
 Submit a Paper
 Propose a Special lssue
 Open Access
ARTICLE
Retrieval and Regional Distribution Analysis of Ammonia, Sulfur Dioxide and Nitrogen Dioxide in the Urban Environment Using Ultraviolet DOAS Algorithm
1 School of Mechanical Engineering, Suzhou University of Science and Technology, Suzhou, 215009, China
2 Department of Optoelectronic Engineering, School of Mathematics and Physics, Anhui University of Technology, Ma'an Shan, 243032, China
3 Hefei Qifeng Photoelectric Technology Co., Ltd., Hefei, 230000, China
* Corresponding Authors: Fuzhou Niu. Email: ; Chuanxin Li. Email:
(This article belongs to the Special Issue: Advanced Intelligent Decision and Intelligent Control with Applications in Smart City)
Computer Modeling in Engineering & Sciences 2023, 134(2), 1251-1262. https://doi.org/10.32604/cmes.2022.022279
Received 02 March 2022; Accepted 25 March 2022; Issue published 31 August 2022
 View Full Text
 Download PDF
Abstract
Aiming at the in situ and mobile observation of urban environmental air pollution, a portable instrument using ultraviolet spectrum retrieval algorithm was developed based on the basis of Differential Optical Absorption Spectroscopy (DOAS) and multiple-pass cell technique. Typical trace gas pollutants, NH3, SO2, and NO2, were explored using their optical spectral characteristics in deep ultraviolet wavelength range from 210 to 215 nm. The gas concentration was retrieved by Lambert-Beer's law and nonlinear least square method. With an optimized optical alignment, the detection limits of NH3, SO2, NO2 were estimated to be 2.2, 2.3, and 36.2 ppb, respectively. The system was used in carrying out some cruise observations in Chengdu, China. During the entire period, the polluted gases showed varied distribution and typical daily average concentrations of NH3, SO2, NO2 were 23.2, 3.5, and 106.0 ppb, respectively. The contributions from different sources were analyzed combined with the HYSPLIT model. Results show that the portable DOAS system is a convenient and effective tool for regional distribution measurement and pollution source monitoring.Keywords
Along with the urbanization process, industry development and abundant daily material consumption, environmental problems are becoming increasingly prominent. The surrounding areas of residents are now full of pollutant sources, such as industrial factories, waste treatment stations, catering regions, modern farms and vehicle exhaust, which could be collectively called anthropogenic sources. The trace gases produced by human activities, such as sulfur dioxide (SO2), nitrogen dioxide (NO2), nitric oxide (NO), ammonia (NH3), and some volatile organic compounds (VOCs), seriously affect the living environment. In addition, with the rapid development of atmospheric chemical reactions, large amounts of polluted gases and secondary pollutants are discharged into the atmosphere, causing a serious impact on atmosphere and climate, and even human health problems [1–3].
NH3, SO2 and NO2 are three typical pollutants produced from anthropogenic and natural sources in urban environment. NH3 is the most abundant alkaline trace gas and acts as a neutralizer of acid pollutants. It plays a significant role in the process of cloud and rain formation, has effects on visibility, ecosystem and human health [4–6]. SO2 also participates in the formation of acid rain and destroys the ecological circulation system, and high concentration of SO2 might cause burning pain on human respiratory organs [7,8]. NO2 acts as a significant precursor of ozone (O3) and secondary organic aerosols (SOA) in the troposphere, which highly affect the tropospheric air condition [9–11]. The reaction between trace gases in the atmospheric environment is extremely complex. These gases are vulnerable to the influence of sunlight, temperature, humidity and particle condition, which are oxidized and attenuated rapidly, forming regional pollution. Thus, the atmospheric levels of NH3, SO2, and NO2 vary rapidly in urban environment, an effective and sensitive method was needed for their measurements.
Owing to the advantage of non-contacting measurement, great time resolution and high sensitivity, optical methods attract considerable attention on NH3, SO2, and NO2 detection. These methods primarily include Laser Induced Fluorescence (LIF), Differential Optical Absorption Spectroscopy (DOAS), Non-Dispersive Infrared spectroscopy (NDIR) and Fourier Transform Infrared spectroscopy (FTIR). The developments of different technologies provide the potential for trace gas measurements on different locations and platforms [12–16]. However, the measurements are typically carried out at several fixed stations, which could not represent the whole distribution in the urban city. Hence, a portable and sensitive instrument is urged to obtain the spatial and temporal variations of trace gas pollutants.
DOAS algorithm, first proposed by Platt in the 1970s, has been proven to be a powerful detection method for a wide variety of trace gases [17,18]. This method has many advantages, such as non-contacting measurement, on-line continuous monitoring, as well as high precision and low maintenance cost. The method has been developed in recent years and has a very broad application prospect in trace polluting gas monitoring. The DOAS system can collect a wide spectral range at one time, and it simultaneously retrieves the concentration of a variety of different gases.
Following the need for a portable and sensitive detection method for trace gases produced in urban environment, this article describes the setup of DOAS system on the basis of a self-designed multi-pass cell, which met the detection properties of NH3, SO2 and NO2 absorption at deep ultraviolet wavelength, and presents system performance for gas concentration retrieval. The system is integrated as a compact instrument for the laboratory measurement and cruise observation in big cities.
The DOAS technique is based on the optical narrowband absorption structures of polluted gas molecules in ultraviolet (UV) and visible (VIS) spectrum, and it realizes gas quantitative detection utilizing Lambert-Beer's law [19]. Broadband light beam is emitted from a light source, and the intensity is defined as I0(λ). Then, the light passes through a volume with target absorbers. As the light travels through the whole path length, its intensity is reduced to I(λ) through the absorption and scattering of all relevant trace components. This process can be written in the following formula as Eq. (1):
where σi(λ) and ci represent the cross section and the concentration of the ith gases in the absorption path. L is the light path length, and n is the total number of trace gases in the absorption volume. εR(λ) and εM(λ) are Rayleigh and Mie scattering coefficients. A(λ) denotes the turbulence and some uncertain effects.
The basic principle of DOAS is to separate broad and narrow band spectral structures in an absorption spectrum. The broad part that has no characteristic relationship with the gas absorptions is removed by digital filtering to obtain differential optical density OD, which is defined as Eq. (2):
The concentration of each trace gas is obtained by fitting the differential optical density with the reference cross sections by Levenberg-Marquardt nonlinear least square method [20,21].
3 Description of the Portable DOAS Instrument
The portable DOAS system consists of a light source, an optical multi-pass cell for absorption, and a micro spectrometer. Fig. 1 shows a schematic diagram of the DOAS system. In the DOAS system, a deuterium lamp (L2D2 lamp, Hamamatsu Photonics) is used as a light source, which has a spectral distribution from 185 to 400 nm. After collimating by lenses, the light is reflected into the self-designed multi-pass cell, and the transmitted light goes back and forth between the high reflection mirrors and interacts with the trace gases in it. Then the light is emitted from another collimating lens at the outgoing hole and coupled to an optical fiber (400 μm diameter core size, NA = 0.22). The detector is an Athermal High-Resolution Spectrometer (AHR, Gratingworks), which has a software for acquiring and analyzing spectrum data in real time.
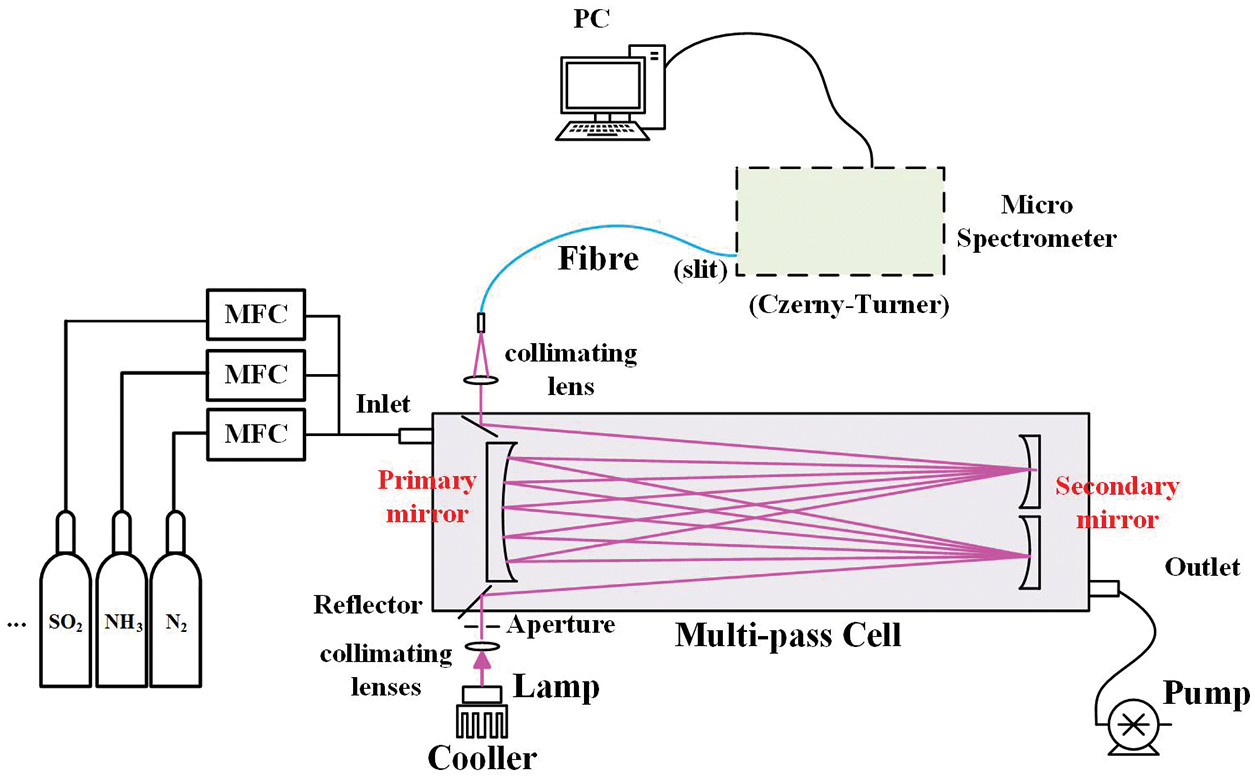
Figure 1: Experimental setup of the portable DOAS instrument (MFC: mass flow controller; PC: personal computer)
The multi-pass cell is designed as a typical White cell [22,23], which mainly consists of three concave spherical mirrors. One of them is primary mirror, and the other ones are secondary mirrors. These mirrors have the same curvature radius, and the center spacing between the primary and secondary mirrors is equal to the radius of curvature, specifically 600 mm in our system. In this way, a conjugated cavity is formed, and the light beam is reflected back and forth between the primary mirror and the two secondary mirrors to increase the optical path length. With a fine tune of the tilt angle, these mirrors is adjusted to obtain a variable reflection times, causing the light to be transmitted multiple times with a specific number of frequency (i.e., fixed to 24 times in our experiment) and interacting with the trace gases in the cell. The light path L can be calculated as Eq. (3) by counting the light spot N on the primary mirror:
where d is the base length of White cell, and n is the total reflection times. With the base length of 600 mm, the optical path of our designed DOAS system is raised up to 14.4 m. The light path is simulated by optical software Zemax (Fig. 2) to guide for optical path inspection and system integration.
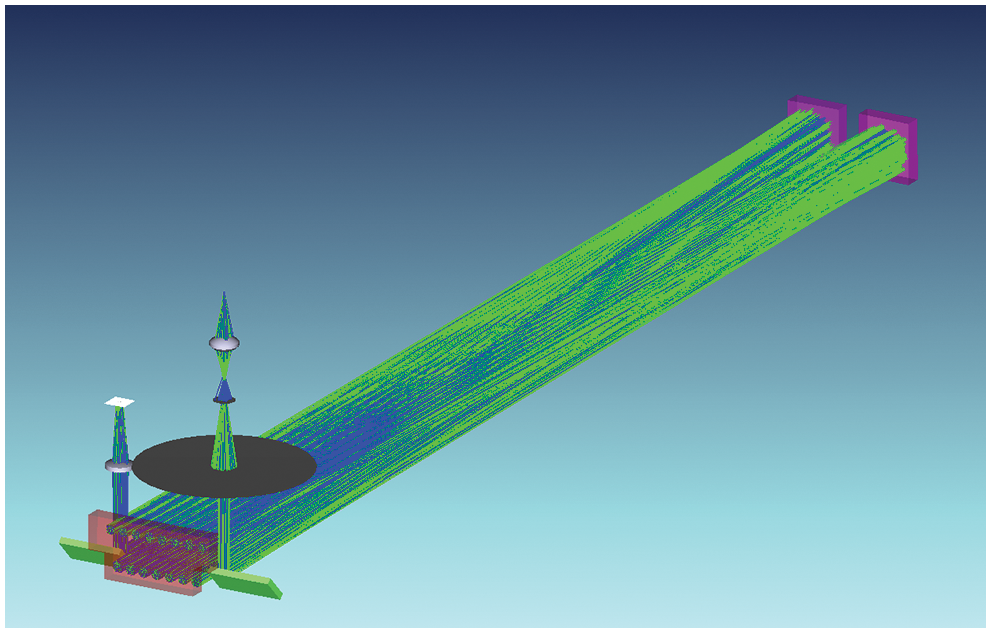
Figure 2: Light path tracing by Zemax software
AHR series spectrometer is based on patented passive athermal system and asymmetrical Czerny-Tuner configuration. The system exhibits high thermal stability, low stray noise and high resolution. The spectrum drift is lower than 0.003 nm/°C and the readout circuit is quite stable. The spectrometer has a spectral range from 180–380 nm, with a slit size of 25 um and a spectral resolution (FWHM, Full Width at Half Maximum) of 0.3 nm.
All the components of the DOAS system is integrated as an instrument for portable measurement, with an overall dimension of 900 mm × 300 mm × 350 mm. A gas supply system offering certain concentration standard gases together with a mechanical pump is used for laboratory experiment. The pump can be also used for gas sampling during the field observation.
4 System Test of the DOAS System
4.1 Performance of the Detection System
Some laboratory tests were carried out for the established DOAS system to meet the requirement of trace gas measurement. The AHR series spectrometer has minimized optical aberration for high finesse spectral images and low distortion. The noise is white Gaussian and can be easily reduced using averaging. The performance of the detection system is tested. The average dark current is detected and shows a high linearity with the integration time (R2 = 0.99996, Fig. 3a), and the averaged dark counts is 1.2 counts/s. The spectrum range from 180 to 380 nm can be calibrated by the specific line spectra emitted from a pen ray mercury lamp. Fig. 3b shows the high correlation between wavelengths and spectrum channels Different DOAS system have their own response to the optical signals called slit function and is related to spectroscopy resolution, wavelength broadening, and stray signal. The result (Fig. 4) can be used to make a cross section convolution for DOAS fitting.
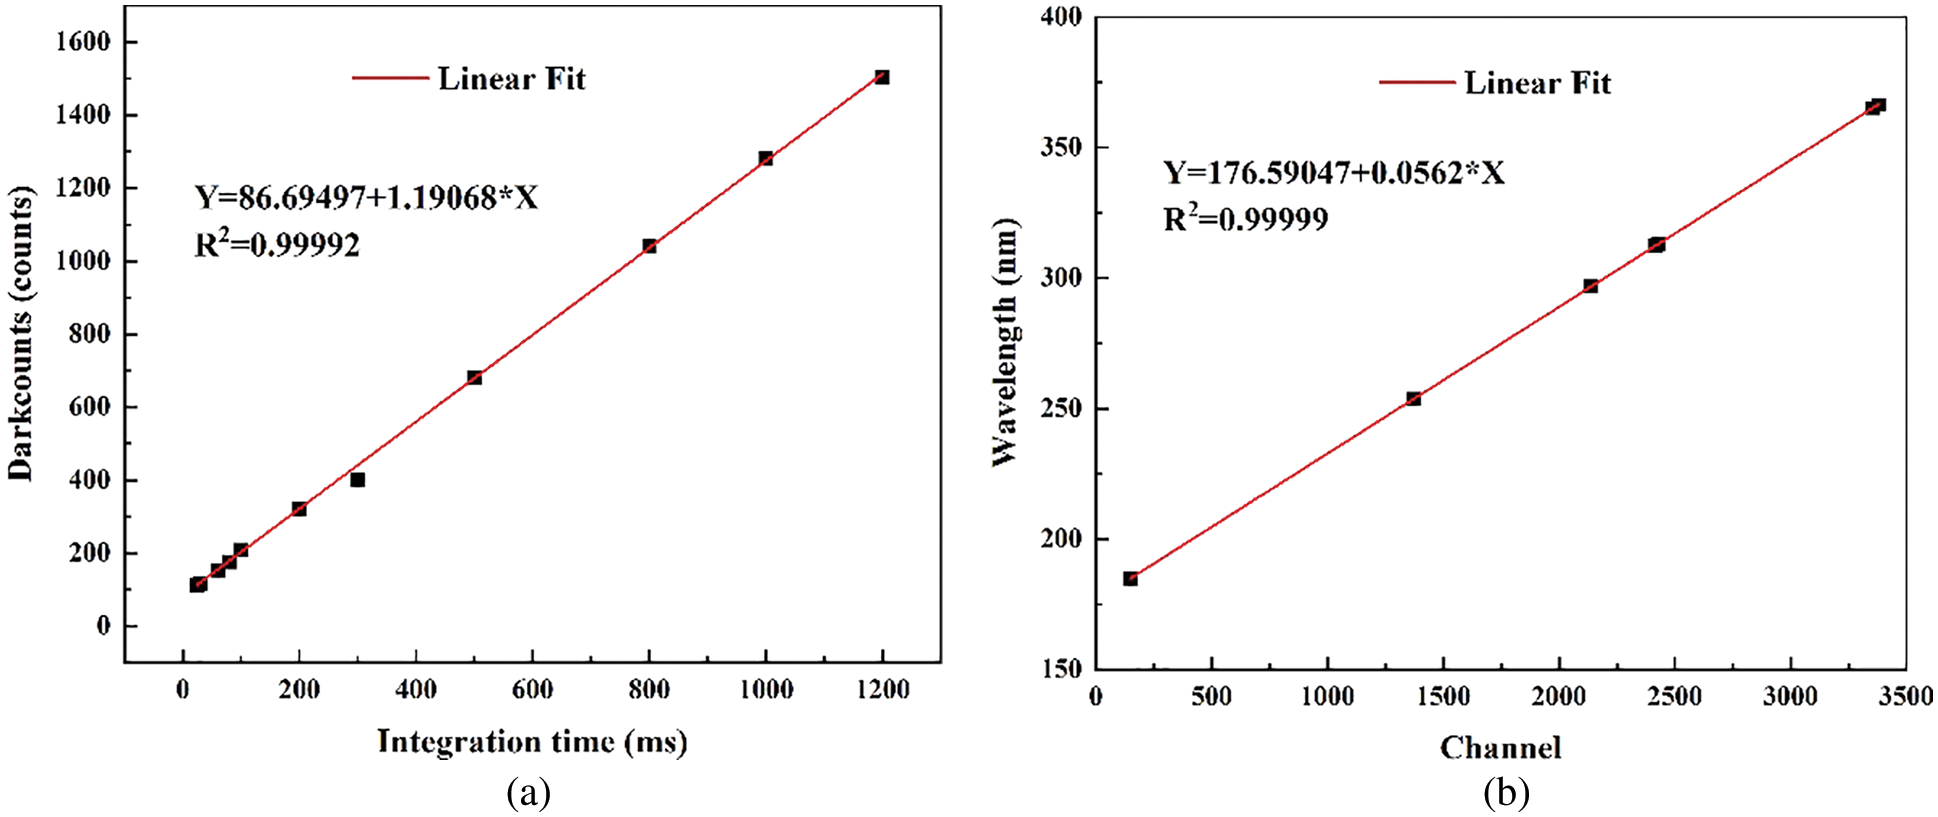
Figure 3: Dark counts test (a) and wavelength calibration (b) for the spectrometer
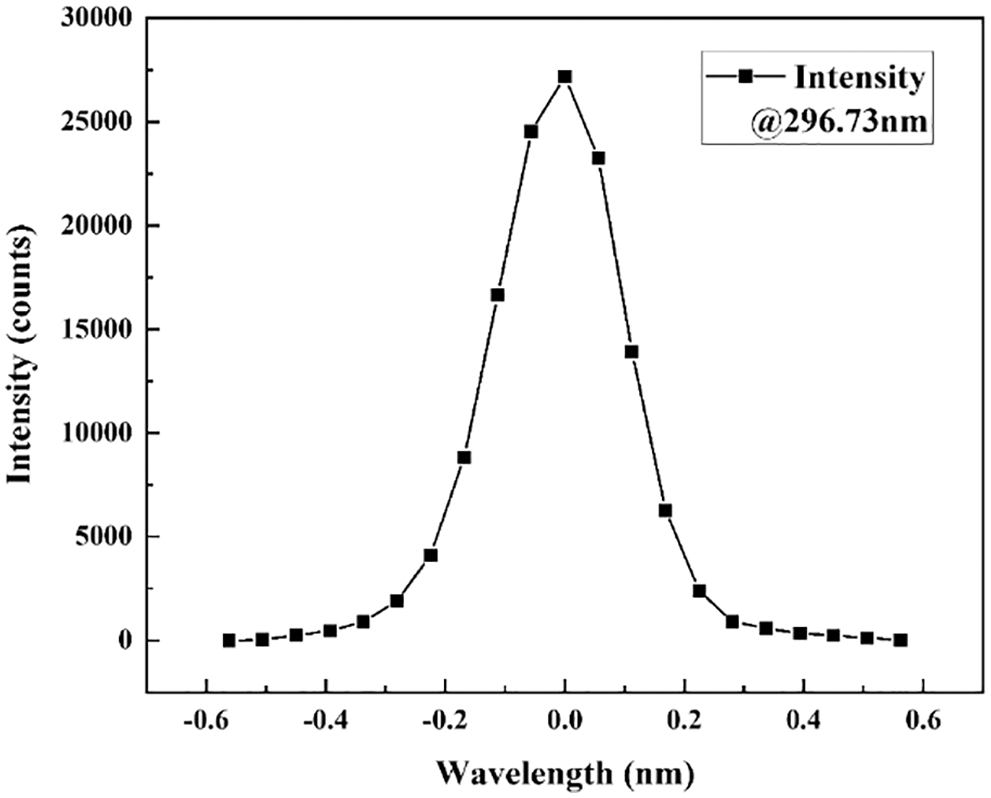
Figure 4: Slit function of the DOAS system
4.2 Spectral Retrieval of the DOAS Technique
The absorption cross section was referred from the MPI-Mainz UV-VIS spectral atlas (https://www.uv-vis-spectral-atlas-mainz.org), and Fig. 5 illustrates some typical gases in ultraviolet region. Some gases emitted from anthropogenic sources and on-road vehicles, such as NH3, SO2, and NO2, similarly have effective absorption cross sections that reached up to 10−17−10−18 cm2/molecule around 200 nm, and proper DOAS fitting procedure can be simultaneously used to retrieve these gas concentrations. However, other species also have absorption features around the same wavelength, such as NO, CS2, and H2S. Their interferences would be separated by considering their absorption structure in DOAS fitting. The high resolution cross sections obtained from spectral atlas were convoluted with instrumental slit function for forward concentration retrieval.
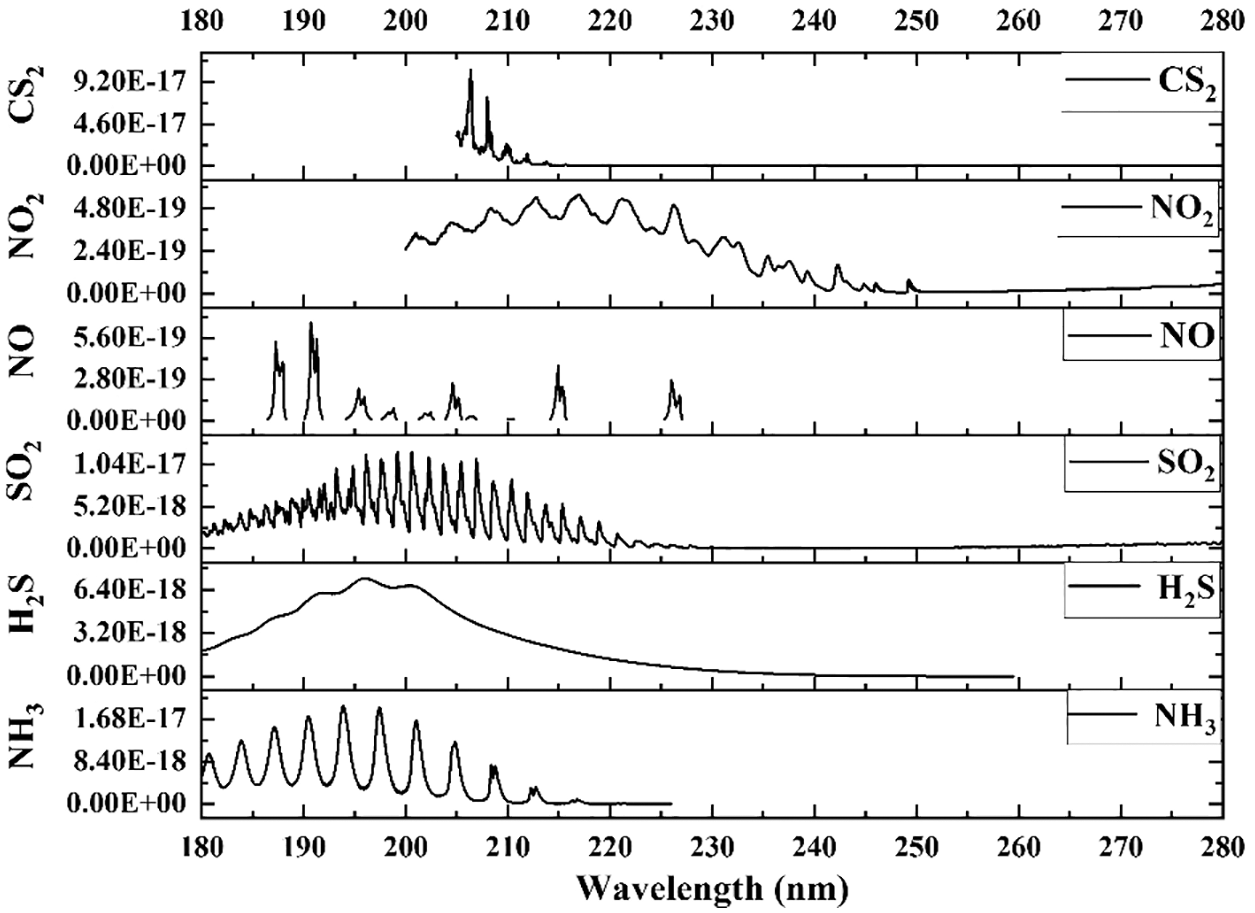
Figure 5: Cross section of some typical trace gases in ultraviolet wavelength
The actual atmospheric gas concentration was retrieved using the DOAS fit procedure. Moreover, the fitting wavelength was set as 200–215 nm, where the DOAS technique could obtain the concentration of NH3, SO2, NO2, NO and some others gases at the same time. Fig. 6 shows the differential optical density and fitted differential spectrum of SO2 (red curve). The system fitting residual noise is also described at nearly 1.5%, and it can be attributed to unknown absorption structure and some other noises.
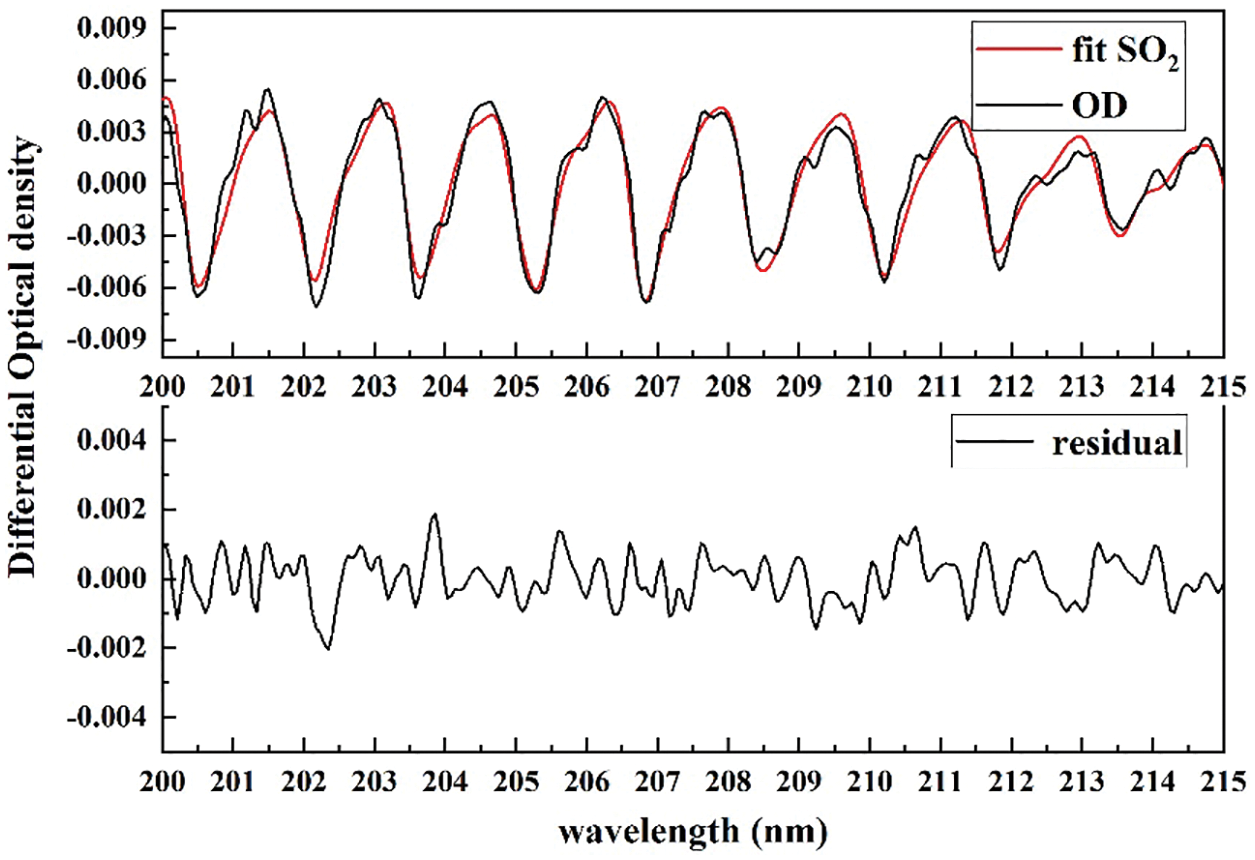
Figure 6: Example for SO2 DOAS fitting
Experiments for different levels of NH3 and SO2 were performed by filling the sampling cell with standard trace gases in the laboratory. The mixed ratio was obtained by different gas flow supply of standard gases and nitrogen (N2), which was controlled by several mass flow controllers (CS200A, Sevenstar).
During the laboratory experiment, different concentrations of NH3 and SO2 were tested and the results recorded. The integration time of the spectrometer was set as 20 ms, and the spectra was averaged to reduce noise, which sets the time resolution at approximately 2 s and to be capable for atmospheric trace gas measurement. The standard NH3 and SO2 gases were separately filled into the sample cell. Different concentrations were kept relatively stable for several minutes, and also a dilute procedure was tested for SO2 measurement (Fig. 7).
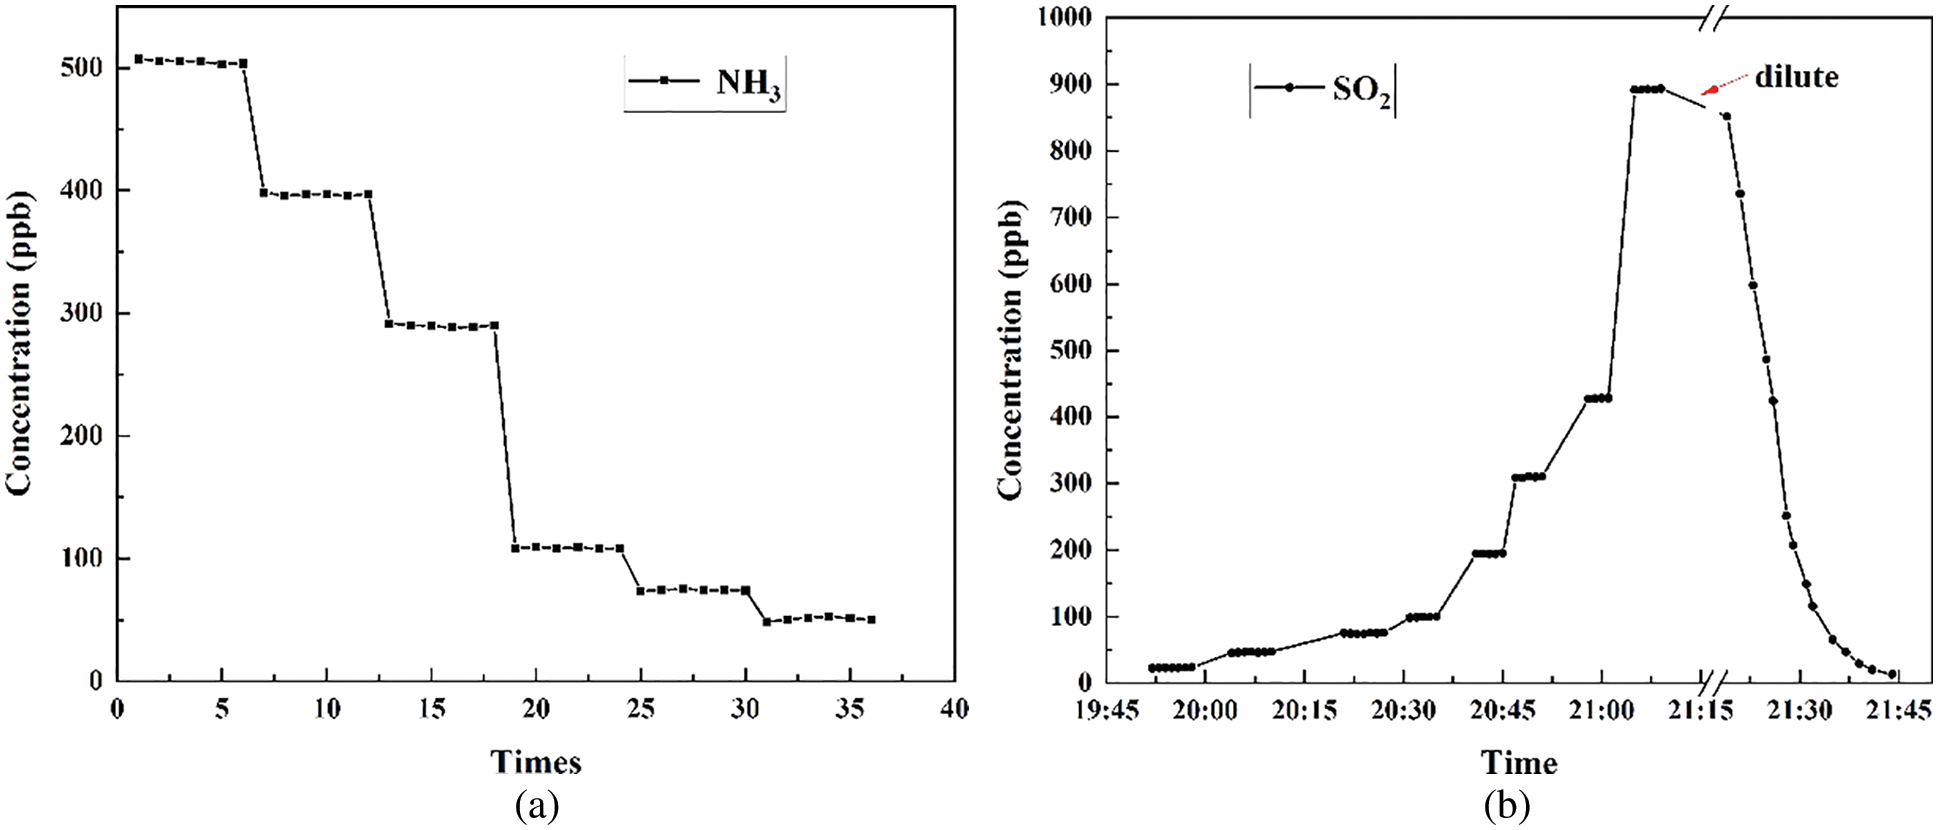
Figure 7: Laboratory measurement of NH3 (a) and SO2 (b)
Measurement errors of NH3 and SO2 were caused by several reasons, including the stray light and dark current of the spectrometer, the uncertainty of referenced cross section, and the DOAS retrieval errors. For the NH3, SO2 and NO2 measurement in our DOAS system, these errors are estimated to be 0.3%, 3%, and 3%, respectively [24,25]. Together with the path length adjustment and some other errors (2%), the whole measurement error is calculated to be less than 5%.
The limit of detection (LOD) of the system is related to the fitting wavelength, optical path length, and residual structure of gas fitting. The following formula (Eq. (4)) is often used to determine the theoretical detection limit of the system [26]:
where
Then LOD is calculated by analyzing the differential absorption, fitting parameters, and residual noise spectrum. The residual was estimated to be 1.5 × 10⁻³, leading to the detection limits of NH3, SO2 and NO2 estimated as 2.2, 2.3 and 36.2 ppb, respectively, which could meet the requirement in the detection of atmospheric gases.
5 Field Measurement and Cruise Observation for Urban Environment
To verify the detection ability in the actual field environment, the portable DOAS system was integrated as a compact instrument, and placed on a vehicle to carry out the cruise observation experiment in some cities.
On November 2020, our instrument was implemented on some field measurements, primarily in Chengdu City, Sichuan Province, China (Fig. 8). During the observation, the atmosphere was sampled by placing a filter at the air inlet to prevent particles from entering the multiple reflection cell to pollute the reflector. At the same time, to reduce the impact of NOx and benzene series emitted by vehicles on the measurement results, the sampling pipe orifice was placed at approximately 20 cm above the roof. During the experiment, the actual sampling and pumping rate of the system was approximately 6 L/min. The running speed of the vehicle was 30–40 km/h, and the longitude and latitude information during the experiment was recorded by a GPS receiver equipped with the on-board system.
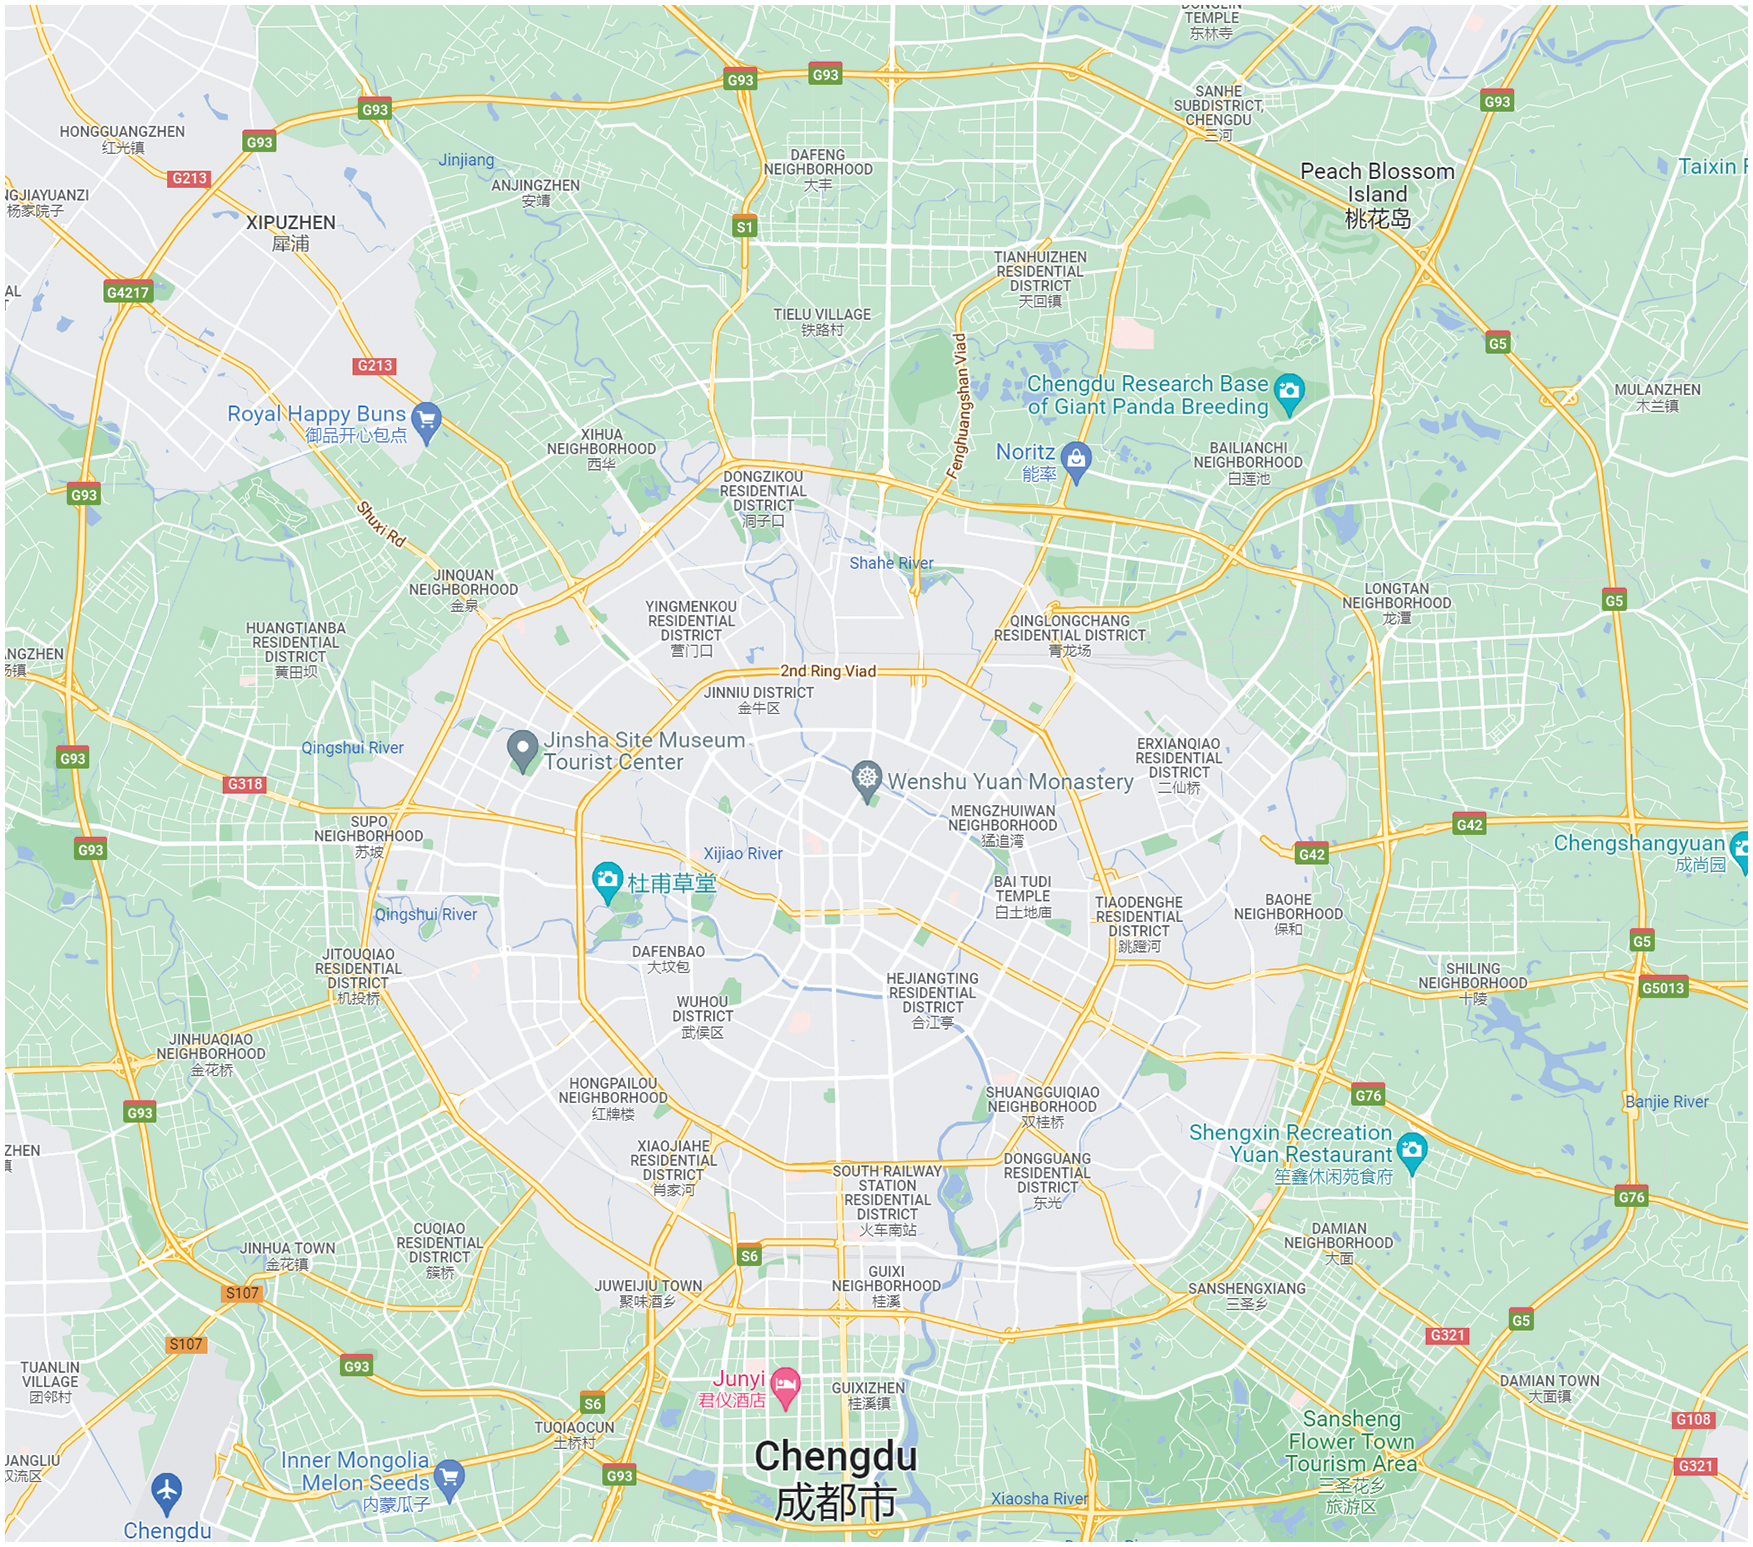
Figure 8: Location of Chengdu City
During the observation period, a portable UV-DOAS system was used to carry out NH3, SO2, and NO2 cruise observation for approximately one week. The equipment reports the concentration contribution of the whole city, and can accurately determine the high-value emission points of each monitoring factor, and check the source of air pollution to achieve the expected effect from industrial sources.
The overall results show a good application of the UV-DOAS system. Fig. 9 shows the typical results of Nov 28, 2020, and the main route was implemented on the 3rd ring road of Chengdu City. The average value of NH3, SO2, and NO2 concentration is 23.2, 3.5, and 106.0 ppb, respectively. Several peak concentrations of NH3 and SO2 appeared on the west and south west part of the route, which might be caused by daily life emissions and industrial pollutions. Moreover, the NO2 concentration is much more related to vehicle exhaust and has more rapid variation.
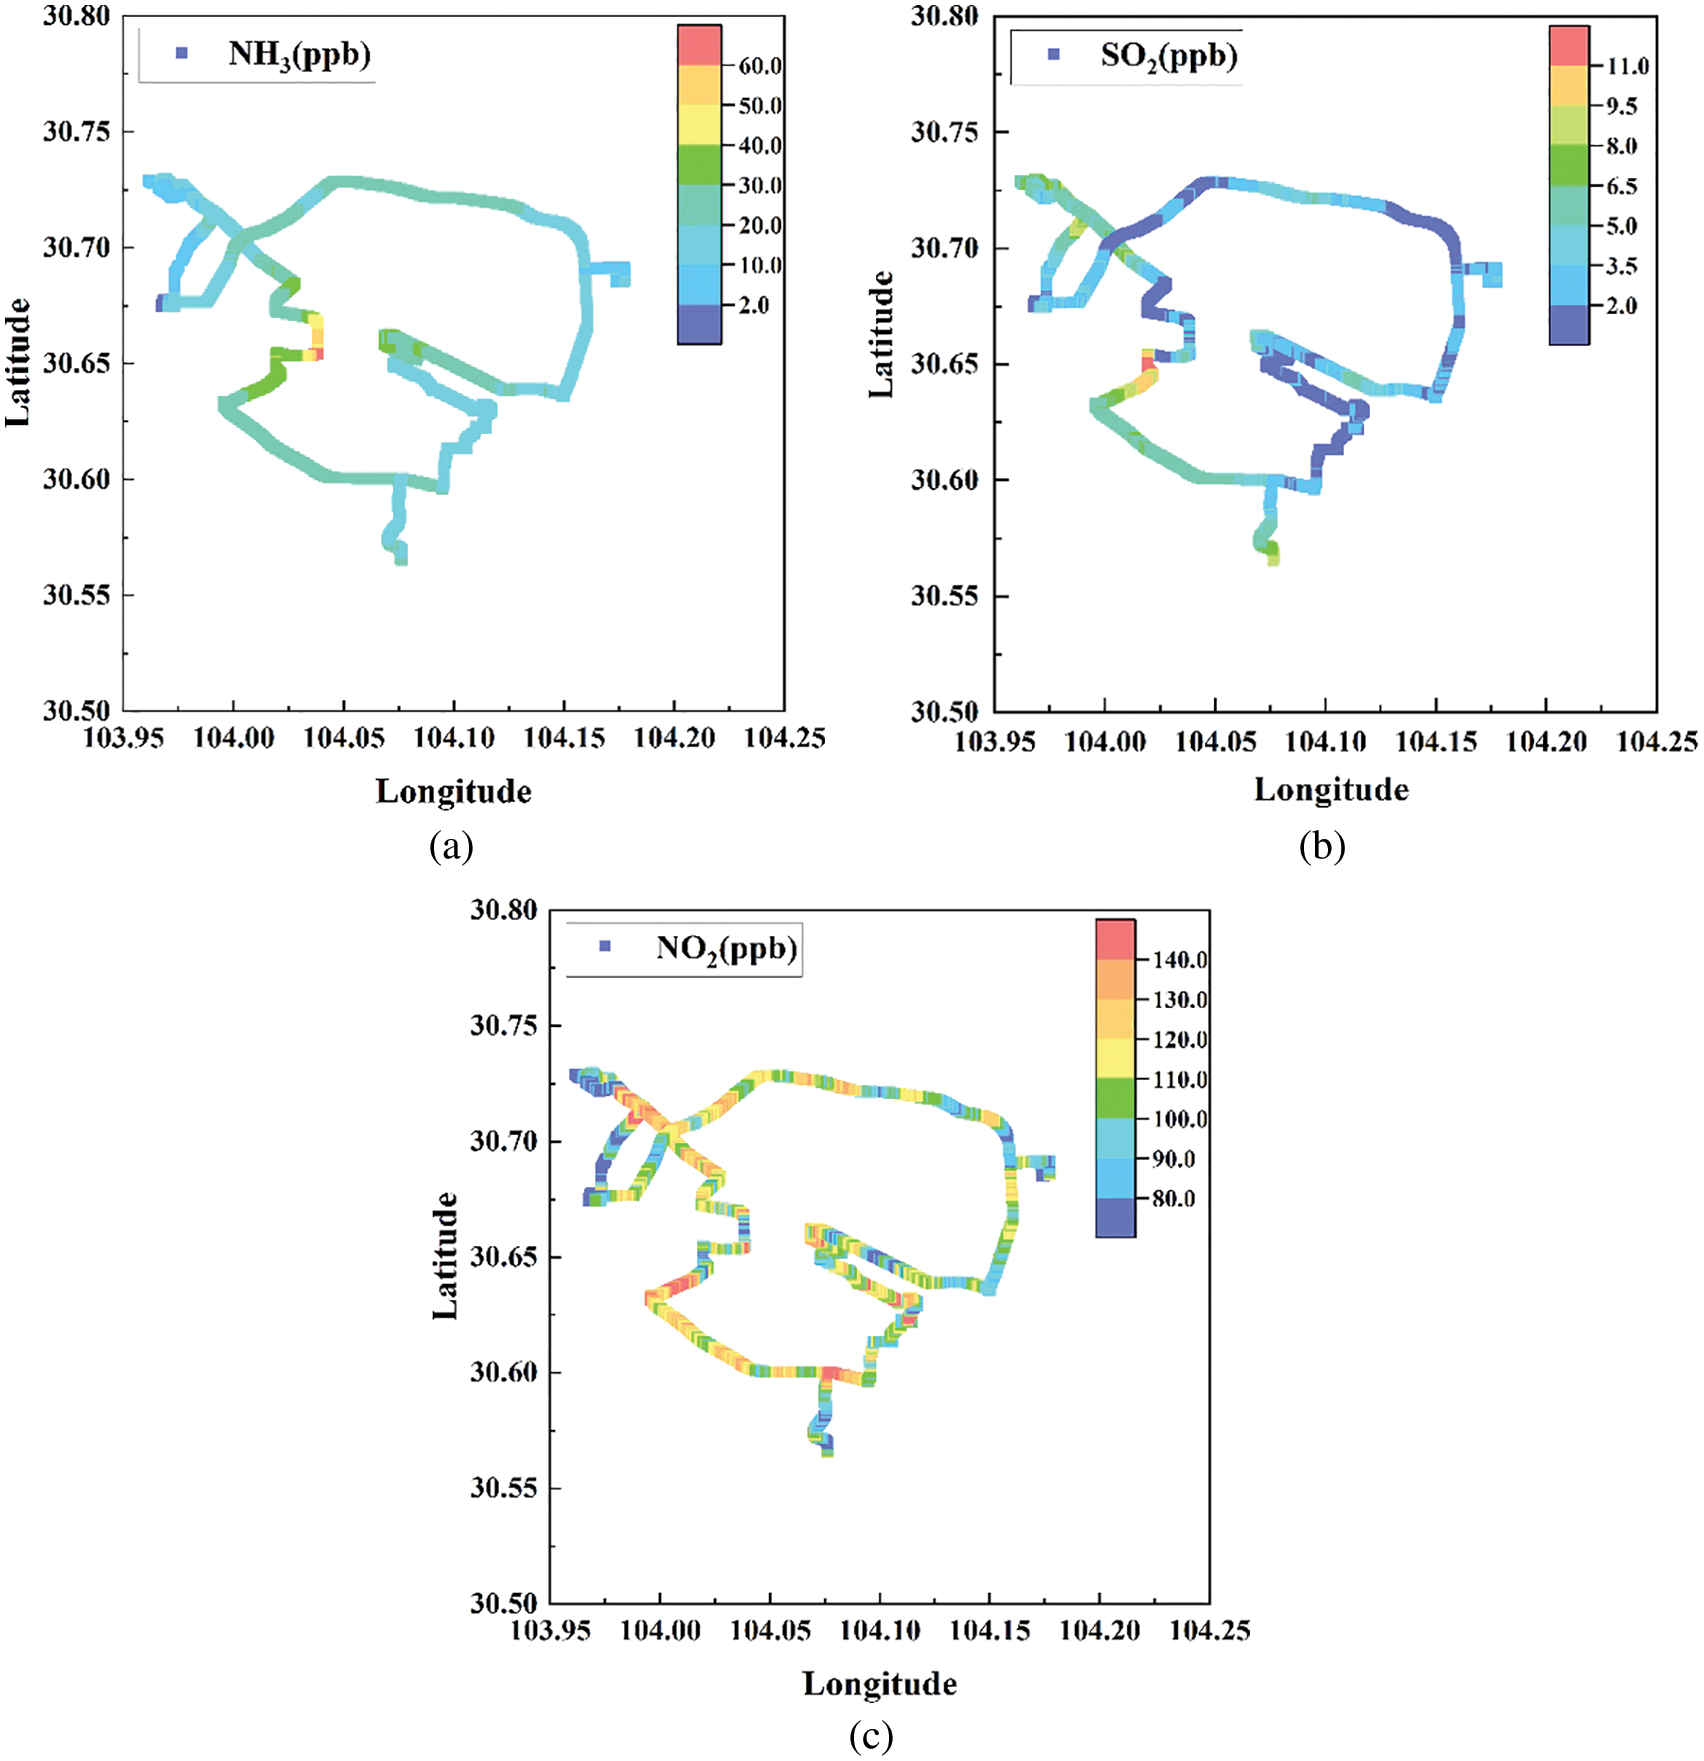
Figure 9: NH3 (a), SO2 (b), and NO2 (c) concentration of the cruise observation in Chengdu City
The HYSPLIT model (Hybrid Single Particle Lagrangian Integrated Trajectory, https://www.arl.noaa.gov/hysplit/getrun-hysplit/) was used to simulate a backward trajectory over 24 h of air masses arriving at the measurement site. The backward trajectory of wind direction was retrieved as Fig. 10. A northeast wind was found during the measurement, which implies that the peak concentration of trace gases might be caused by the pollution in the center area of the city, possibly some small factories in Qingyang District, Chengdu City. The cruise observation indicated that the portable ultraviolet DOAS system was an effective tool for the regional monitoring of gas pollution distribution.
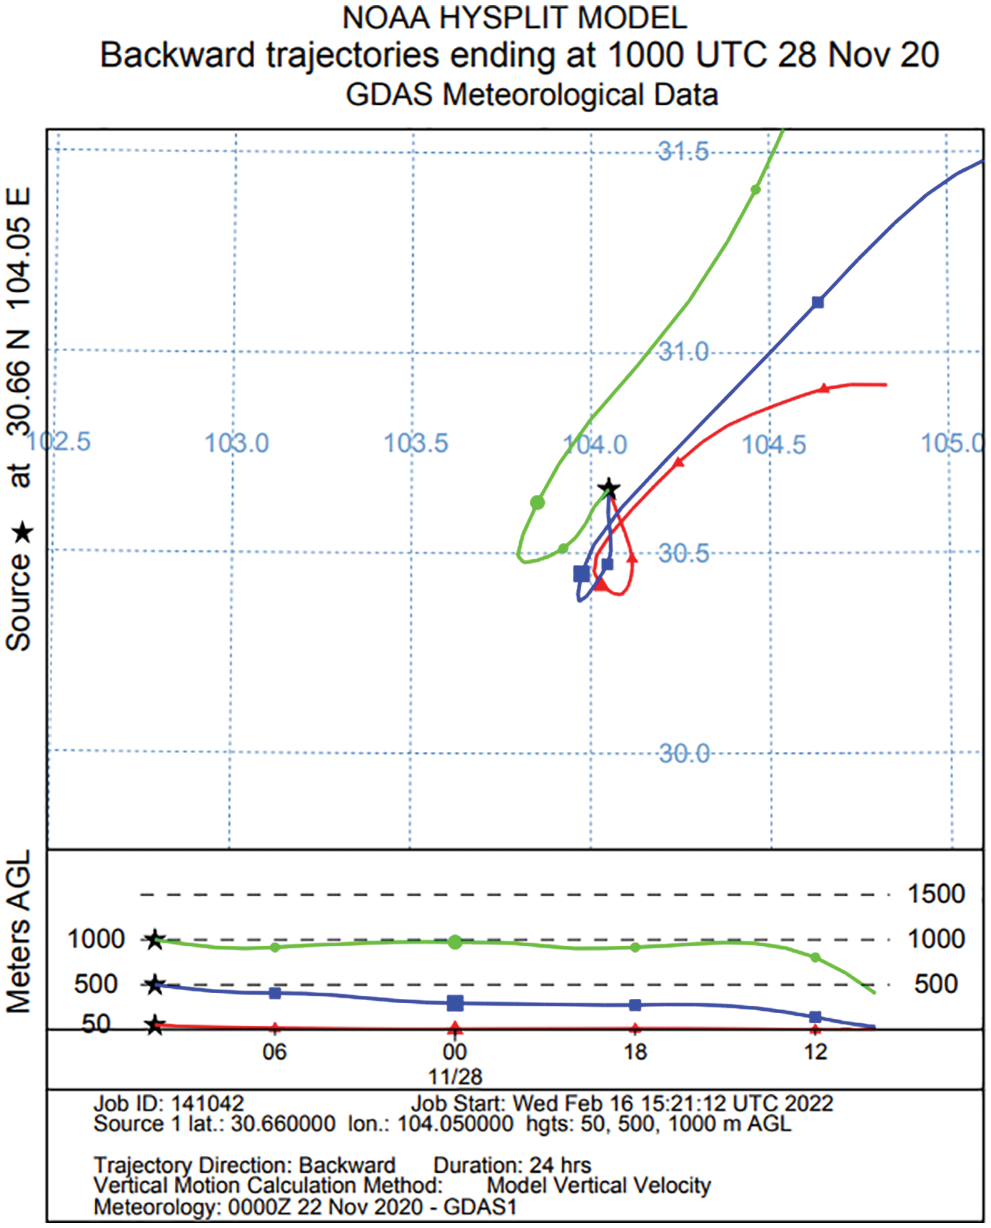
Figure 10: Wind backward trajectory of Chengdu City
The established portable DOAS system was applied to detect trace gases in the deep ultraviolet wavelength of 210–215 nm based on an optical multi-pass cell. The system could realize the simultaneous NH3, SO2, and NO2 measurement. Additionally, the integration time is as short as 2 s, which obtained a detection limit of 2.2, 2.3, and 36.2 ppb, respectively. Experimental results indicated that the system can meet the needs of atmospheric trace gas measurement. Moreover, this compact instrument obtained the trace gas concentration distribution and rapid variation in the urban cities.
Choosing proper retrieval parameters, this DOAS system could broaden the applicable wavelength, and could be used for more ambient air measurement. Some future work will focus on the stability of the light source and spectrometer, and interferences caused by other atmospheric components and environmental variations. The portable UV-DOAS algorithm provides a convenient and effective technique for urban environment measurement and can also be applied for pollution source tracing and emergency monitoring in the industrial region, such as unorganized evaluation emission and gas leakage.
Funding Statement: This work was supported by the National Natural Science Foundation of China (Nos. 61805257, 41905130), in part by the China Postdoctoral Science Foundation (Nos. 2020M671383, 2020M681517), in part by the Science and Technology Development Plan Foundation of Suzhou (No. SS202148).
Conflicts of Interest: The authors declare that they have no conflicts of interest to report regarding the present study.
References
1. Paralovo, S. L., Barbosa, C., Carneiro, I. P. S., Kurzlop, P., Borillo, G. C. et al. (2018). Observations of particulate matter, NO2, SO2, O3, H2S and selected VOCs at a semi-urban environment in the Amazon region. Science of the Total Environment, 650, 996–1006. DOI 10.1016/j.scitotenv.2018.09.073. [Google Scholar] [CrossRef]
2. Jaramillo, P., Muller, N. Z. (2016). Air pollution emissions and damages from energy production in the US: 2002–2011. Energy Policy, 90, 202–211. DOI 10.1016/j.enpol.2015.12.035. [Google Scholar] [CrossRef]
3. Alfoldy, B., Kotb, M., Yigiterhan, O., Safi, M. A., Giamberini, S. (2018). BTEX, nitrogen oxides, ammonia and ozone concentrations at traffic influenced and background urban sites in an arid environment. Atmospheric Pollution Research, 10(2), 445–454. DOI 10.1016/j.apr.2018.08.009. [Google Scholar] [CrossRef]
4. Volten, H., Bergwerff, J. B., Haaima, M., Lolkema, D. E., Berkhout, A. J. C. et al. (2012). Two instruments based on differential optical absorption spectroscopy (DOAS) to measure accurate ammonia concentrations in the atmosphere. Atmospheric Measurement Techniques, 5, 413–427. DOI 10.5194/amt-5-413-2012. [Google Scholar] [CrossRef]
5. Phillips, F. A., Naylor, T., Forehead, H., Griffith, D. W. T., Paton-Walsh, C. (2019). Vehicle ammonia emissions measured in an urban environment in Sydney, Australia, using open path Fourier transform infra-red spectroscopy. Atmosphere, 10(4), 208. DOI 10.3390/atmos10040208. [Google Scholar] [CrossRef]
6. Kupper, T., Bonjour, C., Menzi, H. (2015). Evolution of farm and manure management and their influence on ammonia emissions from agriculture in Switzerland between 1990 and 2010. Atmospheric Environment, 60, 215–221. DOI 10.1016/j.atmosenv.2014.12.024. [Google Scholar] [CrossRef]
7. Berg, N., Mellqvist, J., Jalkanen, J. P., Balzani, J. (2011). Ship emissions of SO2 and NO2: DOAS measurements from airborne platforms. Atmospheric Measurement Techniques, 5(5), 1085–1098. DOI 10.5194/amt-5-1085-2012. [Google Scholar] [CrossRef]
8. Adame J, A., Notario, A., Villanueva, F., Albaladejo, J. (2012). Application of cluster analysis to surface ozone, NO2 and SO2 daily patterns in an industrial area in Central-Southern Spain measured with a DOAS system. Science of the Total Environment, 429, 281–291. DOI 10.1016/j.scitotenv.2012.04.032. [Google Scholar] [CrossRef]
9. Zhu, Y., Chan K, L., Lam Y, F., Horbanski, M., Wenig, M. (2018). Analysis of spatial and temporal patterns of on-road NO2 concentrations in Hong Kong. Atmospheric Measurement Techniques, 11(12), 6719–6734. DOI 10.5194/amt-11-6719-2018. [Google Scholar] [CrossRef]
10. Yang, B., Zhang, K. M., Xu, W. D., Zhang, S., Batterman, S. et al. (2018). On-road chemical transformation as an important mechanism of NO2 formation. Environmental Science and Technology, 52(8), 4574–4582. DOI 10.1021/acs.est.7b05648. [Google Scholar] [CrossRef]
11. Raponi M, M., Jiménez, R., Wolfram, E., Tocho, J. O., Quel, E. J. (2011). Remote sensing of stratospheric O3 and NO2 using a portable and compact DOAS spectrometer. Journal of Physics Conference, 274, 012094. DOI 10.1088/1742-6596/274/1/012094. [Google Scholar] [CrossRef]
12. Gall, R., Perner, D., Ladstätter-Weißenmayer, A. (1991). Simultaneous determination of NH3, SO2, NO and NO2 by direct UV-absorption in ambient air, fresenius. Journal of Analytical Chemistry, 340(10), 646–649. DOI 10.1007/BF00321528. [Google Scholar] [CrossRef]
13. Dinh, T. V., Kim, D. J., Ahn, J. W., Choi, I. Y., Lee, J. Y. et al. (2020). A potential approach to compensate the gas interference for the analysis of NO by a non-dispersive infrared technique. Analytical Chemistry, 92(18), 12152–12159. DOI 10.1021/acs.analchem.0c00471. [Google Scholar] [CrossRef]
14. Javed, U., Kubistin, D., Martinez, M., Pollmann, J., Harder, H. (2019). Laser-induced fluorescence-based detection of atmospheric nitrogen dioxide and comparison of different techniques during the PARADE 2011 field campaign. Atmospheric Measurement Techniques, 12(3), 1461–1481. DOI 10.5194/amt-12-1461-2019. [Google Scholar] [CrossRef]
15. Wu, Z., Karimi, H. R., Dang, C. (2019). An approximation algorithm for graph partitioning via deterministic annealing neural network. Neural Networks, 117, 191–200. DOI 10.1016/j.neunet.2019.05.010. [Google Scholar] [CrossRef]
16. Wu, Z., Gao, Q., Jiang, B., Karimi, H. R. (2021). Solving the production transportation problem via a deterministic annealing neural network method. Applied Mathematics and Computation, 411, 126518. DOI 10.1016/j.amc.2021.126518. [Google Scholar] [CrossRef]
17. Platt, U., Perner, D., Pätz, H. W. (1979). Simultaneous measurement of atmospheric CH2O, O3, and NO2 by differential optical absorption. Journal of Geophysical Research, 84, 6329–6335. DOI 10.1029/JC084iC10p06329. [Google Scholar] [CrossRef]
18. Lampel, J., Frieß, U., Platt, U. (2015). The impact of vibrational Raman scattering of air on DOAS measurements of atmospheric trace gases. Atmospheric Measurement Techniques, 8(9), 3767–3787. DOI 10.5194/amt-8-3767-2015. [Google Scholar] [CrossRef]
19. Platt, U., Stutz, J. (2008). Differential optical absorption spectroscopy: Principles and applications. Germany: Springer-Verlag: Berlin Heidelberg. [Google Scholar]
20. Kraus, S., (2005). DOASIS: A framework design for DOAS (Ph.D. Thesis). University of Mannheim, Germany. [Google Scholar]
21. Wu, Z., Karimi, H. R., Dang, C. (2019). A deterministic annealing neural network algorithm for the minimum concave cost transportation problem. IEEE Transactions on Neural Networks and Learning Systems, 31(10), 4354–4366. DOI 10.1109/TNNLS.5962385. [Google Scholar] [CrossRef]
22. Robert, C. (2007). Simple, stable, and compact multiple-reflection optical cell for very long optical paths. Applied Optics, 46(22), 5408. DOI 10.1364/AO.46.005408. [Google Scholar] [CrossRef]
23. Bogue, R. (2015). Detecting gases with light: A review of optical gas sensor technologies. Sensor Review, 35(2), 133–140. DOI 10.1108/SR-09-2014-696. [Google Scholar] [CrossRef]
24. Chen, F. Z., Judge, D. L., Wu, C., Caldwell, J. (1998). Low and room temperature photoabsorption cross sections of NH3 in the UV region. Planetary & Space Science, 47(1–2), 261–266. DOI 10.1016/S0032-0633(98)00074-9. [Google Scholar] [CrossRef]
25. Zhu, G. L., Hu, R. Z., Xie, P. H., Chen, H., Qin, M. et al. (2015). Calibration system for OH radicals based on differential optical absorption spectroscopy. Acta Physica Sinica, 64(8), 080703. DOI 10.7498/aps.64.080703. [Google Scholar] [CrossRef]
26. Qin, M., Xie, P. H., Liu, J. G., Liu, W. Q., Fang, W. et al. (2005). Study on UV-visible DOAS system based on photodiode array (PDA). Spectroscopy and Spectral Analysis, 25(9), 1463. [Google Scholar]
Cite This Article
 Copyright © 2023 The Author(s). Published by Tech Science Press.
This work is licensed under a Creative Commons Attribution 4.0 International License , which permits unrestricted use, distribution, and reproduction in any medium, provided the original work is properly cited.
 Downloads
 Citation Tools