
 Submit a Paper
 Propose a Special lssue
 Open Access
ARTICLE
An Uncertainty Analysis and Reliability-Based Multidisciplinary Design Optimization Method Using Fourth-Moment Saddlepoint Approximation
1 School of Materials Science and Engineering, University of Science and Technology Beijing, Beijing, 100083, China
2 Beijing Research Institute of Mechanical & Electrical Technology, Ltd., Beijing, 100083, China
3 School of Mechanical and Electrical Engineering, University of Electronic Science and Technology of China, Chengdu, 611731, China
* Corresponding Author: Yongqiang Guo. Email:
(This article belongs to the Special Issue: Computer-Aided Structural Integrity and Safety Assessment)
Computer Modeling in Engineering & Sciences 2023, 134(3), 1855-1870. https://doi.org/10.32604/cmes.2022.022211
Received 27 February 2022; Accepted 12 April 2022; Issue published 20 September 2022
 View Full Text
 Download PDF
Abstract
In uncertainty analysis and reliability-based multidisciplinary design and optimization (RBMDO) of engineering structures, the saddlepoint approximation (SA) method can be utilized to enhance the accuracy and efficiency of reliability evaluation. However, the random variables involved in SA should be easy to handle. Additionally, the corresponding saddlepoint equation should not be complicated. Both of them limit the application of SA for engineering problems. The moment method can construct an approximate cumulative distribution function of the performance function based on the first few statistical moments. However, the traditional moment matching method is not very accurate generally. In order to take advantage of the SA method and the moment matching method to enhance the efficiency of design and optimization, a fourth-moment saddlepoint approximation (FMSA) method is introduced into RBMDO. In FMSA, the approximate cumulative generating functions are constructed based on the first four moments of the limit state function. The probability density function and cumulative distribution function are estimated based on this approximate cumulative generating function. Furthermore, the FMSA method is introduced and combined into RBMDO within the framework of sequence optimization and reliability assessment, which is based on the performance measure approach strategy. Two engineering examples are introduced to verify the effectiveness of proposed method.Keywords
The progress of science and technology has put forward higher reliability requirements for engineering structural systems [1,2]. The actual engineering structure system always has various uncertainties to varying degrees [3–5]. Uncertainty can be roughly divided into two categories: aleatory uncertainty and epistemic uncertainty [6]. The aleatory uncertainty is objective and irreducible. It can be modeled by probabilistic methods. While the epistemic uncertainty is subjective and reducible. It is caused by incomplete information.
Uncertainty-based design optimization problems are mainly divided into two categories: robust design optimization and reliability design optimization. Robust design optimization focuses on guaranteed performance, looking for designs that are relatively insensitive to changes in uncertain variables. The purpose is to make the design solution robust when the design variables are degraded. The main observation is the tail of the PDF. Reliability design optimization focuses on the possibility of system failure, mainly to obtain a design that satisfies a given reliability. The main observation is the center of the PDF [7–13]. The definition of reliability can be given as follows: the probability that a structure completes a specified function within a specified time and under specified conditions [14–17].
Among reliability calculation methods, the moment method approximates the distribution of random response by fitting the first few random moments based on a type of hypothetical distribution. It reduces the calculation difficulty of design under uncertainty [18,19]. As one of the basic methods based on the moment method, the first order second moment (FOSM) is effective, but not accurate [20,21]. Therefore, it is necessary to use higher-order moments to improve the calculation accuracy. The use of the saddlepoint approximation (SA) for progressive analysis is efficient and practical [22–28]. The SA method has the following characteristics: simple calculation and strong operability; the overall approximation effect of the function is excellent, especially the tail probability distribution; when the density function is known and the calculation of the cumulative distribution function (CDF) is difficult, the SA method is useful. However, the SA method requires that the cumulative generating functions (CGF) exist. Moreover, when using the SA method, it is necessary to solve the saddlepoint equation to obtain the saddlepoint. But when the probability distribution type CGF is complicated, the saddlepoint equation is highly nonlinear. In this case it is difficult to solve.
Based on these problems, this study combines the moment method with the SA. It proposes an improved reliability-based multidisciplinary design and optimization (RBMDO) combined with fourth-moment saddlepoint approximation (FMSA) method (RBMDO-FMSA). In the FMSA method, the CGF is constructed based on the first four moments of limit state function (LSF) [29,30]. Then, this study uses the CGF to approximate the probability density function (PDF) and the CDF. To further improve the efficiency of RBMDO [31–35], this study also uses the FMSA method while adopting the sequence optimization and reliability assessment (SORA) [36,37] based on the performance measure approach (PMA) strategy.
The structure of the study can be briefly summarized as: in Section 2, the moment method and the SA method are briefly reviewed. Section 3 introduces the FMSA method. Section 4 applies the FMSA method to RBMDO. Section 5 uses two examples to verify the proposed method. Section 6 gives the conclusion.
2 The Moment Method and Saddlepoint Approximation
Compared with FORM and SORM, the moment method does not have the problem of finding the derivative and design point of the performance function. It directly uses the value of the performance function at some feature points to approximate the failure probability. The moment method can also be directly used for reliability analysis of single and multiple failure mode systems [38–40].
Here, Y = g(x) is assumed to follow a normal distribution. If the first two orders of Y are obtained, namely
where
Normalize the random variable Y standard in Eq. (2).
Then in Eq. (3).
where
When the first four-order center distance of the performance function is known, according to the high-order moment standardization technique (HOMST), the reliability index
where
The failure probability is expressed as Eq. (5).
when
A new higher accuracy reliability index takes into account the parameters ignored by HOMST, which is expressed as Eq. (6).
2.2 The Saddlepoint Approximation
The use of the SA method for progressive analysis is efficient and practical. The SA has the following characteristics: (1) convenient calculation and strong operability; (2) good overall approximation effect to the function, especially the tail probability distribution; (3) SA method is useful when the PDF is known but the calculation of the CDF is difficult [41,42].
Firstly, given the performance function g(Y), then, the moment generating function (MGF) is defined by Eq. (7).
Take the logarithm of MGF to get CGF in Eq. (8).
By deriving CGF, the saddlepoint
According to the
where
Alternative equation for calculating the failure probability is as Eq. (12).
This study combines the moment method and the saddlepoint approximation, then introduces an improved FMSA.
Assuming that Y is a random variable, its MGF and CGF are denoted by
where
Then, the first four moments of the standard variable
According to the saddlepoint approximation method, the CGF can be modeled as Eq. (14).
where
Therefore, the first four derivatives of CGF can be derived as Eqs. (15a)–(15d) in turn according to the Eqs. (13a)–(13d).
Then combine with the Eqs. (13a)–(13d) to get Eq. (16).
If
Then in Eq. (18)
This is the CGF of a standard normal variable whose second derivative is
When
According to the Eq. (9), by deriving CGF can get Eq. (20).
The saddlepoint
Bring the Eq. (19) into Eqs. (14) and (15b), the approximate CGF and second moment can be obtained as Eqs. (22) and (23).
where
According to the Eq. (2), the CGF can be expressed as Eq. (24).
Then according to the Eq. (11), the failure probability and the PDF are expressed as Eqs. (25) and (26).
where
Therefore, the CDF can be expressed as Eq. (27).
When
This section first introduces the SORA and the PMA. Finally, the RBMDO-FMSA model is proposed.
The SORA method is a decoupling method that can efficiently solve reliability design optimization problems [43,44]. It serializes the reliability design optimization process of the traditional nested loop based on decoupling. It divides the reliability design optimization process into deterministic design optimization and reliability analysis, forming a recursive optimization loop, as shown in the Fig. 1. The SORA method transforms the RBMDO problem into an approximate MDO problem by means of equivalent constraints. Then use the deterministic MDO method to solve it. It can make the equivalent constraint gradually shift toward the direction of the probability constraint. Then, the optimal solution can be quickly obtained [45].
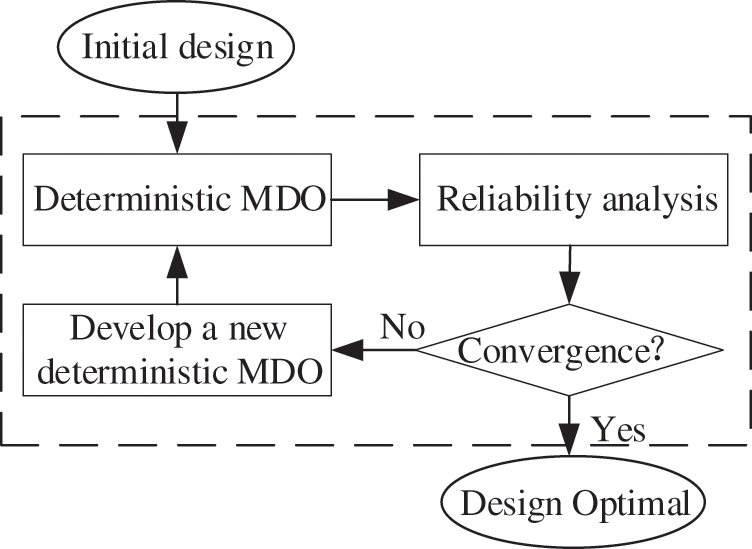
Figure 1: SORA process diagram [43]
The SORA method uses a single-cycle strategy to perform continuous deterministic optimization cycles and reliability analysis. In each cycle, optimization and reliability analysis do not interfere with each other. Reliability analysis is used to verify the feasibility of probabilistic constraints after optimization. The key of this method is to continuously revise the constraints in the optimization with the results obtained through the reliability analysis. Keep it close to the expected probability constraints, realize the optimal design as quickly as possible, reduce the number of optimizations. Thereby reducing the number of reliability analyses.
In RBMDO, the PMA has the advantages of high calculation efficiency, good stability and wide application range [46,47]. It takes the specified reliability index β as the radius of the hypersphere as the search area. It uses the performance function value at the searched extreme point to determine whether the target system is reliable. The equation
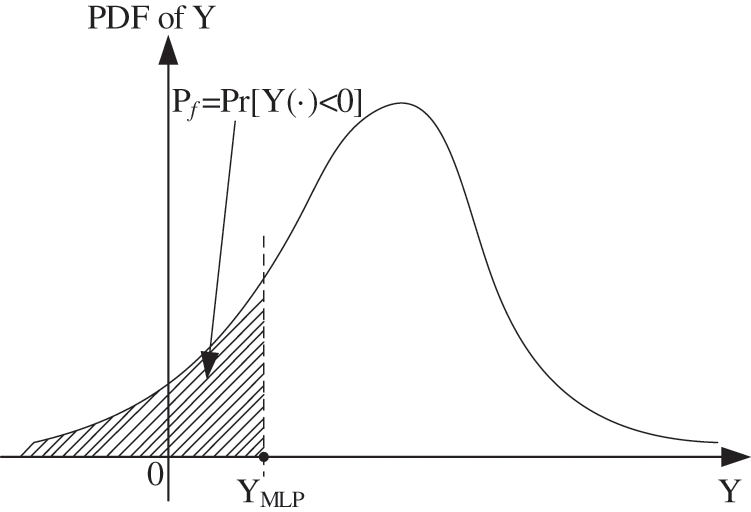
Figure 2: PMA schematic [47]
4.3 The Improved RBMDO Using FMSA
The process of RBMDO-FMSA using SORA is as follows:
Step 1. Deterministic MDO.
where
The initial values
Step 2. Reliability analysis.
I. Linearization of the LSF by first-order Taylor expansion at the MLP point to minimize the accuracy of reliability analysis. When k = 2, if any reliability constraints are not met, the deterministic MDO constraints will use the MLP information based on the previous cycle. Joint PDF has the maximum value at MLP, so the MLP can be obtained by the following Eq. (30):
Ⅱ. Solve the percent performance
Solving Eq. (31) can get
In FMSA, the CGF
The MLP needs the corresponding percent performance
Step 3. Modified MDO.
Through the obtained MLP, the shift vector can be derived as Eq. (34).
Then, the RBMDO problem is transformed into an MDO problem. Deterministic optimization can be performed in the next cycle of SORA. The optimization process is as Eq. (35).
In the next cycle of SORA, after the MDO problem of the equation is solved, the reliability analysis is performed again. This process is repeated until the optimization converges.
This section gives two examples to verify the proposed method. The results obtained by the proposed method will be compared with existing methods. Other methods include mean first-order second-moment method (MVFOSM), first-order reliability method (FORM), second-order reliability method (SORM) and Monte Carlo simulation method (MCS) [50].
5.1 The Simple Wellhead Platform Calculation Example
This is a one-leg wellhead platform composed of a deep well foundation, a tower body and two upper and lower decks [22]. Its simplified model is shown in Fig. 3. In the figure,
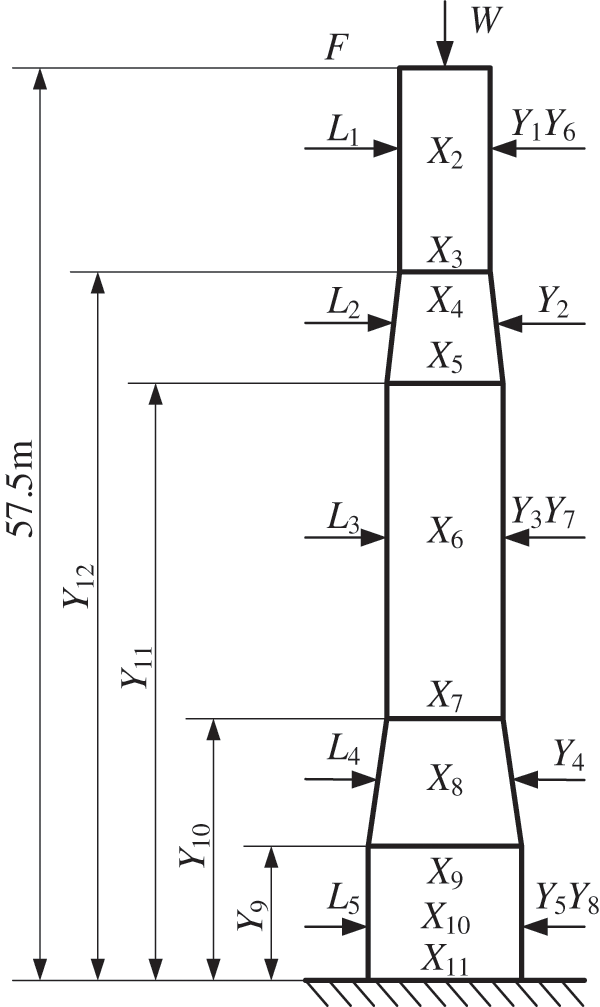
Figure 3: The Simple wellhead platform model
The example has 7 basic random variables. The specific information is shown in Table 1, where
Here only the yield failure of each failure point is considered. The load effect takes into account the axial force N and the bending moment M, so the LSF is:
where
The mathematical model of the optimal design is as Eq. (37).
where
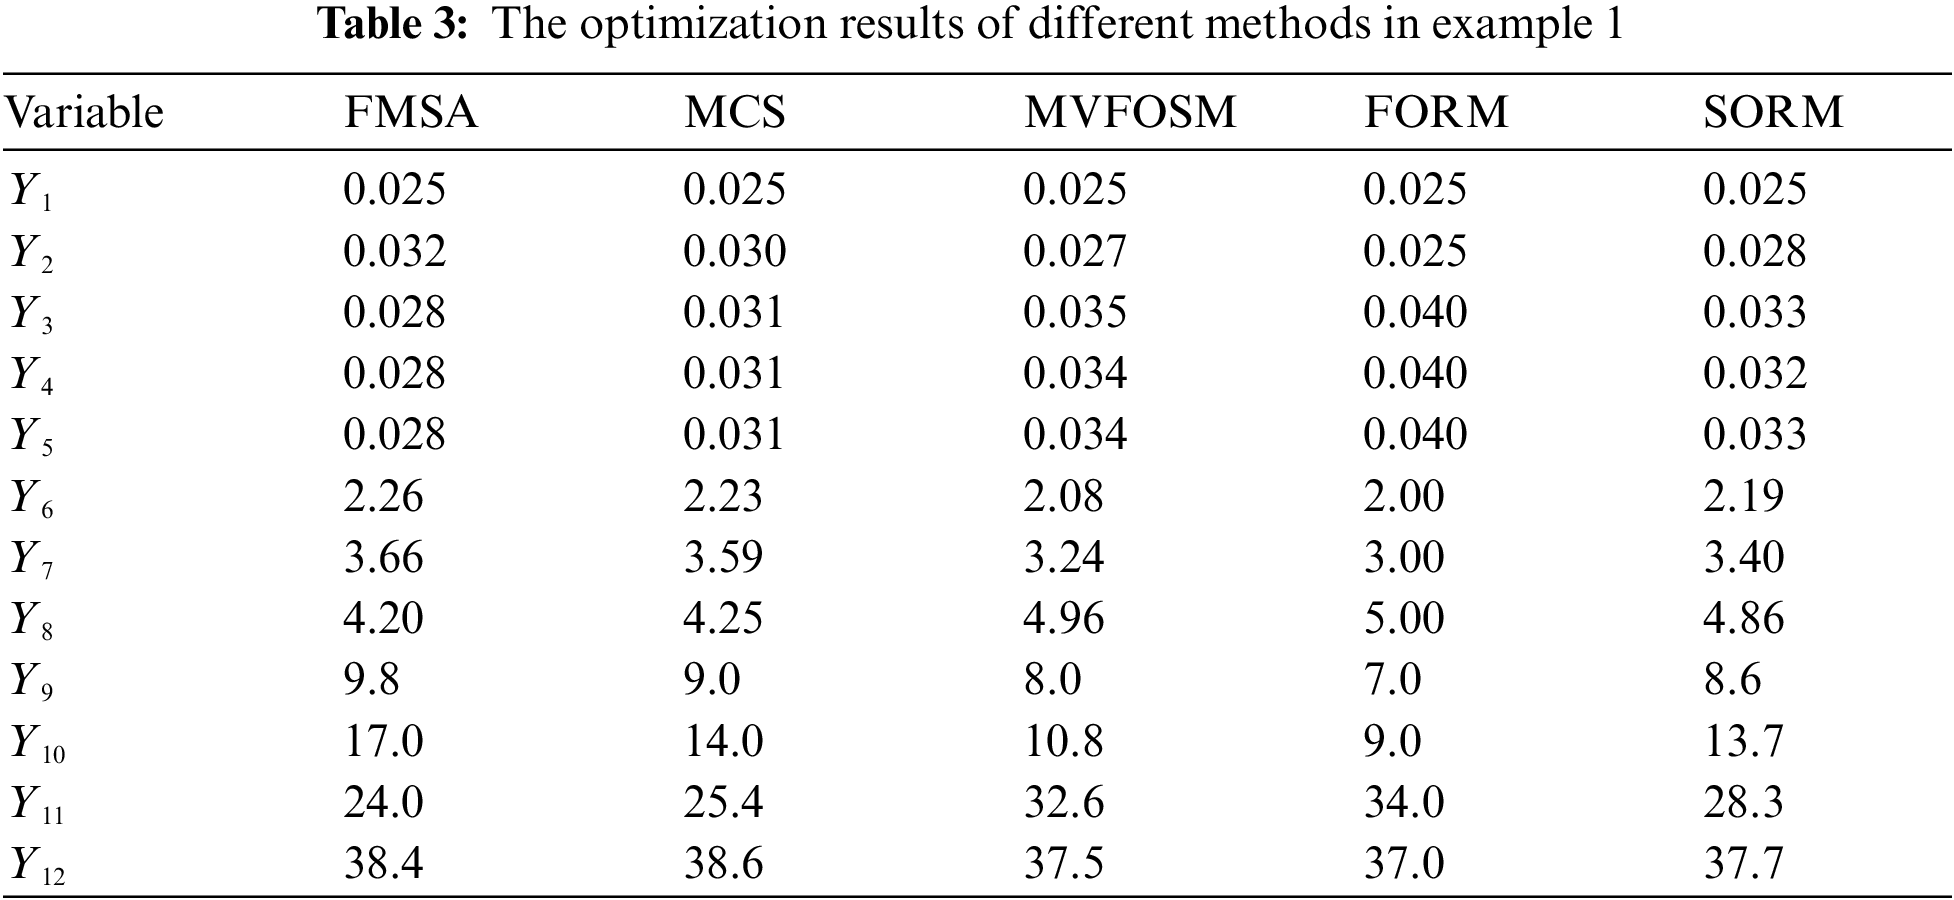
The results obtained by different methods are shown in Table 3. The minimum volume of the optimized platform steel is 16.26 m3, which is nearly 14% smaller than the original design. For more details, the length of truncated cones in two transition sections is obviously increased. Among different methods, the increase obtained by FMSA is the largest one, followed by MCS. While MVFOSM and FORM have relatively smaller length increases. The wall thickness increase of the transition section obtained by FMSA is less. While the increase obtained by FORM is the most. In addition, the diameters of the non-transition sections away from the fixed surface obtained by FMSA increased more than those obtained by the other methods. However, the diameters of the parts contacting the fixed surface decreased.
5.2 The Engineering Speed Reducer Example
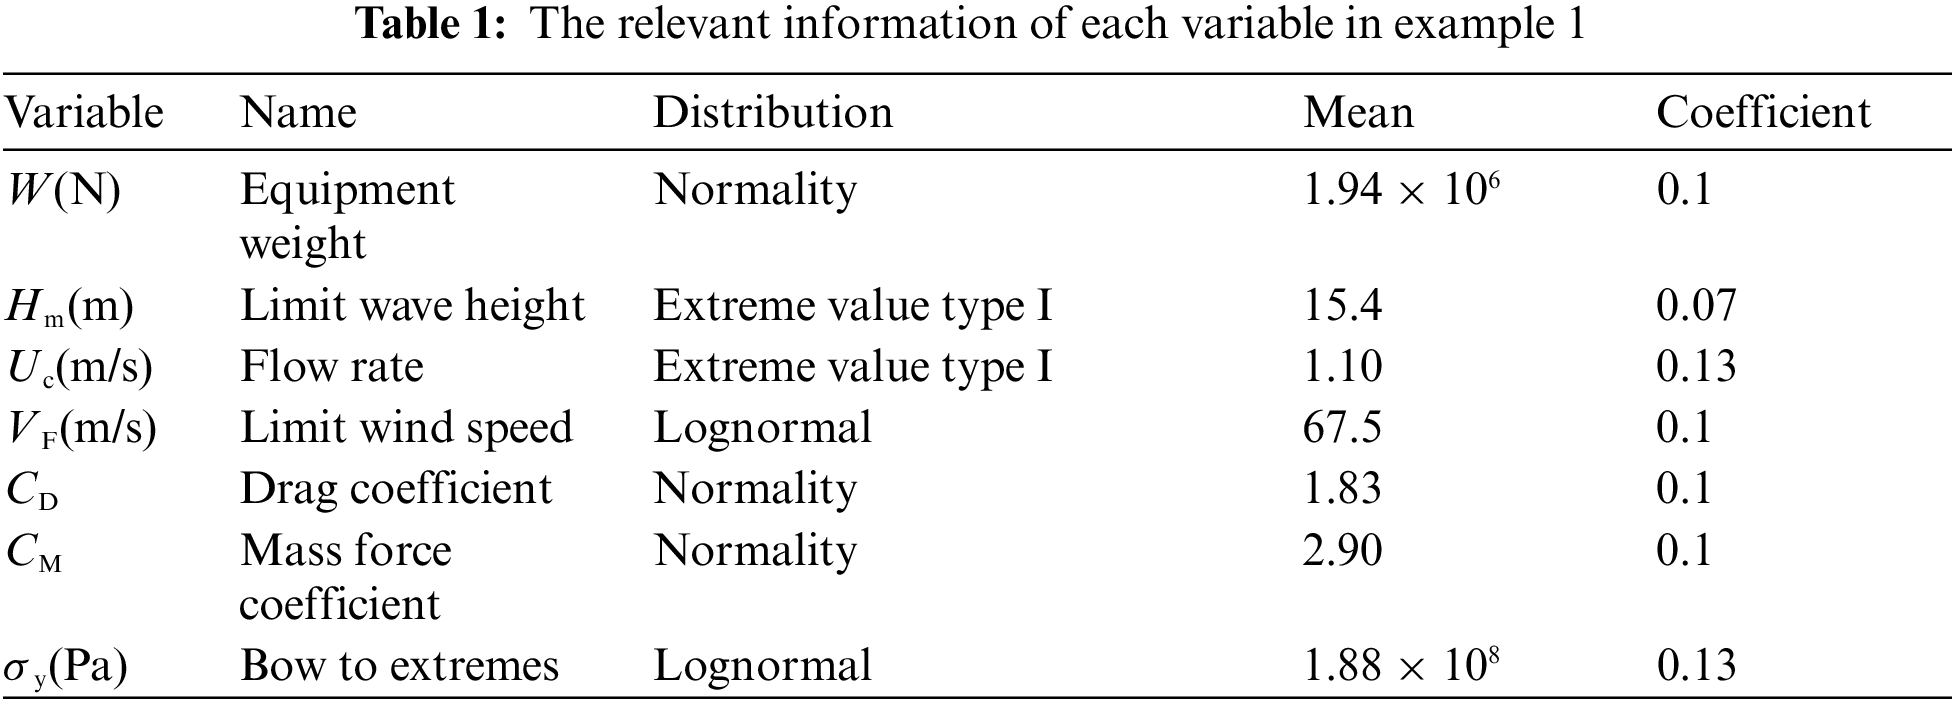
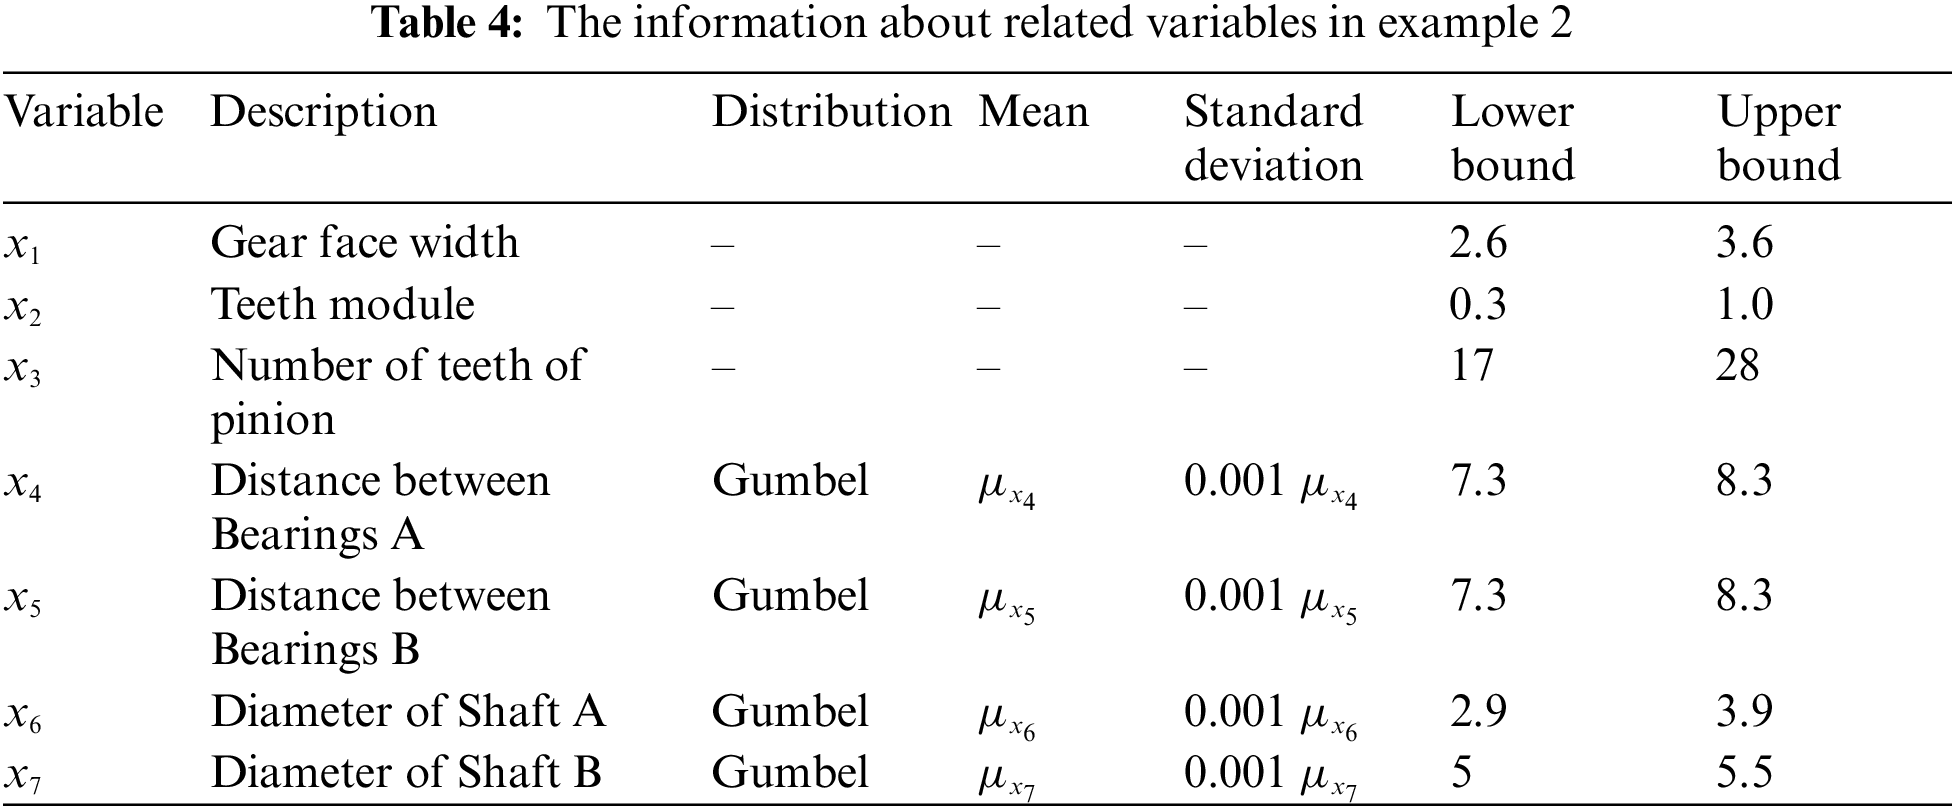
This is an engineering evaluation example of NASA standard MDO test [51,52]. The model of this example is shown in Fig. 4. Table 4 gives the relevant information of each variable. This example involves three disciplines: discipline 1 (Bearing set A and Shaft A), discipline 2 (Bearing set B and Shaft B) and discipline 3 (Gear A and Gear B). Table 5 shows the test results of different RBMDO methods.
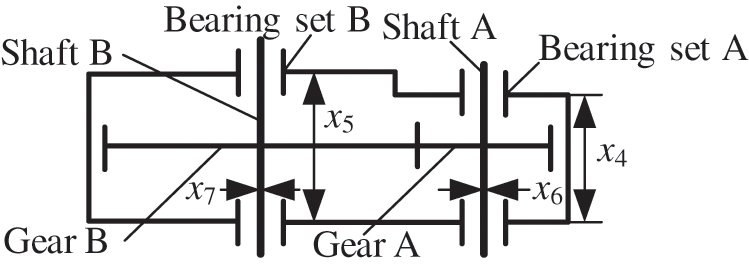
Figure 4: Speed reducer design
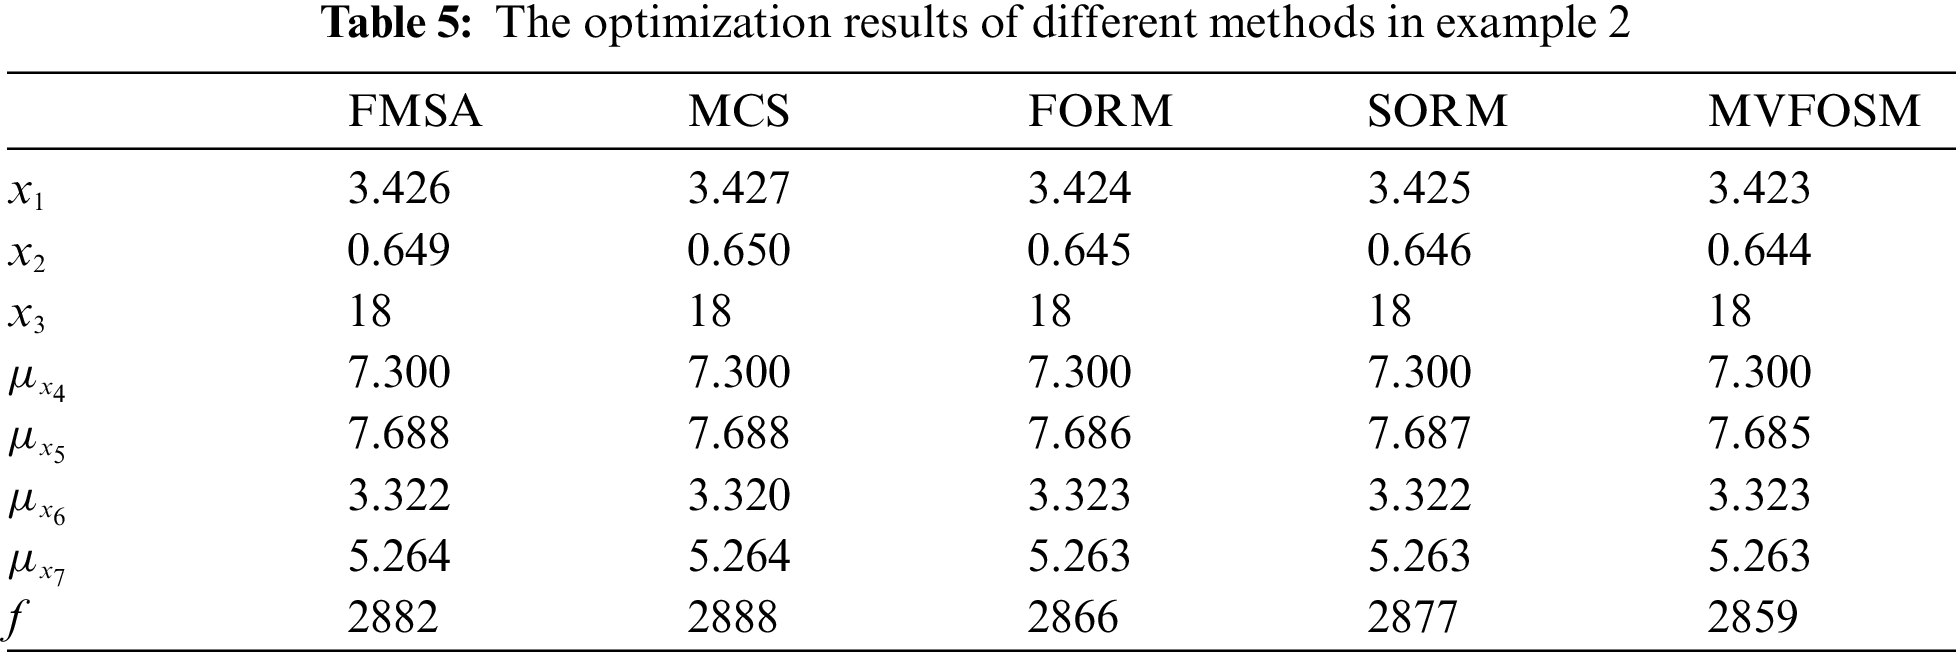
It can be seen from Table 5 that the values of each variable obtained by different optimization methods are still within the constraints. The value of each variable varies little. The optimized value obtained by FMSA is the closest to MCS, indicating that FMSA has higher accuracy. The objective function f is to minimize the volume of the gear system. Compared with other methods, FMSA has higher accuracy and more conservative results, so the volume is larger. However, the volume obtained by FMSA is not much larger than that obtained by other methods. It illustrates that FMSA can enjoy an effective balance between accuracy and cost. The smallest volume is obtained by MVFOSM. However, its accuracy is relatively low.
In uncertainty analysis and RBMDO of engineering structures, the SA method can be utilized to enhance the accuracy and efficiency of reliability evaluation. However, the random variables in SA should be easy to handle. Moreover, the corresponding saddlepoint equation should not be complicated. Both of them limit the application of SA for engineering problems. The moment method can construct an approximate cumulative distribution function of the performance function based on the first few statistical moments. However, the traditional moment matching method is not very accurate generally. To solve these problems, SA is combined with the moment method. An improved RBMDO-FMSA method is proposed to take the advantage of above methods. In FMSA, the approximate CGF is constructed based on the first four moments of the LSF. Then, the PDF and CDF are estimated based on this approximate CGF. Furthermore, the FMSA method is introduced and combined into RBMDO within the framework of SORA, which is based on the PMA strategy. The corresponding formulation RBMDO-FMSA effectively improves the efficiency and accuracy.
Funding Statement: The support from the Key R&D Program of Shandong Province (Grant No. 2019JZZY010431), the National Natural Science Foundation of China (Grant No. 52175130), the Sichuan Science and Technology Program (Grant No. 2022YFQ0087) and the Sichuan Science and Technology Innovation Seedling Project Funding Project (Grant No. 2021112) are gratefully acknowledged.
Conflicts of Interest: The authors declare that they have no conflicts of interest to report regarding the present study.
References
1. Du, X., Xu, H., Zhu, F. (2021). A data mining method for structure design with uncertainty in design variables. Computers & Structures, 244(2), 106457. DOI 10.1016/j.compstruc.2020.106457. [Google Scholar] [CrossRef]
2. Meng, D., Hu, Z., Guo, J., Lv, Z., Xie, T. et al. (2021). An uncertainty-based structural design and optimization method with interval Taylor expansion. Structures, 33(1), 4492–4500. DOI 10.1016/j.istruc.2021.07.007. [Google Scholar] [CrossRef]
3. Wang, L., Xiong, C., Yang, Y. (2018). A novel methodology of reliability-based multidisciplinary design optimization under hybrid interval and fuzzy uncertainties. Computer Methods in Applied Mechanics and Engineering, 337, 439–457. DOI 10.1016/j.cma.2018.04.003. [Google Scholar] [CrossRef]
4. Meng, D., Xie, T., Wu, P., He, C., Hu, Z. et al. (2021). An uncertainty-based design optimization strategy with random and interval variables for multidisciplinary engineering systems. Structures, 32(1), 997–1004. DOI 10.1016/j.istruc.2021.03.020. [Google Scholar] [CrossRef]
5. Meng, D., Li, Y., He, C., Guo, J., Lv, Z. et al. (2021). Multidisciplinary design for structural integrity using a collaborative optimization method based on adaptive surrogate modelling. Materials & Design, 206(2), 109789. DOI 10.1016/j.matdes.2021.109789. [Google Scholar] [CrossRef]
6. Meng, D., Yang, S., Lin, T., Wang, J., Yang, H. et al. (2022). RBMDO using Gaussian mixture model-based second-order mean-value saddlepoint approximation. Computer Modeling in Engineering & Sciences, 132(2), 553–568. DOI 10.32604/cmes.2022.020756. [Google Scholar] [CrossRef]
7. Meng, D., Lv, Z., Yang, S., Wang, H., Xie, T. et al. (2021). A time-varying mechanical structure reliability analysis method based on performance degradation. Structures, 34(2), 3247–3256. DOI 10.1016/j.istruc.2021.09.085. [Google Scholar] [CrossRef]
8. Kim, H. (2017). Optimal reliability design of a system with k-out-of-n subsystems considering redundancy strategies. Reliability Engineering & System Safety, 167(2), 572–582. DOI 10.1016/j.ress.2017.07.004. [Google Scholar] [CrossRef]
9. Li, H., Nie, X. (2018). Structural reliability analysis with fuzzy random variables using error principle. Engineering Applications of Artificial Intelligence, 67, 91–99. DOI 10.1016/j.engappai.2017.08.015. [Google Scholar] [CrossRef]
10. Gao, W., Wu, D., Gao, K., Chen, X., Tin-Loi, F. (2018). Structural reliability analysis with imprecise random and interval fields. Applied Mathematical Modelling, 55(2–3), 49–67. DOI 10.1016/j.apm.2017.10.029. [Google Scholar] [CrossRef]
11. Nya, R. M., Abdullah, S., Singh, S. S. K. (2019). Reliability-based fatigue life of vehicle spring under random loading. International Journal of Structural Integrity, 10(5), 737–748. DOI 10.1108/IJSI-03-2019-0025. [Google Scholar] [CrossRef]
12. Zhi, P., Wang, Z., Chen, B., Sheng, Z. (2022). Time-variant reliability-based multi-objective fuzzy design optimization for anti-roll torsion bar of EMU. Computer Modeling in Engineering & Sciences, 131(2), 1001–1022. DOI 10.32604/cmes.2022.019835. [Google Scholar] [CrossRef]
13. Alkhadashi, A., Mohammad, F., Zubayr, R. O., Aoun Klalib, H., Balik, P. (2022). Multi-objective design optimisation of steel framed structures using three different methods. International Journal of Structural Integrity, 13(1), 92–111. DOI 10.1108/IJSI-07-2021-0080. [Google Scholar] [CrossRef]
14. Abdullah, L., Singh, S. S. K., Azman, A. H., Abdullah, S., Ihsan, A. K. A. M. et al. (2019). Fatigue life-based reliability assessment of a heavy vehicle leaf spring. International Journal of Structural Integrity, 10(5), 726–736. DOI 10.1108/IJSI-04-2019-0034. [Google Scholar] [CrossRef]
15. Xiao, F. (2022). CaFtR: A fuzzy complex event processing method. International Journal of Fuzzy Systems, 24, 1098–1111. DOI 10.1007/s40815-021-01118-6. [Google Scholar] [CrossRef]
16. Zhi, P., Xu, Y., Chen, B. (2019). Time-dependent reliability analysis of the motor hanger for EMU based on stochastic process. International Journal of Structural Integrity, 11(3), 453–496. DOI 10.1108/IJSI-07-2019-0075. [Google Scholar] [CrossRef]
17. Yang, M., Zhang, D., Han, X. (2020). New efficient and robust method for structural reliability analysis and its application in reliability-based design optimization. Computer Methods in Applied Mechanics and Engineering, 366, 113018. DOI 10.1016/j.cma.2020.113018. [Google Scholar] [CrossRef]
18. Zhang, T. (2017). An improved high-moment method for reliability analysis. Structural and Multidisciplinary Optimization, 56(6), 1225–1232. DOI 10.1007/s00158-017-1715-3. [Google Scholar] [CrossRef]
19. Xiao, F. (2021). CEQD: A complex mass function to predict interference effects. IEEE Transactions on Cybernetics, 1–13. DOI 10.1109/TCYB.2020.3040770. [Google Scholar] [CrossRef]
20. Zhao, Y. G., Zhang, X. Y., Lu, Z. H. (2018). Complete monotonic expression of the fourth-moment normal transformation for structural reliability. Computers & Structures, 196(1), 186–199. DOI 10.1016/j.compstruc.2017.11.006. [Google Scholar] [CrossRef]
21. Zhu, S. P., Keshtegar, B., Seghier, M. E. A. B., Zio, E., Taylan, O. (2022). Hybrid and enhanced PSO: Novel first order reliability method-based hybrid intelligent approaches. Computer Methods in Applied Mechanics and Engineering, 393, 114730. DOI 10.1016/j.cma.2022.114730. [Google Scholar] [CrossRef]
22. Meng, D., Hu, Z., Wu, P., Zhu, S. P., Correia, J. A. et al. (2020). Reliability-based optimisation for offshore structures using saddlepoint approximation. Proceedings of the Institution of Civil Engineers-Maritime Engineering, 173(2), 33–42. DOI 10.1680/jmaen.2020.2. [Google Scholar] [CrossRef]
23. Meng, D., Wang, H., Yang, S., Lv, Z., Hu, Z. et al. (2022). Fault analysis of wind power rolling bearing based on EMD feature extraction. Computer Modeling In Engineering & Sciences, 130(1), 543–558. DOI 10.32604/cmes.2022.018123. [Google Scholar] [CrossRef]
24. Su, X., Li, L., Shi, F., Qian, H. (2018). Research on the fusion of dependent evidence based on mutual information. IEEE Access, 6, 71839–71845. DOI 10.1109/ACCESS.2018.2882545. [Google Scholar] [CrossRef]
25. Su, X., Li, L., Qian, H., Mahadevan, S., Deng, Y. (2019). A new rule to combine dependent bodies of evidence. Soft Computing, 23(20), 9793–9799. DOI 10.1007/s00500-019-03804-y. [Google Scholar] [CrossRef]
26. Lu, H., Cao, S., Zhu, Z., Zhang, Y. (2020). An improved high order moment-based saddlepoint approximation method for reliability analysis. Applied Mathematical Modelling, 82(3), 836–847. DOI 10.1016/j.apm.2020.02.006. [Google Scholar] [CrossRef]
27. Zhu, S. P., Liu, Q., Zhou, J., Yu, Z. Y. (2018). Fatigue reliability assessment of turbine discs under multi-source uncertainties. Fatigue & Fracture of Engineering Materials & Structures, 41(6), 1291–1305. DOI 10.1111/ffe.12772. [Google Scholar] [CrossRef]
28. Zhu, S. P., Liu, Q., Peng, W., Zhang, X. C. (2018). Computational-experimental approaches for fatigue reliability assessment of turbine bladed disks. International Journal of Mechanical Sciences, 142(8), 502–517. DOI 10.1016/j.ijmecsci.2018.04.050. [Google Scholar] [CrossRef]
29. Brouwer, J., Tukker, J., Klinkenberg, Y., van Rijsbergen, M. (2019). Random uncertainty of statistical moments in testing: Mean. Ocean Engineering, 182, 563–576. DOI 10.1016/j.oceaneng.2019.04.068. [Google Scholar] [CrossRef]
30. Abd Rahim, A. A., Abdullah, S., Singh, S. S. K., Nuawi, M. Z. (2019). Reliability assessment on automobile suspension system using wavelet analysis. International Journal of Structural Integrity, 10(5), 602–611. DOI 10.1108/IJSI-04-2019-0035. [Google Scholar] [CrossRef]
31. Zhu, S. P., Keshtegar, B., Trung, N. T., Yaseen, Z. M., Bui, D. T. (2021). Reliability-based structural design optimization: Hybridized conjugate mean value approach. Engineering with Computers, 37(1), 381–394. DOI 10.1007/s00366-019-00829-7. [Google Scholar] [CrossRef]
32. Zhi, P., Li, Y., Chen, B., Li, M., Liu, G. (2019). Fuzzy optimization design-based multi-level response surface of bogie frame. International Journal of Structural Integrity, 10(2), 134–148. DOI 10.1108/IJSI-10-2018-0062. [Google Scholar] [CrossRef]
33. Li, Y. H., Sheng, Z., Zhi, P., Li, D. (2021). Multi-objective optimization design of anti-rolling torsion bar based on modified NSGA-III algorithm. International Journal of Structural Integrity, 12(1), 17–30. DOI 10.1108/IJSI-03-2019-0018. [Google Scholar] [CrossRef]
34. Chen, G., Tan, J., Tao, Y. (2018). A reliability-based multidisciplinary design optimization method with evidence theory and probability theory. International Journal of Reliability, Quality and Safety Engineering, 25(1), 1850003. DOI 10.1142/S0218539318500031. [Google Scholar] [CrossRef]
35. Fu, C., Liu, J., Xu, W., Yu, H. (2020). A reliability based multidisciplinary design optimization method with multi-source uncertainties. Journal of Physics: Conference Series, 1654(1), 012043. DOI 10.1088/1742-6596/1654/1/012043. [Google Scholar] [CrossRef]
36. Huang, Z. L., Jiang, C., Zhang, Z., Fang, T., Han, X. (2017). A decoupling approach for evidence-theory-based reliability design optimization. Structural and Multidisciplinary Optimization, 56(3), 647–661. DOI 10.1007/s00158-017-1680-x. [Google Scholar] [CrossRef]
37. Wang, L., Xiong, C., Hu, J., Wang, X., Qiu, Z. (2018). Sequential multidisciplinary design optimization and reliability analysis under interval uncertainty. Aerospace Science and Technology, 80, 508–519. DOI 10.1016/j.ast.2018.07.029. [Google Scholar] [CrossRef]
38. Wang, C., Zhang, H., Li, Q. (2019). Moment-based evaluation of structural reliability. Reliability Engineering & System Safety, 181(3), 38–45. DOI 10.1016/j.ress.2018.09.006. [Google Scholar] [CrossRef]
39. Li, X. Q., Song, L. K., Bai, G. C. (2022). Recent advances in reliability analysis of aeroengine rotor system: A review. International Journal of Structural Integrity, 13(1), 1–29. DOI 10.1108/IJSI-10-2021-0111. [Google Scholar] [CrossRef]
40. Lugannani, R., Rice, S. (1980). Saddle point approximation for the distribution of the sum of independent random variables. Advances in Applied Probability, 12(2), 475–490. DOI 10.2307/1426607. [Google Scholar] [CrossRef]
41. Papadimitriou, D. I., Mourelatos, Z. P., Hu, Z. (2019). Reliability analysis using second-order saddlepoint approximation and mixture distributions. Journal of Mechanical Design, 141(2), 021401. DOI 10.1115/1.4041370. [Google Scholar] [CrossRef]
42. Wang, L., Xiong, C., Wang, X., Liu, G., Shi, Q. (2019). Sequential optimization and fuzzy reliability analysis for multidisciplinary systems. Structural and Multidisciplinary Optimization, 60(3), 1079–1095. DOI 10.1007/s00158-019-02258-y. [Google Scholar] [CrossRef]
43. Du, X., Guo, J., Beeram, H. (2008). Sequential optimization and reliability assessment for multidisciplinary systems design. Structural and Multidisciplinary Optimization, 35(2), 117–130. DOI 10.1007/s00158-007-0121-7. [Google Scholar] [CrossRef]
44. Meng, D., Yang, S., Zhang, Y., Zhu, S. P. (2019). Structural reliability analysis and uncertainties-based collaborative design and optimization of turbine blades using surrogate model. Fatigue & Fracture of Engineering Materials & Structures, 42(6), 1219–1227. DOI 10.1111/ffe.12906. [Google Scholar] [CrossRef]
45. Keshtegar, B., Hao, P. (2018). A hybrid descent mean value for accurate and efficient performance measure approach of reliability-based design optimization. Computer Methods in Applied Mechanics and Engineering, 336(6–7), 237–259. DOI 10.1016/j.cma.2018.03.006. [Google Scholar] [CrossRef]
46. Keshtegar, B. (2017). A modified mean value of performance measure approach for reliability-based design optimization. Arabian Journal for Science and Engineering, 42(3), 1093–1101. DOI 10.1007/s13369-016-2322-0. [Google Scholar] [CrossRef]
47. Zhu, S. P., Keshtegar, B., Bagheri, M., Hao, P., Trung, N. T. (2020). Novel hybrid robust method for uncertain reliability analysis using finite conjugate map. Computer Methods in Applied Mechanics and Engineering, 371, 113309. DOI 10.1016/j.cma.2020.113309. [Google Scholar] [CrossRef]
48. Zhu, S. P., Keshtegar, B., Chakraborty, S., Trung, N. T. (2020). Novel probabilistic model for searching most probable point in structural reliability analysis. Computer Methods in Applied Mechanics and Engineering, 366, 113027. DOI 10.1016/j.cma.2020.113027. [Google Scholar] [CrossRef]
49. Du, X., Chen, W. (2004). Sequential optimization and reliability assessment method for efficient probabilistic design. Journal of Mechanical Design, 126(2), 225–233. DOI 10.1115/1.1649968. [Google Scholar] [CrossRef]
50. Luo, C., Keshtegar, B., Zhu, S. P., Taylan, O., Niu, X. P. (2022). Hybrid enhanced Monte Carlo simulation coupled with advanced machine learning approach for accurate and efficient structural reliability analysis. Computer Methods in Applied Mechanics and Engineering, 388(11), 114218. DOI 10.1016/j.cma.2021.114218. [Google Scholar] [CrossRef]
51. Kodiyalam, S. (1998). Evaluation of methods for multidisciplinary design optimization (MDOPhase I. Hampton, VA: National Aeronautics and Space Administration, Langley Research Center. [Google Scholar]
52. Li, Y. H., Zhang, C., Yin, H., Cao, Y., Bai, X. (2021). Modification optimization-based fatigue life analysis and improvement of EMU gear. International Journal of Structural Integrity, 12(5), 760–772. DOI 10.1108/IJSI-07-2021-0072. [Google Scholar] [CrossRef]
Cite This Article
 Copyright © 2023 The Author(s). Published by Tech Science Press.
This work is licensed under a Creative Commons Attribution 4.0 International License , which permits unrestricted use, distribution, and reproduction in any medium, provided the original work is properly cited.
 Downloads
 Citation Tools