
 Submit a Paper
 Propose a Special lssue
 Open Access
REVIEW
Surface Characteristics Measurement Using Computer Vision: A Review
1 Department of Mechanical Engineering, Advanced Manufacturing and Mechatronics Lab, Malaviya National Institute of Technology, Jaipur, 302017, India
2 Department of Electronics and Communication Engineering, National Institute of Technology, Warangal, 506004, India
3 Department of Civil and Architectural Engineering, Aarhus University, Aarhus, 8000, Denmark
4 Center for Quantitative Genetics and Genomics, Aarhus University, Aarhus, 8000, Denmark
* Corresponding Author: Neeraj Dhanraj Bokde. Email:
Computer Modeling in Engineering & Sciences 2023, 135(2), 917-1005. https://doi.org/10.32604/cmes.2023.021223
Received 02 January 2022; Accepted 28 June 2022; Issue published 27 October 2022
 View Full Text
 Download PDF
Abstract
Computer vision provides image-based solutions to inspect and investigate the quality of the surface to be measured. For any components to execute their intended functions and operations, surface quality is considered equally significant to dimensional quality. Surface Roughness (Ra) is a widely recognized measure to evaluate and investigate the surface quality of machined parts. Various conventional methods and approaches to measure the surface roughness are not feasible and appropriate in industries claiming 100% inspection and examination because of the time and efforts involved in performing the measurement. However, Machine vision has emerged as the innovative approach to executing the surface roughness measurement. It can provide economic, automated, quick, and reliable solutions. This paper discusses the characterization of the surface texture of surfaces of traditional or non-traditional manufactured parts through a computer/machine vision approach and assessment of the surface characteristics, i.e., surface roughness, waviness, flatness, surface texture, etc., machine vision parameters. This paper will also discuss multiple machine vision techniques for different manufacturing processes to perform the surface characterization measurement.Keywords
The technology of machine vision makes use of image data to investigate and inspect the component’s quality. The surface quality of the industrial elements is considered the crucial quality characteristic of ergonomic, functional, and aesthetic aspects. Machine vision techniques are used for the surface roughness characterization by making use of the concept that the image is embodied as the 2-D (two-dimensional) function of the image intensity, which is characterized by the two parameters: (1) the amount of light that hit of the surface and (2) amount of the light that reflects from the surface.
The amount of light that hits on the surface mainly relies on the illuminations. However, the light that reflects from the object or the surface is considered to be the function of surface texture or surface irregularities [1]. The machine learning process in this context can be carried out to create a relationship among the ‘Vision-based texture parameters’ as well as the ‘surface roughness (Ra) value’ [2].
Several methods and techniques have been developed to measure the surface roughness of the machined components, ranging from ‘simple stylus probe instrument’ to that ‘sophisticated optical techniques. Therefore, Artificial intelligence (AI) based surface roughness measurement for the metal matrix composites (MMCs) is considered to be the most effective technique among several other conventional measurement techniques [3]. Here, the ‘surface roughness measurements’ have also been categorized into two segments: Contact-based and non-contact methods. ‘Stylus probe instrument’ is considered the direct contact method that scratches the surface uncontrollably of the component; however, the low accuracy of the parts would not fulfill the requirements concerning the several domains [4–6]. Various optical methods have been developed to resolve surface roughness issues like ‘focus variation instruments’, ‘coherence scanning interferometer’, ‘chromatic confocal microscopy, and ‘phase-shifting interferometer’ [7]. However, non-contact techniques are narrow in scope due to inconvenient working operations, high investments, high precision, and environmental implications [8,9]. The surface characteristics can considerably improve the appearance and general quality of components. It is crucial in a lot of the parts’ function-related performances. Friction, wear, fatigue, corrosion, electrical conductivity, and thermal conductivity of materials are all influenced by the geometric and material features of the surfaces. Furthermore, keeping the surface within the controllable limits is necessary because the machined components have tight tolerances. As a result, inspecting the part’s surface finish is critical for product quality assurance [10]. Over the last few decades, surface finish inspection has been the subject of extensive investigation and study [11]. The necessity to comprehend this domain was recognized as early as the 1930s, with attempts to analyze the surfaces produced by diverse production processes. Surface roughness measurement has come a long way in the last few decades. Numerous methods have been created, ranging from the simple touch comparator to advanced optical approaches. Newer methodologies and procedures for surface evaluation and quantification have resulted from recent instrumentation and evaluation systems advancements [12]. The vast commercial roughness instruments are contact-type instruments that are highly accurate and commonly accepted for examination. The current demand for 100% inspection of parts for quality control and the introduction of automation in the industrial field has mandated quick and automatic surface roughness measurement. Though the stylus instruments are accurate in their measurements, their inability to assess faster and incompatibility with automation has led to the development of alternative methods for high-speed, online measurement. In this sense, there has been a greater focus on creating faster methods for measuring surface roughness.
Many studies have been conducted to examine the surface roughness of a workpiece using machine vision as a substitute for roughness instruments. Machine vision is used to measure surface roughness by examining the distribution of scattered light from a rough surface. A camera captures the light scattering pattern, and the image is processed to characterize the surface. Fig. 1 depicts a machine vision setup as well as an acquired greyscale image of a surface. The outcome is a picture in which the grey levels correspond to the surface relief. This indicates that the darker the valley, the darker the corresponding pixel, and the brighter the corresponding area in the image, the higher the peak. The analysis of these images in order to characterize them is still a work in progress, as no single technique can completely characterize the surface [13].
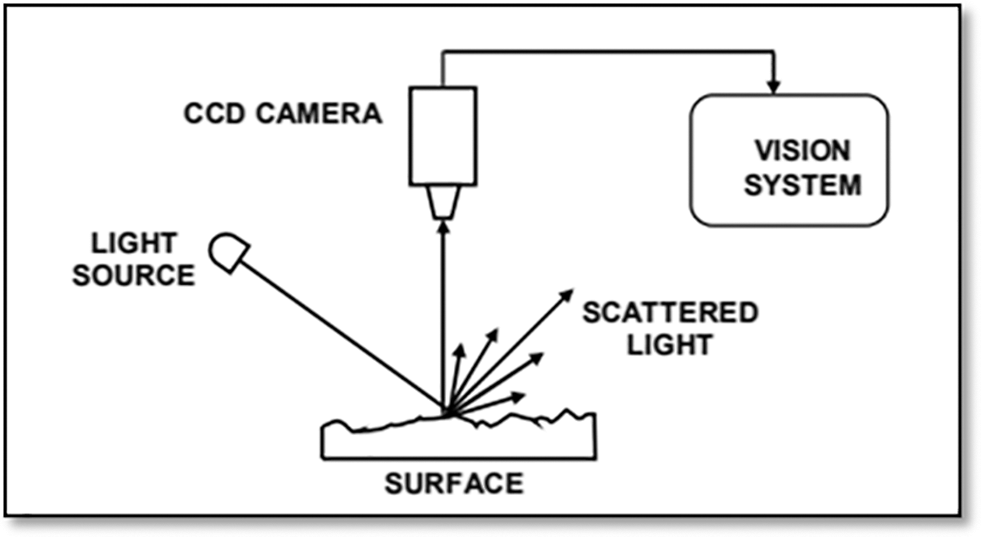
Figure 1: Surface roughness measurement using ‘Machine Vision’ based technique
The availability of high-resolution Charge Coupled Device (CCD) cameras, personal computer computational capacity, and digital data processing boosted the picture analysis possibilities. In combination with data processing using CCD cameras, many optical techniques produce a 3-dimensional (3-D) picture of the surface and roughness parameters related to 2-dimensional (2-D) profiles. The use of machine vision to create viable surface roughness devices is still in its early stages. The primary challenge is determining how to process the surface image in order to acquire the actual surface of the workpiece’s roughness [14].
Many roughness measurement estimation methods are expected to be used to measure the workpiece’s surface finish. Surface roughness measurement techniques are categorized as contact or noncontact depending on whether the measuring probe contacts the workpiece’s surface. The stylus or surface profile meter can be used in industry to measure the roughness of a workpiece. Even though this can be used as a conventional methodology for evaluating the roughness of a surface, a non-contact method is a more accurate alternative. Computer vision technology is one of the most promising non-contact methods for evaluating surface roughness in terms of accuracy and speed.
1.1 Overview of Surface Characteristics and Measurement Techniques
The topography and microstructure of any surface can be used to describe by measuring the surface characteristics. The depth and type of the altered material zone below the surface define the topography’s micro-geometrical qualities or texture and the microstructure [15]. A machined component’s surface characterization is shown in Fig. 2. Any surface imperfections are created by machine tools guiding errors, process mechanics, and process dynamics. Form error lay, waviness, roughness, and other texture properties are used to identify the texture. The many aspects of surface texture are depicted in Fig. 3.
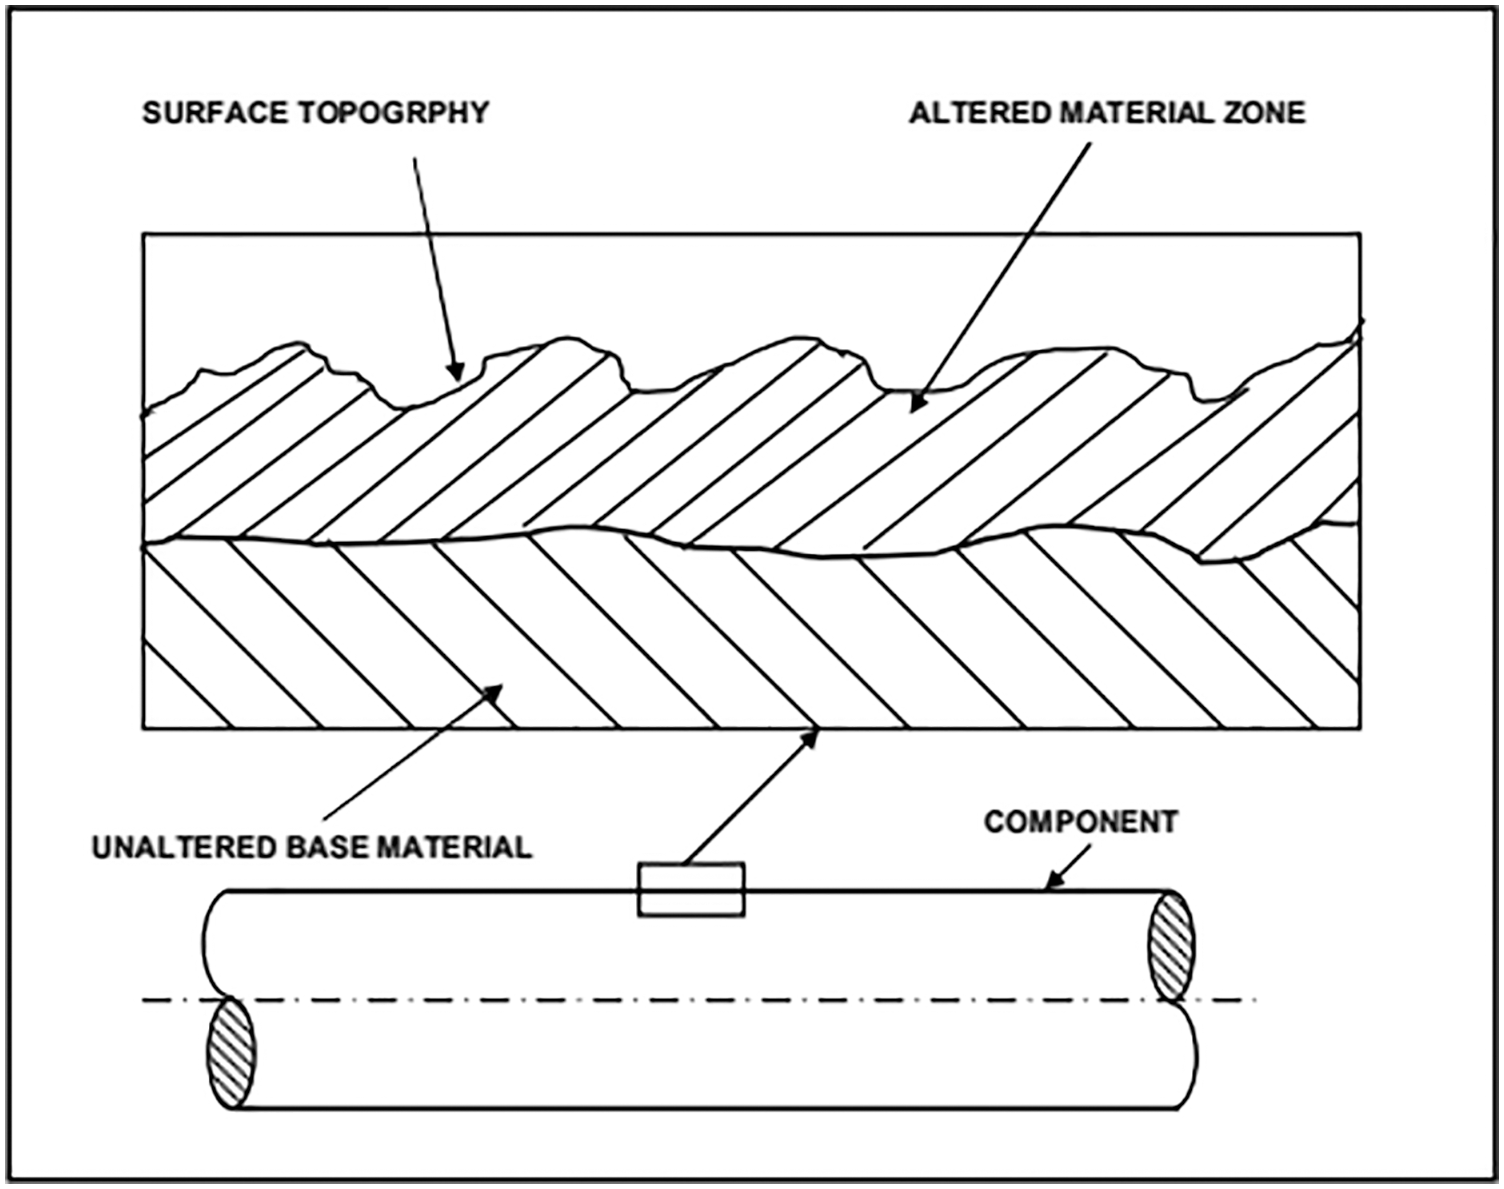
Figure 2: A machined component’s surface characterization
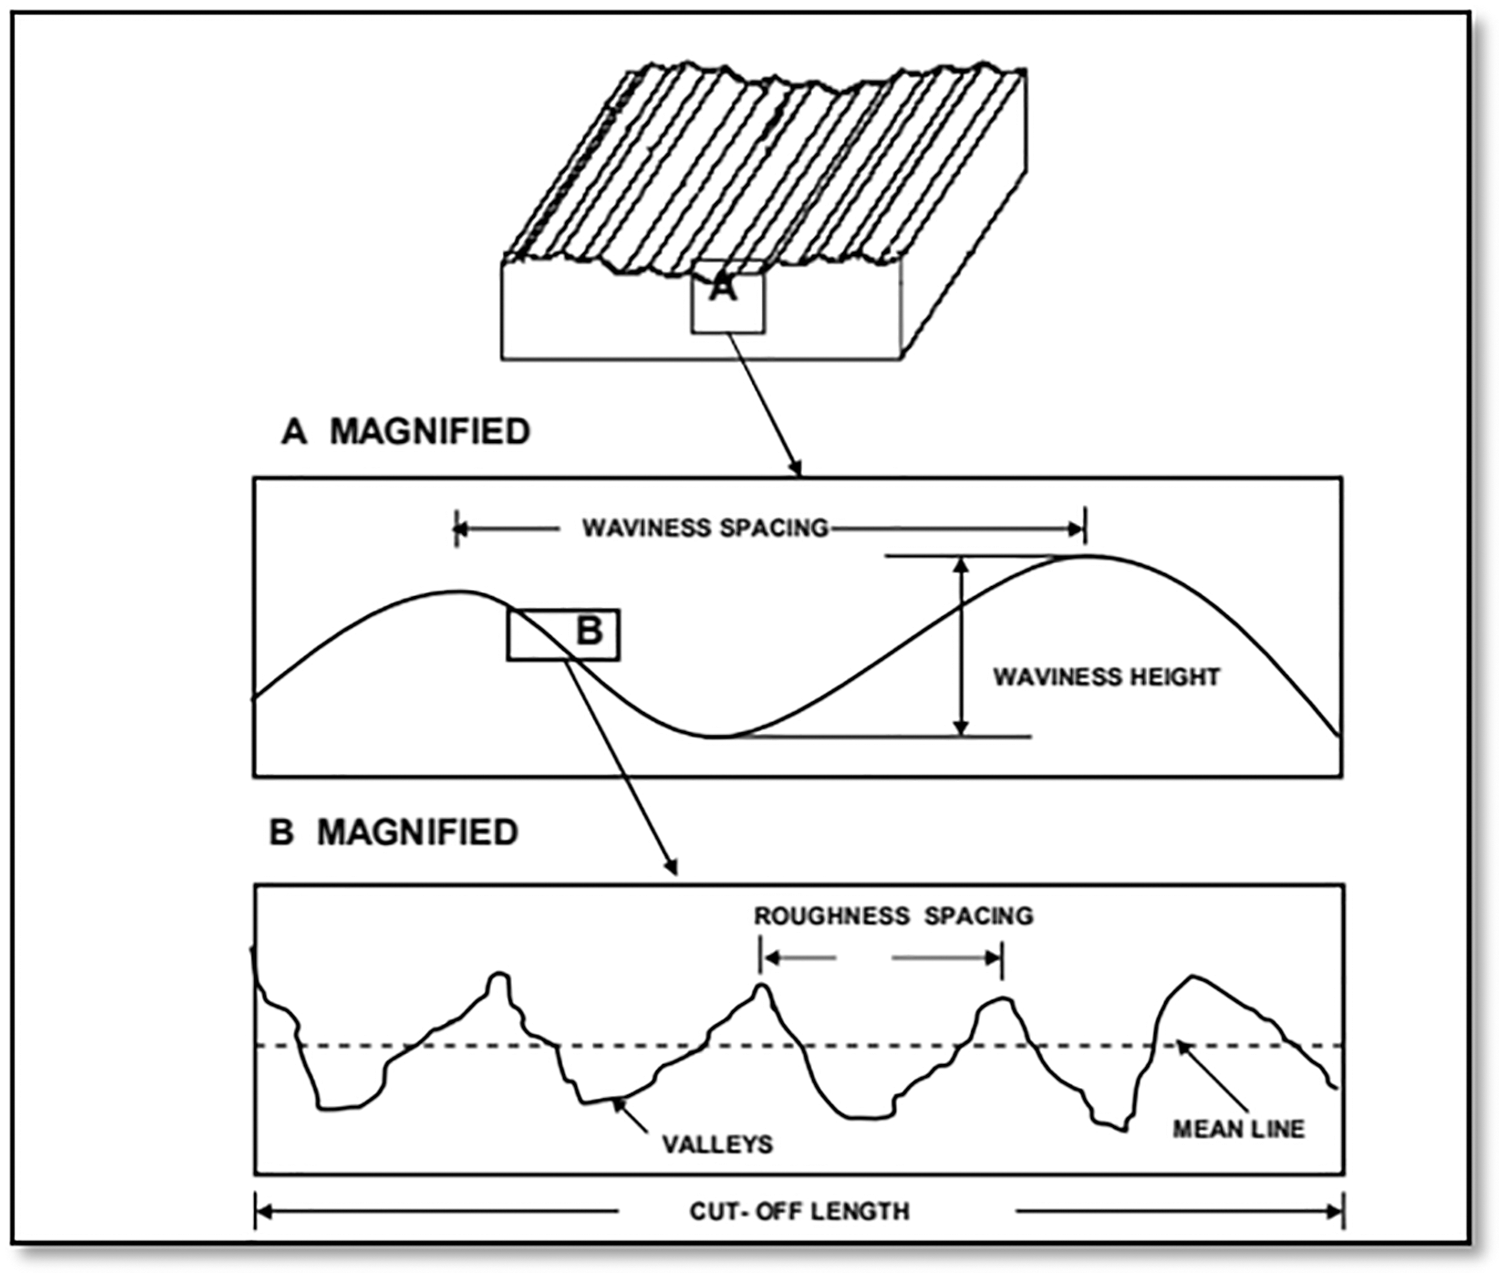
Figure 3: Aspects of surface texture
1.1.1 Types of Surface Characteristics
Machine tool guiding errors, process mechanics, and process dynamics are the most common causes of surface imperfections. Form error, lay, waviness, roughness, and other texture qualities are used to identify texture features. The many aspects of surface texture are depicted in Fig. 3.
• Form Error: A form error is any variation of the surface from the defining feature or form of a component. Form error is defined as very long wavelength imperfections on a part that are examined over the full feature. Machine tool faults and settings cause them.
• Lay: The lay is the prevailing direction of the surface imperfections. It is provided in relation to a workpiece reference edge.
• Waviness: Waviness is a group of medium wavelengths that are substantially shorter than the form flaws on the surface. Due to cutting loads and temperature, errors in cutter geometry, faulty workpiece fixturing, machine tool/cutting tool vibration, and tool and workpiece deflections all contribute to waviness.
• Roughness: It consists of irregularities of short wavelength that are relatively closely spaced or finely surfaced, primarily in the form of feed marks left on the machined surface by the cutting tool. The surface generation mechanism related to manufacturing is thought to be the source of roughness. Due to the narrow wavelengths, finer and smaller abnormalities could be seen in practice, depending on the instrumentation employed. A particular manufacturing technique frequently leaves a distinctive texture on the surface. Roughness is the crucial component of this texture.
Form errors, waviness, and roughness are all examples of surface errors. An integrated error profile is derived from the surface profile. Form errors are linked to the part’s overall geometry, and form variations can be measured with the right trace length and tools. Although the distinction between waviness and roughness is not well defined, standards include allowances to distinguish them in terms of wavelength. They are chosen based on the roughness value and manufacturing method. These wavelengths are referred to as cut-off wavelengths, and they highlight the difference between roughness and waviness. 0.025, 0.08, 0.25, 0.8, 2.5, and 8 mm are the standard values.
1.2 Surface Roughness Measurement
Many surface finish measurement techniques have been developed, ranging from a basic visual comparison that is subjective to a more sophisticated atomic force microscope that detects roughness in nanometers. The several classes of surface roughness measurement are shown in Fig. 4. The following section briefly discusses a few of the ways.
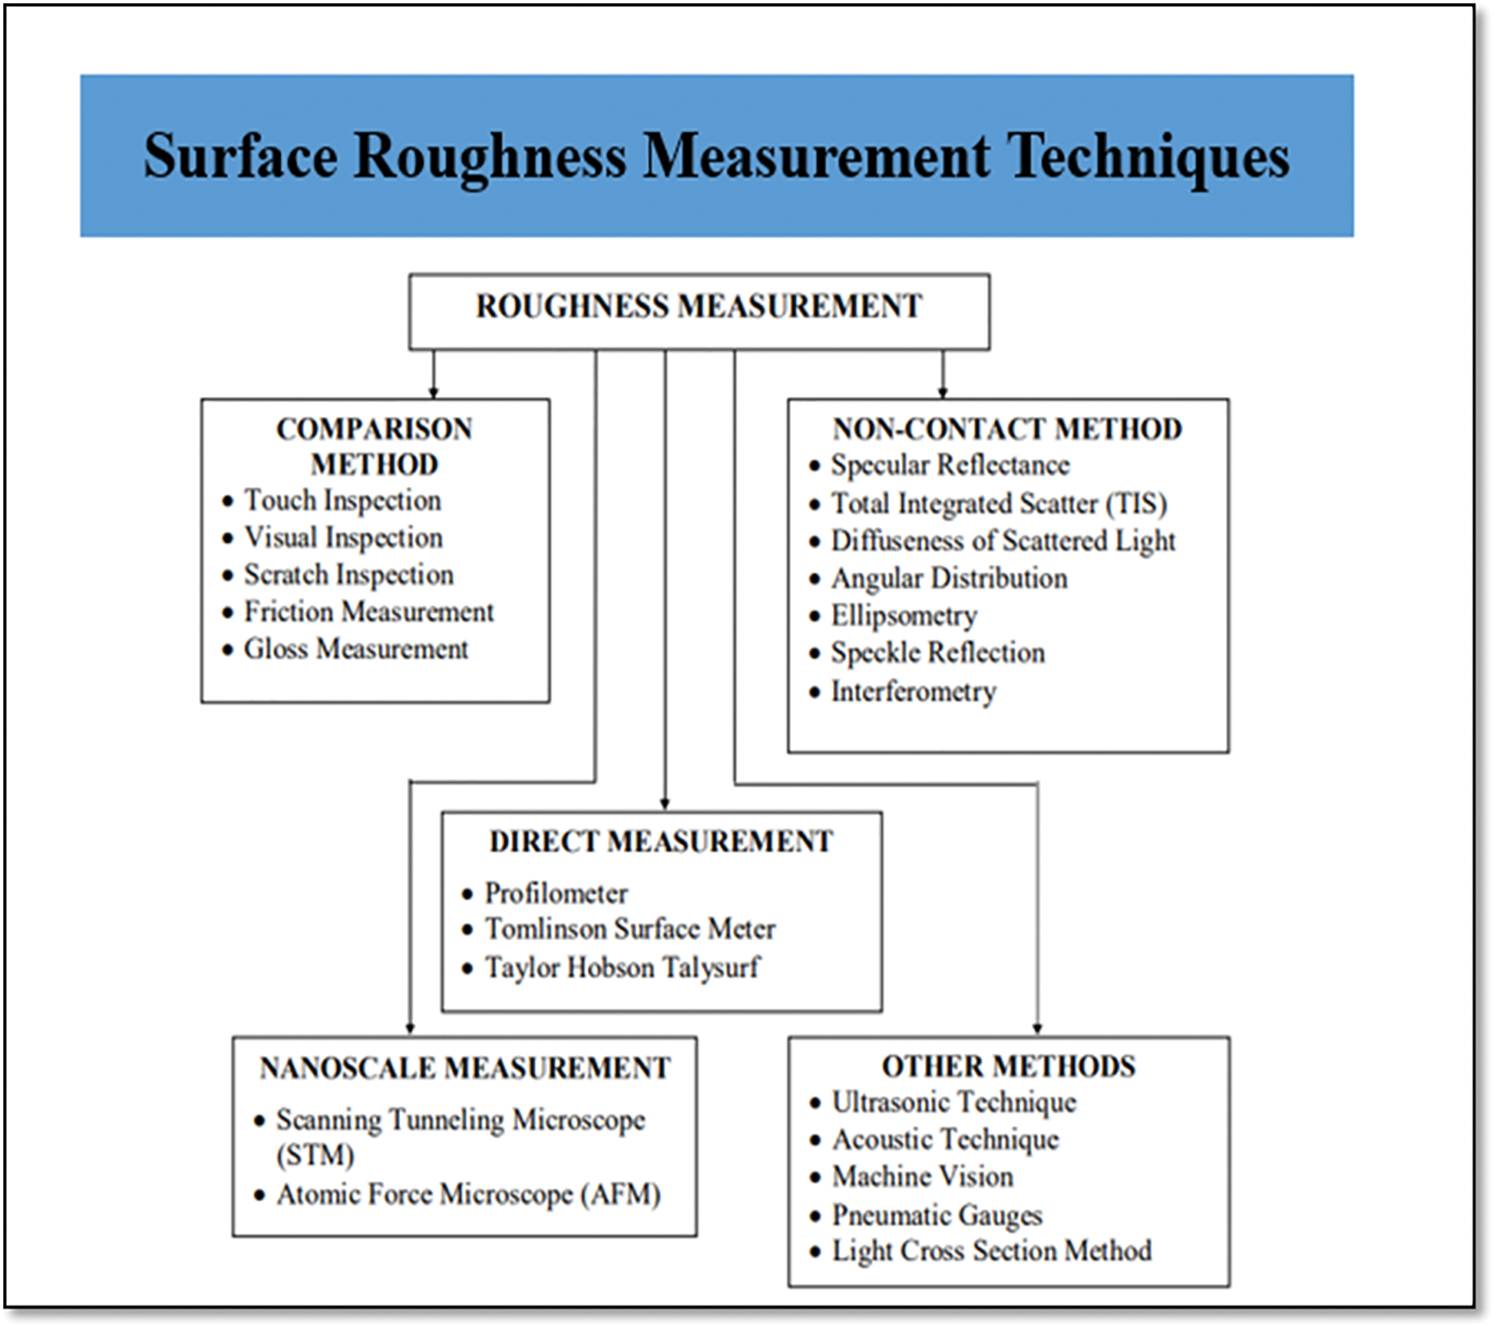
Figure 4: Types of surface roughness measurement
1.2.1 Comparison-Based Methods
The surface roughness is assessed using either visual observation or mechanical sensation in this technique. The specimen’s surface imperfections are compared to the surface of a known surface finish. The roughness measurement is subjective and depends on personal opinion. Surface roughness specimens made with the same process, material, and machining parameters are used in this technique. The comparison is made using a variety of methods.
This approach involves making direct contact with the surface using the inspection probe in order to assign a numerical value to the surface roughness. The stylus probe is moved over the surface by a skid that follows the profile of the surface. Following surface imperfections, the stylus probe moves vertically. Transducers take up and magnify the vertical movement of the stylus. The mechanical or electronic system keeps track of the stylus movement. The vertical movement of the stylus in terms of surface roughness is connected from the profile trace. Some of the most common stylus instruments are the profilometer, Tomlinson surface metre, Taylor-Hobson Talysurf, and Perthometer.
• Profilometer: This dynamic instrument works like a gramophone pickup. The pickup moves a sharply pointed stylus across the surface. The signal is amplified and shown. Roughness, waviness, and faults in surface imperfections are all measured with this equipment.
• Tomlinson Surface Meter: This instrument uses mechanical means to magnify the stylus movement [16]. As shown in Fig. 5, the spring roller configuration prevents the diamond-tipped stylus roller from making just vertical movement. The diamond scribing tracer receives the vertical movement of the stylus and magnifies it. The tracer records vertical movement on a smoked-glass panel, which is evaluated and quantified manually.
• Taylor-Hobson Talysurf: The stylus movement is magnified, and the profile is analyzed using electronics. In this instrument, an armature is pivoting in the stylus arm, as shown in Fig. 6. The air gap changes as the stylus moves, and the current flowing through the armature coils changes as well. This is then put into the amplifier and recorded for further study. Roughness can be directly measured with a suitable electrical circuit. This instrument is widely used in industry because of its simplicity, ease of use, and direct detection of surface roughness [17].
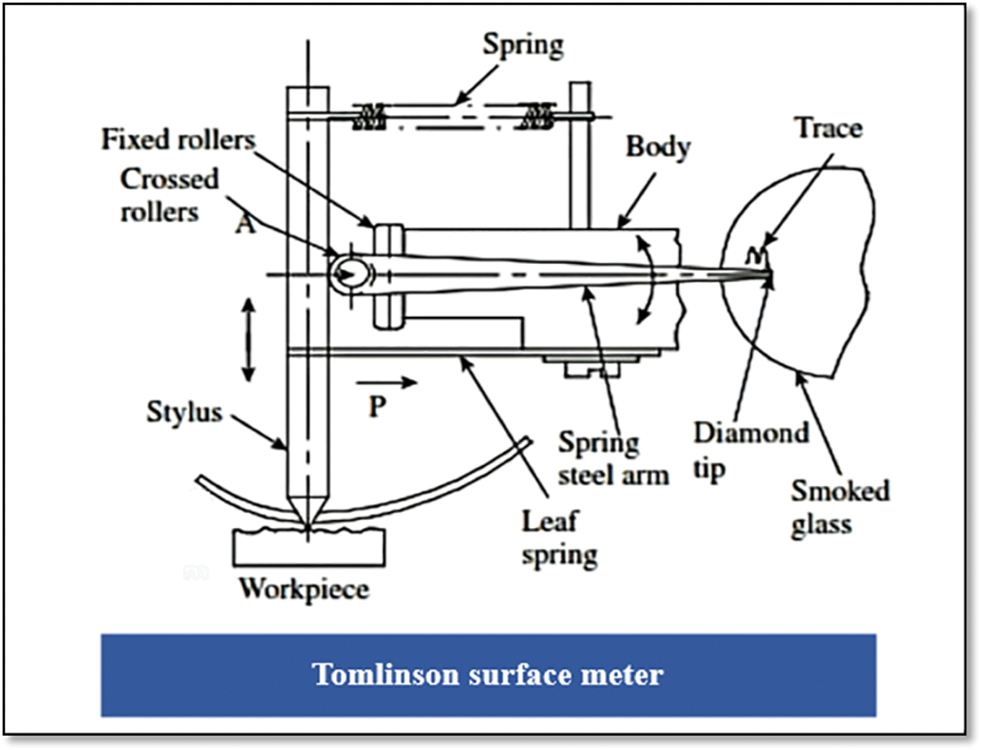
Figure 5: Tomlinson surface meter
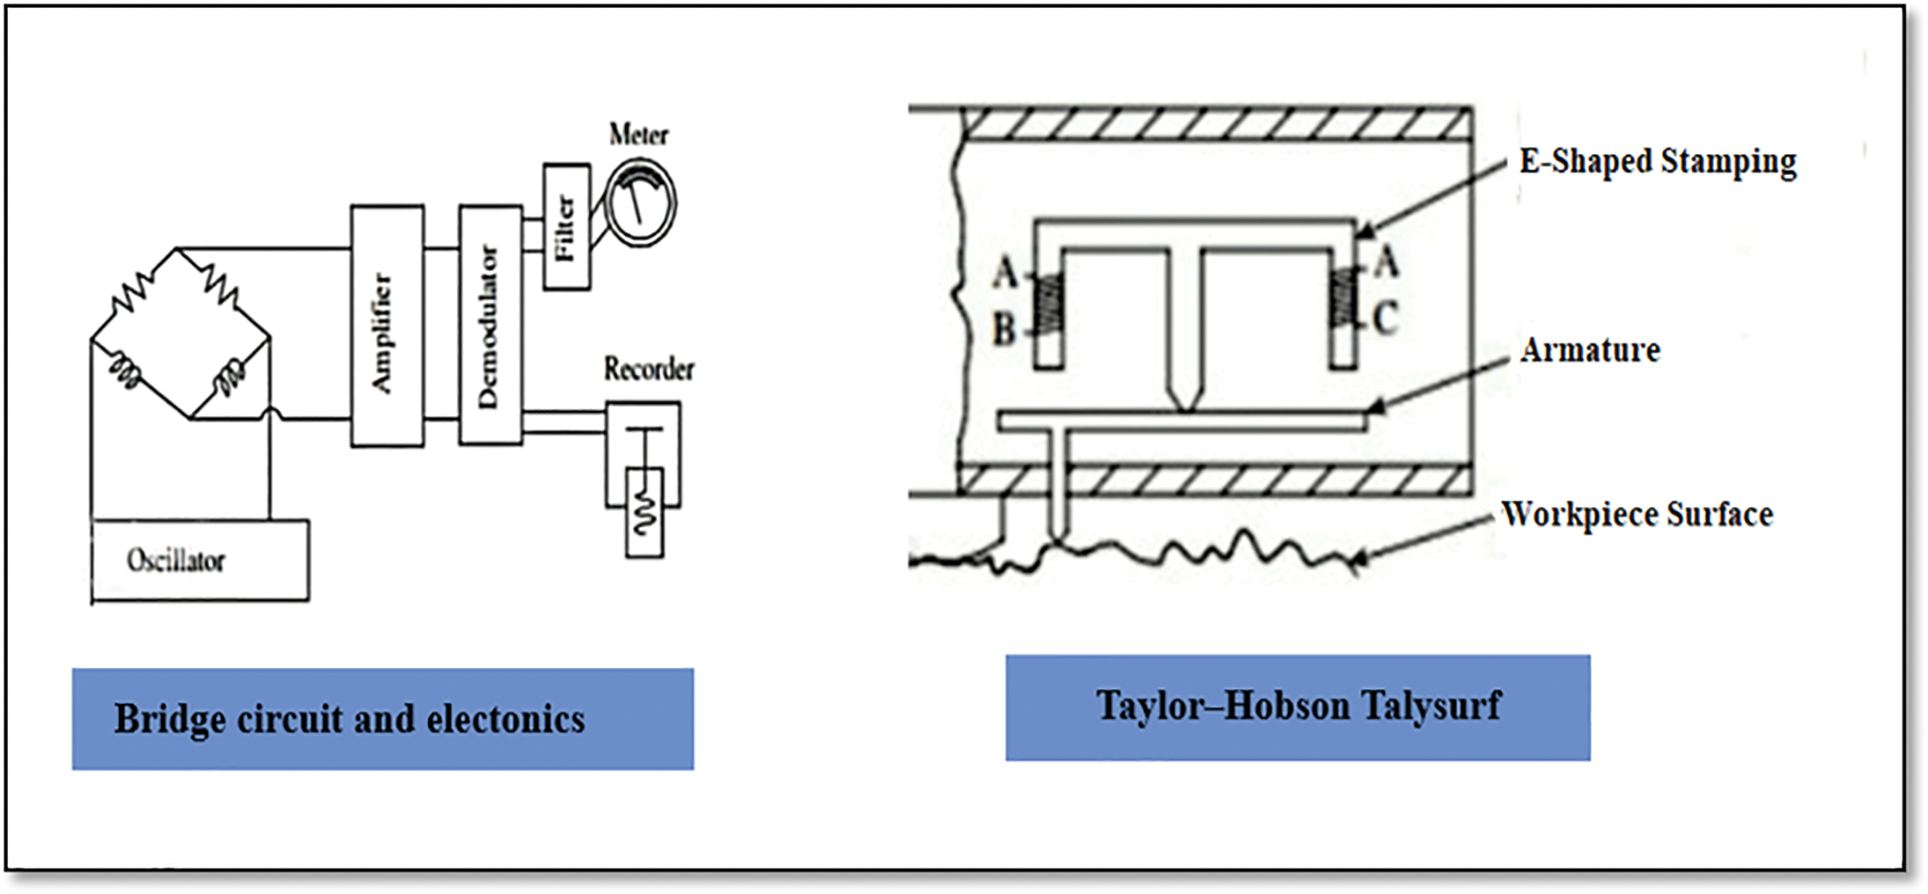
Figure 6: Taylor-Hobson Talysurf device for surface roughness measurement [17]
In 1933, Abbott and Firestone developed the first profilometer technology [18]. According to the chevalier, modern software can calculate about 300 roughness profile parameters and hundreds of topographical parameters. Any surface’s roughness can be measured up to 200 mm in length and 100 mm in width, with a guide variation of fractions of micrometers, and further software support for precision can be provided. A three-point magnetic holder separates the diamond needle from the body. In addition, as shown in Fig. 7, the probe is outfitted with an amplitude modulation transmitter and receiver for communication with a central processing unit [19–21].
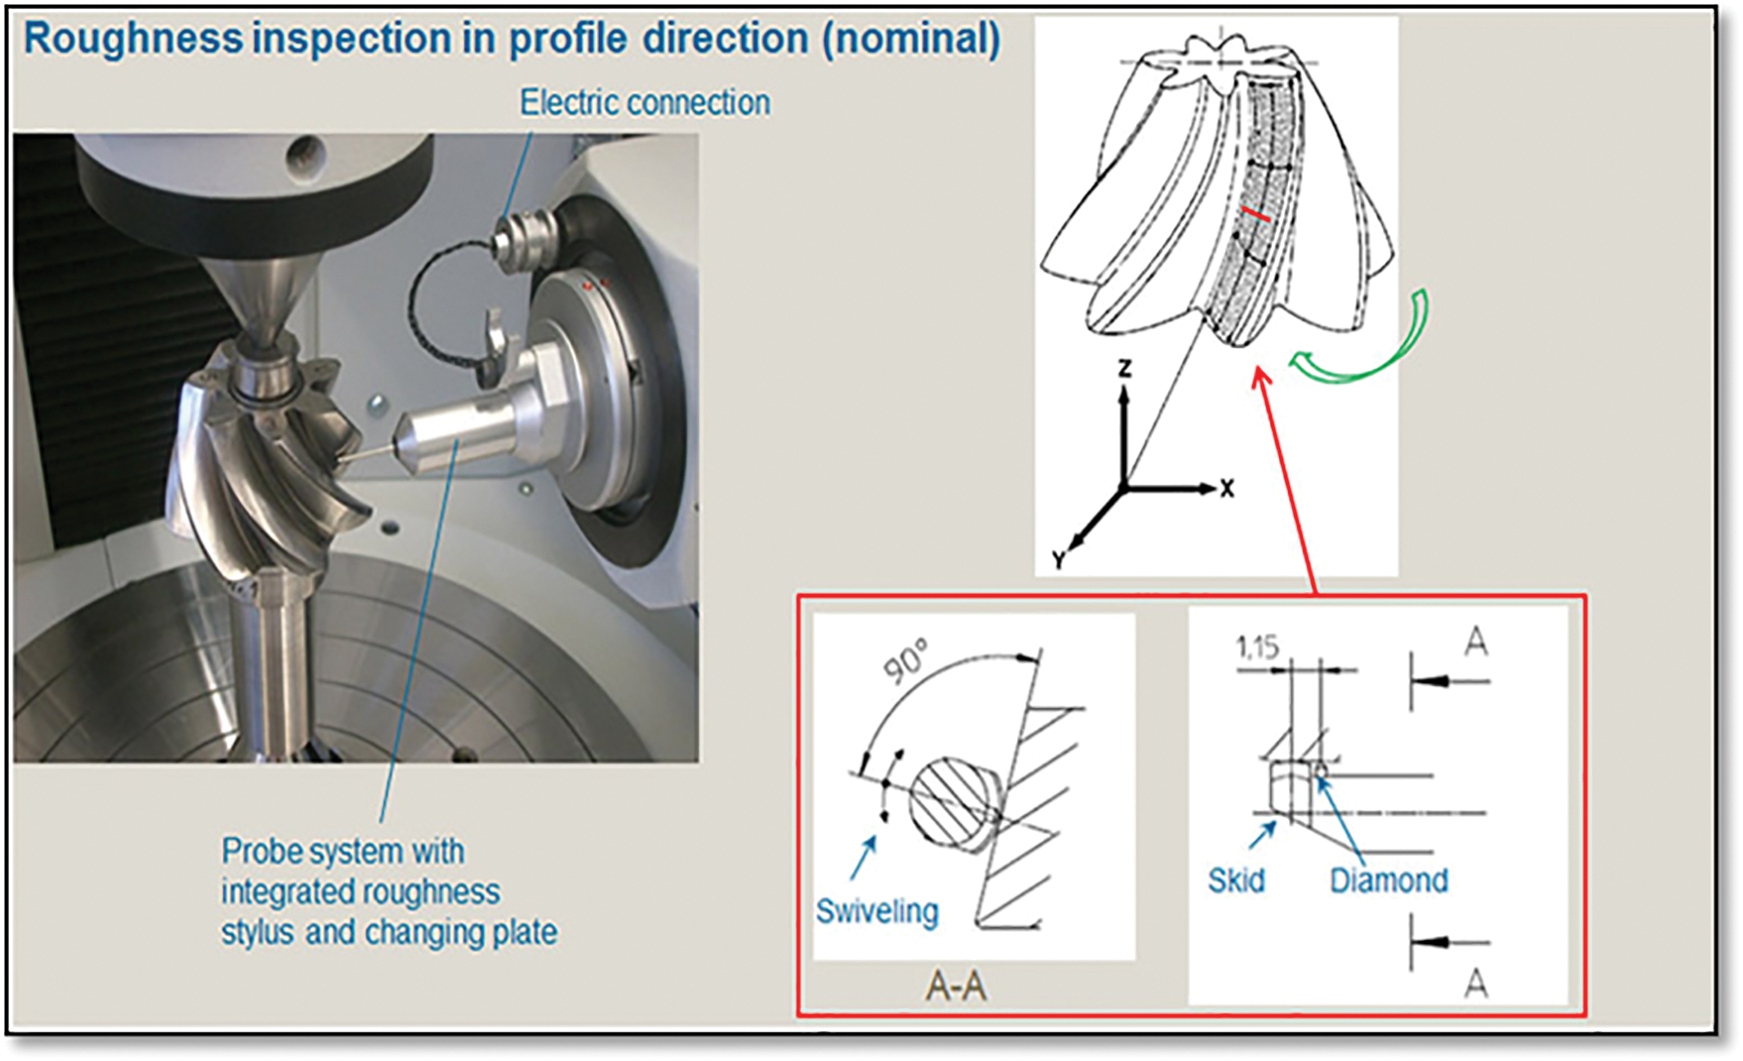
Figure 7: Two modulations of amplitude in roughness measurement [21]
Time-consuming measurements with a stylus profilometer in 3D surface topography are a severe restriction, as shown in Fig. 8. Spiral sampling is one way to avoid this problem [22]. Constructions based on optical phenomena are being created, regardless of the contact devices. As a result, the optical approaches have been thoroughly detailed in the scientific literature [23–27].
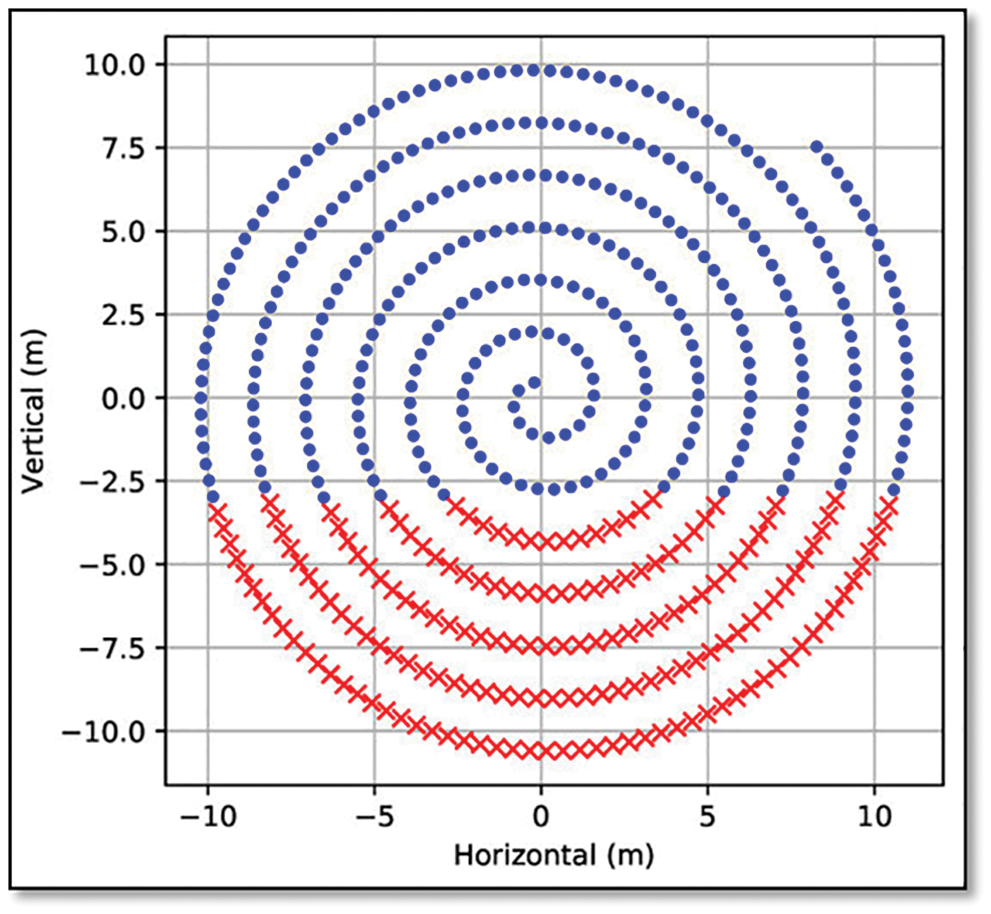
Figure 8: Application of spiral sampling [22]
Surface finish is measured using optical and non-optical technologies such as pneumatic gauges and thermal comparators. Optical techniques commonly employed to detect the fine surface quality have a lot of potential for non-destructive and online surface roughness measurements during manufacturing.
When a rough surface reflects a collimated beam of laser light, the radiation is scattered into an angular distribution according to the laws of physical optics. The intensity and the pattern of scattered radiation depend on roughness height, spatial wavelengths, and wavelength of light. In general, small spatial wavelength components diffract the light into large angles relative to the specular direction, and long spatial wavelength components diffract the light into small angles. This concept is applied in many optical techniques, some of which are explained below. When a rough surface reflects a collimated laser beam, the light is scattered into an angular distribution according to physical optics laws. The intensity and pattern of scattered radiation are determined by the roughness height, spatial wavelengths, and light wavelength. Tiny spatial wavelength components, in general, diffract light into large angles relative to the specular direction, while long spatial wavelength components diffract light into small angles. Many optical techniques use this notion, some of which are detailed below:
• Specular Reflectance: The easiest way in optical technology is to measure the intensity of the specular beam to determine the rough surface’s specular reflectance. Most reflected light propagates in the specular direction for very fine surfaces. The intensity of the specular beam drops as roughness rises, whereas diffracted radiation grows in intensity and becomes more diffuse [28]. Fig. 9 shows the specular reflectance detector 3.
• Total Integrated Scatter (TIS): This approach works in conjunction with specular reflectance. The overall intensity of diffusely scattered light is measured rather than the intensity of specularly reflected light [29]. The schematic of the measurement instrument is shown in Fig. 10.
• Diffuseness of Scattered Light: With increasing roughness throughout a wide roughness range, the dispersed radiation pattern becomes more diffuse. This pattern can be described in terms of roughness. In Fig. 10, the ratio of the specular intensity measured by detectors 3 and 4 might be used to calculate roughness [29].
• Angular Distribution: The angular distribution of dispersed radiation contains much information about the concept’s surface topography. Fig. 10 shows how an array of detectors measures the angle distribution. Other surface metrics such as the average wavelength or the average slope can be determined by altering the angle of incidence and using mobile detectors.
• Ellipsometry: Ellipsometry is a method of measuring the index of refraction of solids, as well as the index of refraction and thickness of surface films. When a beam of light is reflected from a surface, this technique measures the change in its polarisation state [30]. An ellipsometer is shown schematically in Fig. 11.
• Speckle: The reflected beam from a rough surface irradiated with partially coherent light consists of random patterns of brilliant and dark patches known as speckles. The spatial pattern and contrast of the speckle are determined by the optical system employed for observation, the illumination’s coherence state, and the scatterer’s surface roughness. The local intensity variation between surrounding locations in the overall distribution is known as speckle. The intensity variations in speckle contrast measurements are quantified in terms of average contrast, which is defined as the normalized standard deviation of intensity variations at the observation plane. Two speckle patterns are obtained from the test surface by illuminating it with various angles of incidence in the speckle pattern decorrelation measurement. Next, the speckle patterns’ correlation qualities are investigated by recording them on the same photographic plate.
• Interferometry: Interferometry is a useful method for determining the roughness of high-quality optical surfaces. The Michelson two-beam interferometer allows for direct measurement of surface heights in terms of optical wavelength. A partially transmitting mirror splits an optical wavefront into two coherent beams. A smooth surface reflects one beam, while the test surface reflects the other. Following that, the two beams are recombined. A circular interference pattern can be seen when everything is perfectly aligned. The interferometer will produce patterns of dark and bright fringes with a modest amount of tilt. The peaks and valleys of surfaces are revealed by the variation of the fringes, which is analogous to the roughness profile [31]. The fringe pattern and the Michelson interferometer concept are depicted in Fig. 12.
• Vertical Scanning Interferometry (VSI): New solutions have used CCD (charge-coupled Device) lines and arrays to detect the light signal in light scattering approaches. These techniques have been successfully employed in preventive inspection roughness measurements, and their vertical measuring range reaches one micrometer [32–34]. Modern interferometers, which are used to detect roughness, are white light-based systems. Phase-shifting interferometry (PSI), vertical scanning interferometry (VSI), and enhanced vertical scanning interferometry are the most used interferometric measuring techniques (EVSI). PSI uses a monochromatic light source and is typically used to analyze exceptionally smooth surfaces due to its subnanometer resolution. However, it has phase-ambiguity issues, limiting PSI’s applicability to a surface discontinuity of no more than/4, where is the wavelength of the light employed. Furthermore, because of the monochromatic light source, PSI can only be used in ranges where continuous fringes may be obtained. A new approach known as Multiple Wavelength Interferometry (MWI) was developed to tackle this challenge, which has successfully extended high difference constraints. Two wavelengths are chosen in this procedure, allowing the user to improve the dynamic range while keeping the resolution the same. When white light is used, the dynamic range can be increased even more (VSI). Then fringe continuity is less critical; identifying a focus is more vital. Fig. 13 depicts the VSI system’s working principle [35].
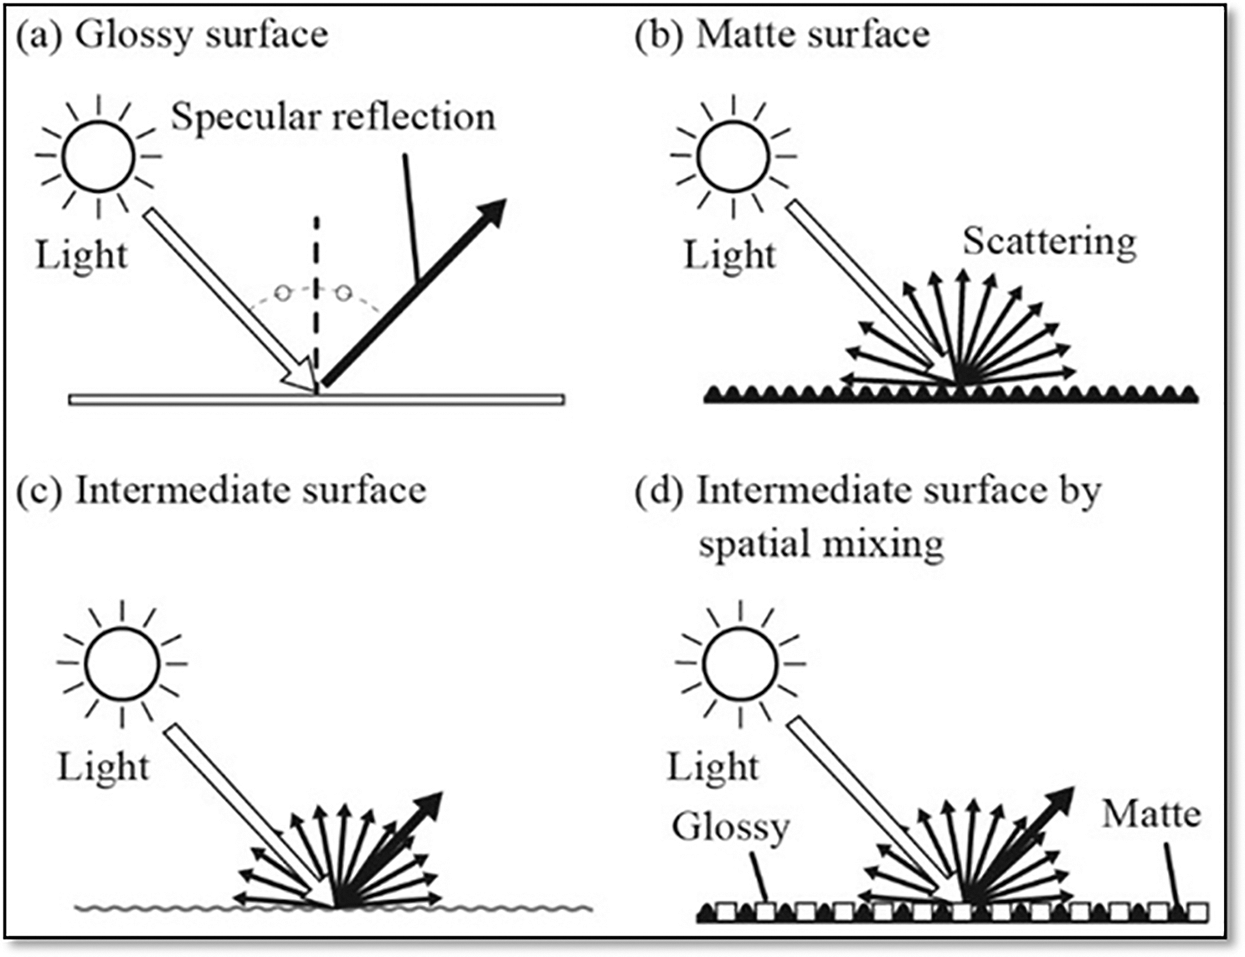
Figure 9: Angular distribution of light scattered by a rough surface [28]
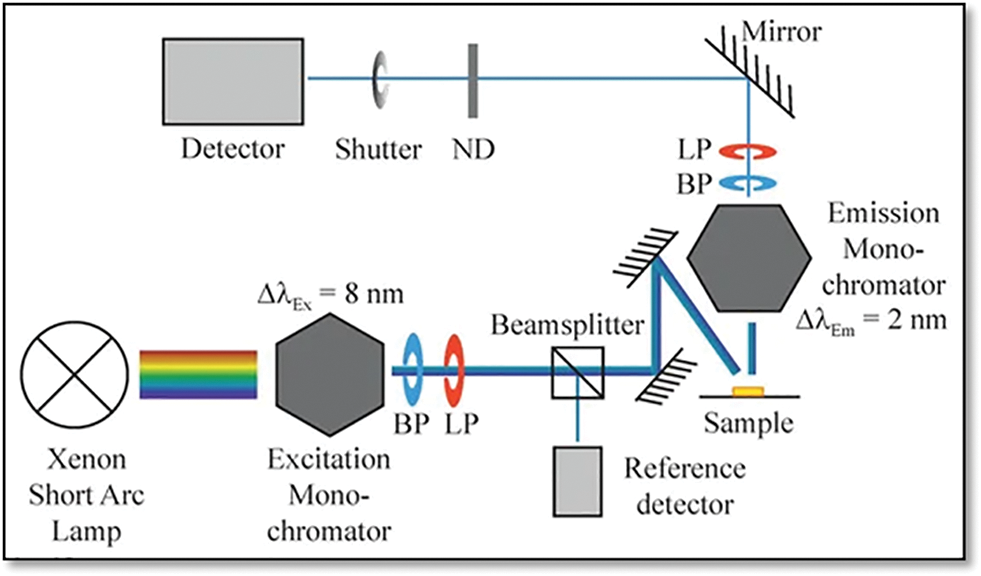
Figure 10: Schematic diagram of TIS apparatus [29]
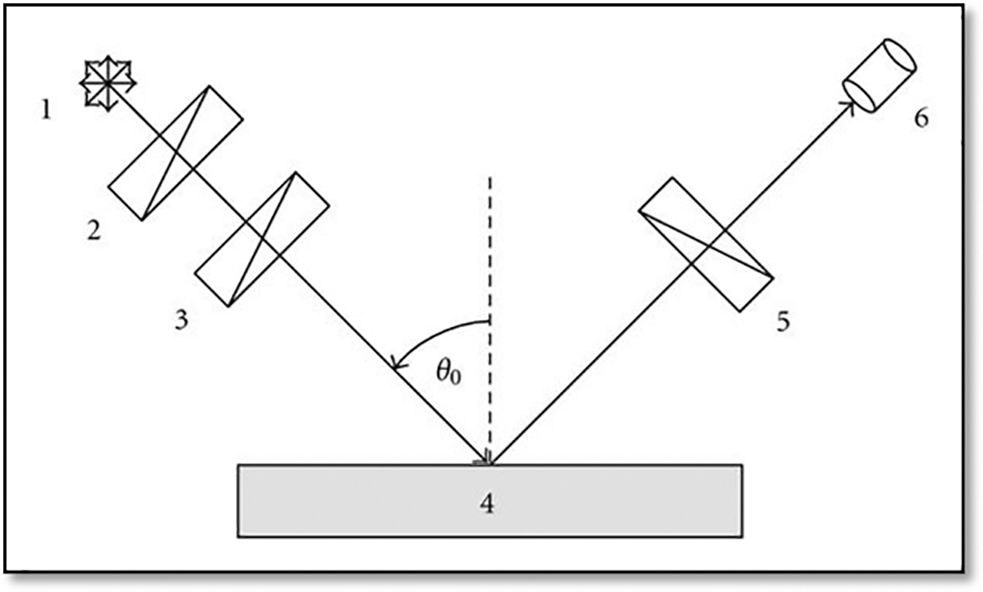
Figure 11: Simplified schematic diagram of the RPA ellipsometer, (1) Unpolarized light, (2) Fixed linear polarizer, (3) Linear polarizer rotates at ω, (4) Isotropic sample, (5) Linear analyzer rotates at ω, and (6) Detector [30]
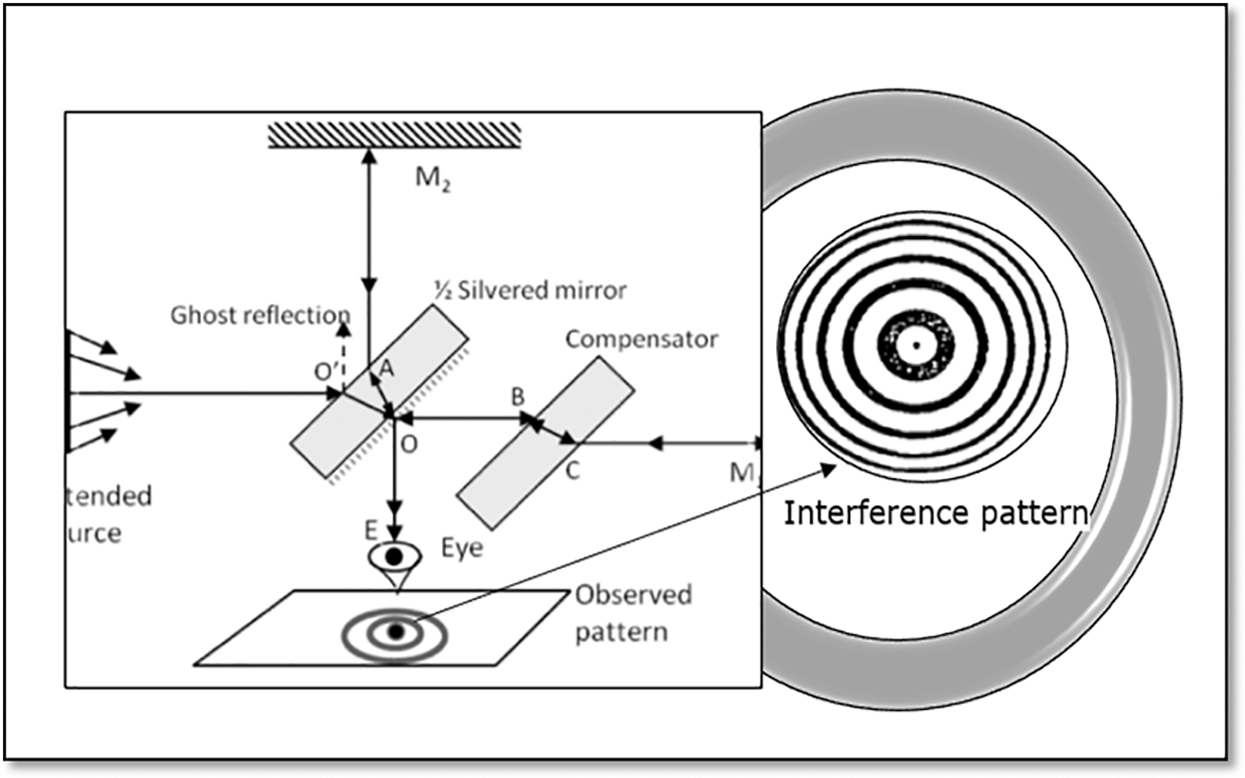
Figure 12: Principle of Michelson interferometer and the fringe pattern [31]
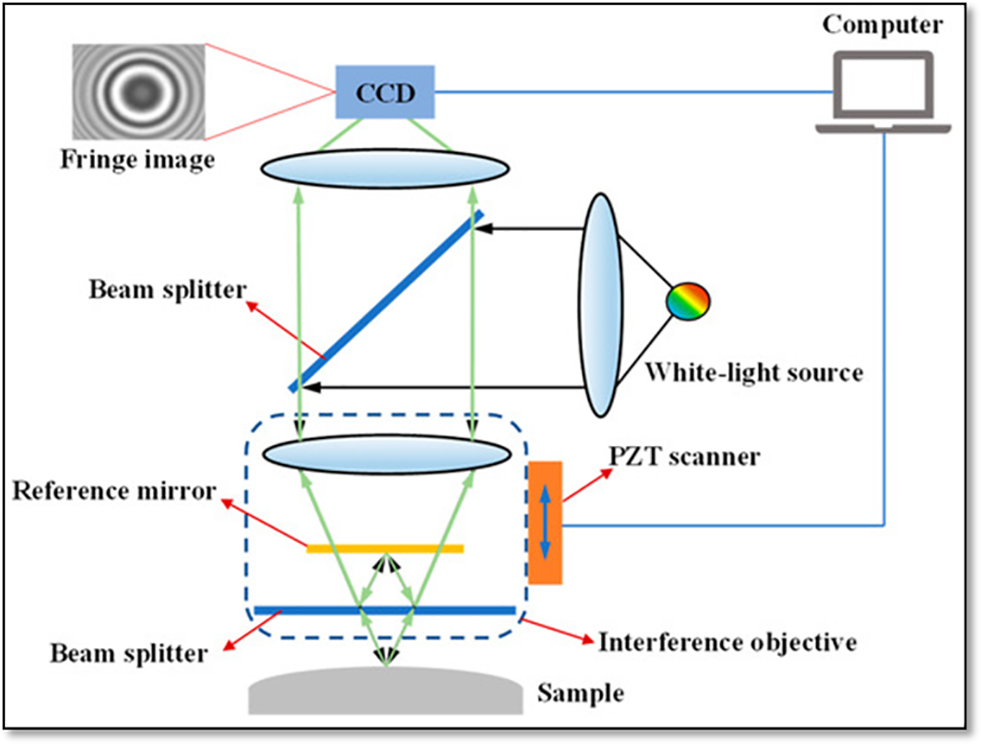
Figure 13: Principle of a VIS [35]
1.3 Optical Measurement Techniques
The most sensitive and delicate measurement probe is light. Light-emitting diodes (LEDs) and lasers are simple to make, while ultrasensitive photodetectors are simple to detect. For surface characterization, light has become an essential tool in nanometrology. As a result, optical techniques for line profiling and areal topography have been developed. These techniques can go close to the spatial resolution limit of diffraction. Optical procedures have the advantage of being non-destructive because they are noncontact. Optical imaging and microscopy technologies are also faster than contacting procedures that rely on the mechanical scanning of a contacting probe.
On the other hand, optical approaches are sensitive to a variety of surface characteristics in addition to surface height. Optical constants, surface slopes, small surface characteristics that generate diffraction, and deep valleys where multiple scattering may occur are all examples of these. Furthermore, stray light in the optical system caused by scattering from examined surfaces can reduce the accuracy of an optical profiling method. A vertical resolution of 0.1 nm is achieved using high-sensitivity technologies such as phase-shifting interferometric (PSI) microscopy [36,37].
• White-Light Interference Microscopy (WLI): Interferometers and microscopes work together in interferometric microscopy. Very good resolution and a large vertical range can be attained using this combination. Although interferometry is not a novel measuring technique, integrating ancient interferometry techniques with current electronics, computers, and software has resulted in incredibly powerful measurement instruments [37–42]. Two separate approaches are typically utilized in phase-shifting interferometry (PSI) and scanning white light interferometry (WLI). A wideband light source is used in WLI microscopy [43–45]. The principle and schematic diagram of a white light interferometer (WLI) system [46], is shown in Fig. 14.
• Confocal Optical Microscopy: One of the most commonly utilized advanced surface metrology techniques is confocal optical microscopy. As the name implies, confocal microscopes have two lenses with the same focus point. The confocal microscope combines the concepts of point-by-point illumination and out-of-focus light rejection. Minsky et al. [47–50] addressed the basic principles of confocal microscope operation; as shown in Fig. 15.
• Confocal White Light Microscopy: WLI and confocal microscopy appear to be good and adaptable techniques. PSI is limited to smooth surfaces, but WLI and confocal microscopy have vertical dynamic ranges that span from nanometers (noise) to a considerable range [51]. Fig. 16 depicts the plan for this structure.
• Digital Holography Technique: In 1948, Dennis Gabor developed holography, a technique for recording and reconstructing the amplitude and phase of a wavefield. The digital holography (DH) approach is widely used in imaging, microscopy, interferometry, and other optical fields [52–55]. Fig. 17 depicts the DH setup for recording off-axis holograms, with Ms representing mirrors, BSs representing beam splitters, MOs representing microscope objectives, and S representing the sample object. DH uses a CCD camera to capture data on surface characteristics in measurement applications, including engineering materials and biomedicine, such as fracture tests. It is made up of a Mach-Zehnder interferometer that is lighted by a 633 nm He-Ne laser [56].
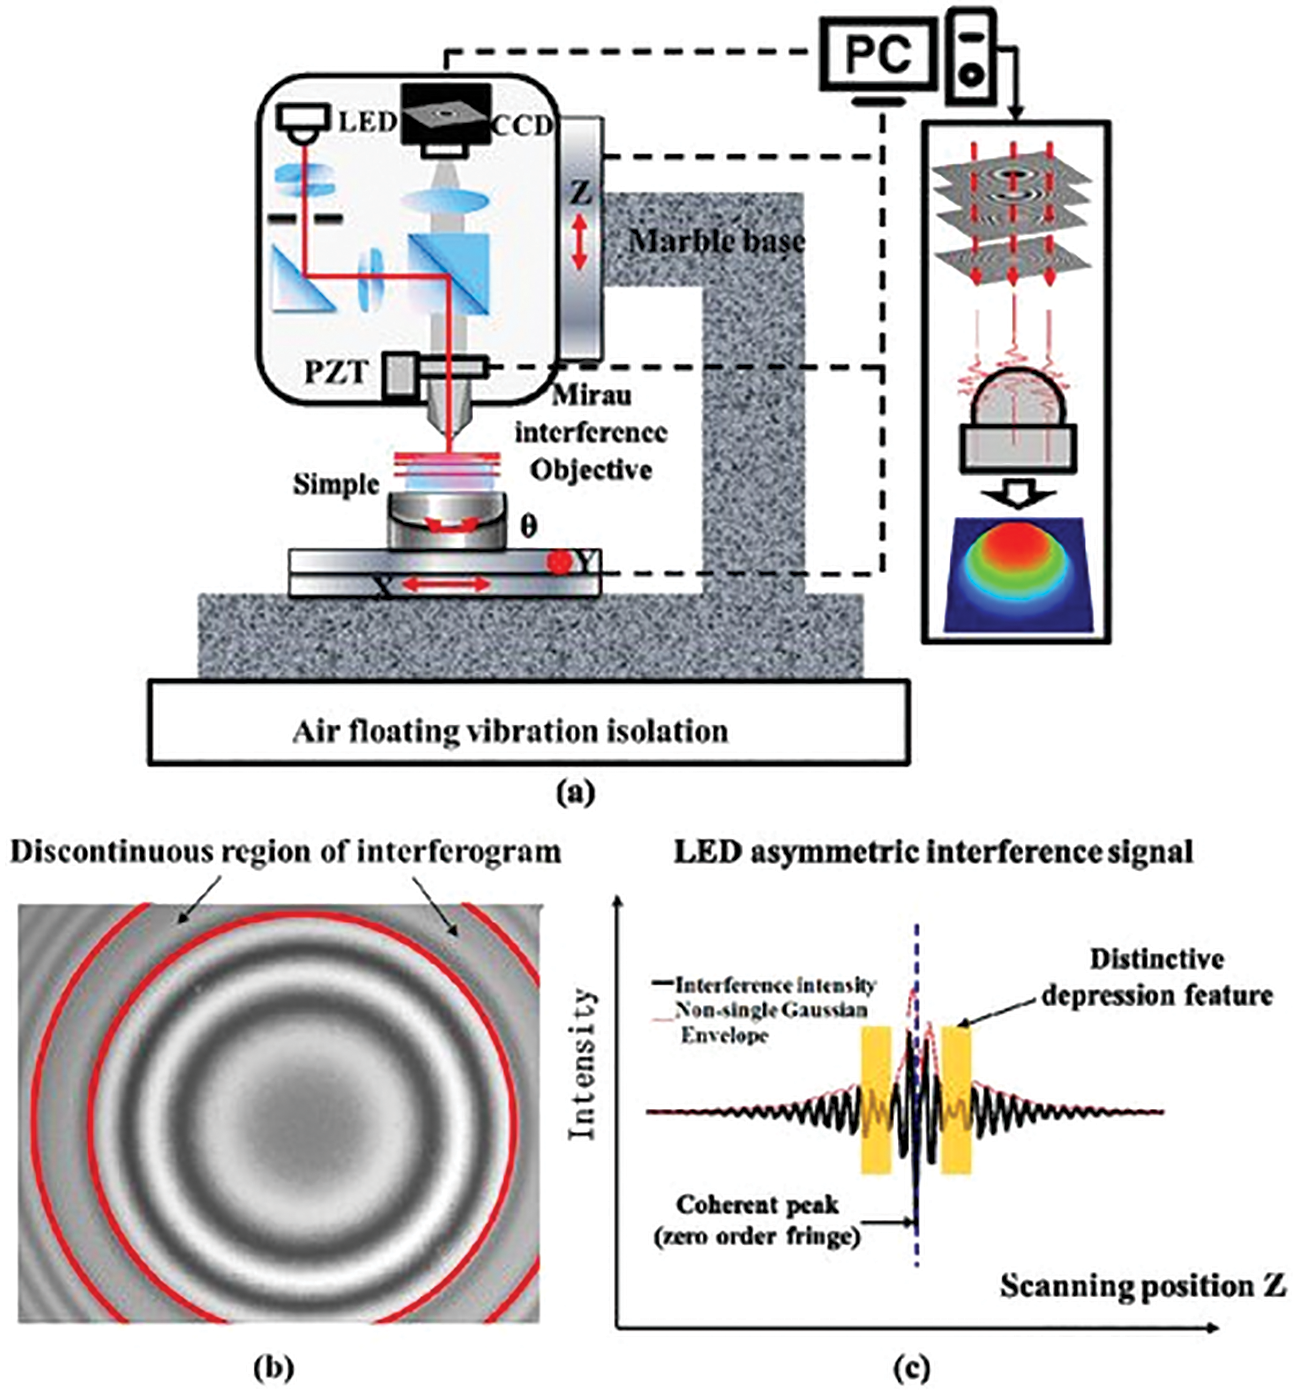
Figure 14: (a) The schematic of the white light scanning interferometry (WLSI) setup and interference data of dual-wavelength white light emitting diodes (LEDs) (b) Interferogram; (c) Interference signal [46]
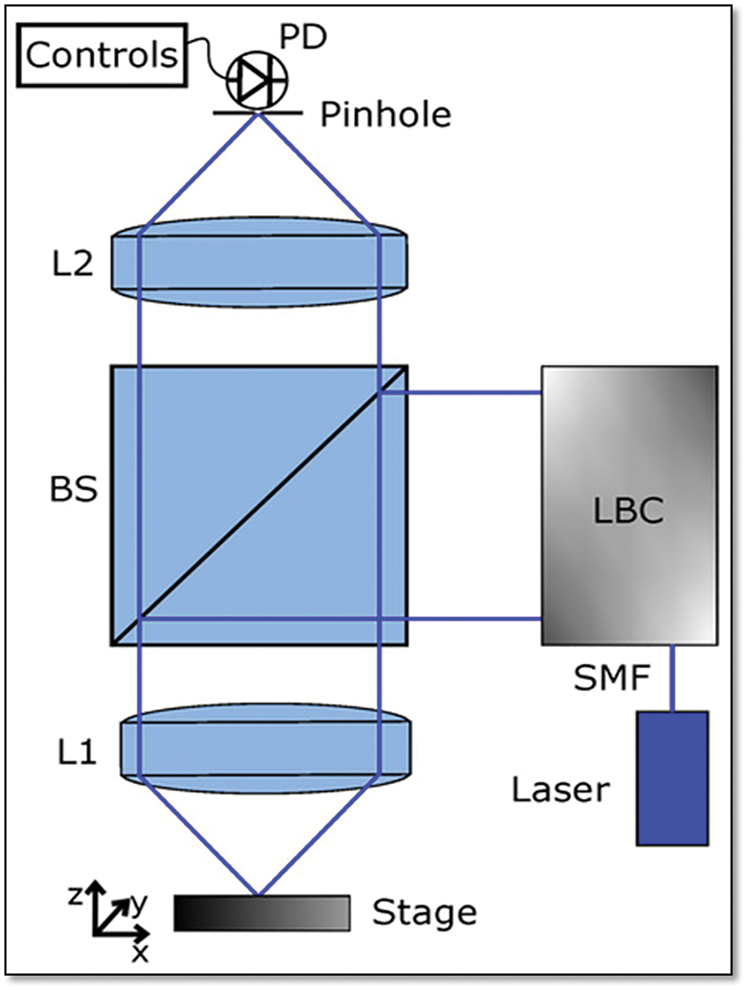
Figure 15: The principles of the optical system of the scanning confocal microscope [50]
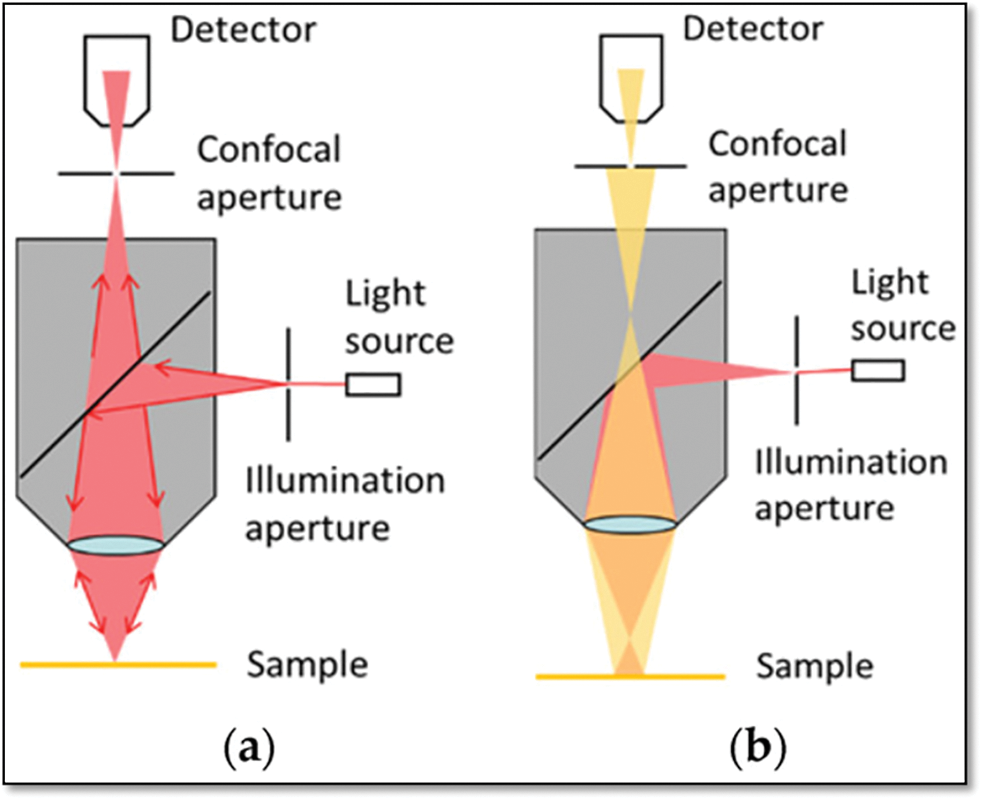
Figure 16: Structure of single-point confocal system. (a) Target point is on focus; (b) Target point is out of focus [51]
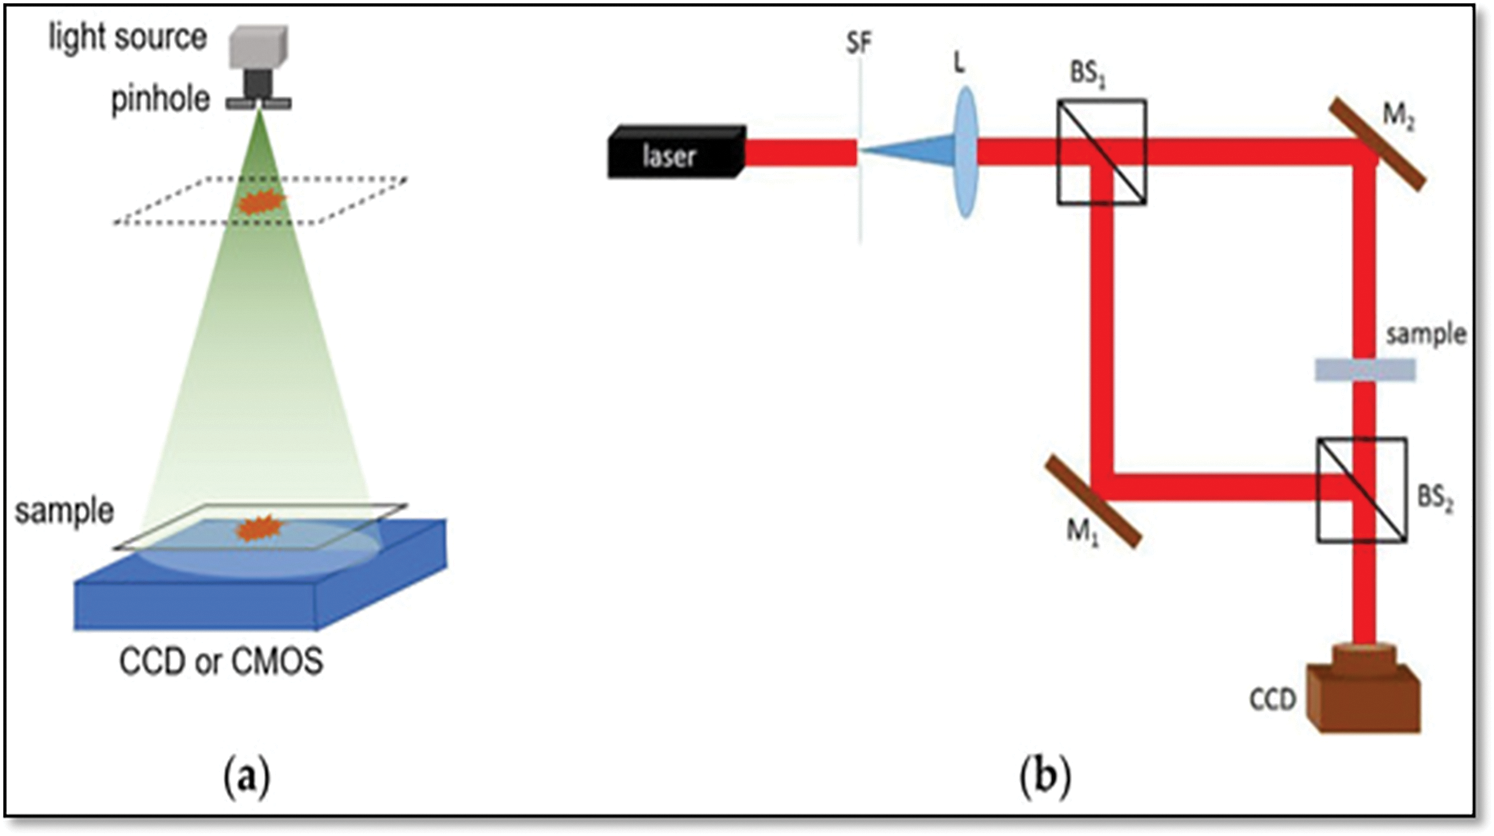
Figure 17: Schematic setup of digital holography technique: (a) Lensless in-line holographic system schematic. (b) Mach–Zehnder interferometer-based holographic system schematic [56]
1.4 Nanoscale Roughness Measurement/Nonoptical Measurement Techniques
As the demand for microelectronic components grows, their quality and surface finish requirements do. Advanced systems and sensors based on Micro-Electronics Mechanical Systems (MEMS) require micro parts, and measurement instruments with high resolution are required to assess the shape and finish of these parts. Surface assessment at the nanoscale is required. The Scanning Tunneling Microscope (STM) and Atomic Force Microscope (AFM) were created as a result of technical advancements (AFM). The Scanning Probe Microscope (SPM) is a mechanical probe microscope that scans an object in an areal space to detect surface morphology with atomic resolution [57]. Mechanically moving the probe in a raster scan of the specimen line by line and recording the probe-surface interaction as a function of position yielded a surface image. Scanning tunneling microscopy (STM) and atomic force microscope (AFM) are the two main types of SPM. The STM was invented in 1981 by Binning and Rohrer, for which they were awarded the Nobel Prize in Physics in 1986 [58].
• Scanning Tunneling Microscope (STM): It is a non-optical microscope that can take photographs of conductive surfaces down to the nanoscale scale. A voltage is supplied between the probe and the surface of the substance being studied, and an atomically sharp investigation is moved across it. Electrons will “tunnel” from the tip to the surface (or vice versa) depending on the voltage, resulting in a weak electric current. A servo loop keeps the tunneling current constant by regulating the distance between the tip and the surface. The surface structure of the substance under study is recreated by scanning the tip over the surface and measuring the height. STMs can display single atoms in great detail [59,60]. Figs. 18 and 19 depict the schematic view and principle of an STM.
• Atomic Force Microscope (AFM): The AFM is made up of a micro-size cantilever with a sharp tip at one end that is used to scan the surface of the material. The cantilever is typically made of silicon nitride with a tip radius of curvature in the nanometer range. A cantilever with a highly sharp tip is utilized to tap or continuously touch the sample surface during scanning. The cantilever deflects when the tip comes into contact with surface forces between the tip and the sample. A probe motion unit senses the force between the probe and the sample, which sends a correction signal to the piezoelectric scanner to keep the forces constant. A laser spot reflected from the top of the cantilever into an array of segmented photodiodes is used to quantify probe motion. Controller electronics interact with the computer, the scanning system, and the probe motion sensor. The AFM can be used in either static or dynamic mode (cantilever static) (cantilever oscillating) [61–63]. Figs. 19 and 20 depict the principle and block diagram of an AFM.
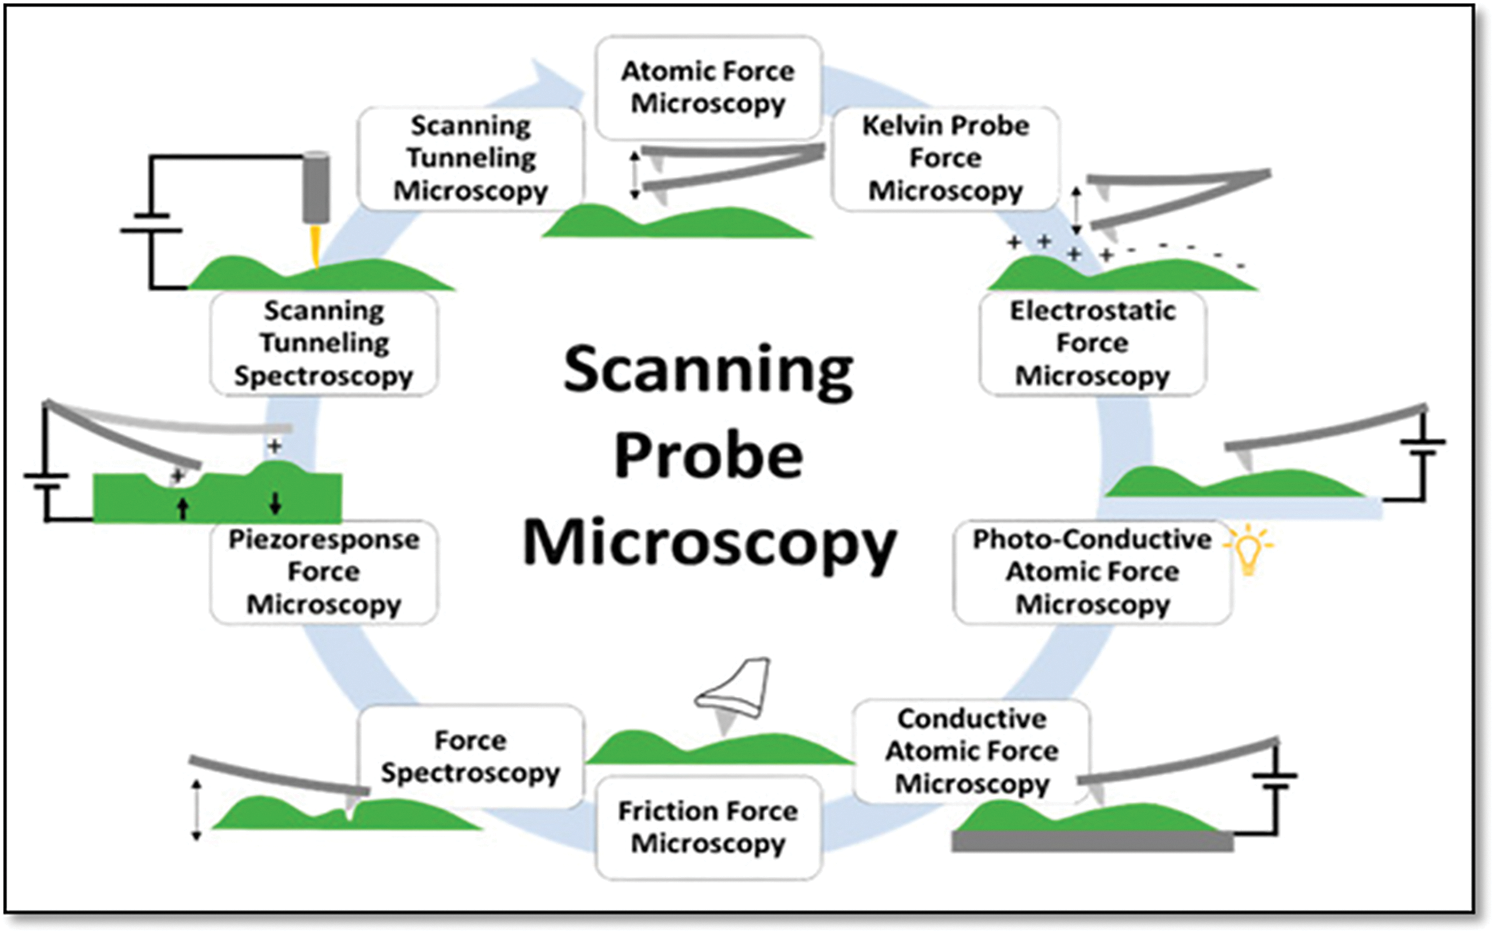
Figure 18: Scheme showing the different Scanning Probe Microscopy techniques described in this review for the characterization of two-dimensional (2D) materials [59]
Figure 19: General principle of STM [60]
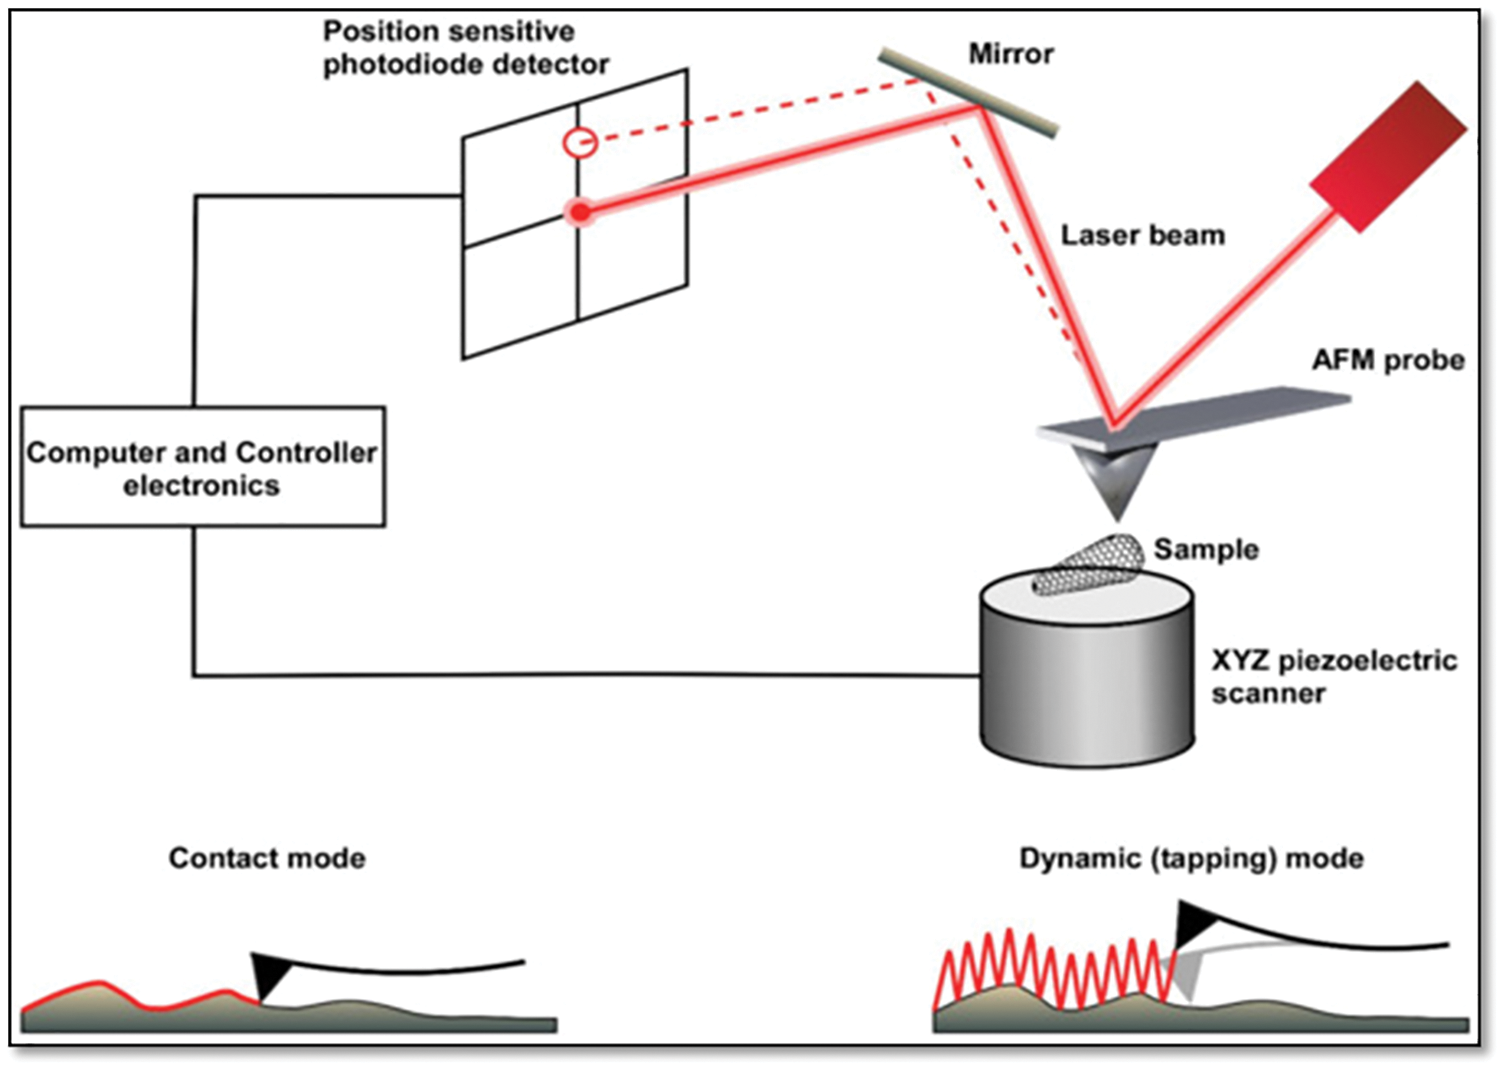
Figure 20: Block diagram of an AFM [61]
Fig. 21 shows the block diagram in the X, Y, and Z directions for various AFM operation modes [62].
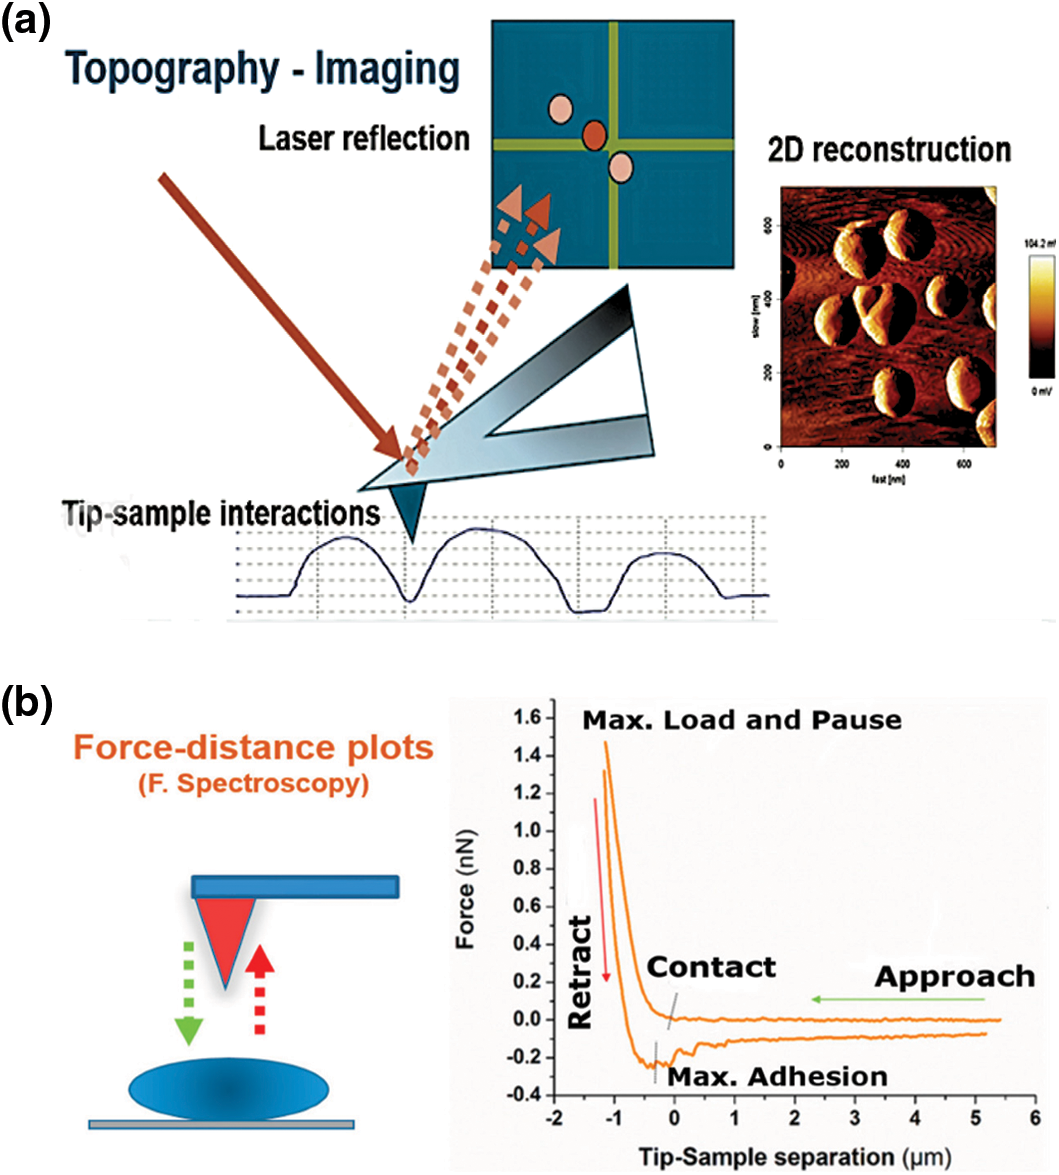
Figure 21: Operation of AFM system control loop: (A) Imaging mode and (B) Force spectroscopy mode [62]
AFM images produced on a 2D and 3D stamp [63], are shown in Fig. 22.
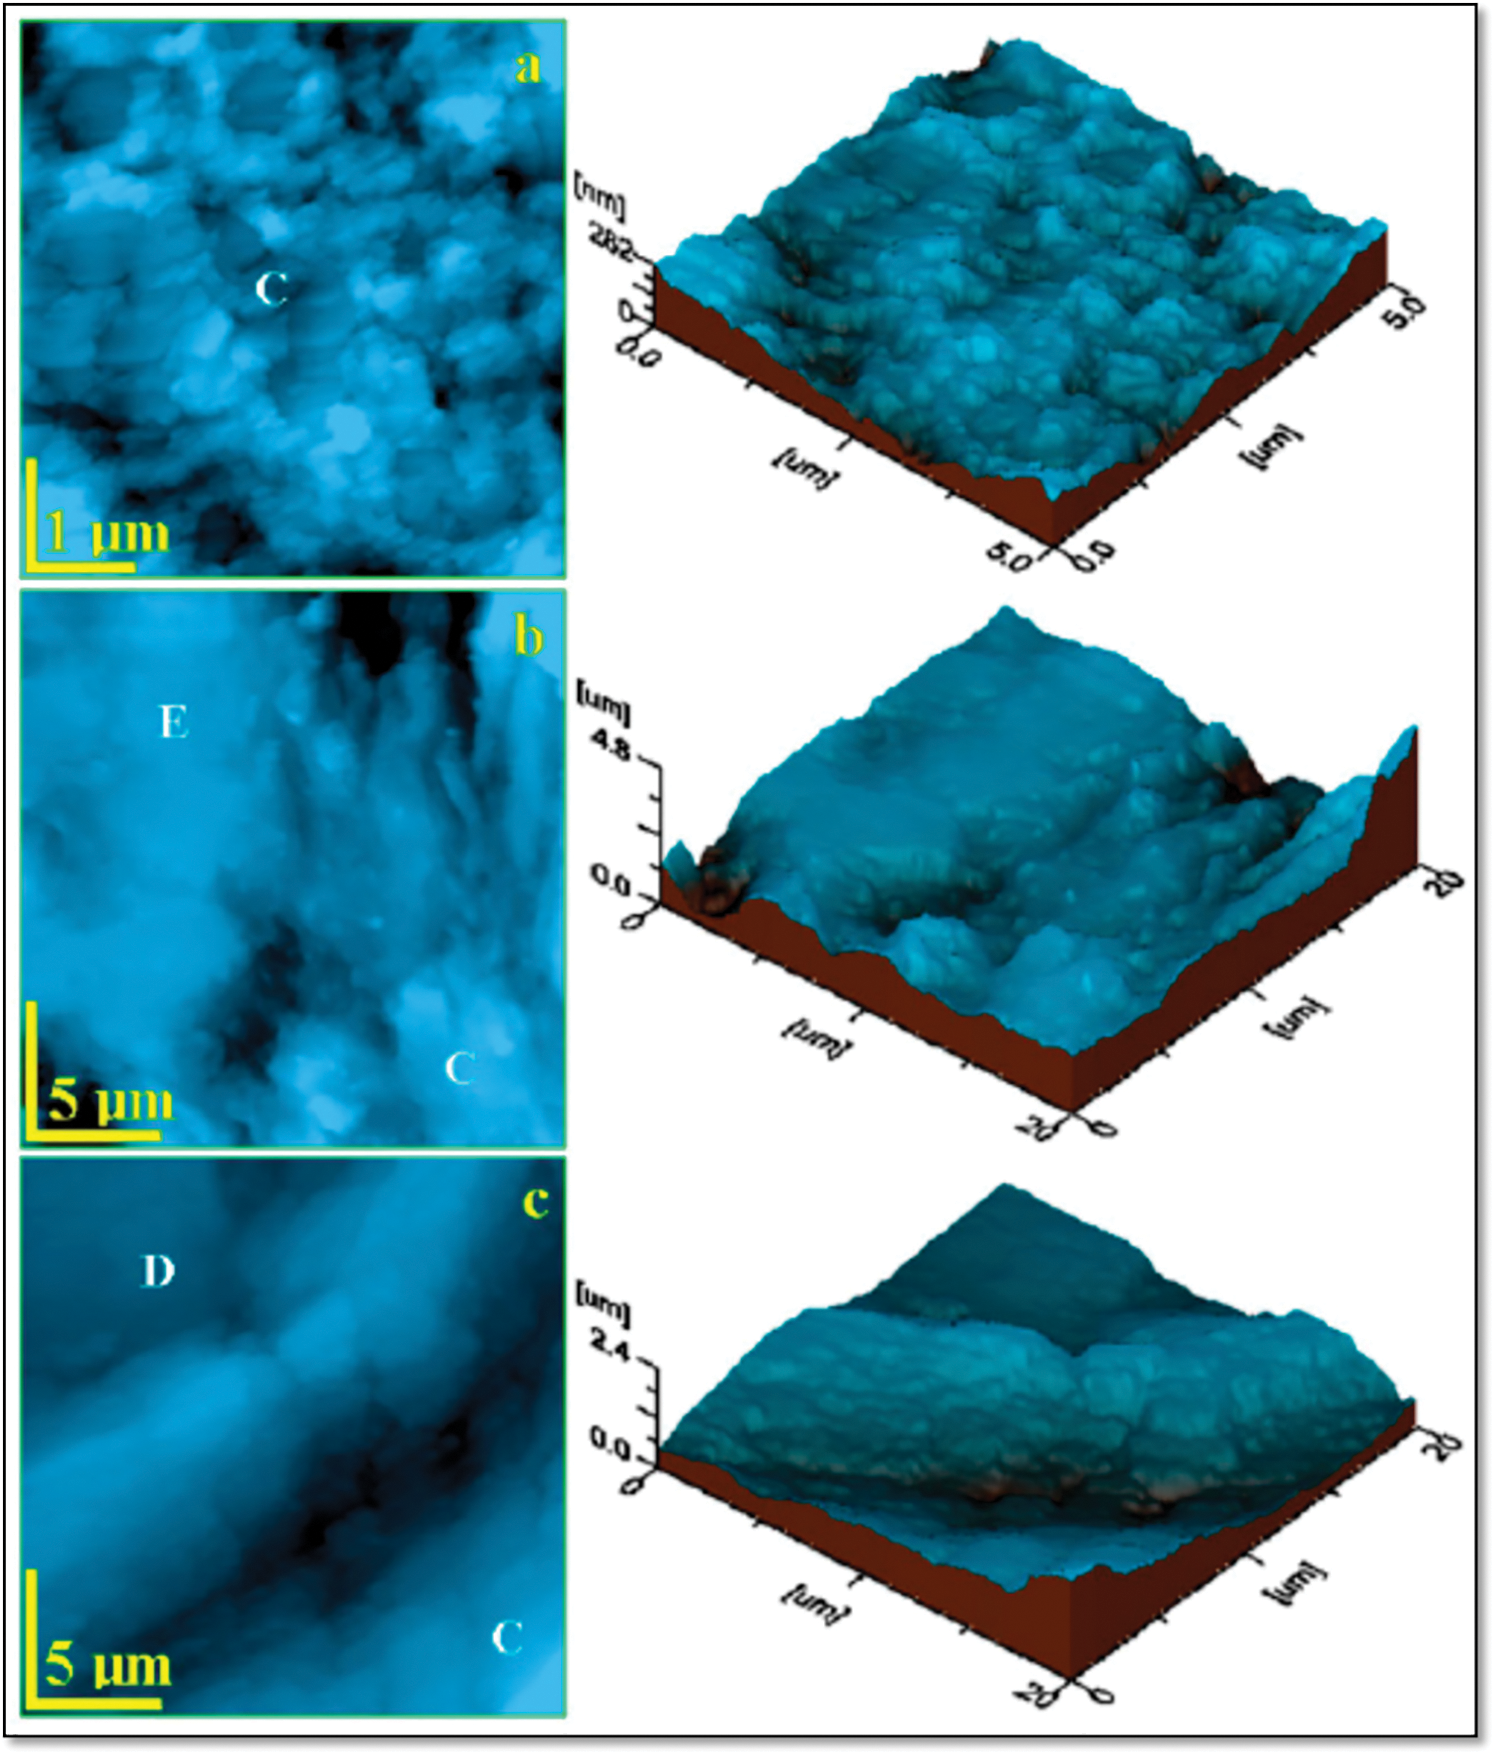
Figure 22: AFM image results in 2D and 3D [63]
3D-CT Technique: The computed tomography (CT) metrology employing X-rays is one of the newly created concepts in recent years. CT metrology is a technique for simultaneously measuring interior and exterior geometries in a wide range of items. As a result, the CT can be utilized as a basic inspection tool and as a measuring principle that provides precise geometrical data. Industry quality engineering is currently being revolutionized by CT [64–66]. Internal and external 3D modeling of the measured part is also possible with the Metrotom CT equipment and Calypso software [67]. Fig. 23 depicts the essential components of CT technology.
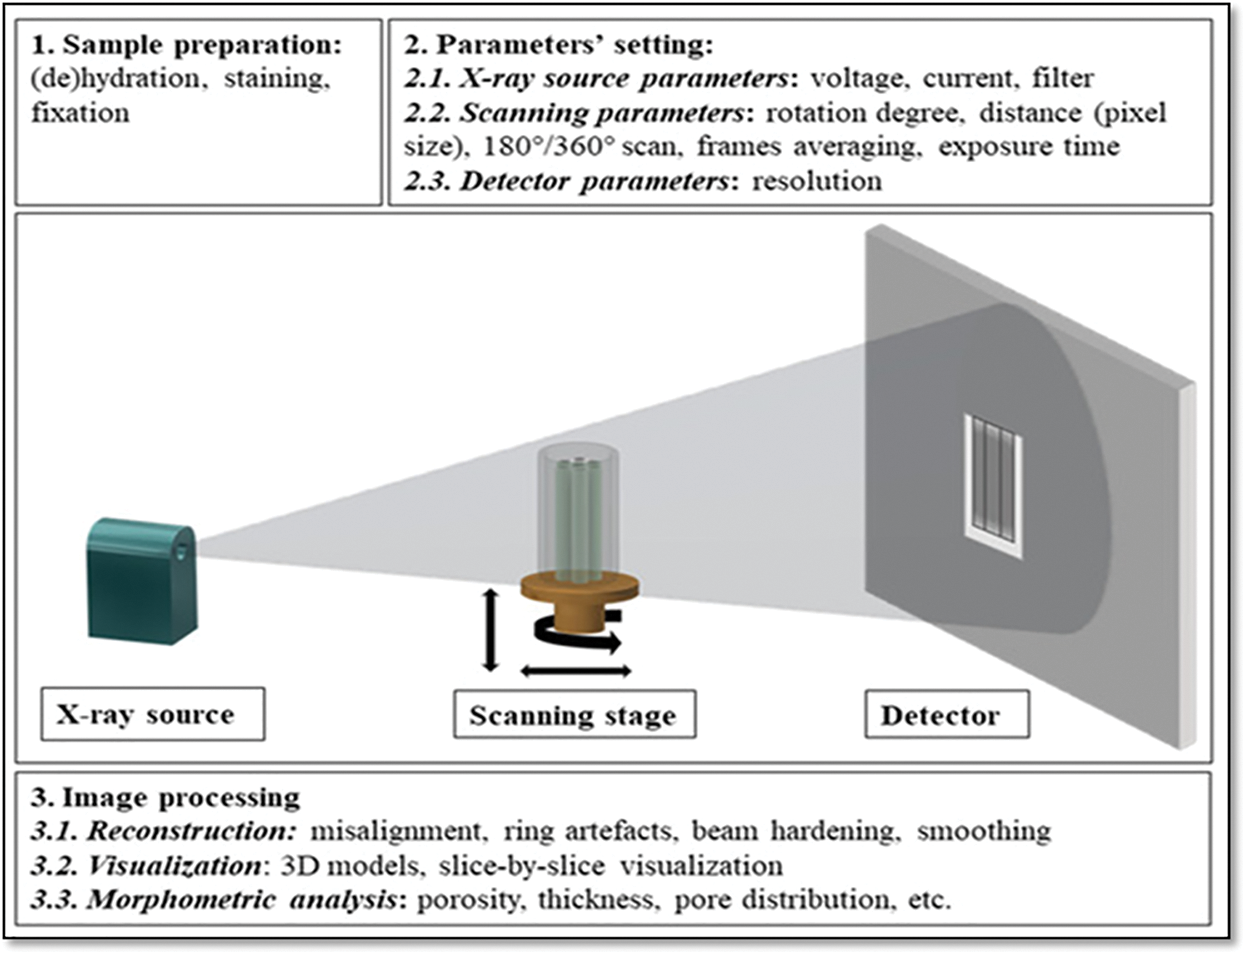
Figure 23: Principal operation of CT technique [67]
The measured part’s internal and external 3D modeling is possible with the Metrotom CT equipment and Calypso software. Fig. 24 depicts the essential components of the CT method. Fig. 18 shows the CT machine, which comprises an X-ray source, a translational moveable rotating table where the item to be scanned is placed on an X-ray detector, and a processing unit (made of six processors working together) to analyze and display the measurement data. There are now two types of CT systems [68–70].
• Ultrasonic Technique: With a non-formal incidence angle, a spherically focused ultrasonic sensor is positioned above the surface. The sensor emits an ultrasonic pulse to the surface and detects the signal’s amplitude. This information is transferred to a computer, which analyses and calculates roughness parameters. Once calibrated with data from a stylus profilometer, the system may generate the real roughness value [71]. Fig. 25 depicts a roughness measurement setup.
• Acoustic Technique: This approach is based on the idea that rubbing two surfaces together produces noise, the characteristics of which are determined by the nature of the two rubbing surfaces. A transducer is affixed to the plate in this technique to detect the acoustic signals generated by moving the human finger/contactor across the test surface. The voltage amplitude ratio of the high frequency to low-frequency components is related to surface roughness, and the received signals are separated into two frequency bands [72]. A typic acoustic technique for surface roughness measurement are shown in Figs. 26 and 27.
• Pneumatic Gauges: Fig. 28 shows how pressurized air is forced out of a nozzle that moves across the surface to be evaluated. The height of the surface’s micro imperfections determines the gap between the nozzle tip and the test surface. The air discharge, which is monitored by a rotameter, is affected by the size of the gap. The roughness variation can be measured with a suitable calibration [73].
• Light Cross-Section Method: A thin film of light is struck at a 45° angle on the surface to be inspected, and a band of reflected light reproduces the profile of the surface flaws. This profile is magnified and observed with a microscope placed at a 45° angle [74]. A double microscope works on the following principle, as shown in Fig. 29.
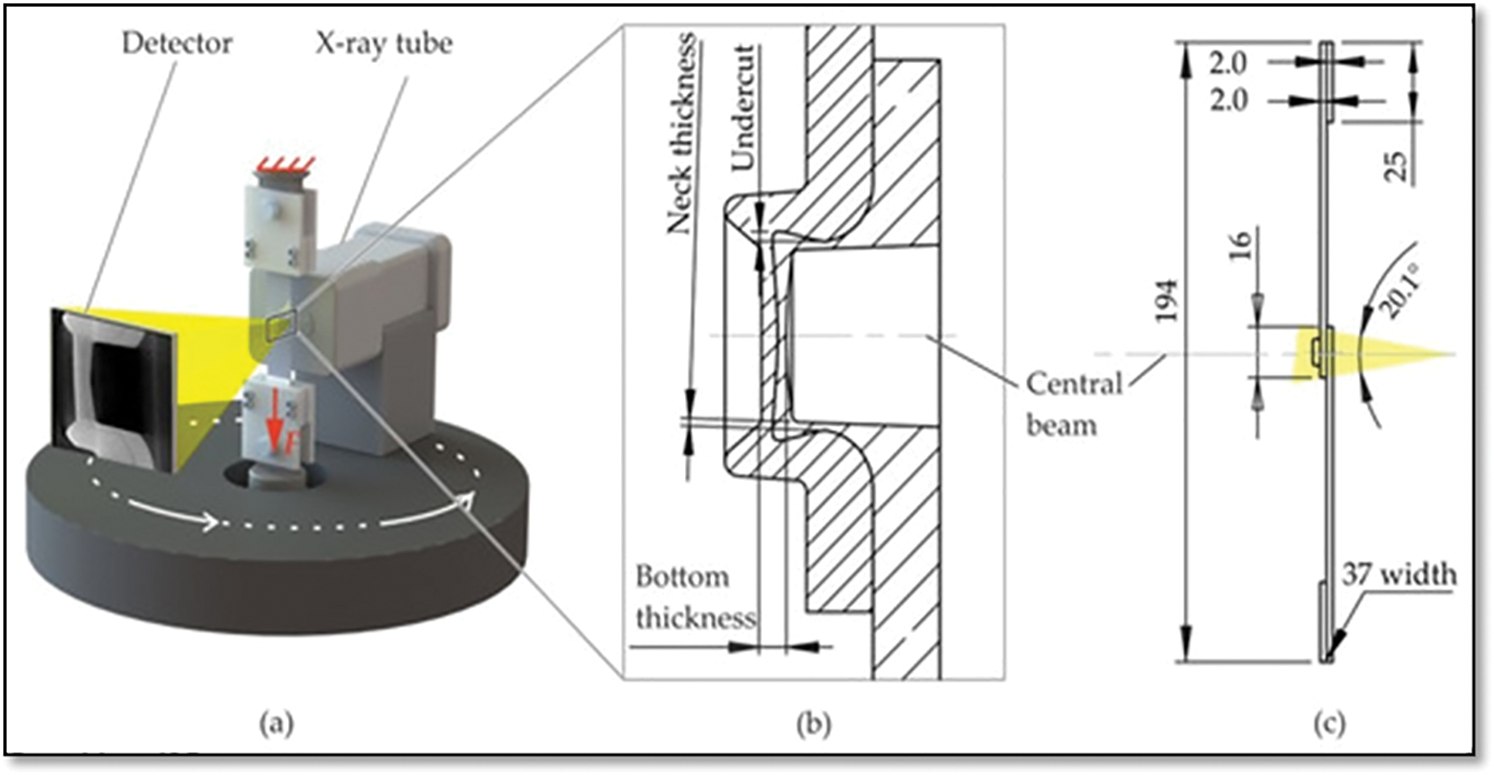
Figure 24: Schematic test set-up in the in situ computed tomography (CT) (a), the cross-section of the lap shear specimen in the initial position with the characteristic dimensions (b), and the overall specimen dimensions (in mm) (c) [70]
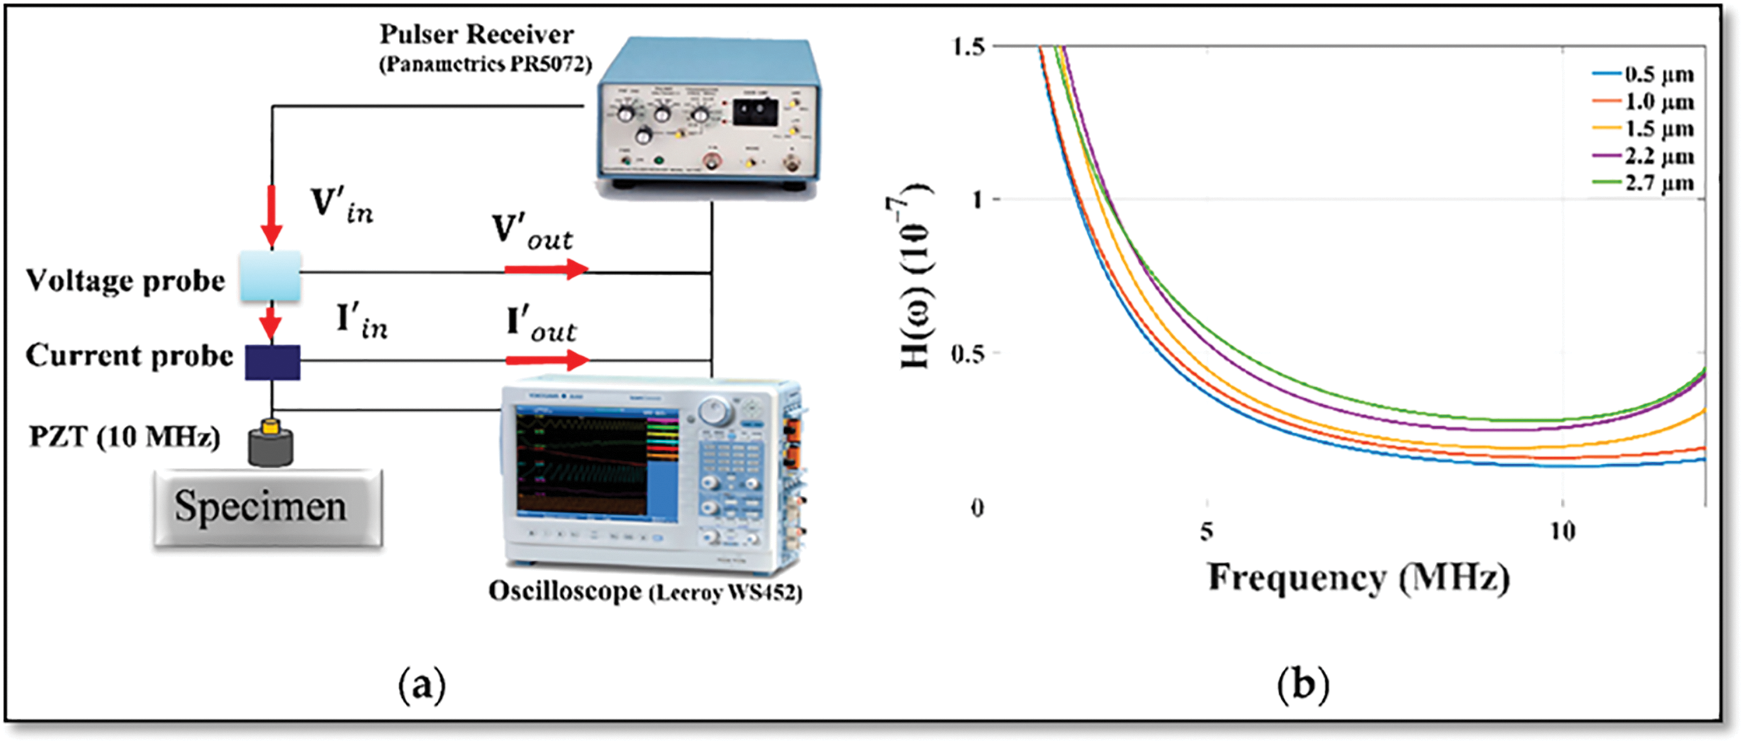
Figure 25: An ultrasonic system for roughness measurement (a) Experimental setup and (b) Calibration curve [71]
Figure 26: An acoustic technique for roughness measurement [72]
Figure 27: A typical application of acoustic technique for roughness measurement [72]
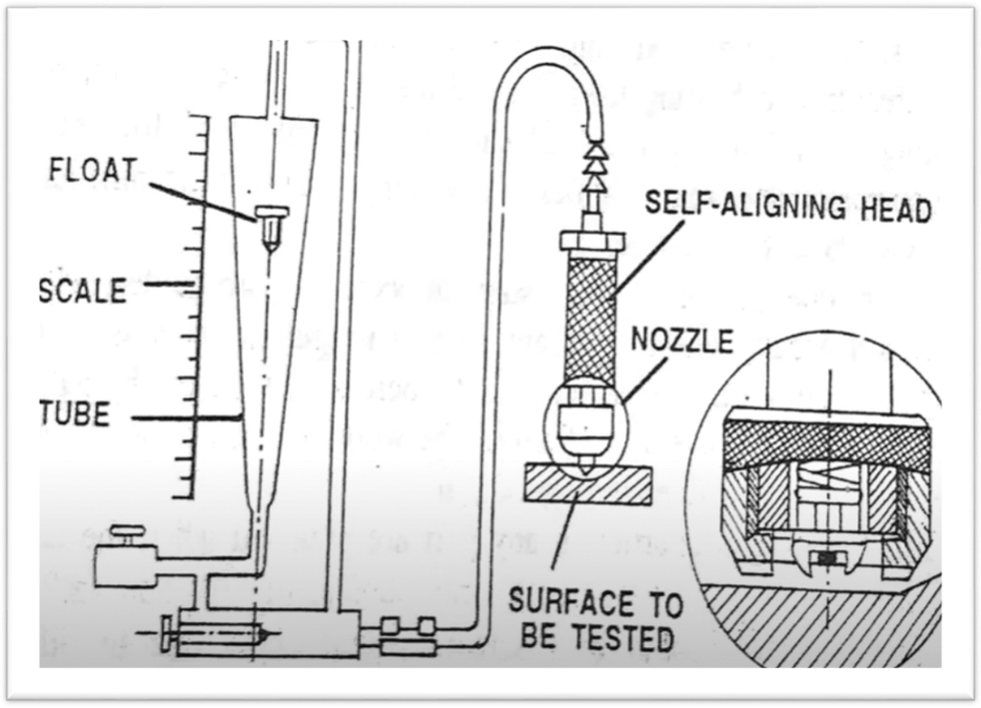
Figure 28: A pneumatic gauge [73]
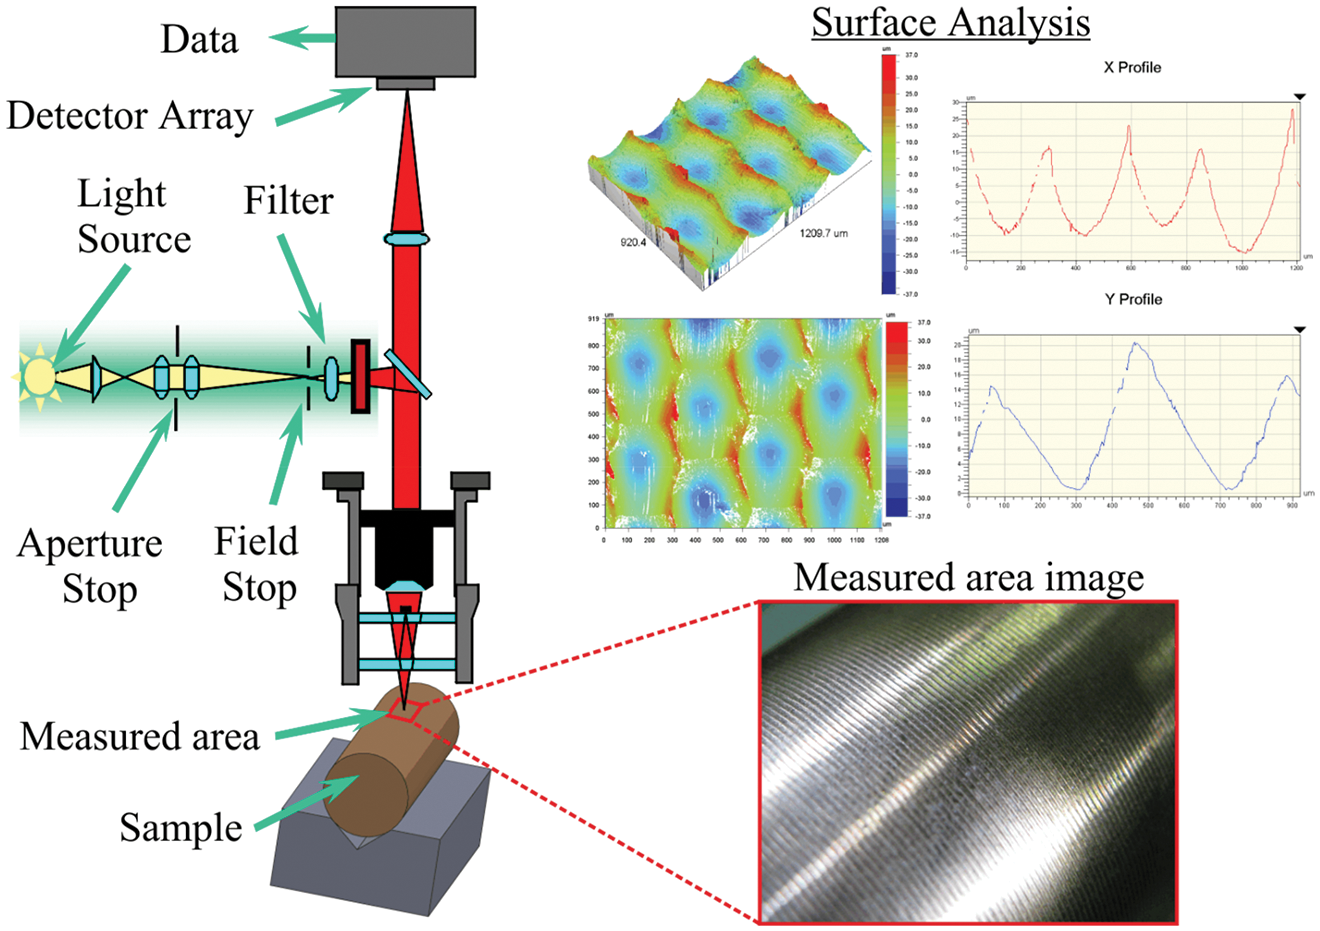
Figure 29: Light cross-section method for surface roughness measurement [74]
1.6 Comparison of Techniques of Surface Measurement
The conventional method to evaluate the surface properties is the contact-based method, which involves using a mechanical stylus tool. The stylus is a sharp tip of a diamond having a very small radius through which it touches traces the surface. Although this method has advantages like the mechanical method is easy to use and creates reliable measurements of the surface, but in the meanwhile the tip can also scratch the surface, causing damage to it [75]. According to a study, contact-based methods usually involve the use of atomic microscopes and stylus profilers in which the stress is applied to the surface, causing damage to the surface [76]. Also, the mechanical methods might involve the incidence of human error [77]. So, to overcome these issues, the non-contact-based method is used. The non-contact-based method, usually called machine vision, presents a better solution for real-time examining and online monitoring of the surface quality [78]. The machine vision-based methods also have advantages of high precision of measurement, low cost, great flexibility, and ability to obtain huge information [79]. Therefore, the benefits of this method include minimization of errors due to environmental conditions and reducing human interference. On the other hand, the non-contact-based methods also have limitations, such as they are less reproducible and less trustworthy [80]. According to a study, the main issue with the machine vision method is that the surface characteristics could only be measured for the stationary specimens [81].
1.6.1 Pros and Cons of Techniques
• Stylus based profilometer
○Advantages: easy to use, surface independence, and stylus tip radius very small up to 20 nm [82].
○Disadvantages: low speed of measurement, low resolution [83].
CMM coordinate technique
○ Advantages: high precision and accuracy, robustness, accurate measurement, and less labor required [84].
○ Disadvantages: very costly, less portable, problems with software [84].
Vertical scanning interferometry
○ Advantages: do not damage to sample, non-contact process, high resolution, and high accuracy.
○ Disadvantages: exposure to the vibration and effects of the transparent thin film [85].
White-light interference microscopy
○ Advantages: fast speed, measure noncontinuous surfaces.
○ Disadvantages: vertical scanning requires frequently consuming so much time, a complicated method [86].
Confocal white light microscopy
○ Advantages: can optically ‘section’ almost transparent materials, shallow field depth, out of focus glare eliminated [87].
○ Disadvantages: background noise, and scattering noise [87].
Atomic force microscopy
○ Advantages: generates 3D images [88].
○ Disadvantages: measurement uncertainty, complex geometry, and challenges of tip characterizations [89].
Digital holographic technique
○ Advantages: high accuracy and high efficacy [90].
○ Disadvantages: slower process, used for small objects, and does not change resolution [91].
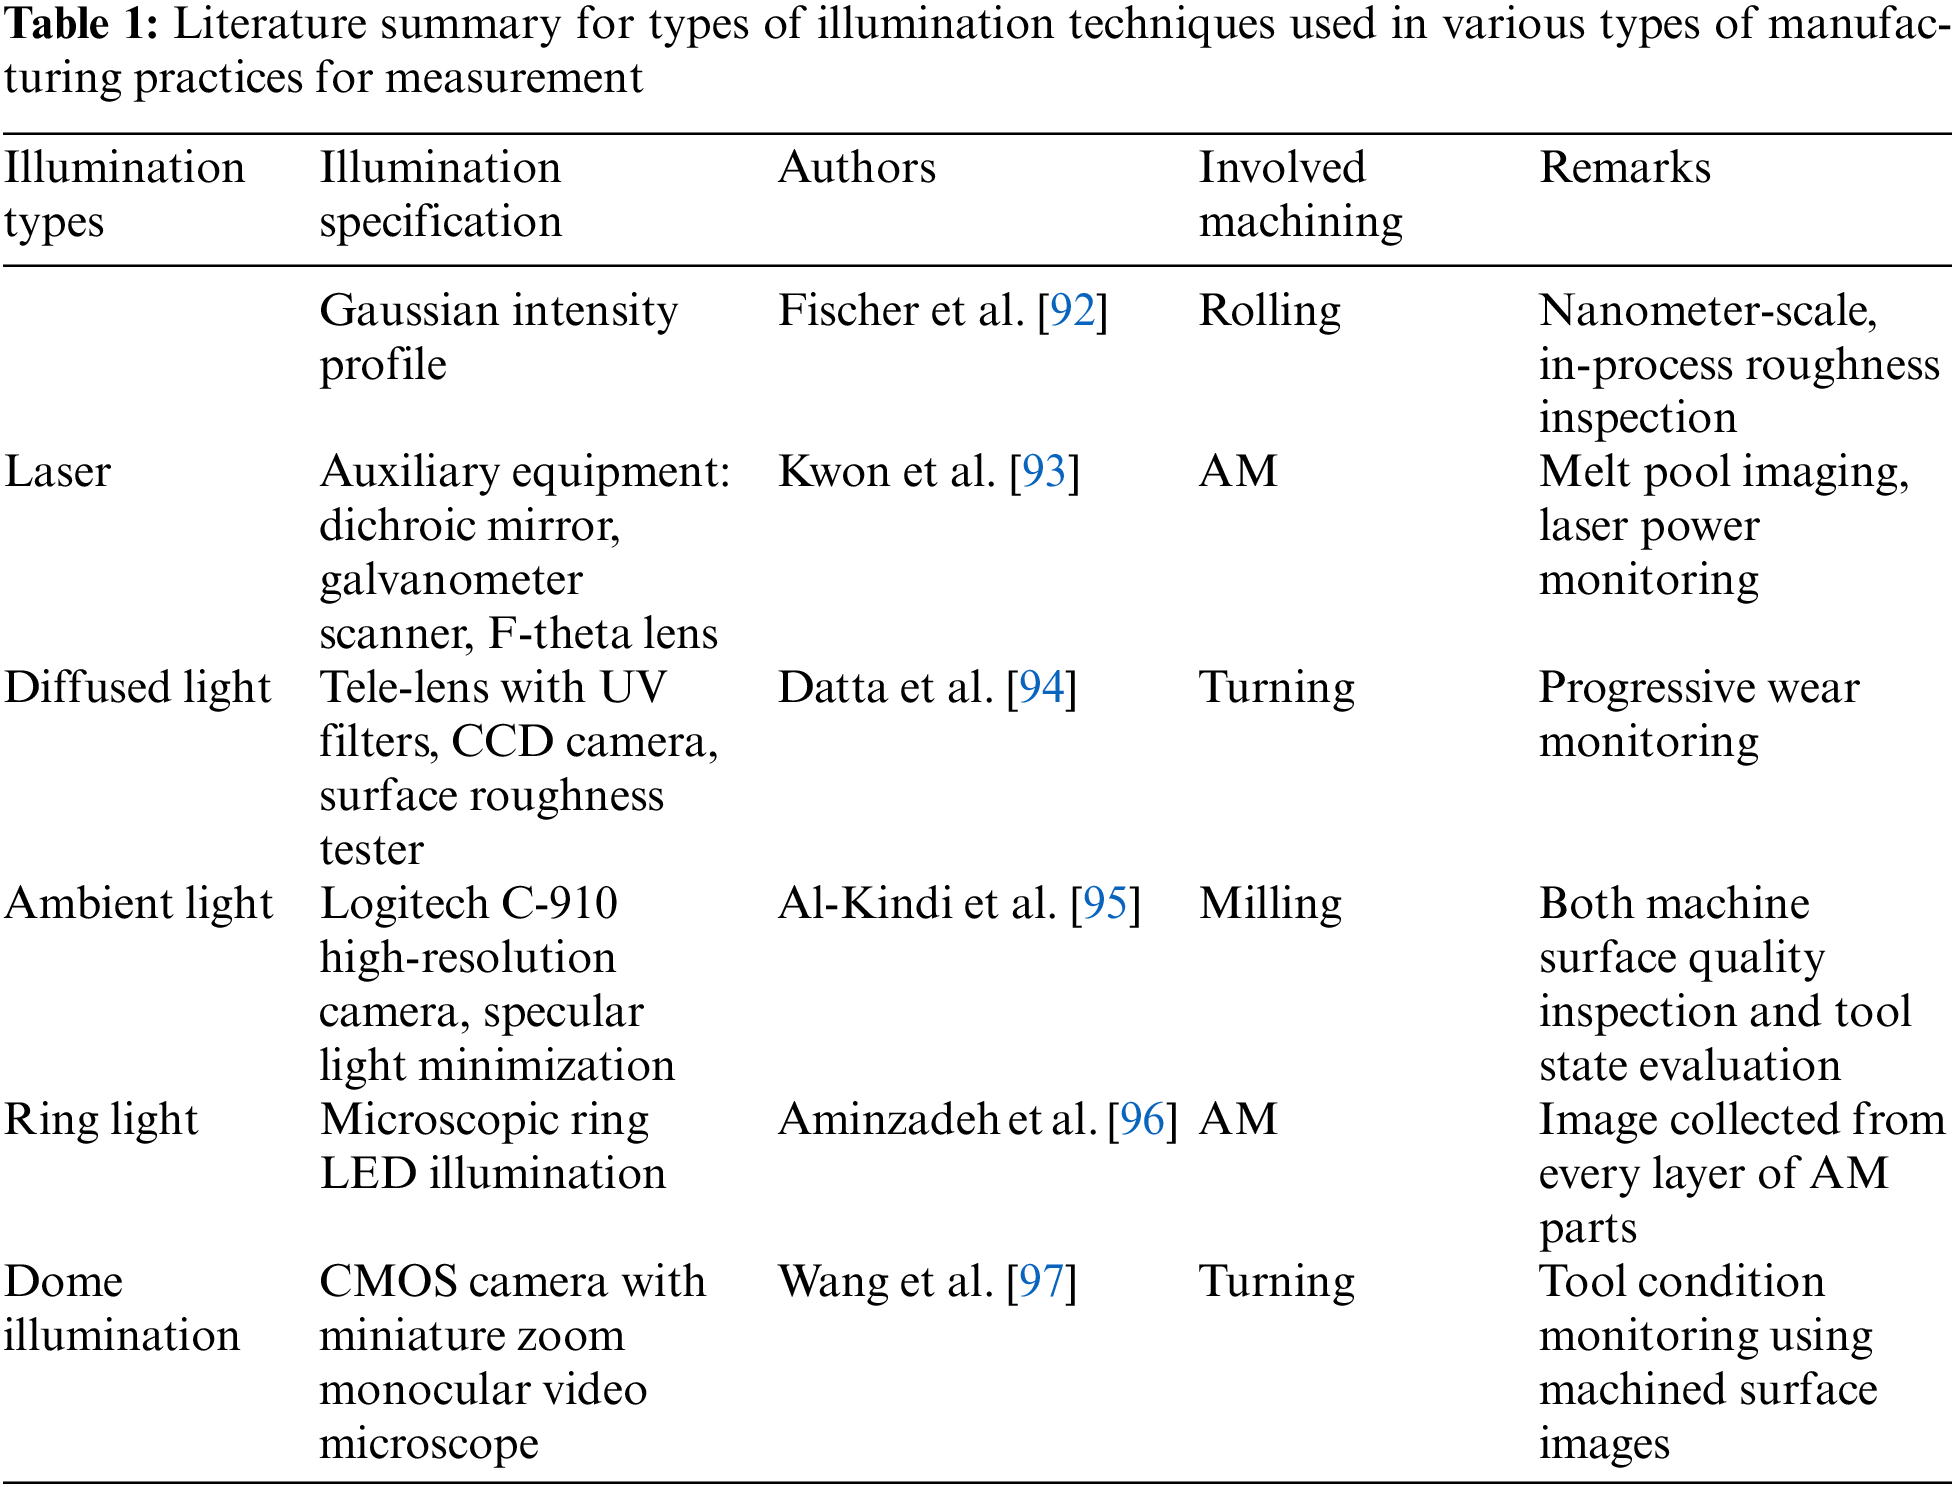
Table 1 presents some more publications from the past that have researched types of illumination techniques used in various types of manufacturing practices for the purpose of measurement.
The systematic literature review was performed to explore the applications and research on machine vision using surface characterizations of any conventional and non-conventional produced parts using text mining analysis to recognize, evaluate, and analyze the published literature between 2017 and 2022. Primarily; a literature review is used to explore, choose, and evaluate related publications. It is described as a systematic, precise, and consistent process to recognize, evaluate, and combine the existing literature of documented work given by the researchers or authors. The review process usually involves multiple steps [98], which involve identifying research questions, recognizing the type of research, and selecting and assessing the assembled publications. During the paper selection and evaluation method, specific inclusion and exclusion standards are needed to assess every probable main study. After conducting the systematic review, the clustering and co-occurrence evaluation for chosen studies are employed to produce a comprehensive summary of the primary research areas and topics.
The research question to perform the systematic review are given as follows:
RQ1: What are machine vision methods of measuring surface characteristics, and how do they work?
RQ2: How are the machine vision methods different from the conventional evaluation methods?
RQ3: What are the advantages and limitations of the traditional and non-traditional methods for evaluating surface characteristics?
2.2 Search Strategy (Identification of Search Terms)
The strategy of search created for this paper contained: recognizing the keywords, searching resources, method of searching, and article selection criteria for the collection of existing and competent available articles related to the topic. The query for search used the Boolean operators who were: “machine vision techniques” or “computer vision techniques” or “machine learning” and “conventional evaluation methods” or “traditional methods of measurement” and “surface quality” or “surface characteristics” or “surface texture”. The terms used for the search were improved by lowering the synonyms while searching the databases because of the limitations of search terms.
2.3 Resources Used for Searching
To search for the appropriate and related articles, we performed a search by incorporating the keywords or the search terms in five databases, involving “ACM digital library, IEEE Xplore digital library, Science Direct, Springer Link, and Scopus.” These are the highly illustrative databases for scientific research and provide results directly relevant to our research topic and are comprised of a huge quantity of literature, such as review papers, journal papers, conference reports, books, etc.
2.3.1 Inclusion and Exclusion Criteria
Depending upon the study directions, the exclusion and inclusion criteria are defined below. The criteria for exclusion were used for the title, abstract, and list of keywords of the publication, but the inclusion criteria were applied for the full-text articles. Those articles were excluded which
• Articles focusing on other than machine vision or computer vision technologies for evaluation of surface characteristics.
• Articles not provided in the English language.
Those articles were included in our study were:
• Articles reporting machine vision or computer vision technologies, written in the English language.
• Articles about modifying the existing technique or introducing new techniques for the evaluation of surface characteristics.
2.3.2 Selection and Assessment of Articles
The process of searching started with searching the publications from the databases described above using specific Boolean operators, and 10,145 articles were included. Then the articles were filtered depending on the exclusion criteria, and then only 3224 articles remained. Depending upon the inclusion criteria, only 200 articles were included for the review. Then, manual research was carried out to search for the additional sources according to the method described by [99], applying exclusion and inclusion criteria. Additional 20 articles were selected. The quality assessment of the articles was performed according to the criteria:
• Has the article focused on machine vision and clearly define the research aim?
• Has the newly introduced methodology improved the evaluation of the surface?
• Has the proposed methodology been clearly described?
• Has the design of the study been clearly presented?
This method employs a microcomputer-based vision system to analyze the pattern of scattered light from the surface to derive a roughness parameter. It is based on the analysis of the pattern of white light scattered from a surface. The microscopic waveform of the surface profile modulates the incident light beams into scattered beams whose intensities and scattering angles can be described as functions of the amplitudes and wavelengths of the surface topography. The information from the surface can be obtained by studying its light-scattering pattern. The generalized schematic arrangement of the setup used for machine vision studies [100], is shown in Fig. 30 [101]. Similarly, Fig. 31 shows the typical machine vision setup for the inspection of the manufactured parts [101].
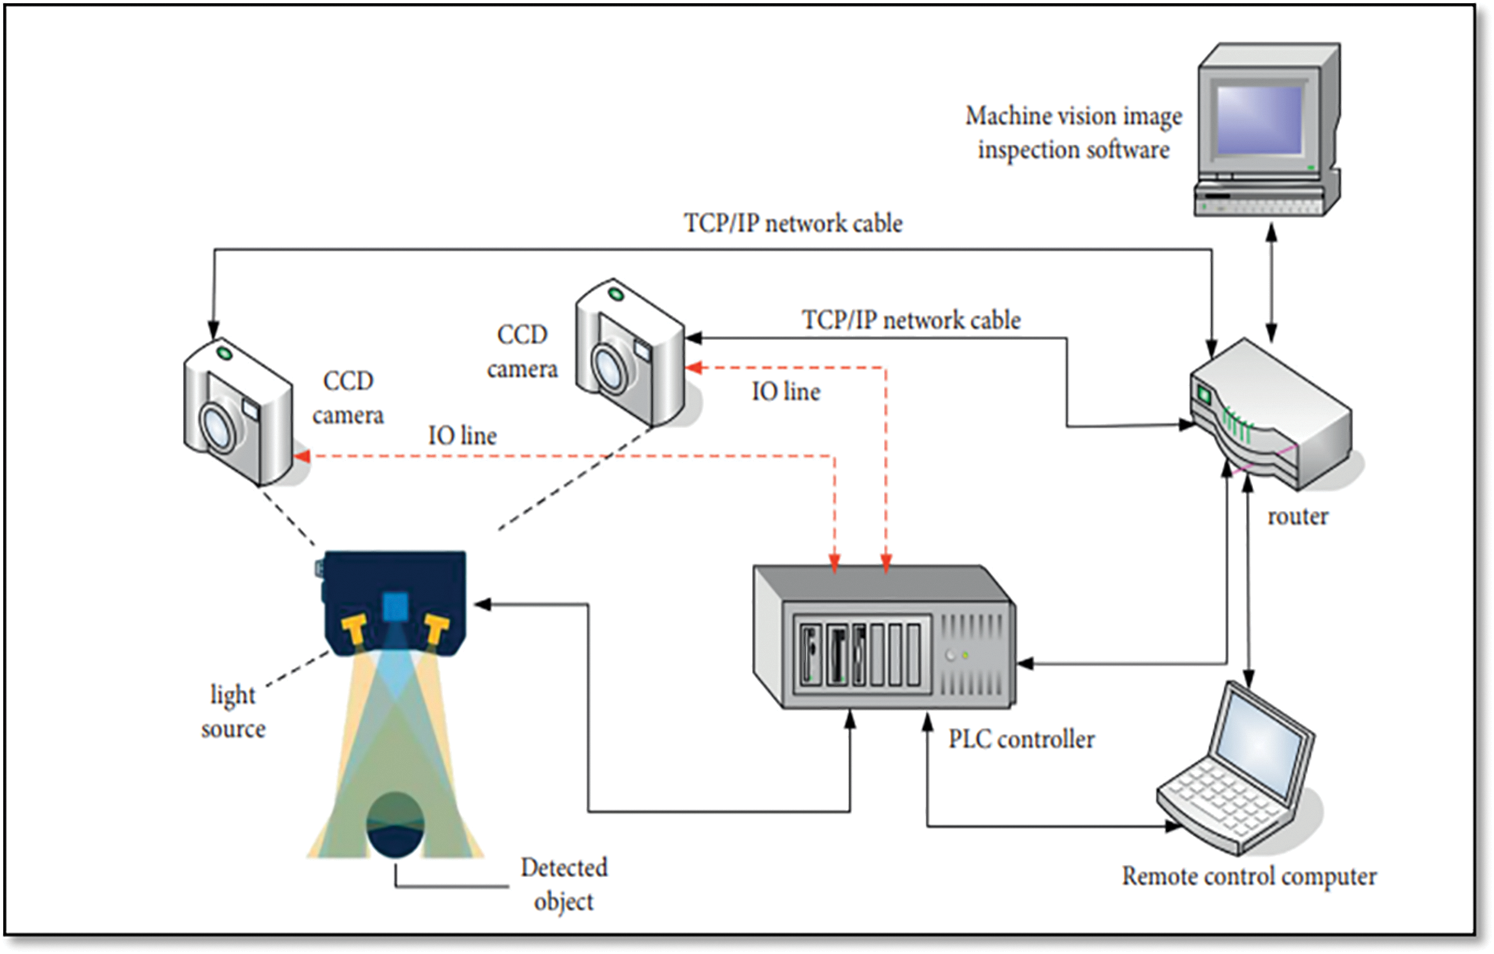
Figure 30: Schematic of the machine vision setup [101]
Figure 31: A typical machine vision setup for the inspection of the manufactured parts [101]
A proposed methodology or architecture [102] for a computer vision system for measuring surface roughness is shown in Fig. 32.
Figure 32: Architecture diagram for the proposed computer vision system for measuring surface roughness [102]
Machine vision is defined as the capture of image data, followed by computer processing and interpretation for a specific application. Machine vision is a fast-evolving technology with a focus on industrial inspection. Image acquisition and digitization, image processing and analysis, and interpretation are the three roles of a machine vision system [103]. Fig. 33 depicts this diagrammatically.
Figure 33: Basic functions of a machine vision system [103]
3.1.1 Image Acquisition and Digitization
A camera and a digitizing system are used to capture and digitize images. The camera is focused on the object of interest, and an image is created by dividing the viewing area into a matrix of discrete picture elements (pixels), each with a value proportional to the light intensity of that part of the scene. An Analog-Digital Converter converts each pixel’s intensity value into its analog-digital converter (ADC). In a binary vision, each pixel’s light intensity is converted to one of two colors: white or black, depending on whether the light intensity reaches a certain threshold. To create the grey scale image, a sophisticated vision system must be able to detect distinct shades of grey in the image. Surface and area characteristics can be determined reasonably with an eight-bit (28) memory of 256 intensity grey levels. Each frame of digitized pixel values is saved in a computer memory device known as a frame buffer. A frame is read at a rate of 30 frames per second. In most machine vision applications, two types of cameras are used. Vidicon cameras obtain relative pixels by focusing the picture onto a photoconductive surface and scanning the surface with an electron beam. Varying voltage levels correspond to different light intensities impacting different locations on the photoconductive surface. The electron beam reads the voltage level of each pixel throughout the scanning operation. The image is focused onto a 2-D array of very small, carefully spaced photosensitive components in solid-state cameras. The photosensitive elements make up the pixel matrix. Each element generates an electrical charge in response to the intensity of light impacting it. The charge is stored in a storage device made up of an array of storage elements that correspond to the photosensitive elements one-to-one. These charge values are read sequentially in a machine vision’s data processing and analysis function. Because of the time-lapse scanning, Vidicon cameras suffer from distortion in the image of a fast-moving object. Solid-state cameras are physically smaller, more robust, create a more reliable image, and thus have a wide range of applications in industries. Pixel arrays available in a variety of sizes, including 256 × 256, 512 × 512, 1035 × 1320. The more pixel elements and resolution it has, the better it can detect fine details and features in a picture. Another crucial consideration is lighting. For seeing the image using a machine vision system, the item should be well-illuminated and consistent across time. For machine vision applications, special lighting systems should be implemented, and the type of lighting changes depending on the type of inspection [104]. Fig. 34 depicts some of the most prevalent lighting approaches.
Figure 34: Common lighting techniques used in machine vision systems [104]
3.1.2 Image Processing and Analysis
Decisions must be made based on the data captured and stored by the frame grabber. As a result, the image captured may not have all of the necessary information to make a judgment. For analyzing picture data in a machine vision system, a number of techniques have been developed:
• Segmentation: Its purpose is to delineate and segregate zones of interest in an image. Thresholding and edge detection are two prominent segmentation techniques. Thresholding is the process of converting each pixel intensity level into a binary value that represents white or black. If a pixel’s value exceeds a threshold, it is assigned a binary bit value of white, or 1. If the value is less than the threshold, it is assigned a bit value of black, or 0. Thresholding aids in the recognition of objects in photographs. The contrast in light intensity that exists between adjacent pixels at the object’s borders is determined using the edge-detection approach, which aids in detecting the object’s boundary.
• Feature Extraction: It is designed to extract features such as the object’s area, length, width, perimeter, diameter, and aspect ratio. The features of an object can be assessed by counting the number of pixels with a specific value.
The image must be interpreted using the extracted features for any application. The job of interpretation is to recognize the object or characteristic. Template matching and feature weighting are two typical interpretation strategies. The image is compared pixel by pixel with one or more features of the model image, which is saved as a template in template matching. Each feature (e.g., area, length, perimeter) is given a weight based on its importance, and the total score is compared to an ideal object stored in memory.
3.2 Application of Machine Vision
Machine vision is used extensively in manufacturing and other fields. Here are some of them:
• Inspection: Machine vision is used most frequently in the inspection. In mass production, machine vision systems are used for automated inspection of I dimensional measurement, (ii) dimensional gauging, (iii) verification of the presence of components or features, (iv) detection of surface faults or defects, and (v) errors in printed labels. The majority of inspections are conducted online or while the process is in progress [105–109].
• Sorting: The part is identified using vision systems, which can then be utilized for sorting, counting, or inventory management [110].
• Visual Guidance and Control: The vision system’s images can be used to guide the robot to the goal position in robot control. Vision cameras can also help in collision avoidance and tracking of distant parts. Vision technology can be used to track the seam welding movement [111,112].
• Agriculture: In agriculture, machine vision is becoming more prevalent. It helps in fruit identification and sorting. Machine vision techniques are utilized to classify olives, weeds, seeds, and other plants [108,113].
• Surface Characterisation: Machine vision is used to analyze the structure of the surface. It’s used in textiles to spot texture flaws, change the texture pattern, and spot color variations. It is used in metal surface studies to identify the manufacturing process, classify texture, estimate surface roughness, detect surface wear, and so on [4,114–117].
3.2.1 Roughness Evaluation Using Machine Vision
Many attempts to employ integrated reflectivity of the surface as a surface evaluation method have been made in the past. This is how gloss meters work. The machine vision system can directly evaluate the surface picture, taking into account the surface’s reflectivity. Discrimination may be shown in the image intensity distribution of the different surface images with fixed illumination and camera arrangement. The surface picture is used to determine several intensity-based metrics that are then compared to the Ra value measured in m by the stylus instrument. A consistent and acceptable approach to surface roughness evaluation is always being sought in this sector. This paper is an attempt to investigate some of the variations in picture surface evaluation.
• In Defect Analysis
A defect in any of these materials can appear during or after administration. Defect testing is constantly required to provide data for the development of surface efficacy, competency, and resilience. Consider artificial hip joints, which require a long life. Prospect hip substitute measures can be calculated by calculating the surface substance for wear, scrapes, and the profile of the artificial joint after it has been removed for substitution.
• In-Process Control
To produce a final product, industrialists must manage processes. Surface estimation controls the process when precision in surface engineering is required; based on inspection results, the approach appears to be adequate.
• Surface Roughness Measurement Concerns
Shape: Surface topology is the calculus of the attention region in its entirety. The adjournment confers to the request “Area of Interest.”
Roughness: Roughness of surface Ra calculates the roughness of the linear profile or the area by estimating the surface finish. The roughness of the surface area (Sa) is calculated as a line covering the full region in 3D optical profilometry.
Surface Asperity: Asperities are characteristic features. For the purposes of inaccuracy engineering, these asperities usually refer to submicron height and form irregularities. For asperity measurements, AFM and TEM & SEM have greater resolution and are commonly utilized.
3.3 Significance of Machine Vision Techniques for Measuring the Surface Characteristics
Optical methods, including computer vision techniques, have a more significant potential for ‘surface characteristics measurement’ and a broader range of options. ‘Optical microscopy’, ‘light scattering techniques’, and ‘vision systems’ are some of the most common optical technologies for measuring surface quality. Two forms of light, “coherent and incoherent light,” are used in computer vision-based methods. Surface characteristics can also be measured using light that scatters or reflects from the surface [118].
Many experiments on the surface characterization of various machined surfaces have used scattering. Tian et al. [114] proposed a method by utilizing the ‘plane-polarized light’ and a ‘scatter light detector’ to characterize the surface. The two-light scattering-based techniques for measuring surface roughness are ‘angular-resolved scatters (ARS)’, and ‘total integrated scatter (TIS)’. Scattering is used in many surfaces’ characterization studies regarding machined surfaces. This article has characterized the surface using ‘plane-polarized light, and a scatter light detector.’ ARS and TIS are known to be the two-light scattering-based procedures for measuring surface roughness (TIS) [118].
The mutual interference of dispersed light generated by the uneven surface’s spatial variations produces a speckle picture of a coherent light beam (laser) projected over the rough surface. Numerous laser speckle methods for measuring surface roughness have recently appeared. The speckle images obtained can measure roughness because surface roughness causes ‘light scattering’; the speckle images obtained can measure roughness. To describe surface roughness, a researcher used a speckle contrast approach. The speckle pattern is created by lighting the rough surface with a He-Ne laser. Surface roughness measurements and characterization are judged based on the distinct parameters of the speckle pattern. ‘Surface roughness characterization’ is evaluated based on the contrast parameters of the speckle pattern. The contrast parameters are calculated by varying the intensities of the speckle image. Various studies have been conducted regarding surface roughness using statistical properties and the ‘distribution of speckle image intensity.’ The standard deviations of the intensity fluctuations in the speckle patterns were found to have a linear relationship with surface roughness values.
A step-by-step machine vision-based condition monitoring and surface roughness measurement process reviewed in this paper has been illustrated in Fig. 35.
Figure 35: Machine vision-based surface roughness processes illustration
Machine vision-based procedures are appropriate for ‘online assessment of machined components’ surfaces and are considered safe for both the surfaces that are to be measured and the measurement system. In various studies, it has been observed that the obtained surface images using a vision system and quantified surface roughness using regression analysis. The surface image’s average grey value (Ga) was computed and calibrated using the stylus’s measured average surface roughness (Ra). Various authors have used the ‘Gray Level Co-occurrence Matrix (GLCM) procedure’ [112] to characterize the surface roughness using machine vision. The spatial correlation among the pixels on the surface image is taken into account by this statistical technique. Surface roughness is collected by investigating the relationships between average surface roughness (Ra) and the GLCM features of the surface image [119,120]. The procedure of the computer vision system for measuring the surface roughness [121], is shown in Fig. 36.
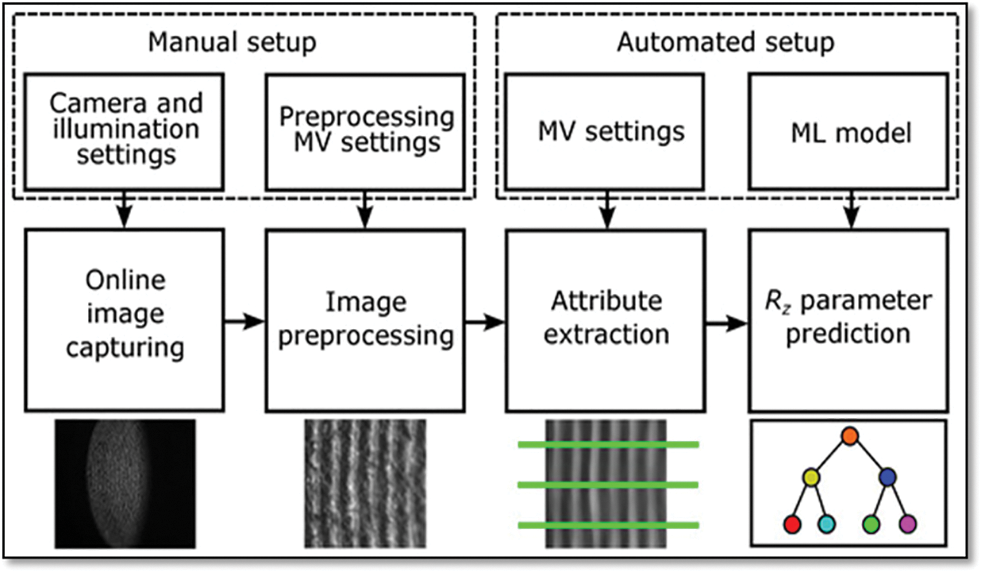
Figure 36: Computer vision system procedure [121]
3.3.4 Key Aspects of Machine Vision Techniques for Surface Characteristics Measurement
Nowadays, the manufacturing industry’s productivity needs high-quality NC, CNC, and automated machine shops widely used for higher productivity. Quality scrutiny of the product also requires higher productivity as a critical feature. Inspection methods are categorized into direct and indirect techniques. Besides machine vision, there exists a new and innovative technology that is used to analyze and calculate the products with the help of ‘CCD camera’ as well as the ‘image processing techniques’ such as ‘image acquisition’ first step in digital image processing, de-noising with filters and comparison between actual and accurate image, mapping in image, image processing technique. The main methods discussed in this section is surface characteristics measurement’. Vision-based measurements have great attention in industries due to their high capacity and faster measurement using hardware, camera, and sensors. In the inception of dimensional accuracy, geometry features surface finish are significant features in the machining area; newer measurement techniques optical measurement plays a vital role [81,121]. A new trend has emerged in industries due to its intelligence and simplification. Vision-based manufacturing is considered significant to reduce the time taken by the production and acquire better quality; this approach to the measurement of surface quality is then known as an ‘automated inspection system [122].’ The typical measurement of angle for the diffused model is shown in Fig. 37.
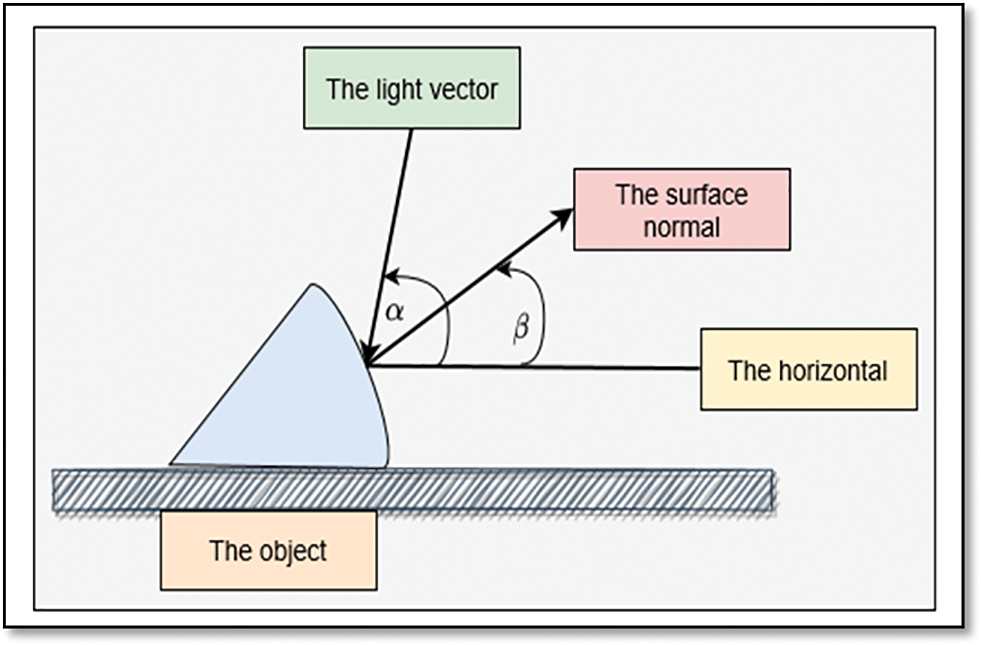
Figure 37: Angles derived for the diffuse model
It has also been observed that surface characteristics, i.e., surface roughness, dimensional accuracy and flatness, and other surface flaws, are characterized and measured using the machine vision system [102]. The working principles of the machine vision system are shown in Fig. 38.
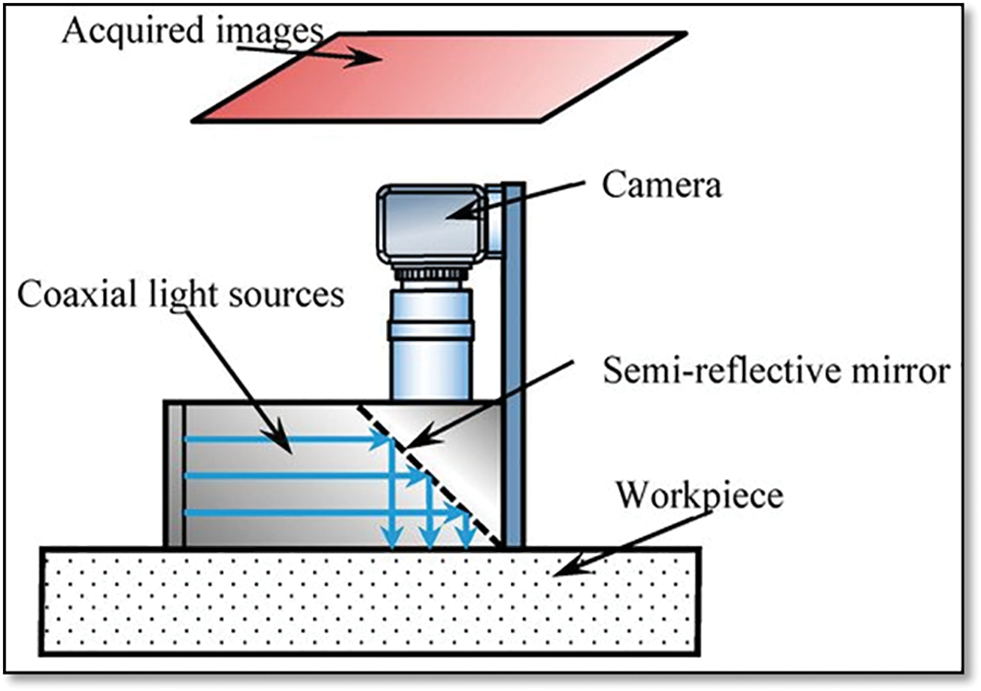
Figure 38: Working principles of the machine vision system [102]
The technology of machine vision is used to examine the quality of parts using image-based data. Surface texture can be characterized using this approach as its data is represented in the two-dimensional intensity of the image produced, which depends on the amount of light incident on the surface and the amount of light reflected. Hence, machine vision could provide a contactless and automated method of measuring surface roughness, which replaces conventional methods [2]. In conventional systems, the surface quality is measured by the use of mechanical stylus profilers and determined by offline operation [123]. For examining the quality of the machined surfaces, e.g., the roughness of the surface, the technical descriptions are hard to be assured using a simple one-step process. Also, the regular initial judgment of the quality of the machined part is based on empirical rules by manually observing the machining time and noise of the processing method [124]. So, in comparison with the traditional methods for quality examination, the machine Vision is capable of evaluating the roughness quality of the surface with a higher speed and is able to detect the irregularities without scraping the surface [125]. Also, machine vision methods are more suitable and have better inspection reliability than the traditional manual processes [126]. The machine vision methods have several advantages, such as non-contact analysis, high accuracy, high speed, low cost, and flexibility, which are essential for industrial use to detect different parts’ surface defects and surface qualities [127]. The assessment of the roughness of the surface has been carried out by many researchers using the laser speckle pattern method which examines the surface characteristics at micrometer and nanometre levels. Townsend et al. [128] performed a systematic review on different techniques used to evaluate the surface roughness of metal additively manufactured, which highlighted the importance of non-contact-based techniques to examine the surface characteristics. Fischer et al. [92] described the evaluation of roughness quality of the surface of metal sheet rolling by using the method of speckle pattern and instruments of optically scattered light. A study performed by Patel et al. [127] compared the stylus method of contact type and machine vision of non-contact type methods of examination of surface quality and a correlation was developed between both the methods. A difference of 15% was observed between both the methods revealing the high advantage of the non-contact type machine-based method. Similarly, Balamurugan et al., evaluated the surface roughness using the laser speckle method and compared it with the traditional method of stylus profiler. The results were better in the case of the machine vision method as compared to the traditional one [129]. However, Patzelt et al. [130] examined the uncertainty of the laser-based method. Some of the researchers revealed this technique to be costly and sometimes the speckle patterns are not practically created especially for its application in environments with limited installations of the equipment [131,132].
The other technique of roughness evaluation includes the use of atomic force microscopy, which images the surfaces depending on their hardness, smoothness, or roughness [133]. Zhao et al. [134] applied the AFM technique to examine the coal’s surface roughness and pore structures with the help of Gwyddion software. The results showed the reliability of the surface roughness and pore sizes when compared with the other methods. AFM is more versatile because of imaging the 3D topography compared to other instruments; however, it also has some limitations. While imaging a smooth or a rough surface, it gets affected by the tip geometry, which could be destructive to the sample surface [135].
Similarly, the evaluation of the surface structure was performed on aluminum thin films by Mwema et al. [136] and compared with the SEM technique, which proved to be more advantageous and significant than the SEM. Liu et al. [88] performed the characterization of the surface roughness of coal using AFM and compared it with the low-pressure nitrogen gas adsorption method. The results showed that using the AFM method made the results more accurate than the other. The disruption factors from the machining procedure are non-trivial in highly accurate measurements of the surface roughness.
Regarding the onsite roughness evaluations at the micro or nano level, the precision is hindered by the constraints of the principle of the instrumentation involving imaging with inadequate light, high-resolution techniques with microsecond level exposure, and in the case of microscopic imaging, the restriction of motion blur [92,132]. From the studies, it has been found that time series is most important in the metal cutting procedures, and the relationship between the indirect measurements and the roughness of the surface was found, such as using sound characteristics and the vibration characteristics [137–139]. The measurements carried out with the help of vibration characteristics attained the relative errors of about 15% [139], and the evaluations established on the time series analysis are also not advantageous as compared to the vision-based methods [140,141]. The surface roughness measured with the methods of CNN and GLCM has been achieved to the best precision of about 80%–90% compared to the conventional stylus-based method [142]. So, in short, the methods of vision-based techniques acquire more sensitive principles of measurements as compared to the other techniques.
The machine vision process is done using the following procedure [143]:
• Image capturing: The first step in machine vision is the image capturing from the CCD camera when the light emits and hits on the source. The image is transformed into a digital image with the help of imaging sensors.
• Image Acquisition: This processing step converts the optimal image to that of the digital image by following three different procedural steps, which are (1) image sensing, (2) image data representation, and (3) digitization.
• Image Processing: This step is used to arrange the pixel values, and it changes these pixel values into a more appropriate form so that further processing can be done. It entails five distinct operators (1) global pattern, (2) point operation, (3) neighborhood operation, (4) temporal operation (5) geometric operation.
• Feature Extraction: It identifies the ‘inherent features’ of the item/image or object.
• Pattern Classification: It is considered the last and final step in machine vision processes. It determines the unknown image or the item from the available set of items.
4 Types of Computer Vision for Measurement
4.1 Surface Characteristics Measurement
‘Surface texture’ is considered to be a significant aspect of machine design. If the surface finishing is done poorly, it will affect the functional performance of various machined components. The ‘direct con-tact components’ like scratch cards and profile meters are used for surface roughness measurement in various industries, especially manufacturing [144,145]. This ‘direct method’ also wears over the ‘high accuracy machined surface.’ Therefore, non-contact components like ‘machine vision system’ as well as ‘optical devices’ are utilized to calculate the surface roughness values. In such a scenario, the ‘machine vision technique’ plays a significant role as the ‘online monitoring system’ of the surface texture. In the same way, the main benefit of utilizing this approach is that it becomes possible to control and regulate the parameters while machining operations and the assistance of ‘intelligent system incorporation.’ Thus, awareness regarding the ‘machine vision system’ for measuring surface roughness is crucial and im-important [14]. The basic requirement to measure the surface finish using machine vision are as follows:
• Proper lighting and optics
• Image processing algorithm
• High computer configuration, i.e., speed, storage, and capacity, surface finish measurement procedure.
The surface finish measurement on machined components procedure is carried out as follows:
1. Image Capturing:
a. The light that is reflected from that of the machined surface is captured using a CCD camera. Surface nature and roughness are assessed using these images.
Filtering the Image:
• a. Image filtering is done via three steps as follows:
At first low-pass filter is applied over the original image to get the ‘low pass filtered image.’
• This image is then deducted from that of the original one to acquire the ‘surface roughness image’.
• The filtered ‘surface roughness image’ is then quantified through the ‘grey level average’. Usually, these processes are done according to the 2D standard ‘ISO 11562-1996’. To get better computing efficiency, ‘Fourier transform’ can be used for image filtering.
4.1.1 Steps of Surface Characteristics Measurement Using Machine Vision
The quantified and the binaries images have been analyzed in terms of ‘matrix form’ based on the light intensity. The following algorithm is followed:
• The intensity of the white area is denoted by 1.
• The intensity of the black area is denoted by 0.
‘Surface Roughness’ is based on the ‘variation in the intensity values’ starting from 1 to 0. The following algorithm is considered to measure the ‘surface profile.’
• It is started by scanning the first pixel of the first column in the image matrix.
• On obtaining 0, scanning is stopped, and the second row is considered.
• If the obtained value is not 0, then the second pixel is scanned in the row.
• The scanning process keeps on finding the 0 pixels in the first row.
• Scanning of the 0-value pixel is done in the second row.
• This process is repeated for each row.
5 Classification of Surface Characteristics Measurement Using Computer Vision Techniques
The classification of various computer vision techniques to measure surface characteristics of any part manufactured by various traditional manufacturing, i.e., CNC machining, casting, forging, additive manufacturing (AM), and non-traditional manufacturing processes. Electric discharge machining (EDM), Laser surface processing (LSP), etc., are given below.
5.1 Surface Characteristics Measurement Using Image Processing
Metal machining surfaces via various procedures, for instance, milling, planning, grinding, or EDM, generate the particular lay pattern. For example, a milled surface comprises a typical periodic and regular layer pattern [146]. Surface topography is composed of two main characteristics:
• The peak amplitude or surface valley.
• Wavelength among the valleys and peaks.
The measurements of the surface are usually articulated as surface profile denoted as y(x) in 2-D and are expected to be equal to the 3-D expressions. The ‘average surface roughness parameter (Ra)’ denotes the average surface profile deviation in regard to the mean line. Ra is usually utilized for the measurement of sur-face roughness characterization and measurement. For several years, the ‘stylus instrument’ has been significantly utilized to measure the surface roughness parameters and the high-reliability percentage. The vertical tip movement of the stylus is calculated for the predetermined horizontal length. The ‘high-frequency components of surface roughness’ are filtered with the help of the stylus tip and also the non-linear deformation within the surface. Furthermore, the tip of the stylus may disrupt or may get disrupted when making contact with the surface that needs to be measured. The requirement for a non-contact, high-speed, and highly reliable surface measurement system is considered to be on the rise. Even though several techniques are there for the measurement of the ‘surface roughness,’ that also includes ‘optical techniques. It has been observed that no techniques have yet been established that are robust and reliable enough for floor applications. The technique of ‘biometric recognition’ has proven to be not only robust but reliable and is found highly recommendable for surface characterization. It comes under the non-contact method utilizing the surface imaging to calculate the Euclidean distance and the hamming distance of reference images and for testing the surface image to make the comparison. The ‘surface roughness measurements’ of the ‘reference surface’ are done using the ‘stylus method,’ and corresponding images have been saved within the database. Testing surface image is characterized based on Hamming as well as Euclidean distance [146].
The steps involved in the measurement of surface roughness using the image processing are as follows.
To perform image acquisition, a ‘Basler PiA2400gm CCD camera’ is fitted using a Zoom 6000 lens whose optical magnification can be done up to 45.0X. Besides this, a lighting system and two halogen bulbs are also used. The specimen is held using the adjustable table and set the cameras to some specific angles. The CCD camera is adjusted in angle to the specimen using a protractor located in the center. The images can be taken by adjusting the camera to different angles. It is then ensured that uniform illumination is there in the setup by diffusing the light source. Surface images are taken for all the specimens at different positions.
To perform the procedure, specimens are collected so that they can be saved in the database as reference images. For every specimen, various images are taken, and among these, one is saved and stored in the database; however, the rest are used as test images. Immediately after capturing it, images are dealt with the lighting. Fluctuations and variations in image acquisition can affect image processing. Through normalization, the image matrix is transformed to have the equal and uniform intensity of each captured image pixel.
To perform the surface characterization, feature extraction is done, and then a comparison is made using the two metrics, i.e., ‘Euclidean and Hamming distance.’ Up till now, these metrics have performed significantly in ‘iris recognition’ in human identification. The Euclidean distance is considered to be the spatial distance between the vectors, suppose p and q. It also measures the ‘dissimilarity’ among the two vectors, p, and q. If the Euclidean value is higher, then higher would be the value of dissimilarity. ‘The circular shaft-based matching’ removes the possibility of a ‘simple shift’ within the image, which could affect the Euclidean distance [147]. The steps of measuring surface roughness using image processing are shown in Fig. 39.
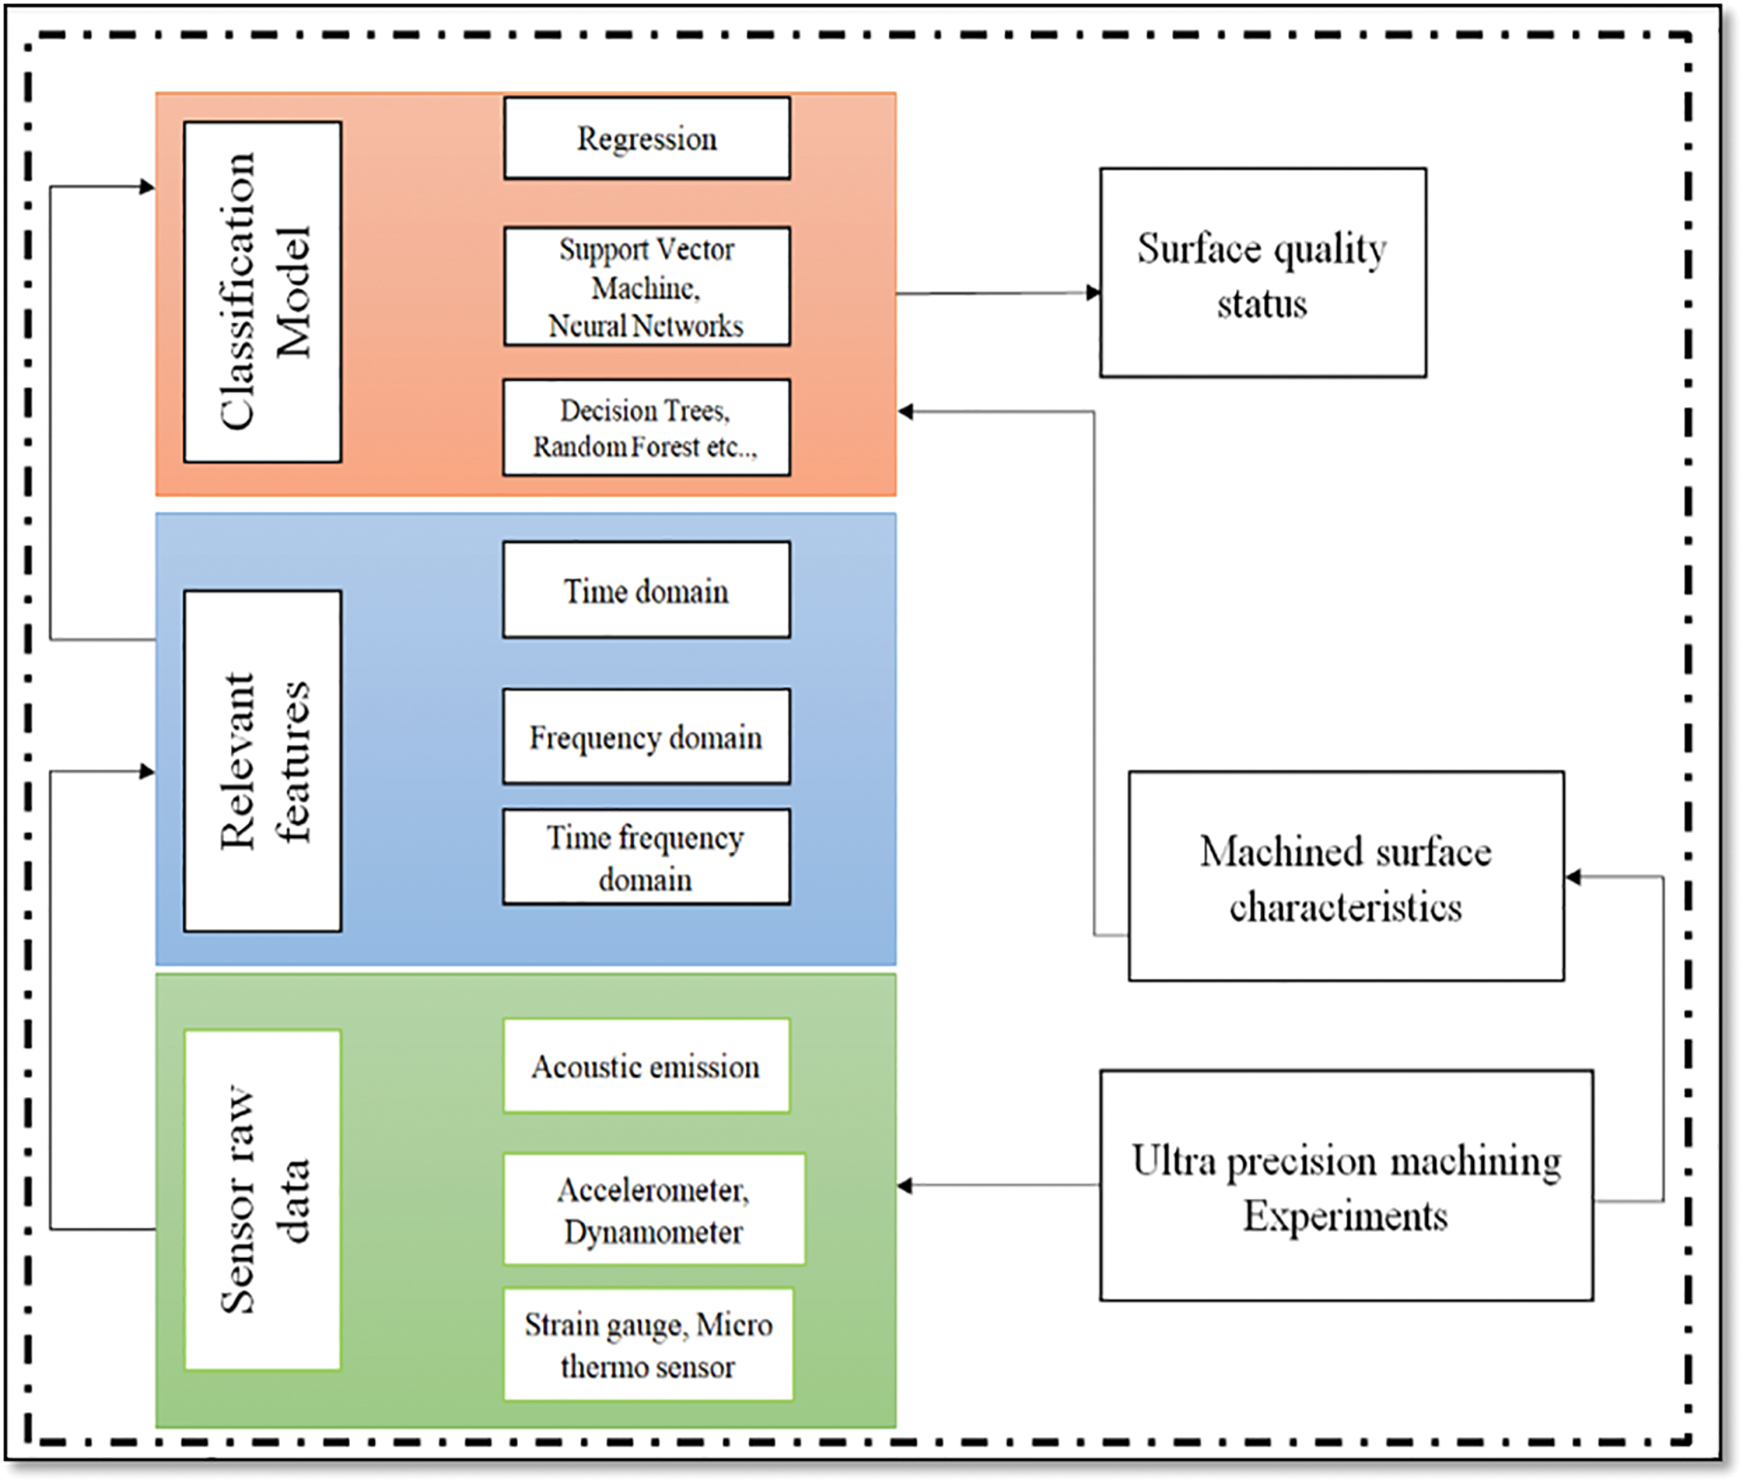
Figure 39: Steps involved in surface roughness using image processing [147]
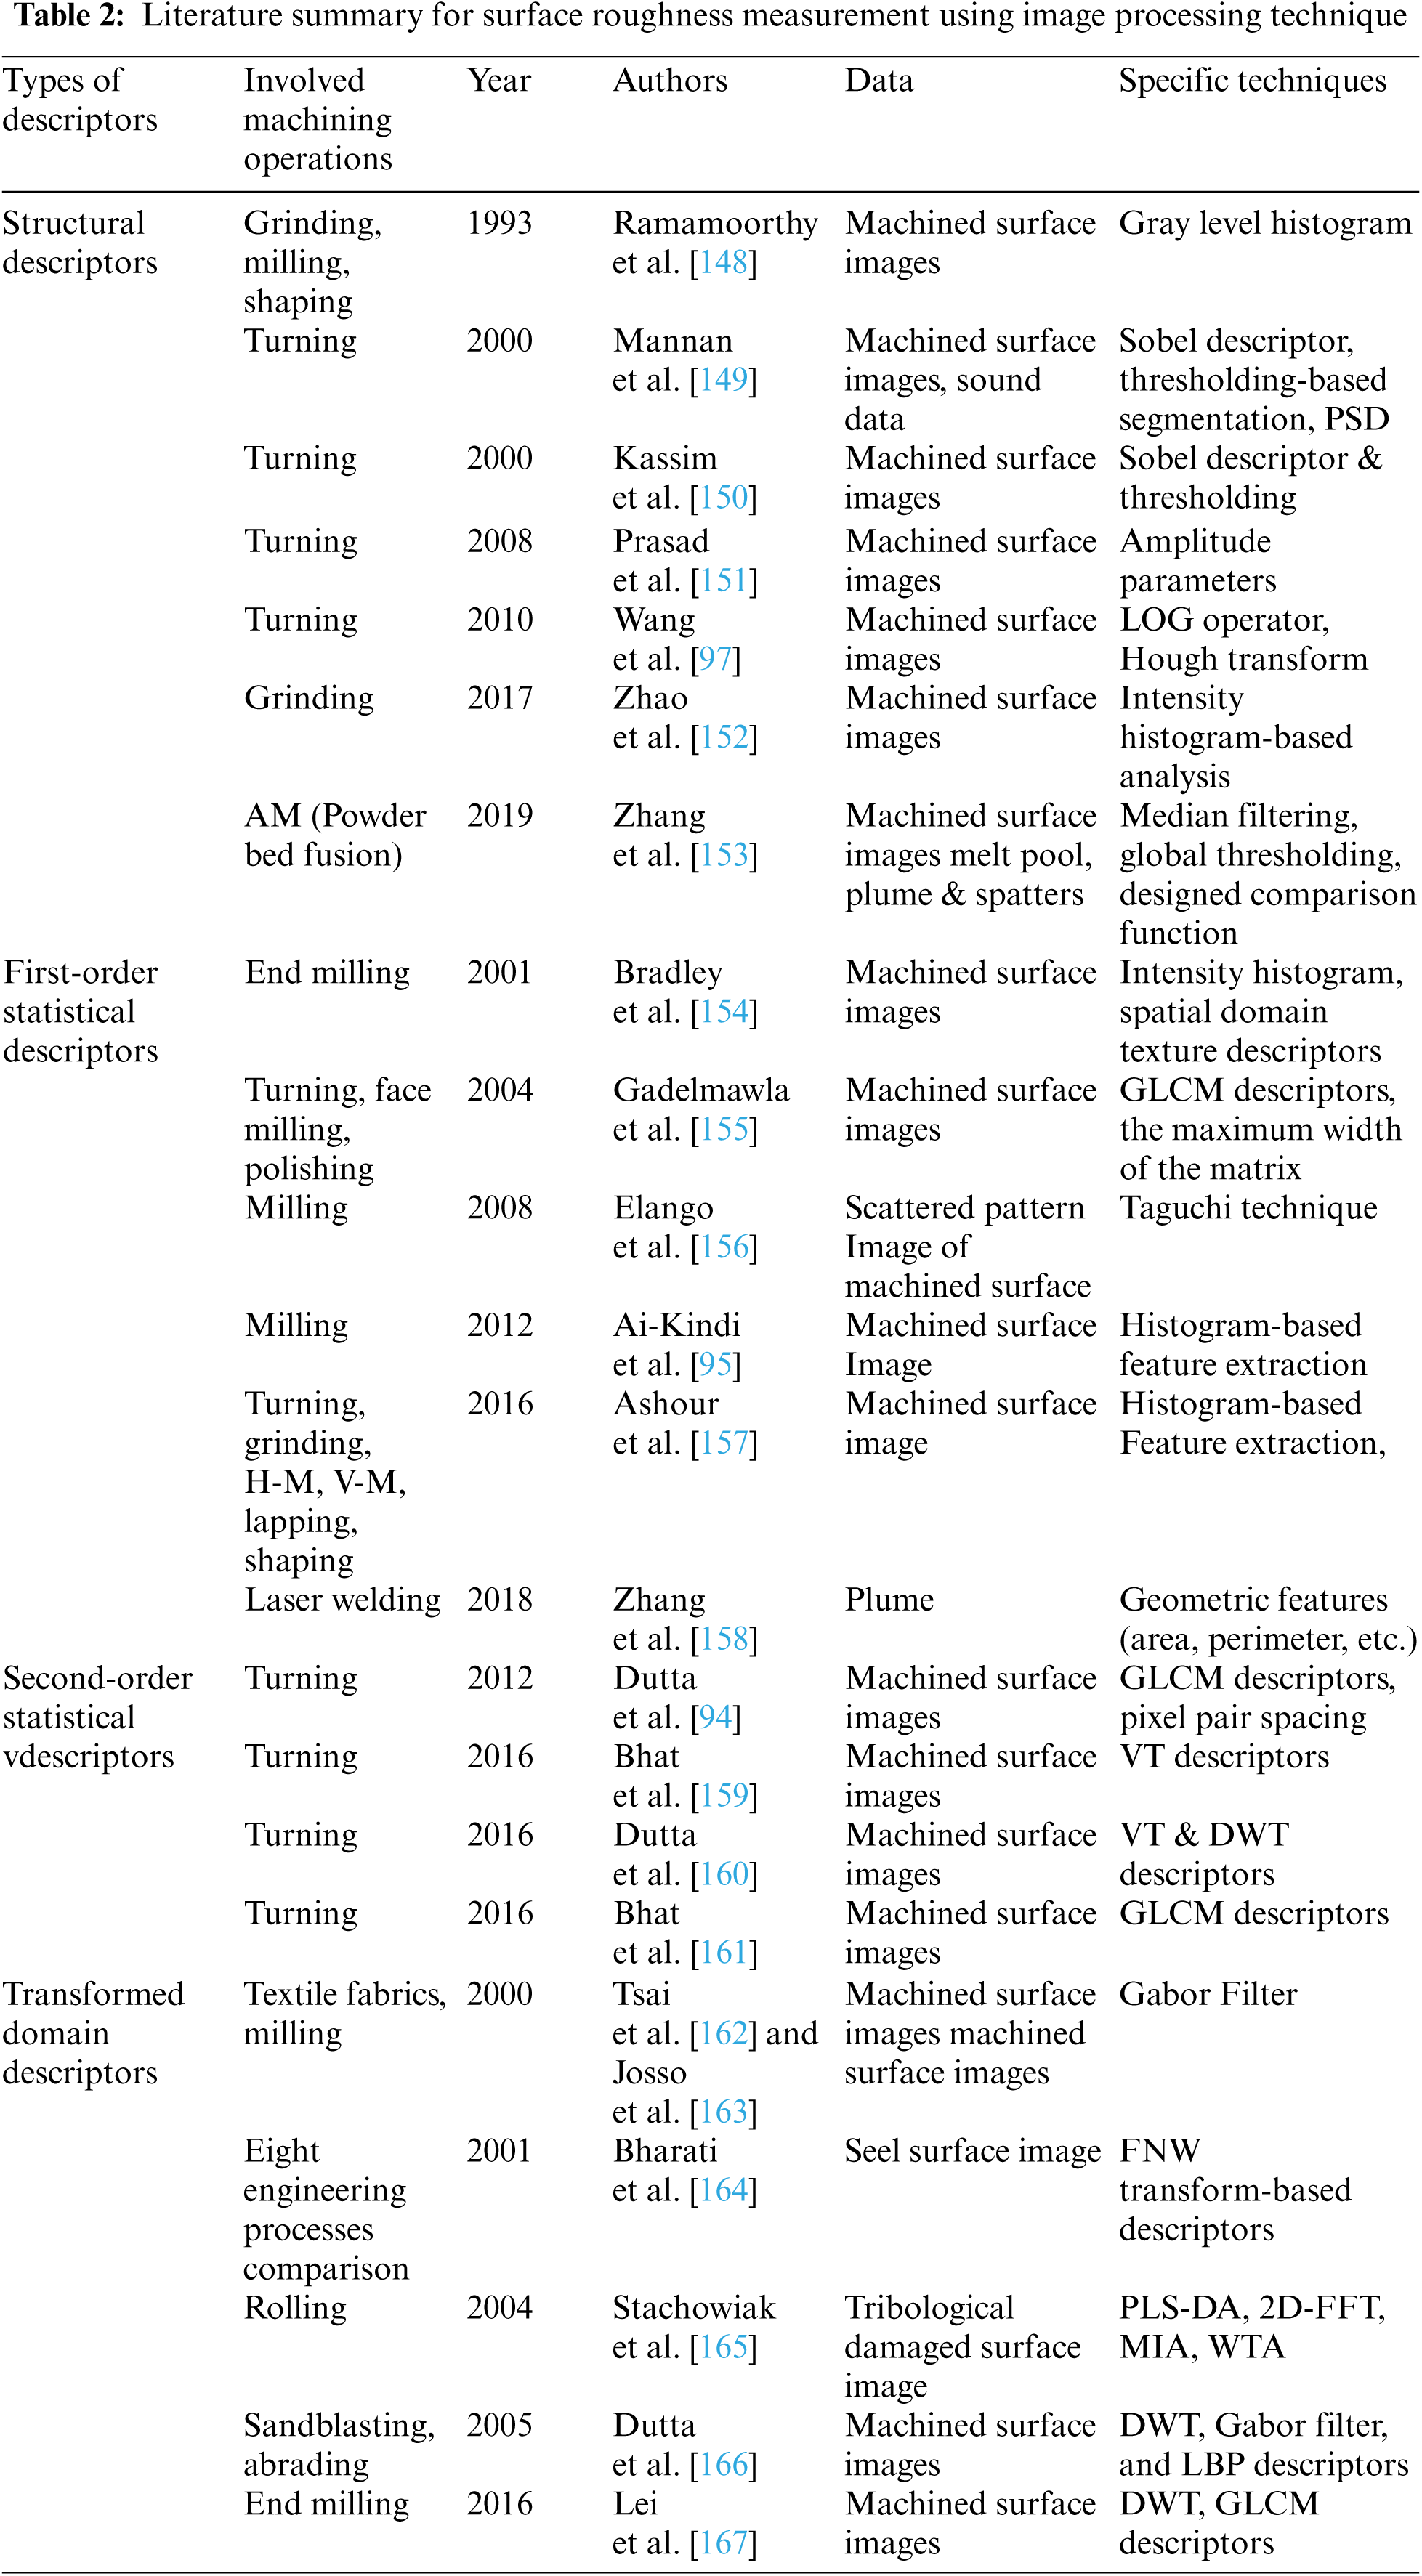
Table 2 presents some more publications from the past that have researched surface characterization and measurement using the Image processing technique.
5.2 Surface Characteristics Measurement Using Machine Vision Techniques
Vision-based measurement in the industrial field has more attention due to fast measurement combined with cameras, hardware, and sensors [168].
In [142], the findings show explicitly that when a machine vision procedure is used to measure the parameters for the surface texture, the orientation of the workpiece must be considered. The findings demonstrate explicitly that the optimal connection to multiple parameters may be achieved through an approach to machine vision; therefore, the measured dimensions of vision and the lay orientation of the workpiece must be explicit. The average roughness parameter Ra from perthometer is compared to the image parameters of the job piece in the X-Y plane by the images taken from a number of directions (0 fee, 30 fee, 45 fee, 60 fee, 90 fee, 120 fee, 135 fee, 150 fee, and 180 fee). This pattern was completely followed by the Ga, GLCM contrast and fractal scale, and average 3D roughness. GLCM energy and Max chance have nearly identical patterns, with the addition of a minor shift of 45 bucks. The maximum association of GLCM energy and likelihood is 45 and 180 livres. However, for the GLCM parameter, the pattern is different. The max values are 90 pounds, and the orientations are at least 45 pounds and 150 pounds. Therefore, it is understood that Ga, GLCM comparison, GLCM energy, GLCM Max likelihood, and Fractal dimensions have a similar pattern when correlating to R. Inconsistency in the quantification of surfaces with visual ruggedness parameters can be reduced to a large degree by considering the transition and properly collecting images from machined surfaces. Manjunath et al. [147] show clearly that the Machine Vision approach is used to approximate the surface roughness of the machined components and that the results show a strong linear relation between stylus Ra values and optical Parameters. The standard deviation strongly correlates with Ra values of all given optical parameters, as determined by traditional and commonly agreed type instruments on machined surfaces produced by electric discharge processes, milling, and grinding processes. The calculation of optical parameters is identical to the roughness measuring technique for the stylus surface. Machine Vision technology can be used easily with a low-cost configuration, resulting in stable and high precision [169].
In [170], a vision-based method was tested using the gray-size imaging technique to characterize the surface texture. An image histogram for further analysis has been analyzed to better the image. This method prohibits close interaction with the surface to be studied. Scratches are made very plain on the surface image, and the distance between them is apparent to examine the surface texture quickly. Different filtering techniques can enhance the precision and visibility of the area of interest for the better use of this visual approach. This processed image can also be used for the surface roughness attribute estimation. In [171], the machine vision technology was investigated for the surface roughness inspection of 38 mm grinding shafts.
First, Luk’s procedure analyses the influence of ambient light using the root mean square height parameter and a regular gray-level distribution differentiation, and a co-occurrence matrix solution. The input variables then suggest the new RBF neural network, which is the average grey value for the context sample area, the average gray-scale value, and the second-order of the work-piece sample area for the co-occurrence matrix, and their corresponding inspection values. This approach used five shafts and II shafts for the neural network training.
Yao et al. [172] presented the light section microscope and machine vision of the surface roughness measurement device and automatically detected the roughness of the surface. The device reduces the artificial read, grab, and estimation and significantly enhances surface roughness measurement efficiency. And with the use of the traditional measuring error, the surface ruggedness measuring procedure is evaluated more stably and credibly based on the experimental contrast findings. Kumar et al. [173] revealed very clearly that the vision technique can be used to measure the roughness of machined surfaces, and a high degree of precision is found in the measurement of the strong linear relationship between Ra and Ga. The interpolation process of Cubic convolutions has proven to become the perfect alternative for enlarging digital images and the Linear Edge Crispening algorithm for subsequent image enhancement. In these magnified and improved images, the Ga, optical roughness, calculated correlates better (i.e., a higher coefficient of correlation) with the mean rugged surface (Ra) of the components generated by machinery, framing, and grinder, which shows its effectiveness to measure the ruggedness of the surface using a vision system machine. It can also be concluded that for machining activities that yield a normal and uniform surface texture, this scheme of optical roughness estimations appears more promising.
Patel et al. [174] explicitly showed that a vision strategy for the machine can be applied to test the ma-chined surface roughness. The fitness of experimental measurements is measured by multiple regression analyses. Surface roughness estimation regression models (R2 > 0.93) match the experimental results very well. The Cubic convolution method of interpolation was the optimal alternative for optical picture mag-modification. Ga’s, optical roughness value estimation, was best related to the overall surface roughness (Ra) calculated for the ground components relative to two other approaches employing these lengths and im-proves images of the cubic convolution algorithm. This Cubic convolution algorithm also offers a better (h3) convergence rate scheme of optical roughness measurement, which shows its efficiency in the measurement using the vision method.
In [175], the combination of a light microscope and a computer vision system was developed as a non-contact and multi-parameter system to quantify surface roughness. The visual method was used to record and store photographs for roughness profiles visited by a light cutting microscope. A specially written software (SRLSVision) was written in-house to process the recorded images. Two modules with a graphical user interface (GUI) were created to extract the images captured and measure ISO roughness parameters from the extracted profiling. The machine added could measure twenty-two parameters of roughness. The machine was calibrated with a typical specimen to measure the parameters of roughness in metric units for both horizontally and vertically resolutions. The method was tested with the normal sample. Furthermore, the device and the design instrument were taken to test various samples processed by separate operations, and the maximum discrepancy between the results of Ra and Rt was ±5.5%.
Joshi et al. [2] proposed an introduction to machine vision to assess the surface resistance of free-hand earth specimens. Normal slip gauge pictures were taken by a camera for free hand grinding surfaces and collected at MATLAB for processing. Images to remove GLCM texture parameters were generated and processed: contrast, similarity, energy, and homogeneity in different directions, including 0, 45, 90, and 135. The GLCM function data were primarily analyzed with respect to components for all slip gauge surfaces in order to detect directions with particular data variances. For construct validity, discriminant validity, convergent validity, and nomological validity, the findings of PCA were validated. The PCA results revealed that there were two key components dependent on GLCM characteristics, which explained 94.308% of the data variation. Contrast and correlation along the center, correlation, and energy in 45, the correlation between 90, and correlation, and energy in 135 were factors loaded on the first main component. Contrasts between 0, 45, 90, and 135 were the factors loaded for the second major portion. Moreover, many regression analyses have been modeling the relationship between the surface ruggedness attribute and GLCM-based concept components. Results from regression analysis for predictive relevance, control Multicollinearity, and standard error concept have been validated. The regression equation of Ra = −9,574 + 12,933 ∗ PC1 + (−1,022) ∗ PC2 is formed for the prediction of the free hand field surface roughness.
In [176], a vision-based system for surface roughness characterization of the milled surface using speckle line images was proposed. At first, a set of 2-D speckle and white images of a milled surface are obtained as the standard derivation of the image pixel intensity for the line speckle, and white light images were calculated from each surface image. The mean speckle image intensity parameters correlate very well with the stylus parameters. The stylus hybrid parameters arithmetic mean slope (Rda) correlate well with the speckle line parameters and the slope of the various points on the free surface. This technique of using the mean of the speckle line images of non-contact evaluation of surface roughness is promising, and the reliability of the measurement establish through the bigger sample size of the experiment.
Kamguem et al. [177] suggested methods for estimating the surface resistance of machined components based on image analysis and machine-learning techniques. Bagging trees and the booster algorithm have been sufficient in the ten timescales of the ‘Ra’ value when considering the correlation coefficient, except those higher values of 0.9289 have been found for bagging trees. Bagging three values have not been regarded. In terms of correlations of 0.7005 and 0.9206, thus estimating ‘Rz’ values, the algorithm of bagging trees and stochastic gradient enhancement obtained adequate results for ten times cross-validation. However, the author can infer that the Stochastic Gradient Boosting algorithm is more feasible than the bagging tree, based on the output parameter: Root-mean-square error, and it also has the advantage of being computationally simpler than the Bagging-Trees algorithm. Future research methods in deep learning, such as recurrent neural networks and long-term memory (LSTM) networks, may predict surface roughness and other workmanship parameters.
Chethan et al. [178] proposed a work that has evolved an image processing-based vision system (computer/machine) for the assessment and evaluation of the surface roughness while keeping the non-contact phenomenon. A group of 2-D images of the ‘milled surface’ has been acquired, and there, the reference images are then changed to the 1-D reference signals. For the test image (‘or the image having unknown surface roughness’). The Hamming distance among the test signals and that of the reference signals are used to expect the surface roughness of the test image. Using both the Hamming and Euclidean distance formula, the similarity of the test images and the ref images gives exceptionally good results. It has also been observed from the past experimentation regarding the vision system-based image processing that both of these distances are extremely low for the surfaces having values of surface roughness nearly equal to each other. Thus, this approach is ideal for performing the ‘online surface characterization’ of the ‘machined surface.’ The exploitation of the huge database of the reference images and the technique exploration for various other machinings procedures, like EDM, planning, and Nithyanantham et al. [179] show clearly that the visual approach of the computer can be used for determining the surface ruggedness of machined surfaces and that there is a strong linear relation between Ra and Ga with a high degree of precision. The calculation of Ga as an optical roughness was better related to the average surface roughness (Ra) following geometric search techniques for components manufactured especially using forming, milling, and grinding methods using a traditional and widely accepted style instrument. To show their usefulness in quantifying machine vision surface roughness.
Due to surface consistency, the surfaces produced are analyzed using a vision method using a Ga parameter with shaping, milling, and grinding with a surface finishing range of Ra 0.3 to 30 μm. Just regular exemplars use the stylus instrument to calibrate the Ra values. However, in most cases, Ga has an excellent relationship with Ra must be stated in particular.
In [14], computer vision methods have been utilized to examine the rough surface of a workpiece under separate turning procedures. The benefits of these methods are contactless measurements and easy automation. In this analysis, a polynomial network of an integrated adaptive system uses learning skills to process the surface image to get the work-pieces surface roughness. The polynomial network has been shown to correlate the input correctly Variables (speed cuts, feed rate, cutting depth, and surface image feature) with the output factor of work-piece surface ruggedness. The results from experiments show that after the picture of turns on the surface and turning conditions (cutting speed, feed rate, and depths of cut) are given, the surface roughness of the rotating component can be accurately predicted, even during various rotational operations. Patel et al. [180] proposed a contactless computer vision method named, Ground roughness measurement vision method. It demonstrates a reliable surface assessment roughness over a given 2D region instead of a single 1D course. The surface picture in the FT approach Conditions of the elements of frequency. The frequency part quantity increases the frequency characteristics present and directionality of the surface picture. The lay course of the frequency component’s surface area is the highest peak frequency, F1, which is a frequency of feed marks (or opposite wavelength). Other ruggedness attributes in the picture usually outperform for evaluation of roughness. Since F1 is the gap, A robust measure for the main peak and the origin Surmount the environmental lighting effect.
Jeyapoovan et al. [146] examined the roughness of the casting surface Digital image capture measurement tool Technology. The approach includes the acquisition of images, improved image, binary image dialogue, and extraction of roughness casting characteristic parameters surface area. The preprocessing and the image interface Roughness assessment criteria extraction is compiled by MATLAB, the base of which can be solid Casting surface roughness digitally and rapid identification.
5.2.1 Surface Characteristics Measurement Using Artificial Neural Network (ANN) Technique
Dhanapalan et al. [181] proposed a method Prediction of surface roughness of aluminum alloy end milling. Aluminum alloy 6061 is predicted from the image’s features extracted from images machined using machine vision. This non-contact method using a CCD camera and (ANN) Neural Network controller is designed to predict the surface roughness of machined from the image features used such as Skewness, Kurtosis, entropy, mean and standard derivatives as in input parameters for training neural network and surface roughness value measured experimentally given as a target value. Regression between input and target value using a neural network to predict the surface roughness of the machined surface [181–184].
Vision-based surface roughness evaluation system for end milling in this paper digital reconstruction and calibration of inspected surface and qualitative evaluation of surface texture. Vision-based results vary from 9% to 11% compared to the stylus-based ones. Spacing parameters were also implemented including autocorrelation length and angular power spectral density function. Cusp lines and tool marks and analysis on further evaluation of surface texture. Texture evaluations are implemented in software that interacts with the microscope camera. A microscope camera is used for image acquisition to ensure repeatability, accuracy, and high precision for the centralization of the inspected surface [185]. Fig. 40 represents the ANN-based surface roughness characterization process flow.

Figure 40: ANN-based machine vision procedure schematic for surface roughness measurement [1]
In [186], the proposed scheme demonstrates that optical roughness is well correlated and thus acceptable with the expected ANN values. The coefficient of differentiation achieved for Ga vs. ANN is 0.941. In addition to optical roughness, the stylus values are often compared. The obtained coefficient is 0.7991 for the Ra vs. Ga correlation. In [187], a vision program has been introduced that can conduct selective image processing and analysis. The filter beats normal designs in terms of quality estimation, high speed, and low power consumption. It is easy to scale and can be mapped with non-linear operators from Digital Logic. Thus, systems such as the EHW, Wavelet, and ANN filters will replace standard systems with success. A new attempt has been made in [188] to predict the surface roughness of rotated components using the neural network model that is trained by non-traditional optimization technology. The error percentage of the DEA-based ANN is similar to the BP-based ANN, and the convergence velocity of the ANN-based DEA is less than the ANN-based BP. The suggested ANN DE-based model for numerical optimization is simpler, faster, and more stable. It is an efficient, direct population-based search algorithm to optimize functions globally by real parameters. The approach precision can be improved by using a high-resolution frame-grabber in the computer vision method and the shadow algorithm.
Morala Argüello et al. [189] showed that regardless of the kind of substance of the turned work-piece being examined for surface roughness, the ANN model-based method introduced in this paper can estimate the surface ruggedness of the work-piece in question with a high degree of precision. Compared with current non-contact surface roughness estimates for turned workpieces, a significantly improved degree of precision is obtained by the method presented in this paper, as far as non-Contact sur-face roughness calculation (without the use of turning parameters) is concerned. In the current methods that apply to machine (turning) parameters in non-contact surface roughness calculations of turned work-pieces, the proposed model-based ANN solution also offers a limited (not very significant) increase in precision. It can therefore be inferred that imagery textural characteristics such as contrast, energy, homogeneity, entropy, range, and standard deviations have very high potential when used to estimate the surface roughness of turned parts on a computer vision-based basis, particularly where prior data on the concerned machining (turning) parameters cannot be obtained.
The surface condition of all machined parts was difficult to verify in the mass manufacturing process [190]. Thus, it adopted the process of job sampling to assess product consistency. This work may substitute for the mass production sampling technique. The vision-based calculation of the roughness of the surface will minimize the test time for all processed parts, thus reducing the scarp frequency. Based on this work, the ANN model will achieve 98.35% precision in predicting the roughness of a surface. The subject of [191] is Al-10 wt% Si3N4 machining. The products have been treated with stir casting. The experimental computer used was the 4-axis CNC WED machine CONCORD DK7720C. Pulses (20, 24, 26 μs), pulse-off times (5, 6, 7 μs), current (4, 5, 6 amps), and bed speed (30, 35, 40 μm/s) were the parameters of the inputs. Surface roughness and electrode wear are the response variables. In this investigative job, the Wire EDM computer has developed a machine vision device to calculate the wire electrode b status of the workpiece’s wiring and surface roughness.
The findings of [192] are used to develop the traditional rolling mill (ANN) model to determine surface roughness (Ra) and are used for various cutting parameters. This review draws the following conclusions:
• Surface ruggedness (Ra) can be accurately predicted by using input variables such as cutting depth, cutting speed, and feed rate.
• The built model of surface roughness (Ra) can be correctly predicted as a correlation factor between the artificial neural network prediction.
Table 3 represents the few of the papers that have worked significantly in machine vision using the ANN technique for surface characterization and surface roughness measurement.
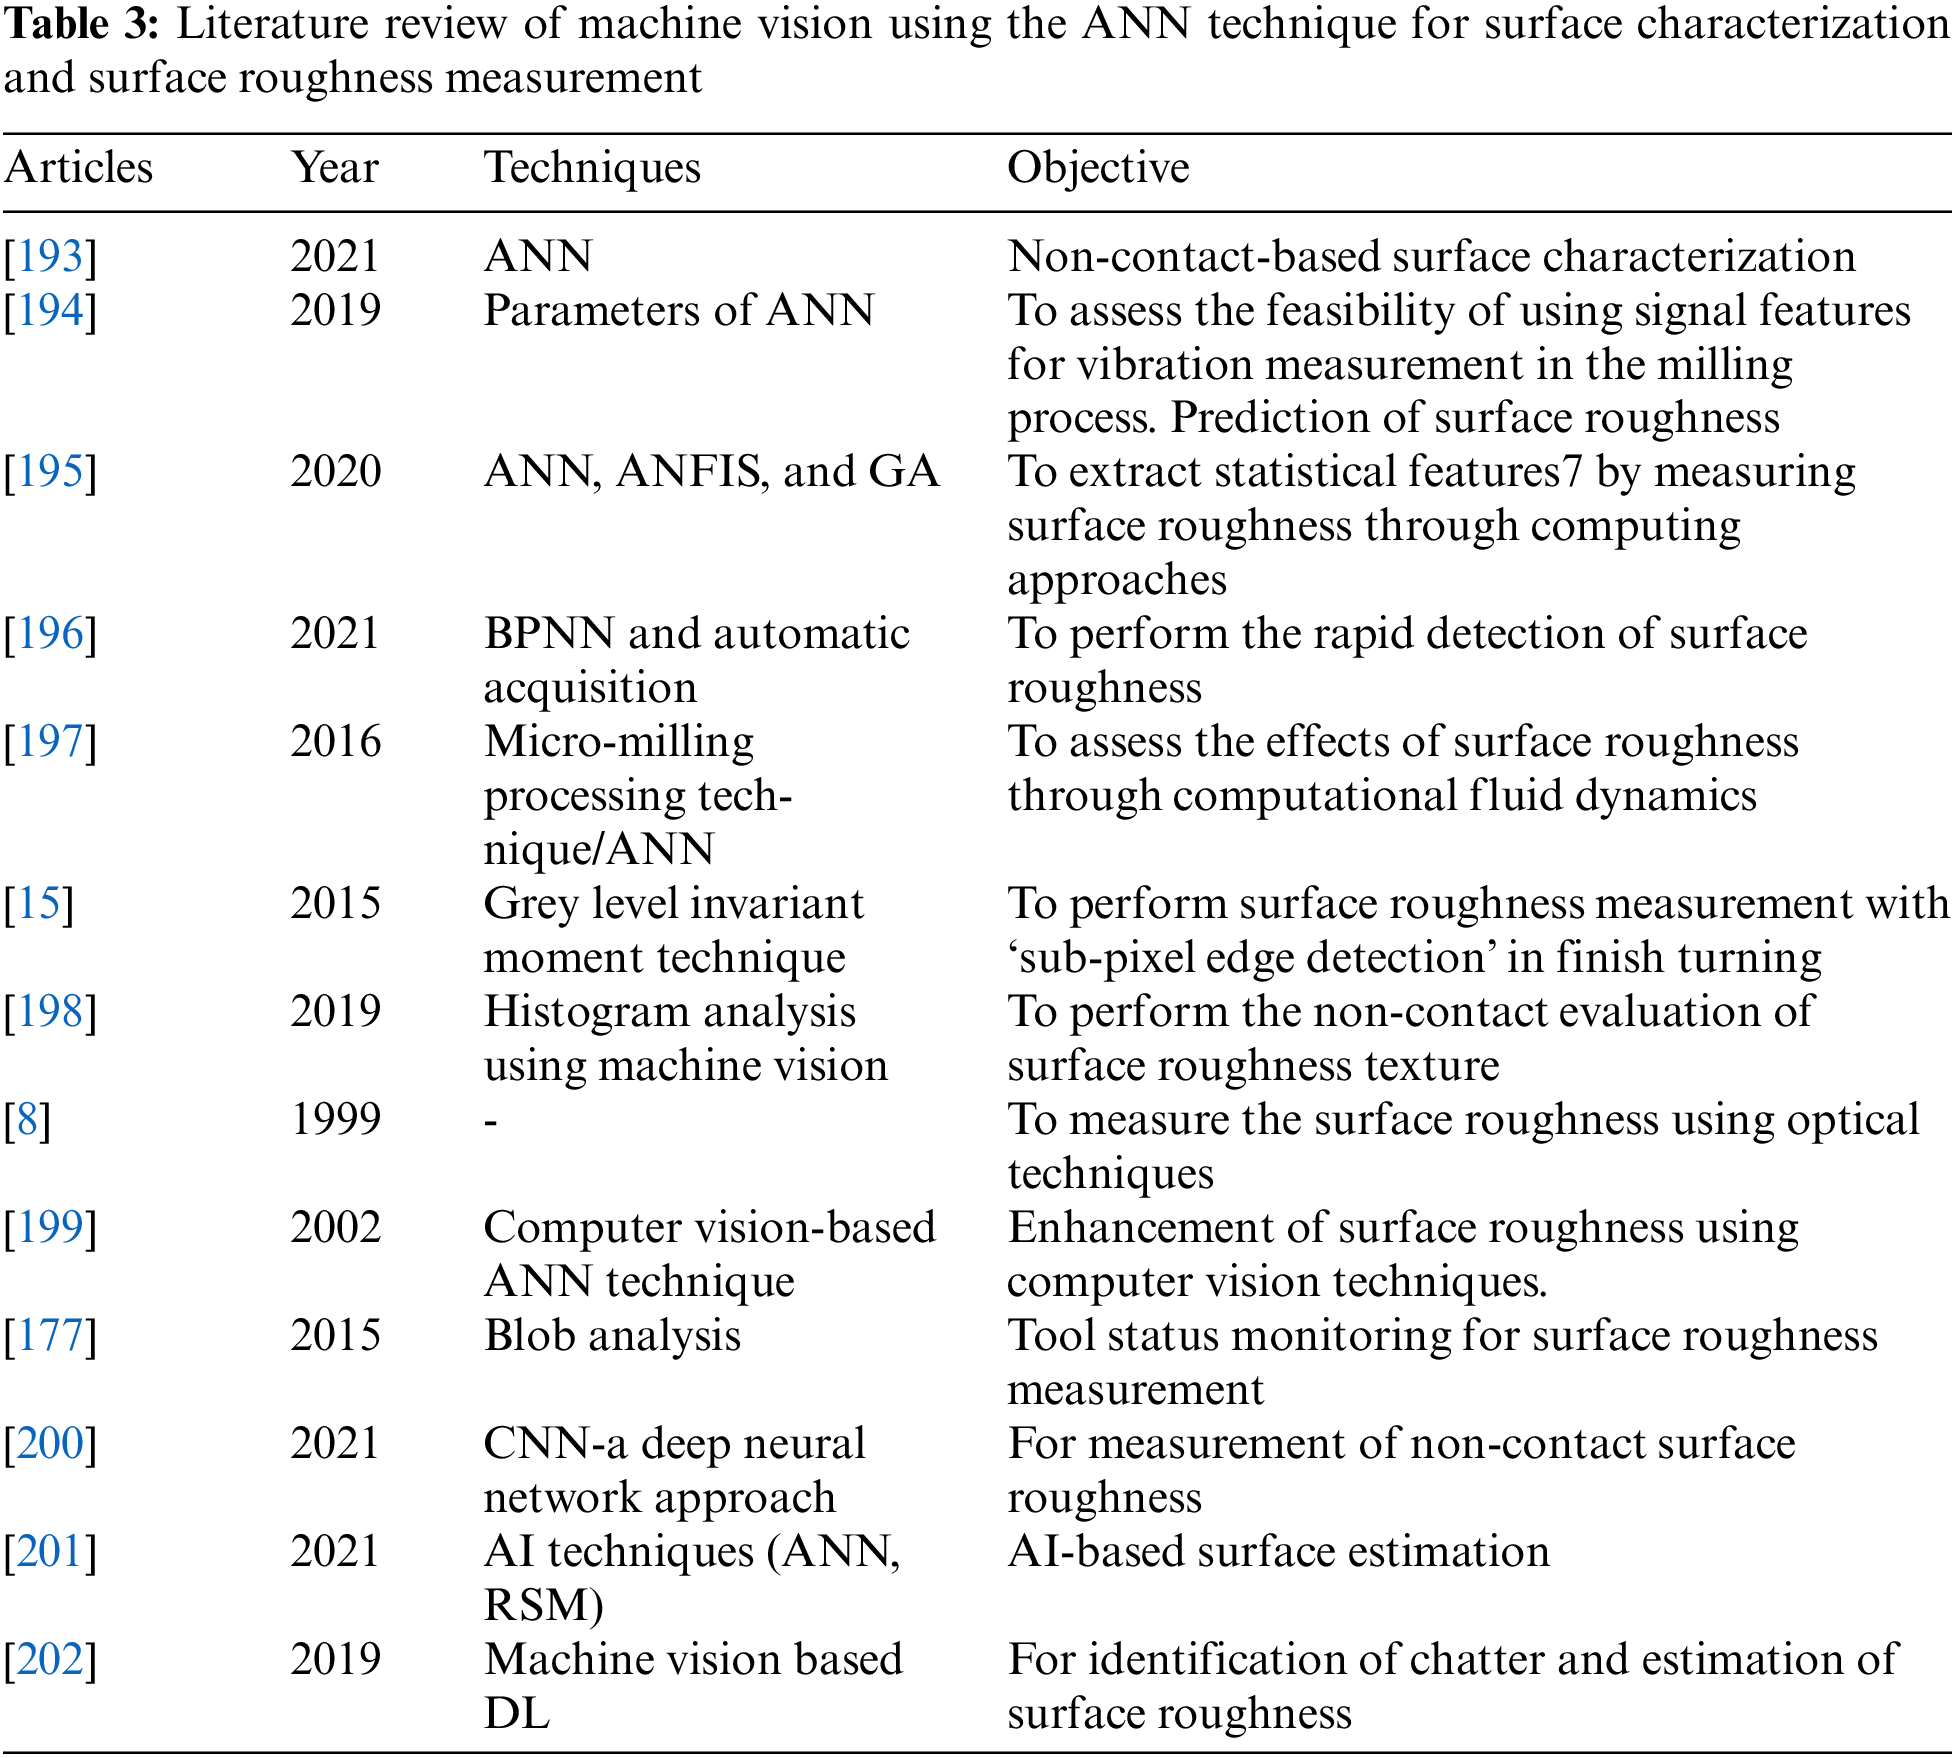
5.2.2 Surface Characteristics Measurement Using Adaptive Neuro-Fuzzy Inference (ANFIS) Technique
In [203], a method proposed online measuring of surface roughness and grinding wheel using ANFIS-GPR hybrid algorithms and Taguchi analysis solved a difficult problem in the grinding Ti-6AI-4V, which is the most difficult material to process but commonly used in industries, so ANFIS-GPR hybrid algorithms predictability is better than ANFIS, and also ANFIS-GPR system provides a CLs of the predicted results. This model is transcendental predictive. This method is Intelligent production conditions, self-adaptable, self-learning, and has a variety of potential applications. Although the data changes, it only needs to follow new empirical data generated by a new training sample [204,205]. Fig. 41 represents the methodology for the surface roughness measurement using the ANFIS techniques.
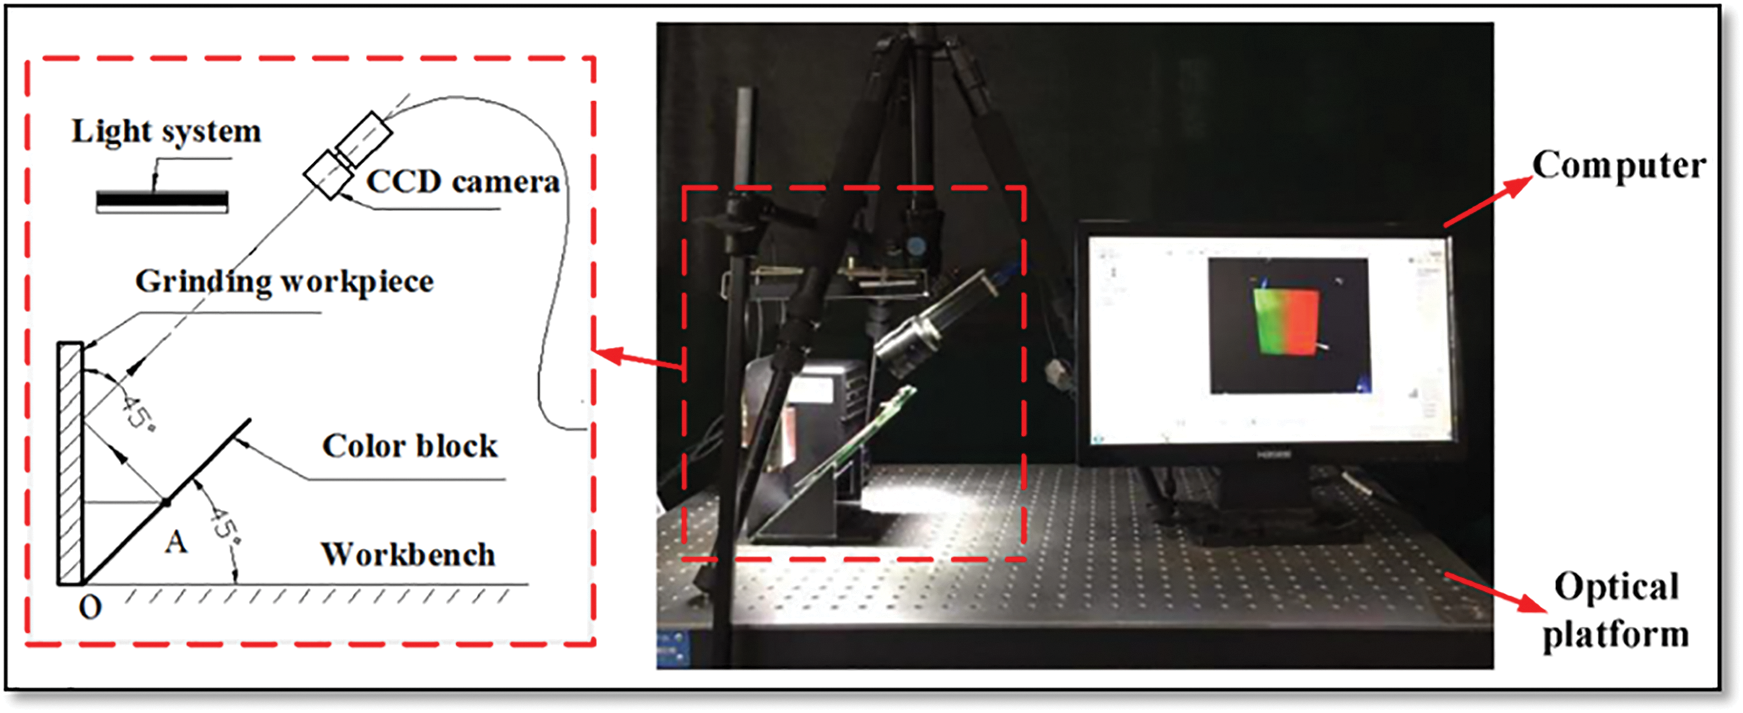
Figure 41: Surface roughness measurement using ANFIS techniques [205]
In [206], surface roughness assessment based on digital image features is proposed to build real-time online surface roughness monitoring for machined surfaces. The system is faster in carrying out the required control of the machined surface. The cost for testing would be cheaper during monitoring of machining, helping to timely react for the positive derivatives and reducing subsequent costs. This idea is based on ANFIS (Adaptive neural-fuzzy interface system) average arithmetic parameter of the roughness profile is Ra. The fuzzy interface system investigation has an assessing error of 6.98%; with such an error, the technical requirement set on the workpiece as a regards quality of machining should be not diminished [199].
The research is part of a study whose overall purpose is to develop a web framework for monitoring machined surface roughness in real-time [207]. The device can conduct the tasks of the machined surface control criteria quicker, checking is cheaper, and tracking during machining allows to respond in good time to potential anomalies and minimize costs. The research in this paper focuses on evaluating machined surface roughness based on digital image characteristics using the neuro-fuzzy adaptive inference system (ANFIS). The arithmetic average of the rawness profile Ra is a regulated parameter for surface roughness. The following characteristics are examined in the paper: the average grayscale value of all members of a digital image matrix, the standard deviation of all the components of the digital image matrix, and the entropy of the digital grayscale image matrix. The study is carried out in a high-speed work environment. The machined surfaces are therefore of high quality, and the roughness measured is very limited. Thus, the digital pictures have very similar characteristics, and a higher evaluation error is predicted. There is a 6.98% flaw in the fuzzy inference method obtained in the present study. But the technical specifications of the workpiece about machining efficiency should not be reduced even with such a mistake. Makadia et al. [208] proposed an ANFIS approach to determine the exact relation of input parameters such as cutting speed, feeding rate, cutting depth, high peak frequency, the main component squared value magnitude, the average grey level, and surface ruggedness performance. The proposed ANFIS model beats the ANN model concerning simulation and prediction precision. The findings promote the expansion of machine vision technologies to so many industrial inspection applications in real-time. Radha Krishnan et al. [183] provided a way of reliably determining the relationship between the properties of the surface image and real surface roughness using the adaptive neuro-fuzzy inference method (ANFIS) and thus can efficiently approximate surface roughness by means of cutting parameters (such as cutting speed, feed rate and cuts depth) and grey surface image level. Non-contact calculations, easy automation, and high precision are the benefits of the process suggested. The proposed ANFIS-based approach showed experimental simulation and estimation accuracy results to outsmart the conventional polynomial network-based method. Table 4 mentions a few of the papers that have worked significantly in machine vision using the ANFIS technique for surface characterization and surface roughness measurement.
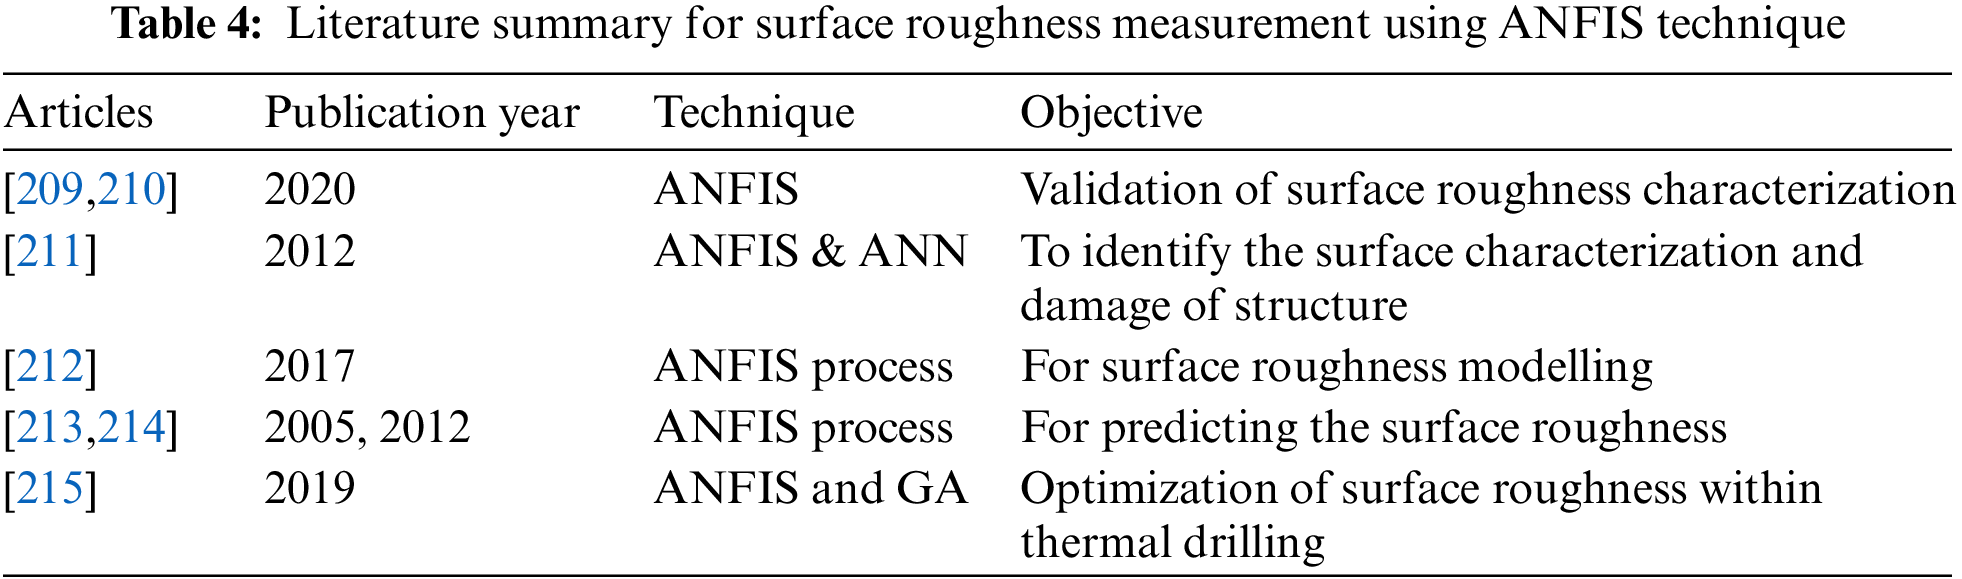
Fig. 42 shows the flow chart of the ANFIS technique with step-by-step process for surface roughness characterization.
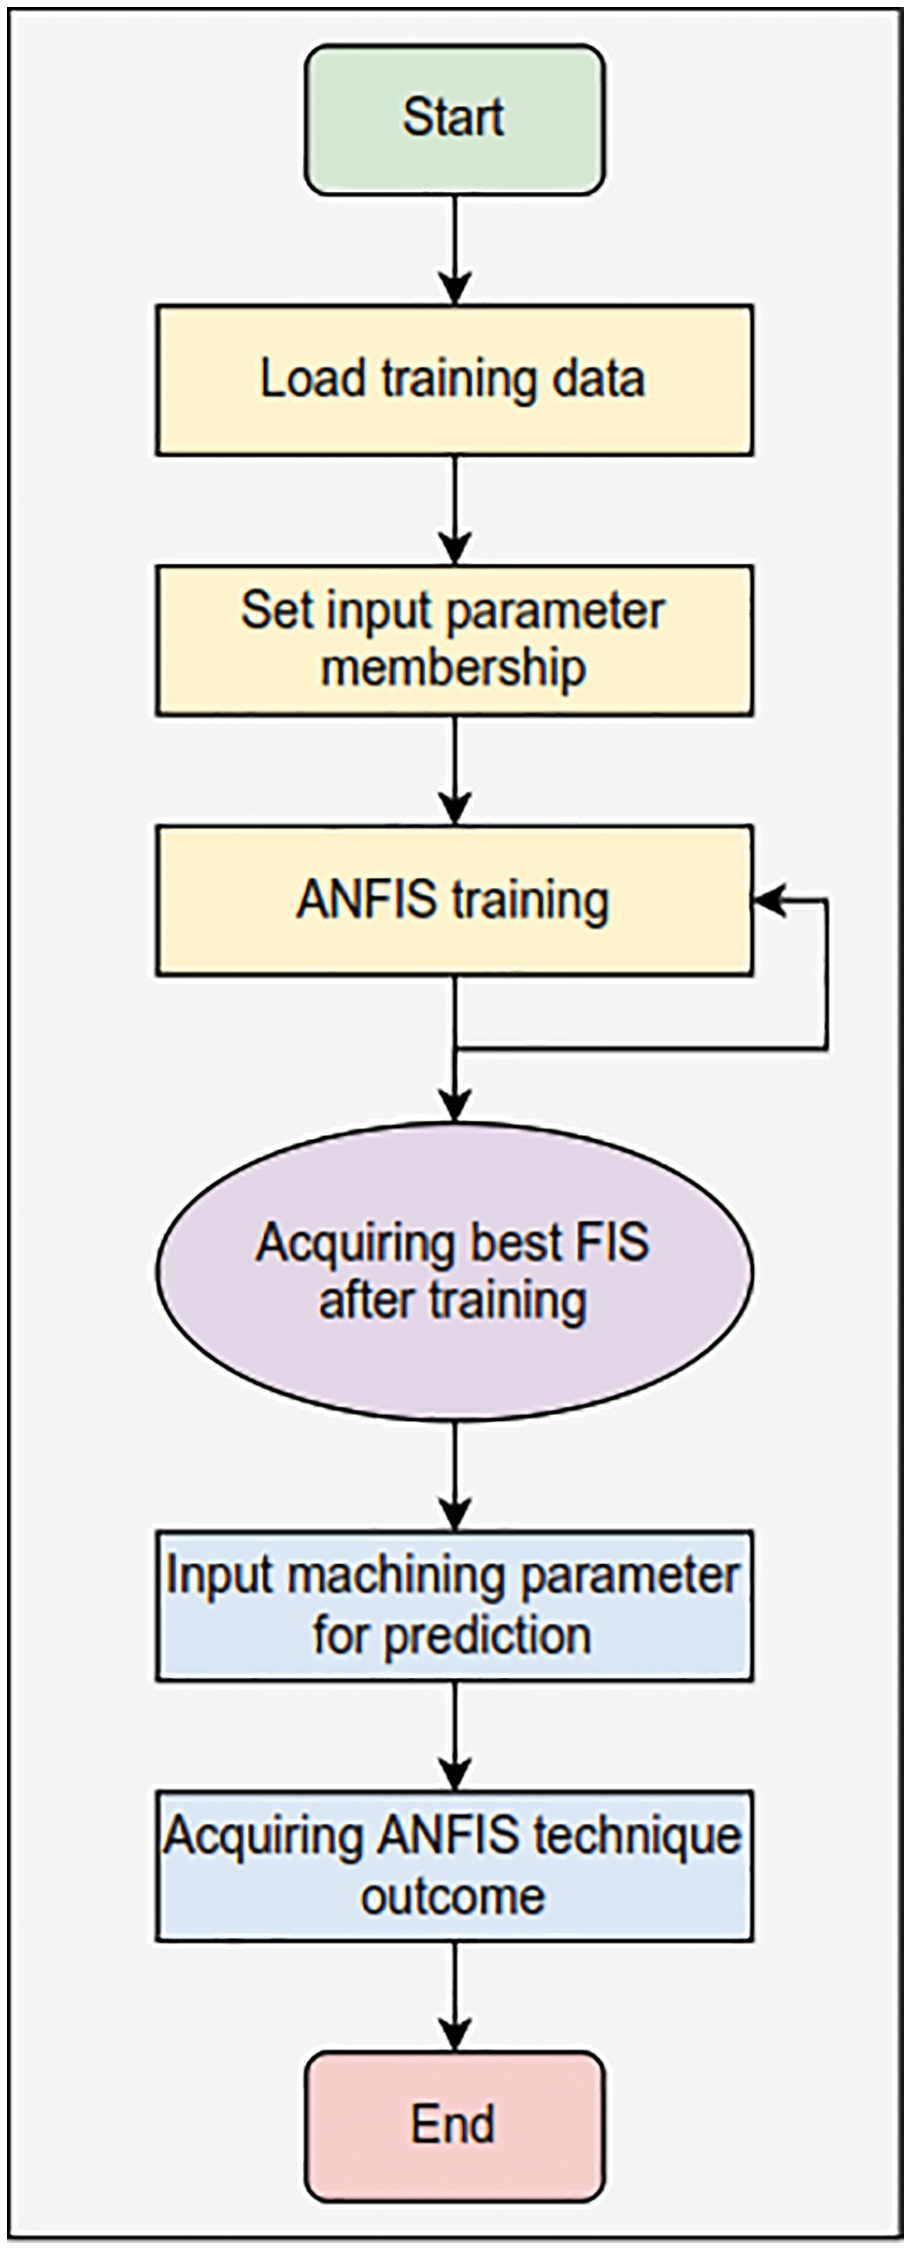
Figure 42: Flowchart of ANFIS technique for surface roughness measurement
5.2.3 Surface Characteristics Measurement Using Convolutional Neural Network (CNN) Technique
In [216], a new method was proposed in which the roughness Rz of a laser-cut edge based on an RGB image can be estimated by a CNN. An average error between 4.8 (line 0.3) and 3.2 μm (line 1.5) could estimate the roughness at various layer depths. As a result, only model training data and outdated in practice is a 3D measuring system required. For example, cameras that take pictures of cut boundaries or different photo stations can be used, if necessary, by the machine operators to sort laser cuts automatically. For the largest measuring line, the CNN seems to function worse. Any marks are incorrect due to inconsistencies in measuring, in which case the CNN forecast is higher than the real calculation. Comparing the errors of the various runs, it becomes apparent that there might be changes if more or better data were available. Then the result is less contingent on the data breakdown, and the contours have less effect on the overall performance. The data accuracy may be increased instead of an optical measuring tool (e.g., stylus tip measurement device). This will also increase the time it takes to gather data.
Fang et al. [217] suggested an alternate surface perception assessment using profound learning models. The proposed CNN model omits the process by extracting functions automatically with convolutional layers, in comparison to former approaches that involve feature extraction. This study suggested an alternate surface perception assessment using profound learning models. In comparison to earlier approaches which would include the extraction of features, the proposed CNN model does not use convolutional layers to automatically extract the features. To fix this issue, in future studies, an adaptive model may be considered that can automatically change the value of hyper-parameters based on their real-time output during the training phase.
Using a neural network, an estimate was made of the Ra surface roughness parameter in [218]. As an input of the neural network estimator, the machined image surface parameters have been increased. There were five cross-sections in the image, from which the six wavelet decomposition levels were calculated by statistical parameters. The Optimal Brain Surgeon Method selected these six parameters. Where increasing these parameters and the estimated value is applied at a given point, it was possible to determine the Ra estimator at times when surface roughness parameters were unknown. Leistung of the surface roughness parameter estimator Ra showed the presented method for tracking surface roughness quality during turning to be very usable. The test set error was clearly less than 20% and marginally less than 5%. The recurring neural network-enabled an accurate assessment of the given value of Ra based on data from the processed surface image only [218]. The “Deep Learning” CNN-based technique for measuring surface roughness [219] using vibrational signal analysis is shown in Fig. 43.
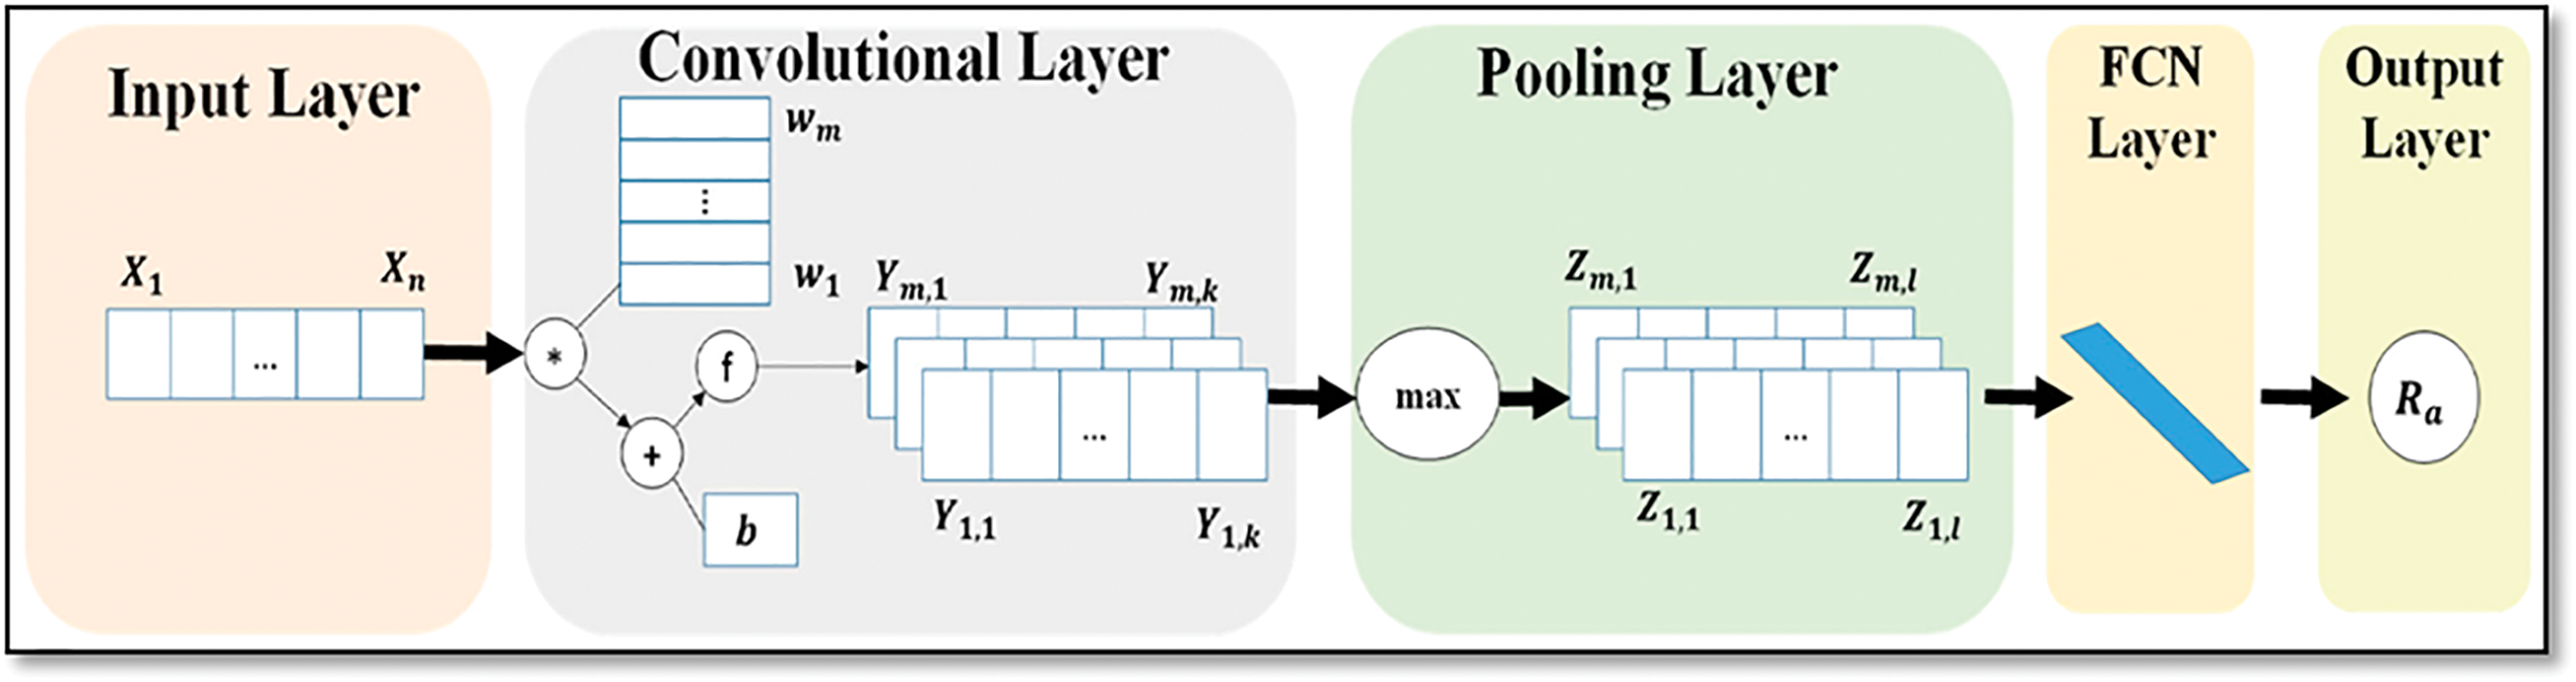
Figure 43: Flowchart of CNN-based technique for the measurement of surface roughness [219]
Table 5 mentions a few papers that have worked significantly in machine vision using the CNN technique for surface characterization and surface roughness measurement.
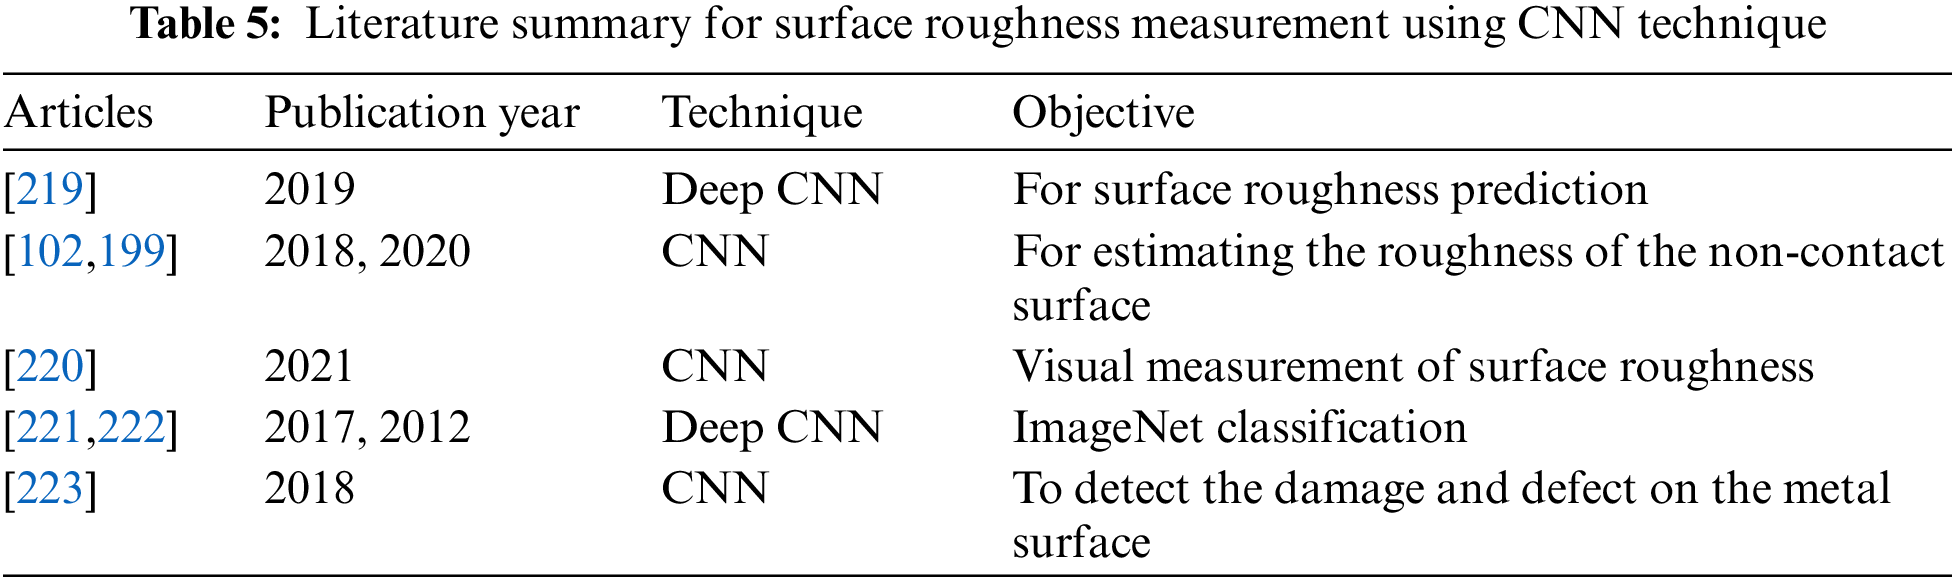
Table 6 mentions a few papers that have worked significantly in machine vision using the Deep Learning technique for surface characterization and surface roughness measurement.
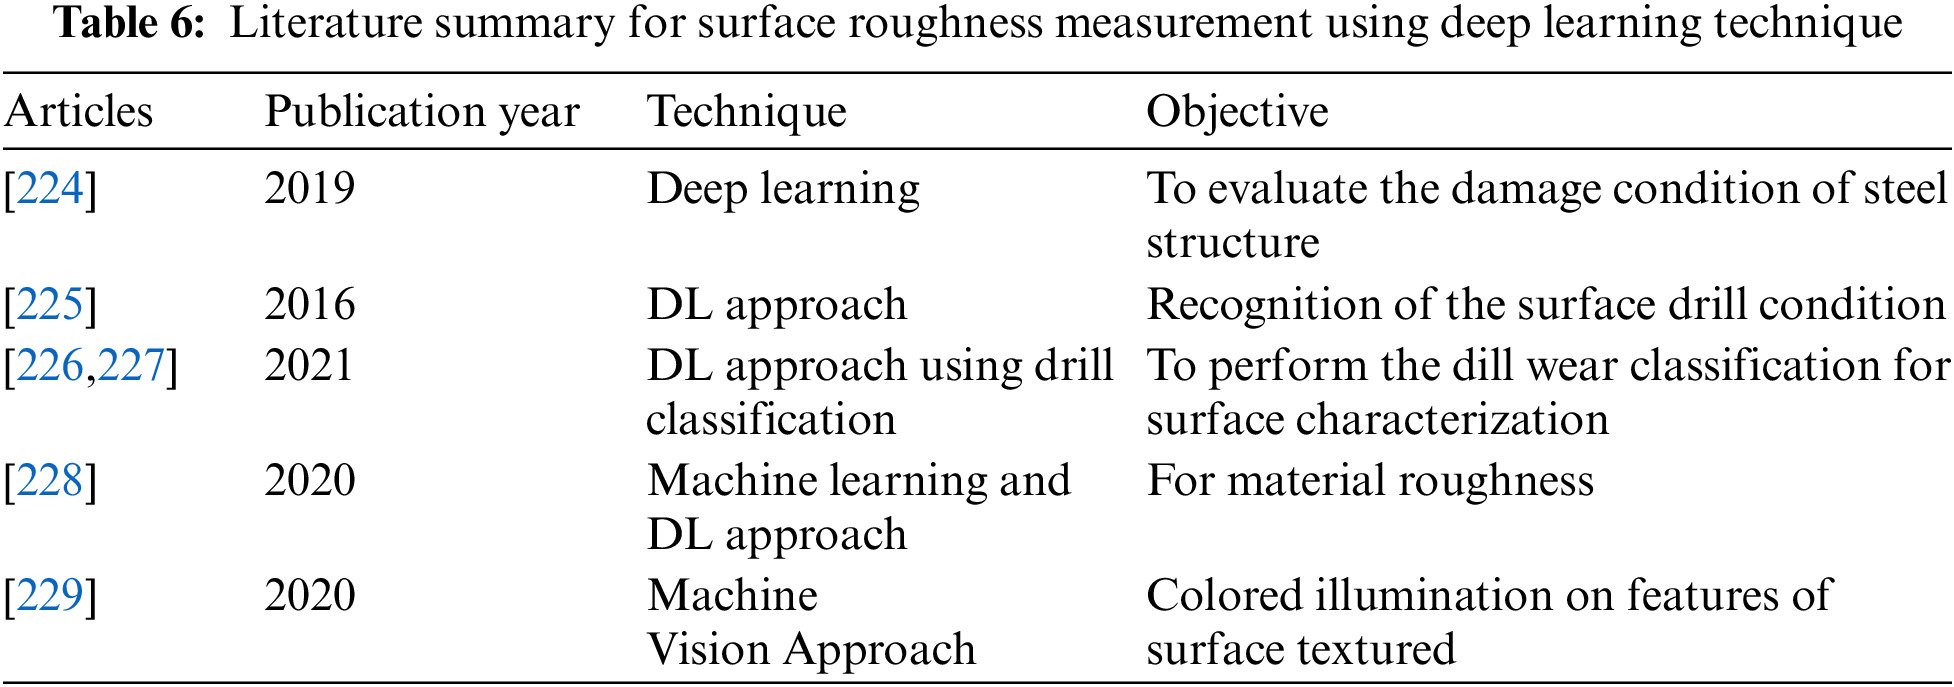
5.2.4 Surface Characteristics Measurement Using Deep Learning (DL) Technique
Ali et al. [230] suggested a deep learning approach based on photographs of die-sink EDM work-piece surfaces acquired by a typical visual computer sensor, which can ensure Ra’s roughness values equivalent to that obtained with a touch profilometer (line profiling method). This allows operators to calculate roughness values in accordance with roughness goals on drawings in a machine-integrated manner. The possibility of characterizing superficial morphology (a key problem when working functional surfaces) and detecting defects given an automated input was also demonstrated in learning-related methods. Table 6 mentions a few of the papers that have worked significantly in machine vision using the Deep Learning technique for surface characterization and surface roughness measurement.
5.3 Surface Characteristics Measurement Using Optical Techniques
Metallic surface characterization is an important problem in developing new products and devices in various industries, from the metallurgical to the medical industry, and understanding fundamental aspects of wave dispersion from rough surfaces [231]. A new optical method for characterizing raw metal surfaces was proposed and experimentally demonstrated. In approach, the effect of surface roughness on the formation of sprinkles in the diffraction plane has been examined. It is that the B/D ratio increases exponentially when surface resistance increases in samples produced with different production processes by analyzing binary speckle patterns. Statistical characteristics of spindles are available in both the image and the diffraction plane. For information on the rough surface, they also suggested a device with a simple experimental set-up and minimal alignment to measure the relative surface roughness of metal surfaces. Even though there are many optical surface ruggedness characteristics with different methods, optical imaging (e.g., microscopic) systems and advanced optical techniques are not required for this proposal.
For surface texture characterization, a view-based system was tried using the grey image approach in [170]. A picture histogram for subsequent investigations was analyzed to improve the picture. This method prevents direct contact with the area to be examined. Scratching is clearly shown on the surface image, and the space between them is apparent in order to examine the texture of the surface easily. Different filters can be implemented to enhance the precision and clarity of the area of interest in order to make more use of this vision-based approach. This graphic can be used in addition to the surface roughness value calculation [203].
Kumar et al. [81] proposed the in-process roughness measurement of a spinning workpiece, a machine vision system using a commercial DSLR camera and sub-pixel edge sensing was created. Photos from nine separate specimens of surface roughness. The calculation used spindle velocities between 0 and 4000 rpm. In comparison with the precision of the parameters of roughness, a style profilometer was employed, whereby a mean difference of 4.6 percent in Ra between the two was found. There was also a strong association with the various dimensions of suitability between the proposed method of vision and the stylus process. The findings demonstrate that the approach proposed is efficient at calculating the roughness at high spindle speeds of a workpiece. In-process roughness calculation this process has major potential for use. The suggested approach offers real-time compared to other non-visual approaches.
Tootooni et al. [232] proposed a system in which measurement of surface ends of turned shafts on location using a CCD camera setup was suggested by Fiedler number (2). First, a simulation study validated the technique, using numerically generated 3D surface profiles with surface roughness (Sq) between 3–30 m (Section 4). The number of Fiedler (2) revealed a steady increase in surface roughness, although not linear. Then tests were performed with machining (OD turning). Two shafts, the first AISI 4340 steel and the other Al 6061, were machined on a lathe of feed ranging from 45 m/rv to 500 m/rev (average area roughness, Sa approximately between 1 and 20 m) in three different conditions along its length with a cutting rate of 256 rpm and a cutting depth of sixty-five m with a cutting tool for carbide. The CCD was taken first when the machine was static (0 rpm) and at two other speeds, 45 and 256 rpm, from the respective shaft zones. The CCD was then used. The Fiedler figure was then calculated less than ten times a second and correlated with offline surface roughness measures in a rational regression setting. The difference between the real surface ruggedness and that estimated at Fiedler is less than 15 percent. When Sa is in the 1–10 m range, there is an error of ±2 m in the mean arithmetic surface ruggedness (Sa). The technique was then discovered to be robust to rotating speed, and it does not need to stop the machine.
A visual-based calculation of the machined surface roughness parameters for online surveillance is defined in [233]. It is concluded that the optical characterization of machined surfaces can be used for this affordable vision device. In order to differentiate between surfaces with varying roughness levels, Parameters obtained from captured images are examined. The ruggedness of the surface has also been shown to influence the vision parameters conclusively.
It is also investigated that ambient light has no marked effect on measuring vision-based parameters during image capture. It is also assumed that the roughness of machined surfaces can be measured successfully using these vision-based parameters. In order to monitor influencing parameters, including rpm, feed, and depth of cuts, if the values of the surface finish are above the permitted levels stored in a device, the machine sends a feedback signal.
Narayanasamy et al. [234] proposed a new camera-based measuring device to conduct high-resolution analyses of technological surfaces. In order to ensure an individual alignment of the image points in the images, the image matching technique involves a non-reflective surface and an odd and non-respecting pattern. However, the preparation of the object’s surface can also overcome these restrictions. In order to have a distinctive pattern on the wall, for example, the surface can be coated in a very thin layer of paint. Therefore, a device will usually calculate any substance (e.g., structural elements, metals). They also developed a two-stage image pipeline like SfM and DIM for the 3D reconstruction of object surfaces. The SfM algorithm is used to estimate the camera’s external orientation and is used by the OpenCV library. The SGM algorithm is used in DIM. To reduce runtime and satisfy real-time criteria, the authors have introduced SGM for GPUs using CUDA’s programming models. The specification of the GPU is also 47.5 times quicker than the pure implementation of the CPU. Further, it modified the roughness parameter Ra to 3D point clouds and examined 18 concrete specimens of varying surface-surface textures to achieve the initial results for the calculation of roughness. A strong linear correlation is observed when comparing Ra values measured by our measuring device and the MTD reference values calculated by the sand patch procedure. Furthermore, more detailed investigations were carried out for a specific specimen to prove the necessity of an area-based calculation of the object surfaces.
Özcan et al. [235] presented a new measuring device based on a camera that allows high-resolution analyses of technological surfaces. The roughness estimate using concrete specimens has been shown as a use case. However, the proposed systems will essentially quantify any surface in the depth of the camera field and hence sharply caught in the photographs. However, to achieve a single pairing of the image points of the pictures, the image-association technique allows the surface to be non-referential, irregular, and non-repetitive. In [236], two methods have been introduced to estimate the concrete SR through the images with sufficient resolution. The first approach used the DIP method to differentiate the coarse aggregate from the cement paste. The second approach, data augmentation, is used to transfer the learning approaches in computer vision to classify the newly acquired images based on predefined images. Both of these applications have been applied using the basic camera approach.
Gharechelou et al. [237] proposed using optical digital camera and photometry techniques to use a basic method for calculating surface roughness. The derived measurements of surface roughness can be used to enhance the modeling of the Remote Sensing Microwave. Researchers more recently attempted to use the inverse models for back-scattering without parametrizing surface roughness, but the approach requires in situ ground moisture estimation and is mostly not valid in the future model because of a lack of evidence.
The viability of machined surfaces’ optical characterization using a cheap visual method has been tested in [238]. In order to differentiate between surfaces with different roughness values, parameters obtained from the representation of the optical spectrum were investigated. To assess the efficacy of the vision findings in discriminatory precision, four of those criteria were chosen. The roughness of the surface has been shown to impair the limits of perception. The values of the CV parameter with low roughness (smooth surfaces) are more correlated than other parameters, and the grey arithmetical average (Ga) is well correlated with the rough surface area. R1 and R2, with all roughness ranges, show a strong association. Nan-Nan et al. [239] proposed an online technique for measuring surface roughness. The roughness of the surface is collected from the light dispersion intensity ratio of the examined surface. The procedure is simply configured with three lasers, two detectors, and a fiber-sensor of multi-wavelength. The technique is efficient for measuring surface roughness and accurately measuring the level of surface purity of particulate-contaminated mirrors. From experimental findings of distinct surface roughness using the grinding standard, it is recognized that surface roughness has a strong linear relationship to the raw area ratio light dispersion intensities. The curve diminishing rate is ten times greater than by using a single wavelength fiber sensor by using a multi-wavelength fiber. Therefore, the relationship curve may differ for surfaces made of different materials.
5.4 Surface Characteristics Measurement Using Laser Speckle Techniques
A final set of laser texture-based textures for elevation characteristics and a comprehensive and detailed texture characterization through confocal microscopy were constructed using various geometries [240]. After initial laboratory parameter optimization (laser power, distance, angle) of objective and subjective setup, speckle patterns were obtained for every texture. Three speckle techniques were applied (contracting method, binary imaging analysis, spot size method) in relation to the usual USIBOR metallic surface roughness measure. A robust correlation was observed for different speckles. Laser texturing is a flexible method for altering metal surfaces’ roughness. Using the Speckle non-contact technique, measurements of roughness may be obtained and correlated by traditional techniques.
In [118], there was a planned and investigated hybrid vision scheme to record laser speckles and scatter pictures simultaneously with two stereo cameras. The formal features of scattering images and texture features are separated and combined with sophisticated signal processing to characterize surface roughness.
Aulbach et al. [76] presented a promising technique, which is easy to execute, and the data collected mostly conform to major patterns to the extent practicable for comparison. A laser source with high-intensity stability is needed to improve the accuracy of the system. The central factor in this method’s configuration is the LCSLM, which explicitly associates the accuracy of the findings with the functionality of this instrument. As discussed previously, the Holoeye PLUTO-VIS modulator used is based on PWM to digital adjustment of liquid crystals. A known problem with PWM schemes is that liquid crystals flicker in a certain grey value spectrum that cannot be removed entirely by external triggers. The amplitude of the flickering stage is linked to the chosen digital series and can be reduced by other digits. The reflectivity of the goals needs to be taken into account, last but not least. Three targets with reflection coefficients nearly equal to the Vnorm estimate are examined in the presented experiments. The effect of the reflectivity must be considered to apply the technique to other materials in the philosophy approach.
Al-Kindi et al. [241] proposed a method of measuring the surface topography without touch and on-site. Laser confocal technology has been developed. With a precision two-axis linear stage and a robotic arm, a laser confocal sensor. The test results indicate that the machine proposed is capable of measuring 0.2–7 μm Ra surfaces, covering a typical spectrum of friction, rotation, and grinding. Relative errors can be managed within 5 percent in this range with linear error compensation. The suggested laser confocal measurement method has the following properties from the above sections:
• High precision calculation accuracy down to 0.2 μm Ra, checked by a stylus profilometer with high precision,
• Calculation of noncontact that prevents potential contamination and sample surface injury,
• Compact architecture that can be integrated for in-situ calculation using a robot or other motion device,
• Three-stage movement control which reduces the robot and positioning vibration Mechanisms of movement, and
• Low-cost architecture relative to the style or optical profilometer desktop system.
In [242], a 3D laser scanning is demonstrated to test the surface roughness of casting surfaces using the PCA flat fitted to point cloud data using a built R software. The findings from this report are as follows:
• Before running surface roughness calculations, different considerations such as shininess, scan machine constraints, depth of view, scan path, and dot density have been studied and understood.
• The study concluded that, after the application of a cut-off filter wavelength, the roughness values specified on the comparator plate had been determined. Based on the absence of wavelength components (availability), The PCA roughness values obtained differed from those of the comparator.
• An independent ‘ACI’ specimen was then created and validated with the recognized ‘C9’ comparator specimen. A correlation curve was used. The surface ruggedness of unknown SCRATA surface texture plates has been quantitatively defined according to satisfactory findings.
• For casting surface, it is apparent that the proposed methodology to approximate roughness by sampling area (Sq), as opposed to traditional methods for calculating roughness based on online sampling, is reliable and has a lower coefficient of variance.
A design to quantify the surface roughness using the speckle images was attempted in [243]. Using the Euclidean and Hamming distances is very promising, and we can use these findings in in-process calculations. For surfaces with identical surface ruggedness values, the difference between Euclidean and Hamming was extremely limited. The use of a broader reference frames database would make online calculation outcomes more efficient. In iris detection, other biometric and wavelet methods can be used in surface estimation.
In [244], the surface roughness quantifying and reconstruction of the thin-walled surface profile of the pieces deposited in the WAAM is suggested by a determination process. The surface roughness calculations are as follows:
• The surface profile is scanned with a laser vision device consisting of a diode laser and a CCD sensor. The points in the world coordination structure are reconstructed using an imaging coordination system by calibrating the camera and the laser plane.
• Any potential cause of the error, including the tangential lens distortion and uncertainties in the image process algorithms for reconstruction accuracy, is discussed. The laser vision sensing approach is shown to be an accurate and cheap method for characterizing the roughness of the surfaces of WAAM deposited components.
In [245], various techniques were used to cover a wide variety of laser-speckle measuring processes, which rely on a single-speckle image processing. Since there are several measurements in any system, more than one calibration relationship must also be obtained to cover a wide variety of the techniques, and more than one detail from the single picture taken from the surface must be retrieved. Each of the data relates to one of these techniques of speckle. The measured data must be calibrated to an acceptable value of surface roughness if the precise information is covered in any calibration connection. Singh et al. [246] presented a computer-based approach for assessing the roughness of the mechanized surfaces of semi-finished goods for vehicle industries to be built and tested experimentally. The laboratory assessment confirms the adequacy of the same moment, the strategy, and the desire to refine the Model of regression for roughness assessment. This is why more work would focus on deriving the model from more samples that are larger, routinely collected, and more representative.
This approach expects to exact and capable of resulting model. Detection of patterns in the roughness value of the commodity that are information for effective process management steps. Moreover, the process optimization can be expanded to include the parameters of the extraction protocol and the algorithm settings of the machine. The online implementation and assessment will also be carried out of the system built in the production context. A water surface can be assembled with a stereo vision device for three-dimensional measurements, as proposed in [247]. A simple understanding of the stereo algorithms and the transition between coordinate frames are essential for successful outcomes. There is also a need for sufficient lighting and surface texture. This method could be suitable for student projects around the disciplines and could include informatics, electrical engineers, or mechanical engineers in ocean technology. Although the findings are for a static camera, more research should look at vessel-based measuring systems [248]. Fig. 44 represents the speckle imaging technique for surface characterization.
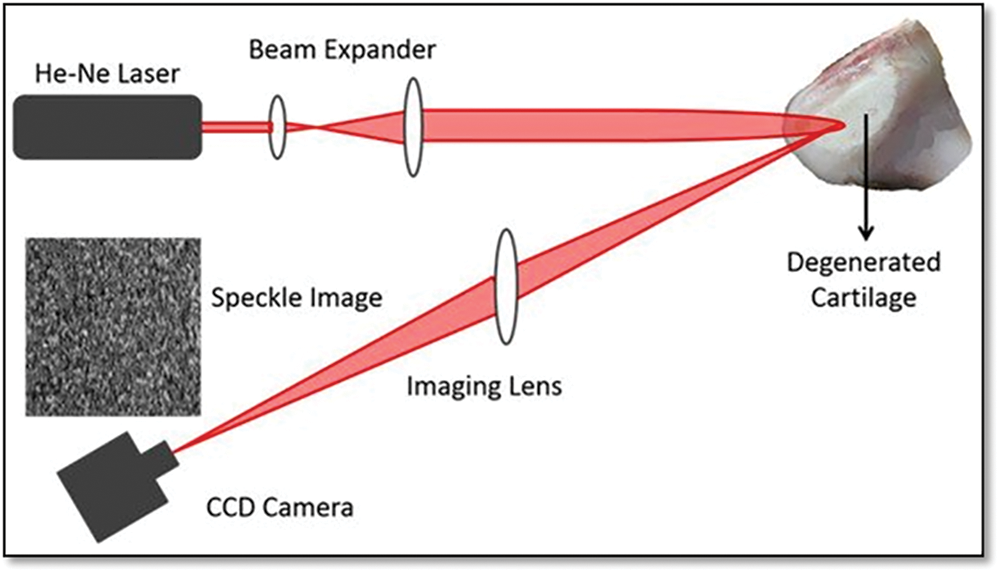
Figure 44: Speckle imaging technique for surface characterization [248]
5.5 Surface Characteristics Measurement Using Atomic Force Microscope (AFM) and Scanning Electron Microscope (SEM) Based Techniques
Hameed et al. [249] proposed that the findings show that employing AFM measurements, the SEM images quantify the ruggedness parameters that are accurate on a wide area and provide an acceptable computational ruggedness parameter compared with AFM measurements. The shift of the SEM image acquisition scale affects little of the contrast surface heights (Sp, Spm, Sv, Svm, St, and Sk), and the samples may relate to the homogeneity of the surface. The impact of using a wide scale on the sample surface can be noted on the Sk parameter’s value, where the value determined using the AFM differs significantly from the values estimated with SEM photographs, which the irregular presence can show.
Chen et al. [250] established a new 3D measuring method focused on a supervised profound learning perspective in AM processes. The main advantage of this approach developed is that the 3D morphology information can be assessed in real-time only by using a single image since the proposed system used the connection between the image pattern and the point cloud to its maximum extent. Furthermore, case studies focused on numerical and real Metal AM parts have demonstrated that the suggested approach produces reliable results with high computer performance. This study has also answered a major problem from the current one, 3D Surface Data Acquisition Methods for Real-time Data Collection Capacity. To sum up, the findings of this analysis indicate that in real-time measurements of AM surface morphology in layers, the proposed approach is very promising. Future analysis and study along these lines, primarily in two ways, will also be very useful. For example, further real-life case studies in the future should be undertaken to further check the efficacy of the proposed approach, particularly actual online layer measurements in AM. Secondly, this approach is also highly useful for the identification of AM processes online.
6 Applications of Surface Characteristics Measurement Using Computer Vision Techniques for Manufacturing Processes
6.1 Surface Characteristics Measurement for Part's Surface Generated by CNC Machining Processes
Research on CNC-making surface consistency for applications using Internet-based diagnostic in-instruments offers an informative case study of principles and methods of equality [251]. The problems of production efficiency with CNC machining are conceptually simple. Each CMM or computer vision laboratory may be done in a CNC laboratory session. The test results include an algorithm that is consistent with the simple vision-based results of roughness characterization for predictive method inspection. The MET 3201 CNC course allows students to define the geometry and the surfaces of a variable and study GD&T (Geometric Dimensioning & Tolerancing) as well as CNC code scripting, CAD/CAD/CAM competencies.
The study of the CNC surface consistency [252] for the use of internet-based noncontact diagnostic instruments gives a case study of principles and methods of E-quality. With CNC machining, the problems with production quality are conceptually simple. Each CMM or computer vision laboratory can be conducted in a CNC laboratory session. The findings of the experiments are in strong harmony with simple visually dependent rugged characterization results of predictive phase inspection algorithms. The MET 316 CNC course has provided students with the skills required to specify the geometry and surface and the CNC code and CAD/CAM skills. The MET 316 CNC Course presented students with the ability to determine the geometry and surface ruggedness for the part and the qualitative power of GD&T (Geometric Dimensioning & Tolerance).
The CNC turning workpiece was used in [184] as a result of a study to detect surface roughness by im-age texture processing, which proposes to detect the material using a non-contact vision system approach. The statistical relation was developed using multiple regression modeling, calculated with a profile meter, between image texture characteristics of machined surfaces and the arithmetic mean deviation (Ra). To evaluate the behavior of the detection model and interpret experimental results, numerous linear and nonlinear regression models were used. Statistical analyses have shown that linear and nonlinear model recognition matches well into a multivariate regression model. In the present research analysis, the efficiency of the linear detection model’s maximal detection error was 2.01% over the nonlinear −9.60% model, which shows enhanced performance characteristics of the linear detection model over the nonlinear model to estimate different statistical rough-surface parameters. From the results, a non-contact method will accurately forecast surface roughness. Experiments have shown that Ra was a minimal relative error and hence the results obtained motivate the proposed amplitude parameter prediction model, namely the size root average roughness (Rq). The method of in-situ camera-based surface characterization of the part surface is generated using CNC machining, as shown in Fig. 45.
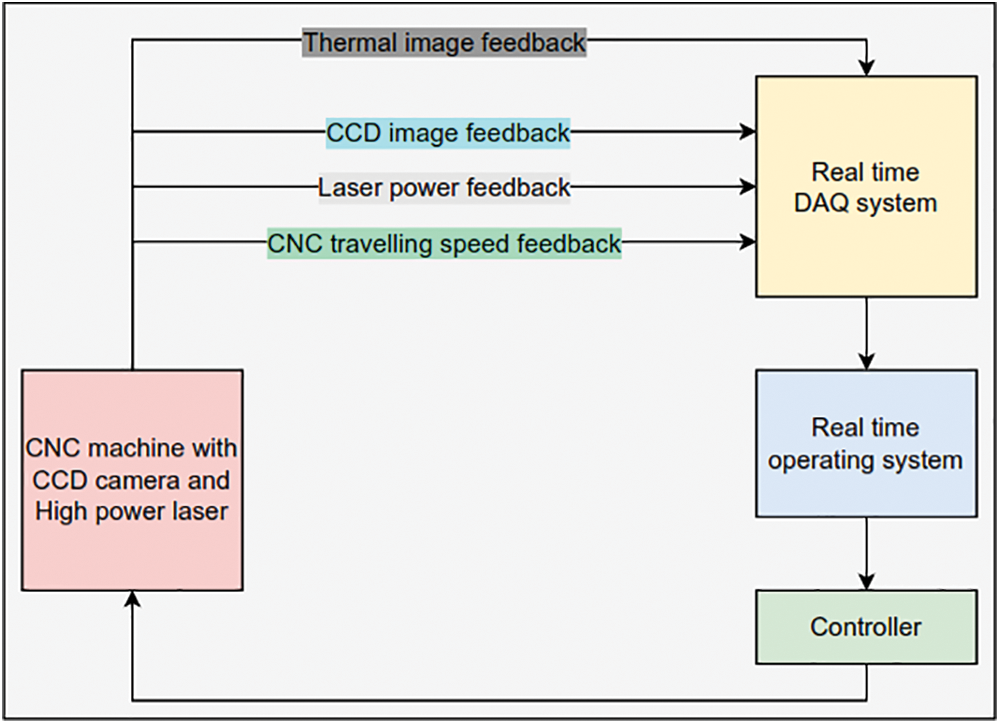
Figure 45: In-situ camera-based surface characterization of the part surface generated using CNC machining
6.2 Surface Characteristics Measurement for Part’s Surface Generated by Other’s Traditional and Non-Traditional Manufacturing Processes
Different pictures of tile and wood flooring are considered in [253] to approximate parameters of roughness, such as average surface roughness (Ra), highest depth (Rv), and square roughness of root mean (Rq). Instead, the Weiner filter produces stronger effects if the sound is linear but not nonlinear, i.e., pulse sound. Thus, an adaptive median filter is used to eliminate the non-linear noise from the bicubic interpolation, which produces a highly improved picture compared to the stretching of contrast. Adaptive medians and bicubic interpolations have a stronger root mean parameter of square roughness (Rq) because they respond to minor changes in surface imperfections. The same result is achieved using the bicubic algorithm, while the contract stretch algorithm has not provided a correct result.
A surface characterization can be studied using texture parameters as presented in [254]. The lighting compensation technique was successful in removing Inhomogeneity with various lighting settings and Various processes in machining. The photos offset healthy correlation with 3D roughness parameters has been shown Uncompensated pictures in contrast. The work, therefore, emphasizes the fact that lighting irregularities support the pattern of texture in the acquired image. Light compared texture parameters in the grinding phase under halogen lighting demonstrated an improved correlation coefficient with 3D surface roughness values. This work characterizes improvements in the texture pattern of the images by second-order, mathematical approaches based on GLCM and GLRLM methods. The experimental findings propose an online measurement technology for the monitoring of machined component surface quality using these methods in the manufacturing setting for faster inspection. This technique can be used as a roughness estimation instrument based on a comparator for quicker surface ruggedness inspections. For texture-based surface evaluation, several other texture parameters may be used.
Sun et al. [102] suggested a smart approach for estimating surface roughness. This new approach includes steps to correct the texture skew, filter images, and define image characteristics. In tandem with the Hough transform, an optimized Sobel operator is used to correct image skew phenomena [255–257]. 2D-DTCWT is used for more efficient pattern recognition preservation functionality. The photos you generated are used to develop a smart model based on ResNet [102]. The conclusion of the approach presented in [86] can be summarized as:
• ResNet has shown that its surface ruggedness assessment approach is successful. The proposed approach is non-contact, without additional surface defects, instead of conventional calculation approaches for measuring surface roughness. This model does not focus on prior experience because of ResNet’s involvement with practical learning.
• Studies in surface friction show the potential way to change the image variabilities is the proposed texture skew corrector process.
• A surface roughness estimate on milled components would verify the effectiveness of the proposed new process. This approach can differentiate between different roughness of the surface and high accuracy grades.
• A filter analysis has shown that the feature networks can be considered as an automated and intelligent manual surface roughness estimate based on reference specimens.
Chang et al. [258] suggested using a non-contact area-based roughness assessment method, which applies digital surface picture transformations on wavelets. The machine efficiency has been evaluated for the flat steel surfaces made of three different methods, forming, grounding, and polishing. The models produced show a close association between the roughness parameters (Ra and Rq) and the significant multiresolution channel characteristics obtained from surface images. Surface methodology response tools have been applied to create adequate polynomial models for the association between important wavelet channels and Ra/Rq values. In order to validate the models’ hypotheses, sequential model building measures and residual checks were performed. The validation process focused on digitalized images, which were historically not used to develop the model, using the projected RSM models to forecast the Ra/Rq value of the specimens. During this survey, they observed that the system’s repetitiveness was stronger than the stylus instrument.
Naresh et al. [143] proposed a study that concluded machining specimens by the use of a stylus probe and machine vision techniques are measured for surface roughness. As a contact-free and accurate technology, the computer vision technique is highly successful for measuring machine specimens. This study further concluded that the technology of vision has average precision and best tolerances.
The study discussed in [259] deals with the online control of the surface during cylindrical rotation. In this study, an online rotated surface control device with computer vision and a digital image phase was introduced for cylindrical rotation. In order to assess the regularity of surface texture and function, the machined surface was analyzed with fractals.
Hameed et al. [249] proposed a stylus roughness test that is used extensively to measure the roughness of turned components. Since turned pieces are axisymmetric, there is a single trace along with the component. Vision-based measuring roughness has some benefits compared to the standard stylus system. Existing vision-based approaches extract data from either a rotating work-piece region or a gray-intensity line scan. Using the simple 2D image on the side of the piece, one can extract a profile that provides precise details on roughness. A standalone vision-based ruggedness tester may be used to assess ruggedness offline or to measure ruggedness on the computer. Vision-based estimation techniques have considerable potential for commercial use due to decreasing costs for cameras and frame captors. However, before this methodology is generally accepted in the industry, a new standard need to be established.
In [260], an examination was carried out for the relationship between GLCM’s texture characteristics and the surface roughness of specimens that are machined by turning operations. The summarized finding of this examination are as follows:
• There has been a found strong association between six texture features (SVAR, SENT, DVAR, ASM, CSH, SAVR) and Ra (correlation coefficient over or equal to 0.9).
• Correlation equations for strongly corresponding texture characteristics were taken from Excel graphs, and calculation equations were obtained to determine the value of Ra from the texture characteristics measured.
• A new Cpp-module has been developed in order to approximate the surface ruggedness of the like specimens with known Ra values using the very correlated texture characteristics.
• The system was tested, and the results revealed that the overall error percentage between the real Ra and the predicted Ra was about 7%.
• The effects of the used vision system may be affected by certain parameters. If these conditions are to change, the machine has to be calibrated to solve this problem. The used vision method will also be used to estimate surface roughness for various machining operations in mass manufacturing.
In [261], statistical software for sample surface roughness assessment was proposed as a form of non-contact to use two process components. The materials chosen have been machined by numerous cutting criteria. The roughness of surface in the CNC frying press. In the preparation of artificial neural networks, the collected surface images were analyzed and used. In MATLAB, a program was developed to assess the roughness of the photographs from Machined surfaces and the application of artificial neural networks. Tests were performed and executed with the following steps:
• Evaluated the binary image matrix in Networks of preparation, black and white lines route.
• Chosen extended parallel in the excess path of these lines. The recognition efficiency of the training network improves in the horizontal direction.
• The best results of 300 to 240 resolutions have been achieved in pictures.
• Log-sigmoid was chosen for the training networks as a transition function, combination gradient scale (SCG) was employed as an algorithm for testing, and the Full number of neurons in training was chosen Network.
• The overall output of the qualified networks of AA 5083 Aluminium was 99.926%, and AISI 1040 steel, on average, 99.932%.
• In comparison with experimental findings obtained in the first photographs, they validated each other at 99.999%.
In Pino et al. [262], by examining the characteristics of the texture picture greyed co-occurrence matrix in the surface speckle pattern, the authors have implemented a surface ruggedness assessed technology. The Gray-Level Co-occurrence matrix includes several texture properties that can be removed. This study examined comparison, correlations, energy, and homogeneity concerning surface ruggedness in the four typical characteristics. It was observed that a shift in the energy function with varying offsets varies between two papers, which quantify the ruggedness of paper by air leak and have very different Bendtsen parameter values. This study claimed that it has to characterize more documentation to validate the process and to figure out what the framework will do.
Abidi et al. [263] proposed a new application for the algorithm of the facet model. It has demonstrated that the paper web’s surface on the wet end can be described with an image improvement algorithm accompanied by topographical descriptions with the facet model (the context subtraction). For the final segmentation of the data, mathematical morphology is then used. Geometric filtering provides well-defined non-uniformities for well-segmented images. Measures are also calculated on position, scale, and structural orientation. The initial work on implementing the facet paradigm in real-time is discussed.
In [264], the methodology and process method used in the prototype design allowed the entire roll calculation to be performed, meter by meter, on the Web paper, in real-time at high speeds. It is possible to improve the current measurement rate of a software prototype by 6 per second and only if the overall roughness is measured by a single Ra or Rq component. The presented online results demonstrate the ability to distinguish between surfaces with very similar roughness and to use the tool in papers and board industries for the micro-level ruggedness calculation. The online and offline experiments provide indications of the precision of the process of the On Top prototype. The real-time surface profile data allow the possibility to extract and quantify surface irregularities and roughness, such as cockling and waviness.
In [265], the findings showed that the current photometric stereo and CMM approach to textural surface measurements are able to quantify the surface roughness of work parts. In addition, the CMM will greatly minimize the light source location errors and increase the calculation precision of the PS device. The pre-test surface roughness varies from 3.2 to 50 μm (Ra), and proper filtering of the measuring result can be carried out to eliminate low-frequency signals. The findings of the inclined angle experiment can be used conveniently to refine the roughness measuring method. The thesis is theoretically useful for improving the precision of the PS system based on metrology. The job can also be used for the measurement of Ra for industrial online measurement. This further study involves characterizing the measuring efficiency and assessing PS system calculation insecurity.
In [266], assessed material surface quality was considered to be an important way to assess the surface quality or standardization in the calculation or study of roughness parameters. In addition, it offers civil engineering practitioners a more precise monitoring instrument for comparing and assessing the surface condition by localization and spatial arrangement, and subdivision of these sites. For example, multiple surface samples of the same material can be provided, and sample roughness patterns can be checked. The construction or environmental conditions like temperature, pressure, and friction have assembled the piece. The proposed instruments provide a new and advantageous perspective for the analysis of surface roughness following the principles outlined in the reference works, which allow local and comprehensive evaluation of surface roughness coefficients while encouraging comparative analysis between different sample surfaces. The study of roughness is critical in the determination of rock surface discontinuities’ shear strength, deformation, and intrusion. Various books illustrate the complexity of data processing using the conventional approach and the propensity to use 3D point clouds in the practical and accurate calculation of surface roughness. As defined in roughness is part of the determination of a surface profile’s shape calculation. The Joint Roughness Coefficient (JRC)) the parameter is used in the sense of rock geo-mechanics. This parameter is determined based on surface geometry and ultimately is a calculation similar to the Ra calculated in this work, which is related to the distance from the point to the surface plane.
In [267], a robust FCM algorithm with non-neighborhood spatial details to measure surface roughness is proposed. The proposed FCM NNS algorithm can explore a surface image aliasing that can solve FCM algorithms’ drawbacks for spatial information in the neighborhood. In particular, a method is suggested for the first time to obtain the relevant initial cluster centers to allow the FCM NNS algorithm to converge quickly to the global optimum. The non-neighborhood space information is obtained from these aliasing images to increase the robustness of the noise and maintain efficient fluid data in aliasing images. The adaptive scale factors μ1, β2 are calculated directly by the noise level of the aliasing picture in the proposed algorithm. The test results show that FCM NNS is very powerful and reliable. The F index depends on the partition matrix to measure surface roughness and use the fluctuating details in clustering results completely. The comparison of roughness evaluation indexes indicates that, while aliasing images are at high levels of noise, this proposed F-figure is closely correlated to surface roughness. For thirty grinding samples, the R2 coefficient is 0.9327. In addition, the value of R2 for an F index based on FCM NNS is higher than that of other indices of roughness, which can check the viability and supremacy of the proposed surface measurement process.
Al-Kindi et al. [241] provided an approach focused on perception to the measurement of surface roughness in micro and nano areas [241,268,269]. The suggested solution offered effective outcomes. Surface roughness parameters, in contrast with styling-based parameters, are achieved with sufficient precision. Nevertheless, the description of these parameters incorporates less susceptible models to changes in local scale, which results in greater precision than other parameters found. In a similar way as in the stylus-based technique, the values derived from the parameters of surface roughness give valid distinct values among the different specimens. The results of micro/nano regions in the proposed approach show no evident im-improvement to the obtained roughness parameter values. In terms of the interaction between a metal and a metal-cavity for micro-nanocyclonic areas, the methodology of the cavity graph is followed clearly. The resulting graphs of the data area of the nano-scale were observed to be steadily changing. This denotes the technique’s ability to capture the macro surface information invisible in micro results. The auto-correlation technique also shows how much vital knowledge is available in nanoscale data concerning regularity and the randomness of the surface texture characteristics. The overall results ensure that the vision data are accurate in determining surface ruggedness. The suggested approach, therefore, promotes further development of techniques for wide-ranging industry applications.
Shahabi et al. [270] recommended a new method of calculation of the object’s surface roughness. This proposed approach was taken from the 3D cognition system of humans, especially the shading of psychological data. The CLS generates shadow images from multi-light sources along with the surface form. The surface ruggedness is derived from shadow photographs by the MRA and graded according to the SOM. The roughness of unknown surfaces can be evaluated by the SOM after studying as a result of simulations. CLS imaging device’s practical uses include squamous cell carcinoma detection. Some traits of this method contain squamous cell carcinoma granular surfaces, uniform white macules, bumps, eroded surfaces, or ulcerative surfaces and surface induration are uniforms. Of particular importance is the coarse-granular form (concavo-convex) of the surface of the mucosa. Thus, the infected sections are diagnosed to assess whether the affected section is cell carcinoma or not by assessing the ruggedness of the mucosa membrane. In order to test this device’s performance, tests based on real carcinoma data are now required.
To obtain sea surface ruggedness measurements from observable pictures based on a novel sea surface random field principle, Pan et al. [271] has introduced a new sea surface picture analysis technique. These algorithms include the grey co-occurrence matrix, the grey co-occurrence matrix, the Tamura texture, the autocorrelation function, the edge frequency, and brownish fractions of movement autocorrelation. Dutta et al. [94] studied the surface properties of generated micro-scaled samples in their surface ruggedness and the use of image processing techniques for analysis of the surfaces. The results of the discrete transformation of waves based on the evaluation of image processing will help increase potential surface texture consistency and optimize the characterization of technological structures. This study shows that computer vision has significant potential as a non-contact step to assess surface ruggedness parameters. The collection and analysis of DWT images imply that this method is useful for determining the roughness of the surface.
In [272], an analysis has been conducted to examine the relationship between GLCM texture features and surface roughness of exemplars machined by rotating operations:
• A strong association was found between six textures (SVAR, SENT, DVAR, ASM, CSH, SAVR) and Ra (coefficient of correlation over or equal to 0.9).
• In the case of graphs drafted by Excel, the correlation coefficients of the strongly correlated texture characteristics were derived, and then the value of Ra was computed from the calculated texture characteristics.
• In order to approximate the surface roughness of comparable specimens with defined Ra values, the new Cpp has been written to use strongly correlated texture characteristics.
In [4], a self-organized polynomial has been developed to model the method of vision measurements for surface roughness. Several experiments on steel S55C have shown that the absolute limit error between vision system-measured surface ruggedness and stylus measured. The tool is less than 11.32%. In other words, the device built with computer vision can efficiently be utilized to calculate the roughness of the surface of this substance in several turning conditions. The direct imaging technique on the shop floor is efficient and simple to use. The objective of the study in [273] is to finish milling. The contours of the peak and valley are visible in 3D reworking, and in contrast with the surface course, the high value varies very little. The characteristics of the fundamental morphology on the end-frying surface will rightly be reflected.
In [182], the relevance of using the acquired data for actual dimensions of surface roughness was examined. The ITC model has shown that the diffuse model uses the hardware required for more accurate measurements. Concerning relative stylus-based parameters, the overall accuracy obtained from all the parameters obtained by using the ITC model, except for the Rsk parameter, is less than 15%, but certain roughness parameters, such as sv, rp, raq, rt and rsm, have shown that they produce close performance. These five parameters were primarily intended to determine aspects of various surface roughness characteristics, including amplitude altitude, amplitude average and distribution, spacing features, and integrated amplitude spacing steps. The calculation of the acquired parameter from the multiple traces of the same pro-file indicated a very small distribution, normally less than 4.5% of its standard deviation from the average. The Sv parameter was the most advantageous parameter that can trustfully be used using the ITC model. Deviated from the Sv parameter using the ITC model by just 0.35% compared to the data acquired from the stylus.
In [274], a new kind of diagram (quasi fractal diagram) was suggested to achieve image ruggedness. The proposed method is not optimum as the selection of criteria for the various phases was made by hand, but for a group of samples of roughness collected using such processing techniques, it must be made only once. A large collection of pictures can also test the algorithms. The collection of box dimension range for the BC3D process and frequency range for the PSD approach was analyzed as further advances. The effect of magnification on almost fractal discrimination parameters and meth will also be examined.
Fu et al. [83] aimed to determine the roughness of milled surfaces using a non-contact vision-based processing tool. At first, a collection of 2-D mounds and white-light pictures were obtained of milled sur-faces. From each surface image, a means and standard deviation of the image pixel intensity were measured with the following steps:
• The similarity between the picture parameters and the design parameters is very weak for white-light imaging. This may be due to the effect of the incidence angle of the light source on the surface leading to the peaks that create shadows in the immediate vicinity.
• The parameters of image strength are very well related to the parameters of the stylus.
• The style parameters for the arithmetical average pitch (Rda), and root average square pitch (Rdque) have been found to correspond well with the picture parameters in Speckle because at different points of the free area, the skyscrapers are responsible for the reflection of lights rays.
• Measurement efficiency can be measured by greater sample size studies.
In [275], one of the technologically easiest and most critical technical parameters that influence the Ra and Rz of surface roughness and depth of material at the defined cutting head feed speeds of the separation of the respective materials is the feeder speed of the cutting head. All the dependencies display an increasing pattern in roughness values. The surface area assessed and evaluated of 0.11–19.91 μm steadily passed from smooth to the rough surface. The smooth zone (characterized by less ruggedness) is increased with the rate of feed decrease. In [157], the following outcomes were inferred from the analysis of the results using the ANOVA procedure and the S/N ratio methodology.
• Experimental design to analyze the problem is suitable and effective.
• Similar results are provided by analysis of the variance methodology and the S/N ratio method.
• The angle of grazing is the light condition that affects the Ga value in terms of both physical and statistical aspects. The next influence factor is the angle of striation.
• For the interactions analyzed in the ga estimate, the grassing angle/angle of striations interaction has the greatest physical importance. There is no physical importance to the rest of the relationships in Ga.
• The mistakes associated with the ANOVA table in relation to the parameters demonstrate a satisfactory consideration of the contributing factors.
• The higher the grazing angle, the smaller the difference of the ga value with the parameter roughness for image analysis through the vision process.
The analysis of photographs may be a reliable way of calculating various textile characteristics [276]. Other measuring systems may make such features as surface strength very difficult. But image processing is specifically concerned with the surface, and this will improve and make surface characteristics such as roughness much more precise. A novel approach based on the scanned image of nonwovens was proposed in this study. A proposed approach focused on the analysis of scanned photographs of nonwovens is proposed in this study. Rs as a criterion means the surface ruggedness determined by the algorithm of the virtual surface profile. This element was strongly associated with the coefficient of friction. Then a new factor, named Rs, which has the effect of the rubbing coefficient, was proposed. This Rs is a decent factor that indicates a light unwoven layer surface roughness factor.
A new strategy for adaptive image improvement is developed by analyzing the image characteristics of the adaptive images in [277]. Firstly, MSRDS segmentation of the base layer of the image. The MSRDS process is then carried out on the base layer section, and the detailed picture is expanded such that the base layer is dynamically comprised.
7.1 Quality Evaluation of Machined Surface
Abellan-Nebot et al. [278] made a review on the AI-based “Machine monitoring system” model; in their review study, they showed the importance of the satisfying quality of surface to makethe machine parts able to perform their flawless functionalities. Therefore, in the last two decades, the development of surface quality monitoring has rapidly increased. The evaluation systems for the surface quality are basically developed on the ‘accurate physical modeling,’ which is lesser competitive as compared to the methods of data-driven, but it is way more expensive [279]. A review study was made by Kurada et al. [280] on the sensors of machine vision to monitor the condition of the tool. They have studied the major instruments, principles, and processing schemes for the production of advanced sensors with respect to the accuracy, spatial resolution, and flexible measurement. In addition to this, Gee et al. [281] developed a patent for the measuring tool for coarse and found materials surfaces’ characteristics by measuring the depolarization degree on the light reflection from the surface. A research study [282] proposed a method for the characterization of surface nature by implementing the computer vision system. They have discussed the lighting and optical principles during their study, conducted the experiments, and verified the feasibility of their methodology.
Cuthbert et al. [283] made a study on the optical assessment of the surface’s texture. They utilized the histogram of grey-level optical “Fourier Transform Pattern” to the surface in order to find out the relatable statistical parameters with the roughness of the surface. They found the parameter R for the optical roughness of the surface and correlated it with the surface roughness of different materials. As a result, they obtained calibration curves of optical roughness for the surface’s finishing measuring up to 0.8 mm. Furthermore, the approach has been shown to be capable of identifying faults on machined surfaces. This methodology provides a quick, non-contact way of assessing the surface roughness of 2D surfaces that most other techniques cannot quantif. Before that, another group of researchers studied the correlation between the roughness measurements and the topography of the surface [284].
7.2 Evaluation of Surface Finish
A fundamental technological hurdle that inhibits firms from adopting additively produced (AM) components is a lack of quality assurance. This is especially true for high-value utilizations the failure of components cannot be accepted. The advancement in process control has enabled substantial advancements in AM methods. As a result, the use of AM methods is accelerating. In contrast to buildup subtractive processes in which monitoring of in-process is ubiquitous, AM techniques need to include monitoring technology that gives room for the detection of discontinuities in the process. Process control advancements have enabled considerable advances in AM methods, significant increases in surface roughness and material characteristics, and a decrease in inter-build variance while the incidence of “embedded material discontinuities” [285]. On-machine surface measuring (OMSM) enables the evaluation of produced surfaces within the time [266]. This study aims to evaluate the most recent OMSM and its utilization in the ultra-precision machining process. The advantages and disadvantages of metrology integration are highlighted. Offline lab-based solutions are migrating toward implementing surface metrology on production ends to improve measurement efficiency and availability [286].
Hashmi et al. have reviewed the various surface finishing techniques, i.e., preprocessing and post-processing techniques, to improve the surface quality [287–289]. They have suggested the measurement of surface roughness using machine vision technique for in-process measurement and optimization of surface roughness of the AM parts [290–292]. Similarly, authors have suggested various simulation and modeling methods to evaluate the surface roughness of machine profiles [293]. Pan et al. [271] had made a study on the in-process and on-machine surface metrology. According to their study, the “machined surface quality” is assessed by the offline procedure employing “mechanical stylus profilers” in typical CNC machining methods. Diversified metallic characteristics considerably influence the workpiece’s mechanical strength, wear resistance, and machinability. Many features are directly tied to the final level, largely dependent on the established production parameters. de Chiffre et al. [294] did this study where they examined the many strategies for quantitatively characterizing the texture of the surface. The study includes traditional 2D and 3D roughness characteristics, with a focus on contemporary international innovations and standards. It introduces new texture characterization ways, including wavelets, fractals, and others, and a brief overview of the new method’s parameters. It is difficult to ensure that some product quality parameters will be satisfied, such as surface roughness. The general manufacturing challenge may achieve a set product quality within the equipment, money, and time restrictions. The study in [294] aimed to present the many approaches and practices used to forecast surface roughness. With manual observation, machining time is measured by the processing noise or overall machining time, according to the ISO 8688 Standards.
“Surface topography can be characterized by geometric parameters, including Ra (i.e., the average of the set of independent measurements of a surface’s peaks and valleys), Rmax (i.e., the maximum height roughness), etc.”
In the study [295], several equipment’s roughness measuring and analysis capabilities were compared. The notion of multi-level contact area and roughness models is given. When applying the theory of image recognition methodologies functioning with 3D digital image processing, surface topography analysis as a spatial pattern is provided. The spatial organization is frequently described qualitatively by means of texture properties such as random, linear, wavy, and so on. Chen et al. [296] mentioned that the wavelet transform is used to examine surfaces created by normal industrial processes. Scientists can use the wavelet transform to connect manufacturing and surface functional elements with the properties of multi-scaling. Wavelet transformations’ key benefits over the other contemporary signal processing algorithms are their “space-frequency localization” and multi-dimensional perspective of signal components.
On the basis of wavelet transformation, the research of Josso et al. [13] provided a novel technique for the analysis of surface roughness and description. Following a brief discussion of wavelet-based approaches used in surface roughness research, the results of the new equipment of analysis known as the “frequency normalized wavelet transform” (FNWT) are given. Gadelmawla et al. [272] said that a vision system was initialized to take photos for the characterization of surfaces. Based on the “grey level co-occurrence matrix,” software has been created to evaluate the collected pictures (GLCM). The GLCMs have been plotted in three dimensions for various collected photos. A new measure termed greatest matrix width is initiated to use as a marker for surface roughness. Niola et al. [297] also did research on the said topic, and according to their research, a pixel in an image only supplies one quantity: the luminance of the associated spot on the object, but a normal vector defines the surface orientation with double degrees of freedom. The amount of brightness is determined by a variety of elements, including the uniformity of the material’s reflecting qualities or its physical continuity and the surface roughness or smoothness. Wavelet transforms outperform Fourier transforms and typical statistical processes in modeling uneven data patterns such as abrupt changes. Similarly, Kumar et al. [173] used regression analysis to measure the machined surfaces’ roughness. For the original photos and the magnified quality upgraded images, a parameter known as Ga was determined using the regression analysis based on the surface image attributes.
In 2007, Al-Kindi et al. [114] conducted research to interpret obtained visual data and compute roughness characteristics; the “Intensity-Topography Compatible” (ITC) model and the model of model Light Diffuse were employed. The skewness parameter (Rsk) yielded significantly different results than the stylus approach. The results demonstrated that the ITC model outperforms the Diffuse Light model. These findings are anticipated to spur more research into practical applications [297]. Al-Kindi et al. [298] conducted another research and gave an assessment of the possibility of gathering “vision-based surface roughness” metrics for samples generated by various machining methods. In the experiment, 20 examples were manufactured utilizing five of the most typical machining procedures. The results revealed that the parameter values obtained from vision data differ significantly from those obtained from stylus data. However, some roughness assessment metrics proved to be more dependable than others. A training model’s input parameters include spatial frequency, standard deviation, and arithmetic mean, of grey levels from a surface picture, with no cutting parameters involved. This research provides a method to develop the link between real texture and surface roughness information that uses an adaptable neuro-fuzzy inference system (ANFIS) [299]. Hu et al. [300] presented a three-dimensional measurement approach for surveying component surface roughness. The following equipment was utilized in the current experiment: a stereomicroscope, a digital camera with a particular parallel light, an interface, an X, Y bidirectional laboratory bench, and a computer. A thorough review of “surface texture metrology” for AM of metal is conducted. The findings of this investigation are organized into parts that focus on specific aspects: industrial sector, AM techniques and materials; surface types explored; surface measuring technology, and surface texture characterization [301]. The study of Fischer et al. [92] showed that the fast “roughness measurements” of >0.08 m2/s on a nanoscale are required for a reliable in-situ evaluation of the surface quality of working rolls. An FPGA-based image processing and a high-speed pulse laser are used to produce a speckle-based measuring technique. In a reconditioning procedure, the quality of surface inspection is confirmed on the rolling wheel to determine instrument roughness distribution and tool wear.
Okamoto et al. [302] mentioned that due to the difficulties of visual inspection during the polishing, complete automation of the polishing procedure had not been realized. A CCD camera placed on a “6-axis controlled robot hand” was used to acquire photos of the polished surface. The measurement of Surface microtopography (e.g., shape, waviness, roughness) is required before assessing components’ surface quality in relation to their applications. An Optical scattered light measuring method is known as Laser speckle-based roughness measurement with a mean of view size of a few square millimeters and frequency measurements within the domain of kilohertz. The results demonstrate a measurement uncertainty ratio compared with fewer than 0.033 nm, mostly confined by shot noise [302]. A study in [126] aims to provide an automated judging mechanism for non-periodic cutter mark patterns. The creation of robot programs for the polishing operations was based on the data of CAD, which was originally proposed in the earlier study. A study provides a cost-effective and modular real-time “AOI system for hot-rolled flat steel.” The picture improvement approach is intended to correct irregular lighting, over-or under-exposure, and other flaws in surface photos. To enhance inspection speed, the suggested algorithms are implemented in parallel on FPGA. The experimental findings demonstrate that the suggested technology is fast and efficient enough for real-world applications in hot-strip producers. Second, the picture improvement approach is intended to compensate for uneven illumination and over-or under-exposure. Based on their wear level, machine learning and computer vision learning might be utilized to evaluate if cutting tools utilized for “edge profile milling” procedures are disposable or serviceable. The suggested technique divides the cutting-edge picture into multiple sections termed Wear Patches (WP), which are then classified as serviceable or worn using texture descriptors. All of the inserts were fragmented, and the cutting edges were trimmed, there were about 577 images of cutting edges: 301 functional and 276 discarded. The optimal “patch division” setup and texture descriptor” for the WP achieve 90.26% of accuracy.
7.3 Inspection of Surface Defects
Most of the methods to inspect surface defects are designed to increase product uniformity and the efficiency of detection, with the goal of gradually replacing or supplementing the inspection with manual methods in the conventional manufacturing lines. JFE Steel JFE TMBP is the manufacturing line for the final product of “Tin Mill Black Plate” (TMBP) and has the greatest operating speed in the world. Sasaki et al. [303] described an autonomous surface inspection system that uses a “Charge Coupled Device” (CCD) scan camera and was placed on a JFE Steel continuous annealing machine. Luo et al. [304] said that with the rising demand for surface quality assurance industrial flat steel manufacture, automated computer-vision-based flaw detection has garnered much attention. In [304], Luo et al. aimed to give a subsequent outlook on surface defect detecting technology. Existing methods are categorized into four types of the algorithms’ nature and picture features: statistical, spectral, machine learning, and model-based.
Hashmi et al. [305] have investigated the surface defects occurs during metal AM process. They have discussed the importance of surface characteristics measurement for metal AM parts. Similarly, Authors have also discussed the importance of machine vision techniques and artificial intelligence (AI) based technique for implementation of intelligent manufacturing [306,307]. Farukh et al. [308–314] have compressively emphasized the importance of compute vision techniques using image processing for various field of engineering applications. These techniques may useful for manufacturing applications i.e., surface characteristics measurement using computer vision techniques.
Gonzalez-Val et al. [315] conducted research and showed that the ConvLBM is an innovative technique for real-time monitoring of Laser-Based Manufacturing operations. It extracts characteristics and quality measures from raw “Medium Wavelength Infrared” coaxial pictures using a Convolutional Neural Network model. The results obtained reflect a milestone in 3D printing of big metal objects as well as quality monitoring of welding procedures. Liu et al. [316] conducted research. According to their study, the chatter frequencies are extremely intricate, have time-variant features, and “multi-frequency/frequency band” are influenced by several parameters throughout the milling process. Because of these qualities, previous chatter detection systems are fragile in actual complicated machining situations. The intricacy of grinding chatter frequency was explored initially in this study. The impact of machining settings and dynamic features of a machine tool on “Grinding Chatter Frequencies” was investigated. The suggested method’s efficacy was effectively validated using grinding procedures, including constant and variable machining. In the year of 2006, Zhang et al. [317] also conducted a study on the grinding and polishing surface product defects. According to them, polishing and grinding are common activities in the industry of material processing. The former method identifies problems into 15 predetermined types based on shape data 30% of the time. Other feature extraction approaches, including as Laws filter bank, DCT filter bank, and Gabor filter bank, were attempted in addition to shape features. The “Support Vector Machine” (SVM) has been installed as a “multi-class classifier” with extracted characteristics as input.
Xie [318] conducted a review study on the advanced surface detections in the year 2008. According to their study, surface defect surveys are broadly classified into two groups. One point of concern with most of the “Visual Surface Inspection” methods is local abnormalities. The other is universal texture and/or color deviation when local texture or pattern is not revealed irregularities. Other imaging data and system acquisition-related concerns are outside the domain of the said survey.
Saini et al. [319] reviewed the effects of cutting parameters on the residual stress, tool wear, and surface roughness. The study looks at how cutting parameters affect the roughness of a surface, residual stress, and tool wear in hard turning. Surface integrity and tool wear are the two most important elements influencing hard turning dependability. In [320], Tapia et al. thoroughly examined the impacts of cutting parameter exactness, tool wear, and residual stress. There is another review study made by Tapia et al. on the metal-additive MP monitoring. According to their study, Additive manufacturing (AM) is a group of latest industrial technologies that provide distinctive capabilities that traditional manufacturing methods cannot match. Metal components’ quality and repeatability continue to be important barriers to their broad adoption as feasible manufacturing techniques. This is especially true in industries with severe part quality standards, such as healthcare and aerospace. According to Neogi et al. [321], a review study, the futuristic vision-based flaw identification and categorization of the surfaces of steel are made. The conventional inspection processes for the manual surface are not sufficient anymore to consistently ensure high-quality surfaces. Work on detecting surface defects on hot strips and bars/rods has also increased during the last ten years. Everton et al. [285] have shown that a fundamental technological hurdle that inhibits firms from adopting additively produced (AM) components is a lack of quality assurance. This is especially true for high-worth implementations where the failure of a component cannot be allowed. The advancement in process control has enabled substantial advancements in AM methods. As a result, the use of AM methods is accelerating. The milling procedure for Inconel-718 reduces the fatigue life of the essential components of the aerospace industry. The system installed to monitor the surface quality based on the acoustic signal’s time frequency is addressed in this research. In order to monitor the roughness of surface exact fault detection, binary clustering has been used, which is a two-step recognition method [322].
8 Conclusion and Directions of Future Research
The technology of machine vision makes use of image data to investigate the component’s quality. The industrial components’ surface quality is considered the crucial quality characteristic from various aspects. Machine vision techniques are used for the surface roughness characterization by making use of the concept that the image is embodied as the 2-D (two dimensional) function of the image intensity, which is characterized by the two parameters: (1) the amount of light that hit of the surface and (2) amount of the light that reflects from the surface. For any components to execute their intended functions and operations, surface quality is considered equally significant to dimensional quality. Surface Roughness (Ra) is a widely recognized measure to evaluate and investigate surface quality. Various conventional methods and approaches to measure the surface roughness be not feasible and appropriate in industries claiming 100% inspection and examination because of the time and efforts involved in performing the measurement. However, Machine vision has emerged as the innovative approach to executing the surface roughness measurement. It can provide economic, automated, quick, and reliable solutions. This article discusses the characterization of the surface texture through a computer/machine vision approach and assessment of the surface roughness on the basis of various machine vision parameters. This paper has also discussed different machine vision techniques to perform the surface characterization measurement. Computer vision techniques can be used for multiple aspects of intelligent manufacturing philosophies. The surface characteristics measured using computer vision techniques, as shown in Fig. 46, may be a promising solution for non-contact type metrology for implementing smart and intelligent manufacturing systems.
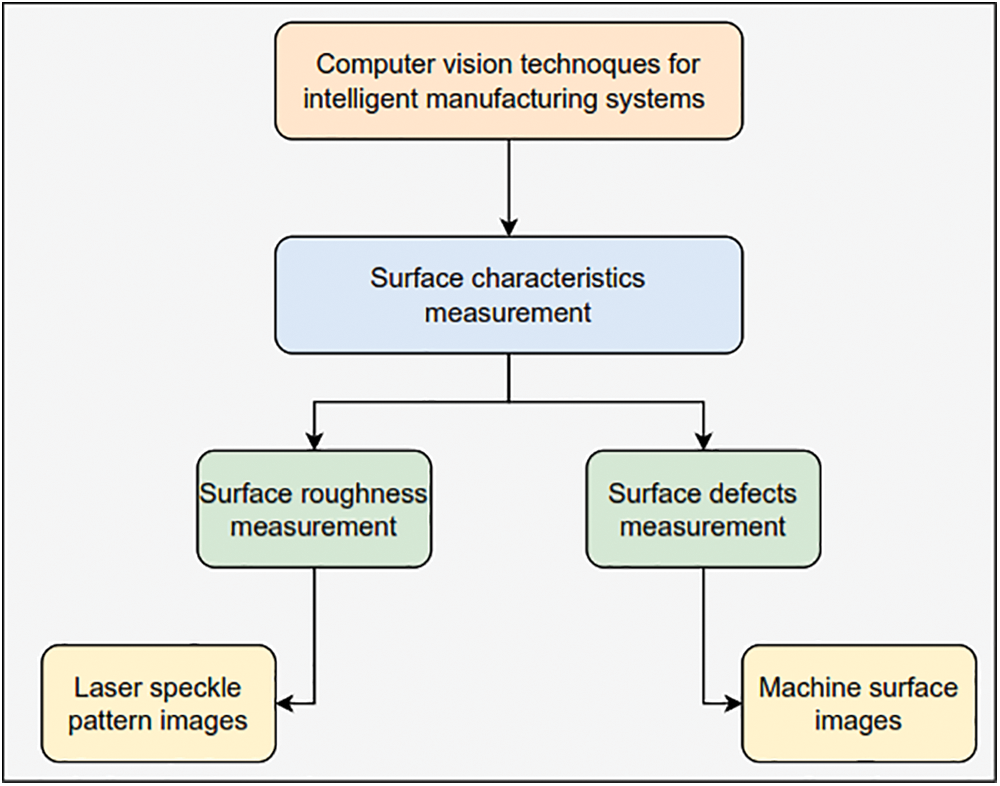
Figure 46: Computer vision techniques for intelligent manufacturing systems
For future work, it is suggested to perform a more in-depth analysis of machining of surface roughness using machine/computer vision as well as image processing. Machine vision has emerged as the innovative approach to executing surface roughness measurement. It is capable of providing economic, automated, quick as well as reliable solutions. There exists very little data on the machined surface roughness using computer vision. From the literature, it has been observed that these new and novel techniques perform well for surface characterization. With more research on machine vision-based systems, surface characterization measurement can be improved. In the three factors below, challenges and opportunities are depicted:
• New problems and opportunities are presented by emerging deep learning techniques and present transition procedures toward smart manufacturing, primarily examined from two perspectives: streaming data processing and imbalanced categorization.
• The computer vision techniques should be implemented using smart sensors in In-situ manufacturing processes.
• The implementation of smart and intelligent manufacturing could be done using computer vision techniques to measure surface characteristics.
• Due to the limited availability of standardized statistics in the early stages of the commercial big data era, a transfer learning-based strategy could be a viable alternative where the dataset contained is insufficient.
• The rising pace with which goods are upgraded in modern industries focuses on short-cycle production with quick response capabilities. On-computer vision equipment’s trial-and-error tests have a significant impact on production.
• The question of how to shorten the time it takes to define parameters for In-situ computer vision algorithms has recently become critical. On-machine data acquisition, validation, and diagnosis platforms based on edge computing and cloud technology should be addressed in detail.
• The computer vision techniques for measuring surface characteristics of additively manufactured parts should be implemented.
• The measurement accuracy should be improved by processing a large set of data using advanced computation methodology, i.e., deep learning technique or big data analytics.
• The following computer vision technique may be implemented for the measurement of surface characteristics of additively manufactured parts, as shown in Fig. 47.
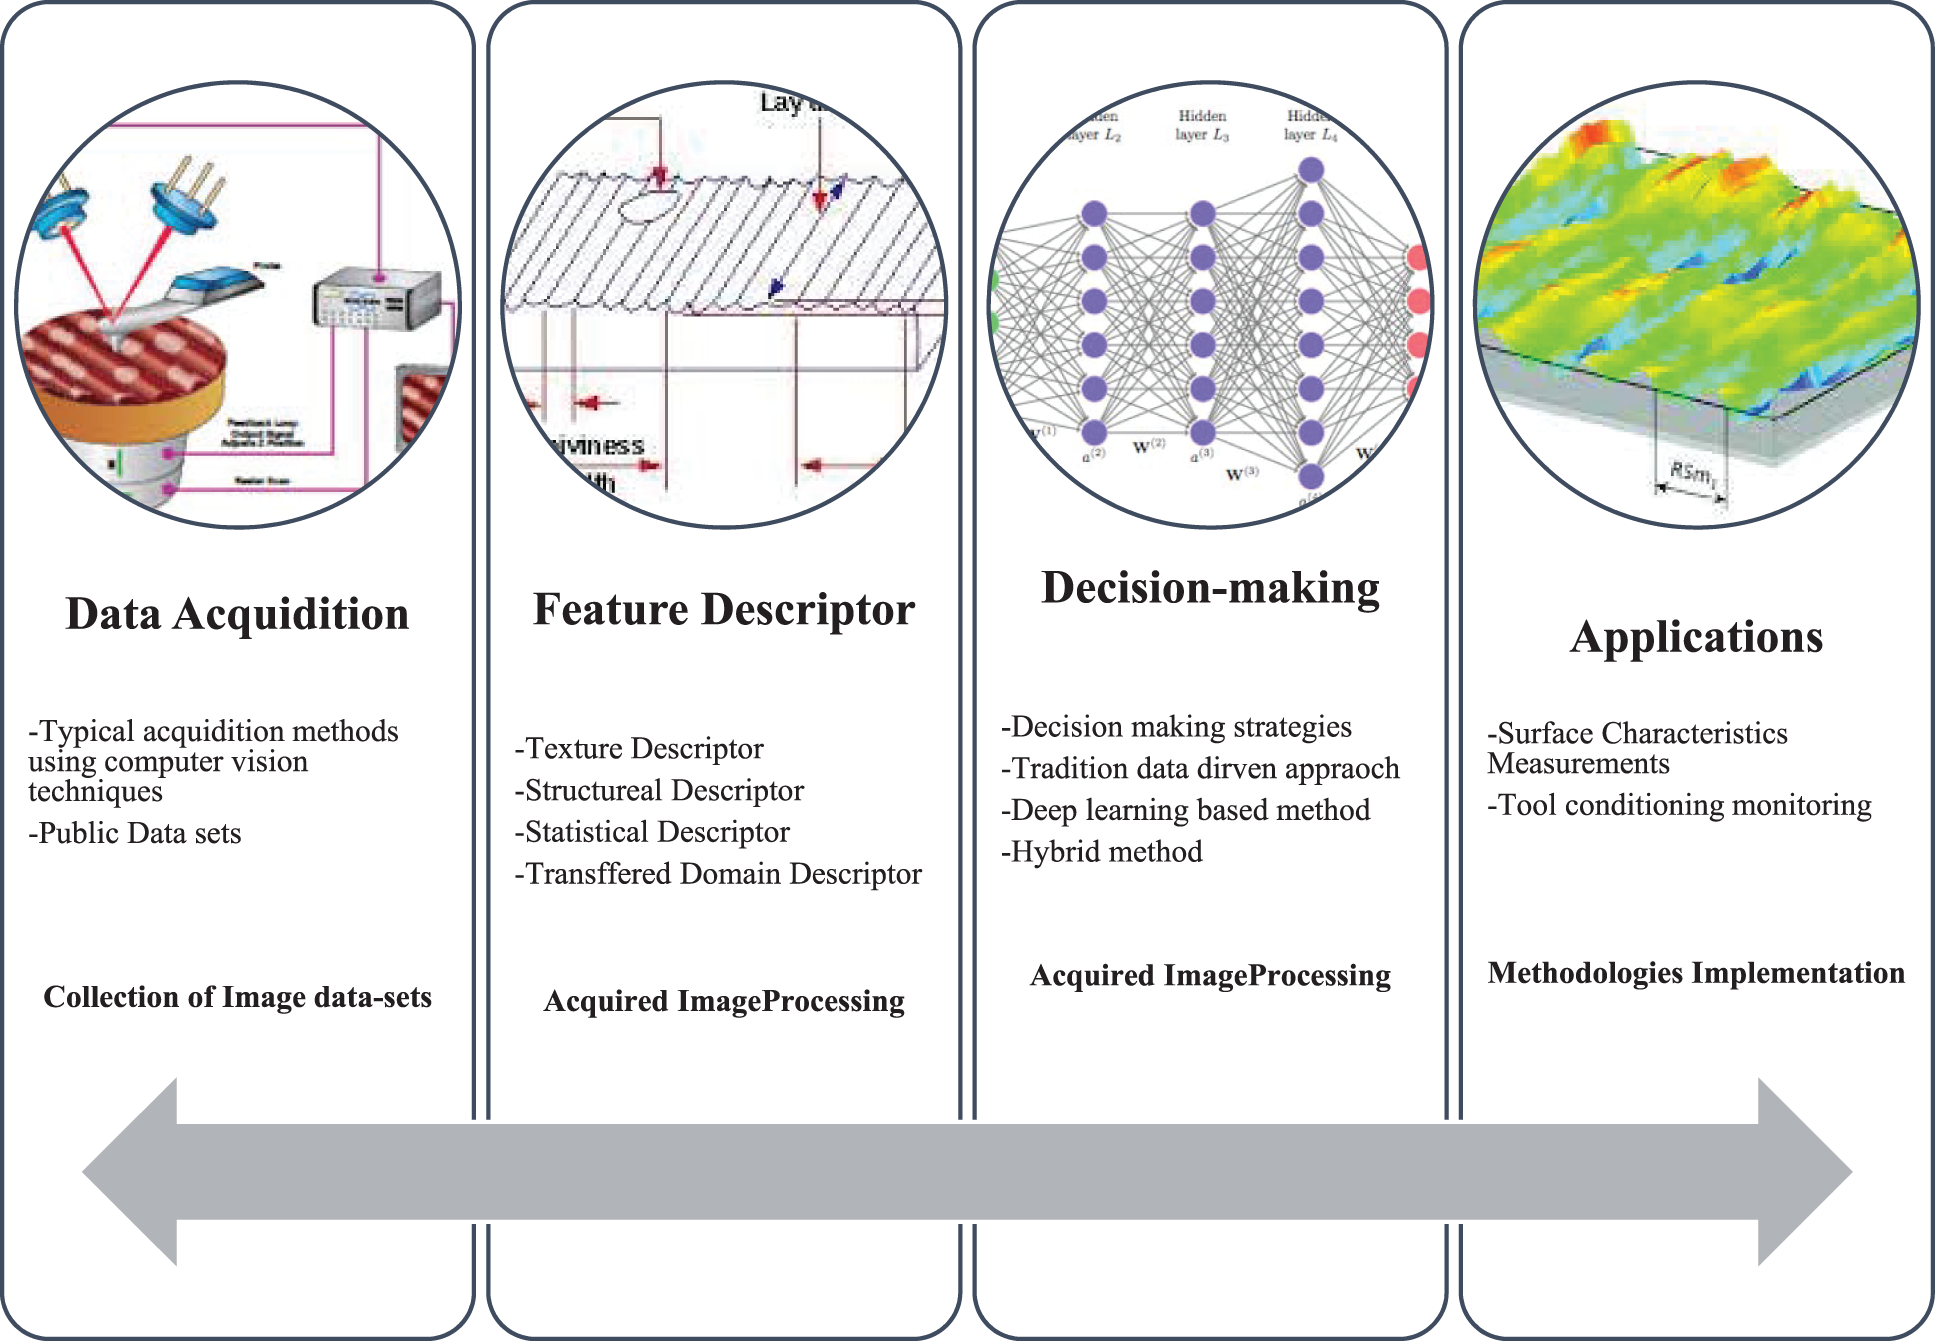
Figure 47: Computer vision techniques for the measurement of surface characteristics of the additively manufactured parts
Funding Statement: The authors would like to thank the Science and Engineering Research Board, Department of Science and Technology, Government of India for supporting this work through the Grant DST-SERB EMR/2016/003372.
Conflicts of Interest: The authors declare that they have no conflicts of interest to report regarding the present study.
References
1. Palani, S., Natarajan, U. (2011). Prediction of surface roughness in CNC end milling by machine vision system using artificial neural network based on 2D Fourier transform. The International Journal of Advanced Manufacturing Technology, 54(9), 1033–1042. DOI 10.1007/s00170-010-3018-3. [Google Scholar] [CrossRef]
2. Joshi, K., Patil, B. (2020). Prediction of surface roughness by machine vision using principal components based regression analysis. Procedia Computer Science, 167, 382–391. DOI 10.1016/j.procs.2020.03.242. [Google Scholar] [CrossRef]
3. Miller, W. S., Zhuang, L., Bottema, J., Wittebrood, A., de Smet, P. et al. (2000). Recent development in aluminium alloys for the automotive industry. Materials Science and Engineering: A, 280(1), 37–49. DOI 10.1016/S0921-5093(99)00653-X. [Google Scholar] [CrossRef]
4. Lee, B. Y., Juan, H., Yu, S. F. (2002). A study of computer vision for measuring surface roughness in the turning process. The International Journal of Advanced Manufacturing Technology, 19(4), 295–301. DOI 10.1007/s001700200038. [Google Scholar] [CrossRef]
5. Risbood, K. A., Dixit, U. S., Sahasrabudhe, A. D. (2003). Prediction of surface roughness and dimensional deviation by measuring cutting forces and vibrations in turning process. Journal of Materials Processing Technology, 132(1–3), 203–214. DOI 10.1016/S0924-0136(02)00920-2. [Google Scholar] [CrossRef]
6. Kiran, M. B., Ramamoorthy, B., Radhakrishnan, V. (1998). Evaluation of surface roughness by vision system. International Journal of Machine Tools and Manufacture, 38(5–6), 685–690. DOI 10.1016/S0890-6955(97)00118-1. [Google Scholar] [CrossRef]
7. Su, R., Wang, Y., Coupland, J., Leach, R. (2017). On tilt and curvature dependent errors and the calibration of coherence scanning interferometry. Optics Express, 25(4), 3297–3310. DOI 10.1364/OE.25.003297. [Google Scholar] [CrossRef]
8. Yilbas, Z., Hasmi, M. S. J. (1999). Surface roughness measurement using an optical system. Journal of Materials Processing Technology, 88(1–3), 10–22. DOI 10.1016/S0924-0136(98)00356-2. [Google Scholar] [CrossRef]
9. Feng, X., Senin, N., Su, R., Ramasamy, S., Leach, R. (2019). Optical measurement of surface topographies with transparent coatings. Optics and Lasers in Engineering, 121, 261–270. DOI 10.1016/j.optlaseng.2019.04.018. [Google Scholar] [CrossRef]
10. Kalpakjian, S., Schmid, S. R. (2009). Manufacturing engineering technology, no. 1989, pp. 661–663. Reading, MA: Addison-Wesley. [Google Scholar]
11. Gadelmawla, E. S., Koura, M. M., Maksoud, T. M., Elewa, I. M., Soliman, H. H. (2002). Roughness parameters. Journal of Materials Processing Technology, 123(1), 133–145. DOI 10.1016/S0924-0136(02)00060-2. [Google Scholar] [CrossRef]
12. Benardos, P. G., Vosniakos, G. C. (2003). Predicting surface roughness in machining: A review. International Journal of Machine Tools and Manufacture, 43(8), 833–844. DOI 10.1016/S0890-6955(03)00059-2. [Google Scholar] [CrossRef]
13. Josso, B., Burton, D. R., Lalor, M. J. (2002). Frequency normalised wavelet transform for surface roughness analysis and characterisation. Wear, 252(5–6), 491–500. DOI 10.1016/S0043-1648(02)00006-6. [Google Scholar] [CrossRef]
14. Lee, B. Y., Tarng, Y. S. (2001). Surface roughness inspection by computer vision in turning operations. International Journal of Machine Tools and Manufacture, 41(9), 1251–1263. DOI 10.1016/S0890-6955(01)00023-2. [Google Scholar] [CrossRef]
15. Balasundaram, M. K., Ratnam, M. M. (2014). In-process measurement of surface roughness using machine vision with sub-pixel edge detection in finish turning. International Journal of Precision Engineering and Manufacturing, 15(11), 2239–2249. DOI 10.1007/s12541-014-0587-3. [Google Scholar] [CrossRef]
16. Whitehouse, D. J. (1997). Surface metrology. Measurement Science and Technology, 8(9), 955. DOI 10.1088/0957-0233/8/9/002. [Google Scholar] [CrossRef]
17. https://www.brainkart.com/article/Direct-instrument-measurements_5853/. [Google Scholar]
18. Abbott, E. J., Firestone, F. A. (1933). Specifying surface quality–A method on accurate measurement and comparison. Mechanical Engineering ASME, 59, 569–572. [Google Scholar]
19. Verma, R. (2010). Characterisation of engineered surfaces (Ph.D. Thesis). The University of North Carolina at Charlotte, USA. [Google Scholar]
20. Mathia, T. G., Pawlus, P., Wieczorowski, M. (2011). Recent trends in surface metrology. Wear, 271(3–4), 494–508. DOI 10.1016/j.wear.2010.06.001. [Google Scholar] [CrossRef]
21. Mikoleizig, G. (2015). Surface roughness measurements of cylindrical gears and bevel gears on gear inspection machines. Gear Technology, 5, 48–55. [Google Scholar]
22. Azevedo, F., Cardoso, J. S., Ferreira, A., Fernandes, T., Moreira, M. et al. (2021). Efficient reactive obstacle avoidance using spirals for escape. Drones, 5(2), 51. DOI 10.3390/drones5020051. [Google Scholar] [CrossRef]
23. Song, J. F., Ma, L., Vorburger, T. V. (2006). The effect of Gaussian filter long wavelength cutoff in topography comparisons and measurements. Proceedings of 2006 American Society of Precision Engineering, Monterey, USA. [Google Scholar]
24. Wieczorowski, M. (2001). Spiral sampling as a fast way of data acquisition in surface topography. International Journal of Machine Tools and Manufacture, 41(13–14), 2017–2022. DOI 10.1016/S0890-6955(01)00066-9. [Google Scholar] [CrossRef]
25. Bennett, J. M. (1992). Recent developments in surface roughness characterization. Measurement Science and Technology, 3(12), 1119. DOI 10.1088/0957-0233/3/12/001. [Google Scholar] [CrossRef]
26. Tiziani, H. J. (1989). Optical methods for precision measurements. Optical and Quantum Electronics, 21(4), 253–282. DOI 10.1007/BF02027299. [Google Scholar] [CrossRef]
27. Leonhardt, K., Rippert, K. H., Tiziani, H. J. (1989). Optical methods of measuring rough surfaces. In: Surface measurement and characterization, vol. 1009, pp. 22–29. SPIE. [Google Scholar]
28. Yoshimizu, Y., Yasuga, H., Iwase, E. (2022). Quantification of visual texture and presentation of intermediate visual texture by spatial mixing. Micromachines, 13(2), 255. DOI 10.3390/mi13020255. [Google Scholar] [CrossRef]
29. Bock, S., Kijatkin, C., Berben, D., Imlau, M. (2019). Absorption and remission characterization of pure, dielectric (nano-) powders using diffuse reflectance spectroscopy: An end-to-end instruction. Applied Sciences, 9(22), 4933. DOI 10.3390/app9224933. [Google Scholar] [CrossRef]
30. El-Agez, T. M., Taya, S. A. (2010). A Fourier ellipsometer using rotating polarizer and analyzer at a speed ratio 1:1. Journal of Sensors, 2010, 706829. DOI 10.1155/2010/706829. [Google Scholar] [CrossRef]
31. Woodford, C. (2021). Interferometers. https://www.explainthatstuff.com/howinterferometerswork.html. [Google Scholar]
32. Tay, C. J., Wang, S. H., Quan, C., Shang, H. M. (2003). In situ surface roughness measurement using a laser scattering method. Optics Communications, 218(1–3), 1–10. DOI 10.1016/S0030-4018(03)01102-7. [Google Scholar] [CrossRef]
33. Wang, S., Tian, Y., Tay, C. J., Quan, C. (2003). Development of a laser-scattering-based probe for on-line measurement of surface roughness. Applied Optics, 42(7), 1318–1324. DOI 10.1364/AO.42.001318. [Google Scholar] [CrossRef]
34. Ali, S. H. (2012). Advanced nanomeasuring techniques for surface characterization. International Scholarly Research Notices, 2012, 859353. DOI 10.5402/2012/859353. [Google Scholar] [CrossRef]
35. Wu, D., Liang, F., Kang, C., Fang, F. (2021). Performance analysis of surface reconstruction algorithms in vertical scanning interferometry based on coherence envelope detection. Micromachines, 12(2), 164. DOI 10.3390/mi12020164. [Google Scholar] [CrossRef]
36. Harasaki, A., Schmit, J., Wyant, J. C. (2000). Improved vertical-scanning interferometry. Applied Optics, 39(13), 2107–2115. DOI 10.1364/AO.39.002107. [Google Scholar] [CrossRef]
37. Bhushan, B., Wyant, J. C., Koliopoulos, C. L. (1985). Measurement of surface topography of magnetic tapes by Mirau interferometry. Applied Optics, 24(10), 1489–1497. DOI 10.1364/AO.24.001489. [Google Scholar] [CrossRef]
38. Greivenkamp, J. E., Bruning, J. H. (1992). Phase shifting interferometers. In: Optical shop testing, pp. 501–598. John Wiley & Sons. https://cir.nii.ac.jp/crid/1571417124944497152#citations_container. [Google Scholar]
39. Denisyuk, Y. N. (1965). On the reproduction of the optical properties of an object by the wave field of its scattered radiation. II. Optics and Spectroscopy, 18, 152. [Google Scholar]
40. Chang, B. J., Alferness, R., Leith, E. N. (1975). Space-invariant achromatic grating interferometers: Theory. Applied Optics, 14(7), 1592–1600. DOI 10.1364/AO.14.001592. [Google Scholar] [CrossRef]
41. Leith, E. N., Swanson, G. J. (1980). Achromatic interferometers for white light optical processing and holography. Applied Optics, 19(4), 638–644. DOI 10.1364/AO.19.000638. [Google Scholar] [CrossRef]
42. Cheng, Y. S., Leith, E. N. (1984). Successive Fourier transformation with an achromatic interferometer. Applied Optics, 23(22), 4029–4033. DOI 10.1364/AO.23.004029. [Google Scholar] [CrossRef]
43. Deck, L., de Groot, P. (1994). High-speed noncontact profiler based on scanning white-light interferometry. Applied Optics, 33(31), 7334–7338. DOI 10.1364/AO.33.007334. [Google Scholar] [CrossRef]
44. Schmit, J., Olszak, A. (2002). High-precision shape measurement by white-light interferometry with real-time scanner error correction. Applied Optics, 41(28), 5943–5950. DOI 10.1364/AO.41.005943. [Google Scholar] [CrossRef]
45. Vorburger, T. V., Rhee, H. G., Renegar, T. B., Song, J. F., Zheng, A. (2007). Comparison of optical and stylus methods for measurement of surface texture. The International Journal of Advanced Manufacturing Technology, 33(1), 110–118. DOI 10.1007/s00170-007-0953-8. [Google Scholar] [CrossRef]
46. Zhu, L., Dong, Y., Li, Z., Zhang, X. (2020). A novel surface recovery algorithm for dual wavelength white led in vertical scanning interferometry (VSI). Sensors, 20(18), 5225. DOI 10.3390/s20185225. [Google Scholar] [CrossRef]
47. Minsky, M. (1988). Memoir on inventing the confocal scanning microscope. Scanning, 10(4), 128–138. DOI 10.1002/sca.4950100403. [Google Scholar] [CrossRef]
48. Darafsheh, A., Limberopoulos, N. I., Derov, J. S., Walker Jr, D. E., Astratov, V. N. (2014). Advantages of microsphere-assisted super-resolution imaging technique over solid immersion lens and confocal microscopies. Applied Physics Letters, 104(6), 061117. DOI 10.1063/1.4864760. [Google Scholar] [CrossRef]
49. Jensen, K. E., Weitz, D. A., Spaepen, F. (2013). Note: A three-dimensional calibration device for the confocal microscope. Review of Scientific Instruments, 84(1), 016108. DOI 10.1063/1.4776672. [Google Scholar] [CrossRef]
50. Schnitzler, L., Finkeldey, M., Hofmann, M. R., Gerhardt, N. C. (2019). Contrast enhancement for topographic imaging in confocal laser scanning microscopy. Applied Sciences, 9(15), 3086. DOI 10.3390/app9153086. [Google Scholar] [CrossRef]
51. Fu, S., Cheng, F., Tjahjowidodo, T., Zhou, Y., Butler, D. (2018). A non-contact measuring system for In-situ surface characterization based on laser confocal microscopy. Sensors, 18(8), 2657. DOI 10.3390/s18082657. [Google Scholar] [CrossRef]
52. Schnars, U., Jüptner, W. P. (2002). Digital recording and numerical reconstruction of holograms. Measurement Science and Technology, 13(9), R85. DOI 10.1088/0957-0233/13/9/201. [Google Scholar] [CrossRef]
53. Maaboud, N., El-Bahrawi, M., Abdel-Aziz, F. (2010). Digital holography in flatness and crack investigation. Metrology and Measurement Systems, 2010(4), 583–588. DOI 10.2478/v10178-010-0047-z. [Google Scholar] [CrossRef]
54. Awatsuji, Y., Koyama, T., Tahara, T., Ito, K., Shimozato, Y. et al. (2009). Parallel optical-path-length-shifting digital holography. Applied Optics, 48(34), H160–H167. DOI 10.1364/AO.48.00H160. [Google Scholar] [CrossRef]
55. Yu, X., Cross, M., Liu, C., Clark, D. C., Haynie, D. T. et al. (2012). Quantitative imaging and measurement of cell–substrate surface deformation by digital holography. Journal of Modern Optics, 59(18), 1591–1598. DOI 10.1080/09500340.2012.729095. [Google Scholar] [CrossRef]
56. Chen, D., Wang, L., Luo, X., Xie, H., Chen, X. (2022). Resolution and contrast enhancement for lensless digital holographic microscopy and its application in biomedicine. Photonics, 9(5), 358. DOI 10.3390/photonics9050358. [Google Scholar] [CrossRef]
57. Vilalta-Clemente, A., Gloystein, K., Frangis, N. (2008). Principles of atomic force microscopy (AFM). Proceedings of Physics of Advanced Materials Winter School, pp. 1–8. Greece. [Google Scholar]
58. Binnig, G., Quate, C. F., Gerber, C. (1986). Atomic force microscope. Physical Review Letters, 56(9), 930. DOI 10.1103/PhysRevLett.56.930. [Google Scholar] [CrossRef]
59. Musumeci, C. (2017). Advanced scanning probe microscopy of graphene and other 2D materials. Crystals, 7(7), 216. DOI 10.3390/cryst7070216. [Google Scholar] [CrossRef]
60. Travers, T., Colin, V. G., Loumaigne, M., Barillé, R., Gindre, D. (2020). Single-particle tracking with scanning non-linear microscopy. Nanomaterials, 10(8), 1519. DOI 10.3390/nano10081519. [Google Scholar] [CrossRef]
61. Rousso, I., Deshpande, A. (2022). Applications of atomic force microscopy in HIV-1 research. Viruses, 14(3), 648. DOI 10.3390/v14030648. [Google Scholar] [CrossRef]
62. Iturri, J., Toca-Herrera, J. L. (2017). Characterization of cell scaffolds by atomic force microscopy. Polymers, 9(8), 383. DOI 10.3390/polym9080383. [Google Scholar] [CrossRef]
63. Nawrocka, A., Piwonski, I., Sauro, S., Porcelli, A., Hardan, L. et al. (2021). Traditional microscopic techniques employed in dental adhesion research—Applications and protocols of specimen preparation. Biosensors, 11(11), 408. DOI 10.3390/bios11110408. [Google Scholar] [CrossRef]
64. Kasperl, S., Hiller, J., Krumm, M. (2009). Computed tomography metrology in industrial research and development. Materials Testing, 51(6), 405–411. DOI 10.3139/120.110053. [Google Scholar] [CrossRef]
65. Andreu, V., Georgi, B., Lettenbauer, H., Yague, J. A. (2009). Analysis of the error sources of a computer tomography machine. 9th International Conference and Exhibition on Laser Metrology and Machine Tool Performance (Lamdamap), pp. 462–471. USA. [Google Scholar]
66. Bartscher, M., Neuschaefer-Rube, U., Waldele, F. (2004). Computed tomography--A highly potential tool for industrial quality control and production near measurements. 8th International Symposium on Measurement and Quality Control in Production, pp. 477–482. Germany. [Google Scholar]
67. Olaret, E., Stancu, I. C., Iovu, H., Serafim, A. (2021). Computed tomography as a characterization tool for engineered scaffolds with biomedical applications. Materials, 14(22), 6763. DOI 10.3390/ma14226763. [Google Scholar] [CrossRef]
68. Bartscher, M., Hilpert, U., Goebbels, J., Weidemann, G. (2007). Enhancement and proof of accuracy of industrial computed tomography (CT) measurements. CIRP Annals, 56(1), 495–498. DOI 10.1016/j.cirp.2007.05.118. [Google Scholar] [CrossRef]
69. Simon, M., Tiseanu, I., Sauerwein, C., Sindel, M., Brodmann, M. et al. (2006). Advanced computed tomography system for the inspection of large aluminium car bodies. European Conference on Non-Destructive Testing, Germany. [Google Scholar]
70. Köhler, D., Kupfer, R., Troschitz, J., Gude, M. (2021). In situ computed tomography—Analysis of a single-lap shear test with clinch points. Materials, 14(8), 1859. DOI 10.3390/ma14081859. [Google Scholar] [CrossRef]
71. Kim, J., Ha, H. P., Kim, K. M., Jhang, K. Y. (2020). Analysis of the influence of surface roughness on measurement of ultrasonic nonlinearity parameter using contact-type transducer. Applied Sciences, 10(23), 8661. DOI 10.3390/app10238661. [Google Scholar] [CrossRef]
72. Jeong, D., Choi, H. S., Choi, Y. J., Jeong, W. (2019). Measuring acoustic roughness of a longitudinal railhead profile using a multi-sensor integration technique. Sensors, 19(7), 1610. DOI 10.3390/s19071610. [Google Scholar] [CrossRef]
73. https://www.europeana.eu/en/item/2020801/dmglib_handler_image_26402023. [Google Scholar]
74. Toulfatzis, A. I., Pantazopoulos, G. A., David, C. N., Sagris, D. S., Paipetis, A. S. (2018). Machinability of eco-friendly lead-free brass alloys: Cutting-force and surface-roughness optimization. Metals, 8(4), 250. DOI 10.3390/met8040250. [Google Scholar] [CrossRef]
75. Abidin, Z. F. Z., Hung, T. J., Zahid, M. N. O. (2019). Portable non-contact surface roughness measuring device. IOP Conference Series: Materials Science and Engineering, 469(1), 012074. DOI 10.1088/1757-899X/469/1/012074. [Google Scholar] [CrossRef]
76. Aulbach, L., Salazar Bloise, F., Lu, M., Koch, A. W. (2017). Non-contact surface roughness measurement by implementation of a spatial light modulator. Sensors, 17(3), 596. DOI 10.3390/s17030596. [Google Scholar] [CrossRef]
77. George, R. M., Palayil Saseendran, S. (2018). Qualitative and quantitative study of existing surface parameters and their correlation to CWS parameters in automobile industry: Surface texture parametric study of CWS (Master Thesis). Halmstad University. [Google Scholar]
78. Shivanna, D. M., Kiran, M. B., Kavitha, S. D. (2014). Evaluation of 3D surface roughness parameters of EDM components using vision system. Procedia Materials Science, 5, 2132–2141. DOI 10.1016/j.mspro.2014.07.416. [Google Scholar] [CrossRef]
79. Lu, E., Liu, J., Gao, R., Yi, H., Wang, W. et al. (2018). Designing indices to measure surface roughness based on the color distribution statistical matrix (CDSM). Tribology International, 122, 96–107. DOI 10.1016/j.triboint.2018.02.033. [Google Scholar] [CrossRef]
80. Chiou, R. Y., Kwon, Y. J., Yang, Y. T., Kizirian, R., Tseng, T. L. B. (2010). Non-contact surface roughness measurement for remote quality control. Proceedings of the ASME 2010 International Manufacturing Science and Engineering Conference, pp. 247–253. Erie, Pennsylvania, USA. [Google Scholar]
81. Kumar, B. M., Ratnam, M. M. (2015). Machine vision method for non-contact measurement of surface roughness of a rotating workpiece. Sensor Review, 5(1), 10–19. DOI 10.1108/SR-01-2014-609. [Google Scholar] [CrossRef]
82. Airaksinen, V. M. (2015). Chapter 15-silicon wafer and thin film measurements. In: Handbook of silicon based MEMS materials and technologies. USA: Matthew Deans. [Google Scholar]
83. Wang, Z. (2020). Review of real-time three-dimensional shape measurement techniques. Measurement, 156, 107624. DOI 10.1016/j.measurement.2020.107624. [Google Scholar] [CrossRef]
84. Stojkic, Z., Culjak, E., Saravanja, L. (2020). 3D Measurement-comparison of CMM and 3D scanner. Proceedings of the 31st DAAAM International Symposium, pp. 21–24. Vienna, Austria. [Google Scholar]
85. Namyoon, K. (2019). Non-scanning interferometry for surface profile and thickness measurement of transparent thin-film using color camera (Ph.D. Thesis). Seoul National University, South Korea. [Google Scholar]
86. Lei, Z., Liu, X., Zhao, L. I., Yang, W., Chen, C. et al. (2019). A rapid measurement method for structured surface in white light interferometry. Journal of Microscopy, 276(3), 118–127. DOI 10.1111/jmi.12843. [Google Scholar] [CrossRef]
87. Yu, W., Sing, S. L., Chua, C. K., Tian, X. (2019). Influence of re-melting on surface roughness and porosity of AlSi10MG parts fabricated by selective laser melting. Journal of Alloys and Compounds, 792, 574–581. DOI 10.1016/j.jallcom.2019.04.017. [Google Scholar] [CrossRef]
88. Liu, X., Song, D., He, X., Wang, Z., Zeng, M. et al. (2019). Quantitative analysis of coal nanopore characteristics using atomic force microscopy. Powder Technology, 346, 332–340. DOI 10.1016/j.powtec.2019.02.027. [Google Scholar] [CrossRef]
89. Dai, G., Xu, L., Hahm, K. (2020). Accurate tip characterization in critical dimension atomic force microscopy. Measurement Science and Technology, 31(7), 074011. DOI 10.1088/1361-6501/ab7fd2. [Google Scholar] [CrossRef]
90. Abdelsalam, D. G., Yasui, T., Ogawa, T., Yao, B. (2017). Surface characterization by the use of digital holography. In: Holographic materials and optical systems. IntechOpen. DOI 10.5772/66082. [Google Scholar] [CrossRef]
91. Nehmetallah, G., Williams, L., Nguyen, T. (2020). Latest advances in single and multiwavelength digital holography and holographic microscopy. In: Augmented reality and its application, pp. 51–78. IntechOpen. DOI 10.5772/intechopen.94382. [Google Scholar] [CrossRef]
92. Fischer, A., Stöbener, D. (2019). In-process roughness quality inspection for metal sheet rolling. CIRP Annals, 68(1), 523–526. DOI 10.1016/j.cirp.2019.04.069. [Google Scholar] [CrossRef]
93. Kwon, O., Kim, H. G., Ham, M. J., Kim, W., Kim, G. H. et al. (2020). A deep neural network for classification of melt-pool images in metal additive manufacturing. Journal of Intelligent Manufacturing, 31(2), 375–386. DOI 10.1007/s10845-018-1451-6. [Google Scholar] [CrossRef]
94. Dutta, S., Datta, A., Chakladar, N. D., Pal, S. K., Mukhopadhyay, S. et al. (2012). Detection of tool condition from the turned surface images using an accurate grey level co-occurrence technique. Precision Engineering, 36(3), 458–466. DOI 10.1016/j.precisioneng.2012.02.004. [Google Scholar] [CrossRef]
95. Al-Kindi, G., Zughaer, H. (2012). An approach to improved CNC machining using vision-based system. Materials and Manufacturing Processes, 27(7), 765–774. DOI 10.1080/10426914.2011.648249. [Google Scholar] [CrossRef]
96. Aminzadeh, M., Kurfess, T. R. (2019). Online quality inspection using Bayesian classification in powder-bed additive manufacturing from high-resolution visual camera images. Journal of Intelligent Manufacturing, 30(6), 2505–2523. DOI 10.1007/s10845-018-1412-0. [Google Scholar] [CrossRef]
97. Wang, Z. R., Zou, Y. F., Zhang, F. (2011). A machine vision approach to tool wear monitoring based on the image of workpiece surface texture. Advanced Materials Research, 154, 412–416. [Google Scholar]
98. García-Holgado, A., Marcos-Pablos, S., García-Peñalvo, F. (2020). Guidelines for performing systematic research projects reviews. International Journal of Interactive Multimedia and Artificial Intelligence, 6(2), 136–144. [Google Scholar]
99. Wohlin, C. (2014). Guidelines for snowballing in systematic literature studies and a replication in software engineering. Proceedings of the 18th International Conference on Evaluation and Assessment in Software Engineering, pp. 1–10. UK. [Google Scholar]
100. Zhang, Y. (2021). Safety management of civil engineering construction based on artificial intelligence and machine vision technology. Advances in Civil Engineering, 2021. DOI 10.1155/2021/3769634. [Google Scholar] [CrossRef]
101. https://www.manufacturingtomorrow.com/article/2020/06/simplifying-ai-deployment-for-quality-inspection/15478/. [Google Scholar]
102. Sun, W., Yao, B., Chen, B., He, Y., Cao, X. et al. (2018). Noncontact surface roughness estimation using 2D complex wavelet enhanced ResNet for intelligent evaluation of milled metal surface quality. Applied Sciences, 8(3), 381. DOI 10.3390/app8030381. [Google Scholar] [CrossRef]
103. Benbarrad, T., Salhaoui, M., Kenitar, S. B., Arioua, M. (2021). Intelligent machine vision model for defective product inspection based on machine learning. Journal of Sensor and Actuator Networks, 10(1), 7. DOI 10.3390/jsan10010007. [Google Scholar] [CrossRef]
104. Pérez, L., Rodríguez, Í., Rodríguez, N., Usamentiaga, R., García, D. F. (2016). Robot guidance using machine vision techniques in industrial environments: A comparative review. Sensors, 16(3), 335. DOI 10.3390/s16030335. [Google Scholar] [CrossRef]
105. DeVoe, D. L., Zhang, G. M. (1993). Optical area-based surface quality assessment for in-process measurement. Technical Research Report. [Google Scholar]
106. Lu, R. S., Li, Y. F., Yu, Q. (2001). On-line measurement of the straightness of seamless steel pipes using machine vision technique. Sensors Actuators A: Physical, 94(1–2), 95–101. DOI 10.1016/S0924-4247(01)00683-5. [Google Scholar] [CrossRef]
107. Lahajnar, F., Pernuš, F., Kovačič, S. (2002). Machine vision system for inspecting electric plates. Computers in Industry, 47(1), 113–122. DOI 10.1016/S0166-3615(01)00134-8. [Google Scholar] [CrossRef]
108. Chen, M. C. (2002). Roundness measurements for discontinuous perimeters via machine visions. Computers in Industry, 47(2), 185–197. DOI 10.1016/S0166-3615(01)00143-9. [Google Scholar] [CrossRef]
109. Derganc, J., Likar, B., Pernuš, F. (2003). A machine vision system for measuring the eccentricity of bearings. Computers in Industry, 50(1), 103–111. DOI 10.1016/S0166-3615(02)00141-0. [Google Scholar] [CrossRef]
110. Wen, Z., Tao, Y. (1999). Building a rule-based machine-vision system for defect inspection on apple sorting and packing lines. Expert Systems with Applications, 16(3), 307–313. DOI 10.1016/S0957-4174(98)00079-7. [Google Scholar] [CrossRef]
111. Broggi, A., Berte, S. (1995). Vision-based road detection in automotive systems: A real-time expectation-driven approach. Journal of Artificial Intelligence Research, 3, 325–348. DOI 10.1613/jair.185. [Google Scholar] [CrossRef]
112. Bertozzi, M., Broggi, A. (1998). GOLD: A parallel real-time stereo vision system for generic obstacle and lane detection. IEEE Transactions on Image Processing, 7(1), 62–81. DOI 10.1109/83.650851. [Google Scholar] [CrossRef]
113. Cho, S., Lee, D. S., Jeong, J. Y. (2002). AE—Automation and emerging technologies: Weed–plant discrimination by machine vision and artificial neural network. Biosystems Engineering, 83(3), 275–280. DOI 10.1006/bioe.2002.0117. [Google Scholar] [CrossRef]
114. Al-Kindi, G. A., Shirinzadeh, B. (2007). An evaluation of surface roughness parameters measurement using vision-based data. International Journal of Machine Tools and Manufacture, 47(3–4), 697–708. DOI 10.1016/j.ijmachtools.2006.04.013. [Google Scholar] [CrossRef]
115. Al-Kindi, G. A., Baul, R. M., Gill, K. F. (1992). An application of machine vision in the automated inspection of engineering surfaces. The International Journal of Production Research, 30(2), 241–253. DOI 10.1080/00207549208942892. [Google Scholar] [CrossRef]
116. Pedersen, K. B. (1990). Wear measurement of cutting tools by computer vision. International Journal of Machine Tools and Manufacture, 30(1), 131–139. DOI 10.1016/0890-6955(90)90047-M. [Google Scholar] [CrossRef]
117. Galante, G., Piacentini, M., Ruisi, V. F. (1991). Surface roughness detection by tool image processing. Wear, 148(2), 211–220. DOI 10.1016/0043-1648(91)90285-3. [Google Scholar] [CrossRef]
118. Narayanan, M. R., Gowri, S., Krishna, M. M. (2007). On line surface roughness measurement using image processing and machine vision. World Congress on Engineering, vol. 2165, no. 1, pp. 645–647. London, UK. [Google Scholar]
119. Tian, G. Y., Lu, R. S. (2006). Hybrid vision system for online measurement of surface roughness. Journal of the Optical Society of America A, 23(12), 3072–3079. DOI 10.1364/JOSAA.23.003072. [Google Scholar] [CrossRef]
120. Zhou, L., Liu, H., Zhuang, X., Liu, D. (2018). Study on brittle graphite surface roughness detection based on gray-level co-occurrence matrix. 2018 3rd International Conference on Mechanical, Control and Computer Engineering (ICMCCE), pp. 273–276. Huhhot, Inner Mongolia, China. [Google Scholar]
121. Koblar, V., Filipič, B. (2021). Evolutionary design of a system for online surface roughness measurements. Mathematics, 9(16), 1904. DOI 10.3390/math9161904. [Google Scholar] [CrossRef]
122. Suresh Kumar, B., Vijayan, V., Paulo Davim, J. (2019). Machine vision in measurement. In: Measurement in machining and tribology, pp. 113–123. Springer, Cham. DOI 10.1007/978-3-030-03822-9_4. [Google Scholar] [CrossRef]
123. Gao, W., Haitjema, H., Fang, F. Z., Leach, R. K., Cheung, C. F. et al. (2019). On-machine and in-process surface metrology for precision manufacturing. CIRP Annals, 68(2), 843–866. DOI 10.1016/j.cirp.2019.05.005. [Google Scholar] [CrossRef]
124. Liu, Y., Guo, L., Gao, H., You, Z., Ye, Y. et al. (2022). Machine vision based condition monitoring and fault diagnosis of machine tools using information from machined surface texture: A review. Mechanical Systems and Signal Processing, 164, 108068. DOI 10.1016/j.ymssp.2021.108068. [Google Scholar] [CrossRef]
125. Rifai, A. P. (2019). Cutting tool parameter identification and machined surface quality inspection based on deep learning for advanced machine tool development (Ph.D. Thesis). Keio University Tokyo, Japan. [Google Scholar]
126. Bulgarevich, D. S., Tsukamoto, S., Kasuya, T., Demura, M., Watanabe, M. (2018). Pattern recognition with machine learning on optical microscopy images of typical metallurgical microstructures. Scientific Reports, 8(1), 1–8. DOI 10.1038/s41598-018-20438-6. [Google Scholar] [CrossRef]
127. Patel, D. R., Kiran, M. B. (2021). Vision based prediction of surface roughness for end milling. Materials Today: Proceedings, 44, 792–796. [Google Scholar]
128. Townsend, A., Pagani, L., Scott, P., Blunt, L. (2017). Areal surface texture data extraction from X-ray computed tomography reconstructions of metal additively manufactured parts. Precision Engineering, 48, 254–264. [Google Scholar]
129. Balamurugan, R., Prakasam, R., Manimaran, C. (2021). Laser speckle computation for the evaluation of surface roughness. AIP Conference Proceedings, 2352(1), 030018. DOI 10.1063/5.0052459. [Google Scholar] [CrossRef]
130. Patzelt, S., Stöbener, D., Fischer, A. (2019). Laser light source limited uncertainty of speckle-based roughness measurements. Applied Optics, 58(23), 6436–6445. DOI 10.1364/AO.58.006436. [Google Scholar] [CrossRef]
131. García-Ordás, M. T., Alegre-Gutiérrez, E., Alaiz-Rodríguez, R., González-Castro, V. (2018). Tool wear monitoring using an online, automatic and low cost system based on local texture. Mechanical Systems and Signal Processing, 112, 98–112. DOI 10.1016/j.ymssp.2018.04.035. [Google Scholar] [CrossRef]
132. Luo, Q., He, Y. (2016). A cost-effective and automatic surface defect inspection system for hot-rolled flat steel. Robotics and Computer-Integrated Manufacturing, 38, 16–30. DOI 10.1016/j.rcim.2015.09.008. [Google Scholar] [CrossRef]
133. Zhang, H., Huang, J., Wang, Y., Liu, R., Huai, X. et al. (2018). Atomic force microscopy for two-dimensional materials: A tutorial review. Optics Communications, 406, 3–17. DOI 10.1016/j.optcom.2017.05.015. [Google Scholar] [CrossRef]
134. Zhao, S., Li, Y., Wang, Y., Ma, Z., Huang, X. (2019). Quantitative study on coal and shale pore structure and surface roughness based on atomic force microscopy and image processing. Fuel, 244, 78–90. DOI 10.1016/j.fuel.2019.02.001. [Google Scholar] [CrossRef]
135. Shinato, K. W., Huang, F., Jin, Y. (2020). Principle and application of atomic force microscopy (AFM) for nanoscale investigation of metal corrosion. Corrosion Reviews, 38(5), 423–432. DOI 10.1515/corrrev-2019-0113. [Google Scholar] [CrossRef]
136. Mwema, F. M., Oladijo, O. P., Sathiaraj, T. S., Akinlabi, E. T. (2018). Atomic force microscopy analysis of surface topography of pure thin aluminum films. Materials Research Express, 5(4), 046416. DOI 10.1088/2053-1591/aabe1b. [Google Scholar] [CrossRef]
137. Papandrea, P. J., Frigieri, E. P., Maia, P. R., Oliveira, L. G., Paiva, A. P. (2020). Surface roughness diagnosis in hard turning using acoustic signals and support vector machine: A PCA-based approach. Applied Acoustics, 159, 107102. DOI 10.1016/j.apacoust.2019.107102. [Google Scholar] [CrossRef]
138. Plaza, E. G., López, P. N. (2017). Surface roughness monitoring by singular spectrum analysis of vibration signals. Mechanical Systems and Signal Processing, 84, 516–530. DOI 10.1016/j.ymssp.2016.06.039. [Google Scholar] [CrossRef]
139. Plaza, E. G., López, P. N. (2018). Application of the wavelet packet transform to vibration signals for surface roughness monitoring in CNC turning operations. Mechanical Systems and Signal Processing, 98, 902–919. DOI 10.1016/j.ymssp.2017.05.028. [Google Scholar] [CrossRef]
140. Pour, M. (2018). Determining surface roughness of machining process types using a hybrid algorithm based on time series analysis and wavelet transform. The International Journal of Advanced Manufacturing Technology, 97(5), 2603–2619. DOI 10.1007/s00170-018-2070-2. [Google Scholar] [CrossRef]
141. Joshi, K., Patil, B. (2020). Evaluation of surface roughness by machine vision using neural networks approach. In: Recent advances in mechanical infrastructure, pp. 25–31. Springer, Singapore. [Google Scholar]
142. Zhu, B., Chen, Z., Hu, F., Dai, X., Wang, L. et al. (2022). Feature extraction and microstructural classification of Hot stamping ultra-high strength steel by machine learning. JOM, 1–12. DOI 10.1007/s11837-022-05265-5. [Google Scholar] [CrossRef]
143. Naresh, P., Hussain, S. A., Durga Prasad, B. (2019). Surface roughness measurement of machined surfaces by machine vision technique. The International Journal of Recent Technology and Engineering, 7, 129–134. [Google Scholar]
144. Baraiya, R., Babbar, A., Jain, V., Gupta, D. (2020). In-situ simultaneous surface finishing using abrasive flow machining via novel fixture. Journal of Manufacturing Processes, 50, 266–278. DOI 10.1016/j.jmapro.2019.12.051. [Google Scholar] [CrossRef]
145. Dresler, N., Inberg, A., Ashkenazi, D., Shacham-Diamand, Y., Stern, A. (2019). Silver electroless finishing of selective laser melting 3D-printed AlSi10Mg artifacts. Metallography, Microstructure, and Analysis, 8(5), 678–692. [Google Scholar]
146. Jeyapoovan, T., Murugan, M. (2013). Surface roughness classification using image processing. Measurement, 46(7), 2065–2072. DOI 10.1016/j.measurement.2013.03.014. [Google Scholar] [CrossRef]
147. Manjunath, K., Tewary, S., Khatri, N., Cheng, K. (2021). Monitoring and predicting the surface generation and surface roughness in ultraprecision machining: A critical review. Machines, 9(12), 369. DOI 10.3390/machines9120369. [Google Scholar] [CrossRef]
148. Ramamoorthy, B., Radhakrishnan, V. (1993). Statistical approaches to surface texture classification. Wear, 167(2), 155–161. DOI 10.1016/0043-1648(93)90320-L. [Google Scholar] [CrossRef]
149. Mannan, M. A., Kassim, A. A., Jing, M. (2000). Application of image and sound analysis techniques to monitor the condition of cutting tools. Pattern Recognition Letters, 21(11), 969–979. DOI 10.1016/S0167-8655(00)00050-7. [Google Scholar] [CrossRef]
150. Kassim, A. A., Mannan, M. A., Jing, M. (2000). Machine tool condition monitoring using workpiece surface texture analysis. Machine Vision and Applications, 11(5), 257–263. DOI 10.1007/s001380050109. [Google Scholar] [CrossRef]
151. Prasad, B. S., Sarcar, M. M. M. (2008). Experimental investigation to predict the condition of cutting tool by surface texture analysis of images of machined surfaces based on amplitude parameters. International Journal of Machining and Machinability of Materials, 4(2–3), 217–236. DOI 10.1504/IJMMM.2008.023206. [Google Scholar] [CrossRef]
152. Zhao, Y. J., Li, H. N., Song, K. C., Yan, Y. H. (2017). In-situ and in-process monitoring of optical glass grinding process based on image processing technique. The International Journal of Advanced Manufacturing Technology, 93(9), 3017–3031. DOI 10.1007/s00170-017-0743-x. [Google Scholar] [CrossRef]
153. Zhang, Y., Fuh, J. Y., Ye, D., Hong, G. S. (2019). In-situ monitoring of laser-based PBF via off-axis vision and image processing approaches. Additive Manufacturing, 25, 263–274. DOI 10.1016/j.addma.2018.10.020. [Google Scholar] [CrossRef]
154. Bradley, C., Wong, Y. S. (2001). Surface texture indicators of tool wear--A machine vision approach. The International Journal of Advanced Manufacturing Technology, 17(6), 435–443. DOI 10.1007/s001700170161. [Google Scholar] [CrossRef]
155. Gadelmawla, E. S. (2004). A vision system for surface roughness characterization using the gray level co-occurrence matrix. NDT & E International, 37(7), 577–588. DOI 10.1016/j.ndteint.2004.03.004. [Google Scholar] [CrossRef]
156. Elango, V., Karunamoorthy, L. (2008). Effect of lighting conditions in the study of surface roughness by machine vision--An experimental design approach. The International Journal of Advanced Manufacturing Technology, 37(1), 92–103. DOI 10.1007/s00170-007-0942-y. [Google Scholar] [CrossRef]
157. Ashour, M. W., Khalid, F., Halin, A. A., Abdullah, L. N. (2015). Machining process classification using PCA reduced histogram features and the support vector machine. 2015 IEEE International Conference on Signal and Image Processing Applications (ICSIPA), pp. 414–418. Malaysia. [Google Scholar]
158. Zhang, Y., You, D., Gao, X., Wang, C., Li, Y. et al. (2020). Real-time monitoring of high-power disk laser welding statuses based on deep learning framework. Journal of Intelligent Manufacturing, 31(4), 799–814. DOI 10.1007/s10845-019-01477-w. [Google Scholar] [CrossRef]
159. Bhat, N. N., Dutta, S., Vashisth, T., Pal, S., Pal, S. K. et al. (2016). Tool condition monitoring by SVM classification of machined surface images in turning. The International Journal of Advanced Manufacturing Technology, 83(9), 1487–1502. DOI 10.1007/s00170-015-7441-3. [Google Scholar] [CrossRef]
160. Dutta, S., Pal, S. K., Sen, R. (2016). On-machine tool prediction of flank wear from machined surface images using texture analyses and support vector regression. Precision Engineering, 43, 34–42. DOI 10.1016/j.precisioneng.2015.06.007. [Google Scholar] [CrossRef]
161. Bhat, N. N., Dutta, S., Pal, S. K., Pal, S. (2016). Tool condition classification in turning process using hidden markov model based on texture analysis of machined surface images. Measurement, 90, 500–509. DOI 10.1016/j.measurement.2016.05.022. [Google Scholar] [CrossRef]
162. Tsa, D. M., Wu, S. K. (2000). Automated surface inspection using Gabor filters. The International Journal of Advanced Manufacturing Technology, 16(7), 474–482. DOI 10.1007/s001700070055. [Google Scholar] [CrossRef]
163. Josso, B., Burton, D. R., Lalor, M. J. (2001). Wavelet strategy for surface roughness analysis and characterisation. Computer Methods in Applied Mechanics and Engineering, 191(8–10), 829–842. DOI 10.1016/S0045-7825(01)00292-4. [Google Scholar] [CrossRef]
164. Bharati, M. H., Liu, J. J., MacGregor, J. F. (2004). Image texture analysis: Methods and comparisons. Chemometrics and Intelligent Laboratory Systems, 72(1), 57–71. DOI 10.1016/j.chemolab.2004.02.005. [Google Scholar] [CrossRef]
165. Stachowiak, G. P., Podsiadlo, P., Stachowiak, G. W. (2005). A comparison of texture feature extraction methods for machine condition monitoring and failure analysis. Tribology Letters, 20(2), 133–147. DOI 10.1007/s11249-005-8303-1. [Google Scholar] [CrossRef]
166. Dutta, S., Pal, S. K., Sen, R. (2018). Progressive tool condition monitoring of end milling from machined surface images. Proceedings of the Institution of Mechanical Engineers, Part B: Journal of Engineering Manufacture, 232(2), 251–266. DOI 10.1177/0954405416640417. [Google Scholar] [CrossRef]
167. Lei, N., Soshi, M. (2017). Vision-based system for chatter identification and process optimization in high-speed milling. The International Journal of Advanced Manufacturing Technology, 89(9), 2757–2769. DOI 10.1007/s00170-016-9770-2. [Google Scholar] [CrossRef]
168. Nammi, S., Ramamoorthy, B. (2014). Effect of surface lay in the surface roughness evaluation using machine vision. Optik, 125(15), 3954–3960. DOI 10.1016/j.ijleo.2014.01.152. [Google Scholar] [CrossRef]
169. Manjunatha, R., Rajaprakash, R., Naveen, B., Mohan, G. (2017). Evaluation of surface roughness of machined components using machine vision technique. International Journal of Engineering Development and Research, 5, 1256–1263. [Google Scholar]
170. Srivani, A., Xavior, M. A. (2014). Investigation of surface texture using image processing techniques. Procedia Engineering, 97, 1943–1947. DOI 10.1016/j.proeng.2014.12.348. [Google Scholar] [CrossRef]
171. Zhang, Z., Chen, Z., Shi, J., Ma, R., Jia, F. (2009). A neural network-based machine vision method for surface roughness measurement. 2009 International Conference on Mechatronics and Automation, pp. 3293–3297. China. [Google Scholar]
172. Yao, S. L., Jin, J. H., Wang, Y. X. (2016). Design of surface roughness measuring system based on machine vision. International Journal of Innovation Management, 3(4), 2350–0557. [Google Scholar]
173. Kumar, R., Kulashekar, P., Dhanasekar, B., Ramamoorthy, B. (2005). Application of digital image magnification for surface roughness evaluation using machine vision. International Journal of Machine Tools and Manufacture, 45(2), 228–234. DOI 10.1016/j.ijmachtools.2004.07.001. [Google Scholar] [CrossRef]
174. Patel, D. R., Kiran, M. B., Vakharia, V. (2020). Modeling and prediction of surface roughness using multiple regressions: A noncontact approach. Engineering Reports, 2(2), e12119. DOI 10.1002/eng2.12119. [Google Scholar] [CrossRef]
175. Elhamshary, N., Abouelatta, O. B. S., Amar, I. M. I. E., Gadelmawla, E. S. (2020). Surface roughness measurement using light sectioning method and computer vision techniques. Mansoura Engineering Journal, 29(1), 13–24. DOI 10.21608/bfemu.2020.132820. [Google Scholar] [CrossRef]
176. Suhail, S. M., Ali, J. M., Jailani, H. S., Murugan, M. (2018). Vision based system for surface roughness characterisation of milled surfaces using speckle line images. IOP Conference Series: Materials Science and Engineering, 402(1), 012054. [Google Scholar]
177. Kamguem, R., Tahan, S. A., Songmene, V. (2013). Evaluation of machined part surface roughness using image texture gradient factor. International Journal of Precision Engineering and Manufacturing, 14(2), 183–190. DOI 10.1007/s12541-013-0026-x. [Google Scholar] [CrossRef]
178. Chethan, Y. D., Ravindra, H. V., Kumar, S. B. (2015). Machine vision for tool status monitoring in turning inconel 718 using blob analysis. Materials Today: Proceedings, 2(4–5), 1841–1848. [Google Scholar]
179. Nithyanantham, N., Suresh, P. (2016). Evaluation of cast iron surface roughness using image processing and machine vision system. ARPN Journal of Engineering and Applied Sciences, 11, 1111–1116. [Google Scholar]
180. Patel, D. R., Kiran, M. B. (2020). A non-contact approach for surface roughness prediction in CNC turning using a linear regression model. Materials Today: Proceedings, 26, 350–355. [Google Scholar]
181. Dhanapalan, N., Thanigaiyarasu, G., Vani, K. (2014). Prediction of surface roughness of 6061 aluminium alloy end milling: A machine vision approach. International Journal of Machining and Machinability of Materials, 16(3–4), 285–302. DOI 10.1504/IJMMM.2014.067309. [Google Scholar] [CrossRef]
182. Arunachalam, N., Ramamoorthy, B. (2006). Vision based surface roughness evaluation of ground components using wavelet transform and neural network. 18th IMEKO World Congress 2006: Metrology for a Sustainable Development, pp. 2381–2385. Rio de Janeiro, Brazil. [Google Scholar]
183. Radha Krishnan, B., Vijayan, V., Parameshwaran Pillai, T., Sathish, T. (2019). Influence of surface roughness in turning process—An analysis using artificial neural network. Transactions of the Canadian Society for Mechanical Engineering, 43(4), 509–514. DOI 10.1139/tcsme-2018-0255. [Google Scholar] [CrossRef]
184. Sanjeevi, R., Nagaraja, R., Krishnan, B. R. (2020). Vision-based surface roughness accuracy prediction in the CNC milling process (Al6061) using ANN. Materials Science, 2214, 7853. [Google Scholar]
185. Cuka, B., Cho, M., Kim, D. W. (2018). Vision-based surface roughness evaluation system for end milling. International Journal of Computer Integrated Manufacturing, 31(8), 727–738. DOI 10.1080/0951192X.2017.1407451. [Google Scholar] [CrossRef]
186. Joshi, R. A., Helambe, S. N. (2019). Machine vision-based surface roughness detection system. International Journal for Research in Engineering Application & Management, 25–28. DOI 10.18231/2454-9150.2018.086. [Google Scholar] [CrossRef]
187. Akbari, A. A., Fard, A. M., Chegini, A. G. (2006). An effective image based surface roughness estimation approach using neural network. 2006 World Automation Congress, pp. 1–6. Budapest, Hungary. [Google Scholar]
188. Yang, S. H., Natarajan, U., Sekar, M., Palani, S. (2010). Prediction of surface roughness in turning operations by computer vision using neural network trained by differential evolution algorithm. The International Journal of Advanced Manufacturing Technology, 51(9), 965–971. DOI 10.1007/s00170-010-2668-5. [Google Scholar] [CrossRef]
189. Morala Argüello, P., Barreiro García, J., Alegre Gutiérrez, E., González Castro, V. (2009). Application of textural descriptors for the evaluation of surface roughness class in the machining of metals. 3rd Manufacturing Engineering Society International Conference (MESIC-09), pp. 833–839. Alcoy, Spain. [Google Scholar]
190. Newton, N., Schafer, D. (2021). Day-by-day math thinking routines in fifth grade: 40 weeks of quick prompts and activities. DOI 10.4324/9781003022930. [Google Scholar] [CrossRef]
191. Alegre, E., Barreiro, J., Castejón, M., Suarez, S. (2008). Computer vision and classification techniques on the surface finish control in machining processes. International Conference Image Analysis and Recognition, pp. 1101–1110. Berlin, Heidelberg. [Google Scholar]
192. Koura, O. M., Sayed, T. H. (2015). Prediction of surface roughness and feed force in milling for some materials at high speeds. American Journal of Mechanical Engineering, 3(1), 1–6. DOI 10.12691/ajme-3-1-1. [Google Scholar] [CrossRef]
193. Khorasani, A. M., Yazdi, M. R. S., Safizadeh, M. S. (2012). Analysis of machining parameters effects on surface roughness: A review. International Journal of Computational Materials Science and Surface Engineering, 5(1), 68–84. DOI 10.1504/IJCMSSE.2012.049055. [Google Scholar] [CrossRef]
194. Wu, T. Y., Lei, K. W. (2019). Prediction of surface roughness in milling process using vibration signal analysis and artificial neural network. The International Journal of Advanced Manufacturing Technology, 102(1), 305–314. [Google Scholar]
195. Beemaraj, R. K., Chandra Sekar, M. S., Vijayan, V. (2020). Computer vision measurement and optimization of surface roughness using soft computing approaches. Transactions of the Institute of Measurement and Control, 42(13), 2475–2481. DOI 10.1177/0142331220916056. [Google Scholar] [CrossRef]
196. Chen, W., Zou, B., Li, Y., Huang, C. (2021). A study of a rapid method for detecting the machined surface roughness. The International Journal of Advanced Manufacturing Technology, 117(9), 3115–3127. DOI 10.1007/s00170-021-07733-9. [Google Scholar] [CrossRef]
197. Cai, Y., Liu, Z., Shi, Z., Song, Q., Wan, Y. (2016). Influence of machined surface roughness on thrust performance of micro-nozzle manufactured by micro-milling. Experimental Thermal and Fluid Science, 77, 295–305. DOI 10.1016/j.expthermflusci.2016.05.004. [Google Scholar] [CrossRef]
198. Chethan, Y. D., Ravindra, H. V. (2018). Machined surface monitoring in turning using histogram analysis by machine vision. Materials Today: Proceedings, 5(2), 7775–7781. [Google Scholar]
199. Ho, S. Y., Lee, K. C., Chen, S. S., Ho, S. J. (2002). Accurate modeling and prediction of surface roughness by computer vision in turning operations using an adaptive neuro-fuzzy inference system. International Journal of Machine Tools and Manufacture, 42(13), 1441–1446. DOI 10.1016/S0890-6955(02)00078-0. [Google Scholar] [CrossRef]
200. Bhandari, B., Park, G. (2021). Noncontact surface roughness evaluation of milling surface using CNN-deep learning models. https://doi.org/10.21203/rs.3.rs-246947/v1. [Google Scholar]
201. Eser, A., Aşkar Ayyıldız, E., Ayyıldız, M., Kara, F. (2021). Artificial intelligence-based surface roughness estimation modelling for milling of AA6061 alloy. Advances in Materials Science and Engineering, 2021, 1–10. DOI 10.1155/2021/5576600. [Google Scholar] [CrossRef]
202. Rifai, A. P., Fukuda, R., Aoyama, H. (2019). Surface roughness estimation and chatter vibration identification using vision-based deep learning. Journal of the Japan Society for Precision Engineering, 85(7), 658–666. DOI 10.2493/jjspe.85.658. [Google Scholar] [CrossRef]
203. Vishwanatha, J. S., Pai, P. S. (2018). Modelling and prediction of surface roughness in Ti-6Al-4V turned surfaces: Use of DTCWT image fusion and GLCM. IOP Conference Series: Materials Science and Engineering, 376(1), 012133. DOI 10.1088/1757-899X/376/1/012133. [Google Scholar] [CrossRef]
204. Nguyen, D., Yin, S., Tang, Q., Son, P. X. (2019). Online monitoring of surface roughness and grinding wheel wear when grinding Ti-6Al-4V titanium alloy using ANFIS-GPR hybrid algorithm and Taguchi analysis. Precision Engineering, 55, 275–292. DOI 10.1016/j.precisioneng.2018.09.018. [Google Scholar] [CrossRef]
205. Zhang, H., Liu, J., Chen, L., Chen, N., Yang, X. (2019). Fuzzy clustering algorithm with non-neighborhood spatial information for surface roughness measurement based on the reflected aliasing images. Sensors, 19(15), 3285. DOI 10.3390/s19153285. [Google Scholar] [CrossRef]
206. Simunovic, G., Svalina, I., Simunovic, K., Saric, T., Havrlisan, S. et al. (2016). Surface roughness assessing based on digital image features. Advances in Production Engineering Management, 11(2), 93–104. DOI 10.14743/apem2016.2.212. [Google Scholar] [CrossRef]
207. Natarajan, U., Palani, S., Anandampilai, B. (2012). Prediction of surface roughness in milling by machine vision using ANFIS. Computer-Aided Design and Applications, 9(3), 269–288. DOI 10.3722/cadaps.2012.269-288. [Google Scholar] [CrossRef]
208. Makadia, A. J., Nanavati, J. I. (2013). Optimisation of machining parameters for turning operations based on response surface methodology. Measurement, 46(4), 1521–1529. DOI 10.1016/j.measurement.2012.11.026. [Google Scholar] [CrossRef]
209. Gill, J., Singh, J., Ohunakin, O. S., Adelekan, D. S., Atiba, O. E. et al. (2020). Adaptive neuro-fuzzy inference system (ANFIS) approach for the irreversibility analysis of a domestic refrigerator system using LPG/TiO 2 nanolubricant. Energy Reports, 6, 1405–1417. DOI 10.1016/j.egyr.2020.05.016. [Google Scholar] [CrossRef]
210. Kumar, M. A. (2020). Surface roughness prediction using ANFIS and validation with advanced regression algorithms. International Conference on Intelligent and Fuzzy Systems, pp. 238–245. Istanbul, Turkey. [Google Scholar]
211. Hakim, S. J. S., Razak, H. A. (2013). Adaptive neuro fuzzy inference system (ANFIS) and artificial neural networks (ANNs) for structural damage identification. Structural Engineering and Mechanics, 45(6), 779–802. DOI 10.12989/sem.2013.45.6.779. [Google Scholar] [CrossRef]
212. Kumaran, S. T., Ko, T. J., Kurniawan, R., Li, C., Uthayakumar, M. (2017). ANFIS modeling of surface roughness in abrasive waterjet machining of carbon fiber reinforced plastics. Journal of Mechanical Science and Technology, 31(8), 3949–3954. DOI 10.1007/s12206-017-0741-9. [Google Scholar] [CrossRef]
213. Roy, S. S. (2005). Design of adaptive neuro-fuzzy inference system for predicting surface roughness in turning operation. Journal of Scientific and Industrial Research, 64, 653–659. [Google Scholar]
214. Shahriar, J. H., Nafis, A. (2012). Adaptive neuro-fuzzy inference system (ANFIS) based surface roughness prediction model for ball end milling operation. Journal of Mechanical Engineering Research, 4(3), 112–129. [Google Scholar]
215. Kumar, R., Hynes, N. R. J. (2020). Prediction and optimization of surface roughness in thermal drilling using integrated ANFIS and GA approach. Engineering Science and Technology, An International Journal, 23(1), 30–41. DOI 10.1016/j.jestch.2019.04.011. [Google Scholar] [CrossRef]
216. Tatzel, L., León, F. P. (2020). Image-based roughness estimation of laser cut edges with a convolutional neural network. Procedia CIRP, 94, 469–473. DOI 10.1016/j.procir.2020.09.166. [Google Scholar] [CrossRef]
217. Fang, X., Luo, Q., Zhou, B., Li, C., Tian, L. (2020). Research progress of automated visual surface defect detection for industrial metal planar materials. Sensors, 20(18), 5136. DOI 10.3390/s20185136. [Google Scholar] [CrossRef]
218. Zawada-Tomkiewicz, A. (2010). Estimation of surface roughness parameter based on machined surface image. Metrology and Measurement Systems, 2010(3), 493–504. DOI 10.2478/v10178-010-0041-5. [Google Scholar] [CrossRef]
219. Lin, W. J., Lo, S. H., Young, H. T., Hung, C. L. (2019). Evaluation of deep learning neural networks for surface roughness prediction using vibration signal analysis. Applied Sciences, 9(7), 1462. DOI 10.3390/app9071462. [Google Scholar] [CrossRef]
220. Chen, Y., Yi, H., Liao, C., Huang, P., Chen, Q. (2021). Visual measurement of milling surface roughness based on Xception model with convolutional neural network. Measurement, 186, 110217. DOI 10.1016/j.measurement.2021.110217. [Google Scholar] [CrossRef]
221. Dai, X., Yue-Hei Ng, J., Davis, L. S. (2017). Fason: First and second order information fusion network for texture recognition. Proceedings of the IEEE Conference on Computer Vision and Pattern Recognition, pp. 7352–7360. Honolulu, HI, USA. [Google Scholar]
222. Krizhevsky, A., Sutskever, I., Hinton, G. E. (2012). Imagenet classification with deep convolutional neural networks. Advances in Neural Information Processing Systems, 25, 1–9. [Google Scholar]
223. Lee, M., Seo, K. (2018). Comparison of region-based CNN methods for defects detection on metal surface. The Transactions of the Korean Institute of Electrical Engineers, 67(7), 865–870. [Google Scholar]
224. Liu, H., Zhang, Y. (2019). Image-driven structural steel damage condition assessment method using deep learning algorithm. Measurement, 133, 168–181. DOI 10.1016/j.measurement.2018.09.081. [Google Scholar] [CrossRef]
225. Kruk, M., Jegorowa, A., Kurek, J., Osowski, S., Gorski, J. (2016). Automatic recognition of drill condition on the basis of images of drilled holes. 2016 17th International Conference Computational Problems of Electrical Engineering (CPEE), pp. 1–4. Czech Republic. [Google Scholar]
226. Jegorowa, A., Kurek, J., Antoniuk, I., Dołowa, W., Bukowski, M. et al. (2021). Deep learning methods for drill wear classification based on images of holes drilled in melamine faced chipboard. Wood Science and Technology, 55(1), 271–293. DOI 10.1007/s00226-020-01245-7. [Google Scholar] [CrossRef]
227. Wu, X., Wei, X., Xu, H., He, W., Li, Y. et al. (2021). Emissivity measurement based on deep learning and surface roughness. AIP Advances, 11(8), 085305. DOI 10.1063/5.0055415. [Google Scholar] [CrossRef]
228. Giusti, A., Dotta, M., Maradia, U., Boccadoro, M., Gambardella, L. M. et al. (2020). Image-based measurement of material roughness using machine learning techniques. Procedia CIRP, 95, 377–382. DOI 10.1016/j.procir.2020.02.292. [Google Scholar] [CrossRef]
229. Kumar, V., Kumar, C. S. (2020). Investigation of the influence of coloured illumination on surface texture features: A machine vision approach. Measurement, 152, 107297. DOI 10.1016/j.measurement.2019.107297. [Google Scholar] [CrossRef]
230. Ali, J. M., Jailani, H. S., Murugan, M. (2020). Surface roughness evaluation of electrical discharge machined surfaces using wavelet transform of speckle line images. Measurement, 149, 107029. DOI 10.1016/j.measurement.2019.107029. [Google Scholar] [CrossRef]
231. Meireles, J. B., da Silva, L., Caetano, D. P., Huguenin, J. A. O. (2012). Effect of metallic surface roughness on the speckle pattern formation at diffraction plane. Optics and Lasers in Engineering, 50(12), 1731–1734. DOI 10.1016/j.optlaseng.2012.07.009. [Google Scholar] [CrossRef]
232. Tootooni, M. S., Liu, C., Roberson, D., Donovan, R., Rao, P. K. et al. (2016). Online non-contact surface finish measurement in machining using graph theory-based image analysis. Journal of Manufacturing Systems, 41, 266–276. DOI 10.1016/j.jmsy.2016.09.007. [Google Scholar] [CrossRef]
233. Chiou, R. Y., Kwon, Y. J., Tseng, T. L. B., Mauk, M. (2015). Experimental study of high speed CNC machining quality by noncontact surface roughness monitoring. International Journal of Mechanical Engineering and Robotics Research, 4(4), 282–286. DOI 10.18178/ijmerr.4.4.282-286. [Google Scholar] [CrossRef]
234. Narayanasamy, B., Dhanabalan, P. (2020). Prediction of surface roughness from the magnified digital images of titanium alloy (gr5) in grinding: A machine vision approach. Tierärztliche Praxis, 40, 1–13. [Google Scholar]
235. Özcan, B., Schwermann, R., Blankenbach, J. (2020). A novel camera-based measurement system for roughness determination of concrete surfaces. Materials, 14(1), 158. DOI 10.3390/ma14010158. [Google Scholar] [CrossRef]
236. Valikhani, A., Jaberi Jahromi, A., Pouyanfar, S., Mantawy, I. M., Azizinamini, A. (2021). Machine learning and image processing approaches for estimating concrete surface roughness using basic cameras. Computer-Aided Civil and Infrastructure Engineering, 36(2), 213–226. DOI 10.1111/mice.12605. [Google Scholar] [CrossRef]
237. Gharechelou, S., Tateishi, R. A., Johnson, B. (2018). A simple method for the parameterization of surface roughness from microwave remote sensing. Remote Sensing, 10(11), 1711. DOI 10.3390/rs10111711. [Google Scholar] [CrossRef]
238. Babu, G. D., Babu, K. S., Gowd, B. U. M. (2010). Evaluation of surface roughness using machine vision. INTERACT-2010, pp. 220–223. Chennai, India. [Google Scholar]
239. Zhu, N. N., Zhang, J. (2016). Surface roughness measurement based on fiber optic sensor. Measurement, 86, 239–245. DOI 10.1016/j.measurement.2016.02.051. [Google Scholar] [CrossRef]
240. Rodríguez, F., Cotto, I., Dasilva, S., Rey, P., Van der Straeten, K. (2017). Speckle characterization of surface roughness obtained by laser texturing. Procedia Manufacturing, 13, 519–525. DOI 10.1016/j.promfg.2017.09.077. [Google Scholar] [CrossRef]
241. Al-Kindi, G. A., Shirinzadeh, B., Zhong, Y. (2008). A vision-based approach for surface roughness assessment at micro and nano scales. 2008 10th International Conference on Control, Automation, Robotics and Vision, pp. 1903–1908. Hanoi, Vietnam. [Google Scholar]
242. Vijayarangan, J. (2017). Non-contact method to assess the surface roughness of metal castings by 3D laser scanning (Doctoral Dissertation). Iowa State University. [Google Scholar]
243. Priya, J. D., Ali, J. M. (2015). Design of a measurement system for surface roughness using speckle images. International Journal of Advance Engineering and Research Development, 2(4), 300–305. [Google Scholar]
244. Ghodrati, S., Kandi, S. G., Mohseni, M. (2018). Nondestructive, fast, and cost-effective image processing method for roughness measurement of randomly rough metallic surfaces. Journal of the Optical Society of America A, 35(6), 998–1013. DOI 10.1364/JOSAA.35.000998. [Google Scholar] [CrossRef]
245. Mahashar Ali, J., Siddhi Jailani, H., Murugan, M. (2019). Surface roughness evaluation of milled surfaces by image processing of speckle and white-light images. In: Advances in manufacturing processes, pp. 141–151. Singapore, Singapore. [Google Scholar]
246. Singh, D., Chadha, V., Singari, R. M. (2016). Effect of nose radius on surface roughness during CNC turning using response surface methodology. International Journal of Recent Advances in Mechanical Engineering, 5(2), 31–45. [Google Scholar]
247. Piepmeier, J., Waters, J., Broussard, R. (2006). A stereo vision based wave surface measurement project. 2006 Annual Conference Exposition, pp. 11–124. Chicago, Illinois. [Google Scholar]
248. Youssef, D., El-Ghandoor, H., Kandel, H., El-Azab, J., Hassab-Elnaby, S. (2017). Estimation of articular cartilage surface roughness using gray-level co-occurrence matrix of laser speckle image. Materials, 10(7), 714. DOI 10.3390/ma10070714. [Google Scholar] [CrossRef]
249. Hameed, N. A., Ali, I. M., Hassun, H. K. (2019). Calculating surface roughness for a large scale sem images by mean of image processing. Energy Procedia, 157, 84–89. DOI 10.1016/j.egypro.2018.11.167. [Google Scholar] [CrossRef]
250. Chen, X. W., Zhang, Z. K., Liu, Z. H. (2011). Measurement of surface roughness by computer vision in planning operations. Advanced Materials Research, 146, 361–365. [Google Scholar]
251. Chiou, R., Mauk, M., Yang, Y. T., Kizirian, R., Kwon, Y. (2010). On line surface roughness measurement using Labview and vision method for E quality control. 2010 Annual Conference Exposition, pp. 15–920. Louisville, Kentucky. [Google Scholar]
252. Petitpas, B., Beaudoin, L., Roux, M., Rudent, J. P. (2010). Roughness measurement from multi-stereo reconstruction. The International Archives of the Photogrammetry, Remote Sensing and Spatial Information Sciences, 38, 104–109. [Google Scholar]
253. Bhaskara Rao, J., Beatrice Seventline, J. (2017). Estimation of roughness parameters of a surface using different image enhancement techniques. International Journal of Engineering, 30(5), 652–658. [Google Scholar]
254. John, J. G., Arunachalam, N. (2019). Illumination compensated images for surface roughness evaluation using machine vision in grinding process. Procedia Manufacturing, 34, 969–977. DOI 10.1016/j.promfg.2019.06.099. [Google Scholar] [CrossRef]
255. Dai, Y., Zhu, K. (2018). A machine vision system for micro-milling tool condition monitoring. Precision Engineering, 52, 183–191. DOI 10.1016/j.precisioneng.2017.12.006. [Google Scholar] [CrossRef]
256. Flack, K. A., Schultz, M. P., Volino, R. J. (2020). The effect of a systematic change in surface roughness skewness on turbulence and drag. International Journal of Heat and Fluid Flow, 85, 108669. DOI 10.1016/j.ijheatfluidflow.2020.108669. [Google Scholar] [CrossRef]
257. Whip, B., Sheridan, L., Gockel, J. (2019). The effect of primary processing parameters on surface roughness in laser powder bed additive manufacturing. The International Journal of Advanced Manufacturing Technology, 103(9), 4411–4422. DOI 10.1007/s00170-019-03716-z. [Google Scholar] [CrossRef]
258. Chang, S. I., Ravathur, J. S. (2005). Computer vision based non-contact surface roughness assessment using wavelet transform and response surface methodology. Quality Engineering, 17(3), 435–451. DOI 10.1081/QEN-200059881. [Google Scholar] [CrossRef]
259. Mai, Q., Quan, Y., Liu, P., Ding, G. (2016). A new method of on-line turned surface monitoring by digital image processing. MATEC Web of Conferences, 63, 04030. DOI 10.1051/matecconf/20166304030. [Google Scholar] [CrossRef]
260. Shome, D., Ray, P. K., Mahanty, B. (2009). Non-contact estimation of surface roughness in turning using computer vision and artificial neural networks. International Journal of Industrial and Systems Engineering, 4(4), 349–367. DOI 10.1504/IJISE.2009.024066. [Google Scholar] [CrossRef]
261. Samtaş, G. (2014). Measurement and evaluation of surface roughness based on optic system using image processing and artificial neural network. The International Journal of Advanced Manufacturing Technology, 73(1), 353–364. DOI 10.1007/s00170-014-5828-1. [Google Scholar] [CrossRef]
262. Pino, A., Pladellorens, J. (2009). Measure of roughness of paper using speckle. Optical Inspection and Metrology for Non-Optics Industries, 7432, 138–146. DOI 10.1117/12.825072. [Google Scholar] [CrossRef]
263. Abidi, B. R., Sari-Sarraf, H., Goddard Jr, J. S., Hunt, M. A. (1999). Facet model and mathematical morphology for surface characterization. Intelligent Robots and Computer Vision XVIII: Algorithms, Techniques, and Active Vision, 3837, 334–344. [Google Scholar]
264. Alam, A., Manuilskiy, A., Thim, J., O’Nils, M., Lindgren, J. et al. (2012). Online surface roughness characterization of paper and paperboard using a line of light triangulation technique. Nordic Pulp Paper Research Journal, 27(3), 662–670. DOI 10.3183/npprj-2012-27-03-p662-670. [Google Scholar] [CrossRef]
265. Somthong, T., Yang, Q. (2016). Average surface roughness evaluation using 3-source photometric stereo technique. International Journal of Metrology and Quality Engineering, 7(4), 406. DOI 10.1051/ijmqe/2016024. [Google Scholar] [CrossRef]
266. Liu, C., Wang, R., Kong, Z., Babu, S., Joslin, C. et al. (2019). Real-time 3D surface measurement in additive manufacturing using deep learning. 2019 International Solid Freeform Fabrication Symposium, Austin, Texas, USA. DOI 10.20944/preprints202101.0587.v1. [Google Scholar] [CrossRef]
267. Zhang, H., Zhang, H., Wang, C., Xie, J. (2019). Co-occurrent features in semantic segmentation. Proceedings of the IEEE/CVF Conference on Computer Vision and Pattern Recognition, pp. 548–557. Long Beach, CA, USA. [Google Scholar]
268. Gong, Y., Xu, J., Buchanan, R. C. (2018). Surface roughness: A review of its measurement at micro-/nano-scale. Physical Sciences Reviews, 3(1), 20170057. DOI 10.1515/psr-2017-0057. [Google Scholar] [CrossRef]
269. Fountas, N. A., Vaxevanidis, N. M. (2021). Optimization of abrasive flow nano-finishing processes by adopting artificial viral intelligence. Journal of Manufacturing and Materials Processing, 5(1), 22. DOI 10.3390/jmmp5010022. [Google Scholar] [CrossRef]
270. Shahabi, H. H., Ratnam, M. M. (2010). Noncontact roughness measurement of turned parts using machine vision. The International Journal of Advanced Manufacturing Technology, 46(1), 275–284. DOI 10.1007/s00170-009-2101-0. [Google Scholar] [CrossRef]
271. Pan, H., Gao, P., Zhou, H., Ma, R., Yang, J. et al. (2020). Roughness analysis of sea surface from visible images by texture. IEEE Access, 8, 46448–46458. DOI 10.1109/Access.6287639. [Google Scholar] [CrossRef]
272. Gadelmawla, E. S. (2011). Estimation of surface roughness for turning operations using image texture features. Proceedings of the Institution of Mechanical Engineers, Part B: Journal of Engineering Manufacture, 225(8), 1281–1292. [Google Scholar]
273. Min, L., Li, D., Dong, S. (2016). 3D surface roughness measurement based on SFS method. 2016 8th International Conference on Intelligent Human-Machine Systems and Cybernetics (IHMSC), pp. 484–488. Hangzhou, China. [Google Scholar]
274. Vesselenyi, T., Dzitac, I., Dzitac, S., Vaida, V. (2008). Surface roughness image analysis using quasi-fractal characteristics and fuzzy clustering methods. International Journal of Computers Communications Control, 3(3), 304–316. DOI 10.15837/ijccc.2008.3.2398. [Google Scholar] [CrossRef]
275. Mitaľ, G., Dobránsky, J., Ružbarský, J., Olejárová, Š. (2019). Application of laser profilometry to evaluation of the surface of the workpiece machined by abrasive waterjet technology. Applied Sciences, 9(10), 2134. DOI 10.3390/app9102134. [Google Scholar] [CrossRef]
276. Mohamed, K., Ahmed, Z., Samir, H., Karim, F., Rabie, A. (2009). Performance analysis of a voltage source converter (VSC) based HVDC transmission system under faulted conditions. Leonardo Journal of Sciences, 8(15), 33–46. [Google Scholar]
277. Tian, J., Yin, X. (2018). Adaptive image enhancement algorithm based on the model of surface roughness detection system. EURASIP Journal on Image and Video Processing, 2018(1), 1–9. DOI 10.1186/s13640-018-0343-1. [Google Scholar] [CrossRef]
278. Abellan-Nebot, J. V., Romero Subirón, F. (2010). A review of machining monitoring systems based on artificial intelligence process models. The International Journal of Advanced Manufacturing Technology, 47(1), 237–257. DOI 10.1007/s00170-009-2191-8. [Google Scholar] [CrossRef]
279. Niu, Y. M., Wong, Y. S., Hong, G. S. (1998). An intelligent sensor system approach for reliable tool flank wear recognition. The International Journal of Advanced Manufacturing Technology, 14(2), 77–84. DOI 10.1007/BF01322215. [Google Scholar] [CrossRef]
280. Kurada, S., Bradley, C. (1997). A review of machine vision sensors for tool condition monitoring. Computers in Industry, 34(1), 55–72. DOI 10.1016/S0166-3615(96)00075-9. [Google Scholar] [CrossRef]
281. Gee, S. (1975). Optical method for surface texture measurement. United States patent US 3,904,293. https://patents.google.com/patent/US3904293A/en. [Google Scholar]
282. Damodarasamy, S., Raman, S. (1991). Texture analysis using computer vision. Computers in Industry, 16(1), 25–34. DOI 10.1016/0166-3615(91)90005-T. [Google Scholar] [CrossRef]
283. Cuthbert, L., Huynh, V. M. (1992). Statistical analysis of optical Fourier transform patterns for surface texture assessment. Measurement Science and Technology, 3(8), 740. DOI 10.1088/0957-0233/3/8/011. [Google Scholar] [CrossRef]
284. Brandt, G. B. (1967). Laser techniques for application to surface topography and roughness measurements. No. WERL-HOLOG-1, Westinghouse Research Labs., Pittsburgh, Pa. USA, Department of Energy Office of Scientific and Technical Information. https://www.osti.gov/. [Google Scholar]
285. Everton, S. K., Hirsch, M., Stravroulakis, P., Leach, R. K., Clare, A. T. (2016). Review of in-situ process monitoring and in-situ metrology for metal additive manufacturing. Materials Design, 95, 431–445. DOI 10.1016/j.matdes.2016.01.099. [Google Scholar] [CrossRef]
286. Li, D., Wang, B., Tong, Z., Blunt, L., Jiang, X. (2019). On-machine surface measurement and applications for ultra-precision machining: A state-of-the-art review. The International Journal of Advanced Manufacturing Technology, 104(1), 831–847. DOI 10.1007/s00170-019-03977-8. [Google Scholar] [CrossRef]
287. Hashmi, A. W., Mali, H. S., Meena, A. (2021). The surface quality improvement methods for FDM printed parts: A review. In: Fused deposition modeling based 3D printing, pp. 167–194. Springer. [Google Scholar]
288. Hashmi, A. W., Mali, H. S., Meena, A. (2021). Improving the surface characteristics of additively manufactured parts: A review. Materials Today: Proceedings. https://doi.org/10.1016/j.matpr.2021.04.223. [Google Scholar]
289. Hashmi, A. W., Mali, H. S., Meena, A. (2020). Surface quality improvement methods of additively manufactured parts: A review. Solid State Technology, 63(6), 23477–23517. [Google Scholar]
290. Hashmi, A. W., Mali, H. S., Meena, A. (2022). Experimental investigation on abrasive flow machining (AFM) of FDM printed hollow truncated cone parts. Materials Today: Proceedings, 56, 1369–1375. [Google Scholar]
291. Hashmi, A. W., Mali, H. S., Meena, A. (2022). Design and fabrication of a low-cost one-way abrasive flow finishing set-up using 3D printed parts. Materials Today: Proceedings, 62, 7554–7563. [Google Scholar]
292. Hashmi, A. W. (2021). An experimental investigation of viscosity of a newly developed natural polymer-based media for abrasive flow machining (AFM) of 3D printed ABS parts. Journal of Engineering Research. DOI 10.36909/jer.1364. [Google Scholar] [CrossRef]
293. Hashmi, A. W., Mali, H. S., Meena, A. (2021). A critical review of modeling and simulation techniques for loose abrasive based machining processes. Materials Today: Proceedings, 56, 2016–2024. [Google Scholar]
294. de Chiffre, L., Lonardo, P., Trumpold, H., Lucca, D. A., Goch, G. et al. (2000). Quantitative characterisation of surface texture. CIRP Annals, 49(2), 635–652. DOI 10.1016/S0007-8506(07)63458-1. [Google Scholar] [CrossRef]
295. Myshkin, N. K., Grigoriev, A. Y., Chizhik, S. A., Choi, K. Y., Petrokovets, M. I. (2003). Surface roughness and texture analysis in microscale. Wear, 254(10), 1001–1009. DOI 10.1016/S0043-1648(03)00306-5. [Google Scholar] [CrossRef]
296. Chen, X., Raja, J., Simanapalli, S. (1995). Multi-scale analysis of engineering surfaces. International Journal of Machine Tools and Manufacture, 35(2), 231–238. DOI 10.1016/0890-6955(94)P2377-R. [Google Scholar] [CrossRef]
297. Niola, V., Nasti, G., Quaremba, G. (2005). A problem of emphasizing features of a surface roughness by means the discrete wavelet transform. Journal of Materials Processing Technology, 164, 1410–1415. DOI 10.1016/j.jmatprotec.2005.02.169. [Google Scholar] [CrossRef]
298. Al-Kindi, G. A., Shirinzadeh, B. (2009). Feasibility assessment of vision-based surface roughness parameters acquisition for different types of machined specimens. Image and Vision Computing, 27(4), 444–458. DOI 10.1016/j.imavis.2008.06.011. [Google Scholar] [CrossRef]
299. Lee, K. C., Ho, S. J., Ho, S. Y. (2005). Accurate estimation of surface roughness from texture features of the surface image using an adaptive neuro-fuzzy inference system. Precision Engineering, 29(1), 95–100. DOI 10.1016/j.precisioneng.2004.05.002. [Google Scholar] [CrossRef]
300. Hu, Z. X., Zhu, L., Teng, J. X., Ma, X. H., Shi, X. J. (2009). Evaluation of three-dimensional surface roughness parameters based on digital image processing. The International Journal of Advanced Manufacturing Technology, 40(3), 342–348. [Google Scholar]
301. Townsend, A., Senin, N., Blunt, L., Leach, R. K., Taylor, J. S. (2016). Surface texture metrology for metal additive manufacturing: A review. Precision Engineering, 46, 34–47. DOI 10.1016/j.precisioneng.2016.06.001. [Google Scholar] [CrossRef]
302. Okamoto, K., Morishige, K. (2013). Quality judgment of a machined surface with a Ball End Mill based on statistical pattern recognition. Transactions of the Japan Society of Mechanical Engineers, Part C, 79(803), 2585–2596. DOI 10.1299/kikaic.79.2585. [Google Scholar] [CrossRef]
303. Sasaki, T., Takada, H., Tomura, Y. (2007). Automatic surface inspection system for Tin mill black plate (TMBP). JFE Technical Report, 9, 60–63. [Google Scholar]
304. Luo, Q., Fang, X., Liu, L., Yang, C., Sun, Y. (2020). Automated visual defect detection for flat steel surface: A survey. IEEE Transactions on Instrumentation and Measurement, 69(3), 626–644. DOI 10.1109/TIM.19. [Google Scholar] [CrossRef]
305. Hashmi, A. W., Mali, H. S., Meena, A., Puerta, V., Kunkel, M. E. (2022). Surface characteristics improvement methods for metal additively manufactured parts: A review. Advances in Materials and Processing Technologies, 1–40. DOI 10.1080/2374068X.2022.2077535. [Google Scholar] [CrossRef]
306. Hashmi, A. W., Mali, H. S., Meena, A., Khilji, I. A., Hashmi, M. F. (2021). Machine vision for the measurement of machining parameters: A review. Materials Today: Proceedings, 56, 1939–1946. [Google Scholar]
307. Hashmi, A. W., Mali, H. S., Meena, A., Khilji, I. A., Hashmi, M. F. (2022). Artificial intelligence techniques for implementation of intelligent machining. Materials Today: Proceedings, 56, 1947–1955. [Google Scholar]
308. Hashmi, M. F., Ashish, B. K. K., Katiyar, S., Keskar, A. G. (2021). Computer vision in contactless biometric systems. International Arab Journal of Information Technology, 18, 484–492. DOI 10.34028/iajit. [Google Scholar] [CrossRef]
309. Hashmi, M. F., Katiyar, S., Hashmi, A. W., Keskar, A. G. (2021). Pneumonia detection in chest X-ray images using compound scaled deep learning model. Journal for Control, Measurement, Electronics, Computing and Communications, 62(3–4), 397–406. DOI 10.1080/00051144.2021.1973297. [Google Scholar] [CrossRef]
310. Naik, B. T., Hashmi, M. F. (2021). Ball and player detection tracking in soccer videos using improved YOLOv3 model. DOI 10.21203/rs.3.rs-438886/v1. [Google Scholar] [CrossRef]
311. Naik, B. T., Hashmi, M. F., Bokde, N. D. (2022). A comprehensive review of computer vision in sports: Open issues, future trends and research directions. Applied Sciences, 12(9), 4429. DOI 10.3390/app12094429. [Google Scholar] [CrossRef]
312. Murthy, C. B., Hashmi, M. F., Keskar, A. G. (2022). Efficientlitedet: A real-time pedestrian and vehicle detection algorithm. Machine Vision and Applications, 33(3), 47. DOI 10.1007/s00138-022-01293-y. [Google Scholar] [CrossRef]
313. Goutam, B., Hashmi, M. F., Geem, Z. W., Bokde, N. D. (2022). A comprehensive review of deep learning strategies in retinal disease diagnosis using fundus images. IEEE Access, 10, 57796–57823. DOI 10.1109/ACCESS.2022.3178372. [Google Scholar] [CrossRef]
314. Lad, B. V., Hashmi, M. F., Keskar, A. G. (2022). Boundary preserved salient object detection using guided filter based hybridization approach of transformation and spatial domain analysis. IEEE Access, 10, 67230–67246. DOI 10.1109/ACCESS.2022.3185409. [Google Scholar] [CrossRef]
315. Gonzalez-Val, C., Pallas, A., Panadeiro, V., Rodriguez, A. (2020). A convolutional approach to quality monitoring for laser manufacturing. Journal of Intelligent Manufacturing, 31(3), 789–795. DOI 10.1007/s10845-019-01495-8. [Google Scholar] [CrossRef]
316. Liu, Y., Wang, X., Lin, J., Kong, X. (2020). An adaptive grinding chatter detection method considering the chatter frequency shift characteristic. Mechanical Systems and Signal Processing, 142, 106672. DOI 10.1016/j.ymssp.2020.106672. [Google Scholar] [CrossRef]
317. Zhang, X., Krewet, C., Kuhlenkötter, B. (2006). Automatic classification of defects on the product surface in grinding and polishing. International Journal of Machine Tools and Manufacture, 46(1), 59–69. DOI 10.1016/j.ijmachtools.2005.03.013. [Google Scholar] [CrossRef]
318. Xie, X. (2008). A review of recent advances in surface defect detection using texture analysis techniques. Electronic Letters on Computer Vision and Image Analysis, 7(3), 1–22. DOI 10.5565/rev/elcvia.268. [Google Scholar] [CrossRef]
319. Saini, S., Ahuja, I. S., Sharma, V. S. (2012). Residual stresses, surface roughness, and tool wear in hard turning: A comprehensive review. Materials and Manufacturing Processes, 27(6), 583–598. DOI 10.1080/10426914.2011.585505. [Google Scholar] [CrossRef]
320. Tapia, G., Elwany, A. (2014). A review on process monitoring and control in metal-based additive manufacturing. Journal of Manufacturing Science and Engineering, 136(6), 060801. DOI 10.1115/1.4028540. [Google Scholar] [CrossRef]
321. Neogi, N., Mohanta, D. K., Dutta, P. K. (2014). Review of vision-based steel surface inspection systems. EURASIP Journal on Image and Video Processing, 2014(1), 1–19. DOI 10.1186/1687-5281-2014-50. [Google Scholar] [CrossRef]
322. Li, Z., Wang, G., He, G. (2018). Surface quality monitoring based on time-frequency features of acoustic emission signals in end milling inconel-718. The International Journal of Advanced Manufacturing Technology, 96(5), 2725–2733. DOI 10.1007/s00170-018-1773-8. [Google Scholar] [CrossRef]
Cite This Article
 Copyright © 2023 The Author(s). Published by Tech Science Press.
This work is licensed under a Creative Commons Attribution 4.0 International License , which permits unrestricted use, distribution, and reproduction in any medium, provided the original work is properly cited.
 Downloads
 Citation Tools