
 Submit a Paper
 Propose a Special lssue
 Open Access
ARTICLE

A Convolutional Autoencoder Based Fault Detection Method for Metro Railway Turnout
1 School of Electronic and Information Engineering, Tongji University, Shanghai, 201804, China
2 School of Engineering, City University of Hong Kong, Hong Kong, 200433, China
3 School of Civil Aviation, Northwestern Polytechnical University, Xi’an, 710072, China
4 School of Computer Engineering, Jimei University, Xiamen, 361021, China
* Corresponding Author: Xingqiu Li. Email:
(This article belongs to the Special Issue: AI and Machine Learning Modeling in Civil and Building Engineering)
Computer Modeling in Engineering & Sciences 2023, 136(1), 471-485. https://doi.org/10.32604/cmes.2023.024033
Received 22 May 2022; Accepted 15 September 2022; Issue published 05 January 2023
 View Full Text
 Download PDF
Abstract
Railway turnout is one of the critical equipment of Switch & Crossing (S&C) Systems in railway, related to the train’s safety and operation efficiency. With the advancement of intelligent sensors, data-driven fault detection technology for railway turnout has become an important research topic. However, little research in the literature has investigated the capability of data-driven fault detection technology for metro railway turnout. This paper presents a convolutional autoencoder-based fault detection method for the metro railway turnout considering human field inspection scenarios. First, the one-dimensional original time-series signal is converted into a two-dimensional image by data pre-processing and 2D representation. Next, a binary classification model based on the convolutional autoencoder is developed to implement fault detection. The profile and structure information can be captured by processing data as images. The performance of our method is evaluated and tested on real-world operational current data in the metro stations. Experimental results show that the proposed method achieves better performance, especially in terms of error rate and specificity, and is robust in practical engineering applications.Keywords
As an essential mode of transportation, urban rail transit has been rapidly developed in many countries. For instance, China’s urban rail transit (URT) has developed into the most prolonged and widespread urban rail transit network worldwide. By the end of 2021, the total length of China’s URT network has reached more than 9,192 kilometers [1]. The safety and efficiency of the URT network have been receiving increasing attention, which is deeply affected by the URT’s equipment. With the development of URT and the increasing awareness, prognostics and health management (PHM) research in URT has become the focus of attention [2,3].
Railway turnout is the critical infrastructure component in Switch&Crossing (S&C) Systems in high-speed rail, general-speed rail, and URT, which control the switch of tracks in operation [4]. Accordingly, railway turnout affects trains’ safety and operational efficiency [5,6]. This study focuses on PHM research in metro railway turnout. Fault detection and fault diagnosis are the main contents of PHM research. Fault detection aims to identify whether a device is faulty, and fault diagnosis refers to recognizing the type of fault [7]. Fault detection can distinguish fault samples from the test data mixed with large numbers of normal samples to reduce the manual judgment workload. Furthermore, fault detection can be divided into abrupt and incipient fault detection based on the cause of the fault [8,9]. This study focuses on abrupt fault detection, which can be viewed as a classification problem.
Recent intelligent sensor advancements have contributed to data-driven PHM research on railway turnout. The related research contents include gap measurement [10–12], electric power analysis [13–15], electric current analysis [16–18], and sound analysis [19–21]. These studies are highly dependent on features, and they are divided into three categories according to the way features are constructed: the manual features applied in classifiers approach [22,23], the distance-based measurement approach [14,24], and the automatic features with deep learning approach [25–27]. There are two types of features for the manual features and classifiers approach: signal-processing-based and statistical features. Márquez et al. [22] extracted 11 time-domain features from the point machine’s current and force signal. An et al. [23] proposed a multi-scale analysis and feature extraction method for high-speed rail’s turnout switch machine. The fault features were represented by the wavelet packet’s energy entropy. Conversely, the main idea of the distance-based measurement approach is to realize identification by comparing the distance metric. Meanwhile, it requires standard curves of various turnout states. Huang et al. [28] used
The automatic features with deep learning approach have become an emerging research topic in PHM research [29]. Deep learning can solve the limitations of the expert experience by providing an efficient way to extract features automatically [30,31]. Zhang et al. [25] proposed a convolutional neural network method for the fault diagnosis of high-speed railway turnout. This study combines 2-D image representation and convolutional operation to extract features automatically. However, this work only decomposed time series data piecewise and stacked it into two-dimensional images, losing the original curve data’s profile and spatial structure information. Guo et al. [26] designed a stacked autoencoder method for fault detection of high-speed railway turnout. Chen et al. [27] developed a sparse autoencoder approach to detect the health condition of general speed train turnout. The data process method of literature [26,27] was to process the data directly as a one-dimensional vector, which destroyed the data’s profile and structure information, leading to the loss of curve data information.
As described, most existing approaches focus on the turnout of high-speed rail and normal-speed railway. Although some studies have applied the data-driven fault detection method to monitoring URT turnout [32,33], little research has considered preserving the curve data’s profile and structure information. This paper develops a fault detection method for URT turnout to address the above limitations. The real on-site detection method in URT is to read the pictures of the current curve and make a judgment based on the profile and structure of the curve. By using the image-based data processing method, curve data’s profile and structure information can be preserved and in line with the domain knowledge in real-life inspection scenarios. The convolution operation and autoencoder are combined to extract features and modeling as the processed data are image data. In summary, this study makes the following contributions:
1. This paper proposes a method for detecting metro turnout faults that applies to solving a practical engineering issue.
2. The proposed data processing method fully considers the real detection scene of metro turnout by preserving the curve data’s profile and structure information.
3. Data from real metro stations validated the proposed method.
This paper is organized as follows: railway turnout and field data description are given in Section 2. The proposed research method is illustrated in Section 3. In Section 4, we evaluate and test the proposed method using real-world operational data. Lastly, the conclusion and future work are drawn in Section 5.
2 Railway Turnout and Field Data Formulation
S&C Systems mainly include rails, actuators, and turnout (switch machine), as shown in Fig. 1. In this study, the research object is the switch machine, and the machine type is ZDJ9. In general, there are two types of definitions for railway turnouts. According to the literature [22], turnout can refer to a switch machine or the combination of switches and crossing. In this article, the authors adopt the term ‘turnout’ to describe the switch machine. A microcomputer monitoring system is mainly used in China to monitor turnouts online via their current or power signals. It can be detected whether a turnout is faulty through current signals analysis since current signals reflect the condition of the turnout’s movement [32,34]. All-round rail transit control system integrator (CASCO) collected the real-life data used in this study. Three subway stations in Shanghai Metro Line 13 have been tested: Jinyun Road, Nanjing West Road, and Fengzhuang.
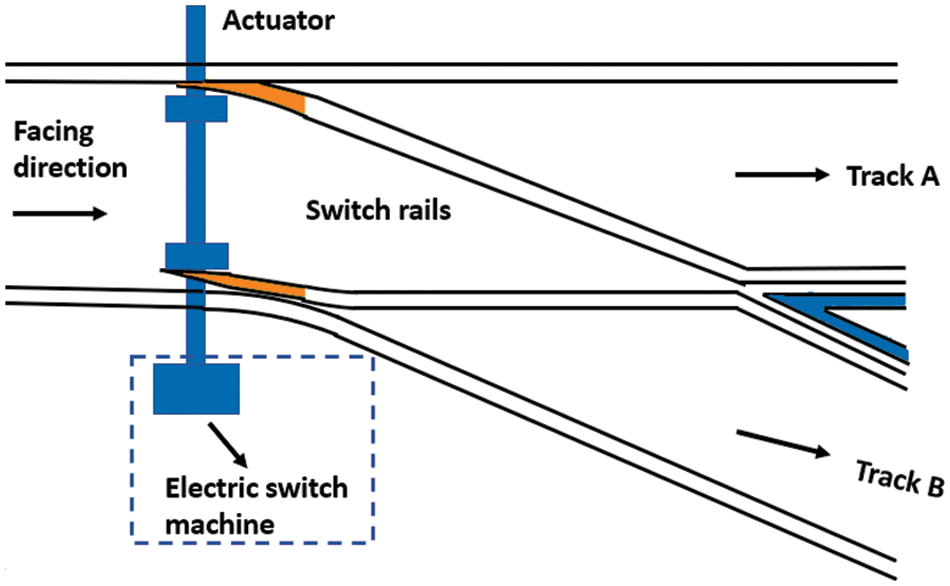
Figure 1: A simplified schematic diagram of S&C systems in railway
The current curve of ZDJ9 includes A, B, and C three-phase currents with the 380 V three-phase AC power supply. According to the literature [25], compared with B-phase and C-phase current curves, A-phase current curve can provide more comprehensive information on the turnout movement. Therefore, this study uses the A-phase current curve to monitor the ZDJ9. The state transition of the switch machine is divided into two situations: positioning to reverse position and reverse position to positioning. Due to the similarity of the A-phase current’s profile and trend in two conditions, this paper takes the case of normal to reverse position as an example, as shown in Fig. 2.
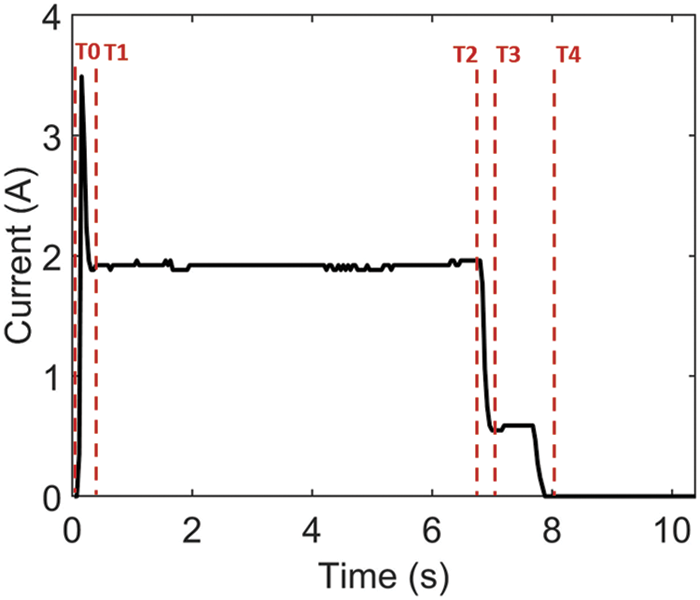
Figure 2: The A-phase current curve
The A-phase current curve consists of four stages: unlocking, switching, locking, and switching on. The specific description of each stage is as follows:
(1) Stage 1 (unlocking) (T0--T1):
After the switch machine starts, it must overcome the strong resistance to complete the unlocking. Therefore, the motor needs to provide strong power support. The current increase rapidly, showing a prominent pulse peak on the curve. Afterward, power and current return to standard levels.
(2) Stage 2 (conversion) (T1--T2):
The conversion process requires less resistance and relatively more minor power than the unlocking stage. The switch machine provides power to pull the switch to realize the conversion. This process is time-consuming, and the power is maintained at a relatively stable value. The current curve also keeps a smooth straight line with slight fluctuation.
(3) Stage 3 (locking) (T2--T3):
After the conversion process is completed, the position of the switch needs to be fixed, and the tip rail is not allowed to move by an external force. This stage is locking. The locking process time is short, and the curve has no prominent feature.
(4) Stage 4 (slow release) (T3--T4):
The switch state transition is completed when the lock ends and the current is disconnected with the switch action. The circuit is turned on, resulting in a rapid drop in the switch machine’s operating current.
ZDJ9 turnout takes 7–9 s to accomplish once state transition, with the sample rate of 25 Hz. Specifically, the field dataset consisted of 500 normal and 500 fault samples. Each current curve includes 256 sample points.
This paper develops a convolutional autoencoder-based (CAE) method for modeling and identifying turnout using the A-phase current curve. The method’s inputs are A-phase current signals of turnout. The outputs are whether the switch is faulty. As shown in Fig. 3, there are two modules in the presented approach.
(1) Curve data pre-processing and image generation. The primary purpose of this module is to pre-process curve data to match the input requirements of the convolutional autoencoder-based model. The process involves the cleaning, normalization, and image generation of the current curve data. The MATLAB software is performed to generate images in a specified size. With the processed data, we can complete the next module’s convolution.
(2) Classification modeling. A CAE model is designed to identify the current curve. The input of this module is the current curve images, and the module’s output is the trained model for fault detection.
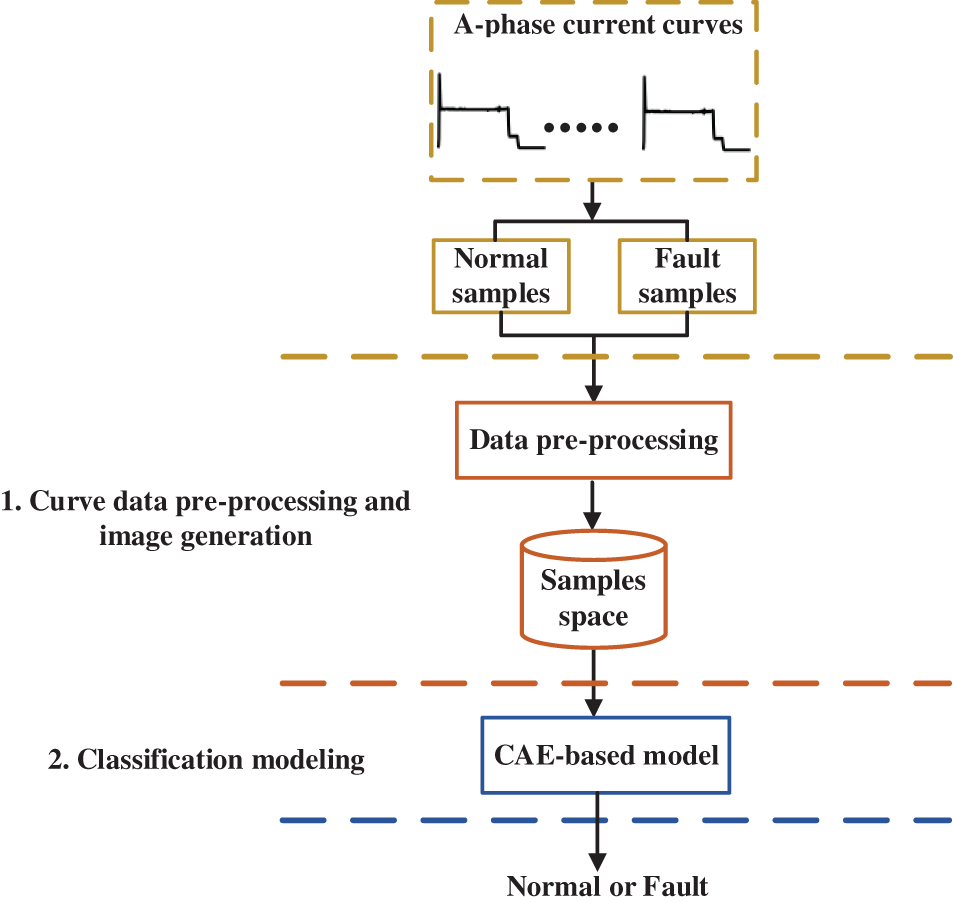
Figure 3: The flowchart of the presented approach
3.1 Curve Data Pre-Processing and Image Generation
The real on-site turnout detection in URT is to read the images of electrical characteristic curves. The 2D image represents the raw current signals based on this domain knowledge. MATLAB’s ‘plot’ and ‘saveas’ functions are used to generate images from raw current curves. The size of the generated images in this study was set to 32 × 32. The whole process is shown in Fig. 4.
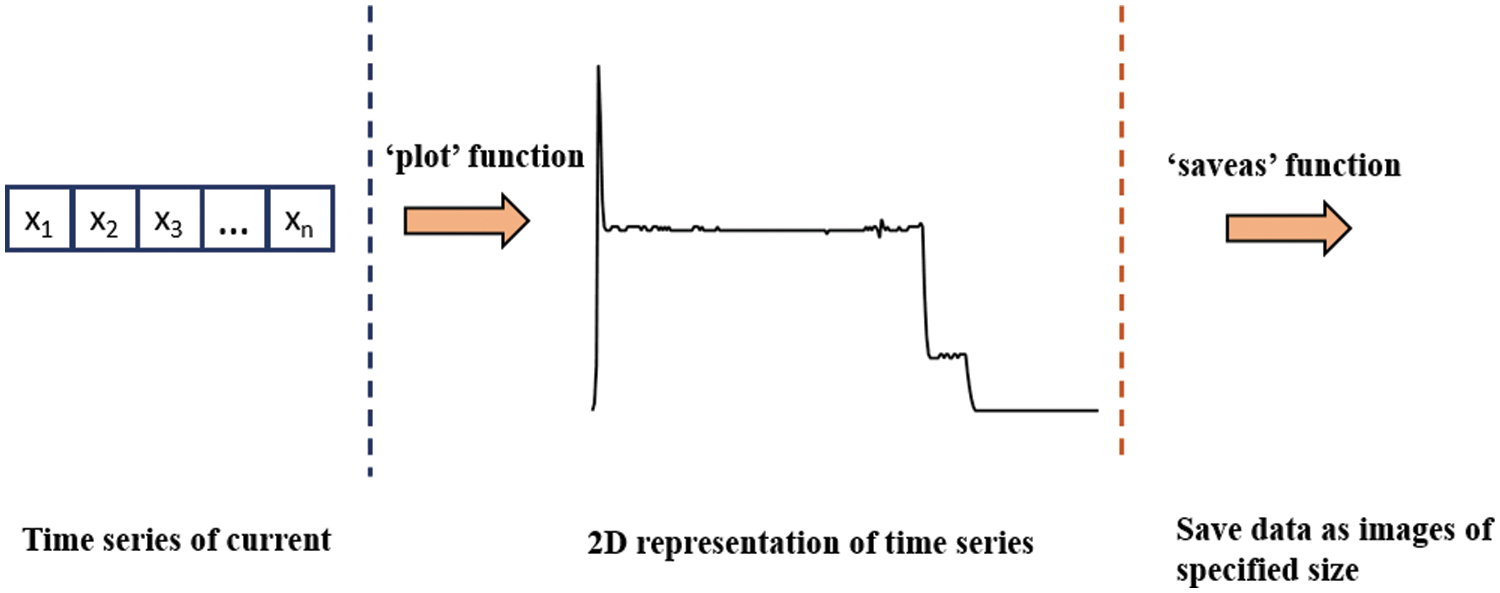
Figure 4: The flowchart for converting time series to images
To summarize, unlike the previous study [22,23], this step does not require complex signal processing calculations, nor does it destroy the spatial structure of the current curve. Furthermore, it combines on-site manual detection with the real scene.
The convolutional autoencoder is a type of autoencoder that is effective for unsupervised learning. It introduces convolutional operations into the encoding and decoding steps. Through the combination of convolutional operations and autoencoders, it provides powerful feature extraction and unsupervised feature clustering. In encoding, convolution and pooling are used to map high-dimensional image data to low-dimensional feature space. In the decoding part, the feature space is reconstructed and transformed into the original data by deconvolution and unpooling. Intermediate hidden layers can effectively represent the original data and provide features for classifiers [35].
In practical engineering application scenarios, the sample size is often relatively small. In this situation, we designed the network structure as shown in Fig. 5, where the encoding part includes two convolution operations and the corresponding two pooling operations, and the decoding part includes two deconvolution operations and the corresponding two unpooling operations.
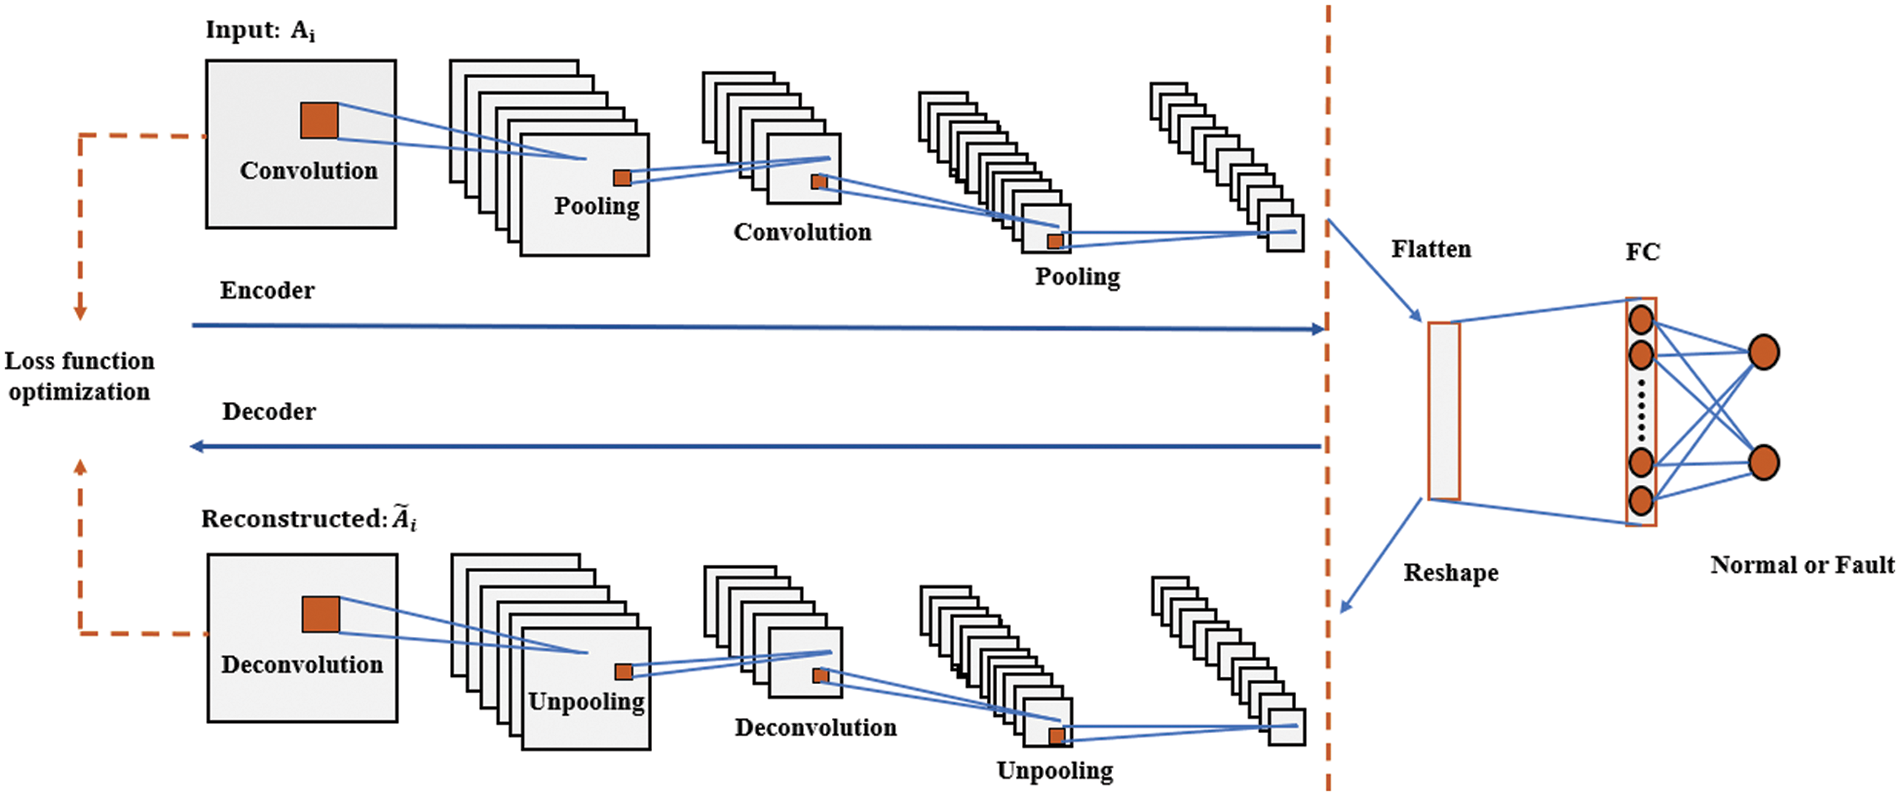
Figure 5: Schematic diagram of the proposed network structure
The configuration of each layer of the proposed structure is shown in Fig. 6. Specifically, the meaning of ‘Conv2D’ is the 2D convolution operation. ‘Deconv2D’ means the 2D deconvolution operation. ‘Maxpooling2D’ represents 2D max-pooling operation. ‘Unpooling2D’ denotes 2D unpooling operation. (3 × 3×16) represents the size of the convolution kernel or deconvolution kernel is 3 × 3, and the number of the corresponding filter is 16. (2 × 2) means the size of the pooling kernel or unpooling kernel is 2 × 2. ‘Full-connected’ denotes the fully connected layer, and the corresponding (64) represents 64 neurons in the layer. The autoencoder’s loss function is the mean squared error (MSE) function. The classifier layer consists of two neurons whose loss function is the SoftMax function to perform classification.
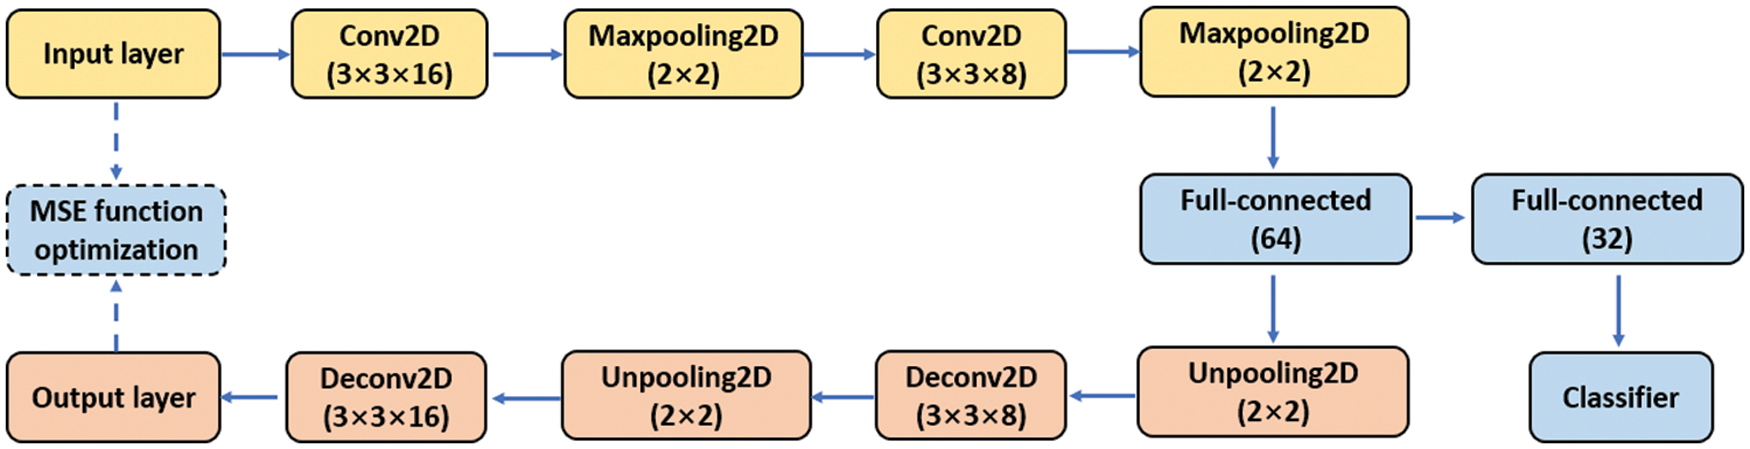
Figure 6: Configuration of the proposed network structure
Let us consider the operation dataset is
Following data processing and image transformation, the input matrix A is represented as follows:
where m and n represent the length and width of the matrix.
(1) The convolution operation for matrix A is represented as:
(2) The encoding part of the convolutional autoencoder is as follows:
Through the convolution operation, the original data is mapped into the feature space
where
And the pooling operation is denoted as follows:
where
Then the decoder operation is as follows:
where
Then the unsupervised loss function is as follows:
The
where
Then the selected hidden layer features are fed into the fully connected layer for classification. The SoftMax function is used as the activation function of the classifier’s output layer, and the SoftMax function is represented as follows:
where h denotes the input vector.
The specific formula of the classifier’s output layer is:
where
The corresponding loss function of the classifier is
The proposed method is validated by the real field current turnout data in the metro system, as described in Section 2. First, we pre-process the field data by cleaning and normalization. Next, the data is transformed into the 32 × 32 images by MATLAB function, with 500 normal and 500 fault samples. In this study, the positive sample represents the fault sample, and the negative sample denotes the normal sample. The ratio of the training set to the test set is 8:2. Lastly, comparative experiments are conducted to analyze the proposed method.
The deep learning framework keras accomplish the developed method with python 3.6. All models are implemented on the workstation with NVIDIA RTX 2080 GPU and Intel i7-8700 CPU. There are four evaluation metrics selected for comparison. The metrics are error rate, F1-score, sensitivity, and specificity. The definitions and formulas of these evaluation metrics are shown as follows:
• Error rate: the probability of recognition error.
• F1-score: a measure of prediction accuracy.
• Sensitivity: the probability of a positive sample being predicted to be positive.
• Specificity: the probability that a negative sample is predicted to be negative.
Specifically, true positives indicate the number of positive samples predicted correctly. False negatives indicate the number of positive samples predicted as negatives. False positives indicate the number of negative samples predicted as positives, and true negatives indicate the number of negative samples predicted correctly.
To evaluate the performance of the presented method, we compared it with the fault detection models in the existing literature. The comparison models include the convolutional neural networks (CNN) model [25], stacked autoencoder (Stacked AE) model [26], and stacked sparse autoencoder (Stacked SAE) model [27]. Stacked AE and Stacked SAE models use autoencoders and sparse autoencoders for feature extraction, respectively. The classifier layer consists of two neurons whose loss function is the SoftMax function to perform classification. The CNN model’s input is the same as this study’s image data. For the Stacked AE and Stacked SAE models, the input is the vector of the original time series in the A-phase current curve. The model’s network structure and key parameter settings follow the original literature’s settings. The comparison experiment is conducted from three perspectives: model performance under different epochs, batch sizes, and the best parameters. Table 1 shows the detail of the hyper-parameters setting in the models, where r, b, and

Experiment 1: Comparison of different models with changes in the number of epochs.
With other parameters fixed, models’ performances in terms of evaluation metrics in different epoch numbers are shown in Tables 2 and 3. The proposed CAE model performs better than other methods in each evaluation index under different iteration times. The experimental results verify the feasibility and effectiveness of the proposed method.


Experiment 2: Comparison of different models with the change in batch size.
With other parameters fixed, models’ performances in evaluation metrics in different batch sizes are shown in Tables 4 and 5. The proposed CAE model performs better than other methods in each evaluation index under different batch sizes. The experimental results further verify the feasibility and effectiveness of the proposed method.


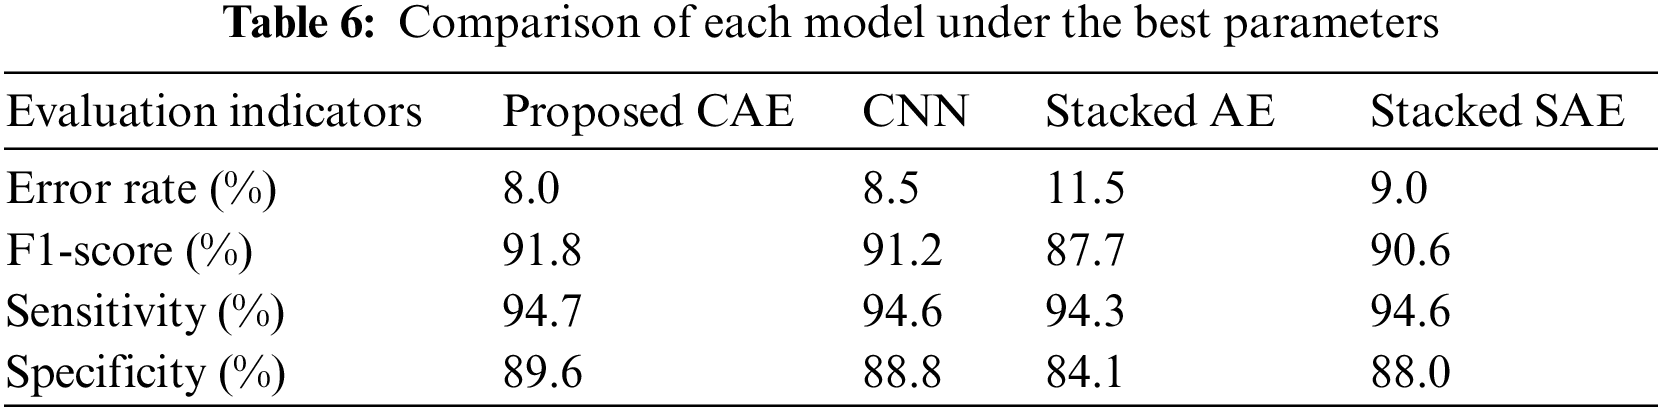
Experiment 3: Models’ performance under the best parameters.
Under the best parameters, models’ performances in evaluation metrics are shown in Table 6. We find that proposed CAE and CNN perform better than other methods. The reason is that the image-based processing method contains more information than the one-dimensional array processing method. The proposed CAE method also outperforms the CNN model because the proposed CAE use the autoencoder to reduce the dimension for data representation.
To summarize, the proposed model offers two distinct advantages over the other method. Firstly, the data processing process considers the curve data’s profile and structure information. Meanwhile, the convolution autoencoder model combines the advantages of convolution operation and autoencoder. Consequently, the proposed method performs well compared to other related studies in experiments 1, 2, and 3, demonstrating our approach’s robustness.
4.3 Discussion on the Detection Failures Case
The samples that failed to be identified in experiment 3 were clustered by k-means clustering and analyzed. Three types of fault samples could not be entirely correctly identified. The specific examples are shown in Fig. 7.
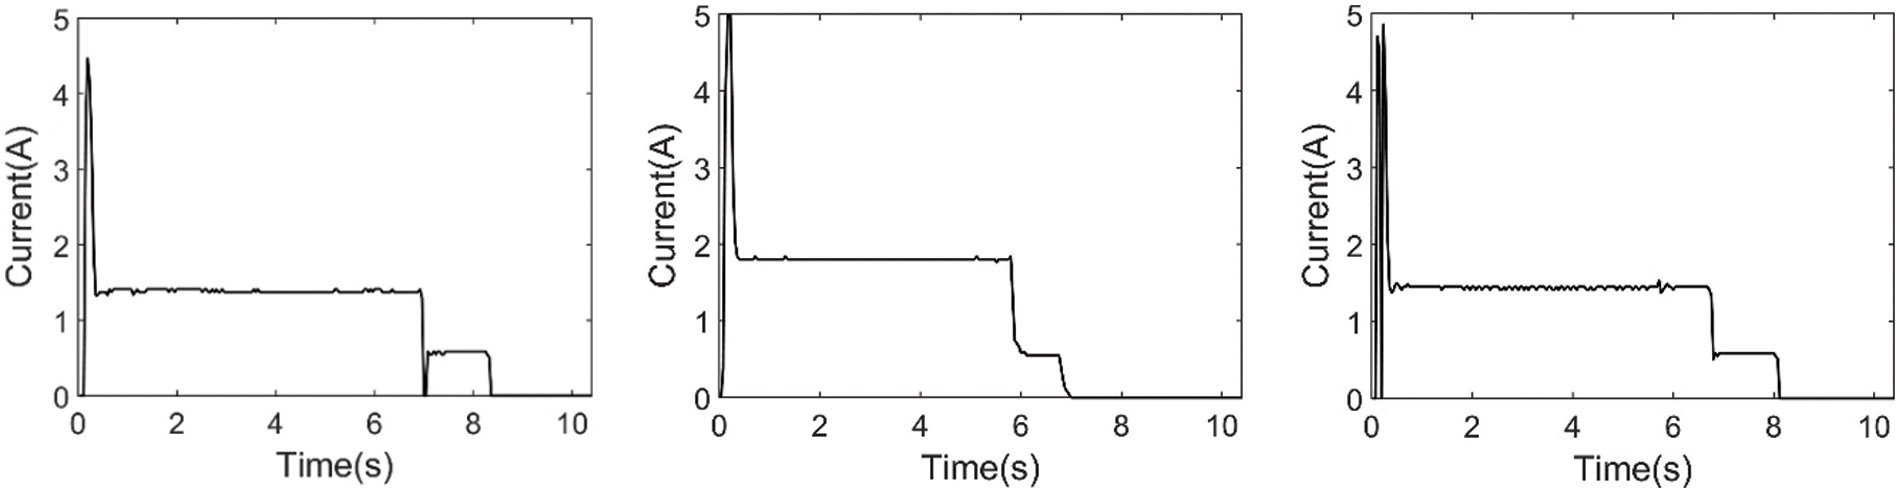
Figure 7: The examples of detection failures case
As a result, the proposed method is difficult to completely identify the fault curve if the profile or structure is relatively small changes compared to the standard curve.
This study proposes a convolutional autoencoder-based fault detection method for metro railway turnout. The presented method included 1) Curve data pre-processing and image generation and 2) Classification modeling based on the convolutional autoencoder. Furthermore, the main contribution lies in developing a new data-driven fault detection method for metro railway turnout without expert experience-based feature engineering. The proposed method combines the advantages of convolutional operations and autoencoders. Specifically, the developed method is evaluated and validated with real-world operation data. While our approach is highly dependent on the quality of the data, it is difficult to identify some kinds of samples. Furthermore, the proposed method still needs to improve accuracy and interpretability, and incipient fault detection is not considered.
Future work will focus on the model’s accuracy, interpretability, and incipient fault detection. We will improve the model’s accuracy and interpretability by circuit physics modeling and the neural network’s loss functions embedded with the partial differential equations. For the incipient fault detection, a dynamic model of the turnout circuit will be constructed based on circuit parameters, describing the degradation process. Afterward, threshold technology will be used to recognize the incipient fault.
Acknowledgement: The authors would like to thank the all-round rail transit control system integrator (CASCO) for providing research data and domain knowledge support.
Funding Statement: This research work is supported in part by the National Natural Science Foundation of China under Grant U1734211.
Conflicts of Interest: The authors declare that they have no conflicts of interest to report regarding the present study.
References
1. Ning, X. China is rapidly becoming a major urban rail transit country. https://www.seetao.com/details/142708.html. [Google Scholar]
2. Hamadache, M., Dutta, S., Olaby, O., Ambur, R., Stewart, E. et al. (2019). On the fault detection and diagnosis of railway switch and crossing systems: An overview. Applied Sciences, 9(23), 5129. DOI 10.3390/app9235129. [Google Scholar] [CrossRef]
3. Yin, J., Tang, T., Yang, L., Xun, J., Huang, Y. et al. (2017). Research and development of automatic train operation for railway transportation systems: A survey. Transportation Research Part C: Emerging Technologies, 85, 548–572. DOI 10.1016/j.trc.2017.09.009. [Google Scholar] [CrossRef]
4. Hamadache, M., Dutta, S., Ambur, R., Olaby, O., Stewart, E. et al. (2019). Residual-based fault detection method: Application to railway Switch & Crossing (S&C) system. 2019 19th International Conference on Control, Automation and Systems (ICCAS), pp. 1228–1233. Jeju, Korea. [Google Scholar]
5. Ghofrani, F., He, Q., Goverde, R. M., Liu, X. (2018). Recent applications of big data analytics in railway transportation systems: A survey. Transportation Research Part C: Emerging Technologies, 90, 226–246. DOI 10.1016/j.trc.2018.03.010. [Google Scholar] [CrossRef]
6. Kostrzewski, M., Melnik, R. (2021). Condition monitoring of rail transport systems: A bibliometric performance analysis and systematic literature review. Sensors, 21(14), 4710. DOI 10.3390/s21144710. [Google Scholar] [CrossRef]
7. Gu, J. X., Albarbar, A., Sun, X., Ahmaida, A. M., Gu, F. et al. (2021). Monitoring and diagnosing the natural deterioration of multi-stage helical gearboxes based on modulation signal bispectrum analysis of vibrations. International Journal of Hydromechatronics, 4(4), 309–330. DOI 10.1504/IJHM.2021.10040778. [Google Scholar] [CrossRef]
8. Pilario, K. E. S., Cao, Y., Shafiee, M. (2019). Incipient fault detection, diagnosis, and prognosis using canonical variate dissimilarity analysis. Computer Aided Chemical Engineering, 46, 1195–1200. DOI 10.1016/B978-0-12-818634-3.50200-9. [Google Scholar] [CrossRef]
9. Wu, Y., Jiang, B., Wang, Y. (2020). Incipient winding fault detection and diagnosis for squirrel-cage induction motors equipped on CRH trains. ISA Transactions, 99, 488–495. DOI 10.1016/j.isatra.2019.09.020. [Google Scholar] [CrossRef]
10. Tao, T., Dong, D., Huang, S., Chen, W. (2020). Gap detection of switch machines in complex environment based on object detection and image processing. Journal of Transportation Engineering, Part A: Systems, 146(8), 04020083. DOI 10.1061/JTEPBS.0000406. [Google Scholar] [CrossRef]
11. Liu, X., Sun, R., Liang, Z. (2022). Research and application of railway turnout gap detection based on improved canny algorithm. The International Conference on Image, Vision and Intelligent Systems (ICIVIS 2021), pp. 151–161. Singapore. [Google Scholar]
12. Xu, T., Wang, G., Wang, H., Yuan, T., Zhong, Z. (2016). Gap measurement of point machine using adaptive wavelet threshold and mathematical morphology. Sensors, 16(12), 2006. DOI 10.3390/s16122006. [Google Scholar] [CrossRef]
13. Ou, D., Xue, R., Cui, K. (2019). A data-driven fault diagnosis method for railway turnouts. Transportation Research Record, 2673(4), 448–457. DOI 10.1177/0361198119837222. [Google Scholar] [CrossRef]
14. Huang, S., Zhang, F., Yu, R., Chen, W., Hu, F. et al. (2017). Turnout fault diagnosis through dynamic time warping and signal normalization. Journal of Advanced Transportation, 2017, 1–8. DOI 10.1155/2017/3192967. [Google Scholar] [CrossRef]
15. Zhang, Y., Xu, T., Chen, C., Wang, G., Zhang, Z. et al. (2021). A hierarchical method based on improved deep forest and case-based reasoning for railway turnout fault diagnosis. Engineering Failure Analysis, 127, 105446. DOI 10.1016/j.engfailanal.2021.105446. [Google Scholar] [CrossRef]
16. Zhou, F., Xia, L., Dong, W., Sun, X., Yan, X. et al. (2016). Fault diagnosis of high-speed railway turnout based on support vector machine. 2016 IEEE International Conference on Industrial Technology (ICIT), pp. 1539–1544. Taipei, Taiwan. [Google Scholar]
17. Bian, C., Yang, S., Huang, T., Xu, Q., Liu, J. et al. (2019). Degradation state mining and identification for railway point machines. Reliability Engineering & System Safety, 188, 432–443. DOI 10.1016/j.ress.2019.03.044. [Google Scholar] [CrossRef]
18. Asada, T., Roberts, C., Koseki, T. (2013). An algorithm for improved performance of railway condition monitoring equipment: Alternating-current point machine case study. Transportation Research Part C: Emerging Technologies, 30, 81–92. DOI 10.1016/j.trc.2013.01.008. [Google Scholar] [CrossRef]
19. Lee, J., Choi, H., Park, D., Chung, Y., Kim, H. Y. et al. (2016). Fault detection and diagnosis of railway point machines by sound analysis. Sensors, 16(4), 549. DOI 10.3390/s16040549. [Google Scholar] [CrossRef]
20. Cao, Y., Sun, Y., Xie, G., Li, P. (2021). A sound-based fault diagnosis method for railway point machines based on two-stage feature selection strategy and ensemble classifier. IEEE Transactions on Intelligent Transportation Systems, 23(8), 12074–12083. DOI 10.1109/TITS.2021.3109632. [Google Scholar] [CrossRef]
21. Sun, Y., Cao, Y., Li, P. (2022). Contactless fault diagnosis for railway point machines based on multi-scale fractional wavelet packet energy entropy and synchronous optimization strategy. IEEE Transactions on Vehicular Technology, 71(6), 5906–5914. DOI 10.1109/TVT.2022.3158436. [Google Scholar] [CrossRef]
22. Márquez, F. P. G., Muñoz, J. M. C. (2012). A pattern recognition and data analysis method for maintenance management. International Journal of Systems Science, 43(6), 1014–1028. DOI 10.1080/00207720903045809. [Google Scholar] [CrossRef]
23. An, C., Gan, F., Luo, W., Qin, F. (2015). Method of speed-up turnout fault diagnosis using wavelet packet energy entropy. Journal of Railway Science and Engineering, 12(2), 269–274. DOI 10.19713/j.cnki.43-1423/u.2015.02.008. [Google Scholar] [CrossRef]
24. Mo, X. M., Fang, Y., Yang, Y. G. (2013). Method on the fault detection and diagnosis for the railway turnout based on the current curve of switch machine. Applied Mechanics and Materials, 427, 1022–1027. DOI 10.4028/www.scientific.net/AMM.427-429.1022. [Google Scholar] [CrossRef]
25. Zhang, P., Zhang, G., Dong, W., Sun, X., Ji, X. (2018). Fault diagnosis of high-speed railway turnout based on convolutional neural network. 2018 24th International Conference on Automation and Computing (ICAC), pp. 1–6. Tyne, UK. [Google Scholar]
26. Guo, Z., Ye, H., Dong, W., Yan, X., Ji, Y. (2018). A fault detection method for railway point machine operations based on stacked autoencoders. 2018 24th International Conference on Automation and Computing (ICAC), pp. 1–6. Tyne, UK. [Google Scholar]
27. Chen, C., Xu, T., Zhang, Z. (2019). Health condition assessment of railway turnout based on stacked sparse auto encoder. 2019 4th International Conference on Electromechanical Control Technology and Transportation (ICECTT), pp. 165–169. Guilin, China. [Google Scholar]
28. Huang, S. Z., Yang, X. L., Wang, L., Chen, W., Zhang, F. et al. (2018). Two-stage turnout fault diagnosis based on similarity function and fuzzy c-means. Advances in Mechanical Engineering, 10(12), 168781401881140. DOI 10.1177/1687814018811402. [Google Scholar] [CrossRef]
29. Ye, Y., Zhu, B., Huang, P., Peng, B. (2022). OORNet: A deep learning model for on-board condition monitoring and fault diagnosis of out-of-round wheels of high-speed trains. Measurement, 199, 111268. DOI 10.1016/j.measurement.2022.111268. [Google Scholar] [CrossRef]
30. Li, X., Cheng, J., Shao, H., Liu, K., Cai, B. (2021). A fusion CWSMM-based framework for rotating machinery fault diagnosis under strong interference and imbalanced case. IEEE Transactions on Industrial Informatics, 18(8), 5180–5189. DOI 10.1109/TII.2021.3125385. [Google Scholar] [CrossRef]
31. Shao, H., Lin, J., Zhang, L., Galar, D., Kumar, U. (2021). A novel approach of multisensory fusion to collaborative fault diagnosis in maintenance. Information Fusion, 74, 65–76. DOI 10.1016/j.inffus.2021.03.008. [Google Scholar] [CrossRef]
32. Li, Z., Yin, Z., Tang, T., Gao, C. (2019). Fault diagnosis of railway point machines using the locally connected autoencoder. Applied Sciences, 9(23), 5139. DOI 10.3390/app9235139. [Google Scholar] [CrossRef]
33. Du, H., Li, Z., Chen, R., Yin, Z., Fu, Z. et al. (2019). Dynamic time warping and spectral clustering based fault detection and diagnosis of railway point machines. 2019 IEEE Intelligent Transportation Systems Conference (ITSC), pp. 595–600. Auckland, New Zealand. [Google Scholar]
34. Guo, Z., Ye, H., Jiang, M., Sun, X. (2020). An enhanced fault detection method for railway turnouts incorporating prior faulty information. 2020 IEEE 23rd International Conference on Intelligent Transportation Systems (ITSC), pp. 1–6. Rhodes, Greece. [Google Scholar]
35. Bourlard, H., Kamp, Y. (1988). Auto-association by multilayer perceptrons and singular value decomposition. Biological Cybernetics, 59(4), 291–294. DOI 10.1007/BF00332918. [Google Scholar] [CrossRef]
Cite This Article
 Copyright © 2023 The Author(s). Published by Tech Science Press.
This work is licensed under a Creative Commons Attribution 4.0 International License , which permits unrestricted use, distribution, and reproduction in any medium, provided the original work is properly cited.
 Downloads
 Citation Tools