
 Submit a Paper
 Propose a Special lssue
 Open Access
ARTICLE

Graph Convolutional Network-Based Repository Recommendation System
1 School of Computer Science and Engineering, Central South University, Changsha, China
2 School of Information Technology and Management, Hunan University of Finance and Economics, Changsha, China
3 School of Engineering and Built Environment, Glasgow Caledonian University, Glasgow, UK
* Corresponding Authors: Shengzong Liu. Email: ; Song Yu. Email:
Computer Modeling in Engineering & Sciences 2023, 137(1), 175-196. https://doi.org/10.32604/cmes.2023.027287
Received 23 October 2022; Accepted 16 December 2022; Issue published 23 April 2023
 View Full Text
 Download PDF
Abstract
GitHub repository recommendation is a research hotspot in the field of open-source software. The current problems with the repository recommendation system are the insufficient utilization of open-source community information and the fact that the scoring metrics used to calculate the matching degree between developers and repositories are developed manually and rely too much on human experience, leading to poor recommendation results. To address these problems, we design a questionnaire to investigate which repository information developers focus on and propose a graph convolutional network-based repository recommendation system (GCNRec). First, to solve insufficient information utilization in open-source communities, we construct a Developer-Repository network using four types of behavioral data that best reflect developers’ programming preferences and extract features of developers and repositories from the repository content that developers focus on. Then, we design a repository recommendation model based on a multi-layer graph convolutional network to avoid the manual formulation of scoring metrics. This model takes the Developer-Repository network, developer features and repository features as inputs, and recommends the top-k repositories that developers are most likely to be interested in by learning their preferences. We have verified the proposed GCNRec on the dataset, and by comparing it with other open-source repository recommendation methods, GCNRec achieves higher precision and hit rate.Keywords
In recent years, the open-source software (OSS) community represented by GitHub has gradually emerged. More and more developers are joining the ranks of OSS development and contributing their code to the open-source software ecosystem. According to Developer Report1 published by GitHub, GitHub has a large number of developers and open-source repositories, with 56 million users, over 3.1 million enterprise accounts, and over 100 million repositories by the end of 2020. GitHub is so popular because its social programming features allow developers to Star or Fork repositories they are interested in, discuss problems with other developers, or participate in developing other open-source repositories.
In GitHub, there are many repositories with similar functions. When developing new repositories, developers tend to add new features directly to existing repositories or reuse the code of existing repositories. A repository recommendation system can help developers discover similar repositories and reduce the time and workload of developing new repositories. In addition, the study [1] has shown that many repositories in the OSS community are difficult to maintain due to the lack of developers, which eventually leads to repository failure. One reason for this situation is that there are a large number of repositories in GitHub, which makes it difficult for developers to find interesting repositories from a large number of repositories. A survey shows that nearly 50% of developers believe a repository recommendation system is necessary [2]. Therefore, open-source repository recommendation methods enable developers to find more repositories of interest, increase the possibility of their participation in open-source repositories and extend the life of open-source repositories.
At present, many researchers have studied the recommendation methods of open-source repositories, which can be classified into three categories: developer behavior-based [3,4], repository content-based [5], and hybrid methods [6–8]. The developer behavior-based recommendation methods use the data of developer behavior, such as Star and Fork, to calculate the similarity of repositories. However, since the content information of the repository is not used, the recommendation result is not necessarily the developer’s expertise. The repository content-based recommendation methods use the Code, Readme, and other repository information to calculate the repository’s similarity and recommend the most similar repositories to developers. However, different developers have different needs for open-source repositories, and recommendation methods that only consider the repository content without considering developers’ behavior cannot meet the needs of developers. The hybrid recommendation method is a research trend in recent years. However, current research suffers from incomplete information utilization, e.g., Zhang et al. [8] only used the Star behavior data of developers and the Readme information of repositories. Such little information is difficult to achieve good results. Furthermore, the matching degree between developers and repositories is calculated by designing different scoring metrics in hybrid recommendation methods, relying too much on the researcher’s experience in GitHub.
Open-source repository recommendation methods usually involve calculating repository similarity, using different developer behaviors to build complex networks, and designing different repository recommendation algorithms. Therefore, this paper introduces the related work from three aspects: similar repository detection, GitHub complex network construction and open-source repository recommendation algorithm.
For similar repository detection, Thung et al. [5] proposed the CLAN algorithm to detect the similarity of Java repositories. They considered the relationship between packages and classes, calculated different weights for different APIs, and then calculated the similarity between repositories by the LSI model. Inspired by the CLAN algorithm, Linares-Vásquez et al. [9] proposed a CLANdroid algorithm to detect similar Android repositories. This algorithm extracts the permission list, source code, sensor list and API call list of Android repositories as repository information. Then, the similarity between repositories is calculated by the LSI model. Wang et al. [10] proposed a framework for detecting similar Android repositories. By comparing the dependency information of third-party libraries used by the repository, the candidate repositories are initially filtered. Then, the final results are obtained through a fine-grained comparison of code blocks. Nguyen et al. [11] constructed a heterogeneous network based on an association network between developers and repositories and code information extracted from repositories. The similarity of repositories is calculated by network node similarity.
As for the research of GitHub complex network construction, many researchers have built a variety of networks. For example, a developer collaboration network is constructed based on the Commit behavior of developers [12]. Yu et al. [13] studied the comment relationship between developers. A directed edge is created between the corresponding nodes in a complex network if a developer comments on a Pull Request (PR). Liao et al. [14] focused on the relationship between the collaborator and PR and constructed a partner PR network. Then, according to the relationship between the repository reviewer and the reviewed PR, Liao et al. [15] constructed the reviewer cooperation network to recommend the appropriate reviewer to PR. Nguyen et al. [16] constructed a complex open-source repository network by analyzing the code in the repositories, Star and Develop behaviors performed by developers.
For the open-source repository recommendation system, Zhang et al. [8] thought that repositories starred by the same developer within a short period are likely to be similar. The more similar the users who star the two repositories, the more similar the two repositories are. Based on this, a ReopPal open-source repository recommendation method is proposed. Zhang et al. [3] analyzed five developers’ behaviors to explore whether they can be used to recommend similar repositories and found that Fork and Star are most suitable. Yang et al. [7] mined the technical features and connection of repositories based on developers’ historical development activities and social association, which helps to detect the similarity of repositories and recommend similar repositories. This recommendation system relies on developer behavior. Once there is less developer behavior, the scope of recommendation is limited. Xu et al. [6] used TF-IDF to calculate the text-similarity of repositories. They got the final prediction result by calculating the similarity between repositories directly operated by developers and new repositories. Less network topology was used in their model. Zhang et al. [4] recommended suitable developers for repositories by combining GitHub with Stack Overflow. However, it is difficult to identify public developers from both communities. Matek and Zebec [17] constructed a repository-developer association network first and then calculated the network node similarity using link prediction metrics, so as to recommend appropriate repositories for developers. However, the content information of repositories is ignored. Gao et al. [18] improved the collaborative filtering algorithm for IOT API recommendation. For the recommended cold start problem, Yang et al. [19] solved the problem through hybrid collaborative filtering algorithm.
In this section, we design a questionnaire to investigate what developers may pay attention to when they Star or Fork repositories, and whether developers want others to participate in their repositories. Section 3.1 shows the content of the questionnaire and the participants. Section 3.2 shows the results of the questionnaire.
To investigate what developers pay attention to when browsing repositories and investigate whether others are involved in developers’ repositories, we design 5 closed questions with possible choices, and we encourage the participants to inform us of their own answers besides the given choices. The 5 questions are shown in Table 1 and the full text of the questionnaire can be retrieved in our Github repository2.
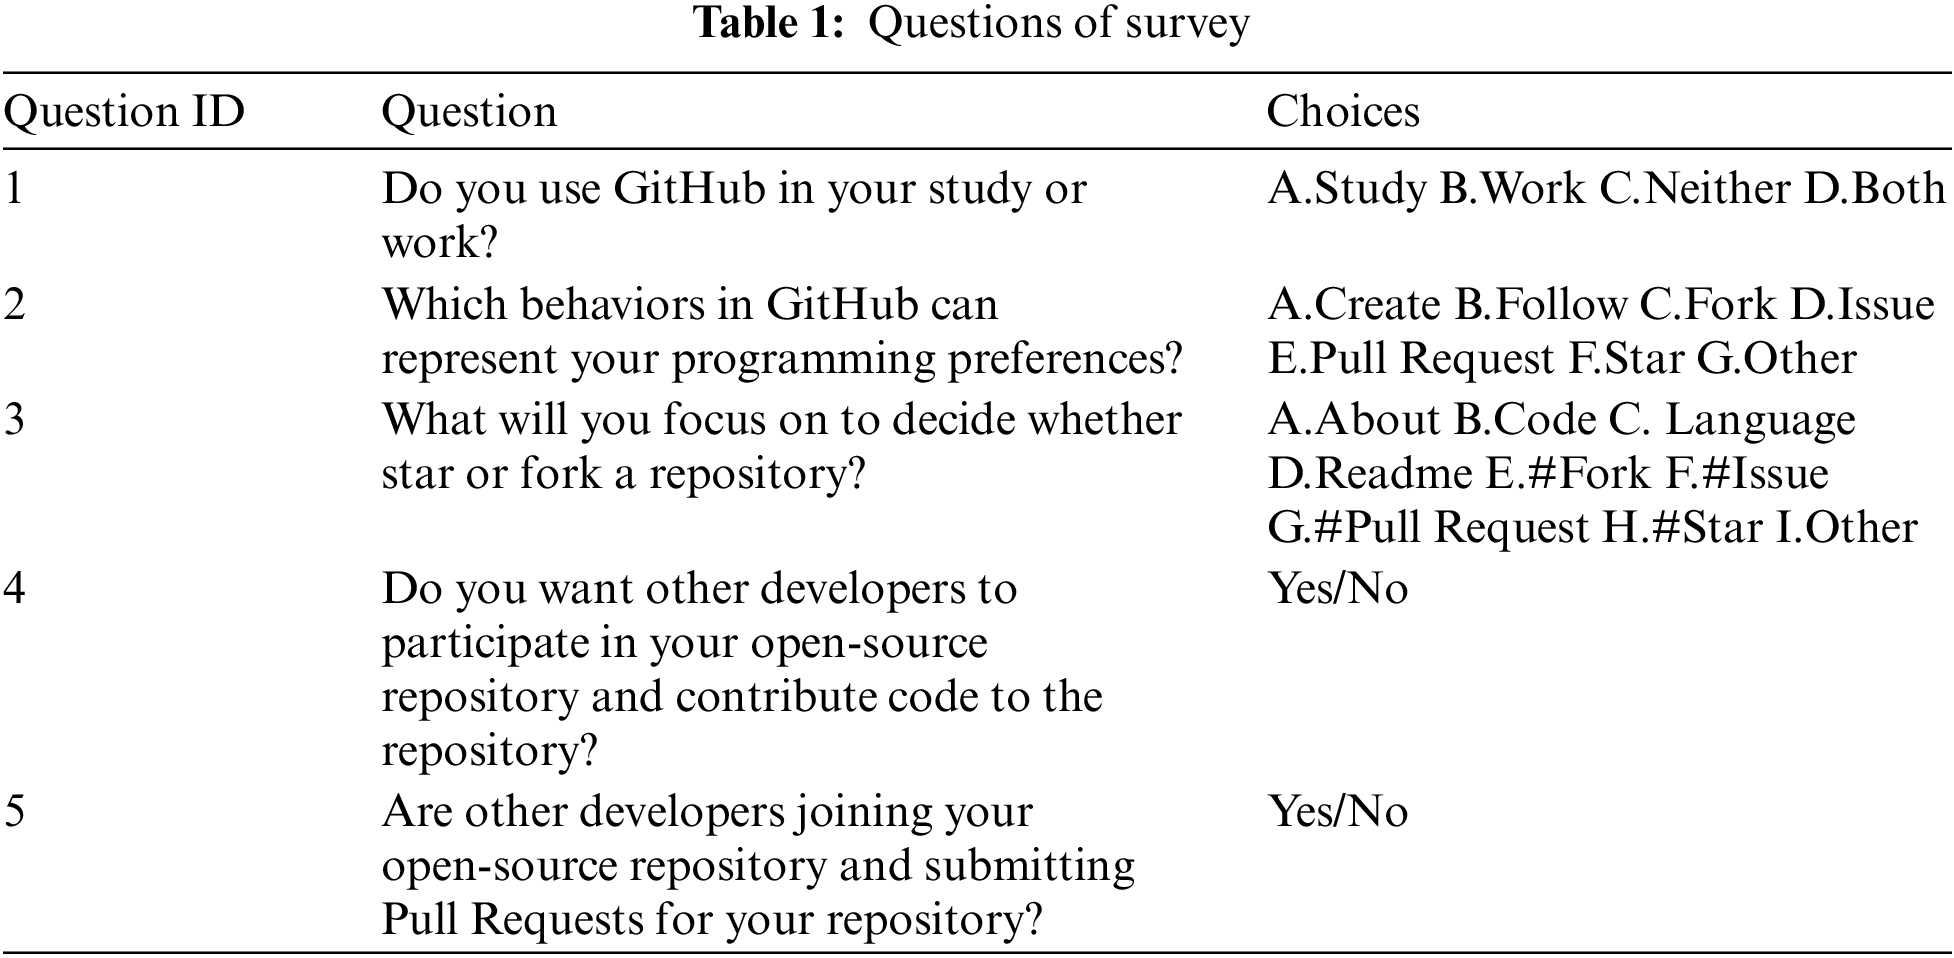
For the first question, we want to know whether developers use GitHub in their studies and work. For the second question, we hope we can understand which behavioral information reflects the developer’s programming preferences, programming preference means the user’s willingness to participate in the development of a project. And we offer the main behavioral information in GitHub as choices. For the third question, we hope to know what developers focus on most when they Star or Fork repositories, and we offer the main content in GitHub repository as choices. For the fourth question, we want to know whether developers want others to participate in their repositories. The fifth question is set to know whether others are involved in repositories created by developers surveyed.
In order to ensure that the respondents are related to software engineering, we selected 80 master’s students in software engineering from Central South University and 92 employees engaged in programming in Internet enterprises. These participants have at least 4 years of program development experience and their programming fields involve Android program development, Java Web program development, Machine Learning and so on. We sent out the questionnaire to the students in the school through the school email system, which can ensure that our email will not be regarded as spam and reduce the accuracy of the survey. From 80 postgraduates, we received 53 email replies, and from 20 enterprise staff, we received 4 replies. We further asked these respondents about their experience in using GitHub, of which 3 did not use GitHub, 14 had two years of experience, 18 had three years of experience, and the remaining 22 had more than three years of experience.
The questionnaire results for question 1 are shown in Fig. 1a. 94.7% of developers use GitHub in their studies or work, and 5.3% (3 developers) do not use GitHub. We further ask why these developers do not use GitHub. One developer replies that they usually use GitLab (a private code hosting platform similar to GitHub deployed by the company) for code development. Another developer answers similarly that his company still uses SVN and has not migrated to the Git platform. The third explains that he is not in the habit of using GitHub because his programming tasks are too few to collaborate with others.
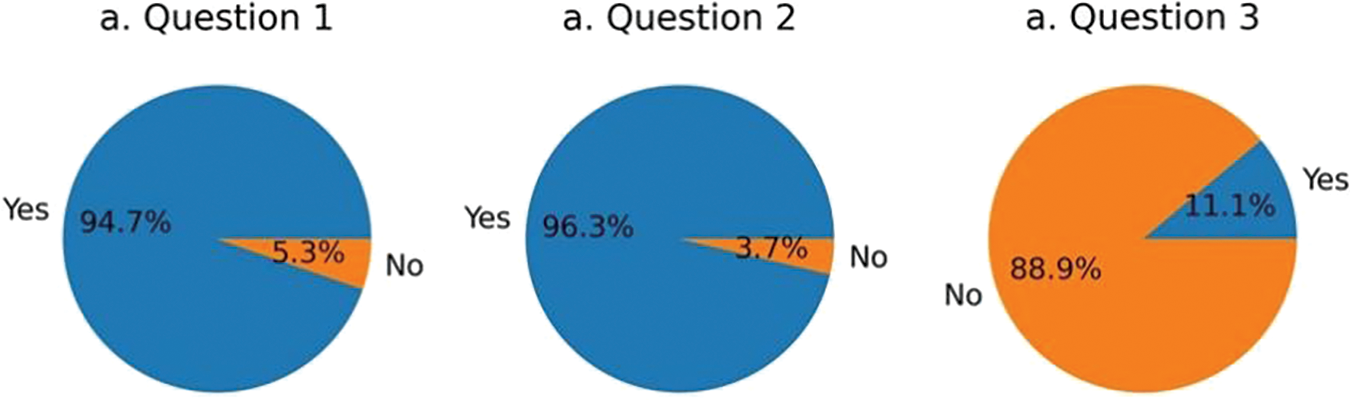
Figure 1: Results of Question 1, Question 4 and Question 5
To better investigate what developers pay attention to when browsing repositories, We excluded the 5.3% of developers who do not use GitHub. As they may be unfamiliar with the behaviors in GitHub, the results from them are tend to be inaccurate. The results show that most respondents (94.7%) use GitHub, indicating the popularity of GitHub as a social programming website and the broad audience for research work conducted on GitHub.
The result of Question 2 is shown in Fig. 2. As can be seen from Fig. 2, the behavior that best reflects the developers’ programming preferences is Create, with 83.3% of the answers. Pull Request, Fork and Star represent 59.3%, 46.3% and 37.0% of the responses, respectively, while Follow and Issue only account for 9.3% and 5.6%.
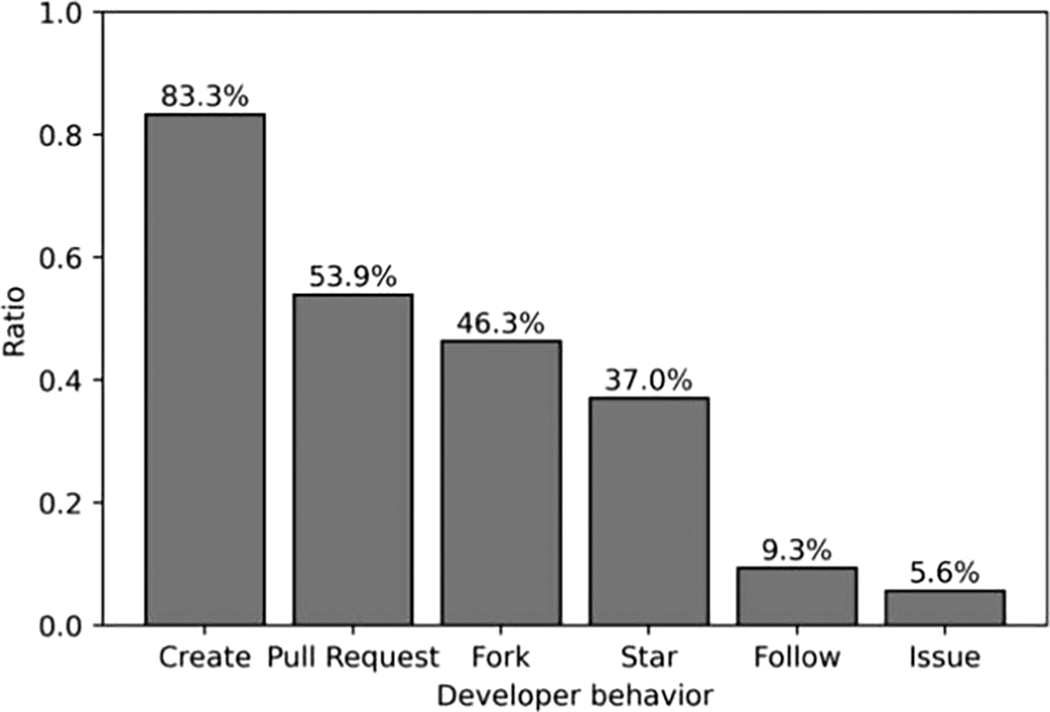
Figure 2: Result of Question 2
For Question 3, we categorized what developers would focus on, and the results are shown in Fig. 3. It can be seen that 81.5% of developers focus on the number of Star when considering whether to Star or Fork a repository, and 29.6% of developers pay attention to the number of Fork.
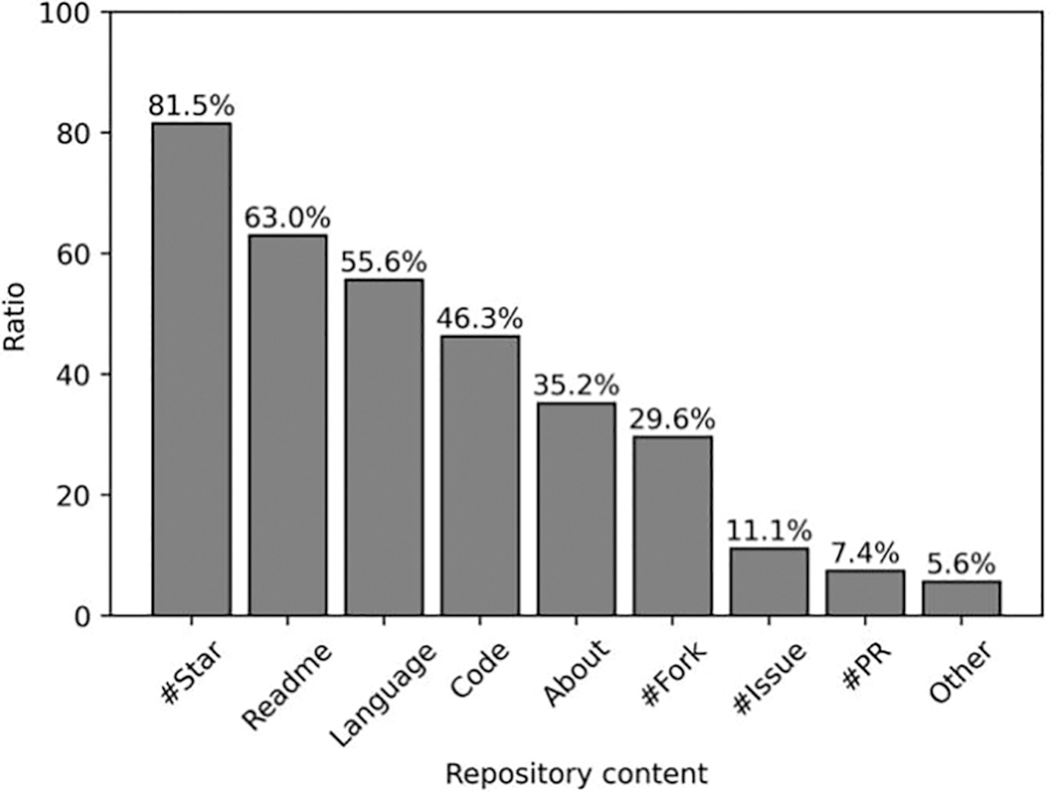
Figure 3: Result of Question 3
As important repository information, Readme, programming language, code, and About are concerned by 34 (63.0%), 25 (46.3%), 19 (35.2%), and 16 (29.6%) developers, respectively. This information reflects the functionality of the repository. Fewer developers (less than 12%) pay attention to information such as the number of Issue and PR.
Two participants mentioned other information, one of whom would be concerned about whether the repository is still being maintained. Another mentioned whether any companies are involved in the repository. Only two participants considered deeper reasons and the rest of participants chose the options we provided.
Therefore, behaviors including Create, Pull Request, Fork and Star can reflect developers’ programming preferences. Developers are more willing to Star or Fork popular repositories, which can be judged from repository information like Readme, programming language, code and About.
3.2.3 Repository Participation
For Question 4, Fig. 1b shows that 96.3% of developers want others to participate in their repositories and commit code. For Question 5, Fig. 1c shows that only 11.1% of the repositories created by developers have other people involved, and the remaining 88.9% of repositories have not received any Pull Request. The result shows that most developers hope to develop repositories with other developers in open-source communities. However, most repositories created by developers go unnoticed, and the development and maintenance of repositories are left to developers themselves or their teams. A recommendation system can improve this situation by recommending repositories to appropriate users, increasing repository exposure and developer engagement.
To recommend appropriate repositories to developers, we propose a Graph Convolutional Network-Based Repository Recommendation System (GCNRec). The model architecture of GCNRec is shown in Fig. 4. Firstly, we construct a Developer-Repository network by crawling GitHub data. Secondly, we extract the repository features and developer features from the repository content that developers are interested in. Thirdly, GCNRec takes the Developer-Repository network and the node features (repository features and developer features) as input, uses a multi-layer graph convolutional network to learn the network structure and updates the node features. Finally, GCNRec recommends the top-k repositories that developers are most likely to be interested in based on the node feature matrix learned by the model.
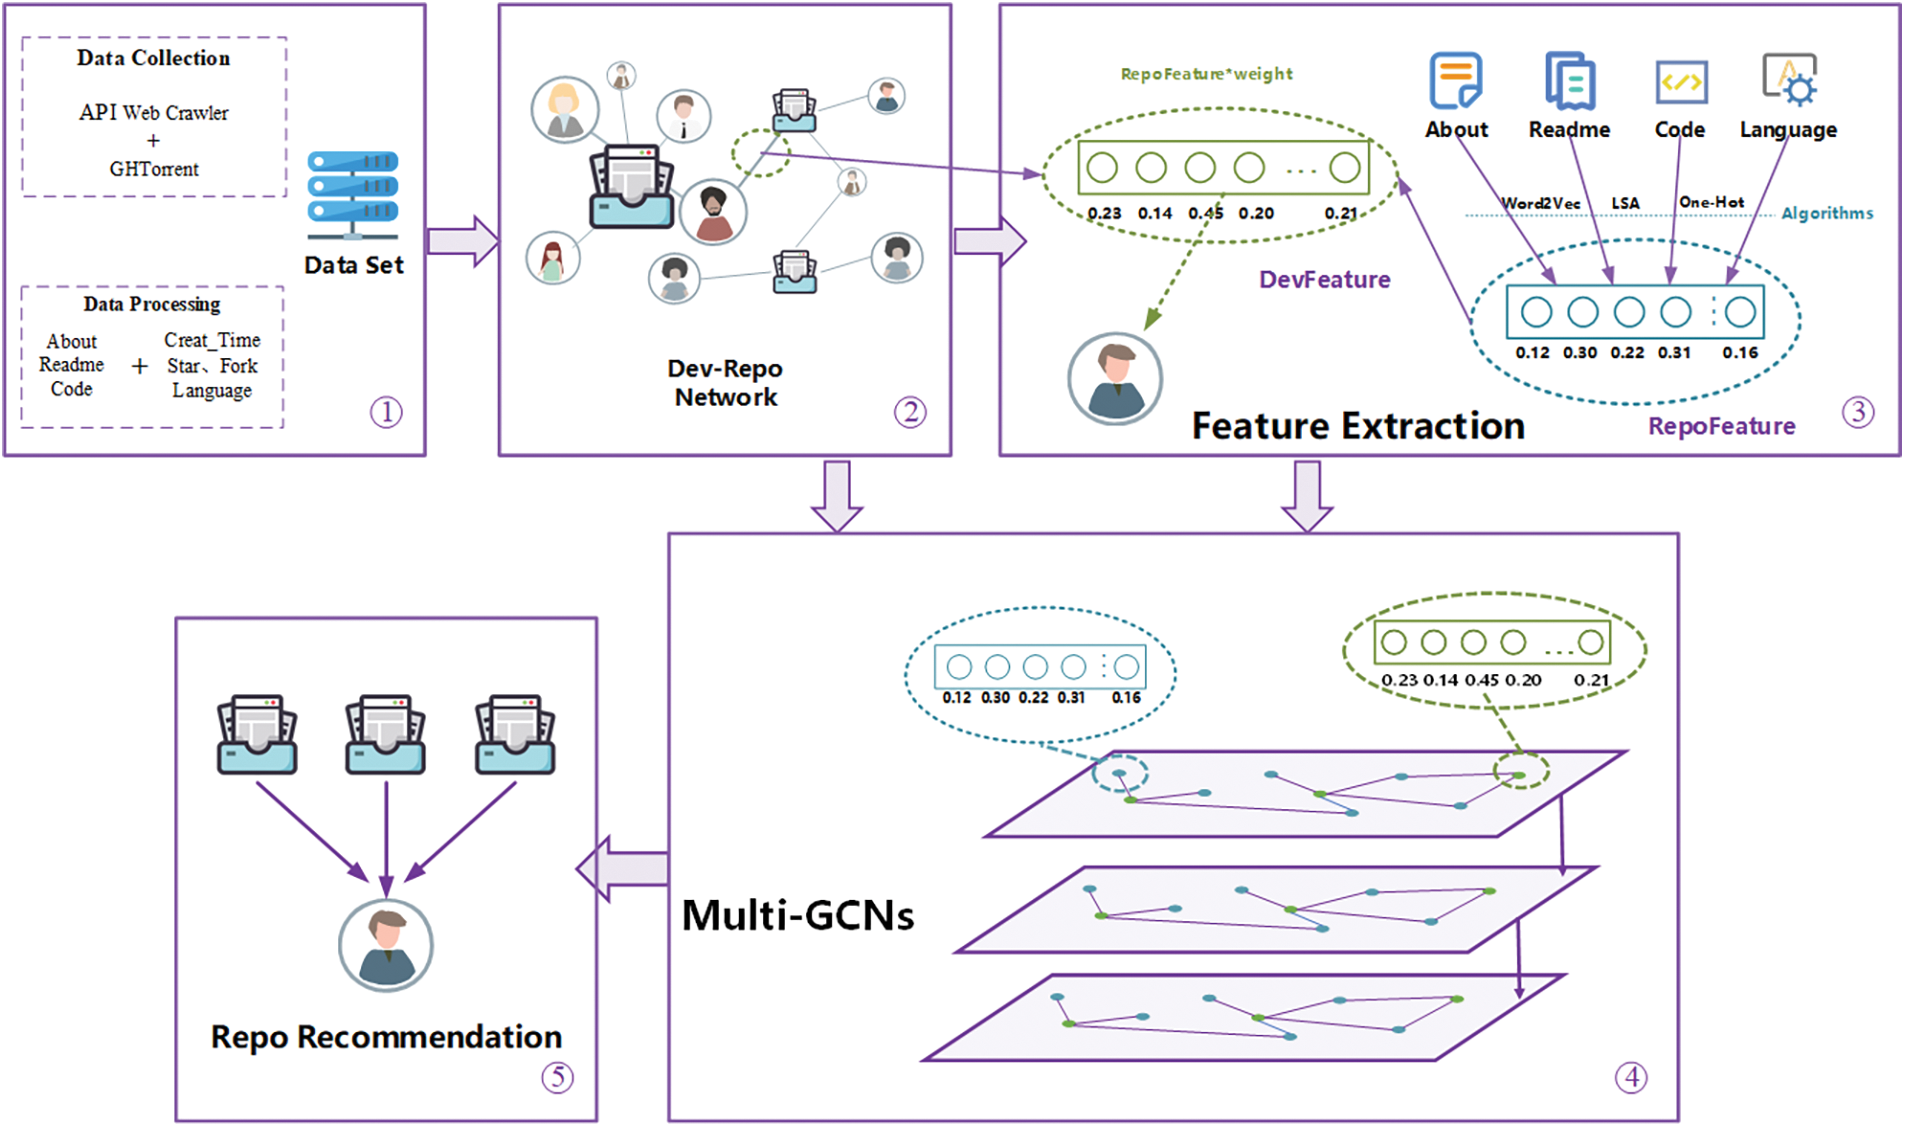
Figure 4: Overview of the GCNRec: (1) Data collection and data processing; (2) Developer-Repository network construction; (3) Repository features and developer features extraction; (4) Recommend model construction; (5) Repository recommendation
4.1 Developer-Repository Network Construction
Based on the questionnaire results, we construct the Developer-Repository network using the four behaviors that best reflect developers’ programming preferences: Create, Fork, Star, and Pull Request.
A Developer-Repository network can be expressed as
1. The set of nodes
2. An edge between the developer and the repository represents that the developer performs at least one of the Create, Fork, Star, and Pull Request operations.
3. Since the weight of edges represents developers’ interest in the repository, we set different weights for each type of developer behavior. The weights of Create, Pull Request, Fork, and Star are denoted as
4.2.1 Repository Features Extraction
The home page of a repository in GitHub usually contains the following information: repository name, number of Watch, the number of Star, the number of Fork, About (used to describe the function of the repository briefly), Code, Readme (used to describe the function of the repository in detail and how to use the repository) and Language (code programming language). According to the questionnaire results, the number of Star, the number of Fork, Readme, Language, Code and About are the main concerns of users when they Star or Fork repositories. The number of Star and Fork can be expressed by the in-degree of repository nodes in the Developer-Repository network. Four text contents, including About, Code, Readme and Language, need to be converted into vectors by feature extraction.
AboutFeature: The About field is mainly used to describe the usage of repositories and does not involve details, so the text is usually short. We first remove the pause words and punctuation in the About text. Then, the Word2Vec model is applied to train the About text and encode each word as a vector with length L1. The vector of About text can be expressed as the mean value of each word vector, as shown in formula (1).
where
CodeFeature: The code is the crucial repository content, and developers can obtain detailed information about repositories from source code files. The following steps are used to extract code features:
1. Remove symbol
There are various symbols in the code files of repositories. For example, {} is used to distinguish code segments, parameters of methods are defined in () and ‘.’ is often used by method calls in Java. The same symbols may have different meanings in different languages. For example, {} is used to represent the dict data type in python. Therefore, there is no uniform standard to distinguish the meaning of a symbol. For this reason, we remove the symbols from the code and keep only the words in the code.
2. Variable name split
Study show that the vocabulary of code is much larger than that of natural language due to a large number of custom variable names in the code, which can be any combination of words or a combination of word abbreviations and acronyms. Fig. 5 shows a snippet of Android code, in which SampleActivity is a programming vocabulary that consists of Sample and Activity and does not exist in the natural language dictionary. Similar variable names include savedInstanceState, WRAP_CONTENT, etc., which are combinations of two or more words. In general, variables are named following the Camel-Case (the first letter of uppercase words is used to distinguish word boundaries, such as SampleActivity) and the Underscore-Case (underscores are used to distinguish word boundaries, such as WRAP_CONTENT). These two rules also name variables for the official software library, such as LayoutParams in Fig. 5, which is a class in the Android SDK and is widely used in Android repositories. Due to the different naming habits of developers, different developers may design different variable names when expressing the same meaning, but the words in the variable names may be partially similar. Therefore, the same variable name may appear several times in one repository but rarely between repositories.
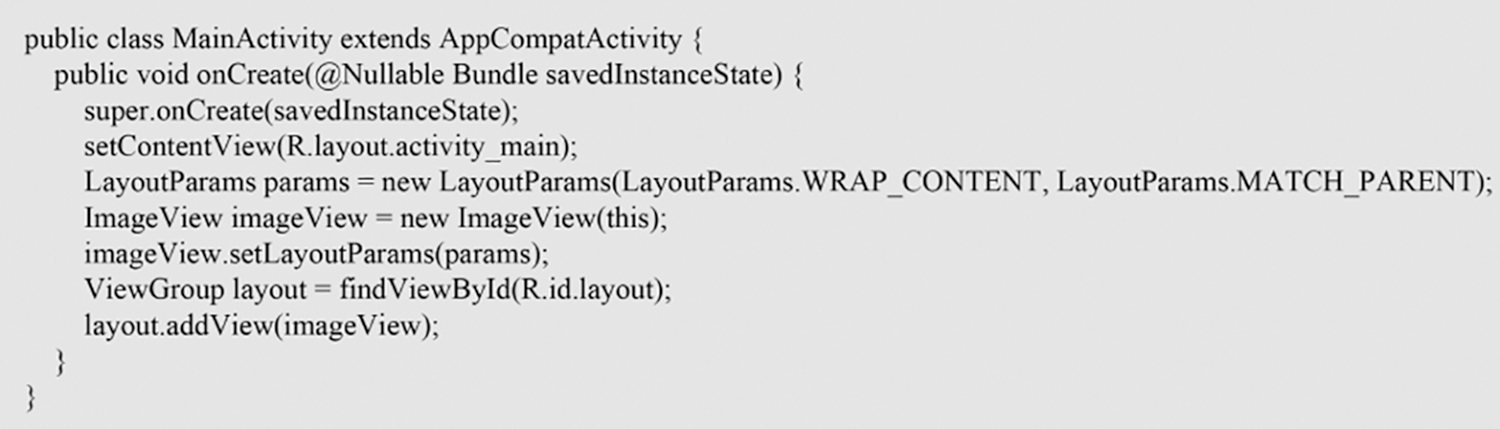
Figure 5: A snippet of Android code
Therefore, we consider variable names that appear less than T times between multiple repositories as variable names named by developers. Such variable names are split into several words to replace the original. Besides, we do not perform splitting for those official or third-party APIs that appear more than T times.
3. Vector representation
Due to a large amount of code vocabulary, using the vector space model (VSM) to represent the code content may face large vector dimensionality and vector sparseness. Therefore, TF_IDF is used to calculate the weight of each word, and then the LSA model is used to calculate the latent semantic encoding of the repository. The TF_IDF calculation formula is shown in formula (2).
where
Based on this, a repository code can be represented as a vector
The LSA model can map the repository vector
ReadmeFeature: The Readme field contains many contents, such as the purpose and usage of repositories, copyright information, and methods of participating in the repository. The Readme text is usually written in Markdown format and contains many Markdown tags, and some of the Readme text contain code blocks, image links, etc., so it is necessary to preprocess the Readme files. Firstly, regular expressions are used to remove Markdown tags, code blocks, hyperlinks, and punctuation. Secondly, stop words without practical meaning should be removed in the Readme files. TF_IDF and the LSI model are then used to calculate the weight of words and extract the semantic feature of the Readme text, respectively. The Readme text of each repository is finally converted into a dense vector of length L3.
LanguageFeature: Most developers only master a few languages used for repository development, so they prefer to create repositories with their familiar languages. What’s more, they are more interested in repositories developed in familiar languages when browsing repositories. The questionnaire results show that 46.3% of developers pay attention to the programming languages of repositories. Therefore, we extract the language feature of repositories by converting the language into a vector of length L4 by one-hot encoding.
We concatenate the above features into a vector as the overall feature of the repository r, which can be expressed by formula (4).
4.2.2 Developer Features Extraction
In GitHub, there is no textual content about developers’ programming preferences on their homepage, so the developer’s preference feature cannot be directly obtained. The questionnaire results show that 4 developer behaviors (Create, PR, Fork, and Star) can reflect developers’ programming preferences. Therefore, the developer’s preference feature can be obtained by repositories corresponding to those behaviors. The About, Readme, Code, and Language features are also components of the developer’s preference feature, as they contain developers’ preference for repository content. We obtain the developer’s feature by calculating repository features with weights of connected edges, and the preference feature for developer d can be formulated as follows:
In the above equation,
4.3 Model Construction and Repository Recommendation
Recent years, deep learning have achieved exciting results in recommendation field [20], and graph convolution neural network is a deep learning method for graph data, which can effectively extract graph structural features. Therefore, we build a repository recommendation model based on a graph convolution neural network. We take the Developer-Repository network and its node features (repository features and developer features) as the model’s input and use the multi-layer graph convolution network to learn the network structure and update the node features. We predict the top-k repositories that developers are most likely to be interested in as the repository recommendation results through graph encoding and graph reconstruction. The model includes graph encoding and graph reconstruction.
Graph encoding: We use k-layer GCN to embed the nodes of the Developer-Repository network to obtain the graph embedding matrix
where X =
Graph reconstruction: We use the graph embedding matrix
We use the cross-entropy loss function to minimize the reconstruction error of the model:
The weight
In this section, we first describe the statistical results of the dataset and introduce the evaluation metrics of the method. Secondly, we set the necessary parameters of the model, and conduct exploratory experiments on the key parameters to make the model achieve the best performance. Thirdly, we conduct ablation experiments on the proposed feature extraction method to prove its effectiveness. Finally, in order to evaluate the recommendation effect of the model, we compare our model with the other two recommendation methods. The two baseline methods were reused original methods. we ran the results on both methods using the same data set and compared the results with our own GCNRec methods.
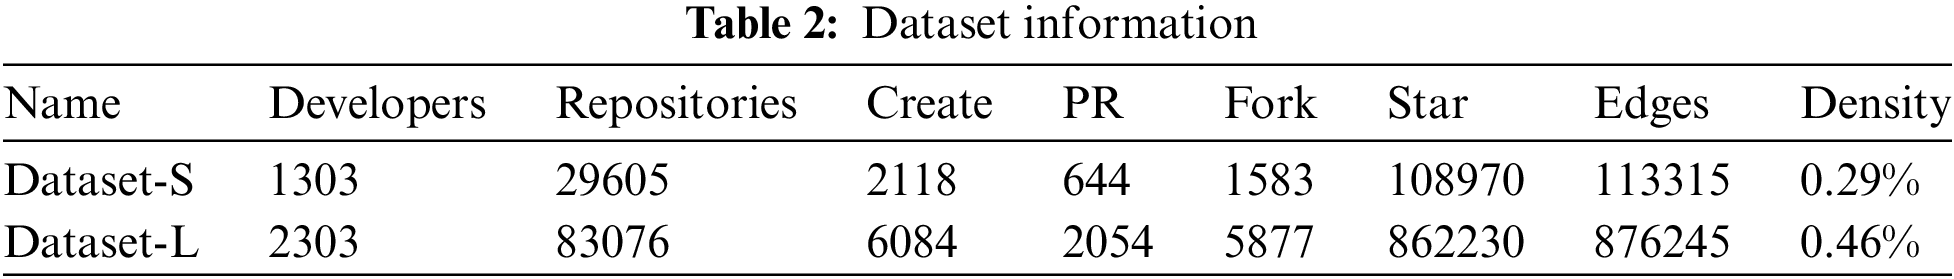
In order to accurately evaluate the performance of the model, we must evaluate each model on the same dataset. There is no open dataset in previous work that contains multiple language repository, therefore, we need to crawl the real behavior data and repository information of GitHub. We try to crawl the developers and repositories in the same programming domain, because the developers and repositories in the same domain can make the developers and repositories have denser behavior data. Specifically, we download the GitHub database from the GHTorrent website [21] and collected 2303 developers who have forked the hdodenhof/circleimageview3 repositoy and whose behavior records are greater than 10. Then, repositories which are related to these developers are collected, with a total of 83076 repositories and 876245 behavior records. We represent this dataset as Dataset-L. In order to evaluate the performance of the model on sparse dataset, we deleted 1000 developers with the largest number of behaviors among 2316 developers, and finally retained 1303 developers, 29605 repositories and 113315 behavior records. We represent this dataset as Dataset-S. The specific information of the dataset is shown in Table 2. As can be seen in the table, density of Dataset-S is 0.29% and density of Dataset-L is 0.46%. Therefore, compared with Dataset-L, Dataset-S is much sparser. Network density is the ratio of the actual number of edges in the network to the upper limit of the number of edges accommodated. It can be used to describe the density of edges among nodes in the network. The calculation formula is shown in formula (13).
In order to visually display the data distribution, we have counted the in-degree of each repository node, and calculated the proportion of the in-degree of each repository in the edge of the dataset. The result is shown in Fig. 6. Figs. 6a and 6b show the distribution of the in-degree proportions of repositories in Dataset-L and Dataset-S, respectively. The orange dashed line in Fig. 6 represents the 10% cut-off point of the number of repositories. In Fig. 6a, the in-degree of the 10% repositories on the left occupies 66.9% of the in-degree of Dataset-L. In Fig. 6b, the in-degree of the 10% repositories on the left occupies 57.8% of the in-degree of Dataset-S, which shows that more than 50% of the edges in the two datasets point to the most popular 10% of the repositories. In GitHub, only a few popular repositories have received wide attention, and most other repositories have received less attention [22–24], which is consistent with the distribution of the datasets.
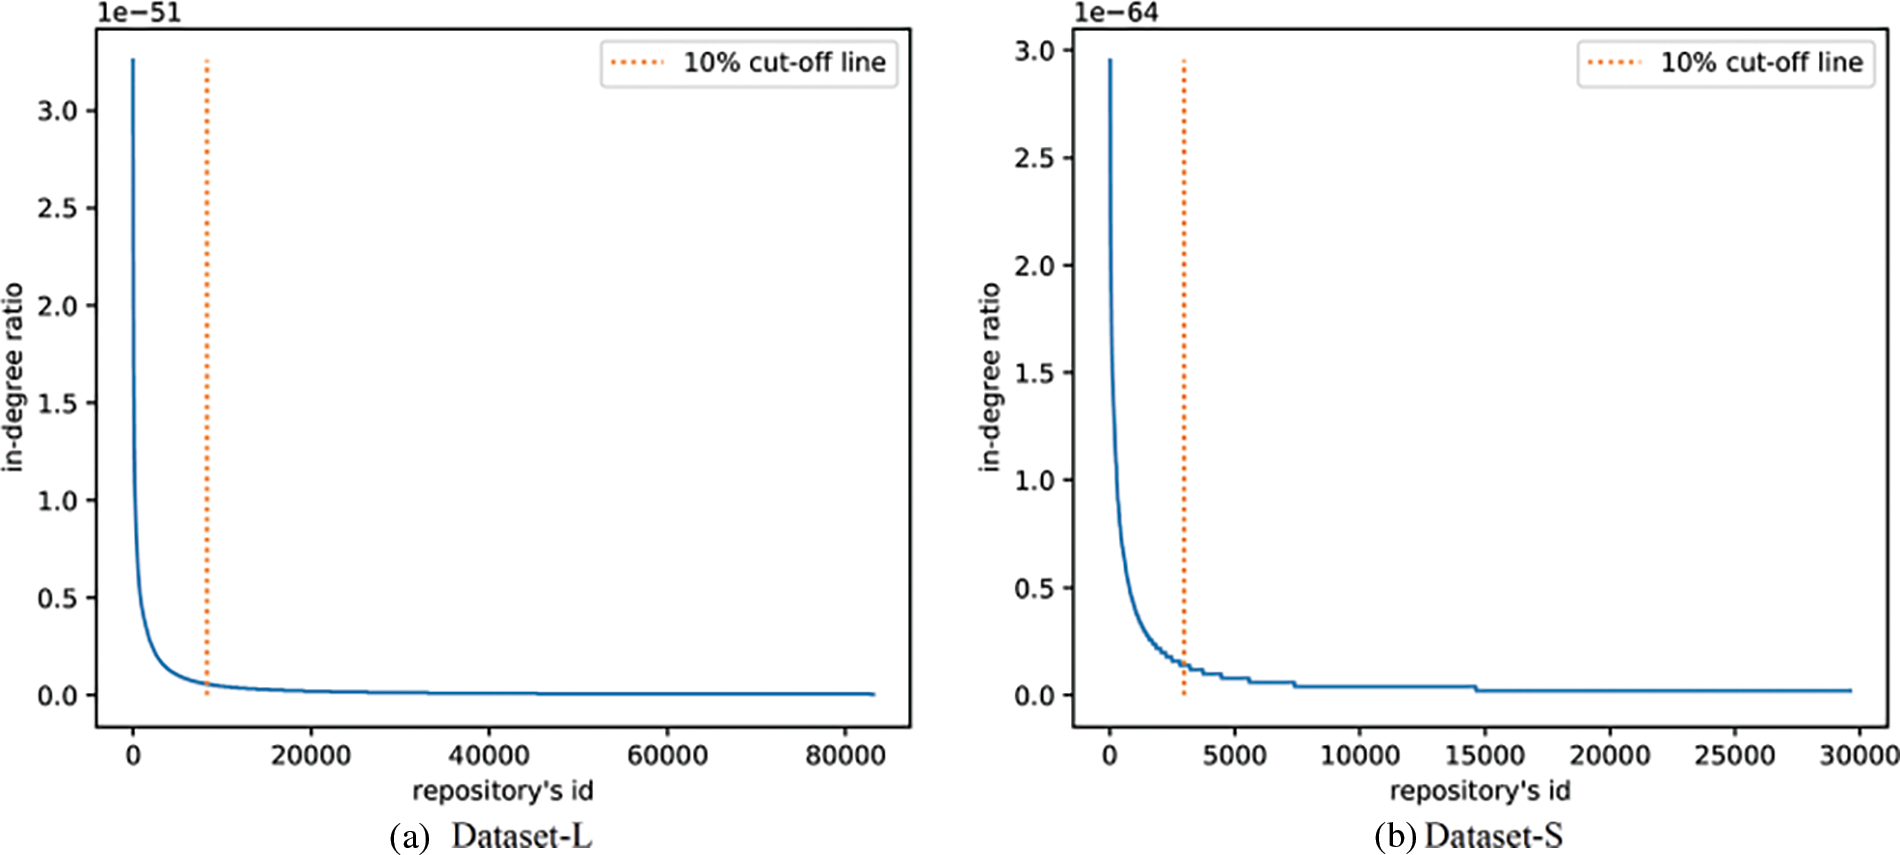
Figure 6: In-degree distribution. A is the distribution of Dataset-L, b is the distribution of Dataset-S, the orange dotted line identifies 10% of the repositories
During GCNRec training, it is necessary to evaluate the effect of the model through positive examples (pairs of nodes that have edges in the dataset) and negative examples (pairs of nodes that have no edges in the dataset) to verify the distinguishing effect of positive samples and negative samples. Therefore, we use the Area Under Receiver Operator Characteristic Curve (AUC) evaluation metric, the most common evaluation index in the field of graph neural network [25], to evaluate the model classification effect during model training.
When making repository recommendations, it is necessary to recommend top-k open-source repositories for each developer, so we use hit rate [26], recall and precision [12,27] to measure the effect of the model. The two metrics are defined as follows:
where
Hit rate can measure the number of developers that the recommended model is applicable to. The larger the hit rate value, the higher the proportion of developers that the model is applicable to. precision represents the proportion of correctly recommended repositories.
The GCNRec model needs to set the lengths of repository features and weights of developer behaviors. We set the length L1 of AboutFeature in the repository features to 100, the length L2 of CodeFeature to 100, and the length L3 of ReadmeFeature to 100. We set the dimension to 100 which is shown to be effective [28], and these values will be constantly updated by GCN. Since there are 163 programming languages in our dataset, we set the length L4 of LanguageFeature to 163. Therefore, the dimension of the repository feature is 463, and the dimension of the developer features is also 463. Based on the questionnaire results, the importance of Create, Pull Request, Fork, and Star decrease in turn, we use the following formula to calculate the weight for every behavior:
So, we set
We ran the experiment on a server with Intel(R) Xeon(R) Silver 4210 2.20 GHz CPU, 128 GB RAM and GeForce RTX 2080ti GPU running the Ubuntu 16.04.7 LTS operating system.
5.4 Hyperparameter Influence Experiment
The GCNRec uses multiple layers of GCN to learn network structure information and node features information, so the number of GCN layers in the model will affect the model performance. In order to explore the impact of the number of GCN layers on the model performance, we set the embedding dimension of GCN to 32. The number of GCN layers was increased from 1 to 10, and experiments were carried out in Dataset-L. The results are shown in Fig. 7. Fig. 7 shows that when the number of GCN layers is 2, the model performance is the best. As the number of model layers increases, the overall AUC value of the model shows a downward trend. This is because as the number of GCN layers increases, the embedding of each node will be similar, which is not conducive to backpropagation to update GCN parameters.
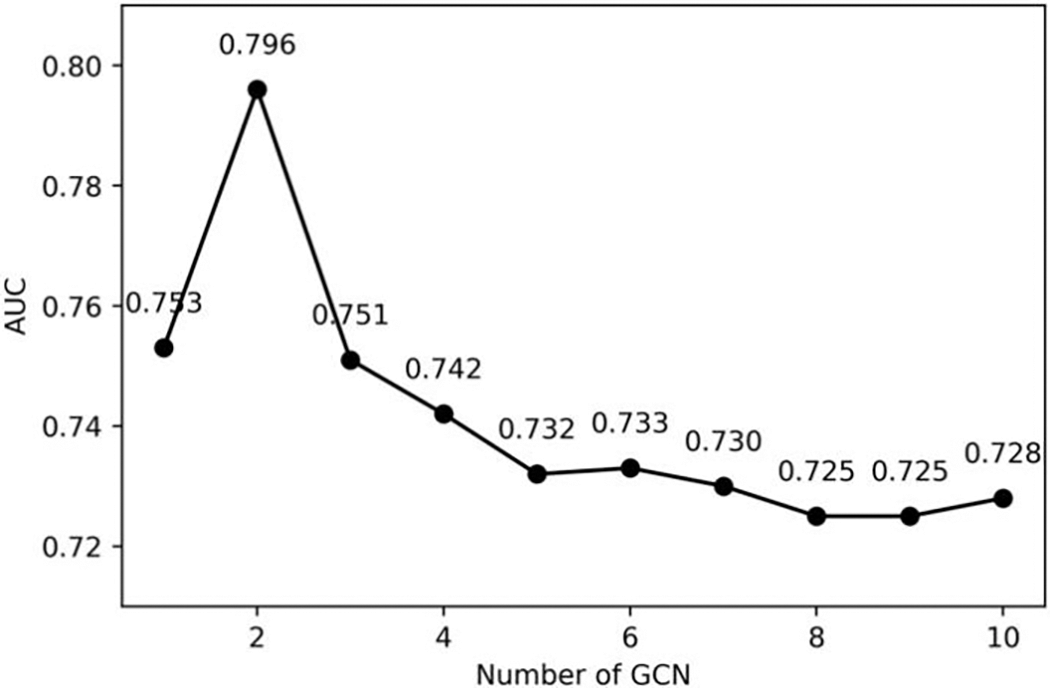
Figure 7: Impact of GCN layer. The points in the figure represent the best results obtained by the model with different GCN layers
We calculated the cosine similarity between the node embeddings output by the multi-layer GCN, the number of GCN layers increased from 1 to 10, and the cosine similarity of the embedding is shown in Fig. 8. Fig. 8 shows that as the number of GCN layers increases, the similarity of embedding continues to increase. When the number of GCN layers increases to 5, the embedding cosine similarity between nodes is greater than 0.97, and the AUC has dropped to 0.732, so if the number of GCN layers increases, the effect will decrease. When there is only one layer of GCN, the AUC value is 0.753. Although the similarity of embedding is low, the ability of one layer of GCN to extract network structure information and node features information is weak. Therefore, when two layers of GCN are used, our model achieves the best AUC value, so we set the GCN layer number of the GCNRec to 2 layers.
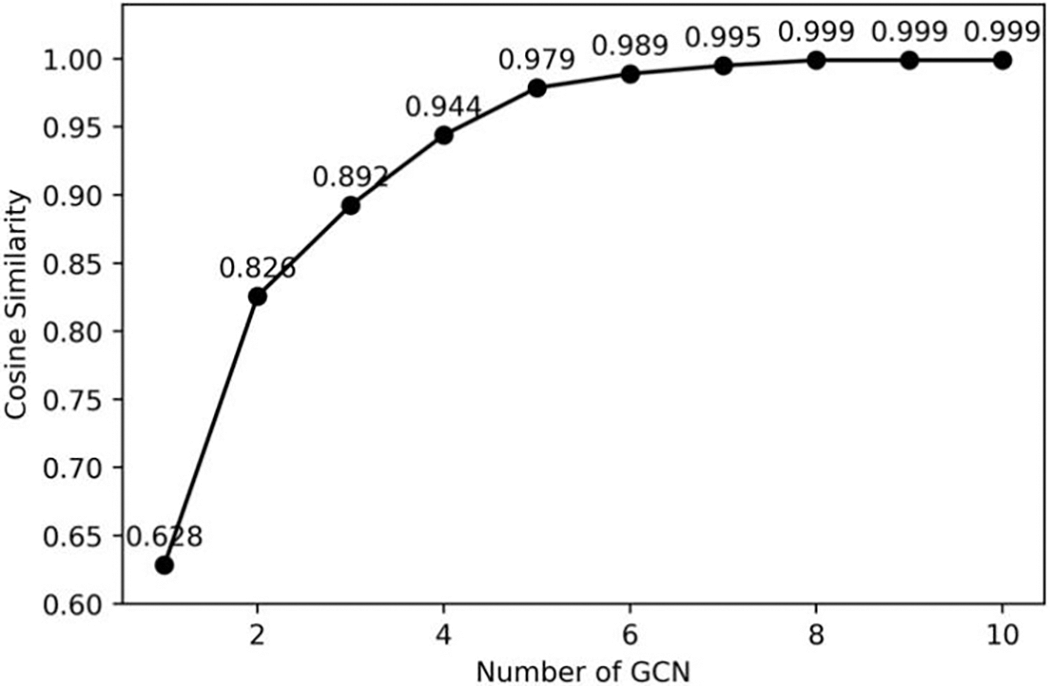
Figure 8: Embedding similarity. The points in the figure represent the embedding similarity between different nodes under the number of GCN layers
5.4.2 The Impact of Dimension of Embedding
The dimension of embedding output by GCN is an essential factor to impact model performance. In order to explore the impact of the dimension of embedding, we increase the dimension from 8 to 512, carry out the experiment on Dataset-S, and report the result in Fig. 9. It shows that as the dimension increases, the AUC value of the model continues to increase because a larger dimension can contain more information, making the model more effective. However, when the vector dimension is increased to 32, the model effect tends to be stable. A larger dimension will only take a longer training time without significantly improving the model performance, so we choose 32 as the final dimension.
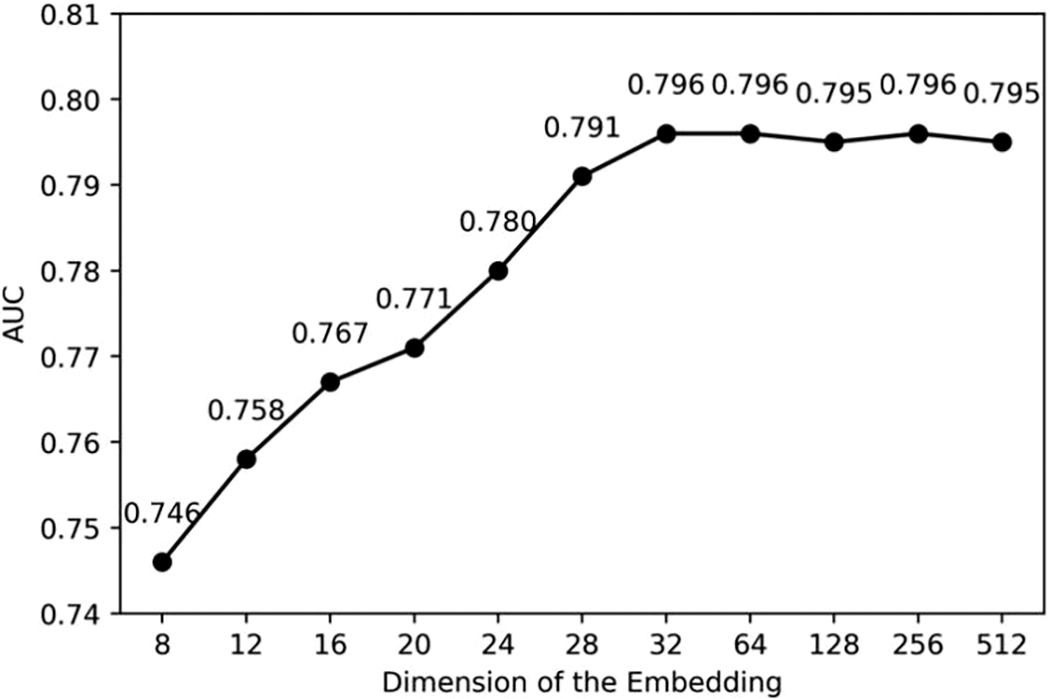
Figure 9: Impact of the dimension of the embedding. The points in the figure represent the best results obtained by the model with different dimension of the embedding
5.5 Experiment of Feature Ablation
In order to verify whether the features we constructed improve the model performance, we conducted experiments on Dataset-S. We separately used each type of features as the repository feature, reconstructed the developer feature by formula (5), respectively, and calculated the AUC value of the model under the four types of features. A random vector is assigned to each node through a random function, and the AUC value of the model is calculated. The final result is shown in Fig. 10.
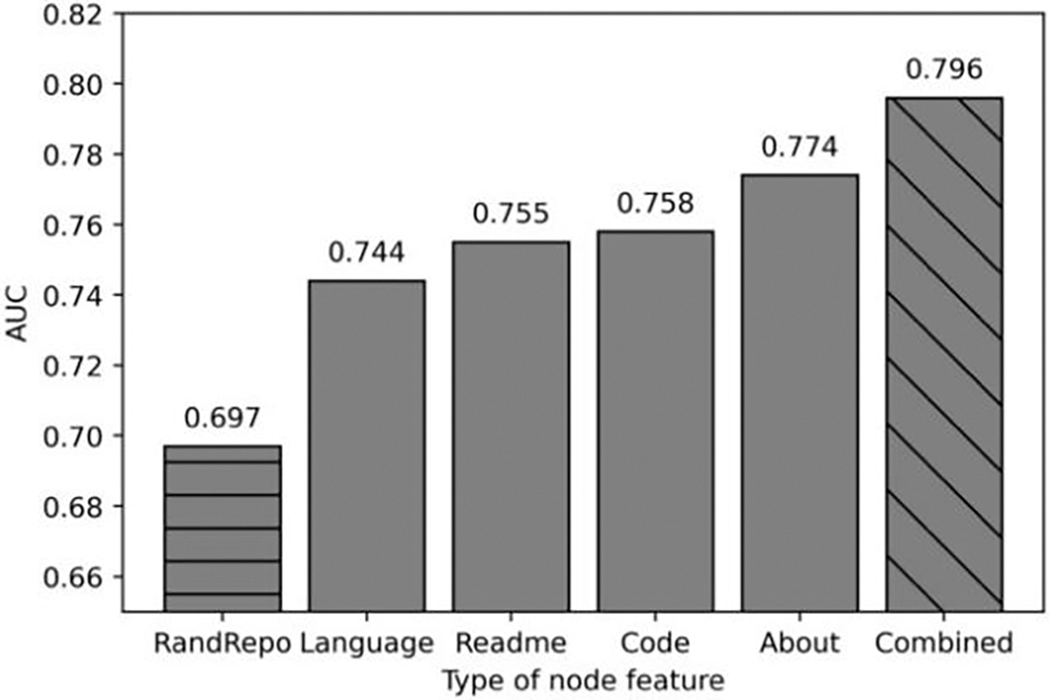
Figure 10: Repository feature ablation result. RandRepo represents that the repository features are randomly generated. Language, Readme, Code and About represent the repository features are generated by our algorithm but only use Language, Readme, Code and About content respectively. Combined represents the repository features were extracted by our algorithm using four content information
Fig. 10 shows that when repository features are randomly constructed (presented as RanRepo in Fig. 10), the AUC value obtained by the model is 0.697. When the repository Language, About, Readme, and Code are used as repository features (presented as Combined in Fig. 10), the AUC values obtained by the model are all higher than the randomly constructed repository features, which shows that these four types of information can improve the performance of the model, which is conducive to open-source repository recommendation. When the four features are combined, the model can achieve the best performance, and the AUC value is 0.796.
In order to find out whether the developer features can improve the model performance, we conducted ablation experiments on the developer features. We generate a random vector as the developer features (represented as RanDev in Fig. 11), and combined it with the extracted repository features for model training, and report the results in Fig. 11. Fig. 11 shows that when random developer features are combined with the four types of repository features to train the model, the AUC is less than 0.528, indicating that the performance is poor. When the developer preference features are randomly generated, the repository features generated with four types of information can still achieve the best results (0.573), showing that combined repository features can get better performance. It is worth noting that when we use random developer features and random repository features, the AUC of the model can reach 0.696, which is better than using random developer features and extracted repository features. This is due to the large difference in distribution between the randomly generated developer features and the extracted repository features, making the model performance poor. When the node features all use randomly generated vectors, the node features are distributed similarly so that a higher AUC value can be reached. When using our proposed method to extract developer features and repository features, the AUC value of the model can reach 0.796, which is far better than randomly generated developer features. Therefore, our proposed feature extraction method is very effective.
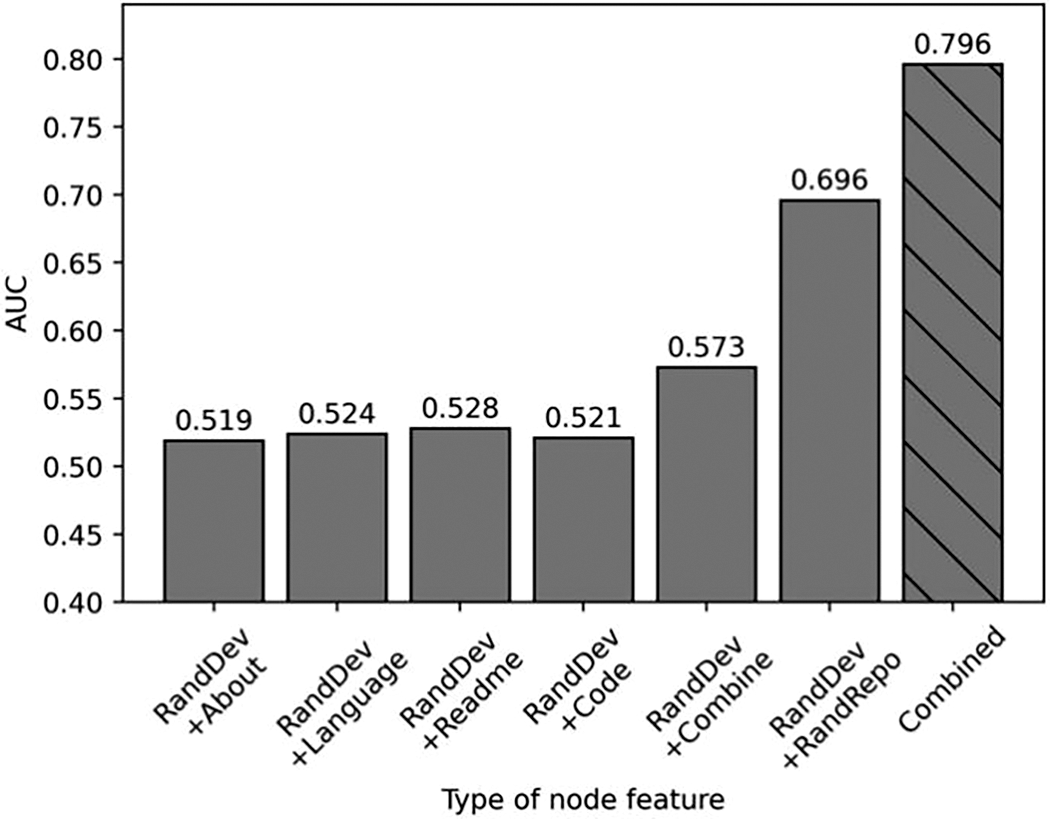
Figure 11: Developer feature ablation result. The first four bars indicate that the developer features are randomly generated and the repository features are constructed by our algorithm using one content information. The fifth bar indicates that the developer features are randomly generated and the repository features are constructed by our algorithm using four content information. The sixth bar indicates that the the developer features and the repository features are both randomly generated. The seventh bar indicates that the the developer features and the repository features are both generated by our algorithm
We conducted performance evaluation experiments on the actual dataset and compared it with the two existing methods. The effectiveness of our method was verified by comparing the two models. The models used for comparison are as follows:
Repository recommendation system based on GitHub community partition (CPRec) [17]: The CPRec recommendation model uses the Infomap community division algorithm [29] to divide the Developer-Repository network into multiple communities and give developers repositories from the same community.
Recommendation system based on developer behavior and repository information (BCRec) [6]: BCRec calculates the similarity between repositories by Readme and Code, and calculates the similarity between candidate repositories and the repositories that the developers have created, Fork, and Star. Recommend the repository with the highest score to the developer.
The GCNRec model was empirically evaluated in the datasets Dataset-S and Dataset-L, and the recommended results were compared with BCRec and CPRec. The comparison results are shown in Table 3. The results show that our method has higher hit rate and precision on both datasets than BCRec and CPRec.
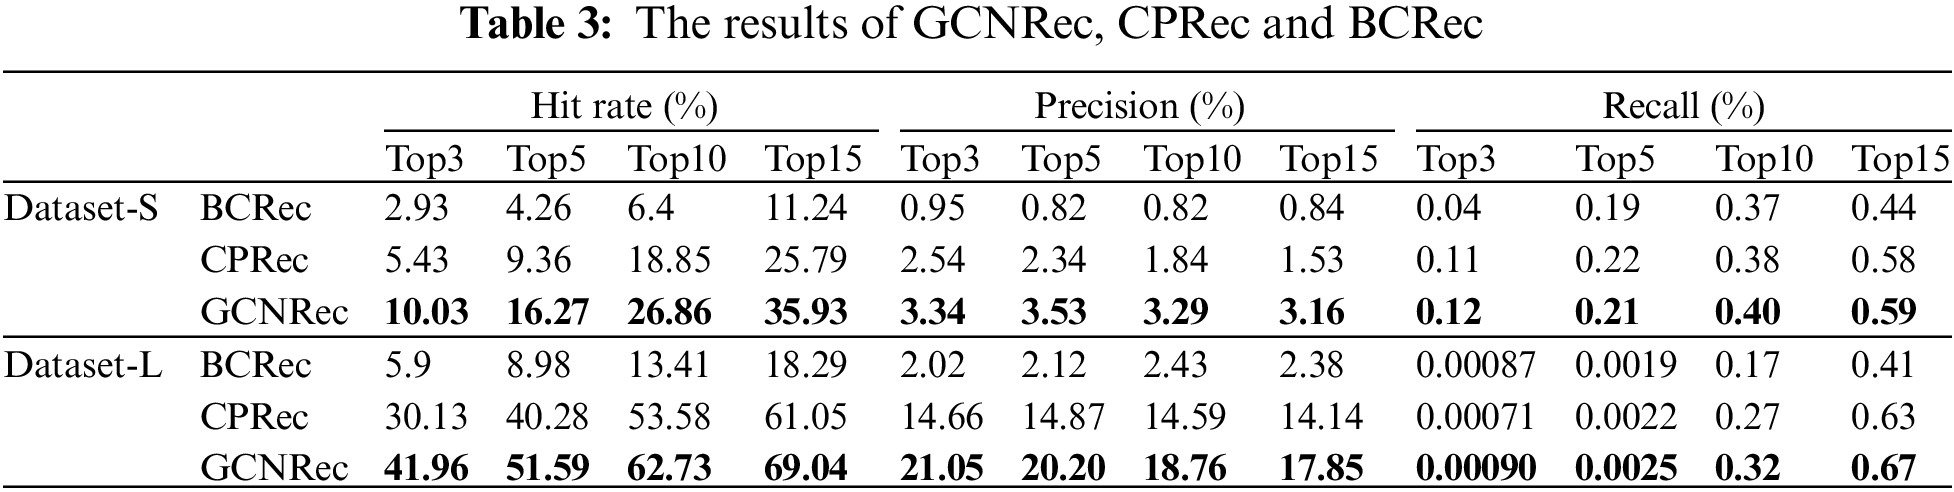
On the Dataset-S, the hit rate of each model increases as the number of recommended repositories increases. The optimal results of the hit rate of BCRec and CPRec are 11.24% and 25.79%. In comparison, the hit rate of GCNRec can reach 35.93%, exceeding 10% of CPRec, which means when 15 repositories are recommended for each developer on Dataset-S, GCNRec can hit 10% more developers than other models. For precision, BCRec and CPRec reached the best in Top3, 0.95% and 2.54%, respectively, while GCNRec reached the best in Top5, 3.53%, which shows that the proportion of correctly recommended repositories of GCNRec is higher than BCRec and CPRec. The poor performance of BCRec is because BCRec uses less developer behavior, does not make full use of the network topology, and only considers the similarity of Readme and Code, so the performance is not good. CPRec uses the network topology information to divide the community, so the candidate repositories are not selected from the entire test set, but from the same community, so the recommendation results are better, but hit rate and precision are still lower than GCNRec. The method we propose makes full use of the four repository contents of About and Readme, Code and Language, and uses the four developer behaviors of Create, Fork, Star, and PR for repository recommendation. Recommendation results in Top3, Top5, Top10, and Top15 of GCNRec have achieved the best hit rate and precision.
Compared with Dataset-S, Dataset-L has more developer nodes and repository nodes, and the network built by Dataset-L is denser, with an average of 380 edges per developer. In comparison, there are only 87 edges per developer in Dataset-S, so Dataset-L has richer developer behavior information. GCNRec can use the developer behavior information and repository information of the entire network, so it performs better in Dataset-L than in Dataset-S. For example, in the recommended results of Top10, the hit rate of GCNRec in Dataset-S is 26.86%, but the hit rate on Dataset-L can reach 62.73%, which is an impressive recommendation performance. The precision of GCNRec in Top10 recommendation in Dataset-L is 18.76%, which means that of all the candidate repositories recommended for each developer, 18.76% are actually of interest to the developer. The recall of GCNRec in Top10 recommendation in Dataset-L is 0.32%, which means that 0.32% of the set of repositories related to user are recommended. Among the top3-top10 project recommendations, the recall rate of dataset-S was higher than that of dataset-L, it is because the sparse dataset had much less edges between users and projects, so the denominator T(u) of the recall rate became smaller, resulting in a higher overall recall rate. Recommendation results in Dataset-L of GCNRec have achieved the best hit rate, recall and precision compared to the other methods.
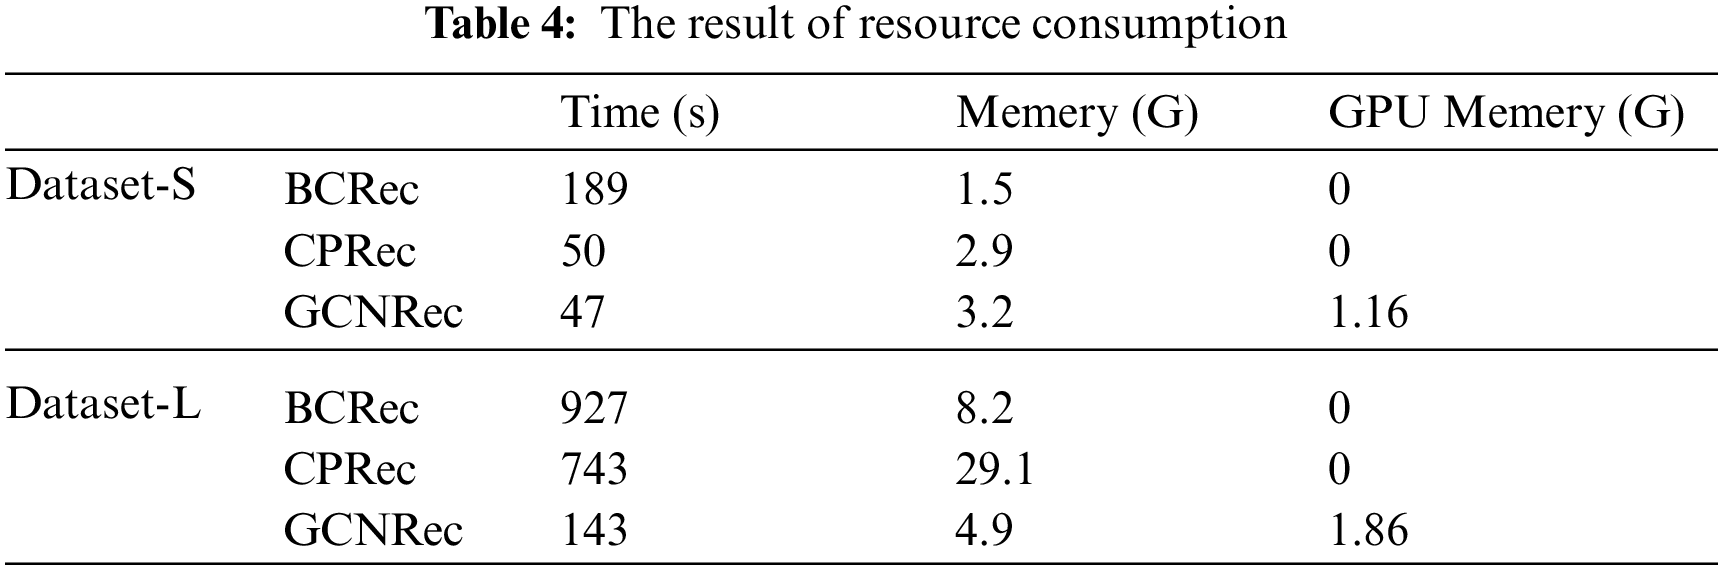
In addition, we compared the time, memory and GPU memory required to run the three methods. The results are shown in Table 4. Table 4 shows that GCNRec takes the shortest time, because it is based on graph convolution network, so GPU can be used to accelerate the training and prediction of the model. The GPU memory used in our model is not high, for example, only 1.86 G GPU memory is used for training on Dataset-L, so our model can be extended to a larger dataset.
Dataset. GitHub has more than 100 million repositories, however, there are only 83076 repositories in our dataset, which is a small fraction. However, our dataset is obtained from GitHub, and the data distribution is consistent with the GitHub repository, that is, a few GitHub repositories are very popular, and most repositories get less focus [22–24].
Repository domain. GitHub does not set the domain label for each repository; we cannot guarantee that all repositories belong to the same domain. In order to reduce this impact, we collect those developers who fork the hdodenhof/CircleImageView repository, and collect the repositories which are related to these developers.
Survey study. We conducted a survey to investigate what developers are interested in when browsing the repository, but we only delivered the questionnaire to 100 people. This is because the large-scale delivery of the questionnaire will cause the mail to be intercepted by the mail server as spam and affect the survey results. Another threat is that the question are all closed, which will affect developers’ decisions. In order to mitigate this threat, we try to list all possible answers, and inform participants that if they have any other answer, they can response with their own answers.
This paper proposes a graph convolutional network-based repository recommendation system to help developers find appropriate repositories. First, constructing a Developer-Repository network and assigning weights to the edges reflects the developer’s interest in the repository. Then, the repository features and the developer features are extracted from the repository’s content as the node feature of the network. Finally, multi-layer GCN is used to build a repository recommendation model and recommend appropriate repositories for developers. We evaluated our model on sparse and dense datasets, performed feature ablation experiments on the model, verified the effectiveness of our proposed feature extraction method, and compared the model with two other open-source repository recommendation methods. The results show that our model is better than existing models in precision and hit rate.
However, there are still some shortcomings in our model. For example, GCNRec cannot interpret the results of repository recommendations and there is a cold start problem in GCNRec. Therefore, in the future, we will combine GCN with a knowledge graph to provide more accurate and interpretable open-source repository recommendation results, and use a knowledge graph to mitigate cold start problems. In addition, we plan to inform the developers of the recommendation results and get feedback from the developers to improve our recommendation system.
Funding Statement: This work was supported by Special Funds for the Construction of an Innovative Province of Hunan, No. 2020GK2028.
Availability of Data and Materials:: Questionnaire Availability: https://github.com/CHNicelee/GCNRec/blob/main/questionnaire.pdf. Dataset Availability: https://github.com/CHNicelee/GCNRec/tree/main/dataset.
Conflicts of Interest: The authors declare that they have no conflicts of interest to report regarding the present study.
1https://octoverse.github.com/
2https://github.com/CHNicelee/GCNRec/blob/main/questionnaire.pdf
3https://www.github.com/hdodenhof/circleimageview
References
1. Coelho, J., Valente, M. T. (2017). Why modern open source projects fail. Proceedings of the 2017 11th Joint Meeting on Foundations of Software Engineering, pp. 186–196. Paderborn Germany. https://doi.org/10.1145/3106237.3106246 [Google Scholar] [CrossRef]
2. Borges, H., Valente, M. T. (2018). What’s in a github star? understanding repository starring practices in a social coding platform. Journal of Systems and Software, 146(1), 112–129. https://doi.org/10.1016/j.jss.2018.09.016 [Google Scholar] [CrossRef]
3. Zhang, L., Zou, Y., Xie, B., Zhu, Z. (2014). Recommending relevant projects via user behaviour: An exploratory study on github. Proceedings of the 1st International Workshop on Crowd-Based Software Development Methods and Technologies, pp. 25–30. Hong Kong, China. https://doi.org/10.1145/2666539.2666570 [Google Scholar] [CrossRef]
4. Zhang, X., Wang, T., Yin, G., Yang, C., Yu, Y. et al. (2017). DevRec: A developer recommendation system for open source repositories. International Conference on Software Reuse, pp. 3–11. Salvador, Brazil. https://doi.org/10.1007/978-3-319-56856-0_1 [Google Scholar] [CrossRef]
5. Thung, F., Lo, D., Jiang, L. (2012). Detecting similar applications with collaborative tagging. 2012 28th IEEE International Conference on Software Maintenance (ICSM), pp. 600–603. Trento, Italy. https://doi.org/10.1109/ICSM.2012.6405331 [Google Scholar] [CrossRef]
6. Xu, W., Sun, X., Hu, J., Li, B. (2017). REPERSP: Recommending personalized software projects on GitHub. 2017 IEEE International Conference on Software Maintenance and Evolution (ICSME), pp. 648–652. Shanghai, China. https://doi.org/10.1109/ICSME.2017.20 [Google Scholar] [CrossRef]
7. Yang, C., Fan, Q., Wang, T., Yin, G., Wang, H. (2016). Repolike: Personal repositories recommendation in social coding communities. Proceedings of the 8th Asia-Pacific Symposium on Internetware, pp. 54–62. Beijing, China. https://doi.org/10.1145/2993717.2993725 [Google Scholar] [CrossRef]
8. Zhang, Y., Lo, D., Kochhar, P. S., Xia, X., Li, Q. et al. (2017). Detecting similar repositories on GitHub. 2017 IEEE 24th International Conference on Software Analysis, Evolution and Reengineering (SANER), pp. 13–23. Klagenfurt, Austria. https://doi.org/10.1145/2993717.2993725 [Google Scholar] [CrossRef]
9. Linares-Vásquez, M., Holtzhauer, A., Poshyvanyk, D. (2016). On automatically detecting similar Android apps. 2016 IEEE 24th International Conference on Program Comprehension (ICPC), pp. 1–10. Austin, TX, USA. https://doi.org/10.1109/ICPC.2016.7503721 [Google Scholar] [CrossRef]
10. Wang, H., Guo, Y., Ma, Z., Chen, X. (2015). Wukong: A scalable and accurate two-phase approach to android app clone detection. Proceedings of the 2015 International Symposium on Software Testing and Analysis, pp. 71–82. Baltimore, MD, USA. https://doi.org/10.1145/2771783.2771795 [Google Scholar] [CrossRef]
11. Nguyen, P. T., di Rocco, J., Rubei, R., di Ruscio, D. (2020). An automated approach to assess the similarity of GitHub repositories. Software Quality Journal, 1–37. https://doi.org/10.1007/s11219-019-09483-0 [Google Scholar] [CrossRef]
12. Gao, H., Huang, W., Yang, X., Duan, Y., Yin, Y. (2018). Toward service selection for workflow reconfiguration: An interface-based computing solution. Future Generation Computer Systems, 87(3), 298–311. https://doi.org/10.1016/j.future.2018.04.064 [Google Scholar] [CrossRef]
13. Yu, Y., Wang, H., Yin, G., Ling, C. X. (2014). Reviewer recommender of pull-requests in GitHub. 2014 IEEE International Conference on Software Maintenance and Evolution, pp. 609–612. Victoria, BC, Canada. https://doi.org/10.1109/ICSME.2014.107 [Google Scholar] [CrossRef]
14. Liao, Z., Wu, Z., Li, Y., Zhang, Y., Fan, X. et al. (2020). Core-reviewer recommendation based on pull request topic model and collaborator social network. Soft Computing, 24(8), 5683–5693. https://doi.org/10.1007/s00500-019-04217-7 [Google Scholar] [CrossRef]
15. Liao, Z., Wu, Z., Wu, J., Zhang, Y., Liu, J. et al. (2019). TIRR: A code reviewer recommendation algorithm with topic model and reviewer influence. 2019 IEEE Global Communications Conference (GLOBECOM), pp. 1–6. Waikoloa, HI, USA. https://doi.org/10.1109/GLOBECOM38437.2019.9014249 [Google Scholar] [CrossRef]
16. Nguyen, P. T., di Rocco, J., Rubei, R., di Ruscio, D. (2018). CrossSim: Exploiting mutual relationships to detect similar OSS projects. 2018 44th Euromicro Conference on Software Engineering and Advanced Applications (SEAA), pp. 388–395. Prague, Czech Republic. https://doi.org/10.1109/SEAA.2018.00069 [Google Scholar] [CrossRef]
17. Matek, T., Zebec, S. T. (2016). GitHub open source project recommendation system. arXiv preprint arXiv: 160202594. [Google Scholar]
18. Gao, H., Qin, X., Barroso, R. J. D., Hussain, W., Xu, Y. et al. (2020). Collaborative learning-based industrial IoT API recommendation for software-defined devices: The implicit knowledge discovery perspective. IEEE Transactions on Emerging Topics in Computational Intelligence, 6(1), 66–76. https://doi.org/10.1109/TETCI.2020.3023155 [Google Scholar] [CrossRef]
19. Yang, X., Zhou, S., Cao, M. (2020). An approach to alleviate the sparsity problem of hybrid collaborative filtering based recommendations: The product-attribute perspective from user reviews. Mobile Networks & Applications, 25(2). https://doi.org/10.1007/s11036-019-01246-2 [Google Scholar] [CrossRef]
20. Yin, Y., Cao, Z., Xu, Y., Gao, H., Li, R. et al. (2020). QoS prediction for service recommendation with features learning in mobile edge computing environment. IEEE Transactions on Cognitive Communications and Networking, 6(4), 1136–1145. https://doi.org/10.1109/TCCN.2020.3027681 [Google Scholar] [CrossRef]
21. Gousios, G., Spinellis, D. (2012). GHTorrent: GitHub’s data from a firehose. 2012 9th IEEE Working Conference on Mining Software Repositories (MSR), pp. 12–21. Zurich, Switzerland. https://doi.org/10.1109/MSR.2012.6224294 [Google Scholar] [CrossRef]
22. Cosentino, V., Izquierdo, J. L. C., Cabot, J. (2017). A systematic mapping study of software development with GitHub. IEEE Access, 5, 7173–7192. https://doi.org/10.1109/ACCESS.2017.2682323 [Google Scholar] [CrossRef]
23. Kalliamvakou, E., Gousios, G., Blincoe, K., Singer, L., German, D. M. et al. (2014). The promises and perils of mining github. Proceedings of the 11th Working Conference on Mining Software Repositories, pp. 92–101. [Google Scholar]
24. Kalliamvakou, E., Gousios, G., Blincoe, K., Singer, L., German, D. M. et al. (2016). An in-depth study of the promises and perils of mining GitHub. Empirical Software Engineering, 21(5), 2035–2071. https://doi.org/10.1007/s10664-015-9393-5 [Google Scholar] [CrossRef]
25. Wu, Z., Pan, S., Chen, F., Long, G., Zhang, C. et al. (2020). A comprehensive survey on graph neural networks. IEEE Transactions on Neural Networks and Learning Systems, 32(1), 4–24. https://doi.org/10.1109/TNNLS.2020.2978386 [Google Scholar] [PubMed] [CrossRef]
26. Yang, X., Liang, C., Zhao, M., Wang, H., Ding, H. et al. (2017). Collaborative filtering-based recommendation of online social voting. IEEE Transactions on Computational Social Systems, 4(1), 1–13. https://doi.org/10.1109/TCSS.2017.2665122 [Google Scholar] [CrossRef]
27. Kumar, A., Singh, S. S., Singh, K., Biswas, B. (2020). Link prediction techniques, applications, and performance: A survey. Physica A: Statistical Mechanics and its Applications, 553(6), 124289. https://doi.org/10.1016/j.physa.2020.124289 [Google Scholar] [CrossRef]
28. Sun, X., Xu, W., Xia, X., Chen, X., Li, B. (2018). Personalized project recommendation on GitHub. Science China Information Sciences, 61(5), 1–14. https://doi.org/10.1007/s11432-017-9419-x [Google Scholar] [CrossRef]
29. Rosvall, M., Axelsson, D., Bergstrom, C. T. (2009). The map equation. The European Physical Journal Special Topics, 178(1), 13–23. https://doi.org/10.1140/epjst/e2010-01179-1 [Google Scholar] [CrossRef]
Cite This Article
 Copyright © 2023 The Author(s). Published by Tech Science Press.
This work is licensed under a Creative Commons Attribution 4.0 International License , which permits unrestricted use, distribution, and reproduction in any medium, provided the original work is properly cited.
 Downloads
 Citation Tools