
 Submit a Paper
 Propose a Special lssue
 Open Access
REVIEW

A Review on Intelligent Detection and Classification of Power Quality Disturbances: Trends, Methodologies, and Prospects
School of Automation Engineering, University of Electronic Science and Technology of China, Chengdu, 611731, China
* Corresponding Author: Kai Chen. Email:
Computer Modeling in Engineering & Sciences 2023, 137(2), 1345-1379. https://doi.org/10.32604/cmes.2023.027252
Received 21 October 2022; Accepted 28 January 2023; Issue published 26 June 2023
 View Full Text
 Download PDF
Abstract
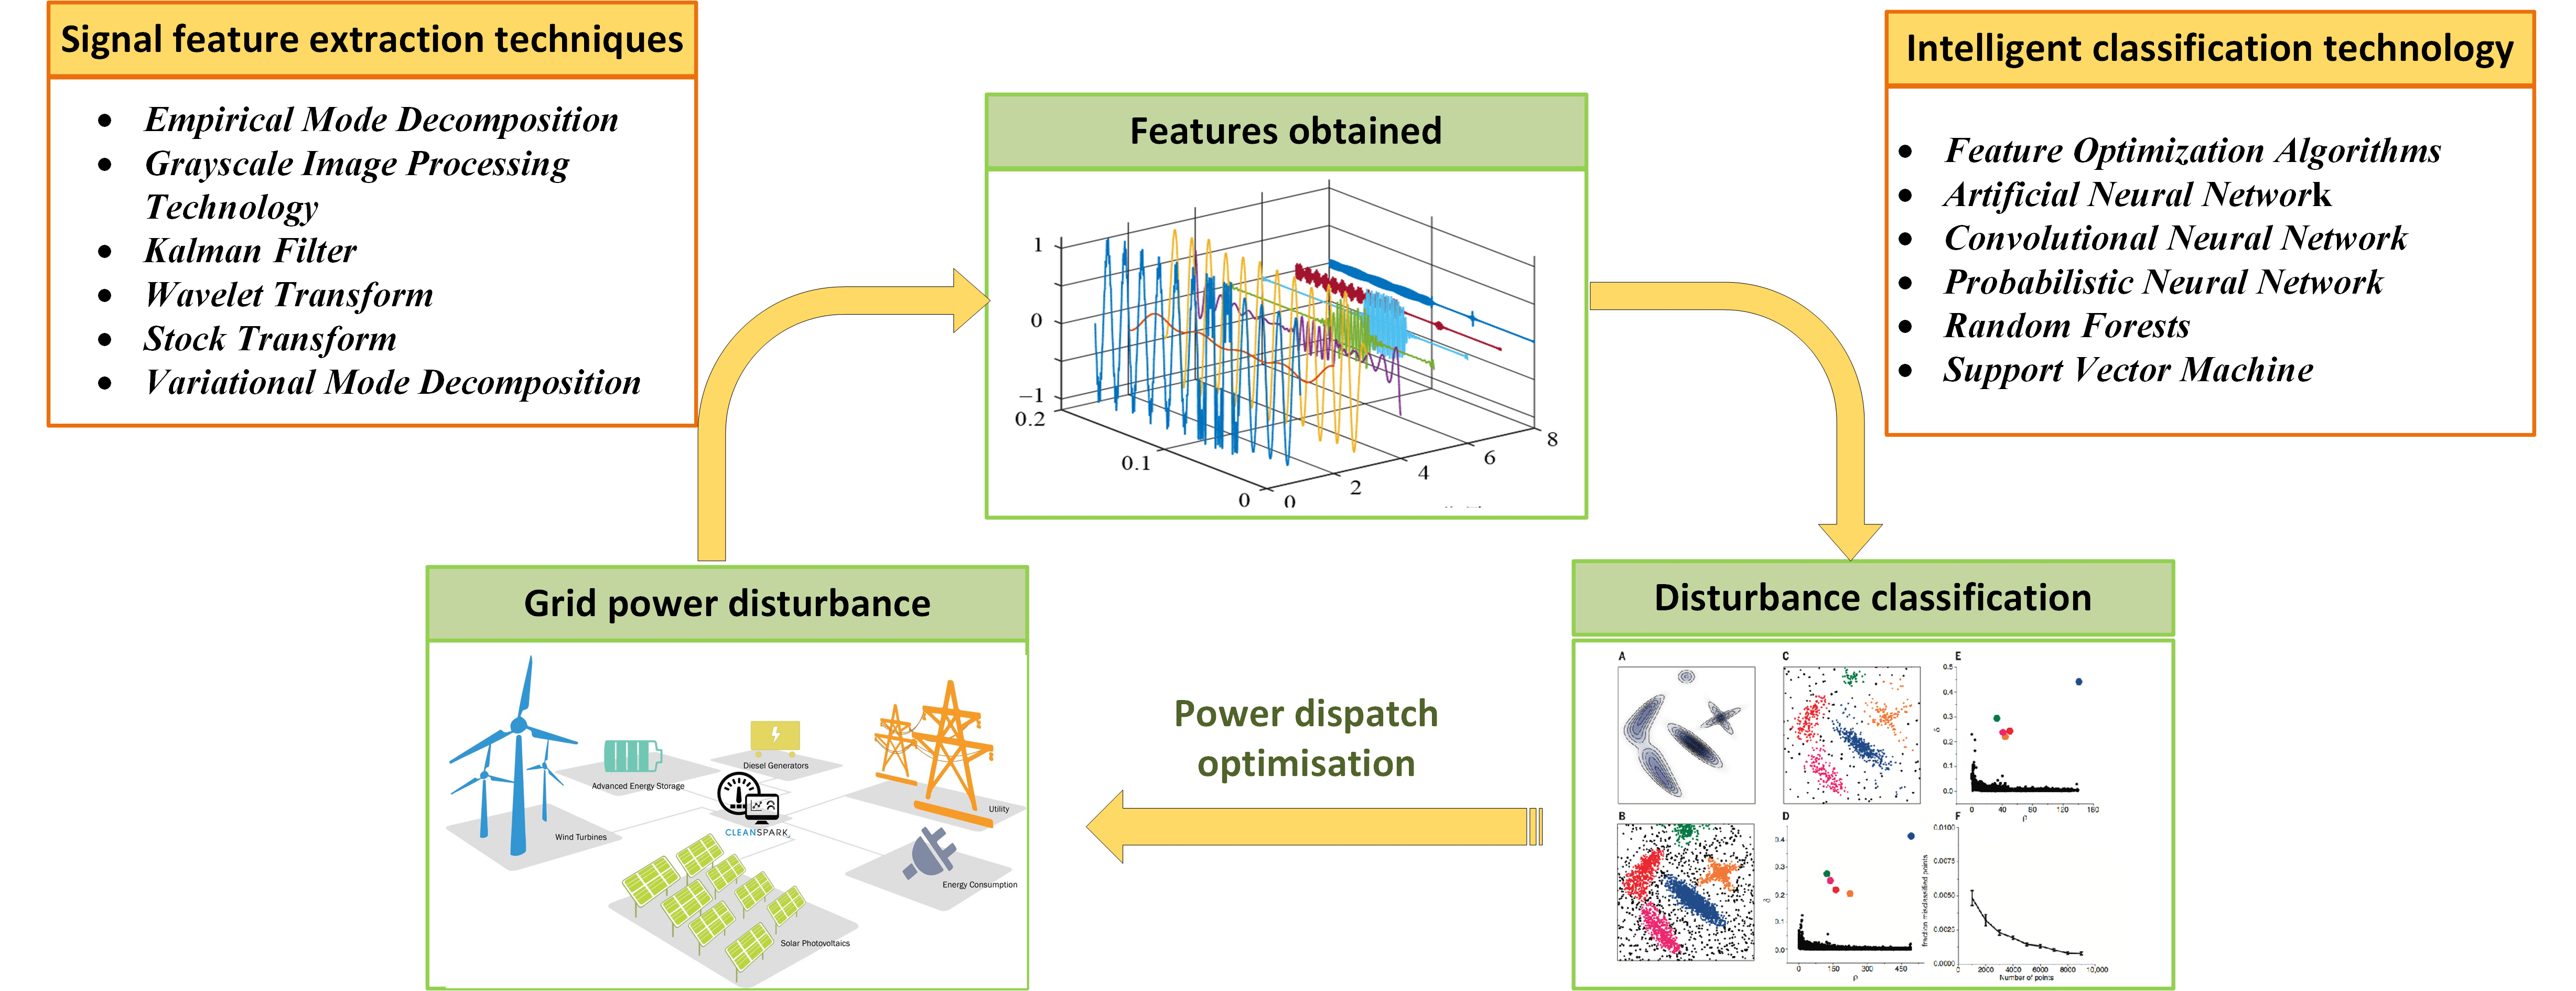
With increasing global concerns about clean energy in smart grids, the detection of power quality disturbances (PQDs) caused by energy instability is becoming more and more prominent. It is well acknowledged that the PQD effects on power grid equipment are destructive and hazardous, which causes irreversible damage to underlying electrical/electronic equipment of the concerned intelligent grids. In order to ensure safe and reliable equipment implementation, appropriate PQD detection technologies must be adopted to avoid such adverse effects. This paper summarizes the newly proposed and traditional PQD detection techniques in order to give a quick start to new researchers in the related field, where specific scenarios and events for which each technique is applicable are also clearly presented. Finally, comments on the future evolution of PQD detection techniques are given. Unlike the published review articles, this paper focuses on the new techniques from the last five years while providing a brief recap on traditional PQD detection techniques so as to supply researchers with a systematic and state-of-the-art review for PQD detection.Graphic Abstract
Keywords
Nomenclature
| ABC | Artificial Bee Colony |
| ANN | Artificial Neural Network |
| CNN | Convolutional Neural Network |
| DWT | Discrete Wavelet Transform |
| EEMD | Ensemble Empirical Mode Decomposition |
| ELM | Extreme Learning Machine |
| EMD | Empirical Mode Decomposition |
| EWT | Empirical Wavelet Transform |
| FNN | Forward Neural Network |
| GIP | Grayscale Image Processing |
| HHT | Hilbert-Huang Transform |
| IMF | Intrinsic Mode Function |
| KF | Kalman Filter |
| LVQ-NN | Learning Vector Quantization-Neural Network |
| PNN | Probabilistic Neural Network |
| PQ | Power Quality |
| PQ Event | Power Quality Event |
| PQD | Power Quality Disturbance |
| PQS | Power Quality Signal |
| PSO | Particle Swarm Optimization |
| PSR | Phase Space Reconstruction |
| RF | Random Forests |
| SA | Statistical Analysis |
| SBS | Sequential Backward Search |
| SFS | Sequential Forward Search |
| ST | Stock-Well Transform |
| SVM | Support Vector Machine |
| VMD | Variational Mode Decomposition |
| WT | Wavelet Transform |
| WVD | Wigner-Ville Distribution |
Renewable energy (e.g., solar, wind and hydropower) has played an increasingly important role in power grids because of its cleanliness and regenerative. It is well known that the stability of the power quality in the grid is of great importance in both stages of factory production and residential use [1]. Despite its various advantages, renewable energy brings intermittent, unstable, and regionally concentrated problems to the grid [2]. The grid demands techniques with PQD detection and intelligent classification to identify these problems for further resolution [3]. Considerable research attention and financial support have been devoted to solving these problems to ensure electricity quality [4].
As shown in Fig. 1, by searching for “power quality disturbance” on the web of science website, we can obtain the number of publications on PQD detection technology per year. Since entering the millennium, power equipment has developed rapidly, and the publication volume of each year on PQD detection technology has steadily increased. It has been stable at more than 70 articles per year. The data provided by the Science website illustrates the growing number of researchers who have conducted studies targeting power quality disturbances. What becomes the consensus is that power quality detection technology is a key technology for building smart grids. We find that the technology is developing rapidly as the number of articles increases. Therefore, we would like to provide a comprehensive review and summary of PQD detection techniques and provide researchers with some new ideas and approaches.
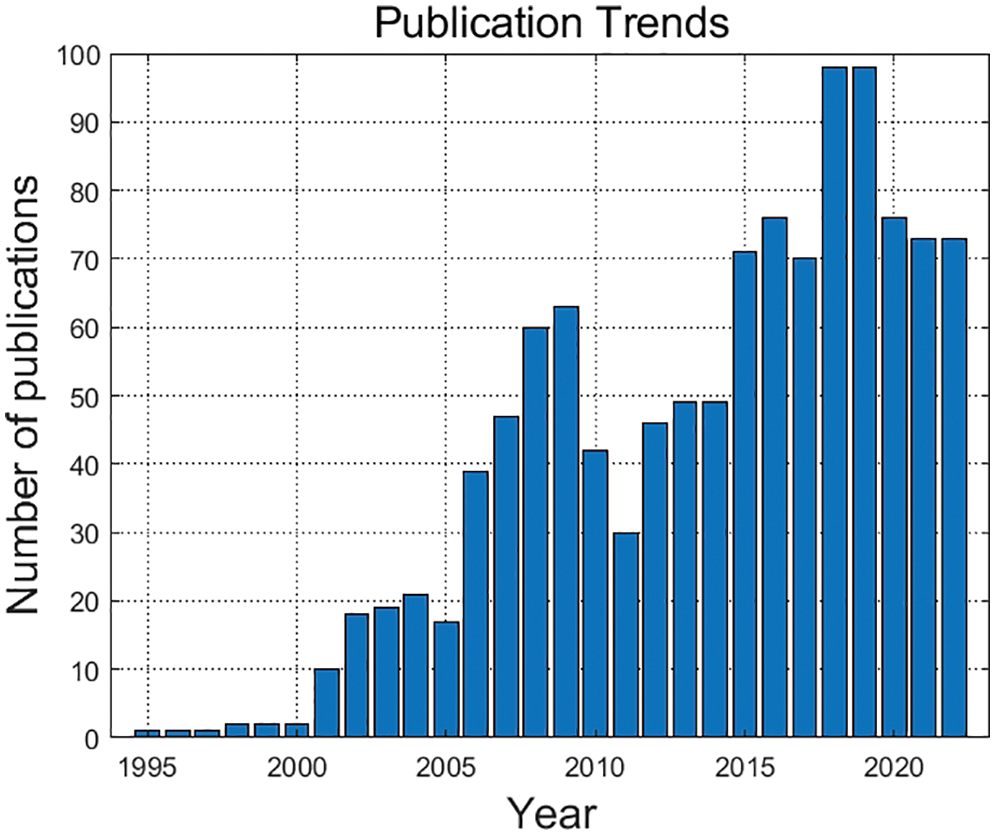
Figure 1: Number of published literature on PQD detection technology
1.1 Technical Background Overview
A consensus exists that disturbances in the grid originate from the three major components. Firstly, voltage and current disturbances in the grid generated by abnormal changes in equipment load could destroy the electrical equipment connected to the grid [5]. Appropriately identifying such anomalous interference is the primary challenge for PQD detection techniques. Second, current home energy devices (e.g., solar panels) are installed in a distributed manner. Such an installation pattern determines that the power transmission and measurement between the grid and the home devices are bidirectional. The bi-directional transmission pattern causes significant disturbances to the grid [6]. Finally, disturbances caused by imbalances in power generation and consumption between different regions can contribute to the instability of the grid [7].
PQD was defined as disturbances in the power grid. It was classified into two types based on its duration: transient and steady-state disturbances [8]. PQD detection technique was used to locate and classify various disturbances in the grid quickly and accurately [9]. Many researchers have designed and improved detection techniques for different application environments and objects to achieve better detection rates and to ensure the stability of power transmission in the grid [10,11]. This paper divides the PQD detection technique into feature extraction, feature optimization, and intelligent classification. As shown in Fig. 2, the pre-processed signals in the grid were obtained utilizing feature extraction with specified features [12]. These features are also sparse representations of the power signal [13]. The feature optimization algorithm was further optimized to extract the features with the highest discriminative power. The intelligent classification algorithm performs PQD classification using optimized features [14].
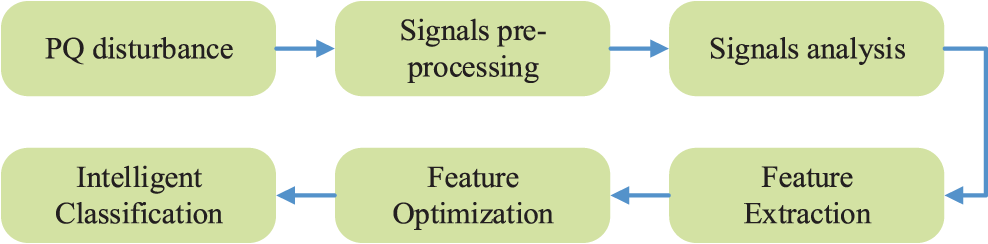
Figure 2: PQD inspection technology processing process
1.2 Published Review Literature
This paper analyzes many published review articles on PQD detection and classification techniques. The literature [15] analyzed data for all keywords, regions and years in the field of power quality, giving quantitative values for the level of interest in different key technologies in different regions and years. From a technical point of view, the literature [16] provided a comprehensive review of signal processing techniques for power quality disturbance events. The literature [17] focused only on the harmonic distortion of power quality disturbance events, reviewing the techniques for their analysis and classification. Regarding the degree of synthesis, the literature [18] reviewed traditional techniques for detecting and classifying power quality disturbances and analyzes a combination of signal processing and machine learning techniques. Inconsistent with the previous reviews, the literature [19] first proposed the idea of feature optimization in 2015, but later researchers did not pay much attention to this direction. The literature [20] pointed out that the techniques in the area of feature optimization have received more and more attention as the means of feature extraction have become more abundant and the number of features after extraction has become larger. The research in [21] was devoted to the analysis of the power quality of ships. Extensions were made to apply wavelets for harmonic distortion measurement and analysis in power grids. And the literature [22] proposed better solutions for several critical power quality problems.
The published reviews are more concerned with classical PQD detection and classification techniques but lack the discussion of relatively new and cutting-edge techniques and research directions. These published reviews do not provide a complete and precise account of the process of detection technology development. It can be seen from Fig. 3 that the published reviews cite fewer technical articles from the last five years. In contrast, the number of articles cited in this paper from the previous five years represents 60% of the total number of articles cited, reflecting the novelty of the aggregated technology in this paper. As a result of our examination, other reviews of the literature were not summarized, but this paper contains the following:
1. 3.2 Grayscale Image Processing Technology
2. 3.4 Statistical Analysis Feature Techniques
3. 3.8 Miscellaneous Feature Extraction Techniques
4. 4.3 Convolutional Neural Network
5. 4.4 Probabilistic Neural Network
6. 4.7 Miscellaneous Detection or Classification Techniques
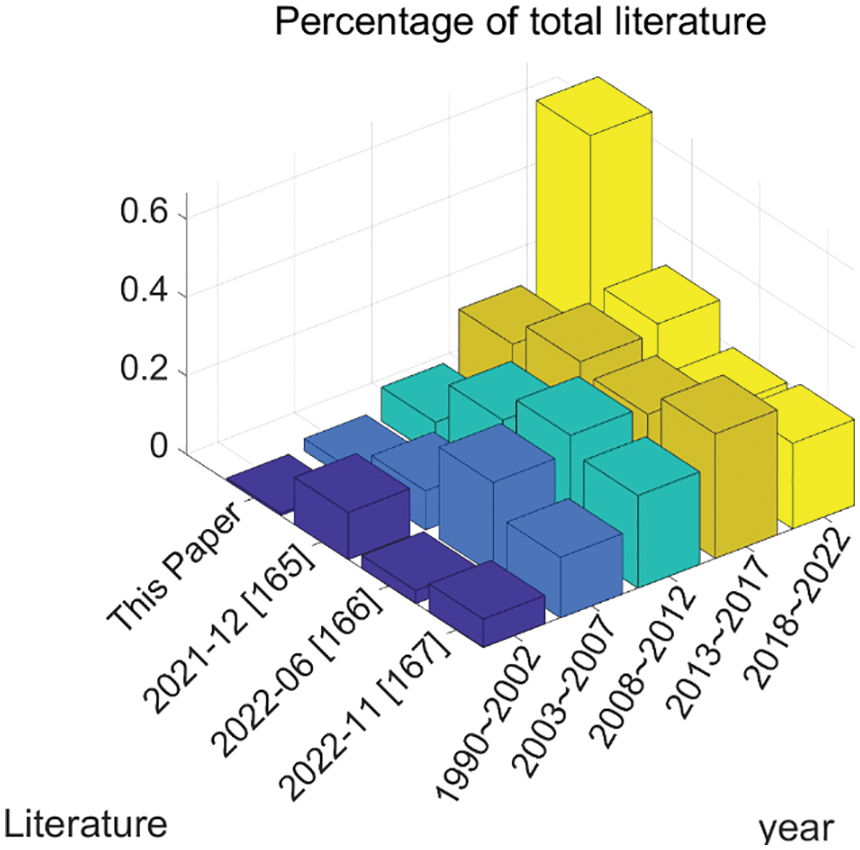
Figure 3: Comparison of reference years for published reviews
Relevant literature is available in specific subsections. This review also gives the development and applicability of various techniques, the accuracy of different techniques and the analysis of future hot technologies.
This paper compares the analysis of recent years of PQD detection techniques in the literature. The reference distribution of all three reviews is based on the period 2013–2017. This indicates a concentrated explosion of innovative articles in this period, and this section is the focus of this paper. All three reviews cite more literature over time, but the literature is under-cited at the end of the last five years. This paper focuses on the latest technologies, so the literature cited between 2018–2022 accounts for more than 60%. However, it also comes with the disadvantage that some technologies may not be stable or not always practical. The disadvantages are negligible for the advantages we can obtain.
1.3 Innovation and Article Structure
This article collects 180 papers, including highly cited and most recent literature, reflecting current research hotspots. The contribution of this paper is threefold: (1) 60% of the recent five-year literature is collected in this paper, as shown in Fig. 2, to present the latest technologies as ultimately as possible; (2) this paper provides a unified summary of the development process and application scenarios for each technology, as shown in Sections 5.1 and 5.2; (3) this paper collects and organizes the most advantageous technology directions in the latest literature, which is placed in Section 5.3.
The rest of the articles are arranged as follows. The introduction is presented in Section 1. The power quality, standard formulation, and definition are briefly discussed in Section 2. The review of feature extraction, feature optimization, and artificial intelligence techniques are presented in Sections 3 and 4. Section 5 provides a summary and future discussion to conclude the paper.
The definition of power quality is an electromagnetic phenomenon whose voltage and current vary with time and location [21]. PQ event is defined as an abnormal electrical interference state, including transient duration (oscillation and pulse), short-term duration (interruption, expansion, and depression), long-term duration (continuous overvoltage), steady-state duration (flicker, harmonic, and gap), and frequency offset. PQS is the time domain representation of PQ events. Different PQ Events have different durations ranging from nanoseconds to seconds [23]. By definition, PQD is a unified description of a series of abnormal behaviors of PQS in the power grid, including but not limited to defined power quality events and undetected and undefined abnormal disturbances in the power grid. Power quality events defined in current standards are listed in Table 1.
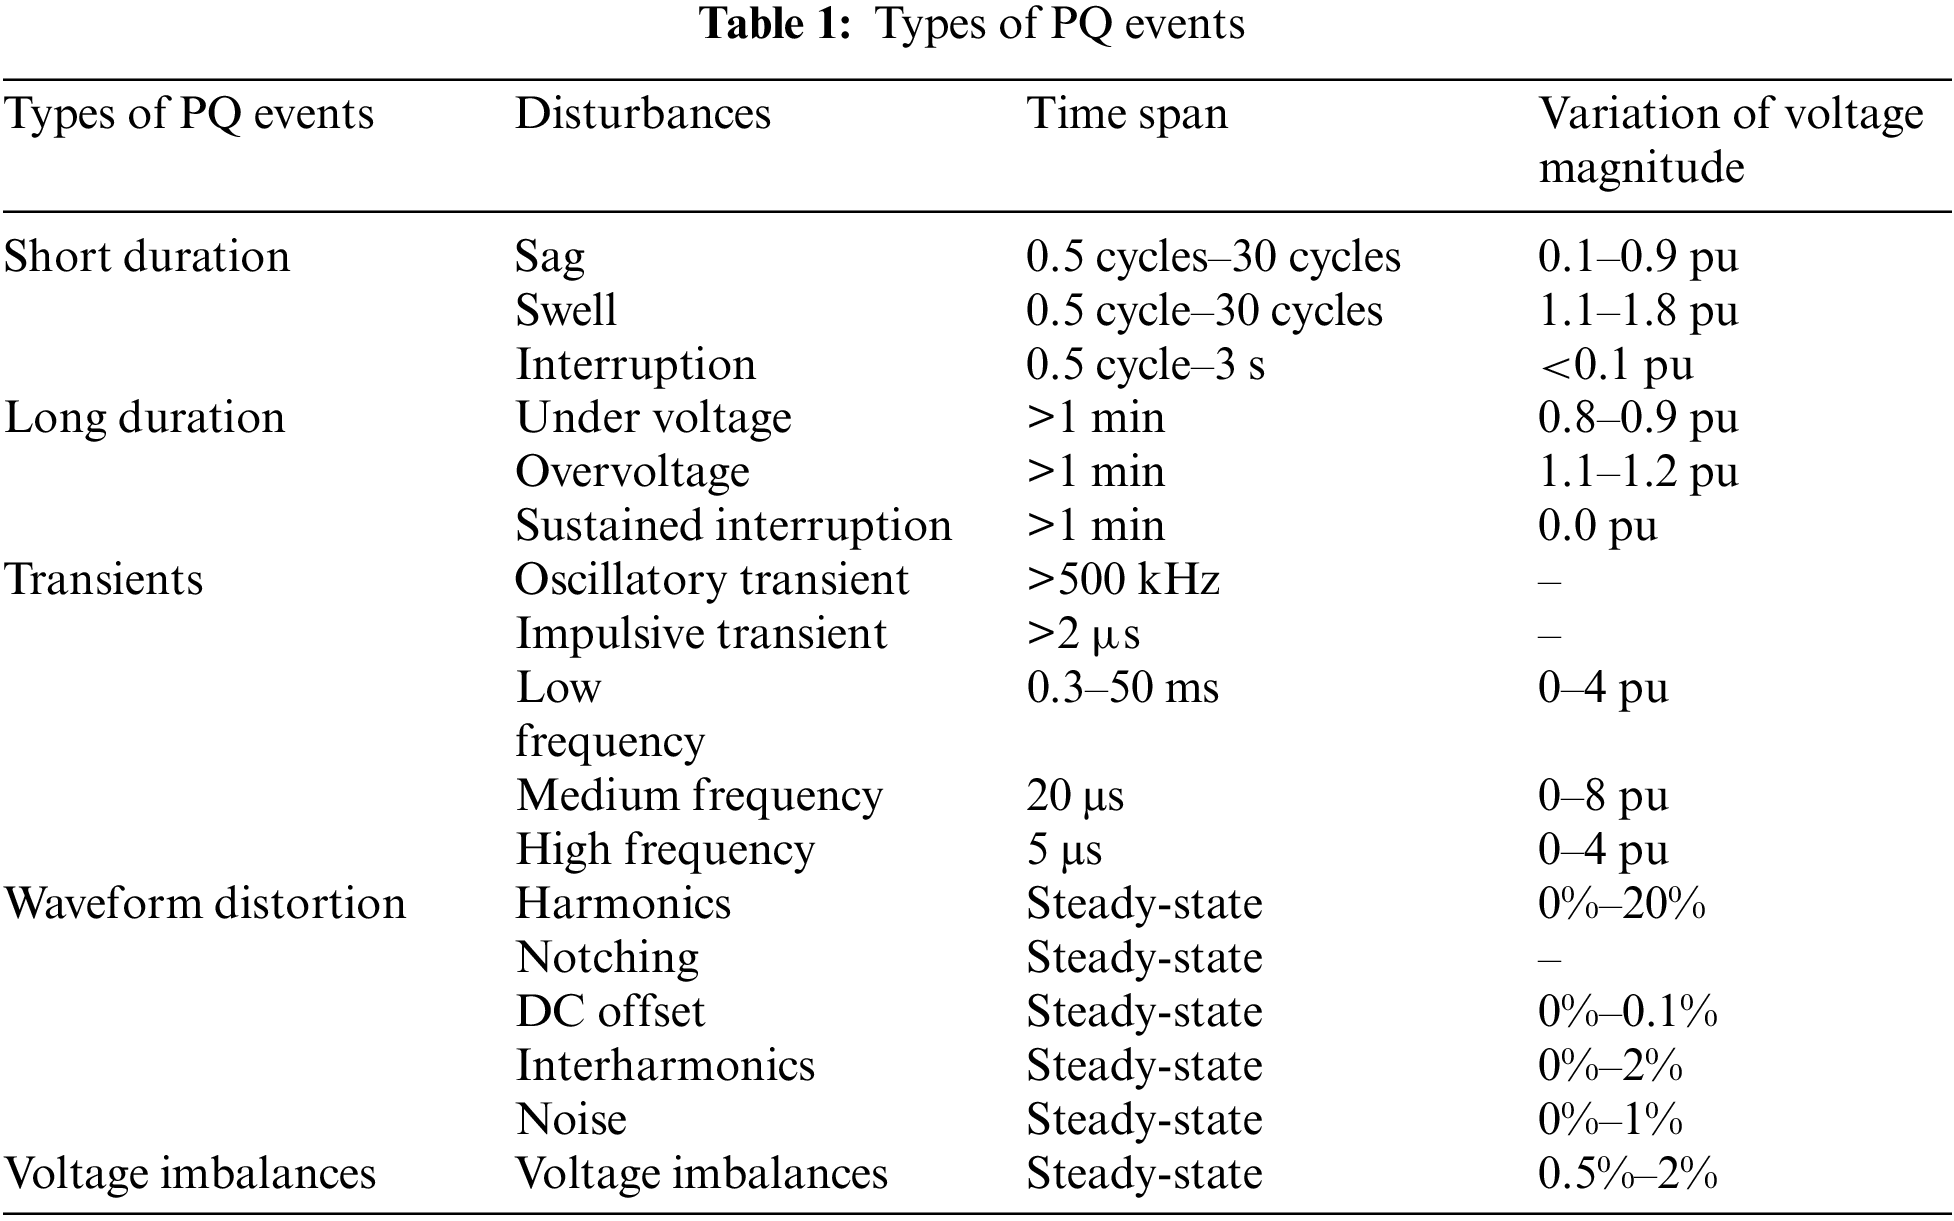
In both IEEE Society’s IEEE 1159 standard and IEC Society’s IEC 61000-4-30 standard, the PQD is classified in terms of the root mean square value concerning the power voltage and current deviation during the nominal operating conditions. Except for the shared definitions, the IEC 61000-4-30 standard establishes reliable methods for measuring and interpreting electromagnetic parameters in electrical grids. In [24], the author also mentioned and defined the indicators of PQD events.
PQ events are classified according to the status of PQS in the power grid. The whole PQ events classification process can be obtained from the existing scientific research literature. First, extract the features of the redundant signal PQS in the power grid and the critical information in the signal. Then, the extracted features are intelligently optimized and classified, ensuring that enough classification features improve the classification speed and the classification effect.
3 PQS Feature Extraction Technology
The feature extraction technology of PQD aims to transform the PQS from the time domain to the sparse domain and represent the PQS with fewer vectors in the sparse feature space. In this case, an infinitely long signal in the time domain can be represented in a finite-dimensional feature space. According to the literature, signal feature extraction techniques can be roughly divided into a) the sparse transformation technique of the signal, e.g., FT, WT, ST, HHT, and GT; b) the signal decomposition technique based on the time scale, e.g., EMD and VMD; and c) the maximum likelihood technique. The meaning of abbreviations is mentioned in the Nomenclature table before the introduction. See Fig. 4 for more details.
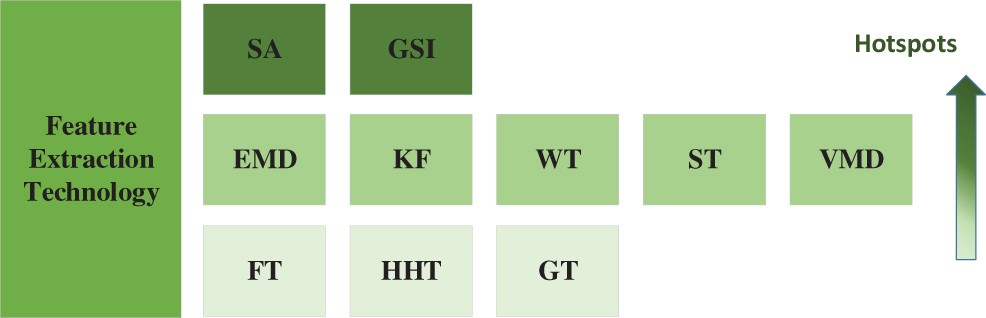
Figure 4: Summary of feature extraction technology
This paper closely searches the relevant literature published in the last five years, and it is found that a) WT and ST are the two most popular feature extraction techniques in the time domain; b) in comparison with other features extraction techniques, ST has relatively more applications in real-world scenarios due to its adoption of Gaussian windows and insensitivity to noises; and c) FT has a limited window and cannot display transformation in real-time.
3.1 Empirical Mode Decomposition
EMD is a feature extraction method that decomposes the signal according to its time scale, which is suitable for analyzing nonlinear and non-stationary signals [25]. Soon after its birth, the EMD was extensively applied to PQD identification. In 2007, an EMD-based PQD detection method was proposed by [26], where the core idea was to perform EMD [27] on the PQD to generate IMF directly. HT is applied to each eigenmode function to obtain the instantaneous spectrum [28] and then obtain the frequency with physical meaning. In [29], researchers compared the detection of voltage spikes and gaps in PQD detection with EMD and S transformation, respectively. It is concluded that EMD is superior to S transform in ignoring the limitations of mode mixing and noise sensitivity. It was pointed out by [30] that compared to EMD, EWT was able to provide a more consistent decomposition. In [31], EMD was applied to the online monitoring of power deviations in the power system, and it was determined that EMD had a lower resolution for PQ events than DWT.
In order to overcome the model mixing problem of EMD, the ensemble EMD approximate entropy was proposed by [32], where white noises were introduced in [33] to assist the EEMD algorithm, and the teaser energy operator was used to obtain the instantaneous amplitude and frequency. The denoising and feature extraction method based on EMD correlation achieved noise suppression [34] and reduced noise susceptibility. The orthogonal empirical mode decomposition method was proposed in [35], with its FPGA implementation also presented. In order to eliminate the limitation of EMD sampling rate, the literature [36] integrates the iterative down sampling phase into EMD, and Salameh et al. [37] proposed a new fast sliding window EMD. These two methods can better extract IMF and reduce the computational burden of EMD. Then the harmonic can be extracted from the non-stationary signal in real-time.
With the further development of EMD, more and more technologies combine EMD with various technologies, reducing the detection time of EMD and improving detection accuracy. It includes the combination of EMD and morphological filter [38]. In [39], EMD and multi-scale mathematical morphology are mixed to achieve PQD detection based on adaptive signal processing. The method based on EMD, and Choi Williams distribution is implemented in [40], effectively reducing Cohen class distribution's cross terms and extracting interference features.
Owing to the rapid rise of machine learning, EMD is also employed to generate feature vectors that can be further used as inputs to ANN, PNN, and other classifiers. For example, a PNN classifier is built based on EMD in [41]. Some researchers combine EMD, random variable moment, and ANN to achieve a better classification effect [42], which achieved 100% accuracy in detecting and classifying PQD. In [43], EMD method was used to extract required feature vectors from time-frequency distribution to build a balanced neural tree. The literature [44] combined EMD and SVM to analyze PQD and compare the results with LVQ-NN.
3.2 Grayscale Image Processing Technology
The grayscale image processing technique converts the signal into a grayscale image according to pixel conversion. Then, a binary image is obtained based on edge detection, which can be used for PQD classification, see Fig. 5 for more details. In the field of PQD detection, a hotspot in the past five years is to convert certain salient features in PQS into grayscale images [45] and using the current popular two-dimensional image processing technology (e.g., CNN) to achieve the detection of disturbance events. Note that applying GIP-CNN in PQD detection is a new technology to visualize PQ events.
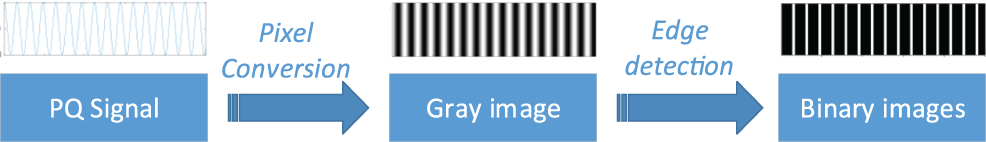
Figure 5: Grayscale image processing flow
With the diversity of machine learning algorithms, more and more researchers are devoted to combining GIP and its processing algorithms to achieve feature extraction. The RF, CNN, LSTM, and other machine learning algorithms are combined to achieve PQD classification [46]. PSR-derived features were used as SVM input in [47], and later PSR was combined with CNN to detect PQD automatically. Small-sample training was achieved in [48], where spectrograms were used to reconstruct PQ events waveforms and CNN. Similarly, power signals with one-dimensional CNN were proposed and converted into images in [49] to improve the classification performance at the same computational complexity.
Besides, for PQD detection in noisy situations, a two-dimensional Riesz Transform is applied to convert one-dimensional signals into two-dimensional signals to obtain efficient features [50]. Feature sparse, and fusion selection was performed on the raw voltage transformed GIP [51] and later combined with ANN to improve the classification accuracy. In addition, GASF was presented to convert one-dimensional PQD signals into two-dimensional image files [52] and subsequently applied to prototype photovoltaic systems. The texture image algorithm was converted into a one-dimensional waveform algorithm in [53] with a satisfactory PQD classification effect. In addition to the combination of GIP and machine learning, a Hilbert transform-based method was proposed by [54] with a viewpoint to transform a one-dimensional curve into a three-dimensional one through the Euler rotation assumption and use the mysterious curve to detect PQD.
The Kalman filter is an optimal parameter estimation algorithm for PQD detection and analysis under noise interference. By introducing state-space models of signals and noises, the KF recursively uses the estimates of the previous moment and the observations of the present moment to update the optimal estimates of current state variables [55]. Due to its high efficiency and denoising capacity, the KF is widely used in PQD detection for parameter estimation [56,57].
It should be noted that Kalman filtering is only suitable for linear systems with Gaussian distributed noises and is not suitable for nonlinear systems or linear systems with low signal-to-noise ratios or non-Gaussian noises. Newly published literature introduces adaptive KF-based methods to address this problem, including maximum likelihood-based KF [58], adaptive process noise covariance KF [59], and extended KF [60]. In addition to adaptive KF, heuristic algorithms are also an alteration. For example, the extended KF was combined with the PSO algorithm in [61] to improve performances such as noise suppression, convergence speed, and estimation accuracy.
In addition to adaptively setting parameters and initial values, the noise and other conditions can be modeled by taking advantage of prior knowledge to enhance the KF performance. To be specific, DWT was used in [62] to model internal noise, and the obtained noise covariance was then used by the maximum likelihood KF, thereby boosting the performance of PQD detection [63].
3.4 Statistical Analysis Feature Techniques
Compared with other transformation-based feature extraction methods, statistical analysis-based feature extraction methods are relatively simple to implement with high interpretability. Some commonly used time-domain features are peak-to-peak, frequency, RMS, etc., and frequency-domain features are mean square frequency, frequency variance, spectral entropy, etc. Among various distributions that can be used for feature extraction, we highlight the WVD technology, the most widely used feature due to its good reflection of the instantaneous time-frequency relationship of signals. Basically, time-frequency features can be used as characteristics of electrical signals in analyzing power quality, and it was pointed out by [64] that the time-frequency relationship can reflect the trend of the signal spectrum over time. Thus, WVD was widely used in power disturbance identification.
Compared with SA and parametric time-frequency methods, which require pre-assumed models, the WVD does not require prior assumptions about signal models but is easily interfered with by cross terms. To solve this problem, researchers introduced windowed WVD and pseudo-smoothed WVD to suppress cross-terms [65,66]. In addition to using the windowing method to hide cross-term influence, deep learning methods were also used to extract features automatically to mitigate the effects of noisy cross-terms. In [67], the WVD was combined with CNN to convert a one-dimensional voltage disturbance signal into a two-dimensional image file. Then a neural network was utilized to classify the images.
Wavelet transform is often used in PQD feature extraction. As shown in Fig. 6, the discrete wavelet transform uses wavelet decomposition at different resolutions to transform the power quality signal into a series of wavelet coefficients that can be efficiently compressed and classified. The ray-coding genetic algorithm was used in [68] to reduce feature dimensions after wavelet transform, which improves the classification accuracy of PNN. In classification accuracy, discrete harmonic search with an improved difference mutation operator can also achieve the same performance as a ray-coding genetic algorithm [69]. For better classification, WT [70] and PSO [71] were combined with neural networks and random forest classifiers for perturbation detection. The flexible analytical wavelet transform was proposed in [72] that combined the bagging of the rotating forest integrated classifier to achieve a classification accuracy of 95.33%.
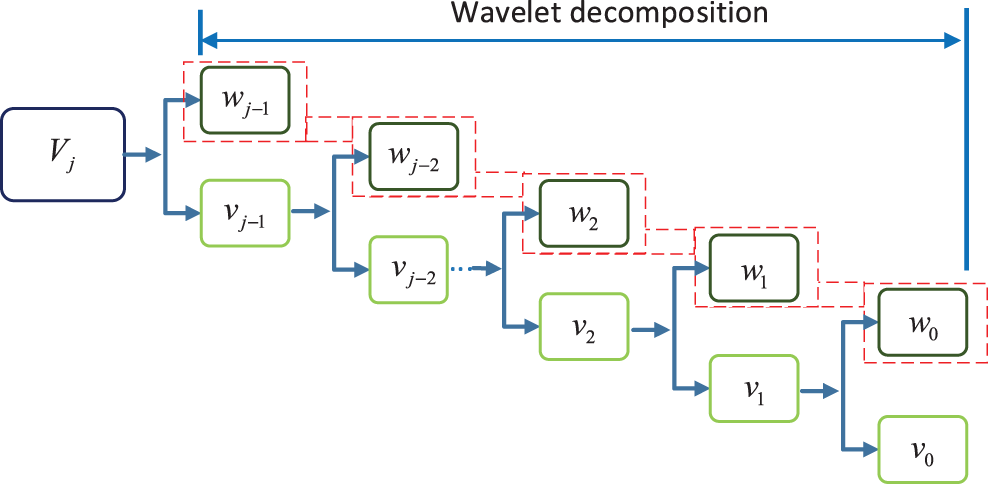
Figure 6: Discrete wavelet decomposition vectors
Compared with continuous wavelet transform, DWT can represent the original signal as coefficients with different levels of approximation coefficients and detail coefficients, and DWT parameters affect the robustness of the classifier towards noises and overall classification accuracy [73]. It was pointed out by [74] that DWT can reduce the required storage space. It was later combined with the PNN model to construct a classifier suitable for classifying different types of electrical disturbances. By using the PNN-ABC algorithm, the performance of the classification system was improved [75]. It was verified by [76] that the combination of DWT technology and adaptive ABC-PSO algorithm can meet the requirements of practical applications and achieve the highest classification accuracy (99.31%).
Subsequently, it was proved in [77] that the combination of DWT and fuzzy logic for fuzzy c-means clustering was equally effective in detecting and classifying events. Cheng et al. [78] developed an adaptive learning framework for depth-weighted sparse self-encoder (AE) using multi-objective evolutionary algorithm (MOEA), which provides a new idea for online monitoring of PQD. At the same time, it was verified in [79] that the efficiency and robustness of the EWT and multiclass SVM methods to noises and disorders of different degrees. The ReliefF algorithm was presented by [80] to achieve further dimensionality reduction optimization with ensured accuracy and reduced computational complexity.
In the case of insufficient training samples, the maximum overlapping discrete wavelet transform (combined with supervised backpropagation training) is studied in [81] to improve the overlapped sparse denoising automatic encoder into a robust classifier. The second-generation wavelet transform proposed by [82] was a time-domain analysis of less processing time. From another perspective, compared with the original WT, the second-generation wavelet transform was simple, easy to implement, and brief to be combined with data mining-based RF. It could be used to distinguish power voltage disconnection events from PQ interference.
S-transform is an extension of the Wavelet Transform and Fourier Transform with good noise immunity. ST was used in [83] to establish classification rules and decision tree classifiers that could identify PQ events effectively. On this basis, Li et al. [84] proposed a model combined with a grid search method for SVM. The complex-valued classifier combined with S-transform was proposed in [85] for PQD classification.
Regarding the combination of ST and neural networks, the SoftMax classifier was used in [86] for classification equipped with good noise resistance, better real-time performance, and higher accuracy. S-transform was integrated with PNN in [87] to show that distinct PQ events can be efficiently detected and classified, where the features of interfering signals were reduced mainly without losing the original properties, thus requiring less storage space and learning time. Using S-transform, improved discrete artificial bee colony algorithm, and the default parameters of random forest, the classification accuracy was proved to be better [88].
The traditional S-transform method has problems like extensive calculations and high redundancy in detecting and classifying PQ events. Random noise S-transform is often combined with random forest using the SFS method [89]. It was shown by [90] that under the same feature subset, the classification accuracy could reach above 99.7% with conditions of 30 dB. Some researchers have pointed out the use of the Kaiser window with intrinsically best energy concentration properties as a kernel function, which provides better resolution at the fundamental frequency.
In practical applications, the improved S transform effectively reduces the influence of noise on power quality disturbance signals. It was tested by [91] that optimized window parameters can be used to improve time-frequency resolution when combined with a kernel-SVM classifier and achieve the efficient classification of PQ events. The optimal fast discrete Stock-well transform was combined [92] with an improved RF-based classifier. Decision stumps were used as weak classifiers to achieve precise time-frequency localization with higher energy concentration degrees and lower noise insensitivity [93]. It should be mentioned that in comparison with the traditional ST method, the decision tree and multi-resolution S-transform were used less.
3.7 Variational Mode Decomposition
Variational Mode Decomposition is a new adaptive processing method for stationary and non-stationary signals. The principle of VMD in signal processing is to find the optimal solution of the signal model and iteratively update the model to obtain all the modal functions of the signal decomposition. The VMD method overcomes the noise sensitivity and sampling rate limitations of EMD [94] and thus has better classification accuracy than EWT [95]. The modes decomposed by VMD are mainly divided into modes containing signals and noises. The signal modalities decomposed by VMD are often combined with artificial intelligence algorithms such as PNN, SVM, and dimensional transformation to detect PQ events. Specifically, SVM was widely applied to power quality disturbance detection [96] that decomposed PQS into several eigenmode functions to analyze and detect power quality disturbance signals. As shown in Fig. 7, the VMD processes the current or voltage signal to obtain the IMF classification, then extracts and selects the features of the IMF, and finally classifies the PQD based on the selected features [97].
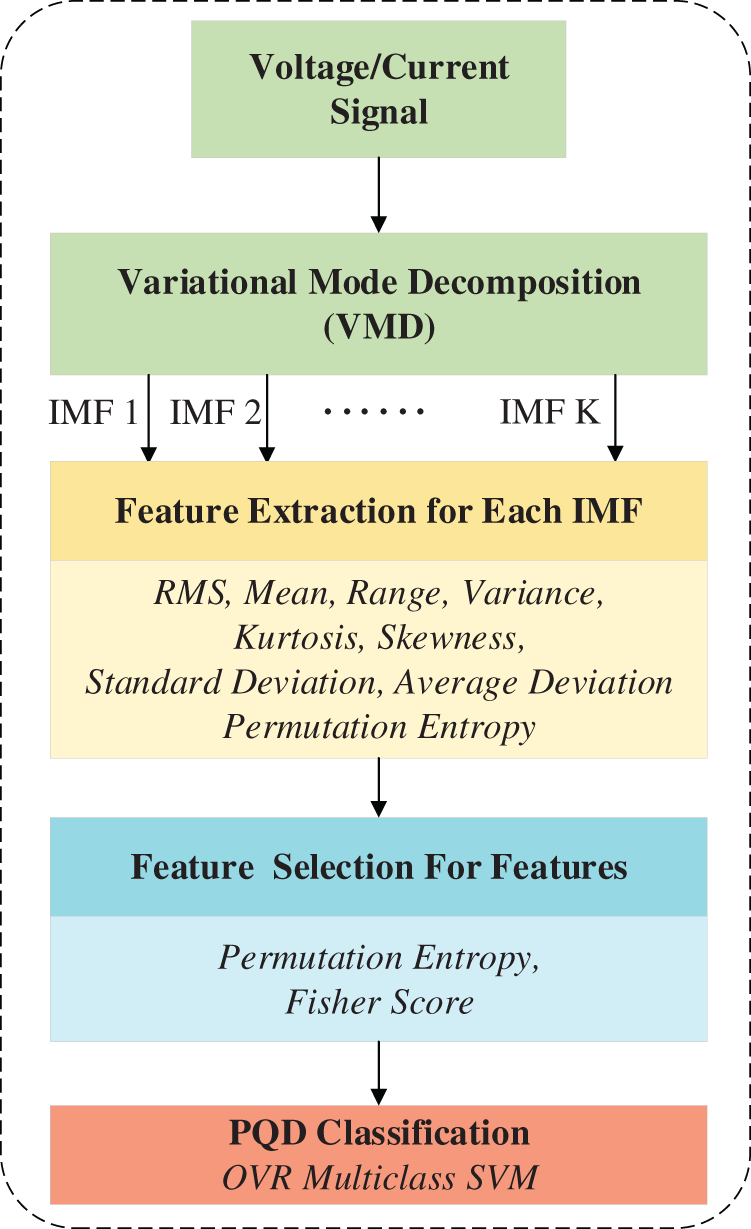
Figure 7: The process of VMD classification of power quality signals
With the acceleration of the application of machine learning in the field of power quality detection, scholars have begun to combine VMD with artificial intelligence to achieve automatic detection and capture of power system PQ events. VMD technology has applications in power generation systems, photovoltaic, and wind power generation systems [98]. The feasibility of VMD has been verified in the laboratory by simulating the signals of multiple PQD events according to IEEE standards [99,100]. With the continuous improvement and innovation of the VMD theory and implementation technology, new algorithms for intelligent classifiers have been continuously adapted to accommodate VMD, which significantly improves the ability of VMD to parse and classify PQD [101,102].
In 1998, Norden E. Huang et al. proposed the Hilbert transform after EMD decomposition, also known as the classic HHT [103]. Inspired by this, S-transform and VMD were combined, where S-transformation was performed on the decomposed eigenmode function to extract potential features to improve detection ability and speed. Similarly, VMD with HT was combined in [104] to modify the IMF to obtain new latent features. To solve value selection problems of penalty parameters in the VMD technique, Chakravorti et al. [105] proposed an algorithm based on adaptive variational mode decomposition. Researchers use the Firefly algorithm to optimize features, speed up convergence, and make VMD output distinguishable. Similarly, it was made possible by [106] to directly output different features by optimizing VMD that can be used to optimize the number of decompositions and data fidelity factors to extract the most efficient band-limited modes.
3.8 Miscellaneous Feature Extraction Techniques
In addition to the techniques mentioned in Sections 3.1–3.7, there are several other special techniques, including transforming the PQS directly through a neural network, making it easy to extract features [107]. The article [108] improve PCA to extract feature. In [109], authors use dictionary learning to decompose sparse PQ signals directly. Different from other conventional feature extraction methods, Aggarwal et al. [110] directly used Convolutional Neural Networks to extract the features of the signal according to the characteristics of the processed image and then uses the Multiclass Support Vector Classifier to detect and classify the power quality disturbance events. Compared with the ordinary convolutional neural network, this method improves performance by about 10%. The literature [111] also directly extracted features through a neural network and proposes a multilayer severe learning computer autoencoder to optimize input weights and directly extract features of power quality disturbances. Besides the technology of directly extracting features with neural networks, some researchers have further proposed new ideas and improvements to the technology of adaptive decomposition of signals for the sparsity of PQS. In [112], authors proposed a new Adaptive Local Iterative Filter Decomposition method to decompose electrical signals, Sahani et al. [113] proposed a new signal segmentation method to reduce the number of decompositions to extract features efficiently. Signal decomposition techniques include decomposition and sparse decomposition, and dictionary learning in machine learning. Therefore, the literature in [114] proposed to use dictionary learning as a decomposition method of PQ signal to extract the required features. They use Principal Component Analysis as a feature extraction method and continuously reduce dimensionality and decompose to extract features.
4 Feature Optimization and Intelligent Classification
In PQD detection and classification, there are two ways to improve performance with the help of artificial intelligence [115]. The first is to use artificial intelligence to find the best subset of features for classification in the feature space of PQS. The second is to use artificial intelligence to improve the classifier’s efficiency. After certain training, artificial intelligence can quickly and automatically identify PQD at a high success rate and a fast speed, which is vital to developing intelligent grids [116,117]. Group optimization algorithms such as ABC and PSO are widely used among feature optimization techniques. Similarly, in the classification technology of artificial intelligence, ANN, SVM, and RF are classic PQD classification artificial intelligence algorithm. Fig. 8 illustrates some basic techniques for feature optimization and intelligent classification.
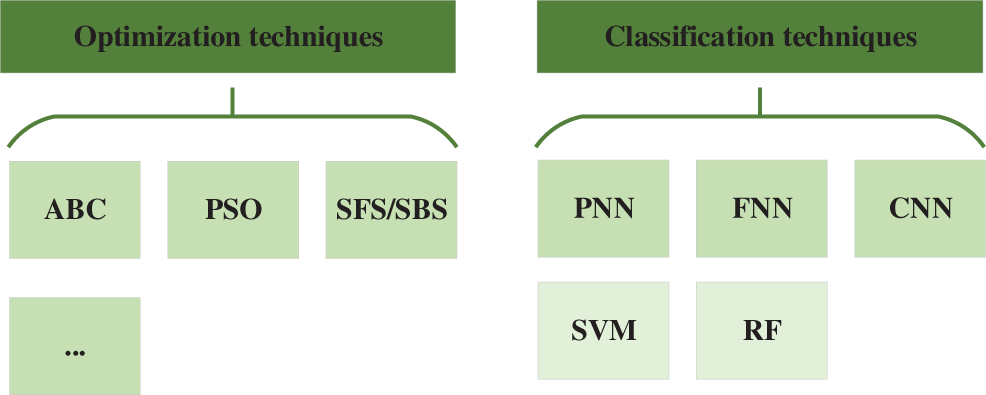
Figure 8: Summary of intelligent optimization and classification
4.1 Feature Optimization Algorithms
The ABC and PSO algorithms are widely used in feature optimization. PSO imitates the predation behavior of bird flocks and integrates the historical positions of the congregation to update the objective function in an iterative way [118]. ABC imitates the behavior of honeybees to find the optimal solution in the search space. Although ABC has low complexity and moderate convergence speed, in case of inappropriate hyperparameters, ABC may fall into the local optimum [119]. Thus, the ABC algorithm is generally combined with other algorithms. The literature [120] used the adaptive chaotic ABC optimization algorithm to optimize the parameters of the objective function. The literature [121] combined ABC algorithms with other optimization algorithms and used PSO as the basis for feature selection.
In addition to the classic PSO and ABC, other feature optimization algorithms can achieve dimensionality reduction and screening of feature subsets in addition to the traditional PSO and ABC. In [122], the features of dimensionality reduction and optimization of the neural network were used to realize the optimization of PQS features. In [86], the features extracted by CNN for S transform were directly employed. Secondary extraction is performed to optimize the number of feature subsets. Zhao et al. [83] proposed an optimal feature selection method based on a probabilistic neural network with the help of PNN, which gradually eliminated redundant and irrelevant features in a noisy environment and improved the classifier’s performance.
Apart from the neural network, SFS and SBS are commonly used feature optimization methods. In [123], SFS and SBS were adopted to extract optimal perturbation features, and the classification accuracy can be maintained above 99.7%. Dempster-Shafer evidence theory [124] introduced the concept of trust functions, forming a set of “evidence” and “composition” mathematical methods for dealing with uncertainty reasoning. Unlike the Bayesian theory, the Dempster-Shafer evidence theory can represent uncertainty fully without prior probabilities and is widely used to deal with uncertain data. Regarding this point, the Dempster-Shafer evidence theory is also a good choice for feature optimization of PQS [125,126]. For some up-to-date feature optimization approaches, please see the non-dominated sorting genetic algorithm [127], Fischer linear discriminant analysis [99], and mutation operators [69].
Artificial Neural Networks imitate the neuron network of the human brain to establish a simple model that forms different networks according to other connections. Due to their non-localization, nonlinearity and non-convexity, ANNs are found to be highly suitable for feature classification and are widely used in the field of PQD classification and detection. ANN is ideal for feature quantities extracted by various feature extraction methods such as WT, ST, EMD, VMD, and KF. Utilizing wavelet transform WT, Sun et al. [71] proposed PSO-based FNN to detect the islanding phenomenon. As shown in Fig. 9, Researchers use ANN to train networks with different disturbances offline. After training, the features of PQS are passed to multiple ANN networks in parallel for online discrimination. In the paper [81], the researchers used WT to extract PQS features and then used the improved stack sparse denoising automatic encoder for classification. The training process of this algorithm is carried out by supervising the backpropagation. It effectively identifies voltage sags and interruptions. At the same time, WT and ANN were directly combined in [128] to realize wavelet network WN and complete the extraction and classification of PQS at one time.
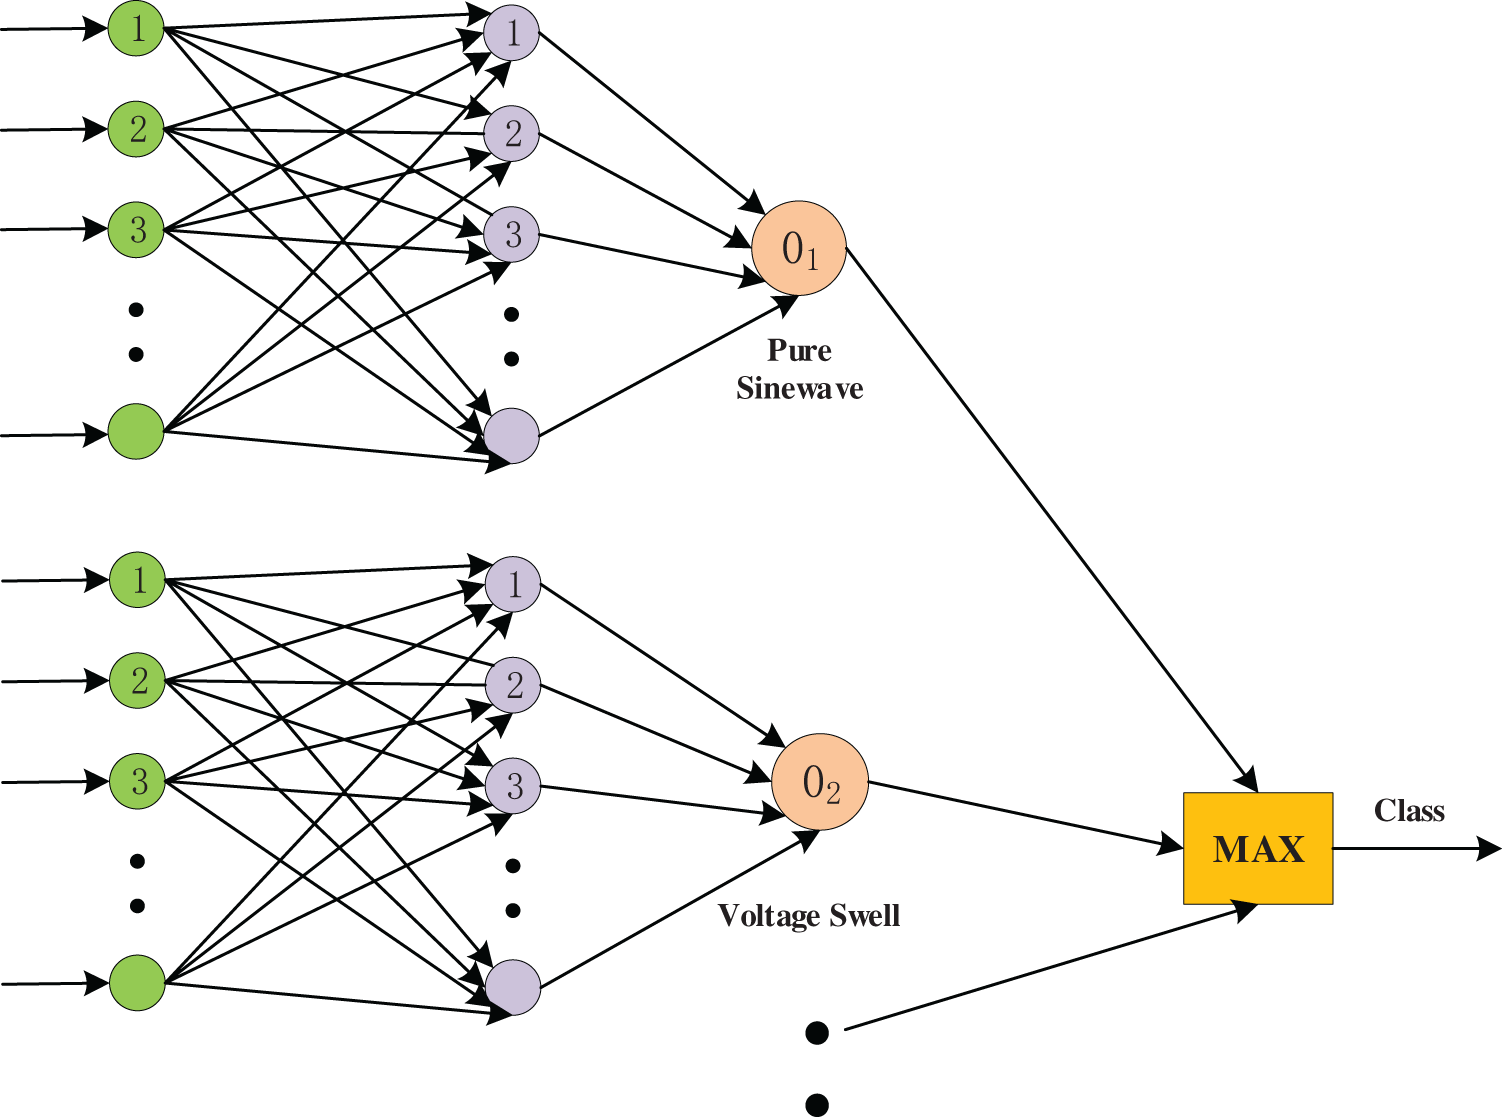
Figure 9: Artificial neural network for PQD classification
Both WT and STFT techniques perform windowing on the signal before analysis to overcome the disadvantage that FT cannot perform time-frequency analysis. Nevertheless, the added fixed-width windows cannot adapt to different signals [129,130]. To solve this problem, ST uses a Gaussian window function whose width is proportional to the inverse of the frequency so that more noise-insensitive feature quantities can be used in PQD detection and classification. In [58], the PQS waveform was filtered by the KF technique and then transformed by the multi-ST feature extraction technique. After feature optimization, the author used a multilayer FNN to achieve perturbation extraction under various high-noise disturbances. In [85], the authors used ST technology as the extraction method, combined with a complex extreme value learning neural machine network and complex value radial basis function network, to achieve single and joint disturbance detection in the power grid.
An adaptive neural network is an artificial neural network with adaptive learning capability. Combining various classical PQD extraction algorithms with neural networks can realize adaptive extraction of PQD. The method of an adaptive neural network to achieve PQD classification has the advantages of high accuracy and high noise resistance. As early as 2004, Kim et al. [131] proposed to combine DWT with an adaptive neuro-fuzzy inference classifier. DWT uses multi-resolution signal decomposition to achieve feature extraction. The adaptive neuro-fuzzy inference was then used, showing better efficiency. Over time, scholars have combined adaptive neural networks with different feature extraction methods to provide various approaches for detecting PDQ classification and have established the advantages of each. For example, a new scheme combining ANN with information theory [132] has very high robustness. It can accurately estimate the PQD even in noisy environments. And, the literature [133] used the traditional HHT transform and NFS classifier. The combination of neural networks and fuzzy systems effectively improves the adaptability of neural networks. This approach enhances the efficiency of the traditional HHT method.
Moreover, based on deep learning, the proposed three-stage diagnosis method [134] achieves almost 100% accuracy. Different adaptive feature extraction and classification methods have recently achieved good results. For example, an adaptive rate time domain analysis method was used to extract the correlation features of the segmented signal [135], achieving a compression gain of 13.26 times. It further tuned the parameters of the extreme learning machine (ELM) [136] by the gray wolf optimization (GWO) method to improve the accuracy.
Unlike traditional clasS-transformed feature extraction methods, the dimensional transformation was used in [51] to convert PQS to grayscale images. An FNN classifier selected the features to distinguish single PQ events from combined PQ events. The EMD and VMD are used by [42] and [101] to decompose PQS, select valuable features, and classify different perturbations, where the detection rate reaches 100%. In [57], the authors estimated the harmonic components of the post-fault voltage signal as eigenvectors through a KF and used SVM and ANN for fault diagnosis and localization.
4.3 Convolutional Neural Network
The Convolutional Neural Network is one kind of deep learning network with convolution operation. It has the characteristics of no loss of parameters, high training efficiency, and good prevention of overfitting when dealing with large-scale two-dimensional image problems. In PQ event detection, the PQS waveform is often converted into a two-dimensional image. Then the perturbation detection and classification are carried out with the advantage of CNN processing techniques [137,138]. Fig. 10 depicts the flow of CNN processing grayscale images of PQS, which can be converted to 2D frequency images by WVD distribution and time-frequency analysis, in addition to grayscale images. With the advantage of CNN in processing images, PQS can be converted into different images that CNN classifies. The CNN can automatically distinguish between the behaviors of typical power systems and power quality disturbances (e.g., voltage dips, voltage swells, and interruptions) at a higher level of accuracy after training [139]. This lays a good foundation for the automatic detection of artificial intelligence when identifying the interference of the power system, reducing the failure rate in future extraction [140,141].
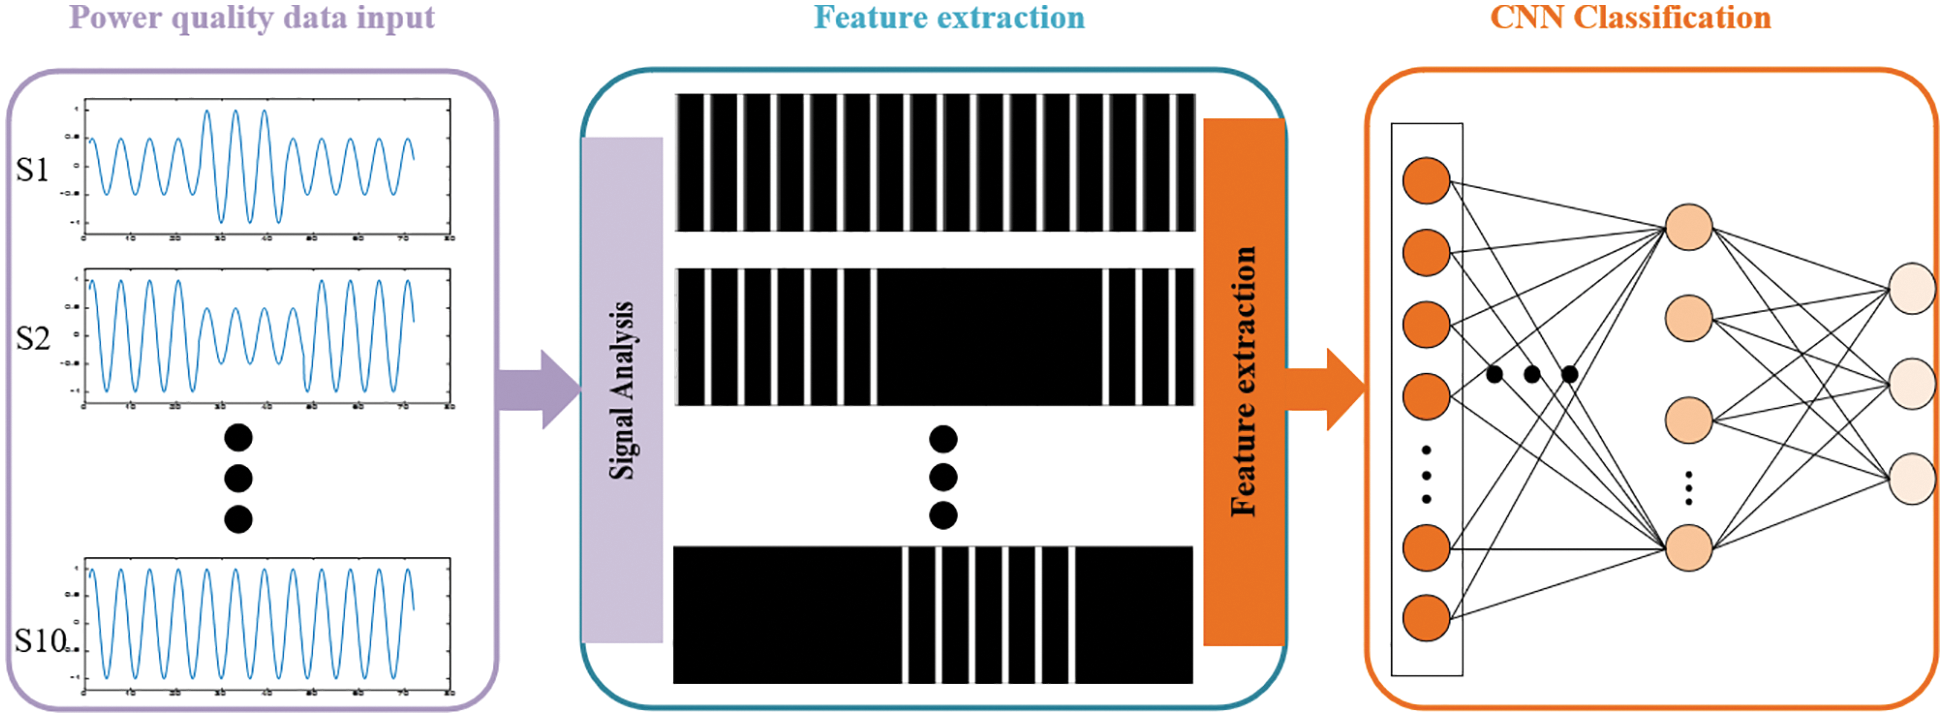
Figure 10: Convolutional neural network processing of grayscale images of PQS
The requirement for using CNN is that one-dimensional interference signals must be converted into two-dimensional image files before the classification process [142]. After combining with a CNN, WVD can determine follow-up remedial actions [67]. The combination of S-transform and CNN can avoid the complex problem of window function selection with fixed window width, good noise immunity, better real-time performance, and higher accuracy [86]. Subsequently, CNN was combined with PSR in [143] to provide remedial measures without human interventions.
On the other hand, CNN can also extract features by utilizing a convolution base composed of two-dimensional convolution normalization to capture grayscale image features [48]. One-dimensional and two-dimensional structure groups were combined in [49] to build a hybrid CNN to ensure satisfactory performance with moderate computational complexity. CNN was further integrated with adaptive variational modal decomposition in [106] to effectively obtain features and thus achieve high classification accuracy, good noise resistance, and short detection time.
4.4 Probabilistic Neural Network
Probabilistic Neural Networks are a simple structure, and extensive neural networks are built based on Bayesian decision theory. Compared with BP neural network, PNN has faster learning speed, good robustness, and classification capability for the PQD classification study, and its structure is shown in Fig. 11. In [144], the IMF of the narrowband frequency was extracted by HHT as the input of PNN, and the simulation results indicate that HHT can effectively classify the PQ events. HHT was used as a feature extraction method in [41], and the obtained results were compared with that of classification, learning vector quantization neural network, and feed-forward multilayer neural network. The study found that the classification performance of PNN was superior to LVQ and FFML.
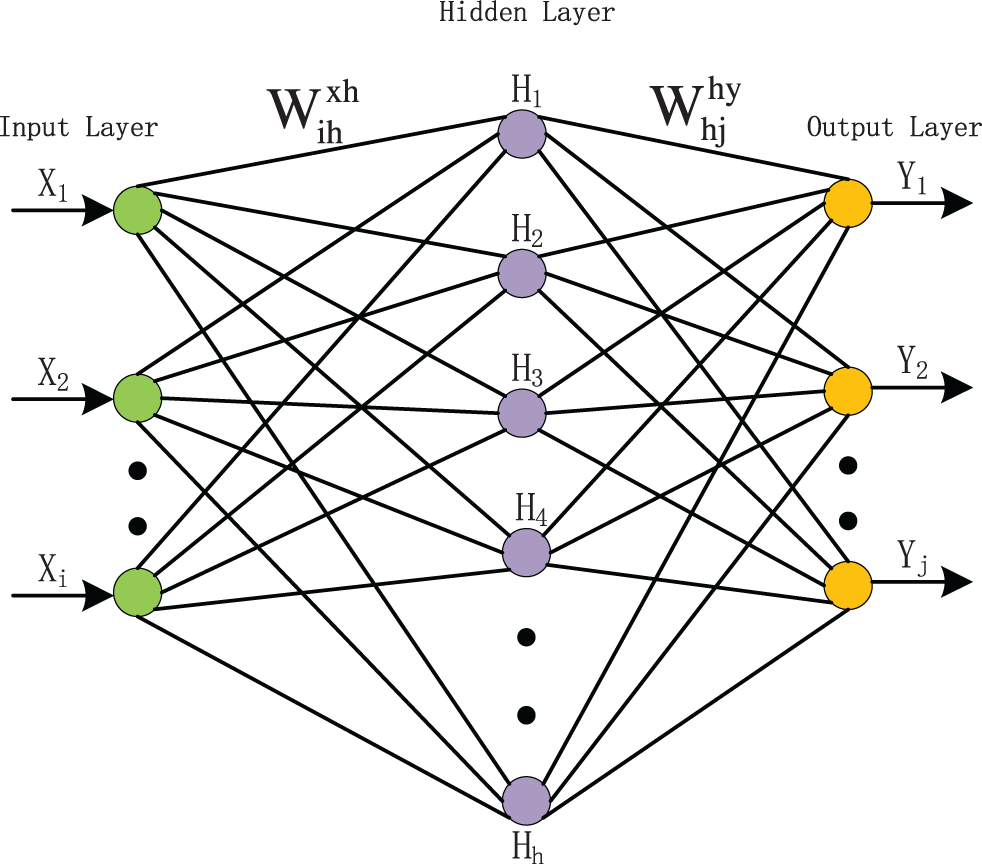
Figure 11: Probabilistic neural network structure
Note that PNN can also be combined with Gabor transform without any iterations to adjust weights, and the results confirmed the effectiveness of the GT-PNN method in PQD recognition [145]. Even in an environment with noise interference, the PFS method combined with the adaptive probability neural network can gradually remove redundant and irrelevant features in the noise environment, effectively eliminating non-essential characteristics and improving the classifier's performance [120]. Several features were extracted by three-order primary component analysis decomposition in [109], taking advantage of PNN to identify disturbances.
PQD has been classified by Random Forests, a machine-learning approach using multiple decision trees to improve classification ability. Wavelet transform and S transform can be utilized together with RF in [70] to show that RF classifiers based on wavelet transform WT better performance classifying data. Literature [73] used RF to develop DWT to extract features to build a model. Literature [30] combined WT and ST extraction to establish a decision tree classifier that can effectively identify mixed interference signals. Zhao et al. [83] achieved 95.33% accuracy by bagging with a rotating forest ROF ensemble classifier [72]. Data mining-based RF [82] was also applied to distinguish power voltage disconnection events from PQ disturbances [146]. An improved RF-based classifier was applied to the optimal fast discrete ST PQ detection framework [92]. The generalization error of RF was used as the objective function in [88], where MDABC was adopted to optimize the forest scale and the number of input features.
Compared with the RF classifier before optimization, the MDABC-RF classifier has better classification accuracy for complex PQD signals. The PQD signals were identified in [147] by using a construct-set RF classifier which determined optimal feature subsets by a sequence of forwarding search methods. The new process accurately identified PQD signals in different noise environments by selecting the optimal classification subset [148,149]. It was proposed in [150] that based on the Decision Tree and multi-resolution S-transform, the characteristics of the analyzed PQS were quantitatively reflected.
It was shown in [151] that the decision tree and VMD could be used to estimate phasors accurately, classify mixed PQ events, and extract features such as pattern center frequency to process and localize PQ events without noise accurately. It was pointed out in [94] that the IMF function can classify different power system disturbances with improved decomposition quality and classification accuracy. Pan et al. [152] proposed a new Gradient Boosting Decision Tree method, which adopted the SA statistical calculation method based on statistical features at a small cost calculation.
Support Vector Machine is a class of supervised generalized linear binary classifiers whose classification is based on the labels of the data, and the hyperplane with the most significant margin is obtained to ensure sparsity and robustness. The features of PQD are extracted as the input of SVM, and then the classification of PQD is realized.
PQD classification was proposed in [153] with fewer samples and higher accuracy by using the interference features extracted by PSR as the input of SVM. Malik et al. [44] analyzed PQD distribution based on the SVM method, and such PQD distribution was later compared with the traditional AI methods of LVQ-NN. Literature [97] used SVM and Random Kitchen Sink algorithms to perform classification, and the accuracy of the Random Kitchen Sink method was 94.44%. SVM was later combined with feature extraction methods such as EMD, HHT, and GIP. Based on SVM and EMD [25], PQD classification was implemented to provide simplicity and good noise immunity with few features.
The performance evaluation of SVM and the classification method of PQD monitoring was introduced by [154]. The HHT technique for extracting feature vectors from the sampled power signal used as input to the SVM classifier is very effective. Similarly, in intelligent grid systems, the literature [155] combined SVM with HHT to detect PQE signals and to improve classification accuracy [3]. At the same time, the electrical energy signal was first converted into GIP, and then the data features were extracted by the image processing method [53].
In addition, the combination of SVM and VMD is also handy in detecting PQD classification. Aneesh et al. [95] used SVM to classify PQD based on VMD and EWT, and it was shown that VMD outperformed EWT in the feature extraction process. To localize disturbances, Multiscale Recurrence Quantification Decomposition was combined with a hybrid approach of SVM [156] for PQD monitoring in grid systems. Similarly, VMD and SVM were combined in [157] to obtain feature vectors. Then, SFS, SBS, and Gram-Schmidt Orthogonalization were applied to eliminate redundant features, and SVM was employed to improve the anti-interference ability, speed, and accuracy [158,159].
Different from the previous feature extraction algorithm, the Fisher score algorithm was used by [100] to remove redundant features in the permutation entropy. Scholars have recently combined WT and SVM to detect PQD categories [79,80], achieving high accuracy and robustness in noisy environments. Besides, a method based on SA statistical analysis and SVM classifier was proposed by [160] to detect PQD classification automatically and in real-time.
In addition to combining SVM with various feature extraction algorithms, much research was also devoted to developing SVM. For instance, the Kernel Support Vector Machine classifier was proposed by [91] and was combined with kernels to classify multiple features to improve the detection of PQD performance. Furthermore, Li et al. [84] employed a grid search method to optimize the parameters to determine the optimal parameters of the SVM. Under different signal-to-noise ratios, this method of SVM could accurately identify 14 kinds of signals.
4.7 Miscellaneous Detection or Classification Techniques
In addition to the techniques of intelligent classifiers described in Sections 5.1–5.5, some other classifier techniques should also be concerned. For example, exploiting Kullback-Leibler divergence was used in [161] to evaluate distributions’ differences. If the Kullback-Leibler divergence is greater than the threshold, there is an abnormal event. In [162], different PQ events in power systems were identified based on statistical time-domain joint neural networks.
In addition, the researchers introduced different machine learning algorithms to implement PQD classification and provided more ideas for subsequent researchers, including locally weighted projection regression [163], balanced neural trees [43], random vector function linkage networks [105], quantum neural networks [124], class-specific weighted random vector function linkage network classifiers [114], and SoftMax classifiers [164].
This paper comprehensively reviews the existing literature on PQD detection and classification. Table 2 lists specific information on 23 of the 180 articles with relatively high citation rates for technical reference. All 23 methods achieved a correct identification rate of 90%, with the vast majority reaching 95%.
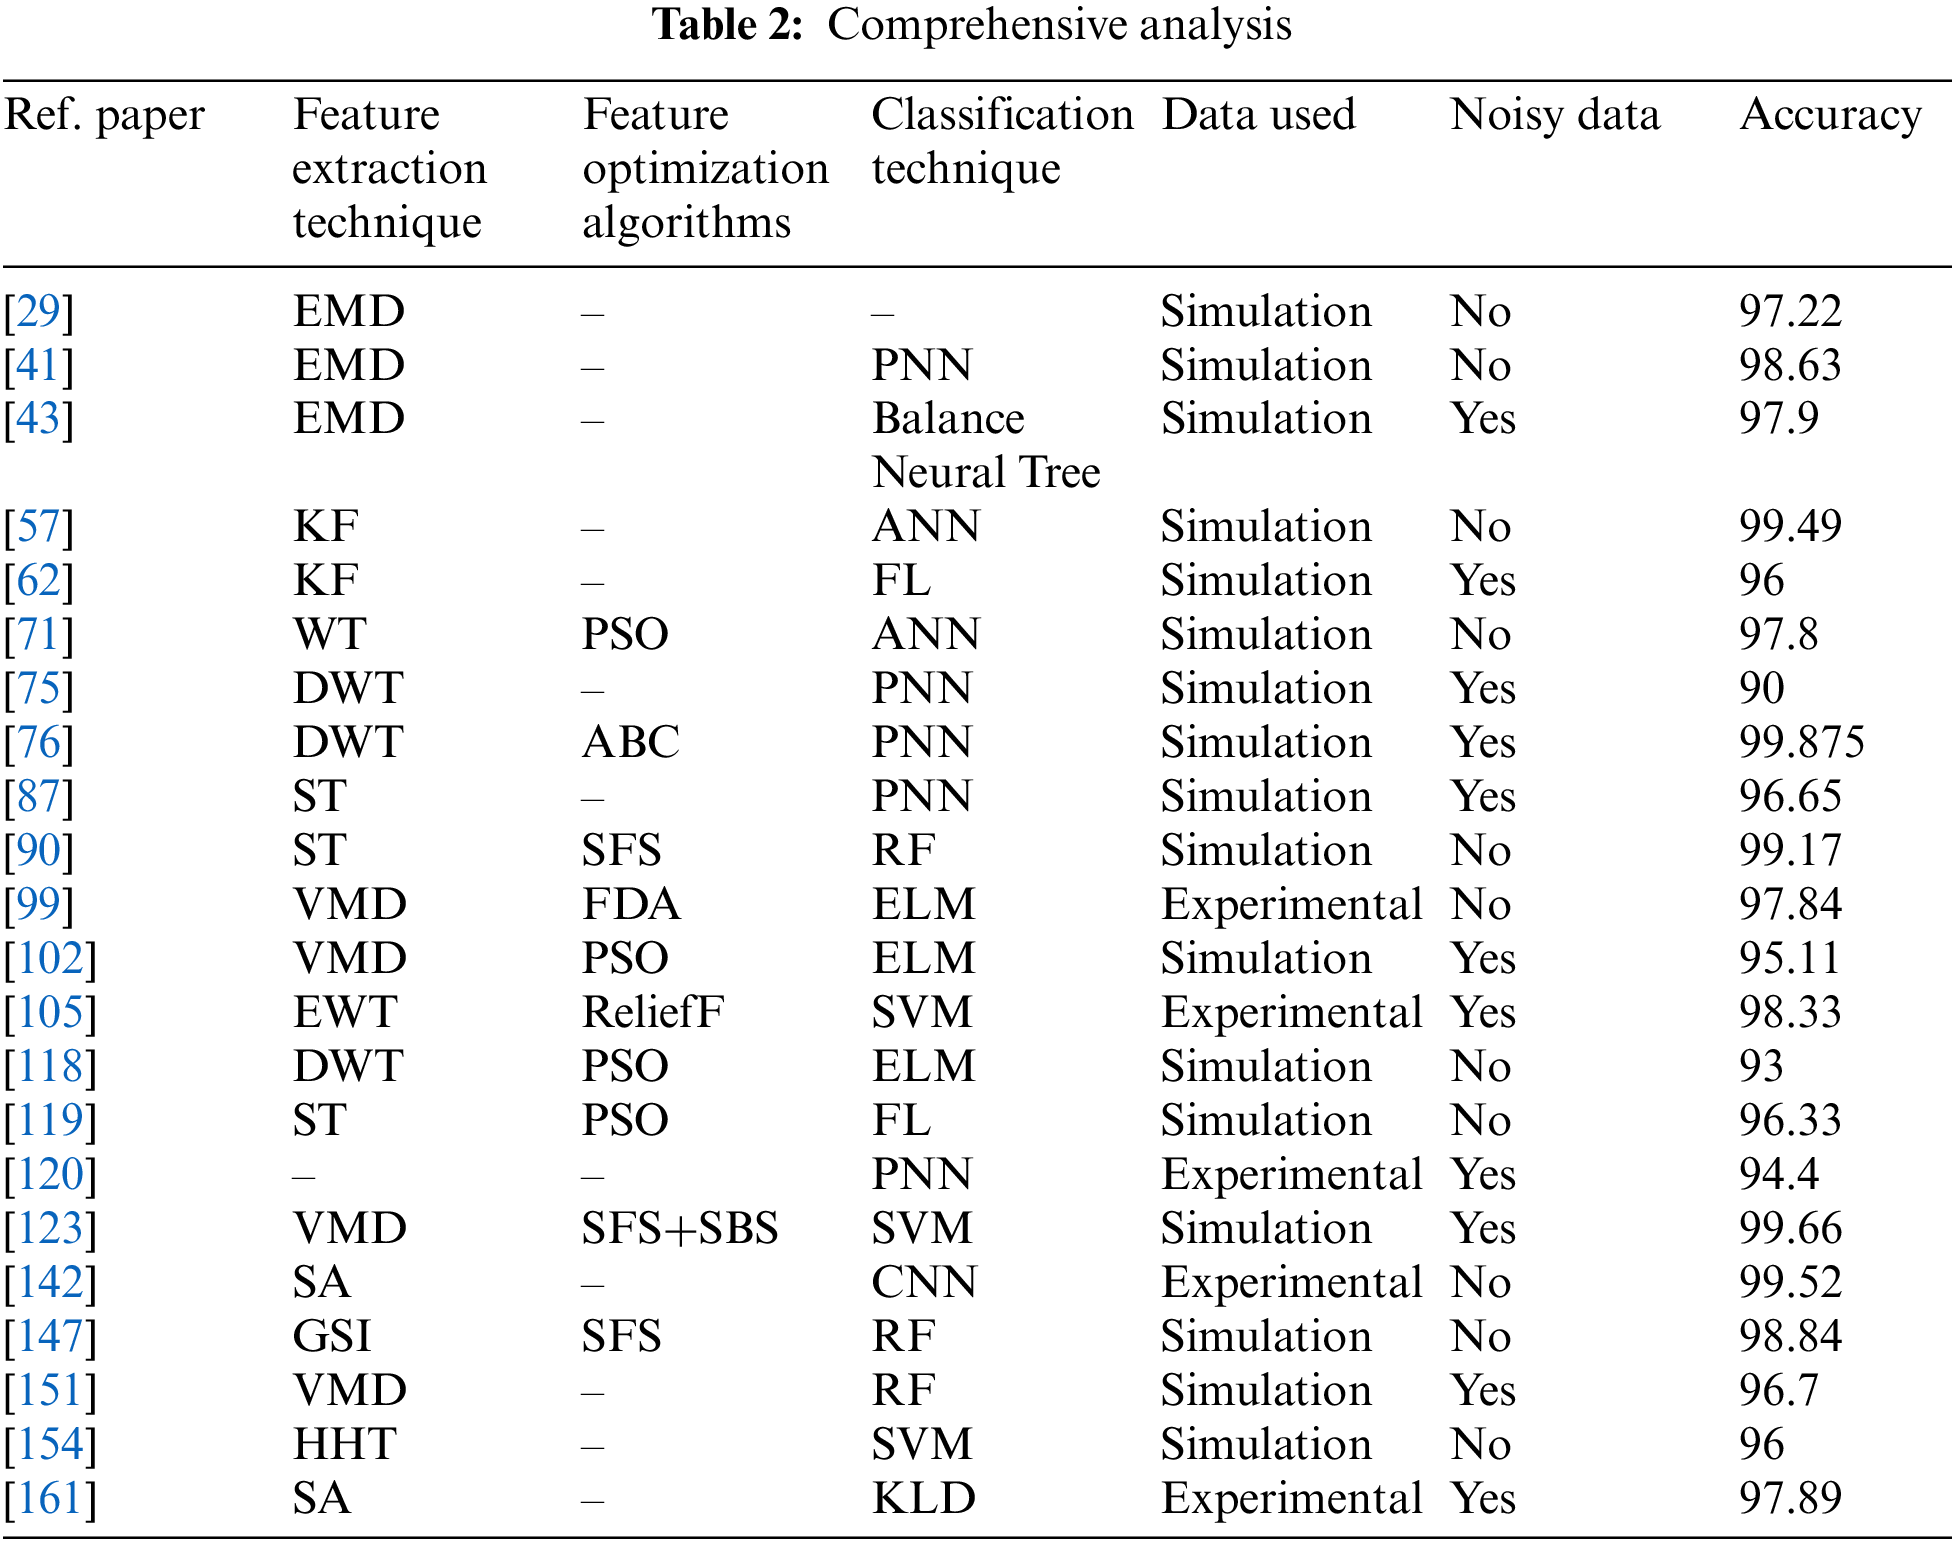
The ranking in Table 2 shows that the feature extraction means with the highest correct rate are still wavelet transform and correlation derivative techniques. Among them, Liang et al. [76] achieved a nearly 100% detection rate by combining wavelet transform and probabilistic neural networks. To achieve such results, the feature optimization algorithms ABC and PSO were added to obtain faster convergence and higher detection rates further. Neural networks PNN and ANN, and ELM have increasingly replaced the traditional machine learning algorithms RF and SVM as the new classifiers. Similarly, adding feature optimization algorithms in the middle of feature extraction and classifier can significantly improve the detection rate and speed.
5.1 Development and Performance of Feature Extraction Methods
Power quality disturbances were first introduced at the beginning of the twenty-first century when grid nodes were small, and generation was low. Time domain analysis techniques are suitable for analyzing PQD problems at the beginning of the twenty-first century because of their simple mathematical expression and precise physical meaning. The PQD problem has been made complex due to the rapid development of high-voltage transmission and distribution grid technologies. Due to the fast development of high-voltage power transmission technologies and distributed grid technologies, PQD could get more complicated. Accordingly, the original PQD problem is expected to be transformed into other forms to obtain desired features quickly and accurately. As one of the most classical signal processing methods, FT plays a vital role in detecting steady-state disturbance of power quality. Unfortunately, due to shortcomings in time-frequency analysis, FT is not feasible for testing temporary perturbations such as sudden drops and rises. The suitable candidates capable of solving such a problem are the STFT and WT, which have satisfactory window analysis capabilities.
It is worth mentioning that WT cannot extract any frequency signal alone, and the wavelet coefficients are greatly affected by noise, making WT unable to quantitatively detect the amplitude characteristics of interference signals containing noise or harmonics. The combined WT and STFT proposal overcome the individual limitations of WT and STFT regarding the choice of window function and fixed window width. As a result, it is insensitive to noise in PQD analysis. The idea of combining the S-transform with other analysis tools has produced a large number of findings on PQD.
In addition to transform-based feature extraction methods, PQS feature extraction methods can also be implemented through pattern decomposition. The most classical implementation of EMD is based on the idea of smoothing the signal to obtain feature functions for different frequencies. The EMD method has the advantage of multi-resolution of the wavelet transform. The primary function of the decomposition is obtained adaptively according to the local time scale of the signal, avoiding the drawback that the analysis result of the wavelet transform depends on the accuracy of the wavelet transform. However, short-term data anomalies in the actual signal can interfere with the decomposition process of the EMD, creating localized high-frequency signals and thus affecting the decomposition results of the high-frequency part of the EMD. This problem is known as the modal aliasing phenomenon, and VMD has emerged to solve this problem of EMD. Therefore, in recent years, VMD has attracted continuous research interest as one of the most popular modal decomposition techniques to avoid modal aliasing by decomposing the time scale.
We rigorously counted the number of publications from 2000 to 2022 by searching the web of science for “power quality disturbance” and specific technical terms. As shown in Fig. 12, wavelet transform is the most popular means of feature extraction. Although WT's publication volume occasionally fluctuates from year to year, its total publication volume is almost at the top, especially in 2008 and 2019. The Kalman filter and empirical modal decomposition techniques, which have evolved over the decade from 2005 to 2015, are consistent with WT in terms of publication volume.
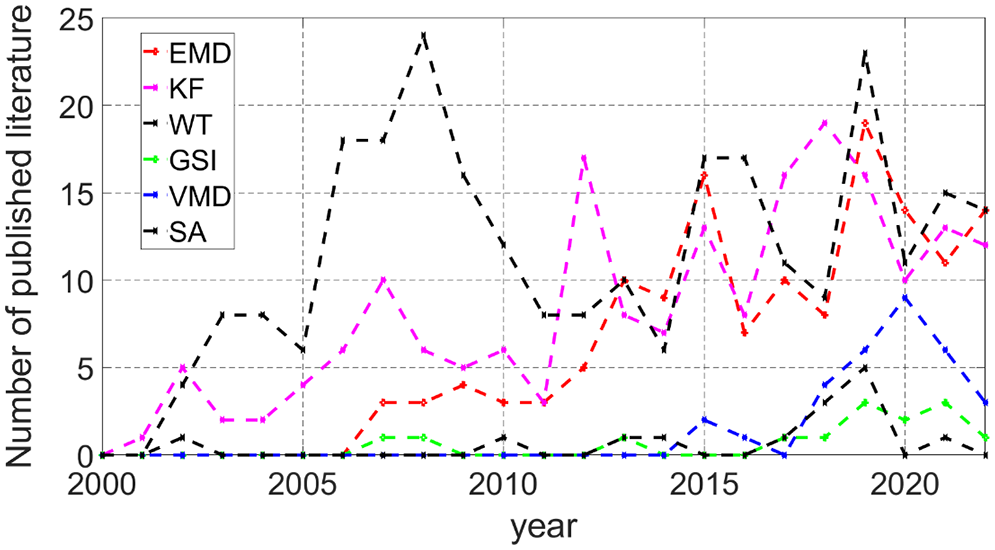
Figure 12: Analysis of the number of publications for feature extraction techniques
As the representatives of new technologies, GSI, VMD and SA have developed year by year as a specific trend in the application of PQD detection tools since 2006. Similar to the development process of EMD and KF, we predict that more papers related to GSI, EMD and SA will appear next. More evidence can be observed in our given Fig. 13. we classified the collected literature over a five-year period according to the different techniques. The uncited literature was removed and the total number of citations was divided by the total number of citations. It can be obtained that although WT has a high number of published articles, the average number of citations is 12.1, which is smaller than VMD’s 15.6. The classical EMD and KF techniques have an average number of citations between 6 and 7, while the newly proposed SA technique has reached 9. The GSI technique has just received attention and its number of citations is not high for the time being, but the journals in which it is published are at a high level, so we have reasons to believe that it has some potential for development.
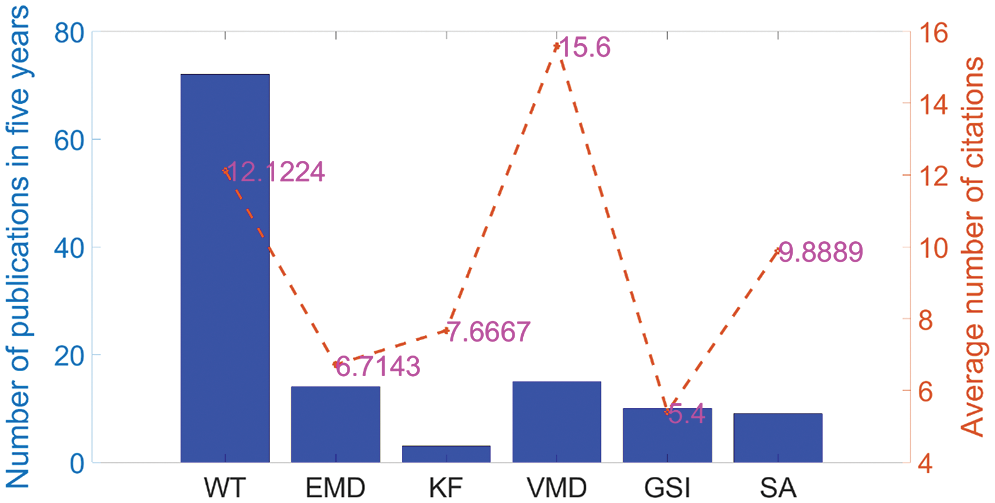
Figure 13: Five-year average number of citations
Our conclusion on feature extraction techniques indicates that the wavelet transform is still the most popular feature extraction technique. Although the wavelet transform has been proposed in combination with power quality disturbance detection for more than a decade, the stability and efficiency of the WT make it the most published technique in the field of PQD detection technology. At the same time, the VMD technique is starting to develop and its potential is so great that we predict that it will gradually replace the WT as the most popular technique in the field of PQD detection in the next few years. In addition, both GSI and EMD techniques are worthy of attention and study.
In summary, current research hotspots in feature extraction methods focus on S-transform (see Section 3.5) and VMD (see Section 3.7). Image processing of features in PQS is also a hot direction (see Section 3.2), with popular techniques such as grey-scale image and phase space reconstruction techniques to convert 1D PQS into 2D images. Interference recognition in PQS is achieved by exploiting the CNN processing image’s outstanding performance to achieve this. In addition, researchers have found more significant advantages in using mainframe computers to distribute and identify statistical features in the time domain of PQS and then complete real-time capture and classification of PQDs due to the tremendous development of computer computing power (see Section 3.4).
5.2 Development and Performance of Feature Optimization and Intelligent Classification
The traditional literature in the field of PQD has focused solely on feature extraction and classifier design. In contrast, the workload and misjudgment rate of the classifier has not been fully considered, especially in cases of complex feature extraction, large feature amounts, and high coupling degree. As a result, feature extraction is usually conducted before classifier design utilizing statistically analyzing classification effects or implementing intelligent algorithms, including ABC and PSO (see Section 4.1) for automatic feature selection. Some scholars use feature optimization technology in neural networks or the dimension reduction algorithm in machine learning to directly optimize the extracted features. For better PQD detection, a promising research direction should be feature optimization approaches that can be applied to different feature extraction methods and classifiers.
In order to obtain the research trends of classifiers in PQD detection techniques, we conducted statistics for the number of classifiers published. As shown in Fig. 14, ANN and SVM, as the hottest classification techniques, are rising in the number of publications yearly. Researchers have found that converting PQS signals into 2D images and leveraging the advantages of CNN in processing images can substantially improve the efficiency of PQD detection, so the number of papers on CNN applications in PQD detection is overgrowing. This direction is worth thinking and researching.
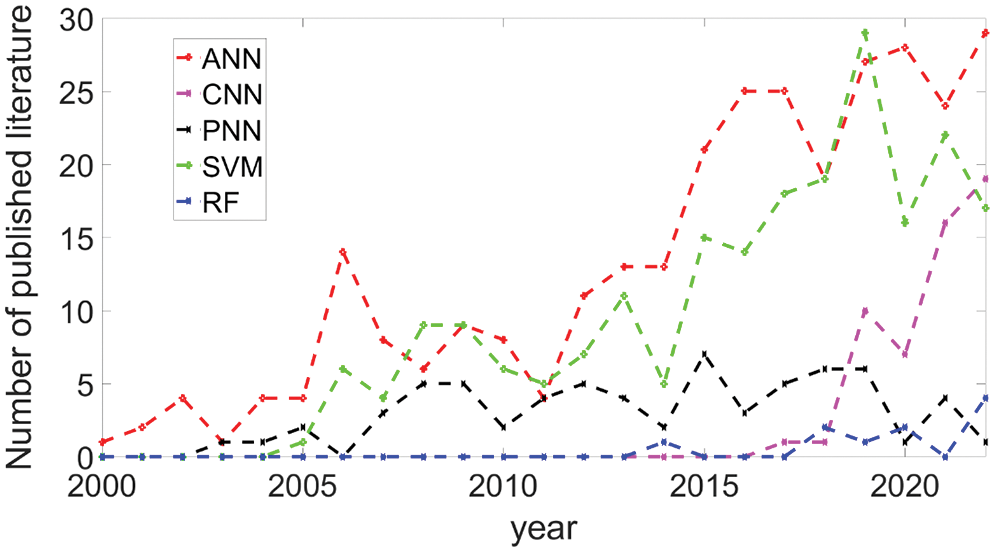
Figure 14: Analysis of the number of publications for Intelligent Classification
Regarding the classification and recognition of various PQ events, ANN, SVM, ES and RF are all good choices. Traditional ANN-based classifiers are generally slow to train, not very accurate, and prone to under-learning, over-learning, and getting stuck at local extremes. RF and SVM methods work well in solving sample classification problems, but face much more difficulties than neural networks and Bayesian methods. Therefore, more research has been done to develop combined strategies for pattern classification to compensate for the shortcomings of any method and obtain better classification performance, such as the combination of ANN and SVM, fuzzy theory and ANN, SVM and Bayesian theory. In addition, researchers are also focusing on more cutting-edge machine learning methods, including CNN, PNN and QNN, to solve the traditional PQD problem.
In recent years, researchers increasingly used the integration of artificial intelligence algorithms to simultaneously achieve feature extraction, feature optimization, and classifier. The wavelet neural network replaces the nonlinear sigmoid function in the ordinary neural network with the nonlinear wavelet basis. It constructs a new layered, multi-resolution artificial neural network model. This neural network model can directly input signals into the neural network for classification without additional feature extraction. Similarly, one-dimensional PQS is converted to a two-dimensional gray image, and then the image processing algorithm is used for direct classification. In a convolutional neural network, the 1D-CNN algorithm also supports the direct input of signals and the direct output of classification results. The commonness of these methods is that researchers ignore the features extracted in the middle and the optimized features but only the final output of the classification results. The internal operation is similar to the black box, which is closed to the outside world. Adjusting different parameters can speed up the classification, but the disadvantages are also prominent. Specific environments need specific debugging parameters, and the parameters of different environments are inconsistent. If future researchers can produce an intelligent integrated classification algorithm with adaptive parameter adjustment, it will further expand the combination of this field and artificial intelligence.
5.3 Future Possible Research Hotspots of PQD Detection
The integration of PQD detection with information systems is a significant research trend to achieve intelligence and practicality. Considering the importance of PQD detection for the development of human society, this field will be even more promising and flourishing in the future. This paper mainly introduces the PQD detection of artificial intelligence with a focus on the following four aspects:
1. Develop more adaptive/transformation feature extraction methods based on artificial intelligence algorithms for better detection and classification [165–167].
2. Another idea is to select an appropriate subset of features and optimization methods for redundant features [168–170] which further influence the classifier’s efficacy to optimize the classification process.
3. New research could consider converting the power quality signal into a two-dimensional grey-scale image by extracting phase and frequency features. PQD detection is then performed with the help of popular image processing tools. Rely on existing convolutional neural networks with effective image processing performance and their variants to isolate the interfering features. Recovering the original image ensures that PQDs can be correctly captured and classified in the presence of inherent noise.
4. New research requires further efforts to compress the many power quality data generated by the continuous operation of the grid [171–175] to ensure real-time monitoring of power quality.
In summary, there is great potential for future PQD detection technologies to be combined with research hotspots in other fields, such as data fusion, distributed computing, data mining, cyber-physical systems, etc. This new detection technology undoubtedly brings more development opportunities and technical challenges to PQD detection, especially in large energy systems, which is certainly one of the most promising development directions for power grids.
This review collects 180 papers, nearly 60% of which were published in the last five years. Compared to other reviews, this review presents the latest technologies as ultimately as possible. It includes GSI (Section 3.2); SAFT (Section 3.3); VMD (Section 3.7); CNN (Section 4.3); PNN (Section 4.4). Other state-of-the-art techniques are placed in Section 3.8 and Section 4.7 Miscellaneous Techniques. In Section 5, this review summarizes the development process and applicability of each technology. And the accurate capture rates provided in each technology article are collected in conclusion to provide a reference for new researchers to select technologies for further research. This review presents for the first time the keywords. Grayscale image processing techniques; statistical analysis feature techniques; and for the first time, the application of PNN and CNN neural network techniques to the PQD problem is summarized. Finally, we give suggestions on the development process and the scope of application of various techniques to save the time of new researchers. And we also make predictions on the future hot directions. These works are uncommon in other published reviews. The next step is to continue to delve into neural networks and explore the deep collaboration between the field of PQD detection and neural networks.
Acknowledgement: The authors would like to thank the anonymous reviewers and the editors of the journal. Your constructive comments have improved the quality of this paper.
Funding Statement: The authors received no specific funding for this study.
Conflicts of Interest: The authors declare that they have no conflicts of interest to report regarding the present study.
References
1. Deng, X., Shao, H. J., Hu, C. L., Jiang, D. B., Jiang, Y. T. (2020). Wind power forecasting methods based on deep learning: A survey. Computer Modeling in Engineering & Sciences, 122(1), 273–301. https://doi.org/10.32604/cmes.2020.08768 [Google Scholar] [CrossRef]
2. Efe, S. B. (2018). UPFC based real-time optimization of power systems for dynamic voltage regulation. Computer Modeling in Engineering & Sciences, 116(3), 391–406. https://doi.org/10.31614/cmes.2018.01784 [Google Scholar] [CrossRef]
3. Chawda, G. S., Shaik, A. G., Shaik, M., Padmanaban, S., Holm-Nielsen, J. B. et al. (2020). Comprehensive review on detection and classification of power quality disturbances in utility grid with renewable energy penetration. IEEE Access, 8, 146807–146830. https://doi.org/10.1109/ACCESS.2020.3014732 [Google Scholar] [CrossRef]
4. Ibrahim, W. R. A., Morcos, M. M. (2002). Artificial intelligence and advanced mathematical tools for power quality applications: A survey. IEEE Transactions on Power Delivery, 17(2), 668–673. https://doi.org/10.1109/61.997958 [Google Scholar] [CrossRef]
5. Wang, Q., Yang, X. L., Pu, D., Fan, Y. Y. (2022). Sustainable investment forecasting of power grids based on the deep restricted boltzmann machine optimized by the lion algorithm. Computer Modeling in Engineering & Sciences, 130(1), 269–286. https://doi.org/10.32604/cmes.2022.016437 [Google Scholar] [CrossRef]
6. Gopinath, C., Rajvikram, M. (2018). A pathway to explore the hidden specialty in the design of fifteen level inverter in grid connected PV system. Computer Modeling in Engineering & Sciences, 115, 359–386. https://doi.org/10.3970/cmes.2018.06143 [Google Scholar] [CrossRef]
7. Gou, H. Z., Ning, Y. C. (2021). Forecasting model of photovoltaic power based on KPCA-MCS-DCNN. Computer Modeling in Engineering & Sciences, 128(2), 803–822. https://doi.org/10.32604/cmes.2021.015922 [Google Scholar] [CrossRef]
8. Chen, K., Yang, Y. P., Xu, B., Wang, Y. F., Zhang, S. et al. (2019). A new method for improving sampling bandwidth of power analyzer. 14th IEEE International Conference on Electronic Measurement and Instruments (ICEMI), pp. 86–94. Changsha, China. [Google Scholar]
9. Cheng, Y. H., Chen, K., Bai, L. B., Yang, J. (2014). Improvement of the grid-connect current quality using novel proportional-integral controller for photovoltaic inverters. Review of Scientific Instruments, 85(2), 86–92. https://doi.org/10.1063/1.4866023 [Google Scholar] [PubMed] [CrossRef]
10. Jimenez-Octavio, J. R., Lopez-Garcia, O., Pilot, E., Carnicero, A. (2008). Coupled electromechanical optimization of power transmission lines. Computer Modeling in Engineering & Sciences, 25(2), 81–98. https://doi.org/10.3970/cmes.2008.025.081 [Google Scholar] [CrossRef]
11. Shanmugapriya, P., Baskaran, J., Nayanatara, C., Kothari, D. P. (2019). IoT based approach in a power system network for optimizing distributed generation parameters. Computer Modeling in Engineering & Sciences, 119(3), 541–558. https://doi.org/10.32604/cmes.2019.04074 [Google Scholar] [CrossRef]
12. Mahela, O. P., Shaik, A. G., Gupta, N. (2015). A critical review of detection and classification of power quality events. Renewable & Sustainable Energy Reviews, 41(4), 495–505. https://doi.org/10.1016/j.rser.2014.08.070 [Google Scholar] [CrossRef]
13. Venkatakrishnan, G. R., Rengaraj, R., Salivahanan, S. (2018). Grey wolf optimizer to real power dispatch with non-linear constraints. Computer Modeling in Engineering & Sciences, 115(1), 25–45. https://doi.org/10.3970/cmes.2018.115.025 [Google Scholar] [CrossRef]
14. Wang, Y. F., Chen, K., Xu, B., Yang, Y. P., Luan, Y. (2019). A high precision fundamental frequency measurement method based on FPGA. 14th IEEE International Conference on Electronic Measurement and Instruments (ICEMI), pp. 254–260. Changsha, China. [Google Scholar]
15. Montoya, F. G., Garcia-Cruz, A., Montoya, M. G., Manzano-Agugliaro, F. (2016). Power quality techniques research worldwide: A review. Renewable & Sustainable Energy Reviews, 54(9), 846–856. https://doi.org/10.1016/j.rser.2015.10.091 [Google Scholar] [CrossRef]
16. Jain, S. K., Singh, S. N. (2011). Harmonics estimation in emerging power system: Key issues and challenges. Electric Power Systems Research, 81(9), 1754–1766. https://doi.org/10.1016/j.epsr.2011.05.004 [Google Scholar] [CrossRef]
17. Singh, N., Ansari, M. A., Tripathy, M., Singh, V. P. (2021). Feature extraction and classification techniques for power quality disturbances in distributed generation: A review. IETE Journal of Research, 6(6), 1–16. https://doi.org/10.1080/03772063.2021.1920849 [Google Scholar] [CrossRef]
18. Khetarpal, P., Tripathi, M. M. (2020). A critical and comprehensive review on power quality disturbance detection and classification. Sustainable Computing-Informatics & Systems, 28(11), 113–118. https://doi.org/10.1016/j.suscom.2020.100417 [Google Scholar] [CrossRef]
19. Saini, M. K., Kapoor, R. (2012). Classification of power quality events–A review. International Journal of Electrical Power & Energy Systems, 43(1), 11–19. https://doi.org/10.1016/j.ijepes.2012.04.045 [Google Scholar] [CrossRef]
20. Geng, H., Wang, Z., Alsaadi, F. E., Alharbi, K. H., Cheng, Y. (2022). Protocol-based fusion estimator design for state-saturated systems with dead-zone-like censoring under deception attacks. IEEE Transactions on Signal and Information Processing over Networks, 8, 37–48. https://doi.org/10.1109/TSIPN.2021.3139351 [Google Scholar] [CrossRef]
21. Barros, J., Diego, R. I. (2016). A review of measurement and analysis of electric power quality on shipboard power system networks. Renewable & Sustainable Energy Reviews, 62(8), 665–672. https://doi.org/10.1016/j.rser.2016.05.043 [Google Scholar] [CrossRef]
22. Khokhar, S., Zin, A., Mokhtar, A. S. B., Pesaran, M. (2015). A comprehensive overview on signal processing and artificial intelligence techniques applications in classification of power quality disturbances. Renewable & Sustainable Energy Reviews, 51, 1650–1663. https://doi.org/10.1016/j.rser.2015.07.068 [Google Scholar] [CrossRef]
23. Geng, H., Wang, Z., Chen, Y., Alsaadi, F. E., Cheng, Y. (2021). Multi-sensor filtering fusion with parametric uncertainties and measurement censoring: Monotonicity and boundedness. IEEE Transactions on Signal Processing, 69, 5875–5890. https://doi.org/10.1109/TSP.2021.3118538 [Google Scholar] [CrossRef]
24. Wang, Y. F., Chen, K., Gou, X., He, R. J., Zhou, W. J. et al. (2021). A high-precision and wideband fundamental frequency measurement method for synchronous sampling used in the power analyzer. Frontiers in Energy Research, 9, 652386. https://doi.org/10.3389/fenrg.2021.652386 [Google Scholar] [CrossRef]
25. Geng, H., Wang, Z., Yi, X., Alsaadi, F. E., Cheng, Y. (2021). Tobit kalman filtering for fractional-order systems with stochastic nonlinearities under round-robin protocol. International Journal of Robust and Nonlinear Control, 31(6), 2348–2370. https://doi.org/10.1002/rnc.5396 [Google Scholar] [CrossRef]
26. Geng, H., Liang, Y., Yang, F., Xu, L., Pan, Q. (2016). Joint estimation of target state and ionospheric height bias in over-the-horizon radar target tracking. IET Radar, Sonar and Navigation, 10(7), 1153–1167. https://doi.org/10.1049/iet-rsn.2015.0318 [Google Scholar] [CrossRef]
27. Geng, H., Liang, Y., Yang, F., Xu, L., Pan, Q. (2016). The joint optimal filtering and fault detection for multi-rate sensor fusion under unknown inputs. Information Fusion, 29(3), 57–67. https://doi.org/10.1016/j.inffus.2015.10.003 [Google Scholar] [CrossRef]
28. Geng, H., Liang, Y., Xu, L. (2015). Fault detection for multi-rate sensor fusion under multiple uncertainties. IET Control Theory and Applications, 9(11), 1709–1716. https://doi.org/10.1049/iet-cta.2014.1134 [Google Scholar] [CrossRef]
29. Shukla, S., Mishra, S., Singh, B. (2009). Empirical-mode decomposition with Hilbert transform for power-quality assessment. IEEE Transactions on Power Delivery, 24(4), 2159–2165. https://doi.org/10.1109/TPWRD.2009.2028792 [Google Scholar] [CrossRef]
30. Jena, M. K., Panigrahi, B. K., Samantaray, S. R. (2018). A new approach to power system disturbance assessment using wide-area postdisturbance records. IEEE Transactions on Industrial Informatics, 14(3), 1253–1261. https://doi.org/10.1109/TII.2017.2772081 [Google Scholar] [CrossRef]
31. Geng, H., Liang, Y., Zhang, X. (2014). Fast-rate residual generator based on multiple slow-rate sensors. IET Signal Processing, 8(8), 878–884. https://doi.org/10.1049/iet-spr.2013.0296 [Google Scholar] [CrossRef]
32. Geng, H., Liang, Y., Zhang, X. (2014). Linear-minimum-mean-square-error observer for multi-rate sensor fusion with missing measurements. IET Control Theory and Applications, 8(14), 1375–1383. https://doi.org/10.1049/iet-cta.2013.0972 [Google Scholar] [CrossRef]
33. Wang, S., Liao, Q., Liu, D., Zhou, Y., Xu, B. et al. (2013). Identification of power quality disturbances based on EEMD and TEO. 2nd International Conference on Mechatronics and Control Engineering (ICMCE 2013), pp. 469–476. Beijing, China. [Google Scholar]
34. Yang, D., Li, H., Hu, Y., Zhao, J., Xiao, H. et al. (2016). Vibration condition monitoring system for wind turbine bearings based on noise suppression with multi-point data fusion. Renewable Energy, 92(9), 104–116. https://doi.org/10.1016/j.renene.2016.01.099 [Google Scholar] [CrossRef]
35. Singh, R. H., Mohanty, S. R., Kishor, N., Thakur, A. K. (2019). Real-time implementation of signal processing techniques for disturbances detection. IEEE Transactions on Industrial Electronics, 66(5), 3550–3560. https://doi.org/10.1109/TIE.2018.2851968 [Google Scholar] [CrossRef]
36. Camarena-Martinez, D., Valtierra-Rodriguez, M., Andres Perez-Ramirez, C., Pablo Amezquita-Sanchez, J., de Jesus Romero-Troncoso, R. et al. (2016). Novel downsampling empirical mode decomposition approach for power quality analysis. IEEE Transactions on Industrial Electronics, 63(4), 2369–2378. https://doi.org/10.1109/TIE.2015.2506619 [Google Scholar] [CrossRef]
37. Salameh, J. P., Cauet, S., Etien, E., Sakout, A., Rambault, L. (2019). A new modified sliding window empirical mode decomposition technique for signal carrier and harmonic separation in non-stationary signals: Application to wind turbines. ISA Transactions, 89(11), 20–30. https://doi.org/10.1016/j.isatra.2018.12.019 [Google Scholar] [PubMed] [CrossRef]
38. Prakash, S., Purwar, S., Mohanty, S. R. (2020). Adaptive detection of islanding and power quality disturbances in a grid-integrated photovoltaic system. Arabian Journal for Science and Engineering, 45(8), 6297–6310. https://doi.org/10.1007/s13369-020-04378-w [Google Scholar] [CrossRef]
39. Nayak, P., Kumar Mallick, R., Dhar, S. (2020). Novel hybrid signal processing approach based on empirical mode decomposition and multi-scale mathematical morphology for islanding detection in distributed generation system. IET Generation Transmission & Distribution, 14(26), 6715–6725. https://doi.org/10.1049/iet-gtd.2020.0780 [Google Scholar] [CrossRef]
40. Liu, W., Guo, X. (2012). Detection of transient power quality disturbances based EMD combined with Choi-Williams distribution. IEEE International Conference on Automation and Logistics (ICAL), pp. 588–591. Zhengzhou, China. [Google Scholar]
41. Manjula, M., Mishra, S., Sarma, A. V. R. S. (2013). Empirical mode decomposition with Hilbert transform for classification of voltage sag causes using probabilistic neural network. International Journal of Electrical Power & Energy Systems, 44(1), 597–603. https://doi.org/10.1016/j.ijepes.2012.07.040 [Google Scholar] [CrossRef]
42. Lopez-Ramirez, M., Ledesma-Carrillo, L., Cabal-Yepez, E., Rodriguez-Donate, C., Miranda-Vidales, H. et al. (2016). EMD-based feature extraction for power quality disturbance classification using moments. Energies, 9(7), 565. https://doi.org/10.3390/en9070565 [Google Scholar] [CrossRef]
43. Biswal, B., Biswal, M., Mishra, S., Jalaja, R. (2014). Automatic classification of power quality events using balanced neural tree. IEEE Transactions on Industrial Electronics, 61(1), 521–530. https://doi.org/10.1109/TIE.2013.2248335 [Google Scholar] [CrossRef]
44. Malik, H., Almutairi, A., Alotaibi, M. A. (2022). Power quality disturbance analysis using data-driven EMD-SVM hybrid approach. Journal of Intelligent & Fuzzy Systems, 42(2), 669–678. https://doi.org/10.3233/JIFS-189739 [Google Scholar] [CrossRef]
45. Shareef, H., Mohamed, A., Ibrahim, A. A. (2013). An image processing based method for power quality event identification. International Journal of Electrical Power & Energy Systems, 46, 184–197. https://doi.org/10.1016/j.ijepes.2012.10.049 [Google Scholar] [CrossRef]
46. Deng, Y., Jia, H., Li, P., Tong, X., Li, F. (2018). A deep learning method based on long short term memory and sliding time window for type recognition and time location of power quality disturbance. Chinese Automation Congress (CAC), pp. 1764–1768. Xi’an, China. https://doi.org/10.1109/CAC.2018.8623810 [Google Scholar] [CrossRef]
47. Li, Z., Wu, W. (2008). Classification of power quality combined disturbances based on phase space reconstruction and support vector machines. Journal of Zhejiang University–Science A, 9(2), 173–181. https://doi.org/10.1631/jzus.A071261 [Google Scholar] [CrossRef]
48. Xue, H. H., Chen, A. L., Zhang, D. Q., Zhang, C. H. (2020). A novel deep convolution neural network and spectrogram based microgrid power quality disturbances classification method. IEEE Applied Power Electronics Conference and Exposition (APEC), pp. 2303–2307. New Orleans, USA. https://doi.org/10.1109/APEC39645.2020.9124252 [Google Scholar] [CrossRef]
49. Sindi, H., Nour, M., Rawa, M., Ozturk, S., Polat, K. (2021). A novel hybrid deep learning approach including combination of 1D power signals and 2D signal images for power quality disturbance classification. Expert Systems with Applications, 174, 114785. https://doi.org/10.1016/j.eswa.2021.114785 [Google Scholar] [CrossRef]
50. Karasu, S., Sarac, Z. (2020). Classification of power quality disturbances by 2D-Riesz transform, multi-objective grey wolf optimizer and machine learning methods. Digital Signal Processing, 101, 102711. [Google Scholar]
51. Zhang, Y., Zhang, Y., Zhou, X. (2022). Classification of power quality disturbances using visual attention mechanism and feed-forward neural network. Measurement, 188, 110390. [Google Scholar]
52. Shukla, J., Panigrahi, B. K., Ray, P. K. (2021). Power quality disturbances classification based on Gramian angular summation field method and convolutional neural networks. International Transactions on Electrical Energy Systems, 31, 13222. [Google Scholar]
53. Huang, R., He, F., Chun, G., Jiang, B. (2017). Power quality disturbances classification based on waveform feature. 5th International Conference on Mechanical, Automotive and Materials Engineering (CMAME), pp. 280–284. Guangzhou, China. [Google Scholar]
54. Narayanaswami, R., Sundaresan, D., Ranjan Prema, V. (2021). The mystery curve: A signal processing based power quality disturbance detection. IEEE Transactions on Industrial Electronics, 68, 10078–10086. [Google Scholar]
55. Wang, L., Liu, S., Zhang, Y., Ding, D., Yi, X. (2022). Non-fragile l2−l∞ state estimation for time-delayed artificial neural networks: An adaptive event-triggered approach. International Journal of Systems Science, 53(10), 2247–2259. [Google Scholar]
56. Chen, Y., Ma, K., Dong, R. (2022). Dynamic anti-windup design for linear systems with time-varying state delay and input saturations. International Journal of Systems Science, 53(10), 2165–2179. https://doi.org/10.1080/00207721.2022.2043483 [Google Scholar] [CrossRef]
57. Koley, E., Shukla, S. K., Ghosh, S., Mohanta, D. K. (2017). Protection scheme for power transmission lines based on SVM and ANN considering the presence of non-linear loads. IET Generation, Transmission & Distribution, 11(9), 2333–2341. https://doi.org/10.1049/iet-gtd.2016.1802 [Google Scholar] [CrossRef]
58. Zhao, Y., He, X., Ma, L., Liu, H. (2022). Unbiasedness-constrained least squares state estimation for time-varying systems with missing measurements under round-robin protocol. International Journal of Systems Science, 53(9), 1925–1941. https://doi.org/10.1080/00207721.2022.2031338 [Google Scholar] [CrossRef]
59. Chen, Y., Song, Q., Zhao, Z., Liu, Y., Alsaadi, F. E. (2022). Global Mittag-Leffler stability for fractional-order quaternion-valued neural networks with piecewise constant arguments and impulses. International Journal of Systems Science, 53(8), 1756–1768. https://doi.org/10.1080/00207721.2021.2023688 [Google Scholar] [CrossRef]
60. Geng, H., Wang, Z., Chen, Y., Yi, X., Cheng, Y. (2022). Variance-constrained filtering fusion for nonlinear cyber-physical systems with the denial-of-service attacks and stochastic communication protocol. IEEE/CAA Journal of Automatica Sinica, 9(6), 978–989. https://doi.org/10.1109/JAS.2022.105623 [Google Scholar] [CrossRef]
61. Geng, H., Wang, Z., Mousavi, A., Alsaadi, F. E., Cheng, Y. (2022). Outlier-resistant filtering with dead-zone-like censoring under try-once-discard protocol. IEEE Transactions on Signal Processing, 70, 714–728. https://doi.org/10.1109/TSP.2022.3144945 [Google Scholar] [CrossRef]
62. Abdelsalam, A. A., Eldesouky, A. A., Sallam, A. A. (2012). Classification of power system disturbances using linear Kalman filter and fuzzy-expert system. International Journal of Electrical Power & Energy Systems, 43(1), 688–695. https://doi.org/10.1016/j.ijepes.2012.05.052 [Google Scholar] [CrossRef]
63. Gao, C., He, X., Dong, H., Liu, H., Lu, G. (2022). A survey on fault-tolerant consensus control of multi-agent systems: Trends, methodologies and prospects. International Journal of Systems Science, 88(13), 130–136. https://doi.org/10.1080/00207721.2022.2056772 [Google Scholar] [CrossRef]
64. Wang, L., Wang, Z., Zhao, D., Wei, G. (2022). Event-based state estimation under constrained bit rate: An encoding-decoding approach. Automatica, 143(2), 110421. https://doi.org/10.1016/j.automatica.2022.110421 [Google Scholar] [CrossRef]
65. Zhu, K., Wang, Z., Dong, H., Wei, G. (2022). Set-membership filtering for two-dimensional systems with dynamic event-triggered mechanism. Automatica, 143(6), 110416. https://doi.org/10.1016/j.automatica.2022.110416 [Google Scholar] [CrossRef]
66. Liu, Q., Wang, Z., Zhang, J., Zhou, D. (2022). Necessary and sufficient conditions for fault diagnosability of linear open- and closed-loop stochastic systems under sensor and actuator faults. IEEE Transactions on Automatic Control, 67(8), 4178–4185. https://doi.org/10.1109/TAC.2021.3108587 [Google Scholar] [CrossRef]
67. Shen, Y., Wang, Z., Liu, H., Dong, H., Yi, X. (2022). Recursive state estimation for multi-rate time-varying systems with multiplicative noises: Dealing with sensor resolutions. International Journal of Robust and Nonlinear Control, 32(10), 6110–6126. https://doi.org/10.1002/rnc.6128 [Google Scholar] [CrossRef]
68. Ma, L., Wang, Z., Liu, H., Alsaadi, F. E., Alsaadi, F. E. (2022). Neural-network-based filtering for a general class of nonlinear systems under dynamically bounded innovations over sensor networks. IEEE Transactions on Network Science and Engineering, 9(3), 1395–1408. https://doi.org/10.1109/TNSE.2022.3144484 [Google Scholar] [CrossRef]
69. Roy, G. G., Panigrahi, B. K., Chakraborty, P., Mallick, M. K. (2009). On optimal feature selection using modified harmony search for power quality disturbance classification. World Congress on Nature and Biologically Inspired Computing, pp. 1354–1366. Coimbatore, India. [Google Scholar]
70. Markovska, M., Taskovski, D. (2017). Optimal wavelet based feature extraction and classification of power quality disturbances using random forest. International Conference on Smart Technologies, pp. 855–859. Ohrid, Macedonia. [Google Scholar]
71. Sun, L. B., Wu, Z. S., Yang, K. K. (2018). Application of islanding detection and classification of power quality disturbance in hybrid energy system. Asia Conference on Energy and Environment Engineering (ACEEE), Washington DC, USA. https://doi.org/10.1088/1755-1315/133/1/012020 [Google Scholar] [CrossRef]
72. Zou, L., Wang, Z., Hu, H., Dong, H. (2022). Ultimately bounded filtering subject to impulsive measurement outliers. IEEE Transactions on Automatic Control, 67(1), 304–319. https://doi.org/10.1109/TAC.2021.3081256 [Google Scholar] [CrossRef]
73. Song, Y., Wang, Z., Zou, L., Liu, S. (2022). Endec-decoder-based N-step model predictive control: Detectability, stability and optimization. Automatica, 135(8), 109961. https://doi.org/10.1016/j.automatica.2021.109961 [Google Scholar] [CrossRef]
74. Jeevitha, S. R. S., Mabel, M. C. (2018). Novel optimization parameters of power quality disturbances using novel bio-inspired algorithms: A comparative approach. Biomedical Signal Processing and Control, 42(2), 253–266. https://doi.org/10.1016/j.bspc.2018.02.003 [Google Scholar] [CrossRef]
75. Gaing, Z. L. (2004). Wavelet-based neural network for power disturbance recognition and classification. IEEE Transactions on Power Delivery, 19(4), 1560–1568. https://doi.org/10.1109/TPWRD.2004.835281 [Google Scholar] [CrossRef]
76. Liang, C., Teng, Z., Li, J., Yao, W., Hu, S. et al. (2022). A kaiser window-based S-transform for time-frequency analysis of power quality signals. IEEE Transactions on Industrial Informatics, 18(2), 965–975. https://doi.org/10.1109/TII.2021.3083240 [Google Scholar] [CrossRef]
77. Khokhar, S., Zin, A. A. M., Memon, A. P., Mokhtar, A. S. (2017). A new optimal feature selection algorithm for classification of power quality disturbances using discrete wavelet transform and probabilistic neural network. Measurement, 95, 246–259. https://doi.org/10.1016/j.measurement.2016.10.013 [Google Scholar] [CrossRef]
78. Cheng, H., Wang, Z., Wei, Z., Ma, L., Liu, X. (2022). On adaptive learning framework for deep weighted sparse autoencoder: A multiobjective evolutionary algorithm. IEEE Transactions on Cybernetics, 52(5), 3221–3231. https://doi.org/10.1109/TCYB.2020.3009582 [Google Scholar] [PubMed] [CrossRef]
79. Thirumala, K., Pal, S., Jain, T., Umarikar, A. C. (2019). A classification method for multiple power quality disturbances using EWT based adaptive filtering and multiclass SVM. Neurocomputing, 334(2), 265–274. https://doi.org/10.1016/j.neucom.2019.01.038 [Google Scholar] [CrossRef]
80. Chen, S. H., Li, Z. C., Pan, G. B., Xu, F. (2022). Power quality disturbance recognition using empirical wavelet transform and feature selection. Electronics, 11(2), 174. https://doi.org/10.3390/electronics11020174 [Google Scholar] [CrossRef]
81. Xiao, F., Lu, T. G., Wu, M. L., Ai, Q. (2020). Maximal overlap discrete wavelet transform and deep learning for robust denoising and detection of power quality disturbance. IET Generation Transmission & Distribution, 14(1), 140–147. https://doi.org/10.1049/iet-gtd.2019.1121 [Google Scholar] [CrossRef]
82. Upadhyaya, S., Bhende, C. N., Mohanty, S., Pati, R. (2022). Evaluation of power quality disturbance in PV-connected IEEE-14 bus system using lifting-based wavelet transform and random forest. Electrical Engineering, 104(4), 2345–2354. https://doi.org/10.1007/s00202-021-01460-w [Google Scholar] [CrossRef]
83. Zhao, W. J., Shang, L. Q., Sun, J. F. (2019). Power quality disturbance classification based on time-frequency domain multi-feature and decision tree. Protection and Control of Modern Power Systems, 4(1), 27. https://doi.org/10.1186/s41601-019-0139-z [Google Scholar] [CrossRef]
84. Li, B., Wang, Z., Han, Q. L., Liu, H. (2022). Distributed quasiconsensus control for stochastic multiagent systems under round-robin protocol and uniform quantization. IEEE Transactions on Cybernetics, 52(7), 6721–6732. https://doi.org/10.1109/TCYB.2020.3026001 [Google Scholar] [PubMed] [CrossRef]
85. Vidhya, S., Kamaraj, V. (2018). Complex neural classifiers for power quality data mining. Journal of Electrical Engineering & Technology, 13, 1714–1722. [Google Scholar]
86. Gao, C., Wang, Z., He, X., Yue, D. (2022). Sampled-data-based fault-tolerant consensus control for multi-agent systems: A data privacy preserving scheme. Automatica, 133(6), 109847. https://doi.org/10.1016/j.automatica.2021.109847 [Google Scholar] [CrossRef]
87. Mishra, S., Bhende, C. N., Panigrahi, B. K. (2008). Detection and classification of power quality disturbances using S-transform and probabilistic neural network. IEEE Transactions on Power Delivery, 23(1), 280–287. https://doi.org/10.1109/TPWRD.2007.911125 [Google Scholar] [CrossRef]
88. Wang, R. M., Wang, H. Y., Wang, L. Y. (2019). Feature selection of complex power quality disturbances and parameter optimization of random forest. 4th International Conference on Intelligent Green Building and Smart Grid (IGBSG), pp. 384–387. Hubei, China. [Google Scholar]
89. Zhong, T., Zhang, S., Cai, G., Li, Y., Yang, B. et al. (2019). Power quality disturbance recognition based on multiresolution S-transform and decision tree. IEEE Access, 7, 88380–88392. https://doi.org/10.1109/ACCESS.2019.2924918 [Google Scholar] [CrossRef]
90. Huang, N. T., Lu, G. B., Cai, G. W., Xu, D. G., Xu, J. F. et al. (2016). Feature selection of power quality disturbance signals with an entropy-importance-based random forest. Entropy, 18(2), 44. https://doi.org/10.3390/e18020044 [Google Scholar] [CrossRef]
91. Tang, Q., Qiu, W., Zhou, Y. (2020). Classification of complex power quality disturbances using optimized S-transform and kernel SVM. IEEE Transactions on Industrial Electronics, 67(11), 9715–9723. https://doi.org/10.1109/TIE.2019.2952823 [Google Scholar] [CrossRef]
92. Reddy, M. V., Sodhi, R. (2018). A modified S-transform and random forests-based power quality assessment framework. IEEE Transactions on Instrumentation and Measurement, 67(1), 78–89. https://doi.org/10.1109/TIM.2017.2761239 [Google Scholar] [CrossRef]
93. Huang, N., Peng, H., Cai, G., Chen, J. (2016). Power quality disturbances feature selection and recognition using optimal multi-resolution fast S-transform and CART algorithm. Energies, 9(11), 927. https://doi.org/10.3390/en9110927 [Google Scholar] [CrossRef]
94. Jena, M. K., Samantaray, S. R., Panigrahi, B. K. (2017). Variational mode decomposition-based power system disturbance assessment to enhance WA situational awareness and post-mortem analysis. IET Generation Transmission & Distribution, 11(13), 3287–3298. https://doi.org/10.1049/iet-gtd.2016.1827 [Google Scholar] [CrossRef]
95. Aneesh, C., Kumar, S., Hisham, P. M., Soman, K. P. (2014). Performance comparison of variational mode decomposition over empirical wavelet transform for the classification of power quality disturbances using support vector machine. International Conference on Information and Communication Technologies (ICICT), vol. 46, pp. 372–380. Kochi, India. [Google Scholar]
96. Viswanath, A., Jose, J. K., Krishnan, N., Kumar, S. S., Soman, K. P. (2014). Spike detection of disturbed power signal using VMD. International Conference on Information and Communication Technologies (ICICT), vol. 46, pp. 1087–1094. Kochi, India. [Google Scholar]
97. Aneesh, C., Hisham, P. M., Kumar, S. S., Maya, P., Soman, K. P. (2015). Variance based offline power disturbance signal classification using support vector machine and random kitchen sink. Smart Grid Technologies (ICSGT), 21, 163–170. https://doi.org/10.1016/j.protcy.2015.10.084 [Google Scholar] [CrossRef]
98. Xu, Y., Gao, Y., Li, Z., Lu, M. (2020). Detection and classification of power quality disturbances in distribution networks based on VMD and DFA. CSEE Journal of Power and Energy Systems, 6, 122–130. [Google Scholar]
99. Chakravorti, T., Dash, P. K. (2018). Multiclass power quality events classification using variational mode decomposition with fast reduced kernel extreme learning machine-based feature selection. IET Science Measurement & Technology, 12(1), 106–117. https://doi.org/10.1049/iet-smt.2017.0123 [Google Scholar] [CrossRef]
100. Fu, L., Zhu, T., Pan, G., Chen, S., Zhong, Q. et al. (2019). Power quality disturbance recognition using VMD-based feature extraction and heuristic feature selection. Applied Sciences, 9(22), 4901. https://doi.org/10.3390/app9224901 [Google Scholar] [CrossRef]
101. Cortes-Robles, O., Barocio, E., Obushevs, A., Korba, P., Sevilla, F. R. S. (2021). Fast-training feed-forward neural network for multi-scale power quality monitoring in power systems with distributed generation sources. Measurement, 170(6), 108690. https://doi.org/10.1016/j.measurement.2020.108690 [Google Scholar] [CrossRef]
102. Zhao, C., Li, K., Li, Y., Wang, L., Luo, Y. et al. (2019). Novel method based on variational mode decomposition and a random discriminative projection extreme learning machine for multiple power quality disturbance recognition. IEEE Transactions on Industrial Informatics, 15(5), 2915–2926. https://doi.org/10.1109/TII.2018.2871253 [Google Scholar] [CrossRef]
103. Sahani, M., Dash, P. K. (2018). Variational mode decomposition and weighted online sequential extreme learning machine for power quality event patterns recognition. Neurocomputing, 310(9), 10–27. https://doi.org/10.1016/j.neucom.2018.03.056 [Google Scholar] [CrossRef]
104. Luo, D., Wu, T., Li, M., Yi, B., Zuo, H. (2020). Application of VMD and Hilbert transform algorithms on detection of the ripple components of the DC signal. Energies, 13(4), 935. https://doi.org/10.3390/en13040935 [Google Scholar] [CrossRef]
105. Chakravorti, T., Satyanarayana, P. (2019). Classification of power quality disturbances using adaptive variational mode decomposition based random vector functional link network. 2019 IEEE Region 10 Symposium (TENSYMP), pp. 721–726. Kolkata, India. [Google Scholar]
106. Sahani, M., Dash, P. K. (2021). FPGA-based deep convolutional neural network of process adaptive VMD data with online sequential RVFLN for power quality events recognition. IEEE Transactions on Power Electronics, 36(4), 4006–4015. https://doi.org/10.1109/TPEL.2020.3023770 [Google Scholar] [CrossRef]
107. Chen, Z. M., Li, M. S., Ji, T. Y., Wu, Q. H. (2015). Power quality disturbance identification using morphological pattern spectrum and probabilistic neural network. IEEE Power & Energy Society General Meeting, pp. 1–5. Denver, CO, USA. https://doi.org/10.1109/PESGM.2015.7285920 [Google Scholar] [CrossRef]
108. Shen, Y., Abubakar, M., Liu, H., Hussain, F. (2019). Power quality disturbance monitoring and classification based on improved pca and convolution neural network for wind-grid distribution systems. Energies, 12(7), 1280. https://doi.org/10.3390/en12071280 [Google Scholar] [CrossRef]
109. Zhang, L., Zeng, P. P., Ma, J., Wu, J. H. (2015). Classification of power-quality disturbances using PSO-MP and parametric dictionaries. International Conference on Intelligent Computing and Internet of Things, pp. 21–25. Harbin, China. [Google Scholar]
110. Aggarwal, A., Das, N., Arora, M., Tripathi, M. M., IEEE. (2019). A novel hybrid architecture for classification of power quality disturbances. 6th International Conference on Control, Decision and Information Technologies (CoDIT), pp. 1829–1834. Paris, France. [Google Scholar]
111. Ahmed, E. M., Ahmed, M. A., Ali, Z. M., Khan, I. (2022). Disturbance evaluation in power system based on machine learning. Computers, Materials & Continua, 71(1), 231–254. https://doi.org/10.32604/cmc.2022.022005 [Google Scholar] [CrossRef]
112. Yang, D., Wang, B., Cai, G. (2017). Adaptive local iterative filter decomposition for analysis of non-stationary waveforms in power quality. International Transactions on Electrical Energy Systems, 27(12), 2426. https://doi.org/10.1002/etep.2426 [Google Scholar] [CrossRef]
113. Sahani, M., Dash, P. K. (2019). FPGA-based online power quality disturbances monitoring using reduced-sample HHT and class-specific weighted RVFLN. IEEE Transactions on Industrial Informatics, 15(8), 4614–4623. https://doi.org/10.1109/TII.2019.2892873 [Google Scholar] [CrossRef]
114. Chen, L., Xu, J., Chen, S., Yang, H., Liu, L. (2021). Power quality disturbance signal denoising based on overcomplete representation. IEEJ Transactions on Electrical and Electronic Engineering, 17(4), 544–555. https://doi.org/10.1002/tee.23453 [Google Scholar] [CrossRef]
115. Yu, Y., Zhao, W., Li, S., Huang, S. (2021). A two-stage wavelet decomposition method for instantaneous power quality indices estimation considering interharmonics and transient disturbances. IEEE Transactions on Instrumentation and Measurement, 70, 1–13. https://doi.org/10.1109/TIM.2021.3052554 [Google Scholar] [CrossRef]
116. Chao, D., Chakraborty, P., Nishikawa, T., Motter, A. E. (2021). Hierarchical power flow control in smart grids: Enhancing rotor angle and frequency stability with demand-side flexibility. IEEE Transactions on Control of Network Systems, 8(3), 1046–1058. https://doi.org/10.1109/TCNS.2021.3070665 [Google Scholar] [CrossRef]
117. Korukonda, M. P. (2022). Modeling and control of smart standalone microgrids within cyber physical system frameworks. arXiv:2203.00970. [Google Scholar]
118. Wang, J. D., Xu, Z. L., Che, Y. B. (2019). Power quality disturbance classification based on DWT and multilayer perceptron extreme learning machine. Applied Sciences, 9(11), 2315. https://doi.org/10.3390/app9112315 [Google Scholar] [CrossRef]
119. Biswal, B., Dash, P. K., Panigrahi, B. K. (2009). Power quality disturbance classification using fuzzy C-means algorithm and adaptive particle swarm optimization. IEEE Transactions on Industrial Electronics, 56(1), 212–220. https://doi.org/10.1109/TIE.2008.928111 [Google Scholar] [CrossRef]
120. Lee, C. Y., Shen, Y. X. (2011). Optimal feature selection for power-quality disturbances classification. IEEE Transactions on Power Delivery, 26(4), 2342–2351. https://doi.org/10.1109/TPWRD.2011.2149547 [Google Scholar] [CrossRef]
121. Das, D., Chakravorti, T., Dash, P. K. (2017). Hilbert huang transform with fuzzy rules for feature selection and classification of power quality disturbances. 4th IEEE-Uttar-Pradesh-Section International Conference on Electrical, Computer and Electronics (UPCON), pp. 439–445. Mathura, India. [Google Scholar]
122. Cai, K., Hu, T., Cao, W., Li, G. (2019). Classifying power quality disturbances based on phase space reconstruction and a convolutional neural network. Applied Sciences, 9(18), 3681. https://doi.org/10.3390/app9183681 [Google Scholar] [CrossRef]
123. Abdoos, A. A., Mianaei, P. K., Ghadikolaei, M. R. (2016). Combined VMD-SVM based feature selection method for classification of power quality events. Applied Soft Computing, 38, 637–646. https://doi.org/10.1016/j.asoc.2015.10.038 [Google Scholar] [CrossRef]
124. He, Z., Zhang, H., Zhao, J., Qian, Q. (2012). Classification of power quality disturbances using quantum neural network and DS evidence fusion. European Transactions on Electrical Power, 22(4), 533–547. https://doi.org/10.1002/etep.584 [Google Scholar] [CrossRef]
125. Lee, J. B., Park, J. H., Lee, S. H., Kim, H. D., Chung, H. S. (2006). Prediction of crack growth in steam generator tubes using Monte Carlo simulation. Computer Modeling in Engineering & Sciences, 11(1), 9–16. https://doi.org/10.3970/cmes.2006.011.009 [Google Scholar] [CrossRef]
126. Kipouros, T., Jaeggi, D. M., Dawes, W. N., Parks, G. T., Savill, A. M. et al. (2008). Insight into high-quality aerodynamic design spaces through multi-objective optimization. Computer Modeling in Engineering & Sciences, 37(1), 1–44. https://doi.org/10.3970/cmes.2008.037.001 [Google Scholar] [CrossRef]
127. Karasu, S., Sarac, Z. (2019). Investigation of power quality disturbances by using 2D discrete orthonormal S-transform, machine learning and multi-objective evolutionary algorithms. Swarm and Evolutionary Computation, 44(8), 1060–1072. https://doi.org/10.1016/j.swevo.2018.11.002 [Google Scholar] [CrossRef]
128. Pradhan, A. K., Routray, A., Behera, A. (2006). Power quality disturbance classification employing modular wavelet network. General Meeting of the Power-Engineering-Society, Montreal, QC, Canada. [Google Scholar]
129. Yadav, S. P., Yadav, S. (2020). Fusion of medical images in wavelet domain: A hybrid implementation. Computer Modeling in Engineering & Sciences, 122(1), 303–321. https://doi.org/10.32604/cmes.2020.08459 [Google Scholar] [CrossRef]
130. Wang, X., Deng, X., Shen, H., Zhang, G., Zhang, S. (2021). Speech intelligibility enhancement algorithm based on multi-resolution power-normalized cepstral coefficients (MRPNCC) for digital hearing aids. Computer Modeling in Engineering & Sciences, 126(2), 693–710. https://doi.org/10.32604/cmes.2021.013186 [Google Scholar] [CrossRef]
131. Kim, S. D., Morcos, M. M. (2004). An improved method for classifying power quality disturbances. Electric Power Components and Systems, 32(4), 407–420. https://doi.org/10.1080/15325000490217443 [Google Scholar] [CrossRef]
132. Kavitha, D., Renuga, P., Lakshmi, M. S. (2015). Detection of power quality disturbances based on adaptive neural net and shannon entropy method. In: Artificial intelligence and evolutionary algorithms in engineering systems, pp. 737–745. India, Springer. [Google Scholar]
133. Kiruthiga, B., Banu, R. N., Devaraj, D. (2019). Detection and classification of power quality disturbances or events by adaptive NFS classifier. Soft Computing, 24(2), 1–12. [Google Scholar]
134. Gonzalez-Abreu, A. D., Delgado-Prieto, M., Osornio-Rios, R. A., Saucedo-Dorantes, J. J., Romero-Troncoso, R. (2021). A novel deep learning-based diagnosis method applied to power quality disturbances. Energies, 14(10), 2839. https://doi.org/10.3390/en14102839 [Google Scholar] [CrossRef]
135. Qaisar, S. M., Alyamani, N., Waqar, A., Krichen, M. (2022). Machine learning with adaptive rate processing for power quality disturbances identification. SN Computer Science, 3(1), 1–6. [Google Scholar]
136. Subudhi, U., Dash, S. (2021). Detection and classification of power quality disturbances using GWO ELM. Journal of Industrial Information Integration, 22(5), 100204. https://doi.org/10.1016/j.jii.2021.100204 [Google Scholar] [CrossRef]
137. Yan, L., Hong, W. C. (2021). Evaluation and forecasting of wind energy investment risk along the belt and road based on a novel hybrid intelligent model. Computer Modeling in Engineering & Sciences, 128(3), 1069–1102. https://doi.org/10.32604/cmes.2021.016499 [Google Scholar] [CrossRef]
138. Zaka, A., Akhter, A. S., Jabeen, R., Sanaullah, A. (2021). Control charts for the shape parameter of power function distribution under different classical estimators. Computer Modeling in Engineering & Sciences, 127(3), 1201–1223. https://doi.org/10.32604/cmes.2021.014477 [Google Scholar] [CrossRef]
139. O'Donovan, C., Giannetti, C., Todeschini, G. (2021). A novel deep learning power quality disturbance classification method using autoencoders. 13th International Conference on Agents and Artificial Intelligence (ICAART), pp. 373–380. Vienna, Austria. [Google Scholar]
140. Hussain, M., Memon, T. D., Hussain, I., Memon, Z. A., Kumar, D. (2022). Fault detection and identification using deep learning algorithms in induction motors. Computer Modeling in Engineering & Sciences, 132(2), 435–470. https://doi.org/10.32604/cmes.2022.020583 [Google Scholar] [CrossRef]
141. Jiang, Z., Li, S., Ma, X., Li, X., Kang, Y. et al. (2022). State estimation of regional power systems with source-load two-terminal uncertainties. Computer Modeling in Engineering & Sciences, 132(1), 295–317. https://doi.org/10.32604/cmes.2022.019996 [Google Scholar] [CrossRef]
142. Liu, H., Hussain, F., Shen, Y., Arif, S., Nazir, A. et al. (2018). Complex power quality disturbances classification via curvelet transform and deep learning. Electric Power Systems Research, 163(6), 1–9. https://doi.org/10.1016/j.epsr.2018.05.018 [Google Scholar] [CrossRef]
143. Soma, S. S., Olalekan, S. A. (2021). Analysis and improvement of reliability in a radial power distribution system using smart reclosers. Journal of Electrical and Electronics Engineering, 14(1), 68–73. [Google Scholar]
144. Gu, I. Y. H., Styvaktakis, E. (2003). Bridge the gap: Signal processing for power quality applications. Electric Power Systems Research, 66(1), 83–96. https://doi.org/10.1016/S0378-7796(03)00074-9 [Google Scholar] [CrossRef]
145. Moravej, Z., Pazoki, M., Niasati, M., Abdoos, A. A. (2013). A hybrid intelligence approach for power quality disturbances detection and classification. International Transactions on Electrical Energy Systems, 23(7), 914–929. https://doi.org/10.1002/etep.1628 [Google Scholar] [CrossRef]
146. Ranjbar, S., Farsa, A. R., Jamali, S. (2020). Voltage-based protection of microgrids using decision tree algorithms. International Transactions on Electrical Energy Systems, 30(4), 12274. https://doi.org/10.1002/2050-7038.12274 [Google Scholar] [CrossRef]
147. Lin, L., Wang, D., Zhao, S. Y., Chen, L. L., Huang, N. T. (2019). Power quality disturbance feature selection and pattern recognition based on image enhancement techniques. IEEE Access, 7, 67889–67904. https://doi.org/10.1109/ACCESS.2019.2917886 [Google Scholar] [CrossRef]
148. Lin, Q., Gong, Y., Shi, Y., Feng, C., Zhang, Y. (2022). A fault risk warning method of integrated energy systems based on relief-soft max algorithm. Computer Modeling in Engineering & Sciences, 132(3), 929–944. https://doi.org/10.32604/cmes.2022.020752 [Google Scholar] [CrossRef]
149. Meng, D., Wang, H., Yang, S., Lv, Z., Hu, Z. et al. (2022). Fault analysis of wind power rolling bearing based on emd feature extraction. Computer Modeling in Engineering & Sciences, 130(1), 543–558. https://doi.org/10.32604/cmes.2022.018123 [Google Scholar] [CrossRef]
150. Huang, N., Wang, D., Lin, L., Cai, G., Huang, G. et al. (2019). Power quality disturbances classification using rotation forest and multi-resolution fast S-transform with data compression in time domain. IET Generation Transmission & Distribution, 13(22), 5091–5101. https://doi.org/10.1049/iet-gtd.2018.5439 [Google Scholar] [CrossRef]
151. Achlerkar, P. D., Samantaray, S. R., Manikandan, M. S. (2018). Variational mode decomposition and decision tree based detection and classification of power quality disturbances in grid-connected distributed generation system. IEEE Transactions on Smart Grid, 9(4), 3122–3132. https://doi.org/10.1109/TSG.2016.2626469 [Google Scholar] [CrossRef]
152. Pan, C., Tan, J., Feng, D. (2018). Identification of power quality disturbance sources using gradient boosting decision tree. Chinese Automation Congress (CAC), pp. 2589–2592. https://doi.org/10.1109/CAC.2018.8623162 [Google Scholar] [CrossRef]
153. Li, Z., Wu, W. (2007). Phase space reconstruction based classification of power disturbances using support vector machines. Pacific-Asia Conference on Knowledge Discovery and Data Mining, vol. 4426, pp. 680–686. Nanjing, China. https://doi.org/10.1007/978-3-540-71701-0 [Google Scholar] [CrossRef]
154. Ozgonenel, O., Yalcin, T., Guney, I., Kurt, U. (2013). A new classification for power quality events in distribution systems. Electric Power Systems Research, 95(4), 192–199. https://doi.org/10.1016/j.epsr.2012.09.007 [Google Scholar] [CrossRef]
155. Hemapriya, C. K., Suganyadevi, M. V., Krishnakumar, C. (2020). Detection and classification of multi-complex power quality events in a smart grid using hilbert-huang transform and support vector machine. Electrical Engineering, 102(3), 1681–1706. https://doi.org/10.1007/s00202-020-00987-8 [Google Scholar] [CrossRef]
156. Cortes-Robles, O., Barocio, E., Segundo, J., Guillen, D., Olivares-Galvan, J. C. (2020). A qualitative-quantitative hybrid approach for power quality disturbance monitoring on microgrid systems. Measurement, 154(1), 107453. https://doi.org/10.1016/j.measurement.2019.107453 [Google Scholar] [CrossRef]
157. Ferede, A. T., Olalekan, S. A., Abel, H. E., Ayalew, A. Y. (2020). Power loss mitigation and voltage profile improvement with distributed generation using grid-based multi-objective harmony search algorithm. Journal of Electrical and Electronics Engineering, 13(2), 5–10. [Google Scholar]
158. Xu, D. D., Shao, H. J., Deng, X., Wang, X. (2022). The hidden-layers topology analysis of deep learning models in survey for forecasting and generation of the wind power and photovoltaic energy. Computer Modeling in Engineering & Sciences, 131(2), 567–597. https://doi.org/10.32604/cmes.2022.019245 [Google Scholar] [CrossRef]
159. Xu, W., Ren, D. D., Yi, B. Y., Zhen, H. Q., Zhang, Y. B. et al. (2022). Optimal scheduling for flexible regional integrated energy system with soft open point. Computer Modeling in Engineering & Sciences, 131(2), 1101–1123. https://doi.org/10.32604/cmes.2022.019564 [Google Scholar] [CrossRef]
160. Jose, S. E., Singh, R. L. R., Rajagopal, R. (2020). Automatic and real time classification of power quality disturbance using statistical moments. 3rd International Conference on Material Science, SMART Structures and Applications (ICMSS), Tamil Nadu, India. [Google Scholar]
161. Li, B., Jing, Y., Xu, W. (2017). A generic waveform abnormality detection method for utility equipment condition monitoring. IEEE Transactions on Power Delivery, 32(1), 162–171. https://doi.org/10.1109/TPWRD.2016.2580663 [Google Scholar] [CrossRef]
162. Darien Gonzalez-Abreu, A., Jose Saucedo-Dorantes, J., Alfredo Osomio-Rios, R., Romero-Troncoso, R. J., Delgado-Prieto, M. et al. (2019). Condition monitoring approach based on dimensionality reduction techniques for detecting power quality disturbances in cogeneration systems. 24th IEEE International Conference on Emerging Technologies and Factory Automation (ETFA), pp. 898–903. Zaragoza, Spain. [Google Scholar]
163. Elango, M. K., Kumar, A. N., Purushothaman, S. (2010). Application of hilbert huang transform with locally weighted projection regression method-for power quality problems. International Review of Electrical Engineering, 5, 2405–2412. [Google Scholar]
164. Qiu, W., Tang, Q., Liu, J., Teng, Z., Yao, W. (2019). Power quality disturbances recognition using modified s transform and parallel stack sparse auto-encoder. Electric Power Systems Research, 174(9), 105876. https://doi.org/10.1016/j.epsr.2019.105876 [Google Scholar] [CrossRef]
165. Elbouchikhi, E., Zia, M. F., Benbouzid, M., El Hani, S. (2021). Overview of signal processing and machine learning for smart grid condition monitoring. Electronics, 10(21), 2725. https://doi.org/10.3390/electronics10212725 [Google Scholar] [CrossRef]
166. Martinez, R., Castro, P., Arroyo, A., Manana, M., Galan, N. et al. (2022). Techniques to locate the origin of power quality disturbances in a power system: A review. Sustainability, 14(12), 7428. https://doi.org/10.3390/su14127428 [Google Scholar] [CrossRef]
167. Ravi, T., Kannaiah, S. K. (2022). Analysis, monitoring and mitigation of power quality disturbances in distributed generation system: A review. Frontiers in Energy Research, 10, 1395. https://doi.org/10.3389/fenrg.2022.989474 [Google Scholar] [CrossRef]
168. Li, W., Niu, Y., Cao, Z. (2022). Event-triggered sliding mode control for multi-agent systems subject to channel fading. International Journal of Systems Science, 53(6), 1233–1244. https://doi.org/10.1080/00207721.2021.1995527 [Google Scholar] [CrossRef]
169. Qu, F., Zhao, X., Wang, X., Tian, E. (2022). Probabilistic-constrained distributed fusion filtering for a class of time-varying systems over sensor networks: A torus-event-triggering mechanism. International Journal of Systems Science, 53(6), 1288–1297. https://doi.org/10.1080/00207721.2021.1998721 [Google Scholar] [CrossRef]
170. Li, X., Song, Q., Zhao, Z., Liu, Y., Alsaadi, F. E. (2022). Optimal control and zero-sum differential game for Hurwicz model considering singular systems with multifactor and uncertainty. International Journal of Systems Science, 53(7), 1416–1435. [Google Scholar]
171. Yu, L., Cui, Y., Liu, Y., Alotaibi, N. D., Alsaadi, F. E. (2022). Sampled-based consensus of multi-agent systems with bounded distributed time-delays and dynamic quantisation effects. International Journal of Systems Science, 53(11), 2390–2406. [Google Scholar]
172. Yu, H., Hu, J., Song, B., Liu, H., Yi, X. (2022). Resilient energy-to-peak filtering for linear parameter-varying systems under random access protocol. International Journal of Systems Science, 53(11), 2421–2436. [Google Scholar]
173. Bao, G., Ma, L., Yi, X. (2022). Recent advances on cooperative control of heterogeneous multi-agent systems subject to constraints: A survey. Systems Science & Control Engineering, 10(1), 539–5513. [Google Scholar]
Tao, H., Tan, H., Chen, Q., Liu, H., Hu, J. (2022). H∞ state estimation for memristive neural networks with randomly occurring DoS attacks. Systems Science & Control Engineering, 10(1), 154–165. [Google Scholar]
175. Xu, J., Sheng, L., Gao, M. (2021). Fault estimation for nonlinear systems with sensor gain degradation and stochastic protocol based on strong tracking filtering. Systems Science & Control Engineering, 9(2), 60–70. https://doi.org/10.1080/21642583.2020.1833789 [Google Scholar] [CrossRef]
Cite This Article
 Copyright © 2023 The Author(s). Published by Tech Science Press.
This work is licensed under a Creative Commons Attribution 4.0 International License , which permits unrestricted use, distribution, and reproduction in any medium, provided the original work is properly cited.
 Downloads
 Citation Tools