
 Submit a Paper
 Propose a Special lssue
 Open Access
REVIEW
Research Progress of Reverse Monte Carlo and Its Application in Josephson Junction Barrier Layer
State Key Laboratory of Mathematical Engineering and Advanced Computing, Zhengzhou, 450001, China
* Corresponding Author: Junling Qiu. Email:
Computer Modeling in Engineering & Sciences 2023, 137(3), 2077-2109. https://doi.org/10.32604/cmes.2023.027353
Received 26 October 2022; Accepted 10 March 2023; Issue published 03 August 2023
 View Full Text
 Download PDF
Abstract
As indispensable components of superconducting circuit-based quantum computers, Josephson junctions determine how well superconducting qubits perform. Reverse Monte Carlo (RMC) can be used to recreate Josephson junction’s atomic structure based on experimental data, and the impact of the structure on junctions’ properties can be investigated by combining different analysis techniques. In order to build a physical model of the atomic structure and then analyze the factors that affect its performance, this paper briefly reviews the development and evolution of the RMC algorithm. It also summarizes the modeling process and structural feature analysis of the Josephson junction in combination with different feature extraction techniques for electrical characterization devices. Additionally, the obstacles and potential directions of Josephson junction modeling, which serves as the theoretical foundation for the production of superconducting quantum devices at the atomic level, are discussed.Keywords
Quantum computing can outperform classical computing by using entangled quantum states as the information carrier and achieve tremendous parallel power with quantum linear superposition for some types of problems. The superconducting quantum computer is considered one of the most advanced quantum computing schemes at present, which has been rapidly developed in both experiments and simulation. As one of the critical devices, the preparation of the Josephson junction has always been a research focus, but the development of the Josephson junction is limited [1–6] due to the major impact of its technological conditions and microstructure on its performance.
Currently, Al-based Josephson junctions exhibit to be one of the highest performance and best development among Josephson junctions for quantum devices [7]. However, the junction's efficiency falls short of expectations, as the critical current is not uniform, necessitating a deeper comprehension and control of atomic structure [7]. The performance of the qubits for Josephson junction is greatly influenced by the process conditions [3,8–10], bridge-ways [2,11], barrier layer defects [12,13], etc., particularly the effects of the local structure (such as the interface layer). The precise driving forces and mechanisms of influence are still unknown.
RMC is a general modeling technique that creates a structural model of disordered systems using experimental data, typically diffraction data. The discrepancy between the estimated diffraction pattern and the empirically measured pattern is reduced by repeatedly modifying the model setup. Reproducing atomic structure models that are in line with the data is the goal. The additional examination of the structure model, when combined with other contemporary characterization techniques, aids in the prediction and direction of the Josephson junction process. RMC can also be used to confirm whether a new approach can create a Josephson junction with an optimal microstructure [14,15]. It is friendly to single-crystal materials, polycrystalline materials, and disordered materials, notably those with structures like amorphous alumina, and it does not require crystallographic information [16,17]. Using RMC to build the barrier layer model or even the entire junction model, explore the atomic structure, and analyze the effect of process conditions and other defects on the junction region is vital and advantageous.
In this paper, the structural properties of the Josephson junction barrier layer are reviewed using simulation-based characterization techniques, and the underlying causes are examined. The second section describes how the RMC method has evolved recently and lists the benefits and drawbacks of applying RMC to modeling. The third section primarily covers the extraction of material structure information by various characterization devices, starting from experimental data pertinent to RMC. After the model building is complete, the fourth component shows the micro-analysis of the structure based on the analysis data and identifies its macro characteristics. The fifth part reviews the barrier layer research conducted using RMC modeling and concludes that the dearth of research is connected to the inaccuracy of characterization equipment and incomplete data collection. Meanwhile, the improvement of the RMC method is also prospected, and the research of other modeling software applied to oxide barrier layers is also compared. Finally, the challenges and prospects of the Josephson junction simulation are presented.
2 Developments of RMC Modeling Algorithm
The key to understanding the properties of a material is to determine its structure. It is difficult to decide on atomic-scale structures from experimental data, especially for amorphous materials lacking long-range order. The backward learning method is often called the “inversion problem” [18]. Modeling methods commonly used require constraints of interatomic potential, such as Monte Carlo (MC) and Molecular Dynamics (MD), etc. Although the fitting effect of experimental data is well, the structure simulation is qualitative. RMC provides algorithms that rely on experimental data to adjust models to analyze more detailed structural features that experimental data cannot explore. By moving the atomic coordinates randomly many times, the error between the model and the experimental data is shortened, and finally, the model is consistent with the experimental data. Due to the simple basic idea of its algorithm, low requirements in the initial model, fewer constraints than other modeling methods (such as MD), more structural information in the later stage of modeling, etc., RMC has been widely studied and applied [19].
The RMC algorithm is a variation of the standard Metropolis Monte Carlo (MMC) method [14,15]. The purpose is to construct a model that is self-consistent with the experimental data within its error range under certain constraints. The error is statistical and conforms to a certain normal distribution [15]. The specific algorithm flow is shown in Fig. 1:

Figure 1: RMC algorithm flow chart
1) To build the initial configuration. N atoms are placed in periodic cells. It is important to note that the density of atoms is set as close to the experimental value as possible. For the initial model, the atomic positions can be arbitrary. Both regular and random are allowed.
2) From the initial configuration, the difference
where
Here, m is the experimental points, σ is the experimental error term and
3) Randomly move atoms within the set maximum moving distance. Suppose the distance between any two atoms is less than the cutoff distance after moving. In that case, the operation is rejected and the algorithm automatically selects a new atom to start new moves until the position is within the constraints. Execute Step 2 in a loop, and calculate the difference between the new and old total structure factor, according to Eq. (1).
4) Use Eq. (1) to calculate
5) If the accuracy of the comparison and difference value is less than the preset value or reaches the preset time, the process ends; otherwise, go to Step 3 [14]. The process ends when the minimum error value is stable or time is up.
2.2 Minimization Energy Model Algorithm
For disordered materials like liquids and glass, RMC produces a structural model (i.e., a group of atoms) that corresponds to all structural factors that fall within its error bounds. In Fig. 1, the algorithm flow is depicted. The program terminates after the error oscillates around its equilibrium value for the predetermined amount of time and the algorithm successfully normalizes the structure factors. The normalization of any experimental data might take the place of the algorithm’s normalization of the structural factor when additional experimental restrictions are applied. For instance, the error calculation formula becomes [21] when neutron diffraction (ND) data is included:
where
Here,
Although the RMC method is straightforward, this random movement produces a configuration with maximum entropy. The model produces maximum disorder under constraints that may bring about defective structures when the system finally reaches consistency, such as breaking chemical bonds, twisting polyhedra, displacement of cations or atoms, etc. To address these problems, various programs have been developed, such as Reverse Monte Carlo Algorithm (RMCA) [22] and RMCProfile [23].
Many studies have focused on the three-dimensional structural model of liquid and glass. However, due to the significant impact of multiple scattering on crystal materials [24,25], the calculation cost in crystal modeling is very high. On this basis, much research has improved RMC algorithm. RMCProfile is a free open source code sponsored by Oak Ridge National Laboratory. It is built from McGreevy & Pusztai’s original RMCA code. The purpose is to determine the local structure of crystal materials, analyze disordered systems, reduce computational cost and eliminate defects such as the inability to maximize the use of Bragg diffraction information. At the same time, RMCProfile added constraints such as polyhedron constraints, distance window constraints, magnetic structure factors, lattice point disorder, and especially lattice point constraints. The initial stochastic model is guaranteed by minimizing the energy of the system to ensure the correctness of the model. To integrate the contour fitting of Bragg diffraction mode, the diffraction data is simplified as the correction function of the flight time Iexp(t), where t is the neutron flight time [23].
where
Here, F(hkl) is the structure factor of the equation, and N is the number of atoms.
When Mcgreevy et al. [14] compared the structural factor of liquid argon with the curve produced by RMC through experiments, they were able to demonstrate the accuracy of their approach. Since then, numerous extended RMC methods have been developed, and RMC has been widely utilized to model the atomic structure of liquid [26–29] and glass [19,30–36]. To increase the speed, Tóth et al. [37] added the perspective of numerical calculation to the discretized RMC’s convergent process for the Born-Green-Yvon problem. To create a silicon glass model that is closer in line with physical reality, Keen [38] changed the concurrent conditions and imposed limitations. For the first time, Tucker et al. [39] reported the RMC’s instantaneous atomic configuration and examined the long- and short-range structures of quartz in a displacement phase transition. In order to compute the conductivity of silver-based superionic glass using a straightforward random walk, Swenson et al. [40] incorporated bond valence limitations. To get over the fluid limitation of adsorption in microporous materials, Sánchez-Gil et al. [41] changed the structure factor method in accordance with the structural properties of zeolite and investigated the adsorption of Ar on siliceous zeolite and siliceous pumice. Pethes et al. [42]’s RMC modeling investigation of water and watery compounds used simple point charge inter-atomic potential energy. Eremenko et al. [43] used the open multi-process computing application interface to implement the parallel computation of RMCProfile while simultaneously changing the technique for computing some difficult data, such as suggesting the parallel chain RMC technique and exploiting the overlap of diffraction peaks to cut down on computation. Contrarily, the gathered instrument resolution effect was properly and effectively rectified to ensure that the model under the limited amount of data was closer to the actual structure [43].
The RMC++ software advances moving the unit based on a set of the rigid atomic or molecular algorithm [44] to account for moving particles that easily break the physical structure itself because the classical RMC takes longer to calculate the distance between the atoms. On the whole, RMC++ software is two times faster than RMCA. RMC++ improves the calculation speed and portability to a certain extent while increasing experiments and constraints, such as X-ray absorption fine structure (XAFS), coordination number, bond angle and other constraints.
With the development of high-performance computing, parallel algorithms are considered in RMC modeling. RMC_POT merges RMC++_NEW and RMC++ _MULTI data format and realizes parallelization through a portable system operation interface, which allows the application of non-bonded inter-atomic potential energy, including intra-molecular bond stretching, angular bending and dihedral stretching potential functions. This algorithm is suitable for large molecular structures, such as molecules with more than 100 atoms [45]. In the structural model, particle distribution simulated by MD is preferentially applied as the initial configuration, the different judgment of potential energy changes before and after moving atoms is added to explore the disorderly system of molecules with arbitrary complexity [26,46].
RMCPOW can directly simulate the structure of powder crystal and magnetic disorder materials, calculate various structural factors, and characterize different crystal structures, such as time-average or instantaneous lattice structures, by different parameters. The time-averaged crystal structure is described by parameters such as lattice vector, the total average position of atoms in the unit cell, and heat factor, while the instantaneous crystal lattice structure is characterized by the super-cell [25].
Based on the minimization energy model as well, some hybrid algorithms are developed to solve the inherent problems of RMC, such as the hybrid reverse monte carlo (HRMC) method with bond angle constraints and the relaxation brought by non-RMC method after alternate RMC modeling with bond angle constraints iteratively executes until the minimum of user-defined potential energy or force gradient is satisfied [18]. Angle-resolved scattering data obtained by rotating Bragg peak was used for weakly disordered crystal samples. The magnetic flux line lattices of the second kind of superconductor are studied, accurately reproducing observations from small-angle neutron scattering [47]. Petersen et al. [48] proposed combining MMC and RMC to show that covalent disordered solids produce physically reasonable structures. Maldonis et al. [49] added energy constraints to provide appropriate supplements and corrections when the experimental data could not reproduce the atomic structure. Petersen et al. [50] added Boltzmann weighted energy term to the error
Here,
Different procedures and ideas have contributed to the exploration of atomic-scale structure models of materials, and the basic idea is to minimize energy to achieve system equilibrium. The minimum energy model algorithm is the basic algorithm, and various algorithms are developed based on this idea. However, we also find that each algorithm is well applied in some fields or certain materials, but its universal applicability is not high, and the calculation cost is high.
2.3 Environment-Dependent Algorithm for Potential Energy Selection
One of the most important limitations of the RMC algorithm is that it samples relatively disordered arrangements more than the ordered ones, which can lead to reduced acceptance rates and unreal structures [51], especially for materials with significant multibody correlations, such as covalently bonded solids. Tóth et al. [51] improved the classical RMC algorithm by modifying the structure factor A, adding the thermodynamic calculation of entropy to control the fitting degree of the ordered system, and adjusting the acceptance probability p in the algorithm (as shown in Fig. 1). The acceptance probability in the new method is the product of the classical probability and the entropy term:
where
Here, ρ is the number density. c1 and c2 are adjustable parameters.
This method increases the energy fluctuation and improves the fitting speed in the directional analysis of radial distribution function and structure factor. When the scale of the system becomes larger, the advantages of the original system method are no longer available. The Tóth G’s team proposed to reverse molecular dynamics (RMD), adding the calculation of the radial-dependent force of each particle [51]:
The calculation of the force of the particle j on i:
Here, ne is the number of experimental data sets, m is the number of points in an experiment, c is a constant, rij is the pair distance, xij is the x-distance between the particle i and j, and the item F is the total structure factor.
The algorithm designs a dynamic way to create a 3D model of diffraction measurements with different “compactness” to achieve a better fit [52]. Its advantages are that atoms or molecules are rarely trapped in a minimum of the local configuration, and multithreaded programming in the algorithm is easy to implement. However, its problems are similar to RMC, with high strain and unstable structure. To obtain a physically more reasonable three-dimensional atomic structure by modeling, a hybrid RMC algorithm combining RMC was developed by using MD [53] or MC during initial model construction. The atomic configurations ware generated by integrating the classical Newton equations of motion in MD, and combined with RMC to analyze the extended X-ray absorption fine structure (EXAFS) data of nanocrystalline materials. Then the structural parameters, including thermal disorder anisotropy, were obtained [54]. Ishida et al. [55] combined inter-atomic radial dependence force with the MD method to minimize the difference between experimental and simulated radial distribution functions, to reduce the difference in total energy. The rationality of the physical structure was ensured by adjusting the atom movement by the force field, and the local bonding environment was guaranteed by relevant constraints such as bond angles. The potential energy selection environment depended on the inter-atomic potential energy, and the energy term was contained in the acceptable probability of atomic movement, and the size of the weight was the key to affecting the strength of covalent bond interaction [55,56]. This method not only utilized the selection of the potential energy environment by MD&MC, but also combined the simplicity and convenience of the RMC calculation model. However, the selection of weights has become the key to the formation of the model. Hashimoto et al. [57] combined potential energy selection with RMC idea and explored new ideas of alumina glass preparation from the preparation of new materials through structural models of different phases of alumina.
Compared with classical RMC, these algorithms consider the effect of inter-atomic forces, which add more constraints to the calculation of structural factors to achieve a physically reasonable structural model and adjust the acceptance probability to promote the model convergence as fast as possible. However, calculations may take longer and require more computational power. To further improve the speed and search for more efficient and accurate model algorithms, RMC has been developed.
2.4 Machine Learning Training Algorithm
The HRMC algorithm combines RMC with additional modeling techniques and offers complementary benefits, improving the entire model's ability to somewhat more closely match experimental data. The local structure still has a few drawbacks, though. After Opletal et al. [58] proposed the HRMC, Li et al. [59] modified the algorithm and combined machine learning to investigate the absorption effect of doped amorphous carbon (aC) on various gases. The HRMC model was used for deep network learning, using a data-driven approach and predicting its adsorption capacity and selectivity. First, using the enhanced HRMC technique, a number of nitrogen-doped aC models were built. Grand canonical Monte Carlo was used to determine each structure’s capacity for the various gases after relaxation at a high temperature. Based on this model, a deep neural network was used to predict the relationship between microstructure and adsorption capacity. In order to better calculate the data, dimensionality reduction processing was carried out. In this big-data era, data collection is no longer the biggest obstacle to research, and the problems of data processing and operation efficiency are gradually becoming more important and difficult.
When the data is multi-dimensional, modeling can sometimes take a long time, even with the current abundance of computational resources and the constant iteration of parallelized algorithms. In order to shorten the time, Verdel et al. [60] combined decision trees (random forest) and RMC to propose a mixed model, and used the model to obtain the predictive model as the initial model of RMC to simplify the fitting time. Taking the structure and composition of human skin as parameters, a random forest was composed of 100 decision trees constructed from the bootstrap samples and the eigenvalue of the original data to construct a single-objective model. The learned value was used as the initial value of RMC, combining with pulsed photo thermal radiometry and diffuse reflectance spectroscopy to fit the RMC model. Compared with the original RMC algorithm, the number of iteration steps was significantly reduced, which improved the efficiency and reduced their jection rate of variance, and it had a good fitting effect. Although this study is applied to non-invasively detect the compositional analysis of human skin structure and tissue, it is also an inspiration for our study of crystalline and disordered materials.
In RMC modeling, the acceptance rate of random moving atoms has always been a restriction that hinders its modeling speed. To improve computing efficiency and build a model more in line with physical structure, Aoun et al. [61] combined the RMC algorithm with machine learning and proposed the FullRMC program, which adopts intensive machine learning and is trained according to behaviors results, data interaction and past experience. Changing the original RMC algorithm that randomly moved the coordinates of atoms into a set of atomic positions (as shown in Fig. 1), and made the moving process more intelligent and physically meaningful by customizing the group of atoms and strengthening supervised learning, while reducing repetitive movements, the accepted move probability was greatly improved, and the computational efficiency was improved. Traditional RMC took a single atom as an object, while FullRMC took a group as an object, and proposed the concept of a group selector, which is responsible for selecting a single group by indexing in each RMC step. The group selector supported random selection and smart random selection, using a reinforcement machine learning algorithm to select a more likely group through a probabilistic scheme that automatically biases and eliminates the bias selector, which effectively improves the acceptable movement. And the previously learned results were applied to subsequent selections, which plays a role in continuously improving efficiency [61]. The combination with machine learning makes up for the low-speed and inefficient trial-and-error mode of RMC. Especially, it provides a faster way to explore the structure of microscopic materials in the age of the rapid development of high-performance computers. However, this algorithm becomes more efficient when the warm-up time is exceeded. Otherwise, traditional RMC is better able to meet the model construction conditions.
The combination of RMC and machine learning is highly cited in disordered materials, rigid matter, and modeling. At the same time, similar citations are reflected in chemistry, the discovery of new materials, and biology (the red part in Fig. 2), indicating that this combination algorithm has a good application prospect in the research of new materials and existing structure modeling. Moreover, we also found that there are relatively few studies on amorphous structure modeling, which provides better application guidance for future algorithm development. It is believed that more RMC algorithms based on machine learning will be applied to the research of disordered structures.
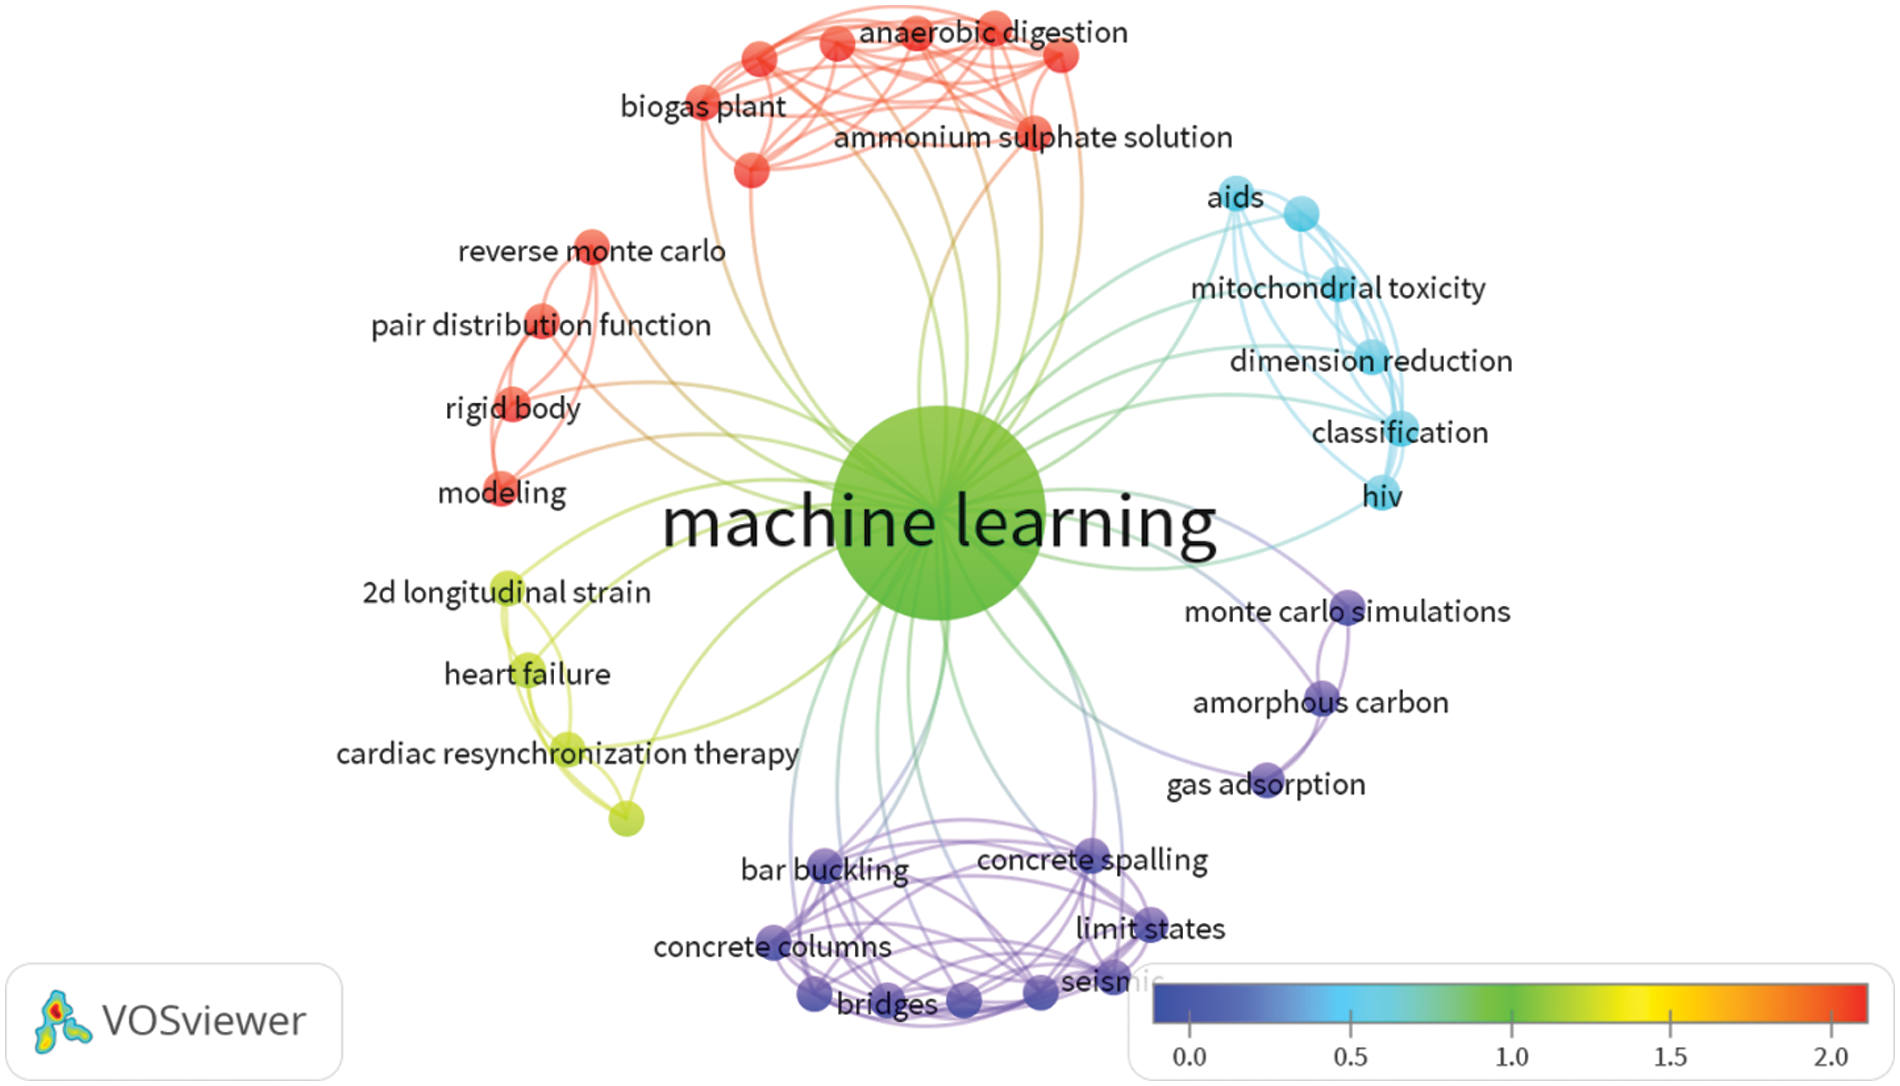
Figure 2: RMC combined with machine learning citation heat maps
Since it was first developed, the RMC algorithm has experienced significant deformation as it has been integrated with other technologies and methodologies. By merging the observed diffraction pattern, Sánchez-Gil et al. [62] provided a parallel modeling technique for producing the constrained fluid-structure model. The theoretical calculation of the diffraction pattern, peak shape fitting, and N-RMC modeling comprised the bulk of the algorithm’s processing. To avoid adsorbed molecules in the vicinity of porous material, N-RMC comprises attempts to insert and delete particles, in contrast to the standard RMC approach. The approach was primarily employed to solve the model’s slow diffusion problem under stringent limitations. Basko et al. [1] combined RMC with MC simulation of high-energy resolution electron energy loss spectroscopy and Markov chain Monte Carlo sampling of oscillator strength parameters. Yang et al. [63] proved through experiments that optical data calculated by this algorithm was reasonable with high accuracy. Wei et al. [64] used Runge-Kutta ray-tracing technology combined with RMC to solve the heat radiation transmission problem in gradient refractive index media with diffuse reflector, mirror surface and dual radial distribution function. That included radiation intensity calculation in the non-balance problem and temperature calculation in the radiation balance problem. Haita [65] modified the RMC algorithm by combining the 2D small-angle scattering data and replaced its structure factor with a 2D structure factor. The RMC method for the 2D scattering mode of the particle network was proposed to analyze the homogeneity of the polymer under deformation. Sans et al. [66] proposed null-collision meshless MC algorithm by using the integral formula and null-collision algorithm, which improves the efficiency of MC in solving the radiation transfer in inhomogeneous media, and provides useful support for the experimental characterization of particle radiation behavior. Norberg et al. [67] added bond valence constraints to build more reasonable local regions of the configuration and provided additional chemical information for fitting. RMC combines a variety of characterization methods and principle algorithms to improve its performance at different stages of its algorithm, making up for its shortcomings and improving performance.
Due to its simplicity and generality, the RMC method has been used with a variety of materials. It does, however, have several restrictions, such as a ten thousand level limit on the number of atoms in the model, a limited range of characterization data, and a lack of support for covalently bound compounds, which is also where RMC will go in the future. The fundamental idea behind RMC is to create 3D models out of 2D data and obtain multi-dimensional structural information from experimental data in order to partially solve problems in material modeling or application, whether it be the deformation algorithm paired with various technologies and algorithms or the algorithm based on a minimization energy model, with the goal of enhancing the mechanical, thermal, and electrical properties of materials. Currently, no universal program applies to all kinds of materials and practical process constraints. Due to the development of characterization methods, there is an urgent need for modeling methods that can fit more experimental data.
3 Application of Characterization Fitting Data in RMC
The accuracy of experimental data is the most important factor in RMC modeling, hence a lot of experimental labor is required in the early stages of modeling. The basis for extracting and researching material structural information is the collecting of experimental data. The goal of RMC structural modeling is to analyze the structural behavior of materials, and the abundance of analytical tools available makes it possible to completely comprehend how the structure was formed and what process conditions still need to be addressed. Technology for material analysis encompasses not only analyzing the composition and structure of the material as a whole but also analyzing the material’ surface and interface, as well as its microstructure and morphology. The macroscopic characteristics and the microstructure of materials are closely related. Some macroscopic phenomena and qualities can be described and inferred from the microscopic characteristics by using the macroscopic performances to identify the microscopic crystal structure characteristics. It can give information for the design and processing of materials to fulfill the needs of industry and research via the comprehensive examination of the structure and performance. X-ray diffraction (XRD) and ND are mostly used in Josephson junction structure modeling in order to analyze pair distribution function (PDF), structural factor, and distribution of coordination numbers. Beginning with the characterization of the data needed for the analysis of the Josephson junction (as depicted in Fig. 3a), this chapter introduces the principle of RMC typical characterization of fitting data and applications.
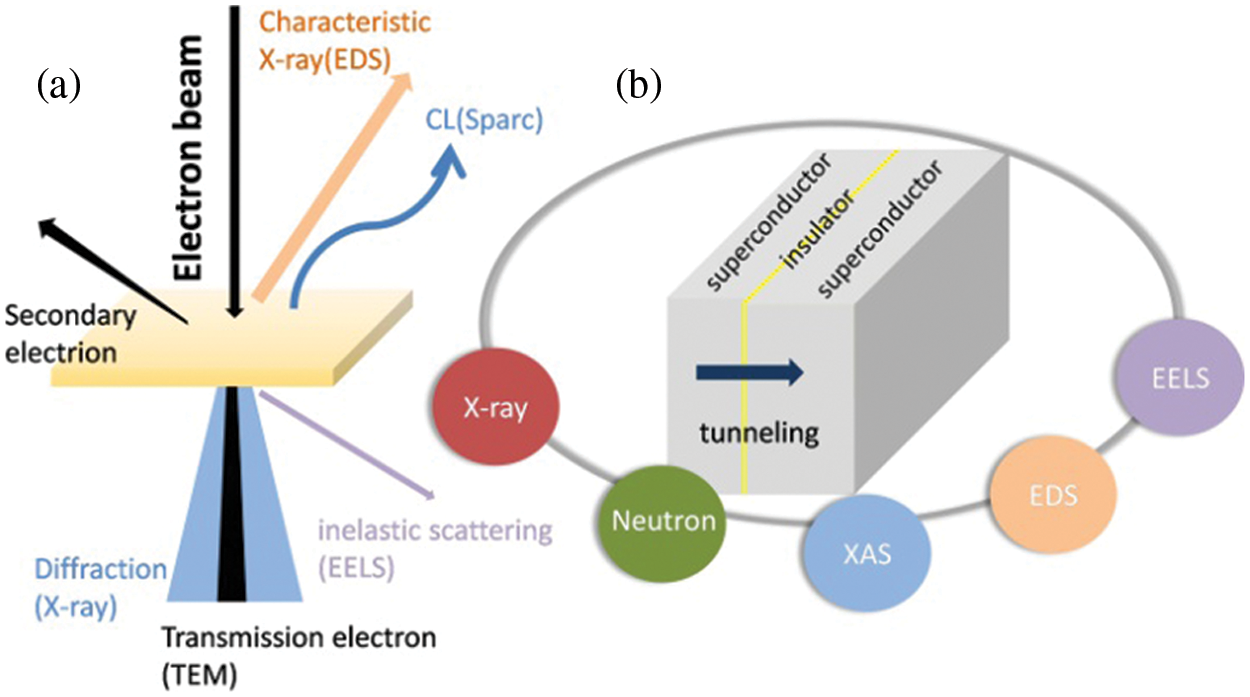
Figure 3: The characterization methods applied to Josephson junction. (a) The wave patterns of various substances produced by high-pressure electron shooting samples. (b) The characterization of Josephson junctions
3.1 Extraction of Phase Information by Diffraction Technology
The foundation of XRD technology is the interference of periodic ordered atoms in the crystal lattice’s elastic scattering waves [68]. It is a fundamental and significant approach for characterizing the material structure that is mostly used for testing and analysis, including phase analysis, the determination of crystallinity, and accurate measurement of the lattice parameters. The radiation is sourced by X-rays, and the noise curve is eliminated by filtering the radiation using a monochromator. The angle is finally obtained by modulating the atomic properties and relative positions, which can be used for the qualitative and quantitative analysis of atomic structure, in order to better control the angle. A slit is then introduced to better control the angle of incident light and diffracted light.
XRD technology as a primary means of characterization is widely used in the research of various materials. Zhang et al. [69] used Transmission electron microscope (TEM)-XRD to analyze the phase of different platinum samples from the microscopic morphology and diffraction peak position, respectively, to verify the existence of platinum nanoparticles in the samples. The thin film was composed of crystalline particles. The composition was determined by XRD through the position of diffraction peaks, and the voltage was controlled, finally verifying the possibility of simultaneously realizing data storage and neuromorphic computing on one device [70]. Hagita et al. [71] used small-angle X-ray diffraction data and RMC to construct a three-dimensional configuration and analyze topological data of silica nanoparticles [72]. In the research of metal oxides [73], the uniformity of porous structure and the difference in skeleton and pore size were observed by scanning electron microscope (SEM) and TEM before and after Ni-Mo-Al dealloying, and the dealloying process was analyzed. XRD curves were added to analyze the composition to verify that they are both Ni and Mo phases after dealloying, and their electrical properties were tested to verify the properties of the nanoporous Ni-Mo alloy prepared by the combination of rapid solidification and dealloying. In more cases, the XRD technique is combined with other characterization methods, such as ND. Researches on liquids [42,74], glass [75–77], nanomaterials [78] and other aspects are reflected in three-dimensional reconstruction, refinement of inter-atomic information and interaction between particles to reveal the coordination number distribution, cluster and interface effects. Timm et al. [79] refined the randomly-spin-configured NiO model using the RMC process combined with ND data, as shown in Fig. 4, showing that it was insensitive to the spin orientation in the {111} ferromagnetic plane. Although it could be seen from Fig. 4d that the magnetic structure of the model was very disordered, since the scales of the nuclear and magnetic phases in the refining were fixed to be the same, the ordered nuclear structure can still correctly reflect the microscopic properties. Diffraction technology is mature and easy to operate, so it is widely used as a primary method for phase analysis. Combined with RMC, it can also be used to analyze the percentage of each component in the material semi-quantitatively by analyzing its radial distribution function.
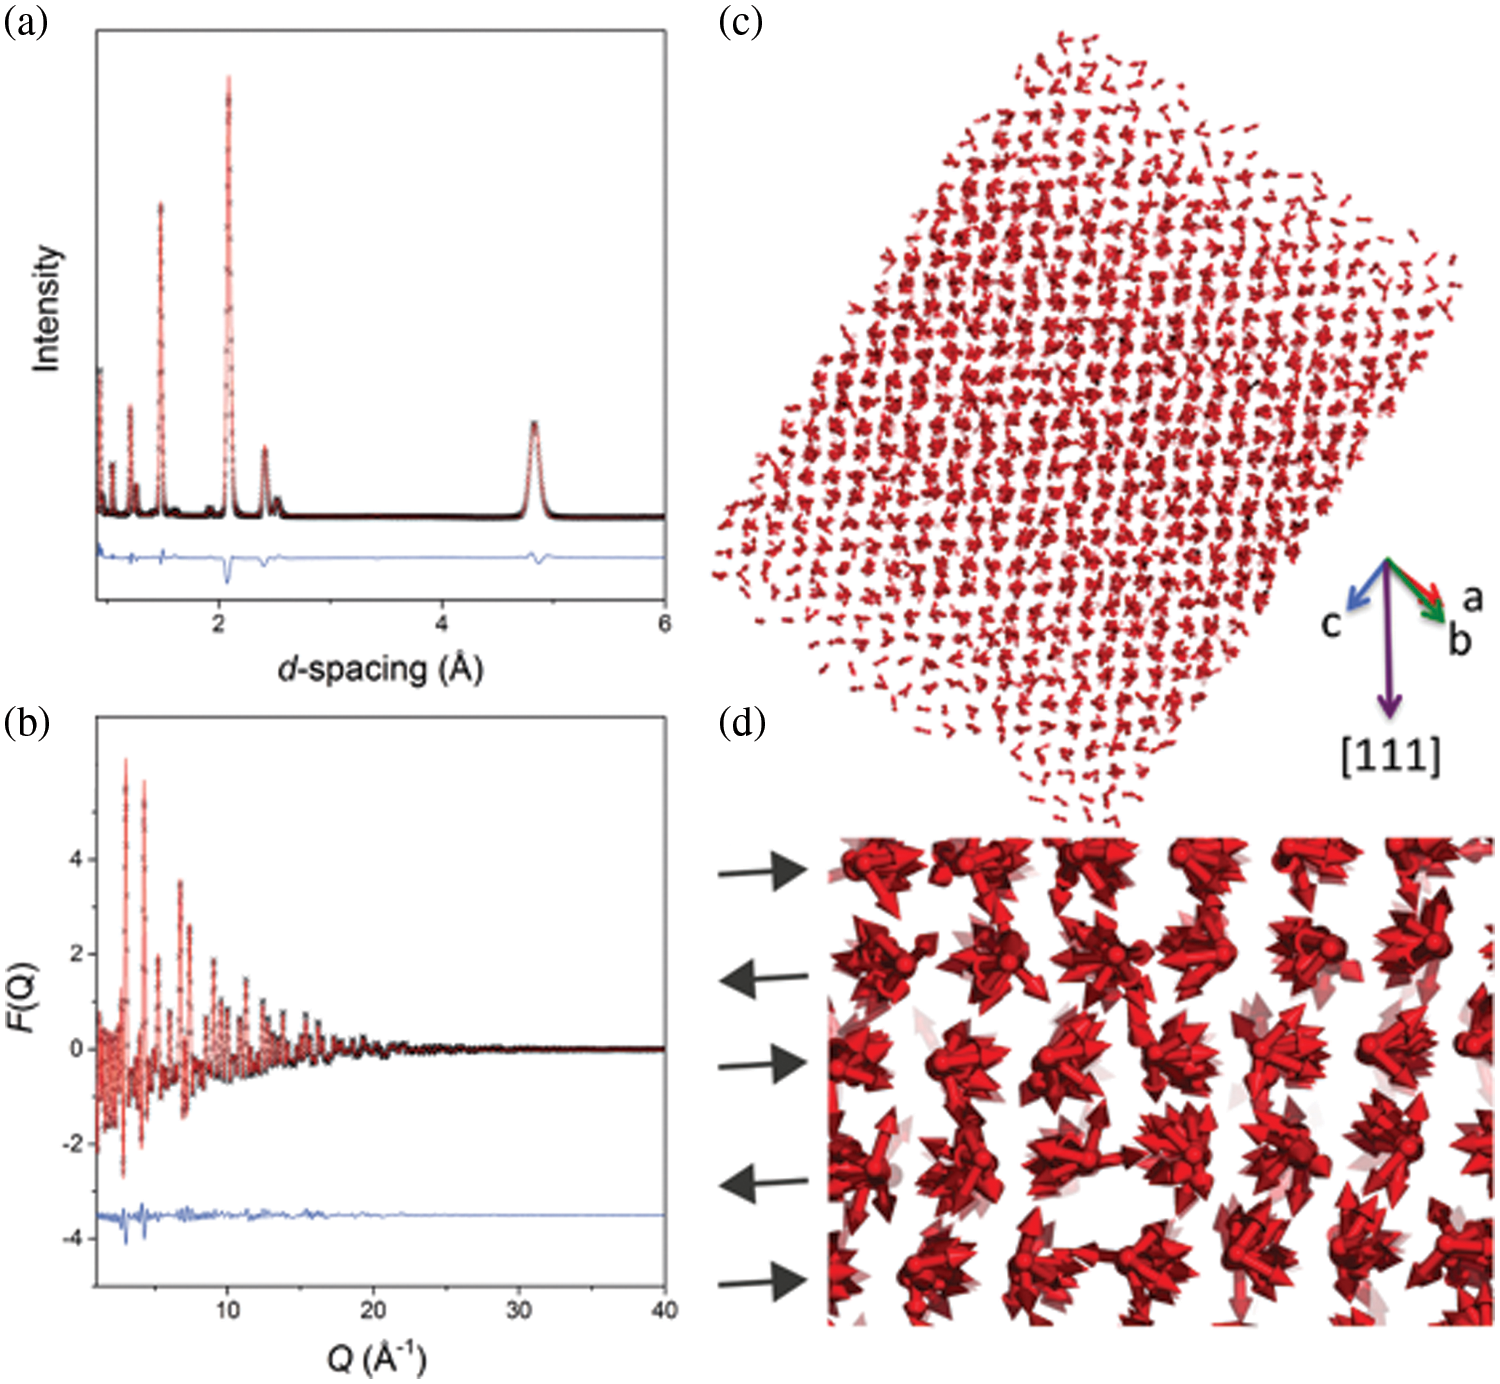
Figure 4: RMC final model and the results matched the diffraction values [79]. This figure by Timm et al. is licensed under CC BY 3.0. (a and b) Representative RMC fits to Bragg values (a) and the total scattering data (b), respectively, for NiO [79]. (c and d) Spin orientations of Ni in RMC refined structures of NiO are shown as arrows. (c) The entire magnetic model with RMC, (d) Highlights the {111} ferromagnetic planes [79]
3.2 Extraction of Composition and Valence Bond Information by Electron Transition Theory
The energy transition of the input wave that is absorbed by electrons outside the nucleus is used in X-ray absorption spectroscopy (XAS) to identify some features of the sample. The X-ray is significantly absorbed when the material’s inner shell electrons are stimulated to the free or unoccupied state, causing a sizable jump in the spectrum that is known as X-ray absorption near edge structure (XANES). As X-ray energy increases, electrons are driven to the continuous region where they can interfere with the atoms’ outgoing and scattered waves to create the oscillation of spectral waves known as EXAFS [80]. Among them, EXAFS has the benefit of allowing for the investigation of the ensemble’s atomic and electronic structures, primarily because of its local structure sensitivity and high spatial resolution. By measuring the coordination number, bond length and the disorder of the fifth shell coordination number, the size and shape of nanoparticles and the surface morphology and disorder of 1–2 nm clusters were analyzed according to external conditions such as temperature, alloy composition and substrate, etc. [16].
EXAFS technology is usually combined with various characterization methods for quantitative and rapid determination of atomic structure. Harada et al. [16] constructed a 3D model based on the RMC modeling method of experimental data based on XRD to obtain a complete atomic structure. Coordination number and bond angle distribution can be calculated from the RMC model, which is helpful in analyzing the crystal system composition and distribution characteristics of the crystal structure. In order to obtain a model that was closer to the experimental value, multi-scale analysis was necessary. After Adam et al. team [81] integrated the ND and EXAFS data (as shown in Fig. 5c and 5d), the model would help analyze more subtle structural changes. The final model is shown in Fig. 5a and 5b, and the calculated structure factors match the experimental values well.
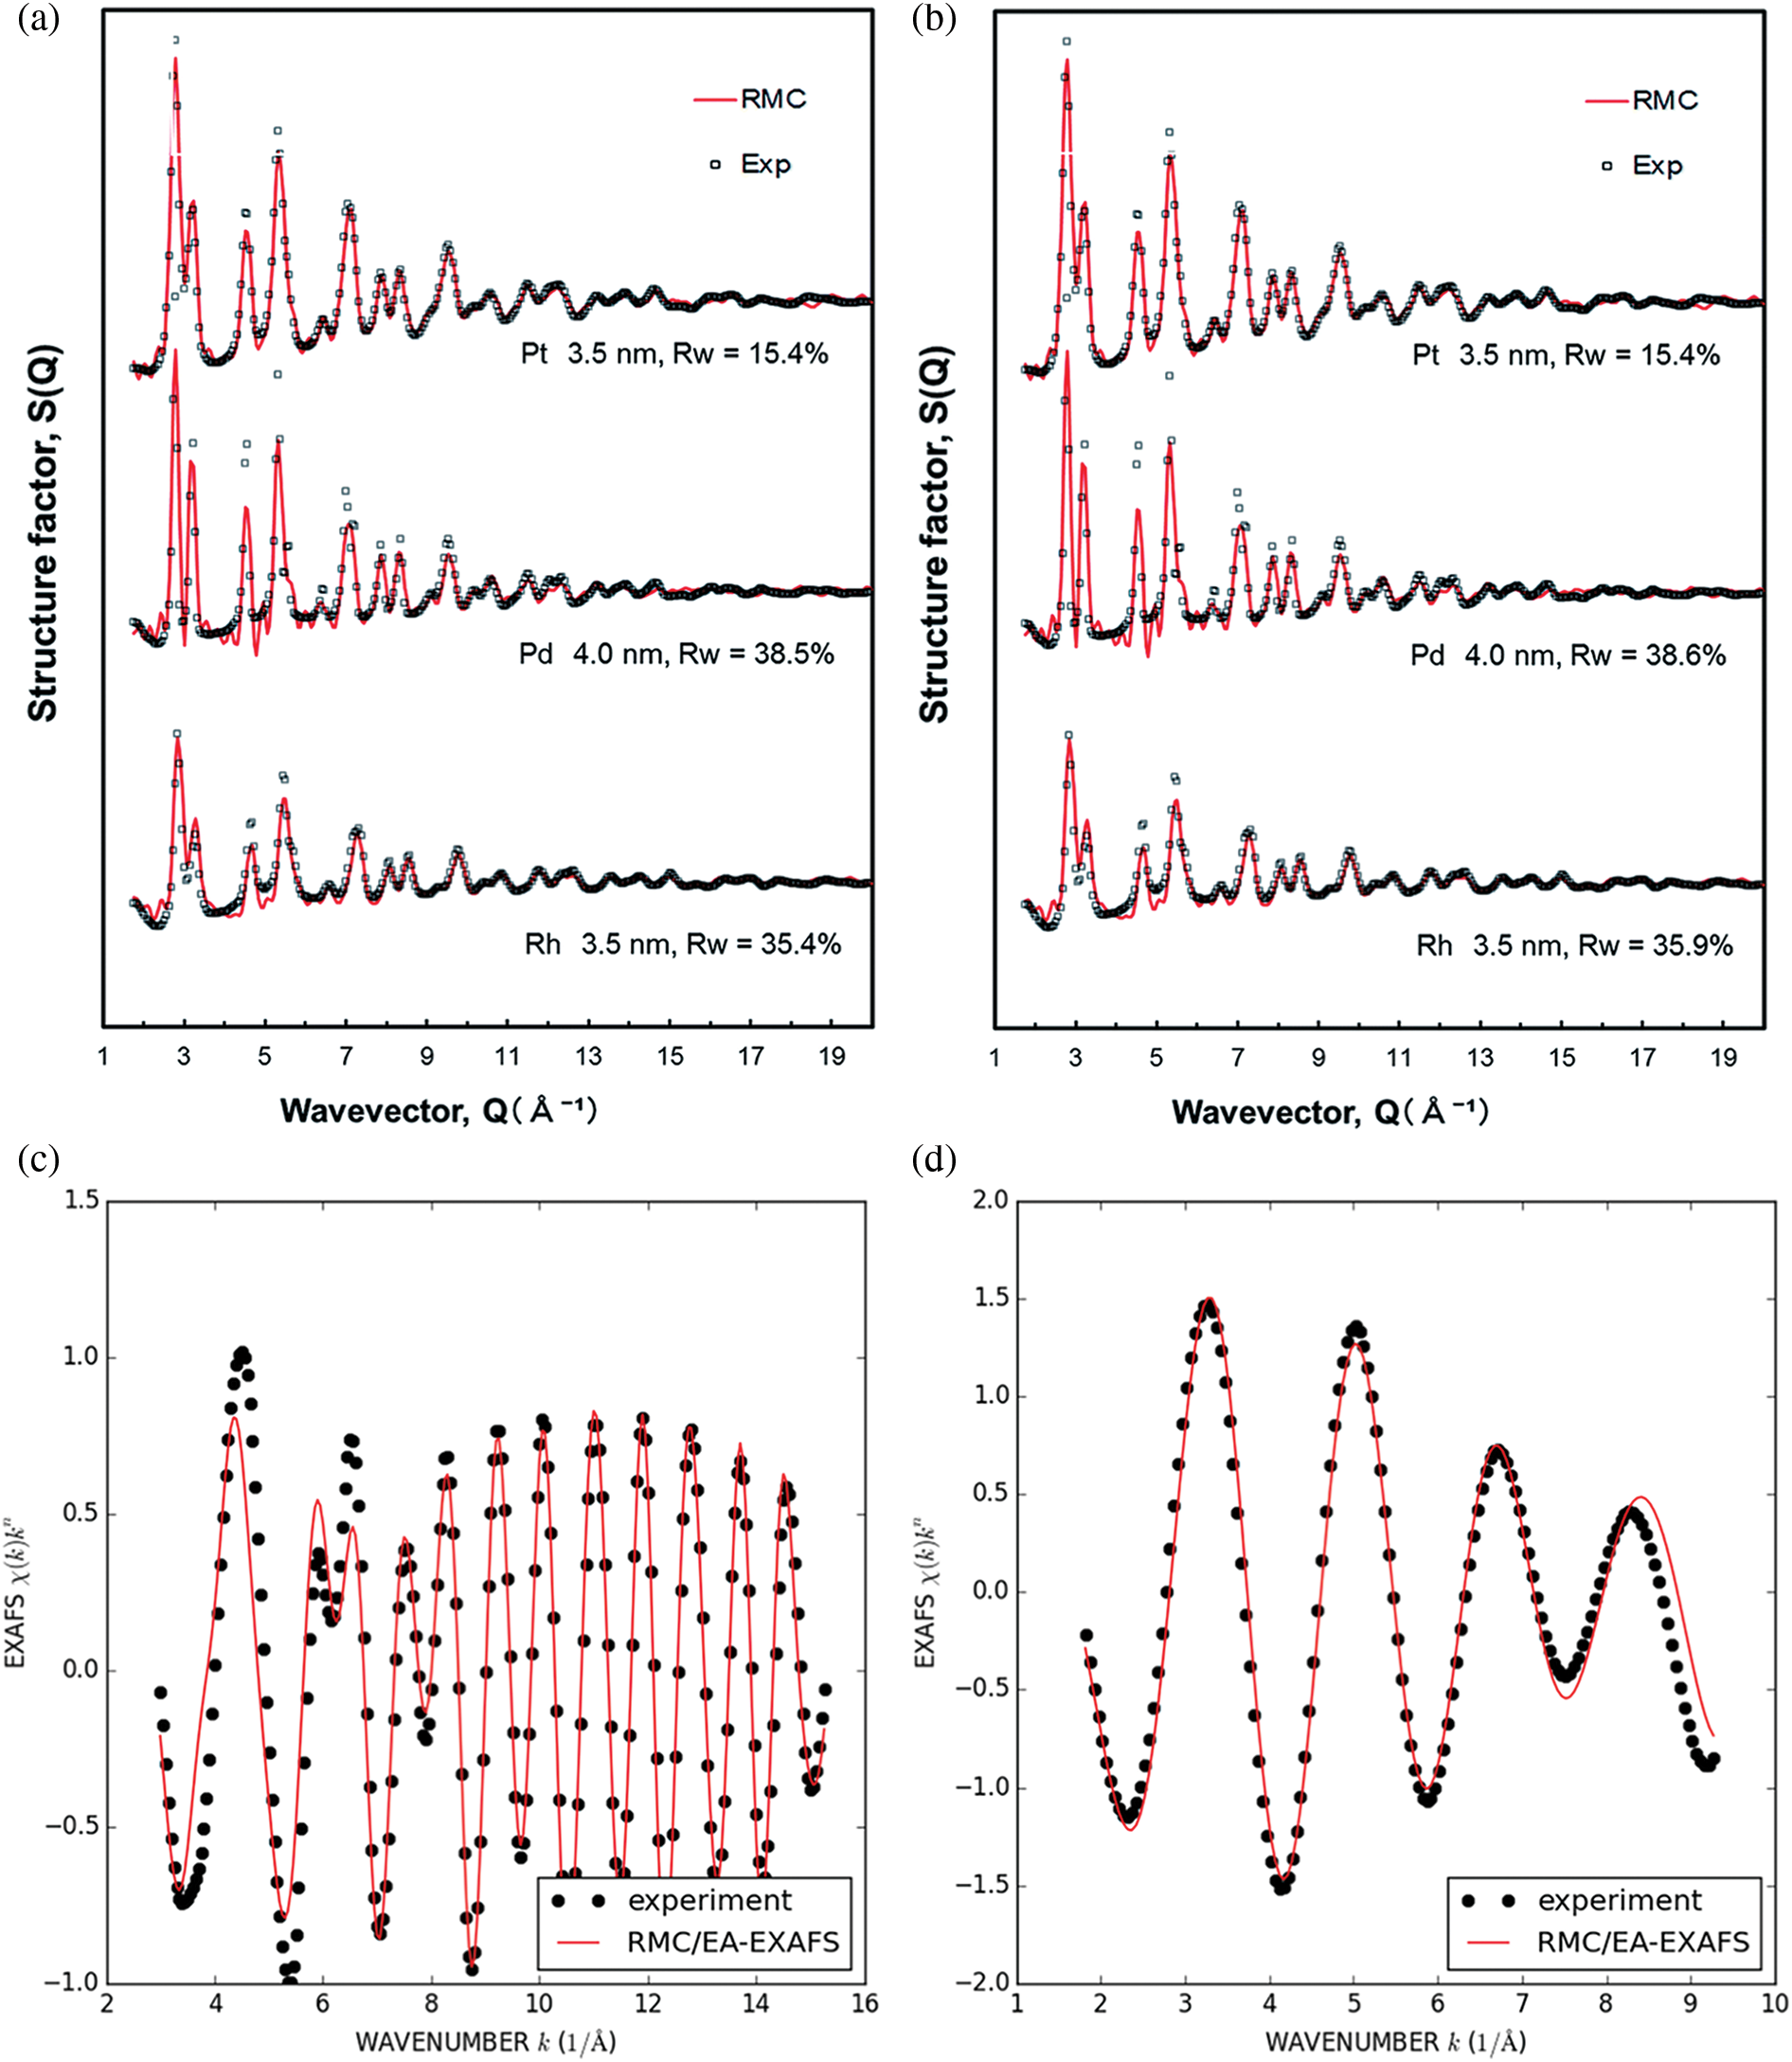
Figure 5: RMC is combined with experimental data. (a and b) Experimental and RMC-simulated total structure factor S(Q) profiles for the Pt, Pd, and Rh nanoparticles with different particle sizes, prepared by the photo reduction in the presence of PVP and benzophenone. The initial model is based on (a) the face-centered cubic (FCC) bulk crystal structure represents and (b) the computer-generated random atomic configuration [16]. Fig. 5a and 5b by Harada et al. [16] is licensed under CC BY-NC 3.0 (c and d) fits shown for k space for the Ce K-edge (left) and Ce L3-edge (right) respectively of the ceria sample [81]. Fig. 5c and 5d by Adam et al. is licensed under CC BY 3.0
RMC with the data of EXAFS has been widely used in disordered molecules and finite systems, such as super-cooled copper and nickel, block metallic glass, polyatomic molecules in the gas phase, etc. For complex systems, RMC fits multiple diffraction techniques such as PDF and EXAFS to achieve refinement. Atomic models of different sizes were compared by minimizing a goodness-of-fit indicator (called Rw) as a benchmark to determine the appropriate size of the model. The total scattering experimental structure factor S(Q) obtained by high-energy X-ray diffraction (HEXRD) was used to refine the model and the details of atomic-scale structure were calculated in combination with EXAFS data. Rw is defined as:
where GE and GC are the experimental and calculated data, respectively. wi is the weighting factor reflecting the statistical quality of the individual data points.
Nataf et al. [82] described the potential of high-pressure energy dispersion X-ray absorption spectroscopy (XANES/EXAFS) in the reconstruction of a nanocrystalline material model. They explored the reduced sensitivity of copper oxide nanoparticles under X-ray irradiation. And the possibility of local environmental changes during two-dimensional layered molybdenum trioxide phase transition was tracked by RMC during the pressure induced phase transition. Guo et al. [34] constructed the RMC model by combining the data of XRD and EXAFS. By comparing the interatomic distance, bond length, Voronoi clusters and other microstructure characteristics, it was concluded that the volume of each cluster in the ZrCu metallic glass adulterating Al relatively shrinking in terms of microstructure, which leads to the denser atoms in the cluster. Comprehensively using a variety of characterization methods to measure the microstructure from qualitative and quantitative perspectives, the influencing factors such as composition, defect sources and process differences can be analyzed, providing theoretical support for improving the properties of materials. Trigub et al. [83] used RMC combined with enhanced EXAFS spectroscopy to study the distortion of atomic structure around some elements of substances. They supplemented computational data by density functional theory (DFT) and XANES to detect local atomic structures of In and Cu in sphalerite. The combination of XAS and RMC has been effectively applied in liquid materials such as molten metal, molten salt and molecular liquid [28,84], oxide metal compounds [82] and gaseous molecular materials [85].
The foundation for developing the model that can qualitatively examine the elemental composition is diffraction data, which serves as the fundamental fitting data for RMC. The local atomic structure of matter, including metastable and transient states, can be studied effectively using XAS. It is a cutting-edge and trustworthy data analysis technique for structure determination technology. EXAFS can be employed for various purposes, including refining RMC models, elemental analysis, bonding analysis, element valence and coordination environment analysis, among others, to produce a reliable reconstruction of short-range structures surrounding atoms [28].
3.3 Extraction of Structural Information by Multiple Characterization Methods
Microscope technology has experienced the optical microscope, electron microscope, and the development of scanning probe microscope. The difference in imaging principle (as shown in Fig. 3) created a microscope to observe the differences in the microstructure. In recent years, it has been mainly applied in the morphology observation of two-dimensional materials [86–94], metals [95–98], superconductors [99,100], composite materials [101,102], catalysts [103,104], etc. In practice, diverse resolutions of the microscope in different research areas play an essential role. Although modern microscopy techniques have theoretically reached the atomic level, it is still difficult to directly obtain the atomic arrangement and fine structure from the morphology directly. Therefore, it is necessary to combine various characterization methods and simulation tools for construction, verification and precision analysis. In addition to obtaining the microscopic morphology and phase information of materials, RMC modeling requires more characteristic information, such as composition, valence bond and other information. So, the combination of electron microscopy and other characterization methods provides the possibility to study more structural features of materials. The electron microscope can observe the molecular and even atomic structure to get the microscopic structure, with other characterization means which can be from the multidimensional analysis of the sample, qualitative and quantitative to obtain the composition of the sample material, valence bond and molecular structure information.
The association of electron energy loss spectroscopy (EELS) and electron microscopy technology has significant characteristics in high spatial resolution and high momentum resolution [105]. It is applied in the fine particle size detection of materials and the understanding of mechanical, thermal and electrical properties, improving the structure and performance of materials. In the research of superconducting quantum Josephson junction, the scanning transmission electron microscope (STEM)-EELS combination was used to reconstruct the three-dimensional model of Josephson junction, calculating the coordination and crystal phase of Al atoms in the alumina barrier layer. Through the combination of nanobeam electron diffraction (NBED)-RMC, the cut-off radius of AlOX was calculated, and the causes of defects and key factors in the process of preparation were analyzed [8]. In the α-Fe2O3 nanowires obtained by thermal oxidation, the long-range order of oxygen vacancies leads to the emergence of modulation structures, which release the stress of the nanowires during the generation process [106]. TEM and high-resolution transmission electron microscopy (HRTEM) were used to investigate the crystallinity of nanowires and their cross-section respectively. Using the energy loss function (ELF) to effectively combine EELS with the RMC showed a good fitting effect with the experimental data (as shown in Fig. 6), indicating that more experimental data would be integrated into the RMC in the future modeling process. Theformation mechanism was obtained by analyzing the elemental valence bond of EELS, which is a technology that provides nanoscale analysis. Its high spatial resolution, high energy resolution, high sensitivity and other characteristics make it have important applications in obtaining elemental information.
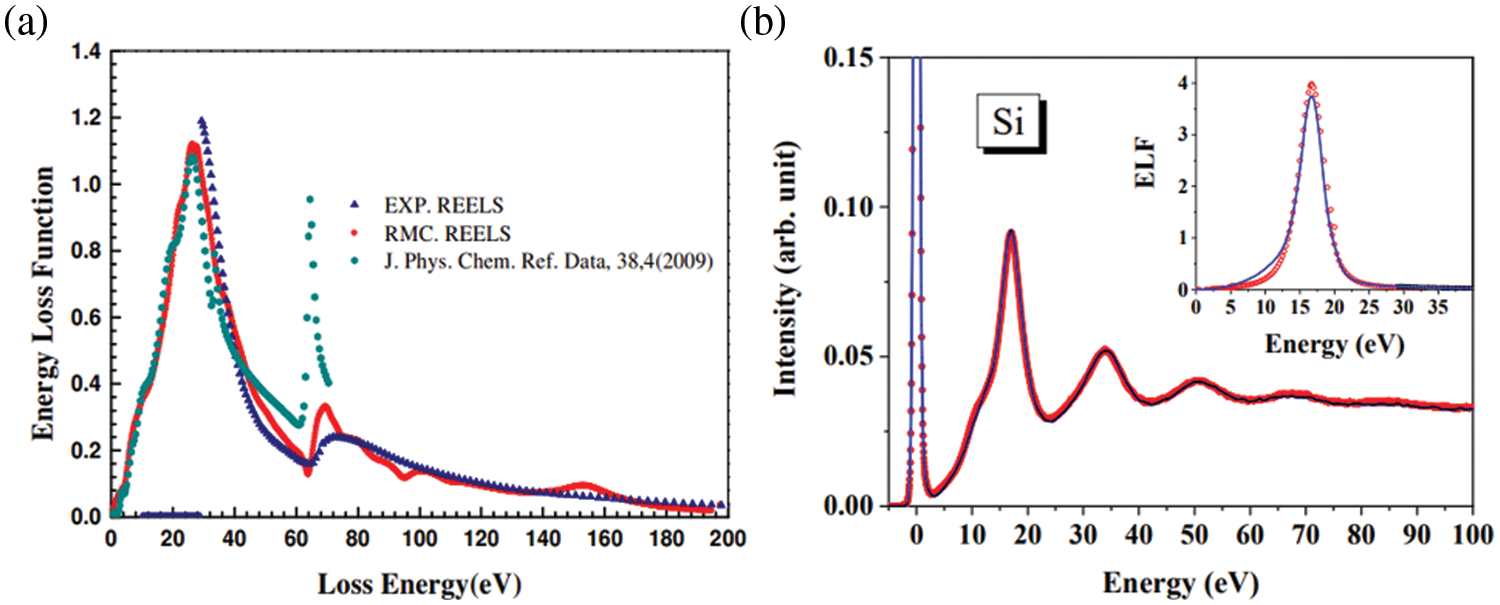
Figure 6: The comparison of RMC fitting EELS data. (a) The comparison among the atomic photo-absorption experiments (blue triangle), RMC fitted curve (red line) and other literature (dark Cyan dots) are shown for comparison [107]. Fig. 6a by Xu et al. [107] is licensed under CC BY 3.0. (b) The inset of the figure shows the ELF obtained by the RMC method (blue line) in comparison with the results in databases of Palik (red circles) and Henke (black squares) [63]. Fig. 6b by Yang et al. [63] is licensed under CC BY 3.0
The microstructure and structure of materials have been the subject of an increasing number of studies in recent years, and many characterisation techniques have permeated all areas of material research, offering a more natural and vivid way to represent feature extraction. For instance, Krayzman et al. [17] constructed the structure model of titanium KNbO3 by combining RMC with ND, Bragg spectrum, EXAFS, and electron diffraction data, demonstrating the correlation of its element structure. Soft magnetic amorphous alloys were studied and calculated by Babilas et al. [108] using XRD, transmission Mossbauer spectroscopy, RMC simulation, and relative permeability measurements. By studying the local structure around Nb atoms using X-ray reflectance, thermal desorption spectroscopy, and fluorescence XAFS, Sajiki et al. [109] estimated the density using quartz glass. Niobium oxide amorphous films’ atomic structure model was investigated using synchrotron radiation, including HEXRD, XAFS, and RMC. In order to expose the three-dimensional spatial distribution of its polarization vector from the atomic scale, Sun [110] fitted RMC simulation tool and collected local structure and ferroelectric spontaneous polarization displacement information. Lattice dynamics and electronic structure viewpoints were used to study the mechanism of valence bond and nearest neighbor coordination at the same time, which offers a fresh perspective for ferroelectric material microscopic localization investigation. The anomalous X-rays of X-ray scattering and Zn absorption edge were fitted by Waseda et al. [111]. To explore the indium gallium zinc oxide layer and nanocrystalline indium gallium zinc oxide film, they built an atomic-scale model using RMC. Harada et al. [16] used the total structure factor S(Q) obtained based on HEXRD and the data obtained from EXAFS measurements in combination with RMC to determine the three-dimensional atomic-scale structure of nanoparticles with a size of less than 5 nm. More and more advanced characterization methods are used to extract material structure information, and RMC structure modeling is combined to better explore the structural characteristics of materials from the microscopic structure.
RMC is used to calculate, relate, and cluster diffraction data query results from the Web of Science database. There are 1170 papers that are connected as of April 2022. In VosViewer, the graphical data gathered from the Web of Science is obtained. The database’s pertinent literary data was analyzed using the co-occurrence counting approach. 219 entries in the records met the measurement requirement, which required that the minimum keyword occurrence times be greater than or equal to 2. Fig. 7 displays the visualization outcomes of overlay following data cleaning. Using information from the Web of Science, Fig. 7a displays the network, relations, clusters, and links in a form graph of this query. Fig. 7b and 7c show the correlation and references from the website of Pubmed over the past few years. From this picture, it can be seen that relevant researches have been going deeper and have been hot topics of concern.
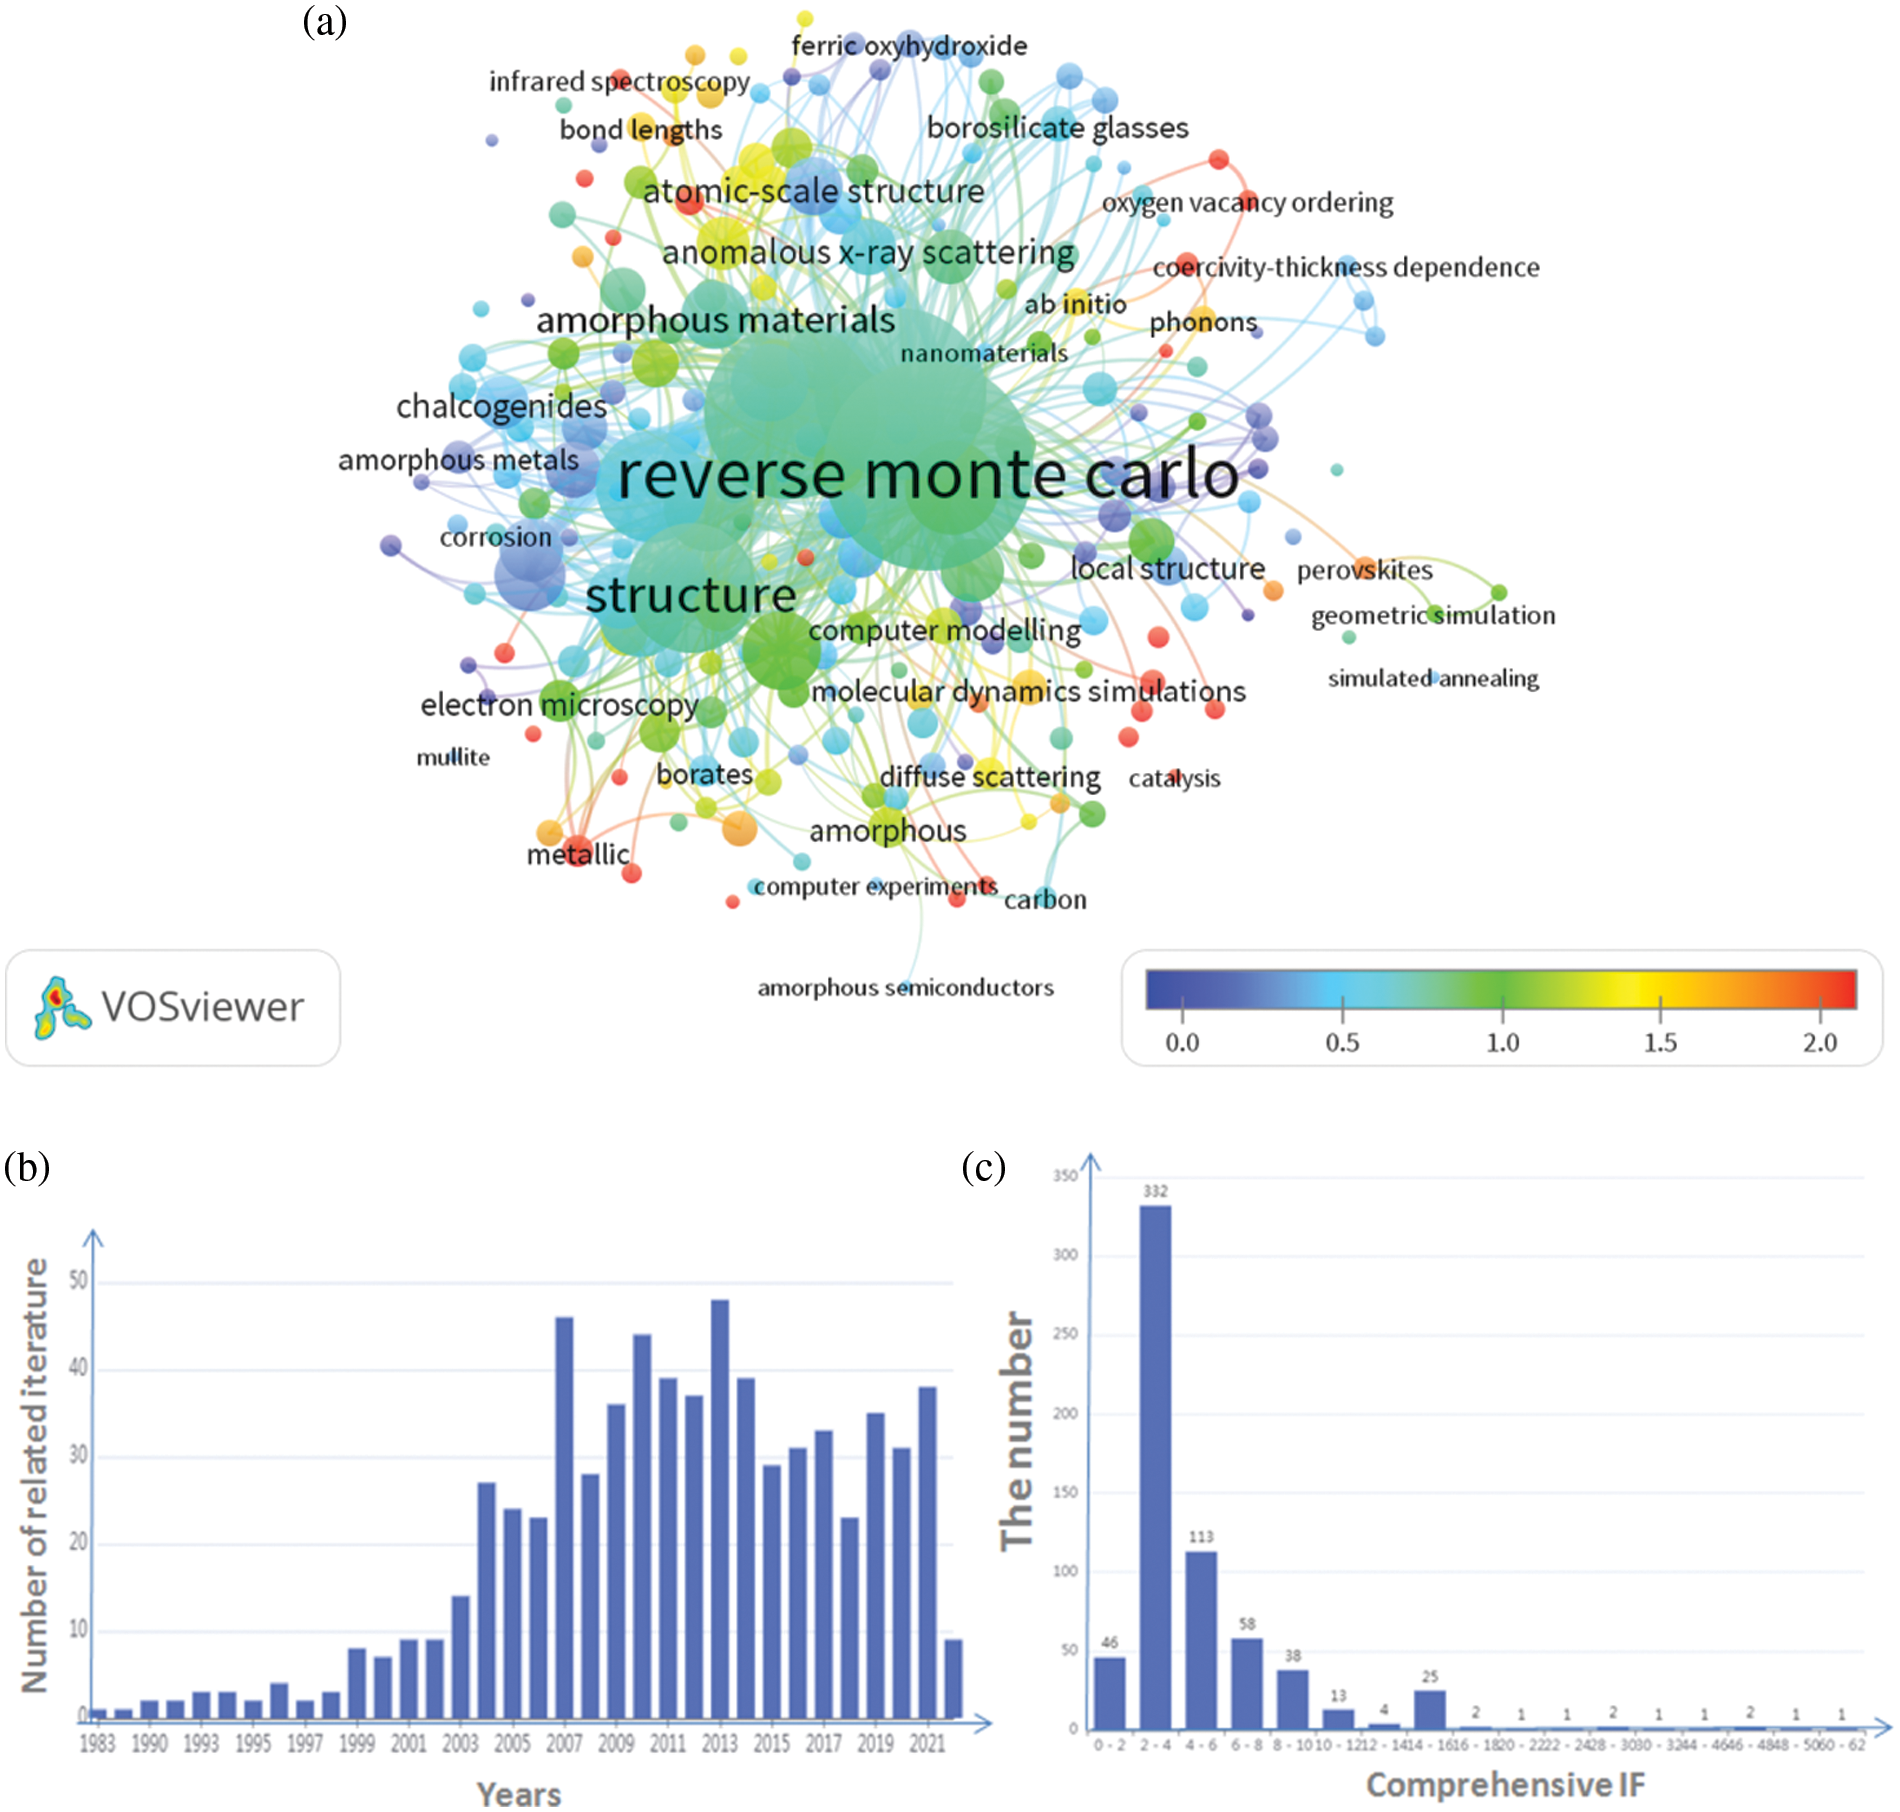
Figure 7: The picture shows the inverse Monte Carlo and diffraction data combined with correlation calculation results. (a) shows the visualization result of overlay combining RMC with diffraction data; (b) shows the correlation between RMC and diffraction techniques; (c) shows the histogram of the influence factor IF combined with the RMC and diffraction data
4 Simulation of Josephson Junction Barrier Layer
Quantum computing has ushered in a prosperous era in recent years. Gradually more advances are being made in the study of the Josephson system, including studies of thermal noise [112–114], quasiparticles [115,116], and other impacts on quantum circuits. The “Zuchongzhi” of USTC has achieved 64 qubits [117], and the computational complexity is six orders of magnitude higher than that of Google’s “Sycamore” [118]. In superconducting, IBM introduced a processor with 127 qubits [119]. Quantum computer measurements heavily rely on the quantity of quantum bits. The LC resonant circuit produces the quantum bits. The level of the uniform resonator is changed by the introduction of a Josephson junction to produce a nonlinear two-level system [120]. This allows the quantum effect to be stated. Decoherence time is a crucial metric for gauging performance. It is planned to investigate ways to enhance coherence time in multi-scale and multi-dimensional aspects, whether the research or analysis is conducted from a microscopic or macroscopic perspective. Our project team’s research was conducted along this path. First principles [121], RMC, and MD are used to investigate the microstructure of the Joseph junction from a microscopic perspective. The design of quantum circuits is enhanced from a macroscopic perspective [122], and the Hamiltonian calculation is optimized [123]. We hope to raise the coherence time and advance the development of quantum computers while simultaneously focusing on improving the process parameters and yield rate of quantum chips.
Josephson junction is composed of three layers (as shown in Fig. 8a). Between the two layers of superconducting material is an ultra-thin insulating layer, in which the superconducting material is metal Al or Nb, and the ultra-thin insulating layer (also called barrier layer) is mostly aluminum oxide or aluminum nitride [8,124,125]. Due to the excellent properties of alumina, Al and its oxides are mainly studied here.
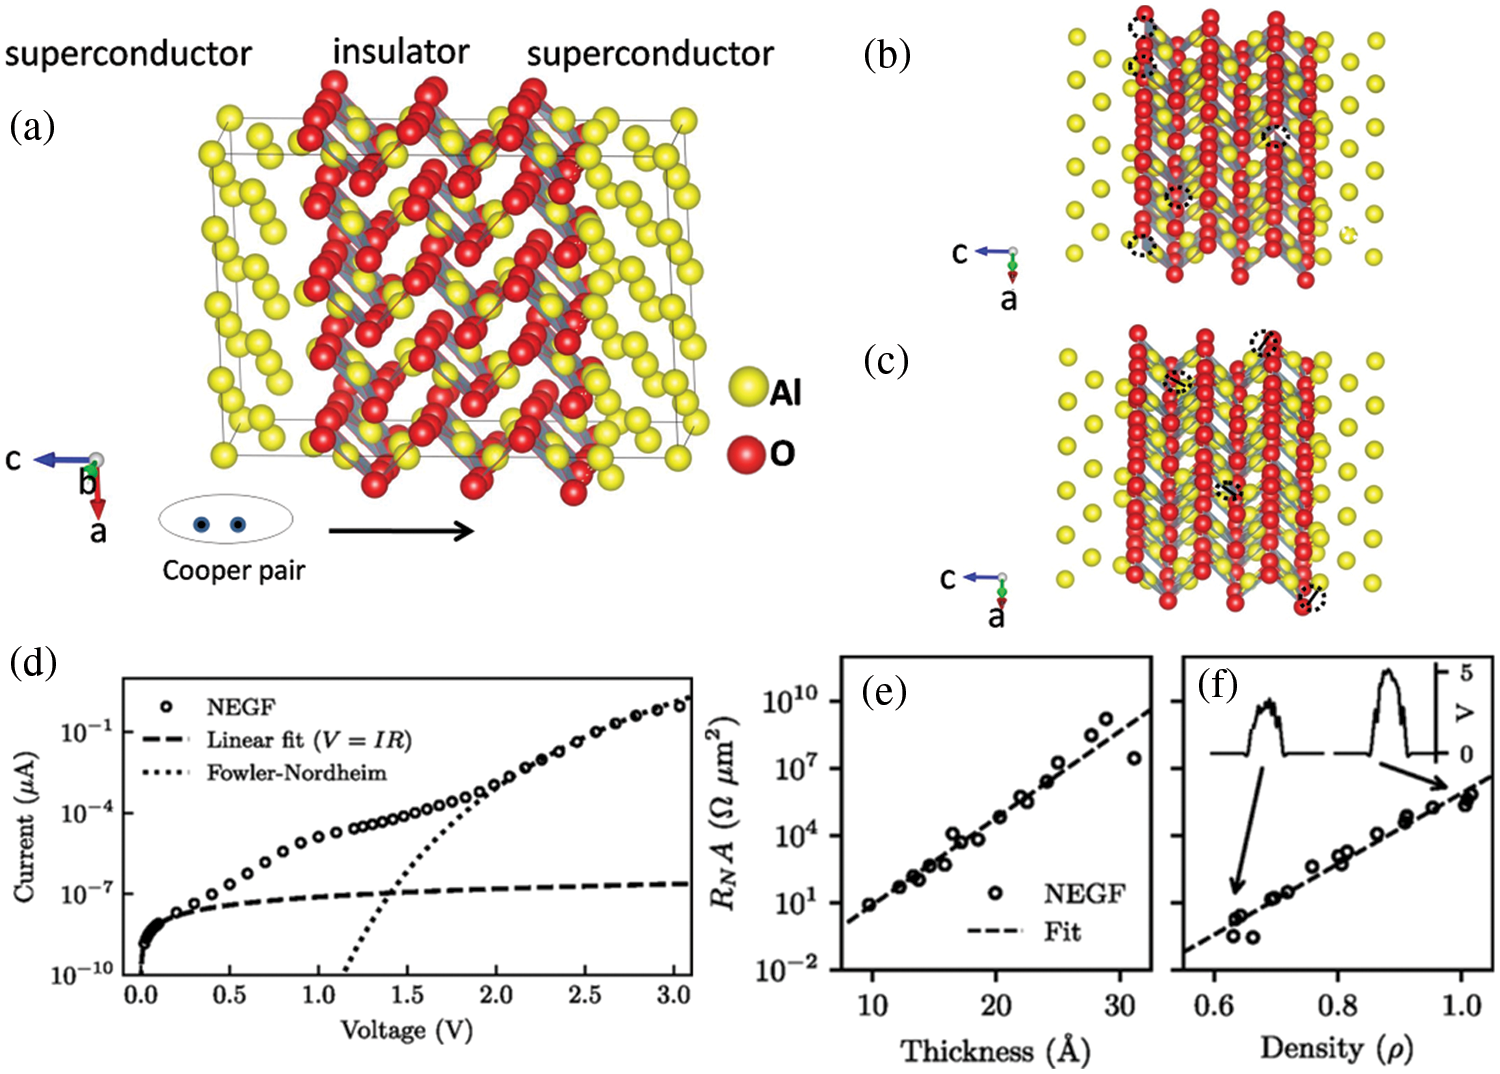
Figure 8: Demonstration of RMC modeling and the electrical performance of Al-AlOx-Al junction model calculated with non-equilibrium Green’s function (NEGF) model. (a) Al-AlOx-Al junction model with RMC; (b) oxygen vacancies appear in the barrier layer; (c) Al-O bond defects appear in the barrier layer; (d) the I–V response of Al-AlOx-Al junction model calculated with NEGF model [132]; (e and f) the calculated resistance area of the junctions is exponentially dependent on both (e) the thickness of the tunneling barrier and (f) the density of the barrier oxide, respectively [132]. Fig. 8d–8f by Cyster et al. is licensed under CC BY 4.0
4.1 Influence of Alumina Barrier Layer Process on Modeling
Alumina thin films have low interfacial defect density and high fixed negative charge density [126], and are widely used in superconducting electronic devices, such as Josephson junction, whose structure and nano chemical properties determine the performance of advanced electronic devices [3,127]. The thickness variation of the alumina layer in the Josephson junction and the structural defects in the AlOX tunnel barrier create noise, limiting the sensitivity of superconducting devices and the decoherence time of qubits [3].
The thickness of the alumina barrier has an effect on electrical properties. Zeng et al. [12] analyzed the morphology of Al/AlOX/Al interfacial layer oxides by annular dark field-scanning transmission electron microscopy (ADF-STEM) and obtained their thickness distribution. The I-V curves of different samples were obtained by conductive atomic force microscopy (CAFM) and STEM to analyze their barrier layer parameters, including barrier thickness and barrier height. The influence of barrier thickness change on tunnel current was obtained. In order to further calculate the distribution of tunnel current with barrier thickness, the conductivity theoretical formula was introduced to calculate. It showed that less than 10% of each barrier layer was active in the three samples. Fritz et al. [3] proved that different oxidation conditions lead to changes in film thickness, such as oxidation temperature and oxygen pressure. EELS curves were used to analyze changes in AlOX composition and alterations in Al-O coordination (i.e., the average bond number of Al-O), which would affect the resistivity of the barrier layer, requiring atomic-scale analysis of AlOX composition. By comparing HRTEM images, it was observed that the contents of crystalline Al inclusions were different in AlOX under different process conditions. Oxygen pressure had a great influence on the content of Al inclusions, but the change of oxygen temperature had no obvious influence on the content of Al inclusions. Residual oxygen may have a strong effect on the grain size and growth process of Al. The inclusion of such crystalline Al may also be generated by high pressure electron beam irradiation, and the electron excitation would lead to the formation of amorphous clusters in the defects of the film, leading to the formation of crystal domains [13].
The two-level system in Josephson junction is thought to be primarily caused by atomic structural flaws in the tunnel barrier. The formation of extra electronic states causes a sub-gap leakage of the Josephson junction as energy dissipation traps on the interface as a result of the presence of vacancies [90]. The orderly distribution of point defects, such as oxygen vacancies or aluminum vacancies (as seen in Fig. 8b), in the crystal structure of metal oxides frequently causes a phase shift from high symmetry to low symmetry. The reduction of symmetric elements that occurs along with this transition typically results in the formation of domain structures [128–130]. Particularly when characterizing materials, high pressure may cause radiative decomposition, resulting in Al-O bond separation (as shown in Fig. 8c) and O-O bond defects, forming O-O clusters, leading to metal ion reduction and structural deformation, which is undesirable. In order to avoid this situation, low-temperature oxidation can be adopted [9].
The Josephson junction’s oxide layer thickness is typically kept at or below 2 nm, and the likelihood of tunneling is exponentially linked to the barrier layer thickness. The characterization results demonstrate that as the barrier thickness lowers by 0.2 nm, the tunnel current increases by order of magnitude [131]. The development of key parts for quantum computers has been accelerated by research on the control and uniformity of barrier layer thickness. In terms of labor, materials, and financial costs, the characterization of its atomic structure and defect analysis have contributed to the advancement of its high-precision industry research, particularly the use of simulation techniques to enhance and optimize the device performance of the material through repeated trial and error.
4.2 RMC Is Applied to Feature Extraction and Structural Analysis of Josephson Junctions
Superconducting qubits contain Josephson junctions, which are crucial parts. The study and characterization of the Josephson junction’s structure have gradually improved thanks to the advancement of microstructure observation techniques. RMC is a widely used modeling tool that is important in assessing the microstructure of materials, particularly in defect analysis. Few systematic research on the influences of oxidation factors on structure and nanochemical characteristics have been done up to this point, according to Fritz et al. [3]. Through STEM, Zeng et al. [8] studied the microstructure of the sandwich structure from the standpoint of flaws. It was assumed that there was substantial contact between the Al-O interface layers due to the high distortion at the Al/AlOX interface. This reaction occurred in PDF Al-O bond with multiple small peaks in 2~4 angstrom interval, which is the performance of the amorphous phase, and was also verified by the EELS curve. Through NBED—PDF and RMC fitting analysis of data structure, such as nearest-neighbor distance between different atoms, coordination number and ring distribution, exploring its alumina film defect structure, this defect structure was one of the main reasons for the degradation of device performance. This paper analyzed the causes of defects, which are crucial for correcting defects, and improving process conditions, and material performance. Later, the team studied the changes in the structure of the interface layer between the lower Al and the substrate Si, found the layered structure through ADF-STEM and bright field-TEM, and further studied the element distribution presented by EFTEM and the energy peaks of different elements provided by EELS in order to analyze the causes. It was found that the existence of defect states may cause the interference factors of decoherence in amorphous alumina and Si between the interface layers, or the destruction of the coherence of Josephson qubits on the amorphous substrate by two-level fluctuation [133–135].
From the standpoint of crystallographic orientation, the effects of various substrate temperatures and deposition rates on the microstructure of aluminum and alumina layers were investigated. It was discovered that as the temperature of the Si substrate decreased and the rate of deposition increased, the overall Si/Al grain boundary grooves gradually disappeared. High-temperature annealing experiments on silicon substrates were conducted to create the ideal environment for aluminum epitaxial growth in order to generate a more homogeneous aluminum layer on the substrate [136–139]. The planarity of the Al/AlOX interface does, however, improve at higher substrate temperatures and slower deposition rates [4]. The short-range order of nanoscale alumina films was studied from the perspective of size in order to control the short-range order of amorphous materials, and the degree of crystallization of materials with various thicknesses was observed at various temperatures by combining EELS and X-ray photoelectron spectroscopy [140]. Jasim et al. [9] examined the bond length and coordination environment between elements from the standpoint of the process circumstances using theoretical calculations by RMC modeling, and then examined the causes of the variations by contrasting various temperatures. Combining TEM and SEM, it was discovered that the AlOX barrier layer’s thickness varied during the development of several substrates. It was determined that this discrepancy was brought on by the various hydroxyl group densities at various temperatures. The analysis of the ePDF coating growth image at low temperatures demonstrates the benefits of ePDF technology in enhancing the development of amorphous atomic layer deposition (ALD) coating materials, allowing for widespread use. AlOX has a variety of crystalline Al inclusion contents that were produced under various oxygen pressures and temperatures. Al inclusion content is significantly influenced by oxygen pressure, but Al inclusion content is not visibly affected by changes in oxygen temperature. A method to lessen the noise of the Josephson junction potential barrier from the oxidation condition was investigated [3]. Residual oxygen may have a significant impact on the size of the Al-grain and the growth process of Al [8]. In order to demonstrate how the ALD cycle number affected the atomic structure of AlOX and consequently the performance of the film, Young et al. [10] built an atomic model of amorphous alumina and examined structural data, including material composition, bonding, and atomic coordination. The Josephson junction’s microstructure and characteristics are greatly aided by the characterisation apparatus.
The reconstruction of atomic structure is to find the structural differences under different process conditions and then find the process factors that affect the properties of materials. For RMC, the analysis methods include PDF, structure factor, the coordination number of each element, the bond length of the element, n-fold ring distribution [8], Voronoi [141], etc. The differences between model structure and ideal structure are analyzed from the aspects of atomic distribution density, atomic bonding rate, atomic defect density, etc.
The experimental data, which includes the various characterisation and test data previously described, is directly related to the atomic structure, which is the numerical performance of the atomic structure, on which the RMC structure model depends. The physical characteristics of a material are determined by its atomic structure, and as physical characteristics may be used to validate structural models, structural models are crucial for examining the microscopic characteristics of materials. Particularly, the study of amorphous materials has produced reasonably developed findings. We discovered, however, that the structural modeling of Josephson junction by RMC has received relatively little attention. The previous literature focuses too much on the oxide in the barrier layer rather than a whole connection. Using the analysis, we also discovered that the parameters of the base material and process conditions have an impact on the barrier layer or interface layer, and these are important factors influencing the performance of the junction. It is also the focus of our future research.
4.3 Contribution of Other Modeling Methods to the Study of the Barrier Layer
There are many methods for modeling and analyzing the structure of Josephson junctions, such as MD, first principles, etc. which analyze the barrier layer or junction region in different directions respectively. Cyster et al. [142] constructed Al/AlOX/Al tunnel junction structure by MD, and obtained the amorphous structure of the oxide layer in an iterative manner. Under the influence of two potential (reactive force field & the Streitz and Mintmire potential), the formation and closure of holes in oxide layer were dynamically observed. The density drops in the interfacial layer and rises in the oxide. The method of determining the thickness of the oxide layer by the position of the outermost oxygen atom layerput forward when distinguishing the interface boundary, and its rationality is proved in density analysis. In terms of potential energy selection, the self-limiting behavior of reactive force field was consistent with that observed in the experiment by comparing the density distribution and charge distribution of the two potential energies. This team combined first-principles with MD to conduct a multi-dimension alanalysis on the reproducibility and drift of circuit parameters in the Josephson junction, and found that the change of the local atomic structure in the junction affects the uniformity of the current [132]. The I–V curve (shown in Fig. 8d) and the influence curve of oxide morphology with resistance area (shown in Fig. 8e and 8f) among them both explained the effects of the atomic structure of various stoichiometric ratios, densities, and charge density distributions on the resistance value from various levels. To correct and reduce the time complexity of modeling, Mei et al. [143,144] modified the charge transfer ionic and embedded atom method potential and added damped shifted force in order to obtain the potential energy that can reasonably describe the interaction between atoms in each phase elemental material of the interface system and the interaction between atoms on both sides of the interface through molecular dynamics. Building the model for determining adhesion required the use of Lammps software [143,145]. The Lammps software was used to build the model of calculating the adhesion function for three termination modes and three kinds of packing modes, determining the most likely interface system [144,145]. Based on this analysis, the layered structure of the interface was analyzed, and its atomic distribution characteristics were obtained. The analysis of PDF interface layer structure features and the research on interface charge distribution characteristics provided reference value for studying the structural characteristics of the boundary layer by MD method.
The Josephson junction or other device structure dynamic evolution can be simulated using MD methods, so there are many applications for this technique. However, the choice of potential energy in model building still has a lot of room for improvement, and molecular dynamics only approximate molecular motion in aspects like reaction time, where it is impossible to match real-world conditions. While the production of alumina takes minutes, molecular dynamics reactions take place over a picosecond time scale (ps). First-principles [146], ab initio calculation [147], and other superconducting device studies appear to have greater advantages in contrast, and some algorithms integrate various theories to maximize the effect of the model authenticity. DuBois et al. [125]’s atomic structure model of the Josephson junction was created by fusing molecular mechanics, conventional modeling, and ab initio computation. As a function of density and stoichiometry, the stability of the barrier and the structure are taken into account and compared to empirically measured characteristics. On the one hand, the superiority of the ab initio computations is shown. However, complicated mathematics is avoided. In order to confirm the impact of various empirical potentials on the model, Laurens et al. [148] compared the framework of four empirical potentials ranging from a few atoms to 12 nm particle size. They combined this analysis with DFT analysis of the AlOX configuration structure, crystal phase, and energy at various sizes. Ness et al. [127] revealed how supercurrent decays exponentially with thickness and identified two defects (exchange splitting and significant dispersion of quasiparticle velocity and transverse momentum) by studying the role of thickness, magnetization and crystal orientation in the ferromagnets mechanism. DFT and Bogoliubov-de Gennes models were combined to optimize the material composition of the magnetic Josephson junction and superconducting magnetic spin valve.
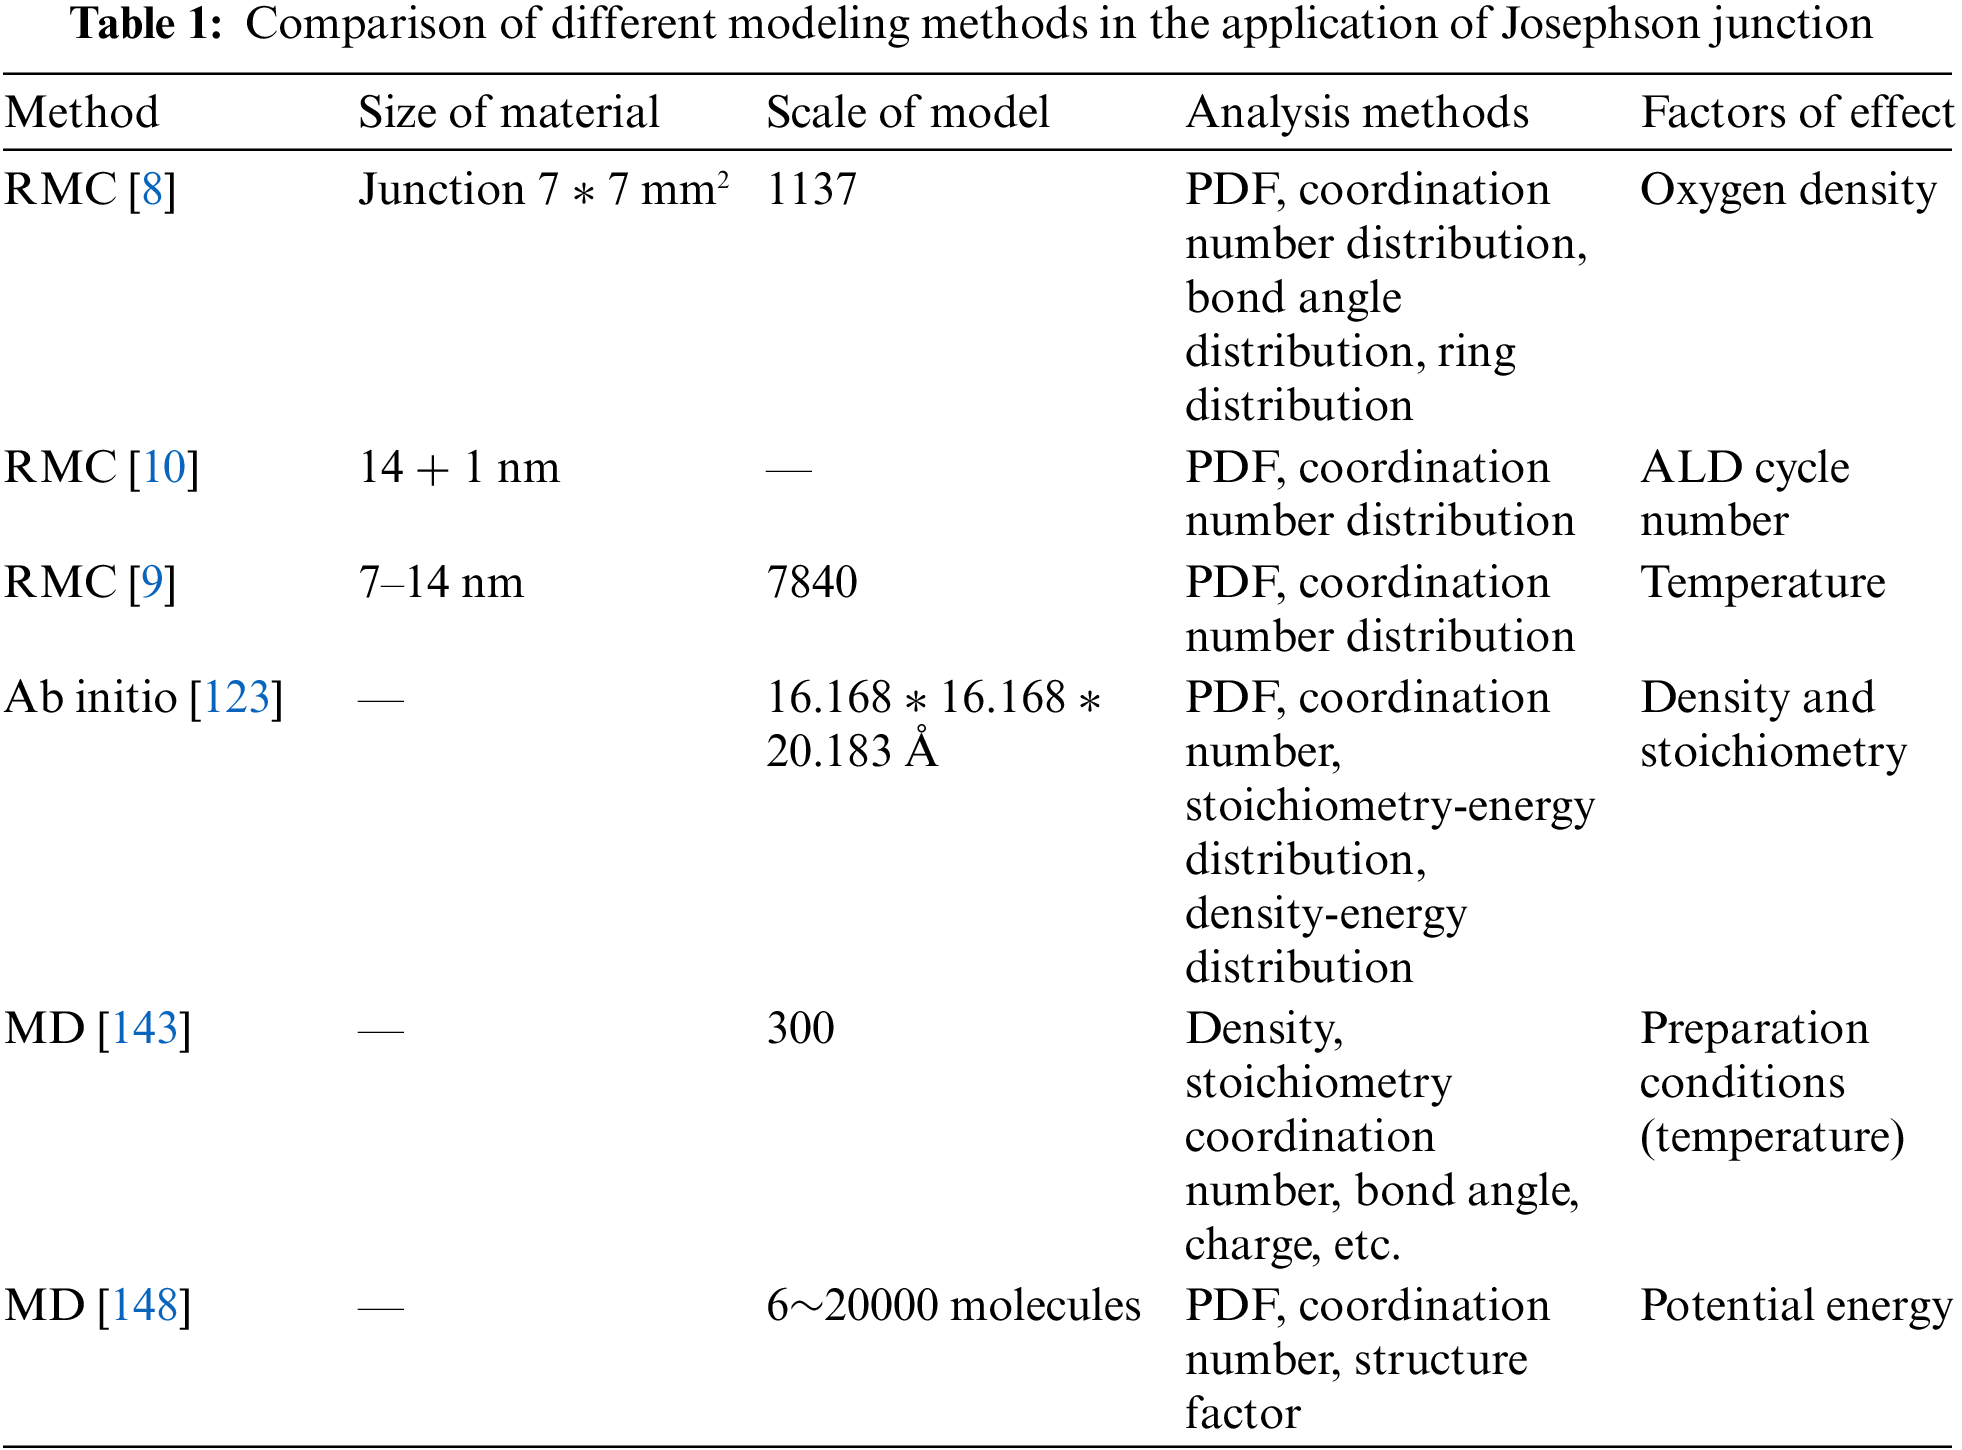
Table 1 compares the model size, analytical tools, and elements influencing the Josephson junction barrier layer structure using various modeling techniques. It is clear that RMC and experiment are strongly associated, and the effect factors are more focused on how preparation circumstances affect the junction’s structure and functionality, which is tightly related to the actual process parameters. There is a gap in our knowledge of Josephson junction because the full-size structure has not yet been completely reconstructed at the atomic level. RMC should resort to other modeling approaches that are more thorough and complete in their analysis of Josephson junctions while studying structures.
The performance of superconducting computers is significantly impacted by the Josephson junction barrier’s construction. Different process factors have an impact on the structure, and they also have an impact on the morphology and distinctive information of the junction. These data contain junction structure. Hence it is crucial to investigate how characterisation techniques affect junction structure and even performance. Currently, the major goals of junction characterization and analysis are to identify structural flaws and the impact of environmental factors on the barrier structure. In order to create atomic-level structures that are consistent with the natural form, RMC carefully combines experimental data, which has promising applications in the research of Josephson junction barrier structure.
RMC is still a new and dynamic tool despite having been developed for almost 30 years. The development of RMC is constrained when characterization methods are unable to accurately mimic the structural properties of experimental samples because of its substantial reliance on experimental data. The benefits of RMC modeling tools will become more obvious, and more academics will use them in growing domains as a result of the increased precision of various characterisation methods, the diversification of analytic methods, and the richness of file types incorporated in RMC.
A typical example is the use of superconducting quantum technology. The efficiency of the Josephson junction, a key element of superconducting quantum computers, is directly correlated with the caliber of the quantum bits.
The development of superconducting quantum devices has also been pushed forward by junction research. However, it is discovered from the analysis of this work that there have not been many studies on the junction’s structure utilizing a modeling tool like RMC. This is particularly true when characterisation data is combined with electrical, thermal, magnetic, structural, and other performance factors. The setting of technological circumstances is further guided by structural modeling of full-scale junctions, numerous analysis techniques, and the enhancement of junction performance, resulting in simulation analysis results that have real-world application. Simulating large-scale Josephson junctions and even devices is difficult at the same time since it affects both the performance of computers with billions of atoms and the way algorithms can produce basic structures.
In summary, this article examines the development and use of the RMC algorithm, identifies its flaws, and then uses those flaws to address the issue at the Josephson junction. It is expected to catalyze the further development of superconducting quantum computers and offers a special framework for their development. The characterization technique with the RMC algorithm is summarized in the aspects of the Josephson junction modeling and analysis, which shows that complete modeling technology is an efficient way to dig the Josephson junction performance. Experiments can also be based on simulation results, and the RMC modeling tool depends on complete and reliable experimental data. This is a process of reciprocal promotion and a positive feedback loop. With advancements in characterization techniques, computer simulation capabilities, optimization of simulation software algorithms, and analytic techniques, it is anticipated that RMC will support superconducting quantum machine research and development to a greater extent.
Funding Statement: This paper is supported by the Major Science and Technology Projects of Henan Province under Grant No. 221100210400.
Conflicts of Interest: The authors declare that they have no conflicts of interest to report regarding the present study.
References
1. Basko, D. M., Pfeiffer, F., Adamus, P., Holzmann, M., Hekking, F. W. J. (2020). Superconductor-insulator transition in Josephson junction chains by quantum Monte Carlo calculations. Physics Review B, 101(2), 024518. https://doi.org/10.1103/PhysRevB.101.024518 [Google Scholar] [CrossRef]
2. He, K. Y., Geng, X., Huang, R. T., Liu, J. S., Chen, W. (2021). Quantum computation and simulation with superconducting qubits. Chinese Physcis B, 30(8), 080304. https://doi.org/10.1088/1674-1056/ac16cf [Google Scholar] [CrossRef]
3. Fritz, S., Radtke, L., Schneider, R., Luysberg, M., Weides, M. et al. (2019). Structural and nanochemical properties of AlOx layers in Al/AlOx/Al-layer systems for Josephson junctions. Physical Review Materials, 3(11), 114805. https://doi.org/10.1103/PhysRevMaterials.3.114805 [Google Scholar] [CrossRef]
4. Fritz, S., Radtke, L., Schneider, R., Weides, M., Gerthsen, D. (2019). Optimization of Al/AlOx/Al-layer systems for Josephson junctions from a microstructure point of view. Journal of Applied Physics, 125(16), 165301. https://doi.org/10.1063/1.5089871 [Google Scholar] [CrossRef]
5. Chen, H. J., Xue, H., Li, S. X., Wang, Z. (2019). A method of determining microwave dissipation of Josephson junctions with non-linear frequency response. Acta Physica Sinica, 668(11), 118501. https://doi.org/10.7498/aps.68.20190167 [Google Scholar] [CrossRef]
6. Cao, W. H., Li, J. J., Wang, L. R., Zhong, Y., Zhong, Q. (2020). Quadruple-stacked Nb/NbxSi1–x/Nb Josephson junctions for large-scale array application. Chinese Physics B, 29(6), 067404. https://doi.org/10.1088/1674-1056/ab90e3 [Google Scholar] [CrossRef]
7. Kim, C. E., Ray, K. G., Lordi, V. (2020). A density-functional theory study of the Al/AlOx/Al tunnel junction. Journal of Applied Physics, 128(15), 155102. https://doi.org/10.1063/5.0020292 [Google Scholar] [CrossRef]
8. Zeng, L., Tran, D. T., Tai, C. W., Svensson, G., Olsson, E. (2016). Atomic structure and oxygen deficiency of the ultrathin aluminium oxide barrier in Al/AlOx/Al Josephson junctions. Scientific Report, 6, 29679. https://doi.org/10.1038/srep29679 [Google Scholar] [PubMed] [CrossRef]
9. Jasim, A. M., He, X., Xing, Y., White, T. A., Young, M. J. (2021). Cryo-ePDF: Overcoming electron beam damage to study the local atomic structure of amorphous ALD aluminum oxide thin films within a TEM. ACS Omega, 6(13), 8989–9000. https://doi.org/10.1021/acsomega.0c06124 [Google Scholar] [PubMed] [CrossRef]
10. Young, M. J., Bedford, N. M., Yanguas-gil, A., Letourneau, S., Coile, M. et al. (2020). Probing the atomic-scale structure of amorphous aluminum oxide grown by atomic layer deposition. ACS Applied Materials & Interface, 12(20), 22804–22814. https://doi.org/10.1021/acsami.0c01905 [Google Scholar] [PubMed] [CrossRef]
11. Zhang, K., Li, M., Liu, Q., Yu, H. F., Yu, Y. (2017). Bridge-free fabrication process for Al/AlOx/Al Josephson junctions. Chinese Physics B, 26(7), 078501. https://doi.org/10.1088/1674-1056/26/7/078501 [Google Scholar] [CrossRef]
12. Zeng, L. J., Nik, S., Greibe, T., Krantz, P., Wilson, C. M. et al. (2015). Direct observation of the thickness distribution of ultra thinAlOx barriers in Al/AlOx/Al Josephson junctions. Journal of Physics D: Applied Physics, 48(39), 395308. https://doi.org/10.1088/0022-3727/48/39/395308 [Google Scholar] [CrossRef]
13. Qin, W., Szpunar, J., Umakoshi, Y. (2011). Electron or ion irradiation-induced phase-change mechanism between amorphous and crystalline state. Acta Materialia, 59(5), 2221–2228. https://doi.org/10.1016/j.actamat.2010.12.025 [Google Scholar] [CrossRef]
14. Mcgreevy, R. L., Pusztai, L. (1988). Reverse Monte Carlo simulation: A new technique for the determination of disordered structures. Molecular Simulation, 1(6), 359–367. https://doi.org/10.1080/08927028808080958 [Google Scholar] [CrossRef]
15. McGreevy, R. L. (2001). Reverse Monte Carlo modelling. Journal of Physics: Condensed Matter, 13(46), R877–R913. https://doi.org/10.1088/0953-8984/13/46/201 [Google Scholar] [CrossRef]
16. Harada, M., Ikegami, R., Kumara, L. S. R., Kohara, S., Sakata, O. (2019). Reverse Monte Carlo modeling for local structures of noble metal nanoparticles using high-energy XRD and EXAFS. RSC Advances, 9(51), 29511–29521. https://doi.org/10.1039/c9ra06519a [Google Scholar] [PubMed] [CrossRef]
17. Krayzman, V., Levin, I. (2012). Reverse Monte Carlo refinements of nanoscale atomic correlations using powder and single-crystal diffraction data. Journal of Applied Crystallography, 45(1), 106–112. https://doi.org/10.1107/S0021889812000398 [Google Scholar] [CrossRef]
18. Ellersdorfer, P., Petersen, T. C., Opletal, G., Bedford, N. (2021). Extracting nanoscale structures from experimental and synthetic data with reverse Monte Carlo. Nano Futures, 5(2), 022502. https://doi.org/10.1088/2399-1984/ac087b [Google Scholar] [CrossRef]
19. Keen, D. A., Mcgreevy, R. L. (1990). Structural modelling of glasses using reverse Monte Carlo simulation. Nature, 344(6265), 423–425. https://doi.org/10.1038/344423a0 [Google Scholar] [CrossRef]
20. McGreevy, R. L. (1995). RMC: Progress, problems and prospects. Nuclear Instruments and Methods in Physics Research Section A: Accelerators, Spectrometers, Detectors and Associated Equipment, 354(1), 1–16. https://doi.org/10.1016/0168-9002(94)00926-0 [Google Scholar] [CrossRef]
21. McGreevy, R. L. (1997). 6-Reverse Monte Carlo methods for structural modelling. Computer Modeling in Inorganic Crystallography, 151–184. https://doi.org/10.1016/B978-012164135-1/50007-1 [Google Scholar] [CrossRef]
22. https://www.szfki.hu/~nphys/rmc++/rmca_3_14.pdf [Google Scholar]
23. Tucker, M. G., Keen, D. A., Dove, M. T., Goodwin, A. L., Hui, Q. (2007). RMCProfile: Reverse Monte Carlo for polycrystalline materials. Journal of Physics: Condensed Matter, 19(33), 335218. https://doi.org/10.1088/0953-8984/19/33/335218 [Google Scholar] [PubMed] [CrossRef]
24. Nield, V. M. (1995). SXD single crystal diffuse scattering—more than just a pretty picture. Nuclear Instruments and Methods in Physics Research Section A: Accelerators, Spectrometers, Detectors and Associated Equipment, 354(1), 30–37. https://doi.org/10.1016/0168-9002(94)00935-X [Google Scholar] [CrossRef]
25. Mellergård, A., McGreevy, R. L. (2000). Recent developments of the RMCPOW method for structural modelling. Chemical Physics, 261(1–2), 267–274. https://doi.org/10.1016/S0301-0104(00)00232-9 [Google Scholar] [CrossRef]
26. Gereben, O., Pusztai, L. (2021). RMC_POT: A computer code for reverse monte carlo modeling the structure of disordered systems containing molecules of arbitrary complexity. Journal of Computational Chemistry, 33(29), 2285–2291. https://doi.org/10.1002/jcc.23058 [Google Scholar] [PubMed] [CrossRef]
27. Howe, M. A., McGreevy, R. L., Pusztai, L., Borzs, I. (1993). Determination of three body correlations in simple liquids by RMC modelling of diffraction data. II. Elemental liquids. Physics and Chemistry of Liquids, 25(4), 205–241. https://doi.org/10.1080/00319109308030363 [Google Scholar] [CrossRef]
28. Cicco, D. A. (2020). X-ray absorption spectroscopy investigations of disordered matter. Radiation Physics and Chemistry, 175, 108077. https://doi.org/10.1016/j.radphyschem.2018.11.031 [Google Scholar] [CrossRef]
29. Ziane, M., Habchi, M., Derouiche, A., Mesli, S. M., Benzouine, F. et al. (2017). Determination of the structural properties of the aqueous electrolyte LiCl6H2O at the supercooled state using the Reverse Monte Carlo (RMC) simulation. IOP Conference Series: Materials Science and Engineering, 186(1), 012010. https://doi.org/10.1088/1757-899X/186/1/012010 [Google Scholar] [CrossRef]
30. Wicks, J. D., McGreevy, R. L., Börjesson, L. (1997). A network problem: Modelling alkali-silicate glasses with RMC. Phase Transitions, 61(1–4), 195–213. https://doi.org/10.1080/01411599708223737 [Google Scholar] [CrossRef]
31. Proffen, T. (1997). Analysis of the diffuse neutron and X-ray scattering of stabilised zirconia using the reverse-Monte-Carlo method. Physica B: Condensed Matter, 241–243, 281–288. https://doi.org/10.1016/S0921-4526(97)00568-1 [Google Scholar] [CrossRef]
32. Swenson, J., McGreevy, R. L., Börjesson, L., Wicks, J. D. (1998). Relations between structure and conductivity in fast ion conducting glasses. Solid State Lonics, 105(1–4), 55–65. https://doi.org/10.1016/S0167-2738(97)00449-9 [Google Scholar] [CrossRef]
33. Guignard, M., Cormier, L. (2008). Environments of Mg and Al in MgO-Al2O3-SiO2 glasses: A study coupling neutron and X-ray diffraction and Reverse Monte Carlo modeling. Chemical Geology, 256(3–4), 111–118. https://doi.org/10.1016/j.chemgeo.2008.06.008 [Google Scholar] [CrossRef]
34. Guo, G. Q., Yang, L., Zhang, G. Q. (2011). Atomic structure of Zr48Cu45Al7 bulk metallic glass. Acta PhysicaSinica, 60(1), 016103. https://doi.org/10.7498/aps.60.016103 [Google Scholar] [CrossRef]
35. Jóvári, P., Kaban, I., Escher, B., Song, K. K., Eckert, J. et al. (2017). Structure of glassy Cu47.5Zr47.5Ag5 investigated with neutron diffraction with isotopic substitution, X-ray diffraction, EXAFS and reverse Monte Carlo simulation. Journal of Non-Crystalline Solids, 459, 99–102. https://doi.org/10.1016/j.jnoncrysol.2016.12.037 [Google Scholar] [CrossRef]
36. Pethes, I., Nazabal, V., Chahal, R., Bureau, B., Kaban, I. et al. (2019). The structure of near stoichiometric Ge-Ga-Sb-S glasses: A reverse Monte Carlo study. Journal of Non-Crystalline Solids, 505, 340–346. https://doi.org/10.1016/j.jnoncrysol.2018.11.009 [Google Scholar] [CrossRef]
37. Tóth, G., Baranyai, A. (2000). Direct determination of two-body potentials from measured pair structures. Journal of Molecular Liquids, 85(1–2), 3–9. https://doi.org/10.1016/S0167-7322(99)00159-2 [Google Scholar] [CrossRef]
38. Keen, D. A. (1997). Refining disordered structural models using reverse monte carlo methods: Application to vitreous silica. Phase Transitions, 61(1–4), 109–124. https://doi.org/10.1080/01411599708223732 [Google Scholar] [CrossRef]
39. Tucker, M. G., Dove, M. T., Keen, D. A. (2000). Simultaneous analysis of changes in long-range and short-range structural order at the displacive phase transition in quartz. Journal of Physics: Condensed Matter, 12(48), L723–L730. https://doi.org/10.1088/0953-8984/12/48/101 [Google Scholar] [CrossRef]
40. Swenson, J., Adams, S. (2021). Application of the bond valence method to reverse Monte Carlo produced structural models of superionic glasses. Physical Review B, 64(2), 024204. https://doi.org/10.1103/PhysRevB.64.024204 [Google Scholar] [CrossRef]
41. Sánchez-Gil, V., Noya, E. G., Lomba, E. (2014). Reverse Monte Carlo modeling in confined systems. The Journal of Chemical Physics, 140(2), 024504. https://doi.org/10.1063/1.4861042 [Google Scholar] [PubMed] [CrossRef]
42. Pethes, I., Pusztai, L. (2017). Reverse Monte Carlo modeling of liquid water with the explicit use of the SPC/E interatomic potential. The Journal of Chemical Physics, 146(6), 064506. https://doi.org/10.1063/1.4975987 [Google Scholar] [PubMed] [CrossRef]
43. Eremenko, M., Krayzman, V., Gagin, A., Levin, I. (2017). Advancing reverse Monte Carlo structure refinements to the nanoscale. Journal of Applied Crystallography, 50(6), 1561–1570. https://doi.org/10.1107/S1600576717013140 [Google Scholar] [CrossRef]
44. Evrard, G., Pusztai, L. (2005). Reverse Monte Carlo modelling of the structure of disordered materials with RMC++: A new implementation of the algorithm in C++. Journal of Physics: Condensed Matter, 17(5), S1–S13. https://doi.org/10.1088/0953-8984/17/5/001 [Google Scholar] [CrossRef]
45. Gereben, O., Pusztai, L. (2015). Understanding the structure of molecular liquids via combinations of molecular dynamics simulations and Reverse Monte Carlo modeling: Handling information deficiency. Journal of Non-Crystalline Solids, 407, 213–219. https://doi.org/10.1016/j.jnoncrysol.2014.08.047 [Google Scholar] [CrossRef]
46. Gereben, O., Jóvári, P., Temleitner, L., Pusztai, L. (2007). A new version of the RMC++ Reverse Monte Carlo programme, aimed at investigating the structure of covalent glasses. Journal of Optoelectronics and Advanced Materials, 9(10), 3021–3027. [Google Scholar]
47. Laver, M., Forgan, E. M. (2008). Uncovering flux line correlations in superconductors by Reverse Monte Carlo refinement of neutron scattering data. Physical Review Letters, 100(10), 107001. https://doi.org/10.1103/PhysRevLett.100.107001 [Google Scholar] [PubMed] [CrossRef]
48. Petersen, T. C., Opletal, G., Liu, A. C. Y. (2016). Hybrid Reverse Monte Carlo and electron phase contrast image simulations of amorphous silicon with and without paracrystals. Molecular Simulation, 42(6–7), 522–530. https://doi.org/10.1080/08927022.2015.1067810 [Google Scholar] [CrossRef]
49. Maldonis, J. J., Hwang, J., Voyles, P. M. (2017). FEMSIM + HRMC: Simulation of and structural refinement using fluctuation electron microscopy for amorphous materials. Computer Physics Communications, 213, 217–222. https://doi.org/10.1016/j.cpc.2016.12.006 [Google Scholar] [CrossRef]
50. Petersen, T., Yarovsky, I., Snook, I., Mcculloch, D. G., Opletal, G. (2003). Structural analysis of carbonaceous solids using an adapted reverse Monte Carlo algorithm. Carbon, 42, 2403–2411. https://doi.org/10.1016/S0008-6223(03)00296-3 [Google Scholar] [CrossRef]
51. Tóth, G., Baranyai, A. (1997). Conceptual and technical improvement of the reverse Monte Carlo algorithm. The Journal of Chemical Physics, 107(18), 7402. https://doi.org/10.1063/1.474978 [Google Scholar] [CrossRef]
52. Tóth, G., Baranyai, A. (2001). Molecular dynamics analog of the reverse Monte Carlo method. The Journal of Chemical Physics, 114(5), 2027. https://doi.org/10.1063/1.1337044 [Google Scholar] [CrossRef]
53. Kohara, S., Shiga, M., Onodera, Y., Masai, H., Hirata, A. et al. (2021). Relationship between diffraction peak, network topology, and amorphous-forming ability in silicon and silica. Scientific Reports, 11(1), 22180. https://doi.org/10.1038/s41598-021-00965-5 [Google Scholar] [PubMed] [CrossRef]
54. Timoshenko, J. (2015). Reverse Monte Carlo modelling of structural and thermal disorder in crystalline materials (Ph.D. Thesis). University of Latvia Faculty of Physics and Mathematics, Riga. [Google Scholar]
55. Ishida, M., Ohba, T. (2020). Hybrid Reverse molecular dynamics simulation as new approach to determination of carbon nanostructure of carbon blacks. Scientific Reports, 10(1), 3622. https://doi.org/10.1038/s41598-020-60372-0 [Google Scholar] [PubMed] [CrossRef]
56. Jain, S. K., Pellenq, R. J. M., Pikunic, J. P. (2006). Molecular modeling of porous carbons using the hybrid Reverse Monte Carlo method. Langmuir, 22(24), 9942–9948. https://doi.org/10.1021/la053402z [Google Scholar] [PubMed] [CrossRef]
57. Hashimoto, H., Onodera, Y., Tahara, S., Kohara, S., Yazawa, K. et al. (2022). Structure of alumina glass. Scientific Reports, 12(1), 516. https://doi.org/10.1038/s41598-021-04455-6 [Google Scholar] [PubMed] [CrossRef]
58. Opletal, G., Petersen, T. C., Snook, L. K., Russo, S. P. (2013). HRMC: Hybrid Reverse Monte Carlo method with silicon and carbon potentials. Computer Physics Communications, 178(10), 777–787. https://doi.org/10.1016/j.cpc.2007.12.007 [Google Scholar] [CrossRef]
59. Li, B., Wang, S., Tian, Z. Q., Yao, G., Li, H. et al. (2022). Understanding the CO2/CH4/N2 separation performance of nanoporous amorphous N-doped carbon combined hybrid Monte Carlo with machine learning. Advanced Theory and Simulations, 5(1), 1–8. https://doi.org/10.1002/adts.202100378 [Google Scholar] [CrossRef]
60. Verdel, N., Tanevski, J., Dzeroski, S., Majaron, B. (2019). Hybrid technique for characterization of human skin using a combined machine learning and inverse Monte Carlo approach. European Conference on Biomedical Optics, 11075_54. Munich, Germany. [Google Scholar]
61. Aoun, B. (2016). Fullrmc, a rigid body reverse monte carlo modeling package enabled with machine learning and artificial intelligence. Journal of Computational Chemistry, 37(12), 1102–1111. https://doi.org/10.1002/jcc.24304 [Google Scholar] [PubMed] [CrossRef]
62. Sánchez-Gil, V., Noya, E. G. G., Lomba, E. C. (2017). NRMC—A GPU code for—Reverse Monte Carlo modeling of fluids in confined media. Computer Physics Communications, 217, 198–203. https://doi.org/10.1016/j.cpc.2017.04.008 [Google Scholar] [CrossRef]
63. Yang, L. H., Tőkési, K., Tóth, J., Da, B., Ding, Z. J. (2020). Revision of optical property of silicon by a reverse Monte Carlo analysis of reflection electron energy loss spectroscopy spectra. Journal of Physics: Conference Series, 1412. https://doi.org/10.1088/1742-6596/1412/20/202026 [Google Scholar] [CrossRef]
64. Wei, L. Y., Qi, H., Niu, Z., Ren, Y. (2019). Reverse Monte Carlo coupled with Runge-Kutta ray tracing method for radiative heat transfer in graded-index media. Infrared Physics & Technology, 99, 5–13. https://doi.org/10.1016/j.infrared.2019.04.002 [Google Scholar] [CrossRef]
65. Haita, K. (2019). Particle-mesh two-dimensional pattern reverse Monte Carlo analysis on filled-gels during uniaxial expansion. Soft Matter, 15(36), 7237–7249. https://doi.org/10.1039/C9SM01060 [Google Scholar] [CrossRef]
66. Sans, M., Hafi, M. E., Eymet, V., Forest, V., Fournier, R. et al. (2021). Null-collision meshless Monte Carlo—A new reverse Monte Carlo algorithm designed for laser-source emission in absorbing/scattering inhomogeneous media. Journal of Quantitative Spectroscopy and Radiative Transfer, 271(1), 107725. https://doi.org/10.1016/j.jqsrt.2021.107725 [Google Scholar] [CrossRef]
67. Norberg, S. T., Tuckerm, M. G., Hull, S. (2009). Bond valence sum: A new soft chemical constraint for RMCProfile. Journal of Applied Crystallography, 42(2), 179–184. https://doi.org/10.1107/S0021889809004981 [Google Scholar] [CrossRef]
68. Gonon, M. (2021). Case studies in the X-ray diffraction of ceramics. Encyclopedia of Materials: Technical Ceramics and Glasses, 1, 560–577. https://doi.org/10.1016/B978-0-12-818542-1.00005-9 [Google Scholar] [CrossRef]
69. Zhang, Z., Li, W. H., Yang, Y. N., Zhou, Z. W., Cao, W. (2022). Performance of active carbon supported monatomic platinum catalytic materials in electrolytic hydrogen evolution. Modern Chemical Industry, 42(1), 95–99. https://doi.org/10.16606/j.cnki.issn0253-4320.2022.01.020 [Google Scholar] [CrossRef]
70. Huang, Y., Zhao, Z., Wang, C., Fan, H., Yang, Y. et al. (2019). Conductive metallic filaments dominate in hybrid perovskite-based memory devices. Science China Materials, 62(9), 1323–1331. https://doi.org/10.1007/s40843-019-9433-4 [Google Scholar] [CrossRef]
71. Hagita, K., Tominaga, T., Sone, T. (2018). Large-scale reverse Monte Carlo analysis for the morphologies of silica nanoparticles in end-modified rubbers based on ultra-small-angle X-ray scattering data. Polymer, 135, 219–229. https://doi.org/10.1016/j.polymer.2017.12.018 [Google Scholar] [CrossRef]
72. Ding, Q., Bei, H. B., Zhao, X. B., Zhang, Z. (2020). Application of the transmission electron microscopy on Ni-base single crystal superalloys: Progress and perspective. Journal of Chinese Electron Microscopy, 39(5), 586–602. https://doi.org/10.3969/j.issn.1000-6281.2020.05.018 [Google Scholar] [CrossRef]
73. Zhou, Q., Zheng, B., Li, Z. Y., Feng, J. W. (2017). Preparation and electrochemical performance of nanoporous NiMoO_4 by De-alloying. Chinese Journal of Inorganic Chemistry, 8, 1416–1422. [Google Scholar]
74. Steinczinger, Z., Jóvári, P., Pusztai, L. (2017). Comparison of interatomic potentials of water via structure factors reconstructed from simulated partial radial distribution functions: A reverse Monte Carlo based approach. Physica Scripta, 92(1), 014001. https://doi.org/10.1088/0031-8949/92/1/014001 [Google Scholar] [CrossRef]
75. Itoh, K. (2017). Structure of Se-Te glasses studied using neutron, X-ray diffraction and reverse Monte Carlo modelling. Journal of Solid State Chemistry, 246, 372–378. https://doi.org/10.1016/j.jssc.2016.12.012 [Google Scholar] [CrossRef]
76. Proffen, T., Welberry, T. R. (1998). The analysis of single crystal diffuse scattering using the Reverse Monte Carlo method: Advantages and problems. https://doi.org/10.48550/arXiv.cond-mat/9805001 [Google Scholar] [CrossRef]
77. Khanna, A., Fábián, M., Hirdesh, Krishina, P. S. R., Benmore, C. J. et al. (2018). Structural analysis of WO3-TeO2Su glasses by neutron, high energy X-ray diffraction, reverse Monte Carlo simulations and XANES. Journal of Non-Crystalline Solids, 495(4), 27–34. https://doi.org/10.1016/j.jnoncrysol.2018.05.003 [Google Scholar] [CrossRef]
78. Genix, A. C., Bocharova, V., Carroll, B., Lehmann, M., Saito, T. et al. (2019). Understanding the static interfacial polymer layer by exploring the dispersion states of nanocomposites. ACS Applied Materials &Interfaces, 11(19), 17863–17872. https://doi.org/10.1021/acsami.9b04553 [Google Scholar] [PubMed] [CrossRef]
79. Timm, L., Tucker, M. G., Keen, D. A., Thygesen, P. M. M., Saines, P. J. (2016). Exploration of antiferromagnetic CoO and NiO using reverse Monte Carlo total neutron scattering refinements. Physica Scripta, 91(11), 1–8. https://doi.org/10.1088/0031-8949/91/11/114004 [Google Scholar] [CrossRef]
80. Gorlin, Y., Kaiser, B. L., Benck, J. D., Gul, S., Webb, S. M. et al. (2013). In situ X-ray absorption spectroscopy investigation of a bifunctional manganese oxide catalyst with high activity for electrochemical water oxidation and oxygen reduction. Journal of the American Chemical Society, 135(23), 8525–8534. https://doi.org/10.1021/ja3104632 [Google Scholar] [PubMed] [CrossRef]
81. Adam, H. C., Huw, R. M., Timothy, I. H., Helen, Y. P., Matthew, G. T. et al. (2017). Reverse Monte Carlo studies of CeO2 using neutron and synchrotron radiation techniques. Physica Scripta, 92(3), 034002. https://doi.org/10.1088/1402-4896/aa547f [Google Scholar] [CrossRef]
82. Nataf, L., Baudelet, F., Polian, A., Jonane, I., Anspoks, A. et al. (2020). Recent progress in high pressure X-ray absorption spectroscopy studies at the ODE beamline. High Pressure Research, 40(1), 82–87. https://doi.org/10.1080/08957959.2019.1700979 [Google Scholar] [CrossRef]
83. Trigub, A. L., Trofimov, N. D., Tagirov, B. R., Nickolsky, M. S., Kvashnina, K. O. (2020). Probing the local atomic structure of In and Cu in sphalerite by XAS spectroscopy enhanced by Reverse Monte Carlo algorithm. Minerals, 10(10), 841. https://doi.org/10.3390/min10100841 [Google Scholar] [CrossRef]
84. Filipponi, A. (2001). EXAFS for liquids. Journal of Physics: Condensed Matter, 13(7), R23–R60. https://doi.org/10.1088/0953-8984/13/7/201 [Google Scholar] [CrossRef]
85. Cicco, A. D., Iesari, F., Trapananti, A., D’Angelo, P., Filipponi, A. (2018). Structure and atomic correlations in molecular systems probed by XAS reverse Monte Carlo refinement. The Journal of Chemical Physics, 148(9), 094307. https://doi.org/10.1063/1.5013660 [Google Scholar] [CrossRef]
86. Feng, E. (2021). Preparation and properties of Cr2Te3 materials by chemical vapor deposition (Master Thesis). Xidian University, China. [Google Scholar]
87. Xu, Z. (2021). Preparation of two-dimensional WS_2 and MoS_2 and study of organic/inorganic heterostructure optoelectronic devices (Master Thesis). Hangzhou Dianzi University, China. [Google Scholar]
88. Xu, Q. (2016). Study on optical properties of two-dimensional materials by near-field optical microscopy (Master Thesis). Soochow University, China. [Google Scholar]
89. Wang, D. (2019). Preparation and electrical properties of SnS_2 single crystal and thin films as novel two-dimensional materials (Master Thesis). Zhejiang University, China. [Google Scholar]
90. Zhou, Y., Zhang, L. C., Zhou, L., Wan, Y. Q. (2021). The numerical analysis method of CNTs dispersion in CNTs/polymer composite by light microscopy. New Chemical Materials, 6, 155+159. https://doi.org/10.19817/j.cnki.issn1006-3536.2021.06.034 [Google Scholar] [CrossRef]
91. Guo, Z. (2021). Surface-assisted crystallization behavior of polymer films (Ph.D. Thesis). Beijing University of Chemical Technology, China. [Google Scholar]
92. Shao, S. (2018). Preparation and field emission properties of graphene/Zno composite films (Master Thesis). University of Electronic Science and Technology of China, China. [Google Scholar]
93. Jiang, Y., Dong, K., Lu, Y., Liu, J., Chen, B. et al. (2020). Bimetallic oxide coupled with B-doped graphene as highly efficient electrocatalyst for oxygen evolution reaction. Science China Materials, 63(7), 1247–1256. https://doi.org/10.1007/s40843-020-1282-6 [Google Scholar] [CrossRef]
94. Kunitake, M., Uemura, S. (2020). Construction and scanning probe microscopy imaging of two-dimensional nanomaterials. Chemistry Letters, 49(5), 65–573. https://doi.org/10.1246/cl.200080 [Google Scholar] [CrossRef]
95. Zhang, J., Peng, W., Jin, J. H., Yang, S. L., Yu, A. et al. (2022). Artificial solid-electrolyte interface facilitating uniform Zn deposition by promoting chemical adsorption. Science China Materials, 65(3), 663–674. https://doi.org/10.1007/s40843-021-1778-2 [Google Scholar] [CrossRef]
96. Afanas’ev, M. S., Kiselev, D. A., Levashov, S. A., Sivov, A. A., Chucheva, G. V. (2020). Creation and investigation of metal—dielectric-semiconductor structures based on ferroelectric films. Physics of the Solid State, 62(3), 480–484. https://doi.org/10.1134/S1063783420030026 [Google Scholar] [CrossRef]
97. Kopanski, J. J., Walker, T. R. (2008). Scanning probe microscopy for dielectric and metal characterization. ECS Transactions, 13(2), 169–175. https://doi.org/10.1149/1.2908629 [Google Scholar] [CrossRef]
98. Liu, Y., Kang, R., Feng, X., Luo, T., Li, Y. et al. (2022). Microstructure and mechanical properties of extruded Mg-Alloy Mg-Al-Ca-Mn-Zn. Chinese Journal of Materials Research, 36(1), 13–20. https://doi.org/10.11901/1005.3093.2021.249 [Google Scholar] [CrossRef]
99. Wang, Q. (2012). Study on superconductivity of two-dimensional Pb and FeSe thin films by heteroepitaxy (Ph.D. Thesis). Tsinghua University, China. [Google Scholar]
100. Yu, X. D., Wei, Z. X., Zhao, Z., Xie, T., Liu, C. et al. (2021). Surface morphology and electronic structure in stoichiometric superconductor CaKFe4As4 probed by scanning tunneling microscopy/spectroscopy. Science China Physics, Mechanics & Astronomy, 64(12), 127411. https://doi.org/10.1007/s11433-021-1804-7 [Google Scholar] [CrossRef]
101. Chen, Y., Pan, Y., Du, W. Q., Lin, X. M. (2022). Application of metal-organic framework in electrode materials of lithium-ion batteries. Materials Research and Application, 16(1), 68–80. [Google Scholar]
102. Zhang, J., Chen, Z., Liu, C., Zhao, J., Liu, S. et al. (2020). Hierarchical iridium-based multimetallic alloy with double-core-shell architecture for efficient overall water splitting. Science China Materials, 63(2), 249–257. https://doi.org/10.1007/s40843-019-1176-6 [Google Scholar] [CrossRef]
103. Liu, Y., Deng, J., Xie, S., Wang, Z., Dai, H. (2016). Catalytic removal of volatile organic compounds using ordered porous transition metal oxide and supported noble metal catalysts. Chinese Journal of Catalysis, 37(8), 1193–1205. https://doi.org/10.1016/S1872-2067(16)62457-9 [Google Scholar] [CrossRef]
104. Sun, Y., Zeng, K. (2020). Characterization of catalysts by advanced scanning probe microscopy and spectroscopy. ChemCatChem, 12(14), 3601–3620. https://doi.org/10.1002/cctc.201901877 [Google Scholar] [CrossRef]
105. Huang, S. Y., Shi, R. C., Li, Y. H., Wu, M., Li, N. et al. (2021). Recent progress of vibration electron energy-loss spectroscopy in scanning transmission electron microscope. Chinese Journal of Vacuum Science and Technology, 41(3), 213–224. https://doi.org/10.13922/j.cnki.cjvst.202102016 [Google Scholar] [CrossRef]
106. Ma, L. H., Meng, S., Jiang, R. H., Chen, G. X. J., Meng, Q. et al. (2021). The atomic-scale interface structure and evolution of α-Fe2O3. Journal of Chinese Electron Microscopy Society, 5, 529–536. https://doi.org/10.3969/j.issn.1000-6281.2021.05.007 [Google Scholar] [CrossRef]
107. Xu, H., Da, B., Mao, S. F., Tőkési, K., Ding, Z. et al. (2015). Extended reverse Monte Carlo method for extracting optical constants of thin Ni film from reflection electron energy-loss spectroscopy. Journal of Physics: Conference Series, 635(6), 062016. https://doi.org/10.1088/1742-6596/635/6/062016 [Google Scholar] [CrossRef]
108. Babilas, R., Mariola, K. G., Burian, A., Temleitner, L. (2016). A short-range ordering in soft magnetic Fe-based metallic glasses studied by Mössbauer spectroscopy and Reverse Monte Carlo method. Journal of Magnetism and Magnetic Materials, 406(6), 171–178. https://doi.org/10.1016/j.jmmm.2015.12.068 [Google Scholar] [CrossRef]
109. Sajiki, G., Benino, Y., Oki, C., Ohara, K., Okano, H. et al. (2017). Structural analyses and reverse Monte Carlo modeling of niobium oxide amorphous film prepared by sputtering method. Journal of the Ceramic Society of Japan, 125(10), 760–765. https://doi.org/10.2109/jcersj2.17053 [Google Scholar] [CrossRef]
110. Sun, J. (2021). Abnormal ferroelectric properties and local structure of nano-oxides (Ph.D. Thesis). University of Science and Technology Beijing, China. [Google Scholar]
111. Waseda, Y., Sugiyama, K., Kawamata, T. (2018). Nanometer-sized crystalline clusters of IGZO films determined from the grazing incidence X-ray scattering and anomalous X-ray scattering data combined with Reverse Monte Carlo simulations. Materials Transactions, 59(11), 1691–1700. https://doi.org/10.2320/matertrans.M2018231 [Google Scholar] [CrossRef]
112. Guarcello, C., Bergeret, F. S. (2021). Thermal noise effects on the magnetization switching of a ferromagnetic anomalous Josephson junction. Chaos, Solitons & Fractals, 142, 110384. https://doi.org/10.1016/j.chaos.2020.110384 [Google Scholar] [CrossRef]
113. Guarcello, C., Filatrella, G., Spagnolo, B., Pierro, V., Valenti, D. (2020). Voltage drop across Josephson junctions for Lévy noise detection. Physical Review Research, 2(4), 043332. https://doi.org/10.1103/PhysRevResearch.2.043332 [Google Scholar] [CrossRef]
114. Guarcello, C., Valenti, D., Spagnolo, B., Pierro, V., Filatrella, G. (2019). Josephson-based threshold detector for Lévy-distributed current fluctuations. Physical Review Applied, 11(2), 044078. https://doi.org/10.1103/PhysRevApplied.11.044078 [Google Scholar] [CrossRef]
115. Kurter, C., Murray, C. E., Gordon, R. T., Wymore, B. B., Sandberg, M. et al. (2022). Quasiparticle tunneling as a probe of Josephson junction barrier and capacitor material in superconducting qubits. npj Quantum Information, 8(1), 31. https://doi.org/10.1038/s41534-022-00542-2 [Google Scholar] [CrossRef]
116. Rossignol, B., Kloss, T., Waintal, X. (2019). Role of quasiparticles in an electric circuit with Josephson junctions. Physical Review Letters, 122(20), 207702. https://doi.org/10.1103/PhysRevLett.122.207702 [Google Scholar] [PubMed] [CrossRef]
117. Gong, M., Wang, S. Y., Zha, C., Chen, M. C., Huang, H. L. et al. (2021). Quantum walks on a programmable two-dimensional 62-qubit superconducting processor. Science, 372(6545), 948–952. https://doi.org/10.1126/science.abg7812 [Google Scholar] [PubMed] [CrossRef]
118. ICV and Guangzihe Institute (2022). Global Quantum Computing Industry Development Report, China. [Google Scholar]
119. IBM (2021). IBM unveils breakthrough 127-qubit quantum processor. https://newsroom.ibm.com/2021-11-16-IBM-Unveils-Breakthrough-127-Qubit-Quantum-Processor [Google Scholar]
120. Wang, T. (2018). Application of superconducting qubit and adiabatic fast shortcut in quantum simulation and quantum gates (Ph.D. Thesis). Zhejiang University, China. [Google Scholar]
121. Shan, Z., Gou, X. L., Sun, H. H., Wang, S. Y., Shang, J. D. et al. (2022). O-terminated interface for thickness-insensitive transport properties of aluminum oxide Josephson junctions. Scientific Reports, 12, 11856. https://doi.org/10.1038/s41598-022-16126-1 [Google Scholar] [PubMed] [CrossRef]
122. He, H. R., Wang, W. L., Liu, F. D., Yuan, B. Z., Shan, Z. (2022). Suppressing the dielectric loss in superconducting qubits through useful geometry design. Entropy, 24(7), 952. https://doi.org/10.3390/e24070952 [Google Scholar] [PubMed] [CrossRef]
123. Yuan, B. Z., Wang, W. L., Liu, F. D., He, H. R., Shan, Z. (2022). Comparison of lumped oscillator model and energy participation ratio methods in designing two-dimensional superconducting quantum chips. Entropy, 24(6), 792. https://doi.org/10.3390/e24060792 [Google Scholar] [PubMed] [CrossRef]
124. Saravanan, L., Senthilvelan, T. (2015). Investigations on the hot workability characteristics and deformation mechanisms of aluminium alloy-Al2O3 nanocomposite. Materials & Design, 79(1), 6–14. https://doi.org/10.1016/j.matdes.2015.04.024 [Google Scholar] [CrossRef]
125. DuBois, T. C., Cyster, M. J., Opletal, G., Russo, S. P., Cole, J. H. (2016). Constructing ab initio models of ultra-thin Al-AlOx-Al barriers. Molecular Simulation, 42, 542–548. https://doi.org/10.1080/08927022.2015.1068941 [Google Scholar] [CrossRef]
126. Hoex, B., Schmidt, J., Bock, R., Altematt, P. P., Sanden, M. C. M. et al. (2007). Excellent passivation of highly doped p-type Si surfaces by the negative-charge dielectric Al2O3. Applied Physics Letters, 91(11), 112107. https://doi.org/10.1063/1.2784168 [Google Scholar] [CrossRef]
127. Ness, H., Sadovskyy, I. A., Antipov, A. E., Schilfgaarde, M. V., Lutchyn, R. M. (2022). Supercurrent decay in ballistic magnetic Josephson junctions. npj Computational Materials, 8, 23. https://doi.org/10.1038/s41524-021-00694-3 [Google Scholar] [CrossRef]
128. Li, L. Y., Hu, X., Jiang, F., Jing, W., Guo, C. et al. (2017). Atomic-scale analysis of cation ordering in reduced calcium titanate. Scientific Reports, 7, 14977. https://doi.org/10.1038/s41598-017-15120-2 [Google Scholar] [PubMed] [CrossRef]
129. Xiong, D. X., Wang, J. B., Lu, L., Zhao, D. S., Sun, Y. F. (2012). Phason strained quasicrystalline and crystalline precipitates in Zr-Al-Ni-Cu-Nb bulk metallic glass matrix composites. Journal of Non-Crystalline Solids, 358(22), 3007–3011. https://doi.org/10.1016/j.jnoncrysol.2012.07.031 [Google Scholar] [CrossRef]
130. Tao, H. Y., Liu, Y., Zhao, D. S., Nie, X., Zhou, J. P. et al. (2012). Electron microscopic investigation on the microstructure of an Mg-AI-Zn-Y alloy. Journal of Chinese Electron Microscopy Society, 3, 211–216. https://doi.org/10.3969/j.issn.1000-6281.2012.03.003 [Google Scholar] [CrossRef]
131. Luo, E. Z., Wong, S. K., Pakhomov, A. B., Xu, J. B., Wilson, I. H. et al. (2001). Tunneling current and thickness inhomogeneities of ultrathin aluminum oxide films in magnetic tunneling junctions. Journal of Applied Physics, 90(10), 5202. https://doi.org/10.1063/1.1412586 [Google Scholar] [CrossRef]
132. Cyster, M. J., Smith, J. S., Vaitkus, J. A., Vogt, N., Russo, S. P. et al. (2020). Effect of atomic structure on the electrical response of aluminum oxide tunnel junctions. Physical Review Research, 2(1), 013110. https://doi.org/10.1103/PhysRevResearch.2.013110 [Google Scholar] [CrossRef]
133. Zeng, L. J., Krantz, P., Nik, S., Delsing, P., Olsson, E. (2015). The atomic details of the interfacial interaction between the bottom electrode of Al/AlOx/Al Josephson junctions and HF-treated Si substrates. Journal of Applied Physics, 117(16), 163915. https://doi.org/10.1063/1.4919224 [Google Scholar] [CrossRef]
134. Martinis, J. M., Cooper, K. B., McDermott, R., Steffen, M., Ansmann, M. et al. (2005). Decoherence in Josephson qubits from dielectric loss. Physical Review Letters, 95(21), 210503. https://doi.org/10.1103/PhysRevLett.95.210503 [Google Scholar] [PubMed] [CrossRef]
135. Zhang, J. X., Li, H., Zhang, J., Song, X. G., Bian, X. F. (2009). Reverse Monte Carlo study on structural order in liquid and glassy AlFe alloys. Chinese Physics B, 18(11), 4949–4954. https://doi.org/10.1088/1674-1056/18/11/055 [Google Scholar] [CrossRef]
136. McSkimming, B. M., Alexander, A., Samuels, M. H. (2017). Metamorphic growth of relaxed single crystalline aluminum on silicon (111). Journal of Vacuum Science & Technology A, 35(2), 021401. https://doi.org/10.1116/1.4971200 [Google Scholar] [CrossRef]
137. Horio, Y. H. Y. (1999). Different growth modes of Al on Si(111)7 ×7 and Si(111)
138. Yamada, I., Inokawa, H., Takagi, T. (1984). Epitaxial growth of Al on Si(111) and Si(100) by ionized-cluster beam. Journal of Applied Physics, 56(10), 2746. https://doi.org/10.1063/1.333805 [Google Scholar] [CrossRef]
139. Reichel, F., Jeurgens, L. P. H., Richter, G., Mittemeijer, E. J. (2008). Amorphous versus crystalline state for ultrathin Al2O3 overgrowths on Al substrates. Journal of Applied Physics, 103(9), 93515. https://doi.org/10.1063/1.2913505 [Google Scholar] [CrossRef]
140. Bloch, L., Kauffmann, Y., Pokroy, B. (2014). Size effect on the short range order and the crystallization of nanosized amorphous alumina. Crystal Growth & Design, 14(8), 3983–3989. https://doi.org/10.1021/cg500580c [Google Scholar] [CrossRef]
141. Mu, L. (2009). Thiessen polygon. International Encyclopedia of Human Geography, 231–236. https://doi.org/10.1016/B978-008044910-4.00545-9 [Google Scholar] [CrossRef]
142. Cyster, M. J., Smith, J. S., Vogt, N., Opletal, G., Russo, S. P. et al. (2021). Simulating the fabrication of aluminium oxide tunnel junctions. npj Quantum Information, 7(1), 12. https://doi.org/10.1038/s41534-020-00360-4 [Google Scholar] [CrossRef]
143. Mei, H. (2015). Molecular dynamics study on microstructure of aluminum/alumina interface (Ph.D. Thesis). Wuhan University of Technology, China. [Google Scholar]
144. Mei, H., Liu, Q., Liu, L., Lai, X., She, W. et al. (2015). Molecular dynamics simulations of the microstructure of the aluminum/alumina interfacial layer. Applied Surface Science, 324(6), 538–546. https://doi.org/10.1016/j.apsusc.2014.10.138 [Google Scholar] [CrossRef]
145. Han, C. B., Sun, H. H., Hou, C. F., Wang, S. Y., Xu, J. L. et al. (2022). Revealing temperature-dependent noise sources in aluminum oxide Josephson junctions using topological analysis. The Journal of Physical Chemistry C, 126(33), 14297–14304. https://doi.org/10.1021/acs.jpcc.2c04056 [Google Scholar] [CrossRef]
146. Siegel, D. J., Hector Jr, L. G., Adams, J. B. (2002). Adhesion, atomic structure, and bonding at the Al(111)/α-Al2O3(0001) interface: A first principles study. Physical Review B, 65(8), 085415. https://doi.org/10.1103/PhysRevB.65.085415 [Google Scholar] [CrossRef]
147. Aykol, M., Persson, K. A. (2018). Oxidation protection with amorphous surface oxides: Thermodynamic insights from Ab initio simulations on aluminum. ACS Applied Materials & Interfaces, 10(3), 3039–3045. https://doi.org/10.1021/acsami.7b14868 [Google Scholar] [PubMed] [CrossRef]
148. Laurens, G., Amans, D., Lam, J., Allouche, A. R. (2020). Comparison of aluminum oxide empirical potentials from cluster to nanoparticle. Physical Review B, 101(4), 045427. https://doi.org/10.1103/PhysRevB.101.045427 [Google Scholar] [CrossRef]
Cite This Article
 Copyright © 2023 The Author(s). Published by Tech Science Press.
This work is licensed under a Creative Commons Attribution 4.0 International License , which permits unrestricted use, distribution, and reproduction in any medium, provided the original work is properly cited.
 Downloads
 Citation Tools