
 Submit a Paper
 Propose a Special lssue
 Open Access
ARTICLE

Horizontal Well Interference Performance and Water Injection Huff and Puff Effect on Well Groups with Complex Fracture Networks: A Numerical Study
1
State Key Laboratory of Shale Oil and Gas Enrichment Mechanisms and Effective Development, SINOPEC, Beijing, 100101, China
2
Sinopec Key Laboratory of Shale Oil/Gas Exploration and Production Technology, SINOPEC, Beijing, 100083, China
3
Key Laboratory of Tectonics and Petroleum Resources, Ministry of Education, China University of Geosciences, Wuhan, 430074,
China
* Corresponding Author: Lei Wang. Email:
(This article belongs to the Special Issue: Modeling of Fluids Flow in Unconventional Reservoirs)
Computer Modeling in Engineering & Sciences 2023, 137(3), 2285-2309. https://doi.org/10.32604/cmes.2023.027996
Received 25 November 2022; Accepted 02 March 2023; Issue published 03 August 2023
 View Full Text
 Download PDF
Abstract
Well interference has become a common phenomenon with the increasing scale of horizontal well fracturing. Recent studies on well interference in horizontal wells do not properly reflect the physical model of the postfracturing well groups and the realistic fracturing process of infill wells. Establishing the correspondence between well interference causative factors and manifestations is of great significance for infill well deployment and secondary oil recovery. In this work, we develop a numerical model that considers low velocity non-Darcy seepage in shale reservoirs to study the inter-well interference phenomenon that occurs in the Santanghu field, and construct an explicit hydraulic fracture and complex natural fracture network model with an embedded discrete fracture model, focusing on the effect of fracture network morphology on well interactions. The model also considers a multi-segment wellbore model to accommodate the effect of inter-well crossflow on wellbore tubular flow. The changes in formation pressure and water saturation during fracturing are performed by controlling the injection pressure and water injection rate. The result shows that the shape of the fracture network generated by the infill well with the old well determines the subsequent fluid and oil-increasing performance of the disturbed well. The synergistic production or competitive relationship formed by fractures with different connectivity between the two wells determines the positive and negative effects of the interference. The paper also investigates the adaptation study of water injection huff and puff schemes for well groups with different connectivity, and demonstrated a potential yield increase of up to 10.85% under adaptation injection. This method of identifying well interference based on the production dynamics of affected wells and the subsequent corresponding water injection method provides valuable references for the selection of secondary oil recovery measures.Keywords
Nomenclature
| λ | Threshold pressure gradient, Pa/m |
| μ | Dynamic viscosity, Pa·s |
| k | Permeability, m2 |
| kr | Relative permeability |
| kx | Permeability on x-direction, m2 |
| D | Well diameter, m |
| L | Well segment length, m |
| l | Cell segment length, m |
| B | Formation volume factor |
| Bo,w | Volume factor of oil and water |
| A | Cross-section area of cell units, m2 |
| Aw | Cross-section area of well units, m2 |
| S | Phase saturation |
| Cf | Unit converting factor |
| f | Friction factor |
| vm | Mixture and phase velocity at the outlet of segment, m/s |
| ρ | Mass density, kg/m3 |
| p | Pressure, Pa |
| pwell | Pressure at the inlet of the segment, Pa |
| WI | Well index |
| α | Mobility of oil and water |
| θ | Wellbore inclination angle |
| ϕ | Matrix porosity |
With the application of volumetric fracturing technology in oilfield sites, shale oil and gas is becoming an important fossil energy component in the world [1–4]. The complex fracture network formed by hydraulic fracturing has effectively improved fluid seepage conditions in ultra-low permeability reservoirs, making commercial development of shale oil and gas possible [5–7]. However, with the continuous increase of well pattern density in the process of shale oil and gas development, the interaction between horizontal well groups caused by the deployment of infill wells has become an increasingly common phenomenon [8–11], which has a complex impact on the development of new and old wells. At present, there is no mature understanding of the inter-well interference in horizontal wells dominated by fractures. There is also not enough reasonable research on the adaptability of subsequent treatment methods for fracture channeling [12,13]. Summarizing the production dynamics and corresponding water injection methods of multi-well systems under different characteristic fracture networks is relevant for the deployment of infill wells in shale reservoirs [14].
The occurrence of well interference in horizontal wells has been reported in major shale oil producing regions around the world [15]. Compared with well interference in conventional reservoirs, which is simply caused by overlapping drainage areas, the dynamics of horizontal wells under interference have a more complex performance [16–19]. According to the field data, except for the well groups with negative effects caused by interference, there are still some well groups that have increased production from old wells after the occurrence of the interference [20–23]. It is suggested that this complex and specific dynamic can be attributed to the fact that the interaction of adjacent horizontal wells in shale reservoirs is not only influenced by the overlap of pressure drop during the production phase, but that the fracture system formed by the two wells during the child well fracturing process also plays an important role [24–27]. Gupta et al. [28] summarized the causes of well interference in hydraulic fracturing horizontal wells in their review on fracture hits and proposed three forms of communication between sub-wells and parent wells: (a) through the main hydraulic fracturing fractures (generally considered as fracture hit); (b) interference through thin matrix; (c) interconnected by a natural fracture network in stimulated reservoir volume (SRV). On the other hand, Pei et al. [29] and others have demonstrated by geo-mechanical methods that the pressure drop zones generated by old wells can lead to the offset of the fracture network from child wells, making it more likely to form a connected fracture network between wells, and this phenomenon becomes more significant with the decrease of well spacing. Marongiu-Porcu et al. [30] conducted a fracturing simulation based on an unstructured natural fracture network DFN model when studying the fracture propagation problem and obtained that the propagation mechanism of infill wells is affected by complex parameters, in which reservoir pressure, in-situ stress direction angle and natural fracture network distribution will greatly affect the final fracture network shape after fracturing. In summary, the completion of infill wells can lead to the formation of interconnected fracture networks between wells, which will further affect the production performance of infill wells.
In order to investigate the horizontal well interference appropriately, scholars have conducted some research through analytical methods and numerical methods and obtained some achievements. The semi-analytical model proposed by Thompson [31] used the superposition principle in the space-time dimension to study the production performance and pressure response of the parent well, and quantified the changes of flow characteristic parameters in well completion period caused by horizontal well interference. He et al. [32] developed a semi-analytical interference test model for a multi-stage horizontal well, analyzed the non-uniform flow in the wellbore under the interference of infill wells, and summarized the flow state changes and pressure response characteristics during the process. Chen et al. [33] constructed a two-well semi-analytical model with a complex fracture network, obtained the transient pressure solution through nodal analysis and Laplace transform, classified the flow states in different stages of well interference, and explained their corresponding pressure derivative curves. However, analytical and semi-analytical methods have their restriction on the expression of complex fracture networks. On the other side, Tang et al. [34] studied the pros and cons of well interference by numerical methods and analyzed the effect of reservoir geological factors such as formation pressure and porosity on horizontal well production rate. It shows that a pure pressure drop interaction will lead to a decrease in the production rate of the parent well, and the productivity of the parent well will be improved when hydraulic fractures of two wells have lap joints. Yu et al. [35] used a discrete fracture model(DFM) to construct the dynamic response of well pressure under complex fracture hits and studied the inducing mechanism of specific well interference. The influence of fracture properties on the well interference intensity was analyzed by changing the number of connecting fractures and fracture conductivity. In summary, the current research on inter-well interference in horizontal wells still ignores some key issues in the production process, such as the influence of pressure drop zones in the production of parent wells and the influence of water injection in the fracturing process that led to some of the study’s conclusions not being fully credible.
In this study, we used the production data of a shale oil horizontal well group in the Lucaogou Formation of the Santanghu Basin as a reference to study the development performance of horizontal wells with well interference under the influence of different forms of fracture networks. In this paper, the embedded discrete fracture model is used to explicitly characterize the complex fracture network existing in the stimulated zone, and to accurately describe the property differences and morphological differences of hydraulic fracturing main fractures, connected fractures between wells and complex natural fractures. A multi-segment wellbore model is also used to accommodate the complex cross-flow phenomenon in the fracture network system. We present the production characteristic curves of different types of interference affected wells, and provide an analysis of the adaptability of the well row water injection development scheme based on well connectivity, the effectiveness of water injection huff and puff in well row and single well injection was compared. This provides a valuable model reference for the design of fracture completion in infill child wells and the development of subsequent secondary oil recovery schemes.
2.1 Low-Velocity Non-Linear Seepage Flow Model
Most of the known shale reservoirs have a seepage characteristic of medium-to-low porosity and ultra-low permeability, which is determined by the micro-nano scale of the pore throat structure in the matrix [36–38]. The Darcy equation based on ideal permeability needs to be revised to describe the low-velocity non-Darcy flow that occurs in this case.
The typical low-velocity non-Darcy seepage curve is shown in Fig. 1, which can be divided into a non-linear zone and a linear zone, Point-a is the minimum threshold pressure gradient, and Point-c is the boundary point between the two regions. As there is no accurate description of the equation of motion for the non-linear stage, it is generally determined by empirical equations. In this paper, the pseudo-threshold pressure gradient model is adopted: Reversely lengthen the linear stage curve to Point b on the pressure gradient coordinate axis, which is then called the pseudo-threshold pressure, using the b-c segment function relationship to approximate fluid motion in low permeability media.
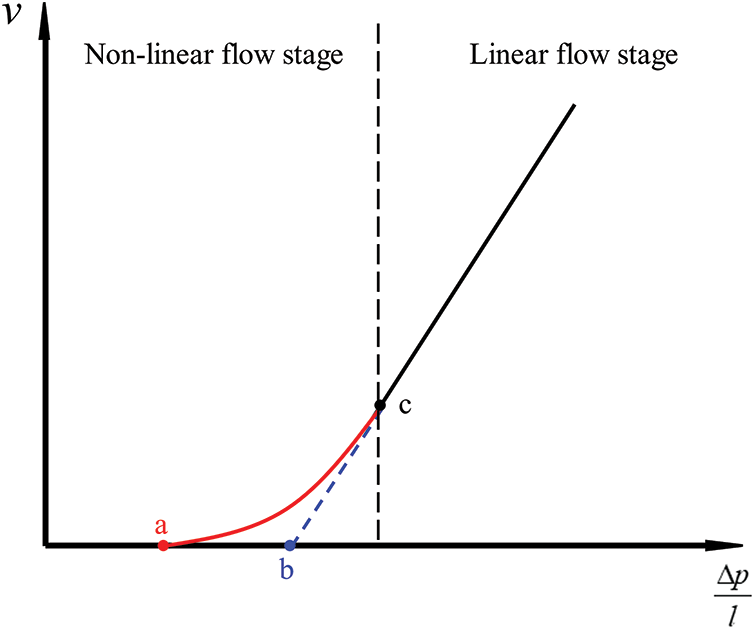
Figure 1: Diagram of the characteristic motion curve of a low-velocity non-Darcy seepage
The equation of motion in three-dimensional space can be written as:
where v is the seepage velocity; k is the permeability of the porous medium; kr is the relative permeability of the components; μ is the fluid viscosity; λ= (λx, λy, λz) is the pseudo-threshold pressure,The values of the three components are different in a heterogeneous medium. This expression can be given as:
where A is the cross-section area of cell units; l is the cell segment length. Discrete oil-water two-phase flow model using the finite volume method, in which Ω is the set of all grids,
Expression (3) can be written as followed using dispersion theorem:
2.2 Embedded Discrete Fracture Model
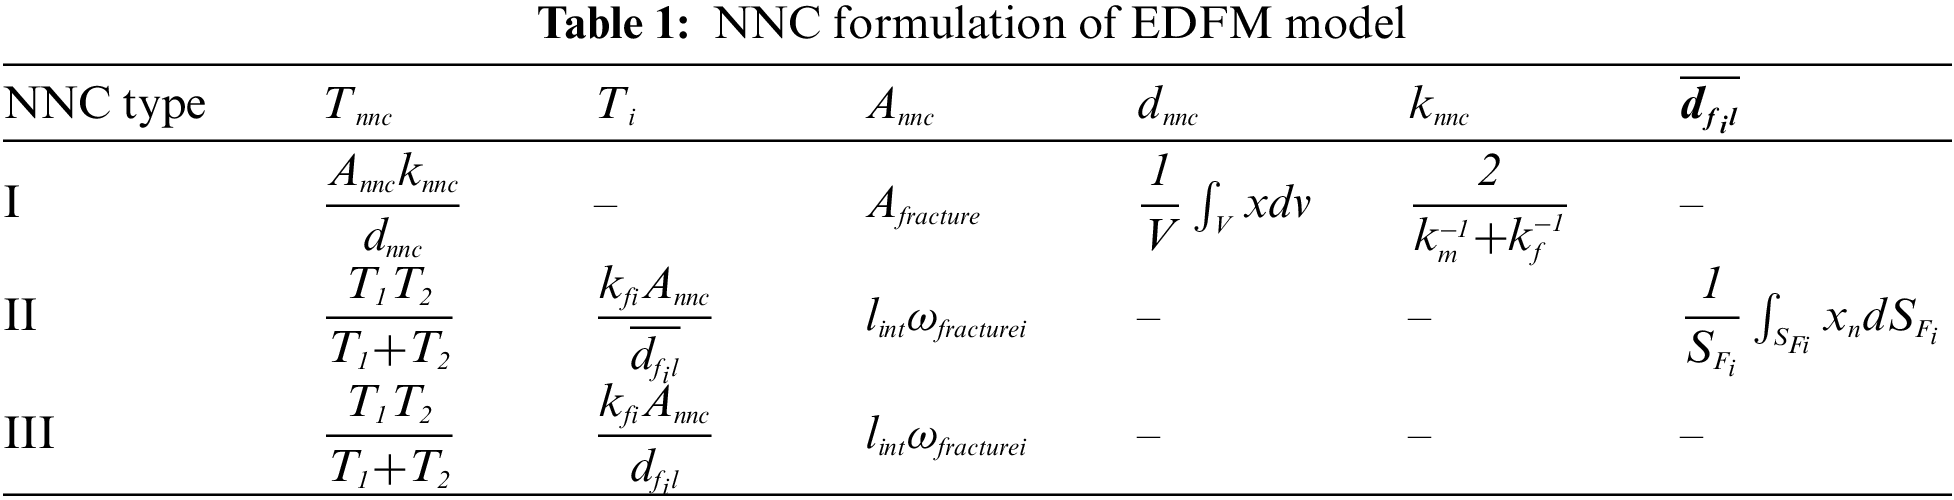
The Embedded Discrete Fracture Model (EDFM), derived from the Discrete Fracture Model (DFM), simplifies the method of describing fractures by treating them as two-dimensional quadrilateral fracture slices while retaining the explicit representation of the geometry and orientation distribution of the formation fractures [39,40]. The fracture is treated as a two-dimensional quadrilateral sheet, and the matrix grid is still discretized by the structured grid, which simplifies the calculation while retaining the non-homogeneous inflow characteristics of the fracture and is suitable for the simulation of large-scale fracture network system [41]. The material exchange relationship between fracture and matrix is established by the Non-Neighboring Connection (NNC) as shown in Fig. 2. The calculation method is based on the form of the fracture-matrix contact, Chai et al. [42] gave the detailed calculation formula of the NNC in each case:
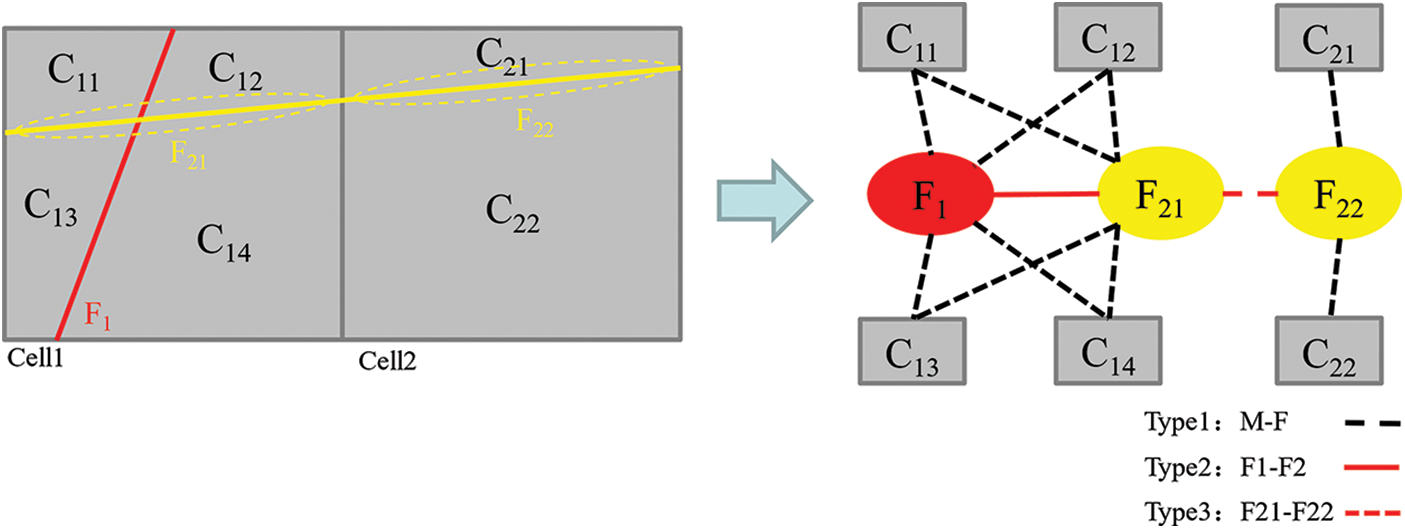
Figure 2: 3 NNC types between matrix system and discrete fractures
where Type 1 represents the NNC between the crack and the matrix, Annc is the area of the fracture sheet in the grid, dnnc is the volume integration of distance from the grid to the fracture surface; Type 2 refers to the contact between two different cracks in the same matrix grid. The characteristic distance needs to be integrated into the fracture segment; Type 3 is the connection type after a fracture is divided by two matrix grids, Tnnc is the half value of the harmonic mean of the fracture conductivity Ti, and the flow model in the presence of the fractures can be constructed by the mass conservation term conductivity coefficient based on the type of NNCs (Table 1).
2.3 Multi-Segment Wellbore Model
The multi-segment wellbore model is used to describe the influence of the flow through lapped fractures in this work. The wellbore is discretized according to the fracturing perforation section to reflect the contribution of different fracturing sections to the oil well production, and the flow characteristics inside the wellbore under the unequal production characteristics of the wellbore perforation grid are described (Fig. 3).
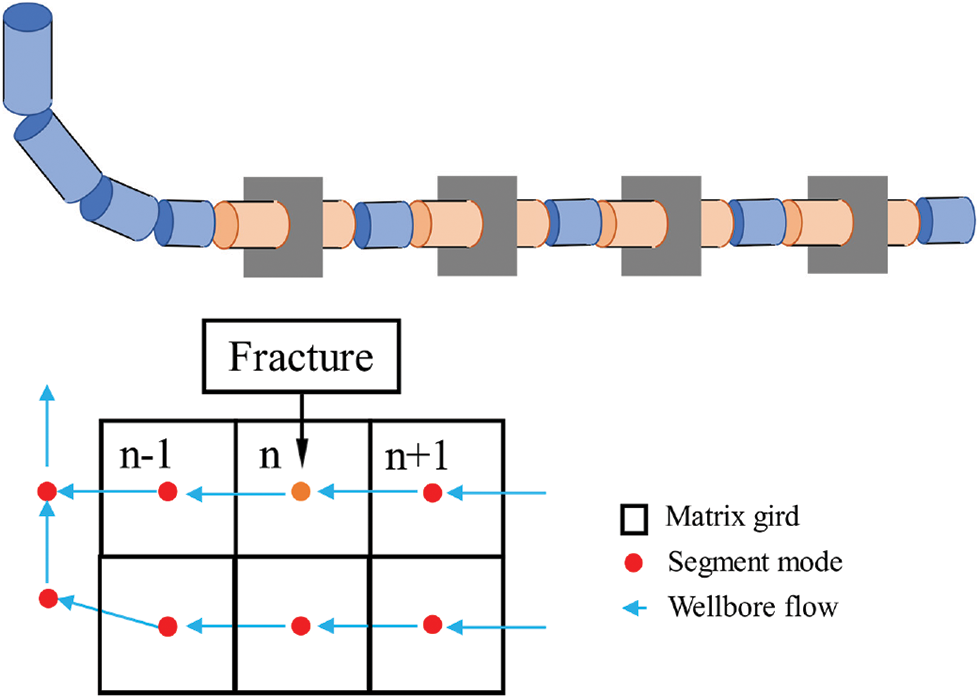
Figure 3: Physical model and node diagram of a multi-segment wellbore
Considering the mass conservation of each component in each well section, the continuity equation for immiscibility between oil and water is:
The nodal mass change term m is equal to the flux term F with the source sink term q, which can be put out as the form followed:
where A is the wellbore cross-sectional area; L is the length of the well segment, vw, vo are the velocities of the water phase, gas phase, and oil phase, respectively, AccmO is the quantity of oil per volume in well segment n in the last time step i-1. We assume a homogeneous flow inside the wellbore, indicating vo = vw. In this example, the gas component term is negligible as there is almost no gaseous hydrocarbon production. The wellbore tubular flow equation mainly involves the initial injection pressure, the kinetic energy conversion term, the frictional loss term and the potential energy conversion term, then according to the fluid Bernoulli equation the pressure loss from segment n and (n−1) can be written as:
where ph,n, pf,n and pa,n are terms representing gravity, friction and acceleration loss, respectively. pa,n can be given as:
pf,n can be calculated by:
and ph,n can be calculated by:
The expression for calculating the source sink term for the perforation wellbore section is as follows:
The shale oil in the Santanghu Basin is mainly volcanic ash deposits, with a gentle structure and a wide range. The physical properties of the reservoir are poor with the permeability generally less than 0.5 mD, the porosity is 8.4% to 19.1% and there are developed fractures and micropores in the formation. It has the characteristics of a typical shale reservoir with high oil saturation, small pore and low permeability. The reservoir temperature is between 50°C and 70°C, which belongs to the low-medium temperature system. The formation pressure is 20.4 MPa, and the pressure coefficient is 0.8 to 1.013, which is a normal pressure system. The density of crude oil is 0.89 g/cm3~0.94 g/cm3, and the viscosity under formation conditions is 58 mPa·s~83 mPa·s which belongs to medium viscosity, high wax condensate reservoirs. Lithology is mainly gray, dark gray tuff, basalt. The oil reservoir has a high oil saturation, mainly between 50% and 90%. The study area is a volcanic shale oil reservoir with a burial depth of 2000 m–3000 m and a thickness of 20–40 m with no significant physical differences between layers. At present, the production of depleted development horizontal wells in the block is decreasing rapidly. In order to increase production and efficiency, the oilfield technical department has adopted measures such as infill drilling and water injection huff and puff, both of which have already carried out pilot tests in the field.
Firstly, a 3D numerical model of well group in the test block is constructed for the well interference phenomenon of infill wells. The model is verified by production history matching. The basic reservoir properties and fracture conductivity parameters used in the model are shown in Table 2. The typical horizontal well J-01 in the target block is selected for history matching. The horizontal section is 1705 m long, and the drilling encountering rate is 91.4%, with 30 stages of perforation, each having 3 clusters. The well model is set according to the above conditions.
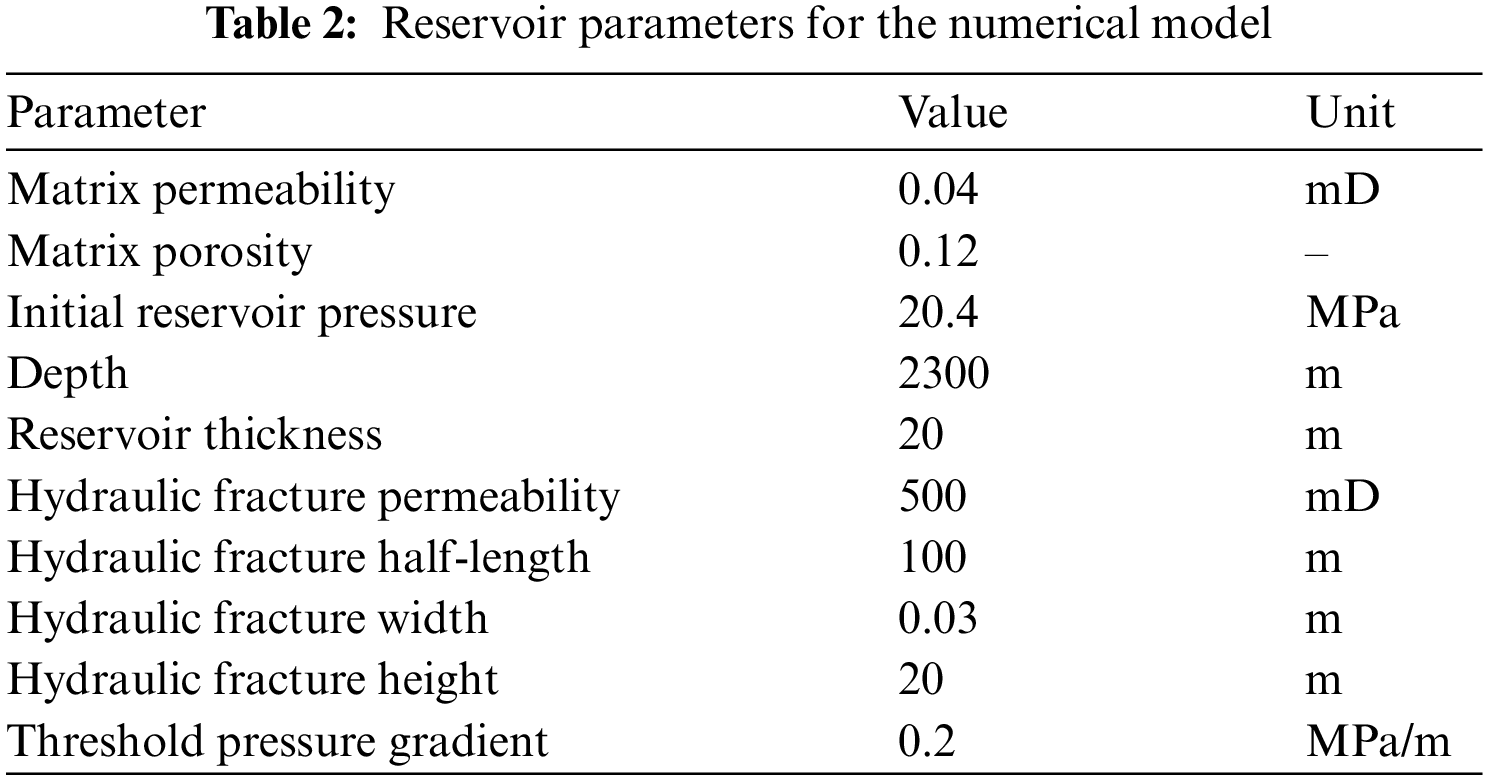
Fig. 4 shows the oil-water relative permeability curve used in the model. Due to the large difference in the oil-water seepage conditions in matrix shale and fractures, two sets of different relative permeability are used to two sets of relative permeability curves are used to reflect the difference in seepage characteristics between the matrix and fractures. The relative permeability curve of oil and water in the matrix refers to the experimental results of conventional hydrophilic shale, while the diagonal relative permeability curve is adopted in fractures. Capillary force curves are obtained from field experiments. The above model parameters are used to conduct the history matching of the typical horizontal well J-01 in the test field. The production history data is from November 2019 to November 2021. We set the liquid rate of the model according to the historical data and compare its daily oil production rate with the record. The comparison between the simulation results of the numerical model and the production data is shown in Fig. 5. It can be considered that the model adopted in this paper is in good agreement with the actual production, and the simulation results have reasonable reference values.
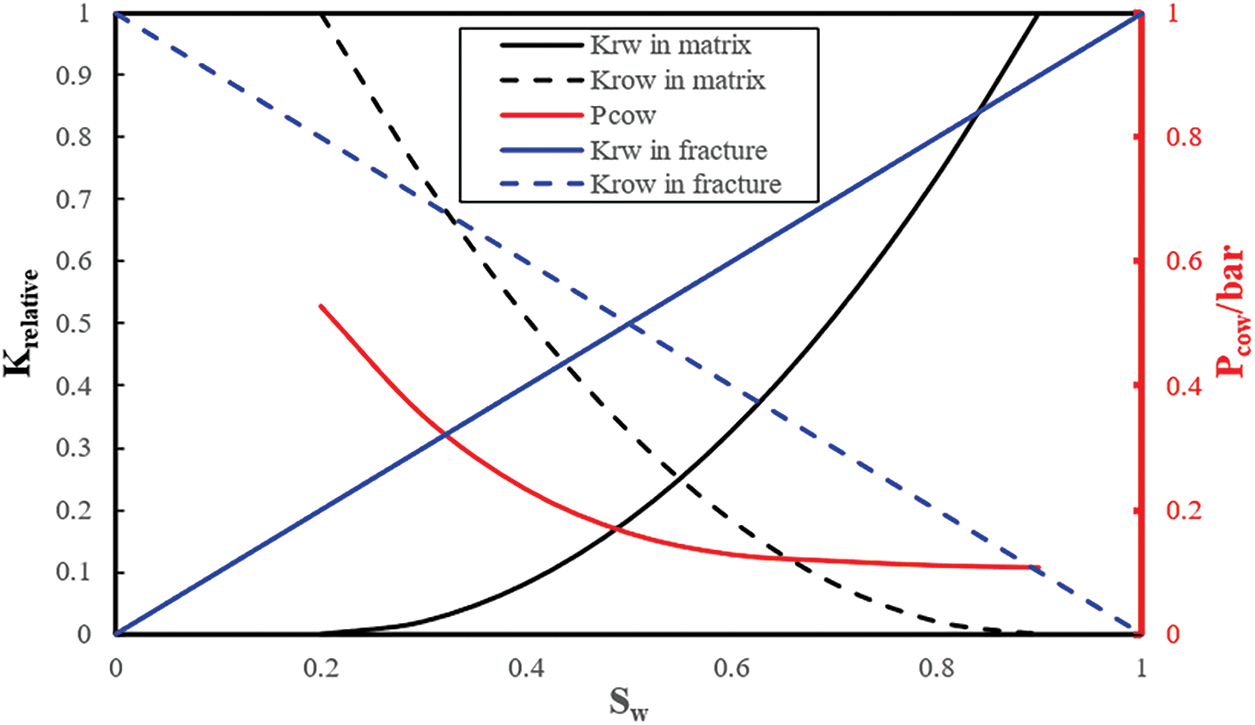
Figure 4: Water-oil relative permeability curve in case model
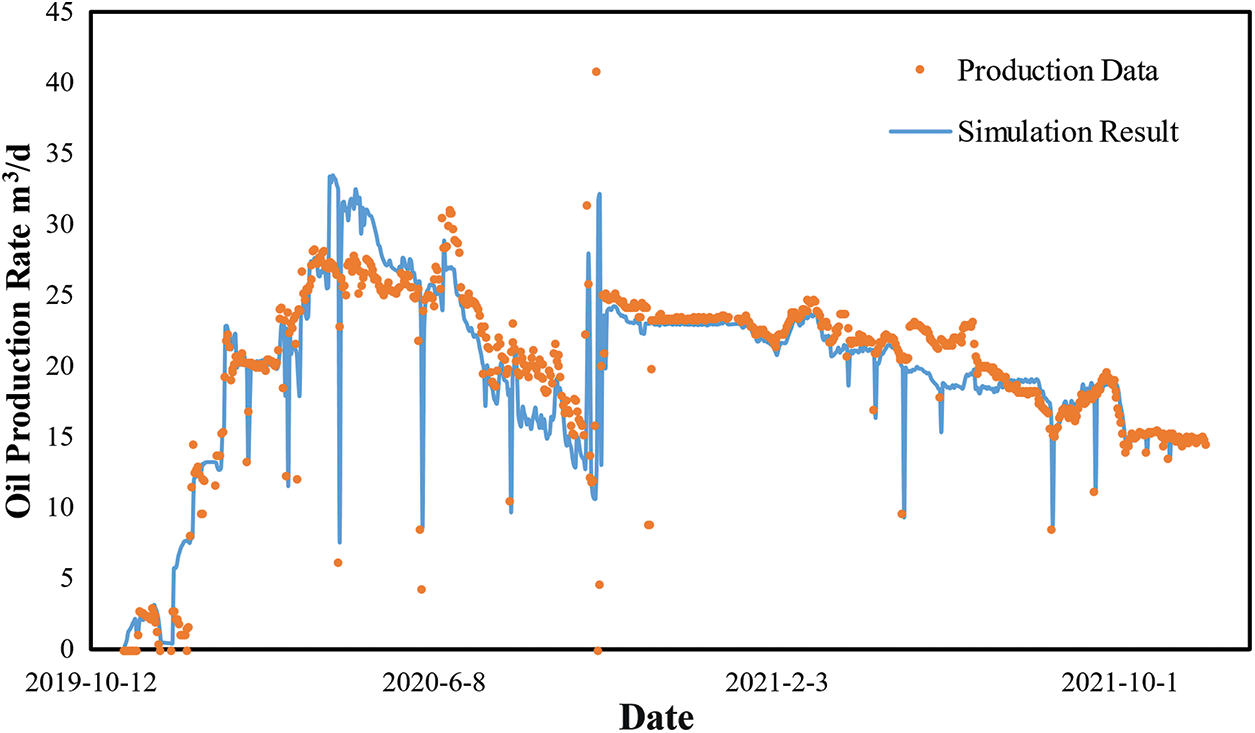
Figure 5: Comparison between simulation results and historical production data
3.2 Case Study: Well Interference Types
In order to determine the influence of different forms of fracture networks formed after infill well fracturing on well interference, 3 typical cases based on the actual operation data of the fracturing perforation section and the related fracture propagation research results are designed. In this study, each case consists of two horizontal wells in a simulated field of 800 m × 500 m, as shown in Fig. 6. Case 1 shows that the fracturing sections of two parallel horizontal wells are designed to be in the same lateral position, and the hydraulic fractures generated by the infill wells face the hydraulic fractures of the parent well directly and have lap joints. Case 2 shows that the design of the fracturing section of the infill well is staggered with the parent well and the two wells form a zipper well pattern, while there is no dominant seepage channel for the two wells to interact directly. Case 3 shows that during the construction of the staggered fracturing section, the new hydraulic fractures expand to the fracture network of the parent well due to the influence of the production pressure drop of it and activate the natural fracture network between wells. This simplified treatment of the activated fractures is shown in Fig. 7. The stimulated fracture system is regarded as a single fracture with a permeability slightly lower than that of the hydraulic fracture. Meanwhile, according to the field microseismic data, a group of natural fractures with an azimuth angle of about 60° are distributed in the ground. Therefore, 4000 random natural fractures with azimuth angles between 55° and 75° are randomly generated in the model by statistical methods. In the three cases, the original well PW (Parent Well) is produced at a constant bottom flow pressure of 5 MPa, and the infill well CW (Child Well) starts after 1000 days. The model adopts the initialization method of restart to simulate the high-pressure SRV area generated after the fracturing operation through constant pressure water injection and then starts production with the same system, where the total simulation time is 2000 d.
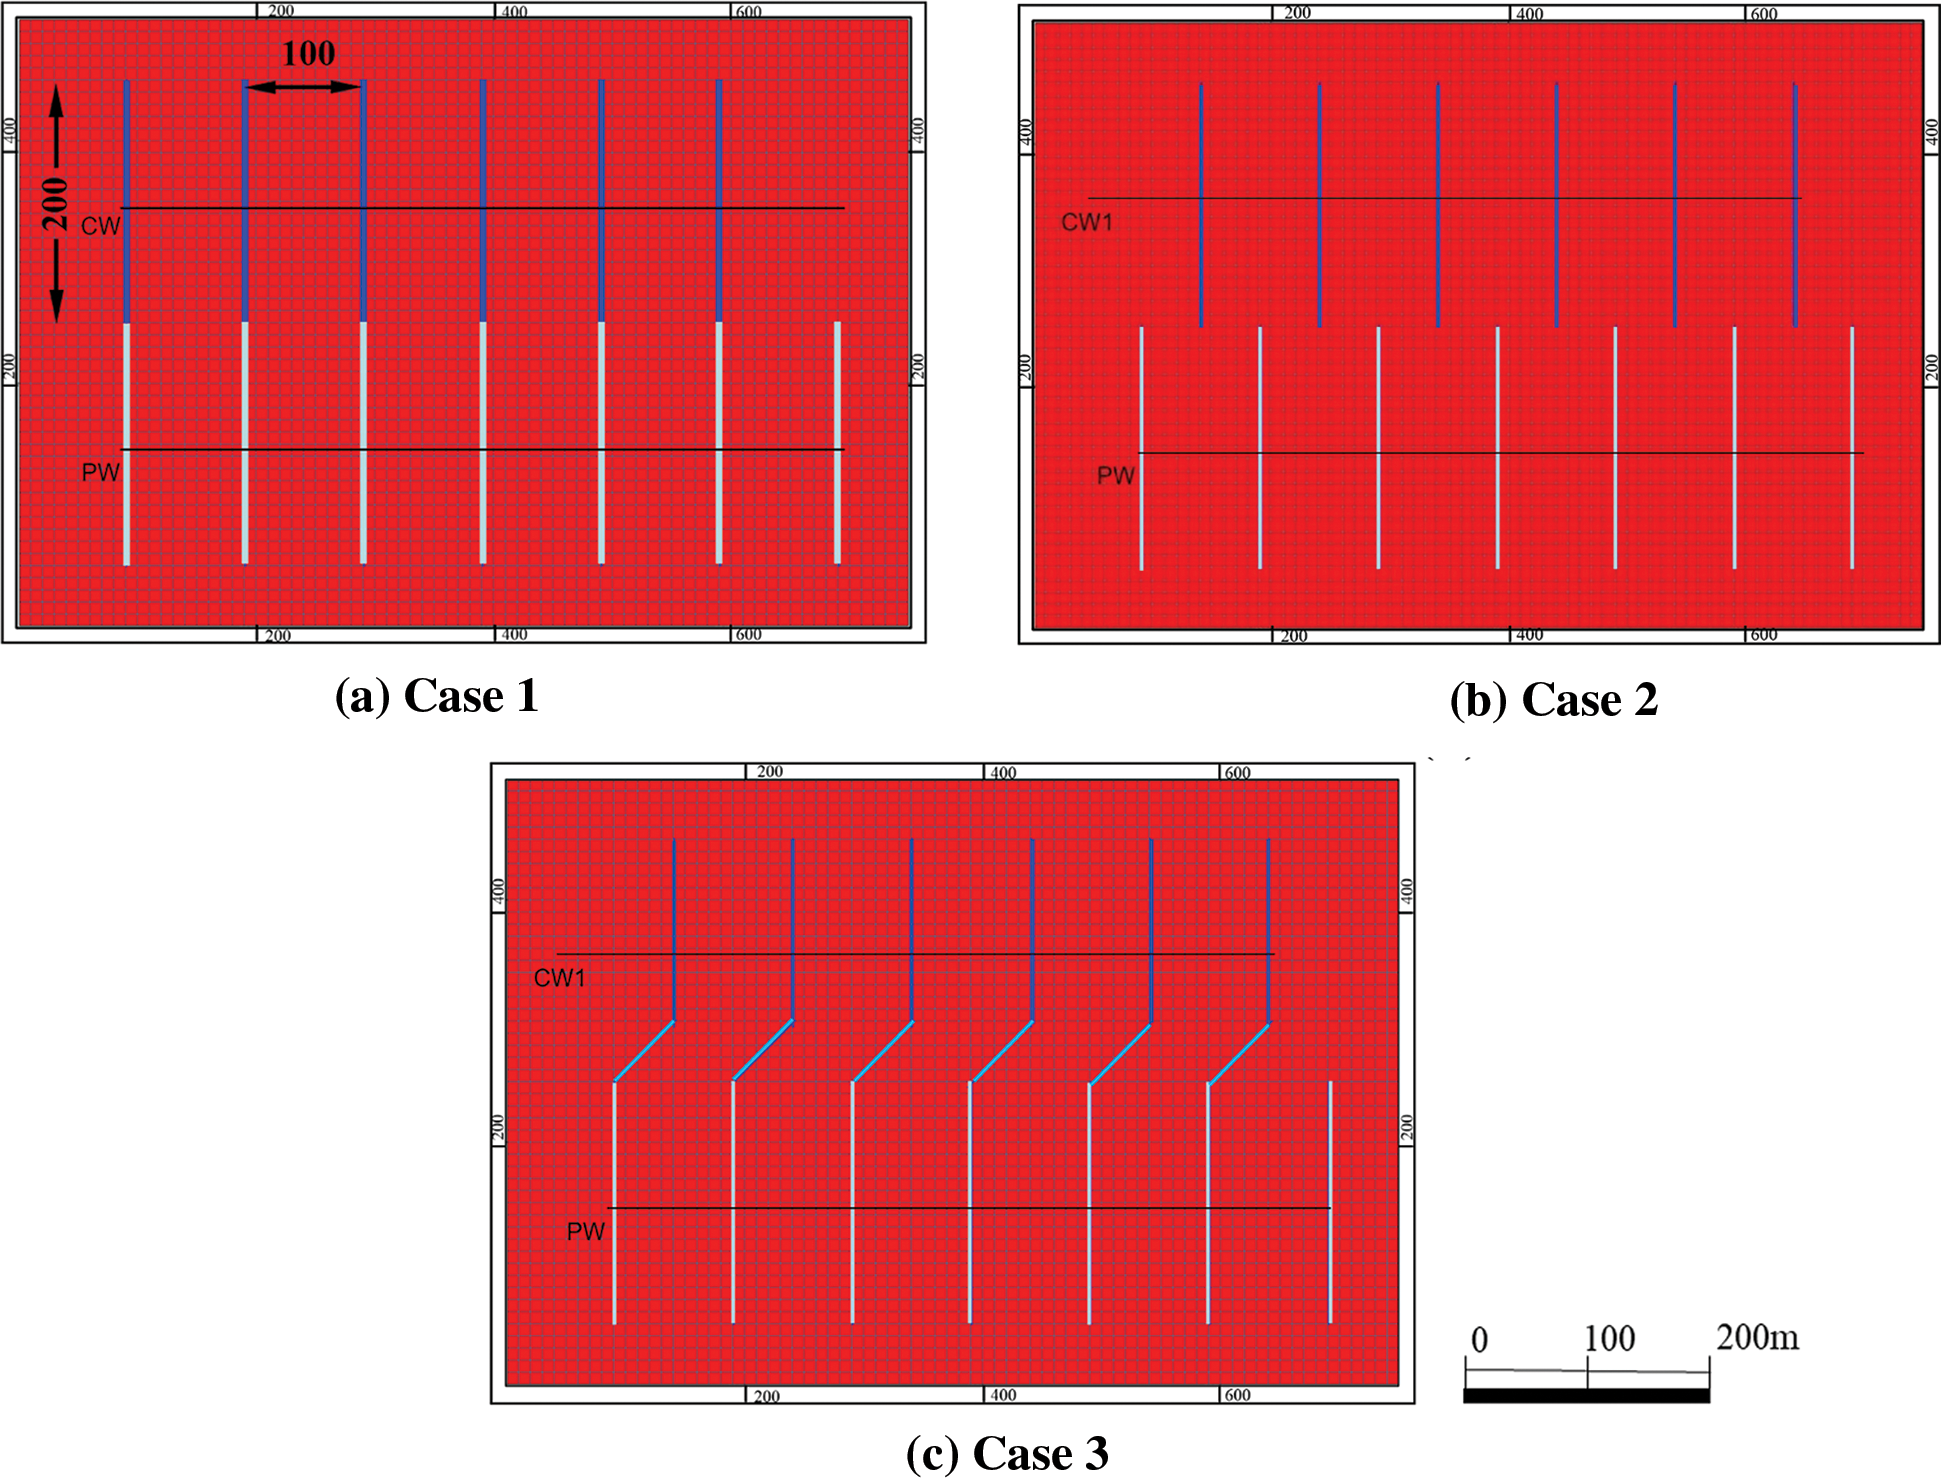
Figure 6: Map view of three cases demonstrating three fracture network morphologies between parent and daughter wells: (a) Aligned hydraulic fractures; (b) Staggered hydraulic fractures; (c) Staggered hydraulic fractures with joint laps
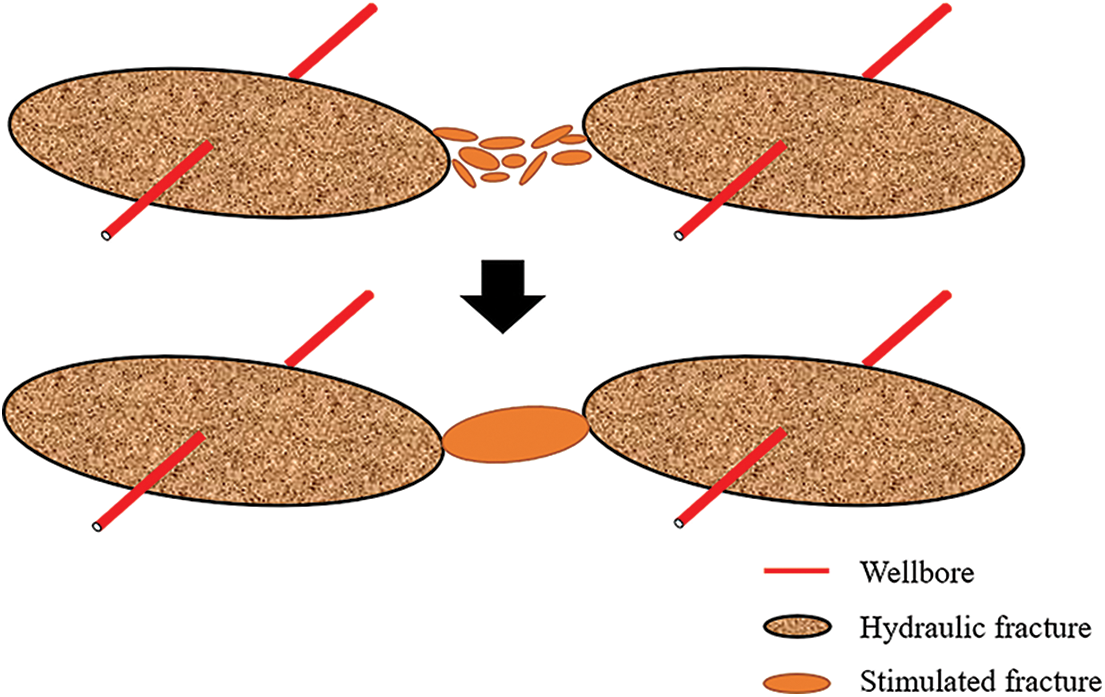
Figure 7: Simplified treatment of fractures in the hydraulic fracturing stimulated zone
Fig. 9 shows the variation of formation pressure in the early stage of child well deployment. It can be observed from the figure that the two-well system after the formation of the facing fracture network will receive significant energy supplementation from the original well during the child well fracturing process. The oil pressure on the corresponding side of the PW hydraulic fracture increases significantly, and the low-pressure area near the parent well shrinks. When the formed hydraulic fracture network is staggered, the high-pressure zone generated by the child well fracturing has no obvious supplementary effect on the parent well, the downward trend of the oil component pressure in PW hydraulic fractures is less affected, indicating that the effect of pressure transmitted by the tight matrix alone is not sufficient. However, when the activated lap joints are generated, it can be seen from the pressure field map and the fracture oil pressure change curve that even if the hydraulic fractures are staggered, the fracturing energy of the child wells can still have a significant replenishment effect on the parent well (Fig. 8).
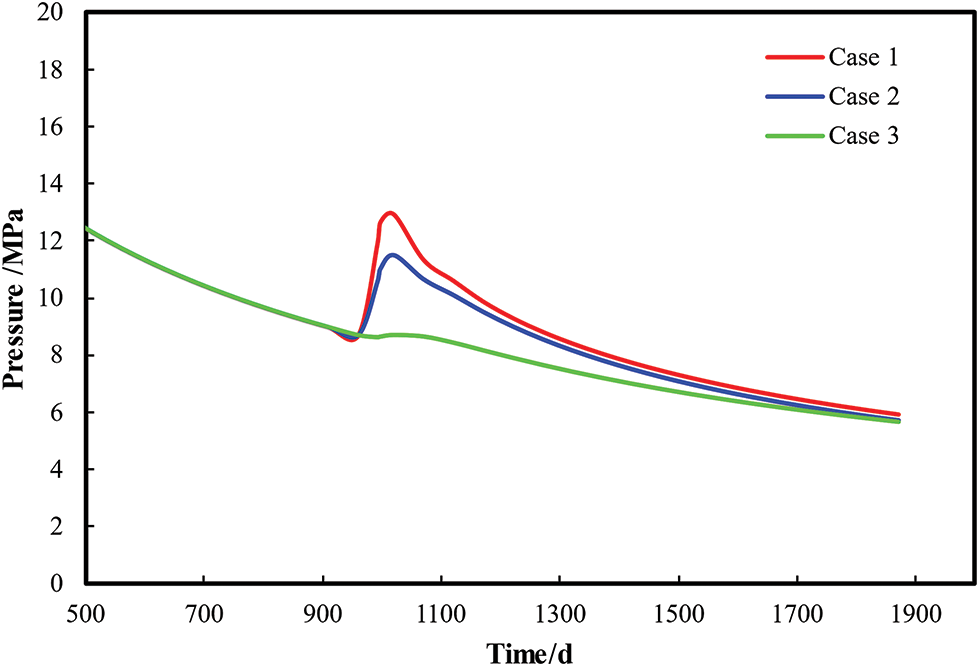
Figure 8: Pressure-drop curve of the oil phase in the wellbore of three cases
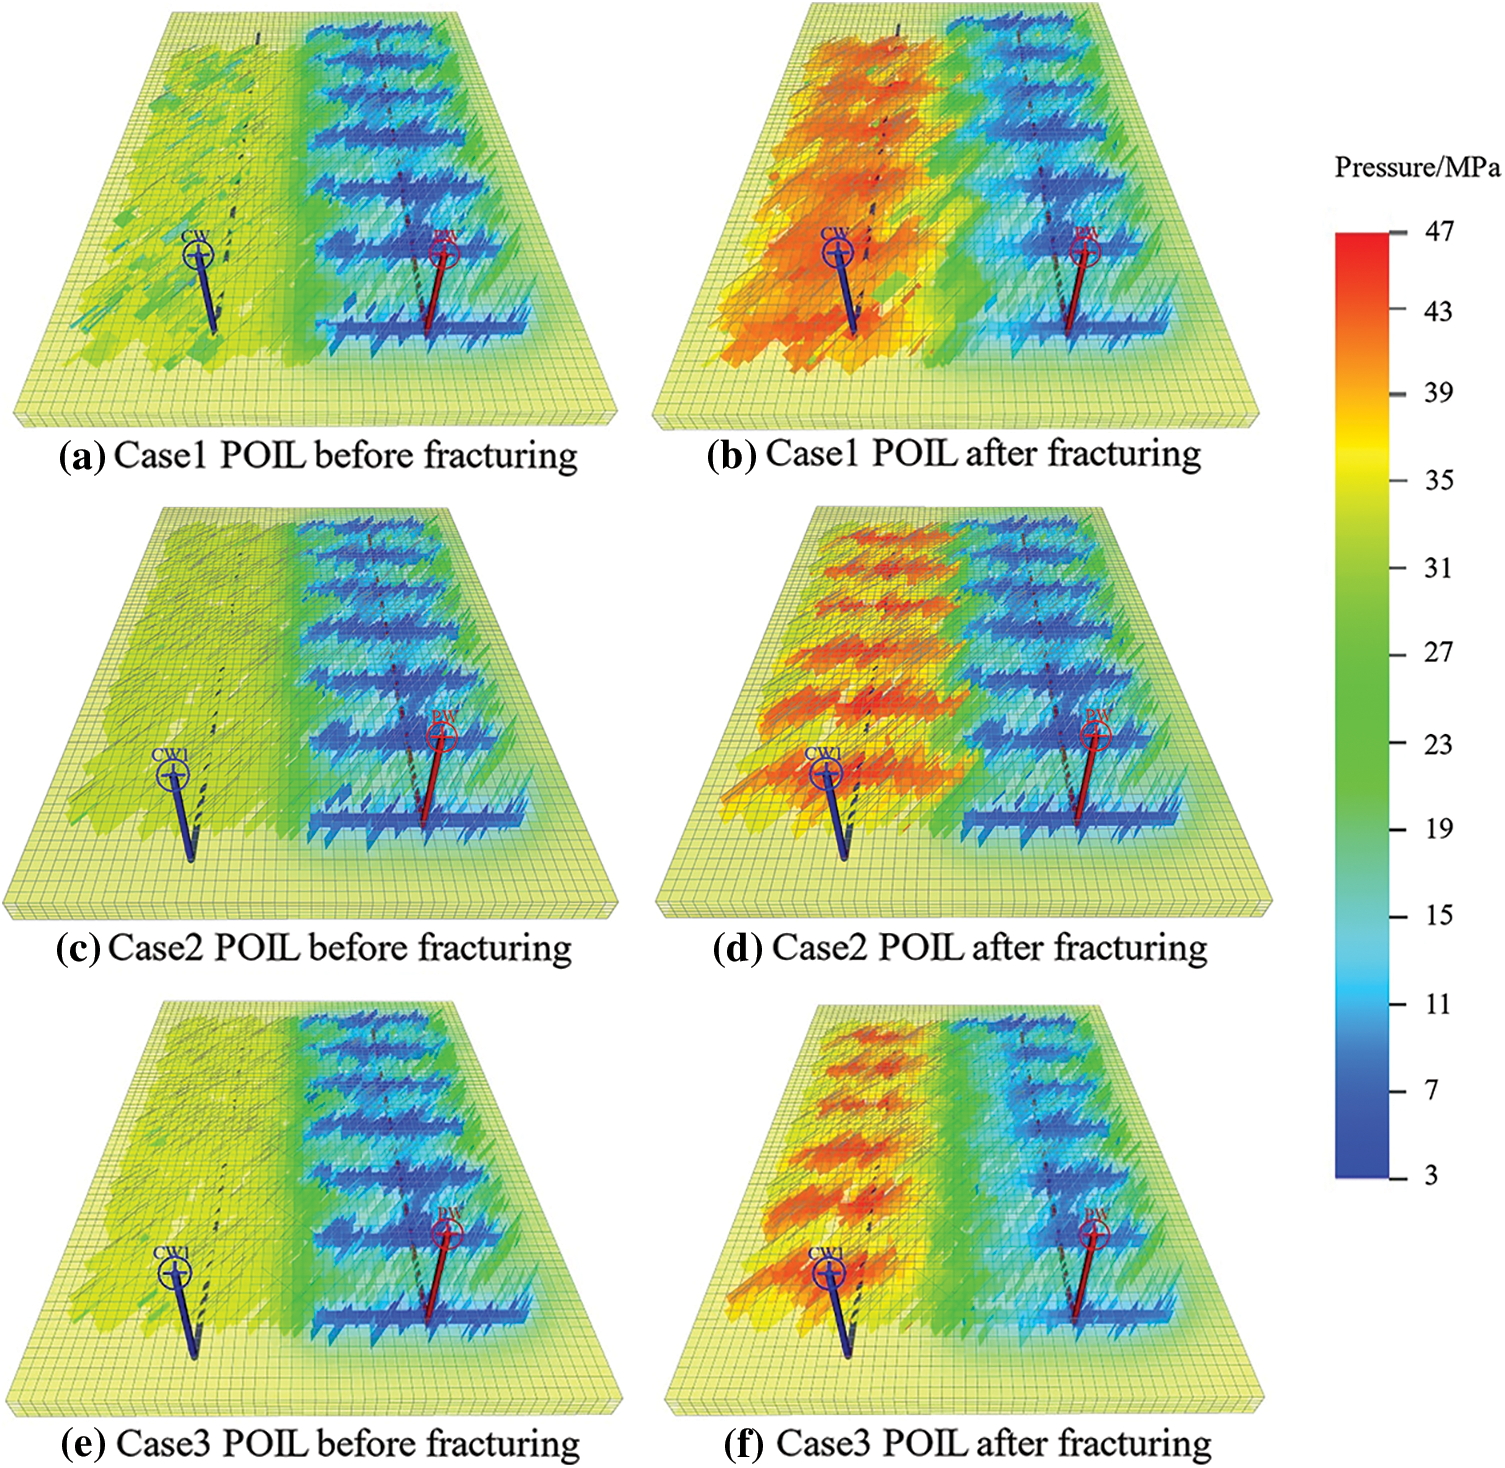
Figure 9: Comparison of the formation pressure distribution before and after the fracturing of infill wells
The production performance data of the parent well is an output from the simulator. According to the numerical simulation results, it can be concluded that there are great differences in the changes of dynamic indicators such as fluid production, oil production, and water cut in the parent wells corresponding to different types of generated fracture networks after the deployment of child wells. As shown in Fig. 10, for the two-well system facing the fracture network, the parent well has a significant liquid increase effect after the child well is put into production and the daily fluid production is increased by up to 17.2 m3. However, the increase in fluid production is mainly due to the increase in water content. In the 20 days after the child well fracturing, the water content in the fluid composition of the parent well production shows a steep increase to more than 90% and then decreases. In the subsequent period of time (1000–1170 days), the decreasing trend of oil production will slow down. The two-well system with staggered hydraulic fractures in Case 2 is not sensitive to the reaction of child well fracturing. During the fracturing process, the parent well has a 9.3% increase in fluid production, the water content variation range is also kept within 10%, and oil production remains basically the same value. For the well group forming networks with lap joints, the parent well also shows a significant increase in fluid production, with a peak daily fluid production of 9.51 m3, which is 7.42 m3 higher than that before the child well fracturing. 40 days after fracturing, the water cut in the parent well increased to 80.3%. However, the oil production rate of the parent well showed an obvious upward trend in this case, which is distinct from Case 1. The daily oil production of the parent well increased from 1.2 m3 before fracturing to the highest value of 3.2 m3 at day 1100 and then decreased.
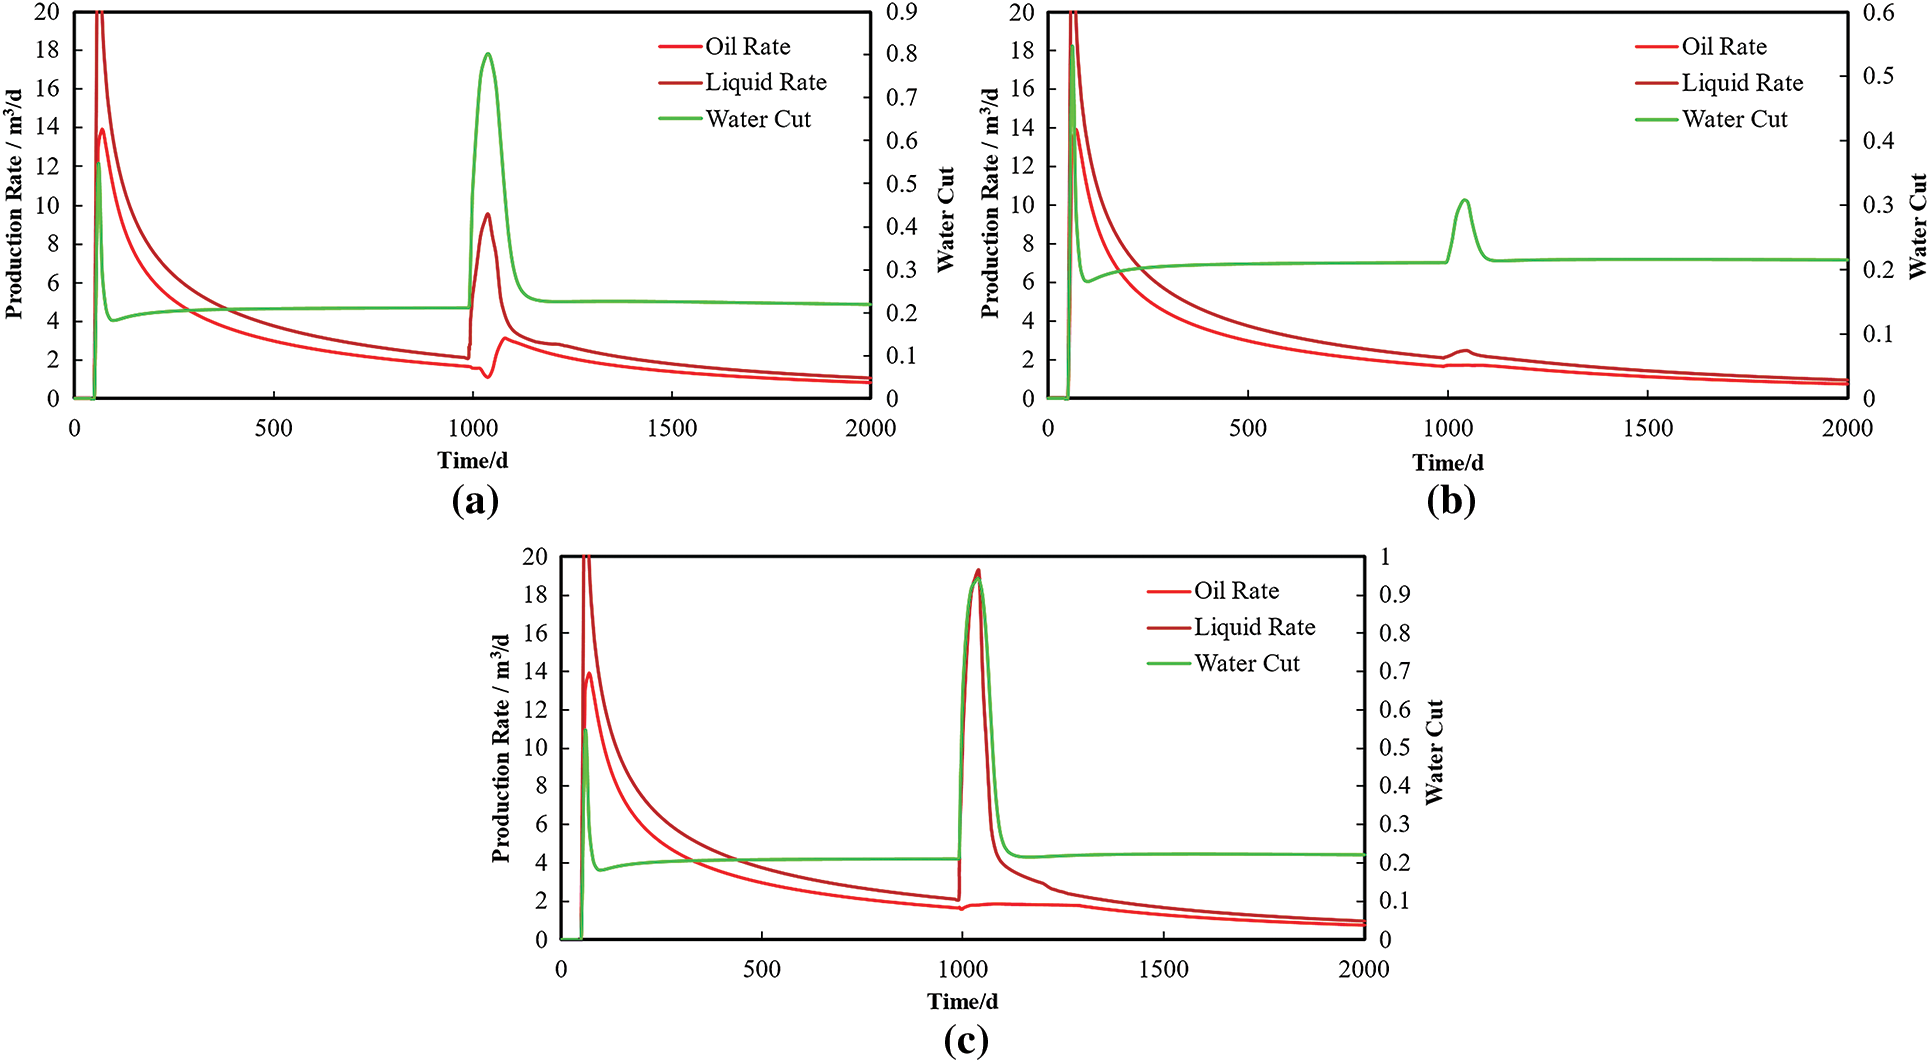
Figure 10: Production curves for parent wells under different well interference types
3.3 Case Study: Production of Well Group with Different Interference Types
Based on the above results, we further study the production performance of the horizontal well pattern in the presence of complex well interference. The physical model of the well group with different interference models is shown in Fig. 11. Well A and Well C are the parent wells under the original well spacing. The given production pressure difference is 10 MPa at the initial stage of production, and the oil pump is used to maintain the production pressure difference after the well loses its ability to stabilize production. Well B is the infill child well and starts production 1000 days after parent wells. We still use water injection to simulate the high-pressure areas after fracturing, the injection pressure is 60 MPa, and the cumulative injection volume is 7000 m3. The hydraulic fracturing perforation sections of the three wells are staggered. The lap joint connected to Well A is formed after the fracturing of Well B, and there is a group of conjugated natural fractures between Well B and Well C. The basic properties of the seam net are shown in Table 3. The model is used to study the effect of different forms of well interference on well pattern production after infill wells completion.
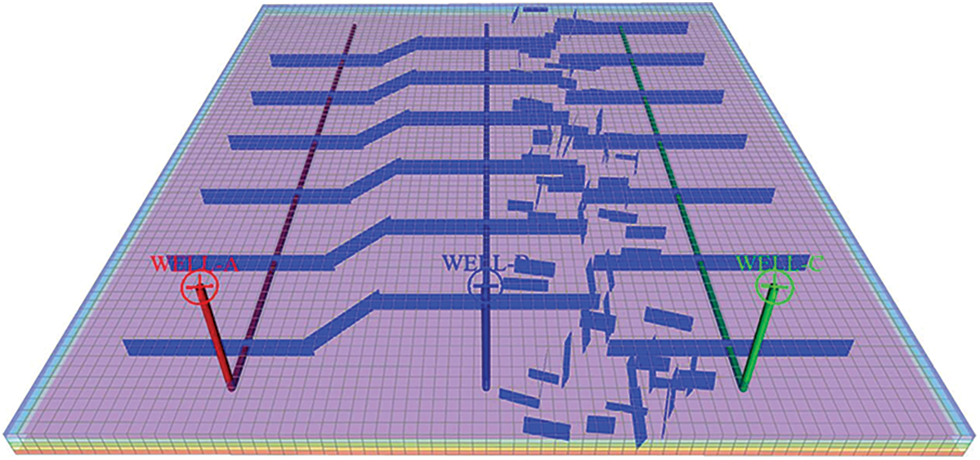
Figure 11: Physical model of horizontal well group with multiple types of fracture networks
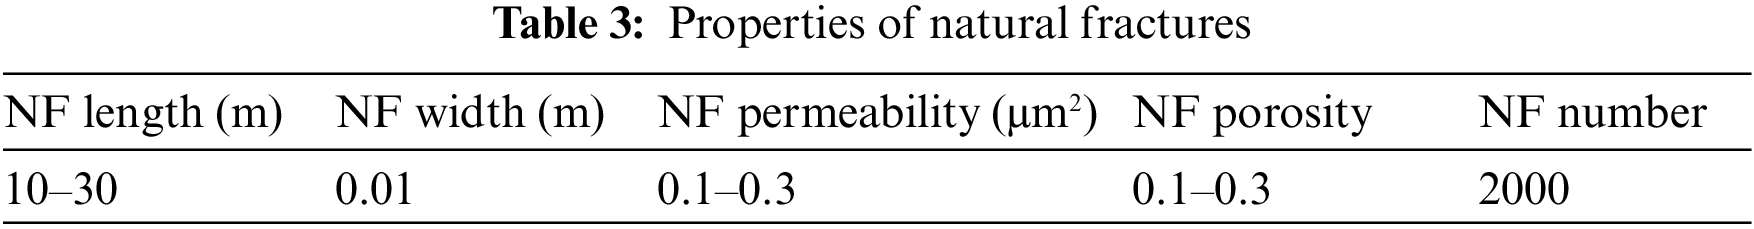
Fig. 12 shows the pressure distribution in the fracture system at the initial stage of completion of Well B. The steep pressure drop gradient is concentrated in the lapped fractures section. The variation of formation pressure during the production process of the well group is shown in Fig. 13. The pressure drop zone extended along the Well B hydraulic fracture and some hydraulic fractures in Well B and C are connected to a certain extent through natural fractures 50 days after the child well opened; After 500 days, fluid drainage happened in the area between the hydraulic fractures. And after 1000 days, all three wells entered the development later stage with a low-level and stable production rate. At this time, the shape of the pressure drop zone did not change, and the matrix pressure near the fracture was further reduced.
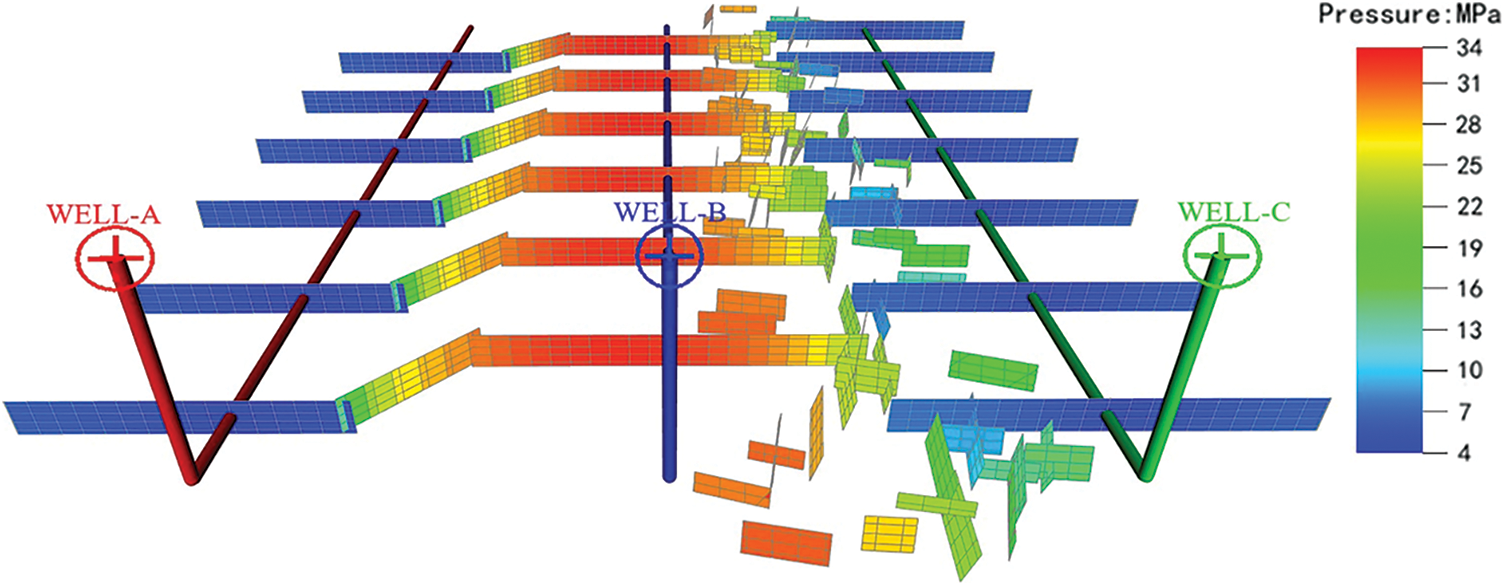
Figure 12: Pressure distribution of reservoir fracture system at the initial stage of infill well opening
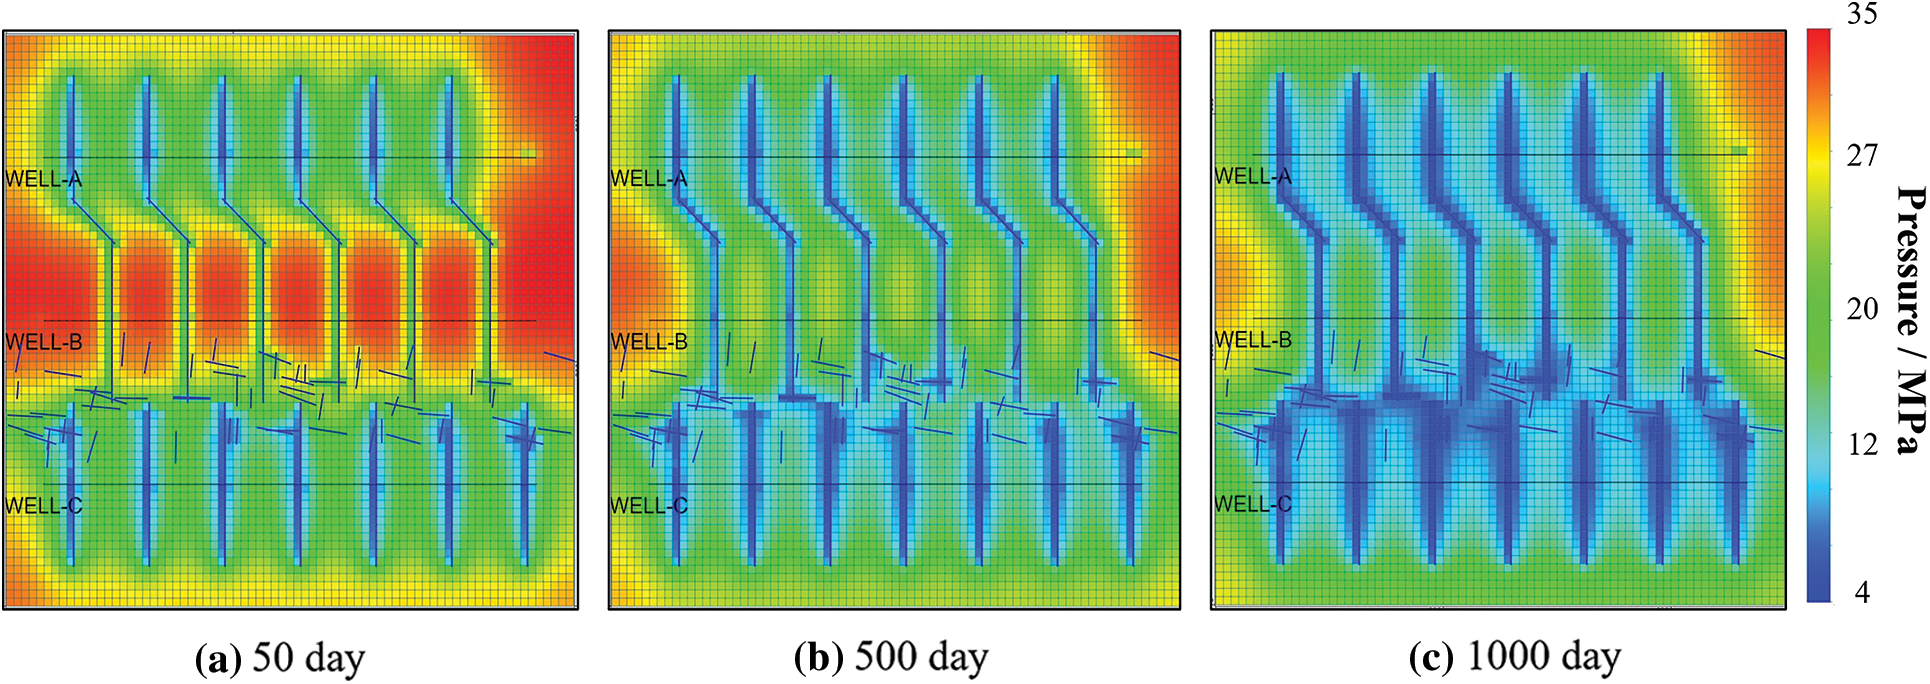
Figure 13: Pressure distribution for the well group after child well completion at different times
The daily oil production rate curve of each horizontal well in the well pattern output by the simulator is used as a reference index to analyze the dynamic production characteristics of the well group under well interference. As shown in the figure, due to the distribution of natural fracture systems around Well C, the stable production time of Well C was longer than that of Well A in the early stage and Well C has a slightly lower production decline rate than Well A. The production of wells A and C showed a sharp increase in a short period of time after the infill well B was opened. The oil production rate of Well A shows a significant increase, from 7.3 m3/d up to 21 m3/d, and the value can be maintained above the original production rate. The oil production rate of Well C decreased rapidly after the sudden increase, and dropped down that before the deployment of the child well after 30 days which remained producing at a rate lower than the original oil production rate in the later period. A control case consisting of only Well A and Well C is also constructed at the same time. The comparison of the simulation results for a 2000-day cumulative production of each well in the two cases is shown in Fig. 14. When the infill Well B exists, the cumulative production of Well A increases by 12.67% compared with the case of no infill, while the cumulative production of Well C decreases by 7.23% (Fig. 15).
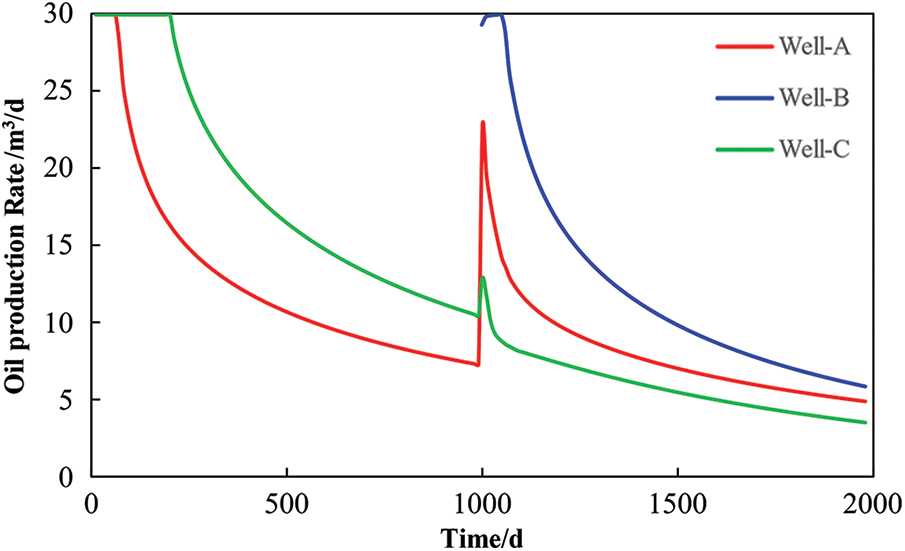
Figure 14: Oil production rate of each well in the model
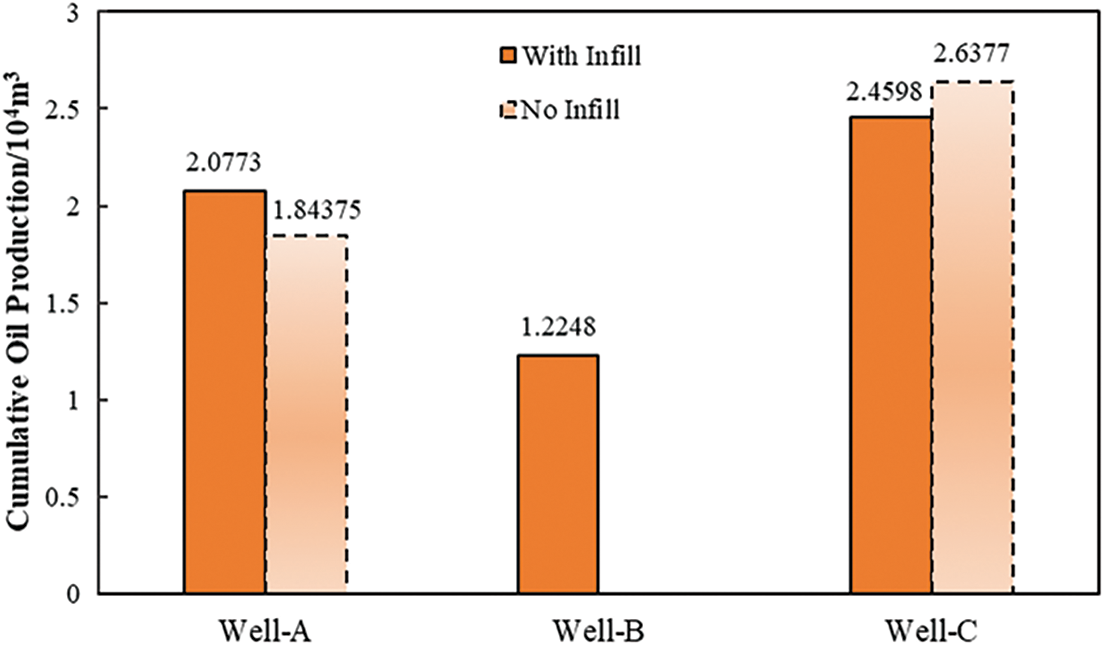
Figure 15: Cumulative production from each horizontal well in the model well group
3.4 Case Study: Water Injection in Well Groups with Different Connectivity
It is generally faced with the phenomenon of rapid production decline after fracturing and completion of the actual development process of shale reservoirs. Therefore, the water injection huff and puff adopted to stabilize production has an important impact on oilfield development in the middle and late stages. For well groups with different types of fracture networks after fracturing, the effectiveness of various water injection measures is also different. There are two types of water injection in the field at present: single well water injection and well pattern water injection. Based on the model case described in Section 3.2, two horizontal well pattern models with high connectivity and low connectivity are set up. In the high-connectivity well pattern (Fig. 16a), the child well fracturing forms connected lap joints and the parent wells on both sides. In the low-connectivity well pattern (Fig. 16b), Well B forms an indirect well interference relationship with the adjacent wells through two groups of natural fractures distributed around. The production conditions of the well group are still set according to the above case. The water injection huff and puff measures are carried out after Well B is opened for 500 days. During a single well water injection, the preset injection pressure of Well B is 50 MPa with an operation process of 20 days. The cumulative water injection volume is around 5000 m3, and the shut-in time is 20 days. As for the well pattern injection, the difference between the well rows for water injection is that three wells undergo water injection and are soaked at the same time. The injection engineering parameters of each well remain the same.
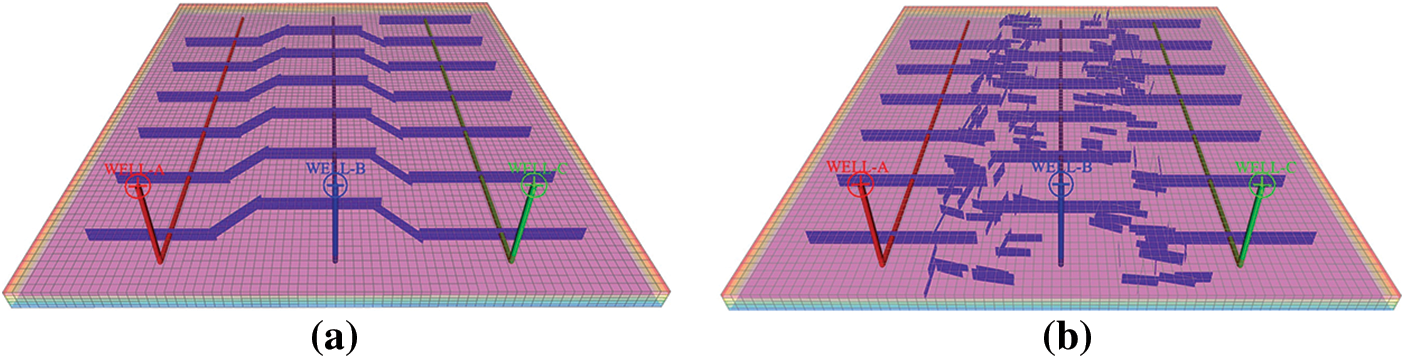
Figure 16: Map of well group models with different inter well connectivity: (a) High connectivity well group; (b) Low connectivity well group
The oil production rate curve and cumulative oil production of each horizontal well output by the simulator is presented in Figs. 17 and 18. Figs. 17a and 17b show the single well and well pattern water injection case of the high-connectivity well group and Figs. 17c and 17d show that in the low-connectivity well group. The comparison can reflect the adaptability of the two water injection schemes to different well patterns. The production of adjacent wells in the injection phase has an insignificant increase, which can be observed from the figure. This is the effect of energy supplementation from the infill well fracturing, and the oil production rate of adjacent wells decreases due to the competition after the water injection well is opened. The oil production rate of each horizontal well improves in the well pattern water injection scheme. The pattern injection can evidently improve the water injection effectiveness of a single well in a high-connectivity well group. The peak oil production of Well B increases from 14.85 m3/d to16.24 m3/d, with a rise of 10.85%. For the low-connectivity well pattern, the effectiveness of both water injection measures shows a relatively small difference. The two water injection schemes correspond to almost the same peak production at the infill well opening, which is 9.8 m3/d.
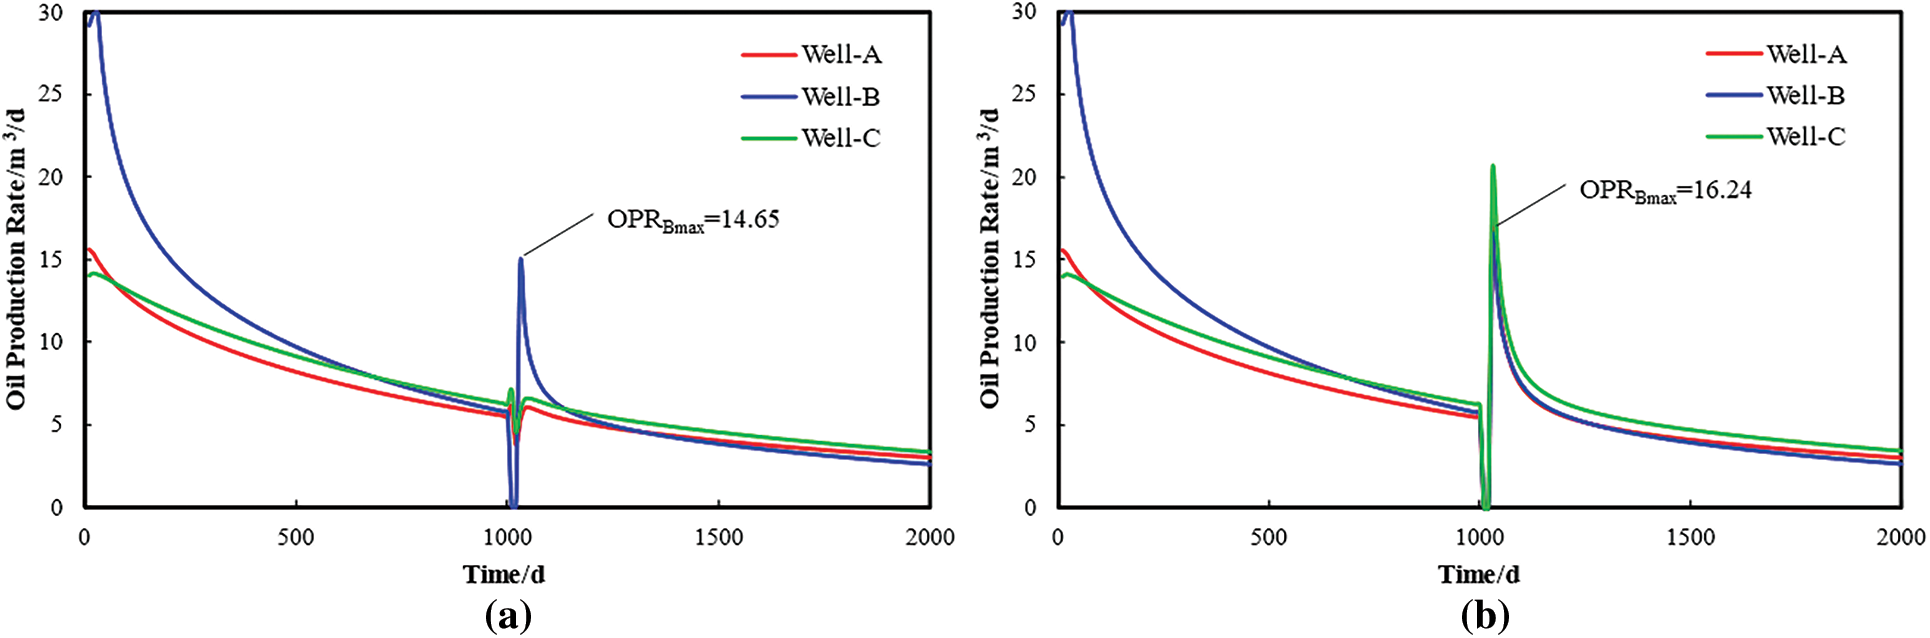
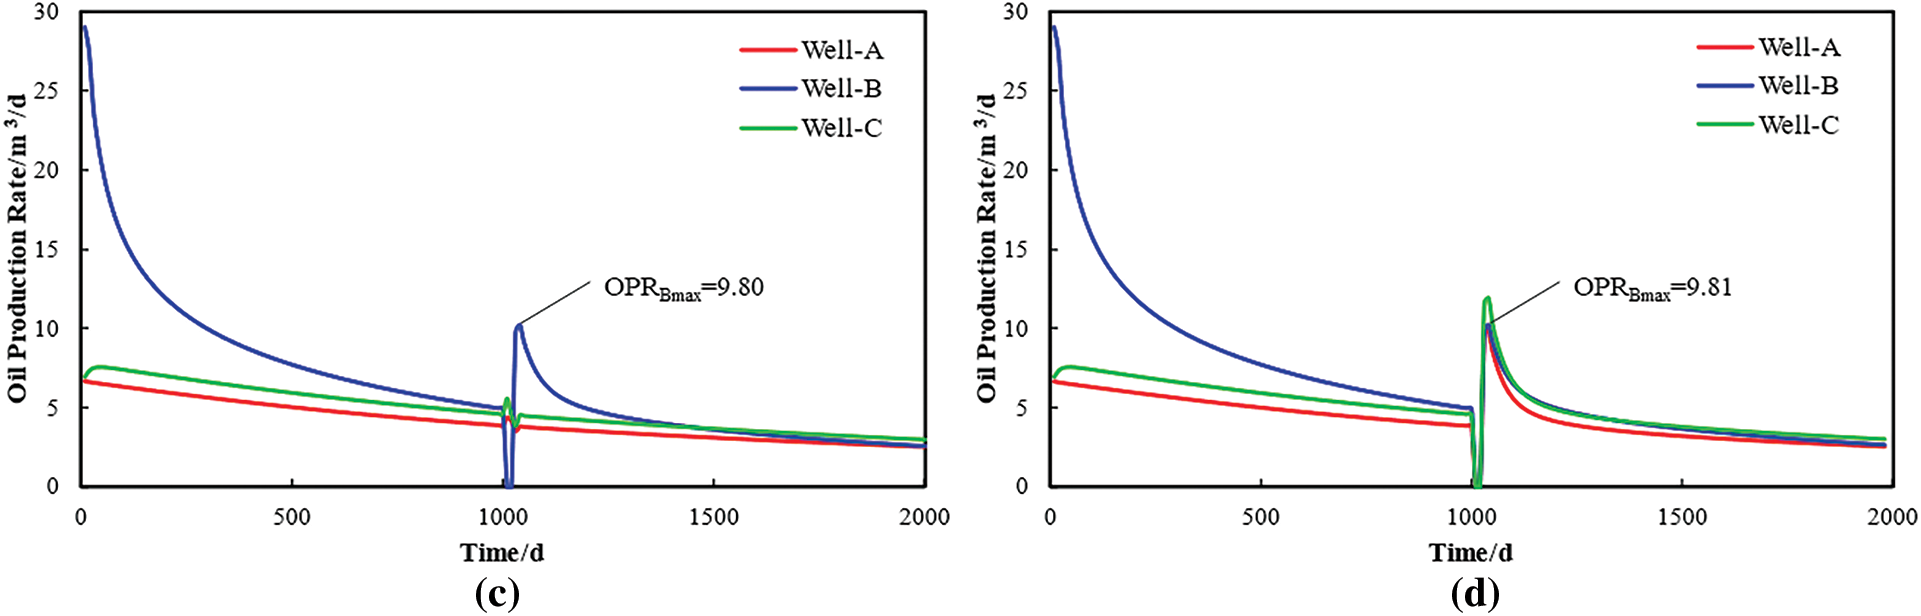
Figure 17: Oil production curve of different water injection measures in well groups with varying connectivity
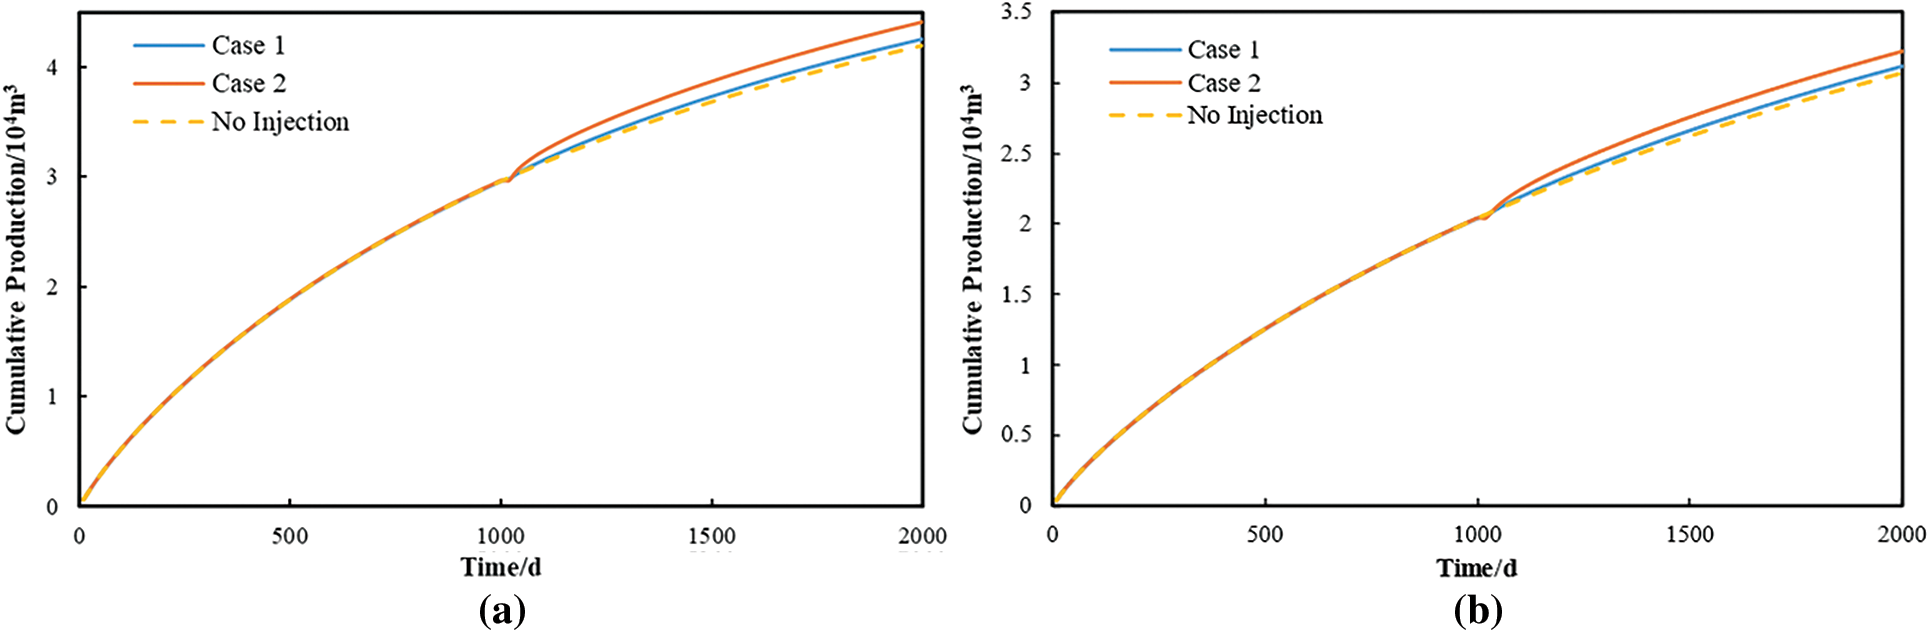
Figure 18: Cumulative production curves of two well group models under different water injection schemes
According to the model described in this paper, the positive and negative effects of the horizontal well interference on production are summarized and analyzed.
4.1 Positive and Negative Well Interference Effects
The summary of the well interference in this study is shown in Table 4 and the production curves of three typical horizontal wells are chosen for the corresponding type as shown in Fig. 19.
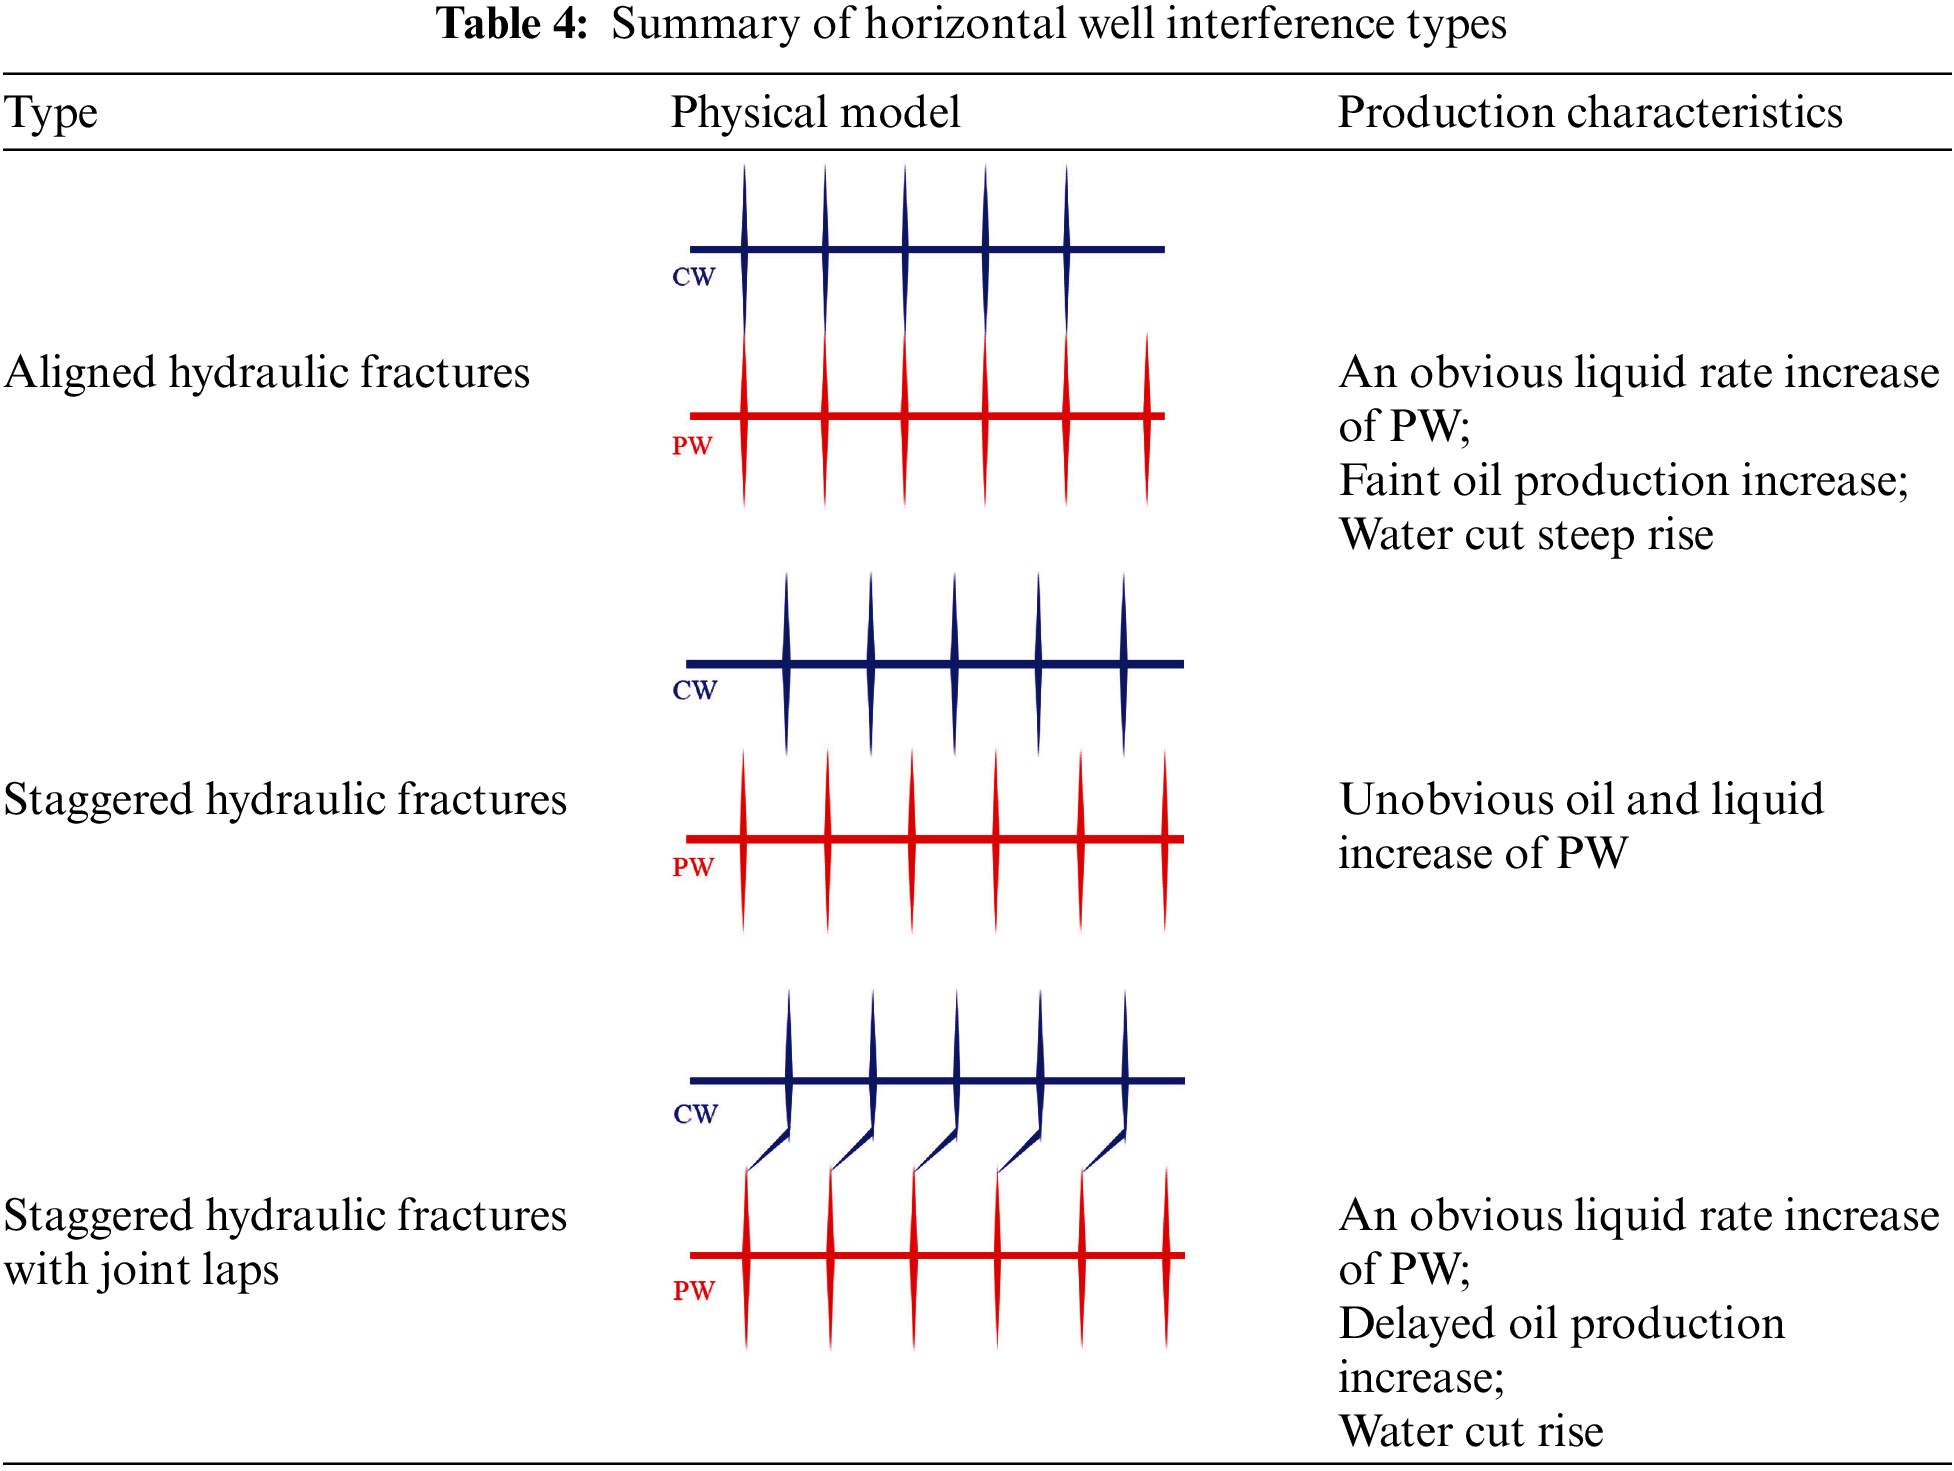
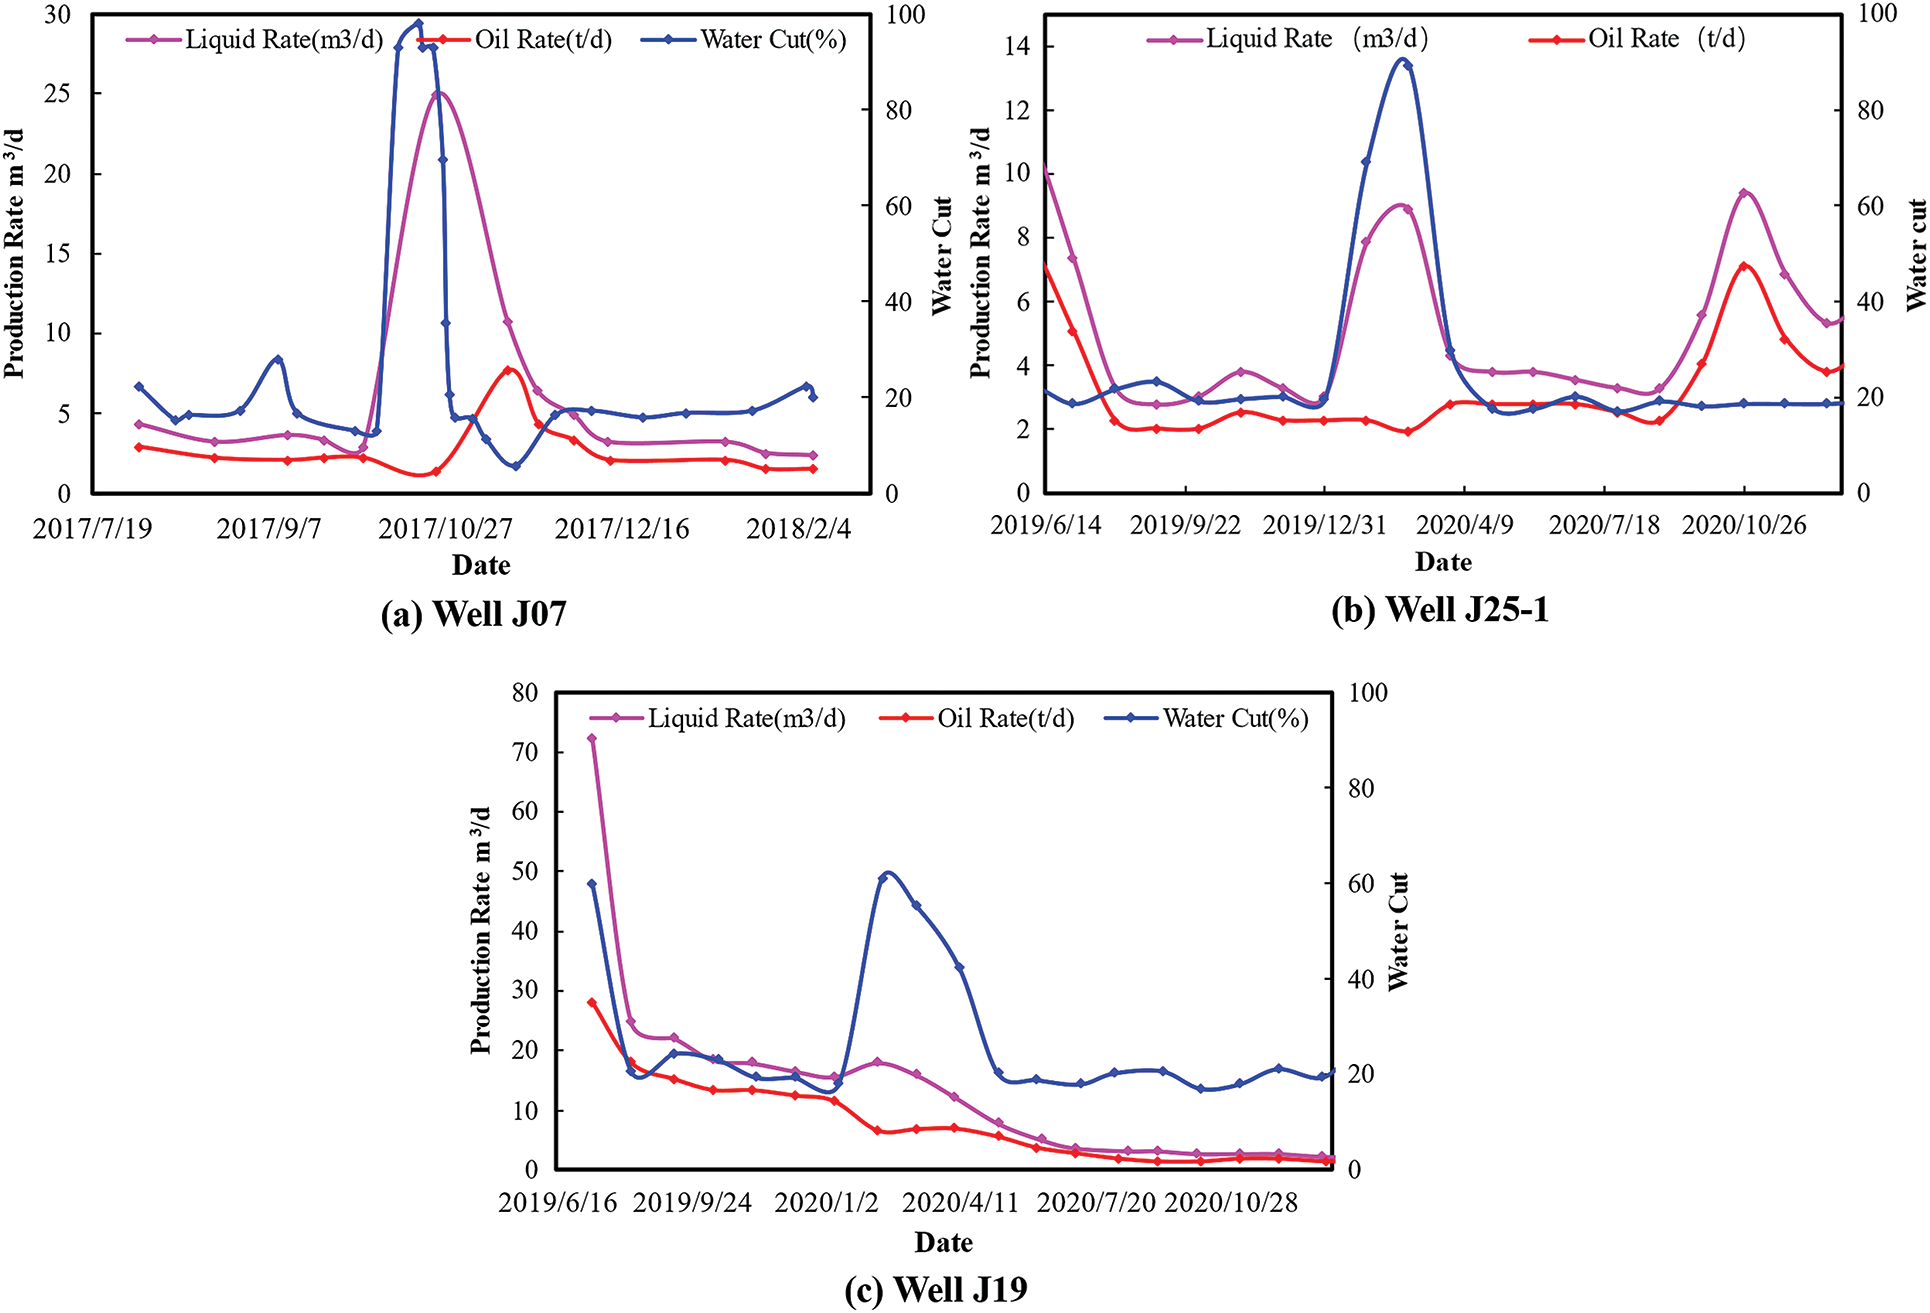
Figure 19: Production dynamics data for typical wells with different types of well interference in the field
The beneficial well interference manifestations are generally the increase of the parent well’s liquid production during the fracturing process of the sub-well and the increase of the oil production after a certain lag. The cause can be considered that the secondary fracture network stimulated by sub-well fracturing overlaps with the parent well fracture network, which expands the area of the SRV area. Results in interactions between wells characterized by rapid water breakthrough and subsequent oil production rise. Such interference type has a positive effect on the production of low-yield old wells and may last for several months. The development curve of a typical well of the category J07 is shown in Fig. 19a.
According to the oilfield fracturing engineering data, the well groups with perforations aligned with each other account for 46% of the total. However, the research results show that the directly connected hydraulic fractures between two wells cannot increase the oil production of the parent well, although it shows a significant supplement of energy to the parent well. As shown in Fig. 19b, the production process of well J25-1 well reflects the dynamic characteristics of this type of interference.
Negative well interference accounts for most of the field reports in oilfields. It is mostly manifested as a sudden drop in the production of parent wells after infill well fracturing. Except for the extreme case where fracturing of infill wells directly damages the wellbore of the parent well, the negative well interference is mainly due to the competitive production relationship between the infill well and the parent well, which will be enlarged by the existence of the natural fracture network. The production process of well J19 (Fig. 19c) reflects the typical characteristics of this interaction in well pattern. The main manifestation is a decrease in the production rate of the parent well or a sudden increase in its production decline rate.
In order to study the influence of reservoir physical properties on the significant degree of well interference and to determine its variation trend, we use the model described in Section 3.3 to conduct a sensitivity analysis on the reservoir parameter of matrix permeability and engineering parameter of the initial production pressure difference of the parent well.
The reservoir matrix permeability plays an important role in controlling the spread range of pressure drop in the depletion development of horizontal wells. Four orders of magnitude of matrix permeability are set to analyze the impact of different types of well interference under the same production conditions.
As shown in Fig. 20a, the well interference under high connectivity fractures has a positive effect, and the parent well oil production increases after the infill well is deployed. The broken line reflects the response trend of the parent well to well interference, which decreases with the increase of matrix permeability. The production increase reaches 24.2% at 4 × 10⁻³ mD, while the increase is only 2.4% when the reservoir permeability rises to 0.4 mD. Due to the improvement of the reservoir permeability, the parent well has a larger EUR in the high permeability reservoir. As for the limited EUR area in the low permeability reservoir, there is a large unused reserve between the infill well and the parent well, which can be accessed by the stimulated fracture network. For the well interference in the low-connectivity well pattern, the two wells are in a competitive oil production relationship, making the reaction a negative factor for the parent well, as shown in Fig. 20b. The effect of this type of well interference is narrow, generally below 10%. Besides, the degree of well interference in this type will also decrease with the increase of matrix permeability. However in the case of extremely low permeability, the depletion pressure cannot spread around through the nearby natural fractures, and the influence of interference will decrease at this time.
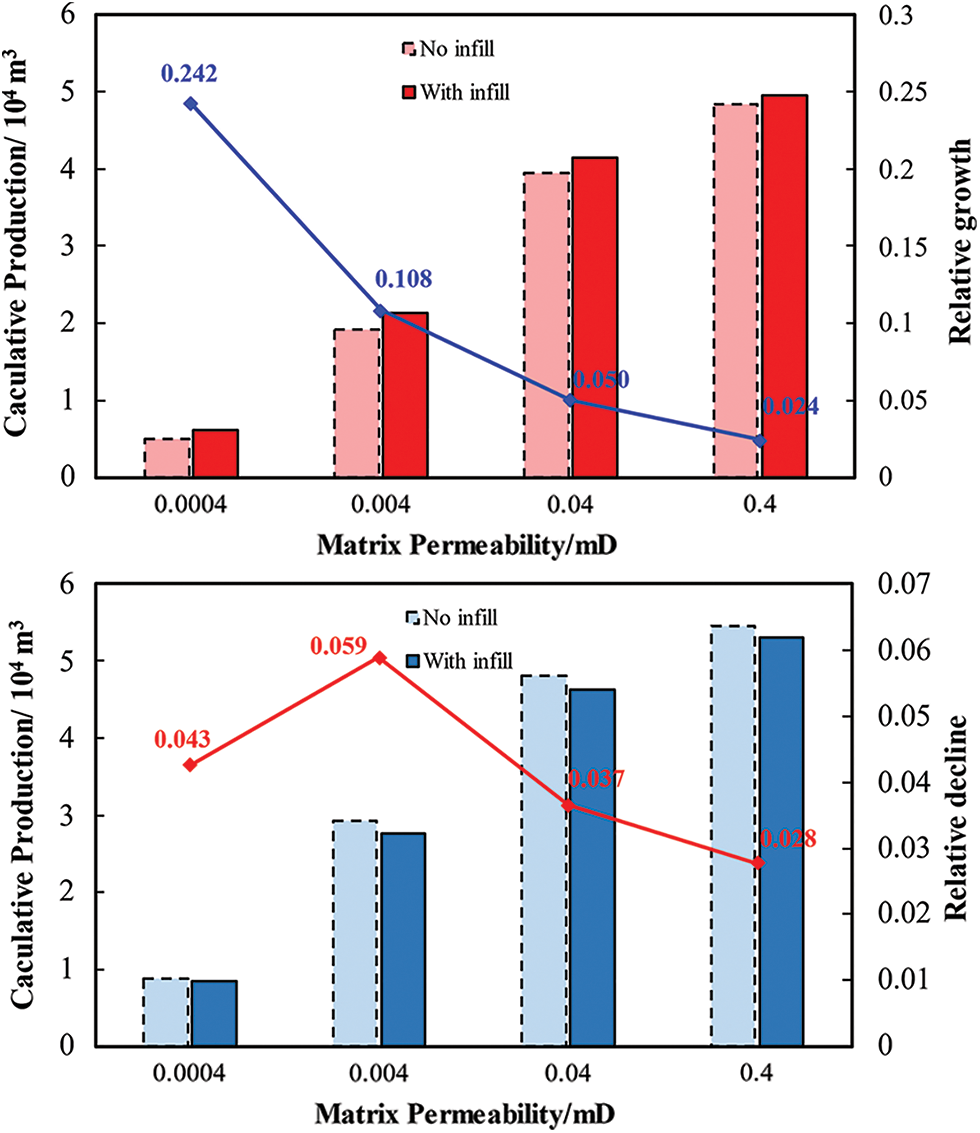
Figure 20: Comparison of the cumulative production of parent wells in the presence of infill wells with two types of fracture morphologies
4.2.2 Production Pressure Difference
The production pressure difference of horizontal wells in low-permeability reservoirs can control the production state during the entire production process and reduce the decline rate of oil wells. We set 4 initial production pressure differences to analyze the well interference performance under the corresponding conditions (Fig. 21).
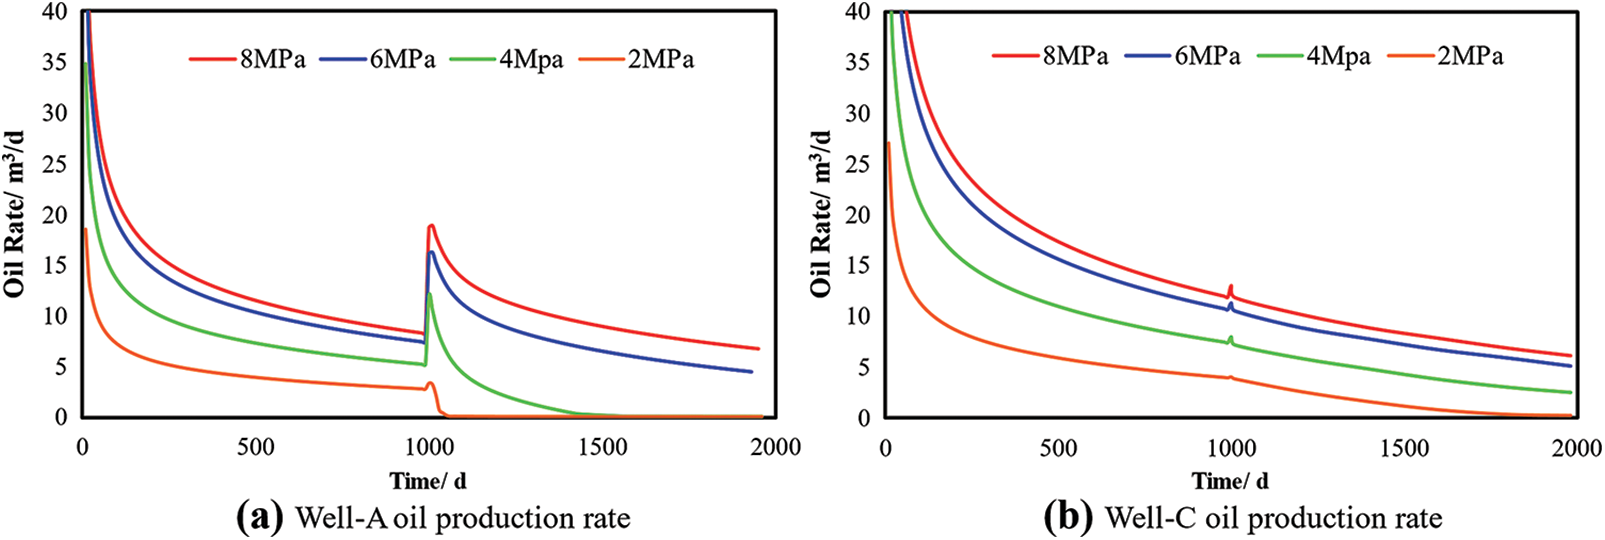
Figure 21: Oil production dynamics of parent wells at different production pressure differences
In the high-connectivity well group, the higher pre-production pressure difference will lead to a more significant production surge after the completion of infill wells. It is mainly because the higher formation pressure depletion will make the energy supplementation effect of the sub-well more prominent. Meanwhile a smaller production pressure difference in the early stage will lead to a faster production decline after the deployment of infill wells. The parent well is not significantly affected by the various production pressure differences in the low-connectivity well group, but the production decline rate of the parent well will also become more visible under the pressure-holding production.
In this paper, a series of oil-water two-phase multi-well numerical models with complex fracture networks are established to study the fracture-dominated well interference performance of different types and the optimal water injection scheme under corresponding conditions. The low-velocity non-Darcy seepage in ultra-low permeability reservoirs is considered in the numerical models. An embedded discrete fracture model is constructed to explicitly represent the hydraulic fractures, natural fracture network and stimulated secondary fractures. The multi-segment wellbore model used to reflect the complex cross flow between the wells is adopted. The numerical model is validated by history matching and shows good agreement with the actual development data.
The production performance characteristics are analyzed in the production model of well groups with aligned hydraulic fractures, staggered hydraulic fractures and overlapping staggered fractures. We also provide a suitable water injection scheme for well groups with different fracture network morphologies. The following conclusions are drawn based on the simulation results:
1. The morphology of the fracture network formed by the infill well fracturing with parent wells is the decisive factor in determining the strength of the interaction between horizontal wells and the dynamic characteristics of subsequent development. In the numerical model, the widely distributed natural fracture network (2000 fractures in total) in the reservoir has no obvious effect on the material and energy exchange between horizontal wells. Only when the main hydraulic fractures of both wells are directly connected or a series of highly conductive activated fractures are formed, can obvious well interference occur between the infill well and the parent well.
2. The formation of an aligned hydraulic fracture will result in a significant fluid increase in the parent well, but will not improve the oil production. When the hydraulic fractures in the two wells are staggered, the oil production capacity of the parent well declines due to competition between the two wells. However, when secondary laps are formed between the staggered hydraulic fractures, the parent well will also have an increase in fluid production, where the oil production grows with a time lag, which is beneficial.
3. The dynamic characteristics of the parent well production during the fracturing of the infill well can be used as a reference to determine the type of fracture network formed. As the reservoir permeability increases, the effect of interference will decrease. Additionally, the pressure depletion around the parent well will affect the strength of the interference effect.
4. For high-connectivity well groups, a single-well water injection huff and puff will cause a great disturbance to the adjacent wells during water injection and well soaking. Due to the existence of the connected fracture network, the injected fluid cannot affect the injection well, and the use of multi-well synchronous water injection can increase the water injection sweep range and improve the water injection huff and puff effect.
5. For low-connectivity well groups, the improvement of each well in the group after applying the water injection huff and puff is not obvious compared with the single well water injection. The single-well water injection huff and puff has little effect on the adjacent well in this case, so low-yield horizontal wells can be selected alone to reduce the construction cost.
Funding Statement: This work is supported by Open Fund Project “Study on Multiphase Flow Semi-Analytical Method for Horizontal Wells of Continental Shale Condensate Gas” of Sinopec Key Laboratory of Shale Oil/Gas Exploration and Production Technology.
Conflicts of Interest: The authors declare that they have no conflicts of interest to report regarding the present study.
References
1. Lin, C., He, J., Li, X., Wan, X., Zheng, B. (2017). An experimental investigation into the effects of the anisotropy of shale on hydraulic fracture propagation. Rock Mechanics and Rock Engineering, 50(3), 543–554. https://doi.org/10.1007/s00603-016-1136-4 [Google Scholar] [CrossRef]
2. Nguyen-Le, V., Shin, H. (2019). Development of reservoir economic indicator for Barnett Shale gas potential evaluation based on the reservoir and hydraulic fracturing parameters. Journal of Natural Gas Science and Engineering, 66(3), 159–167. https://doi.org/10.1016/j.jngse.2019.03.024 [Google Scholar] [CrossRef]
3. Kanin, E. A., Dontsov, E. V., Garagash, D. I., Osiptsov, A. A. (2020). A radial hydraulic fracture with pressure-dependent leak-off. Journal of the Mechanics and Physics of Solids, 143(35), 104062. https://doi.org/10.1016/j.jmps.2020.104062 [Google Scholar] [CrossRef]
4. Li, W., Frash, L. P., Lei, Z., Carey, J. W., Chau, V. T. et al. (2022). Investigating poromechanical causes for hydraulic fracture complexity using a 3D coupled hydro-mechanical model. Journal of the Mechanics and Physics of Solids, 169(16), 105062. https://doi.org/10.1016/j.jmps.2022.105062 [Google Scholar] [CrossRef]
5. Zheng, H., Pu, C., Xu, E., Sun, C. (2020). Numerical investigation on the effect of well interference on hydraulic fracture propagation in shale formation. Engineering Fracture Mechanics, 228(5), 106932. https://doi.org/10.1016/j.engfracmech.2020.106932 [Google Scholar] [CrossRef]
6. Wu, Z., Cui, C., Jia, P., Wang, Z., Sui, Y. (2022). Advances and challenges in hydraulic fracturing of tight reservoirs: A critical review. Energy Geoscience, 3(4), 427–435. https://doi.org/10.1016/j.engeos.2021.08.002 [Google Scholar] [CrossRef]
7. Wang, Q., Zhao, J., Wang, B., Li, D., Ran, L. et al. (2022). Secondary growth and closure behavior of planar hydraulic fractures during shut-in. Journal of Petroleum Science and Engineering, 213(B6), 110420. https://doi.org/10.1016/j.petrol.2022.110420 [Google Scholar] [CrossRef]
8. Wang, Z., Zhao, X., Xiong, S., He, Y. (2021). Semi-analytical model-based research on influencing factors of the spacing of volume fracturing horizontal well in tight oil reservoirs via consideration of imbibition. Journal of Petroleum Science and Engineering, 198(2), 108167. https://doi.org/10.1016/j.petrol.2020.108167 [Google Scholar] [CrossRef]
9. Wang, L., Yao, Y., Wang, K., Adenutsi, C. D., Zhao, G. et al. (2022). Data-driven multi-objective optimization design method for shale gas fracturing parameters. Journal of Natural Gas Science and Engineering, 99(3), 104420. https://doi.org/10.1016/j.jngse.2022.104420 [Google Scholar] [CrossRef]
10. Yong, R., Chang, C., Zhang, D., Wu, J., Huang, H. et al. (2021). Optimization of shale-gas horizontal well spacing based on geology-engineering–economy integration: A case study of well block ning 209 in the national shale gas development demonstration area. Natural Gas Industry B, 8(1), 98–104. https://doi.org/10.1016/j.ngib.2020.07.006 [Google Scholar] [CrossRef]
11. Zhang, Y., Lv, C., Lun, Z., Zhao, S., He, Y. et al. (2022). Horizontal well spacing optimization and gas injection simulation for the ultra-low-permeability Yongjin reservoir. Energy Geoscience, 196(4), 100105. https://doi.org/10.1016/j.engeos.2022.04.001 [Google Scholar] [CrossRef]
12. Zheng, H., Pu, C., Sun, C. (2020). Study on the interaction between hydraulic fracture and natural fracture based on extended finite element method. Engineering Fracture Mechanics, 230(5), 106981. https://doi.org/10.1016/j.engfracmech.2020.106981 [Google Scholar] [CrossRef]
13. Wang, L., Yao, Y., Wang, W., Adenutsi, C. D., Zhao, G. et al. (2022). Integrated optimization design for horizontal well spacing and fracture stage placement in shale gas reservoir. Journal of Natural Gas Science and Engineering, 105(3), 104706. https://doi.org/10.1016/j.jngse.2022.104706 [Google Scholar] [CrossRef]
14. Shen, W., Li, X., Cihan, A., Lu, X., Liu, X. (2019). Experimental and numerical simulation of water adsorption and diffusion in shale gas reservoir rocks. Advances in Geo-Energy Research, 3(2), 165–174. https://doi.org/10.26804/ager.2019.02.06 [Google Scholar] [CrossRef]
15. Feng, Q., Xu, S., Xing, X., Zhang, W., Wang, S. et al. (2020). Advances and challenges in shale oil development: A critical review. Advances in Geo-Energy Research, 4(4), 406–418. https://doi.org/10.46690/ager.2020.04.06 [Google Scholar] [CrossRef]
16. Safari, R., Lewis, R., Ma, X., Mutlu, U., Ghassemi, A. (2017). Infill-well fracturing optimization in tightly spaced horizontal wells. SPE Journal, 22(2), 582–595. https://doi.org/10.2118/178513-PA [Google Scholar] [CrossRef]
17. He, Y., Qiao, Y., Qin, J., Tang, Y., Wang, Y. et al. (2021). A novel method to enhance oil recovery by inter-fracture injection and production through the same multi-fractured horizontal well. Journal of Energy Resources Technology, 144(4), 043005. https://doi.org/10.1115/1.4051623 [Google Scholar] [CrossRef]
18. Wang, J., Zhao, W., Liu, H., Liu, F., Zhang, T. et al. (2020). Inter-well interferences and their influencing factors during water flooding in fractured-vuggy carbonate reservoirs. Petroleum Exploration and Development, 47(5), 1062–1073. https://doi.org/10.1016/S1876-3804(20)60117-3 [Google Scholar] [CrossRef]
19. Guo, T., Xiong, L., Ye, S., Dong, X., Wei, L. et al. (2023). Theory and practice of unconventional gas exploration in carrier beds: Insight from the breakthrough of new type of shale gas and tight gas in Sichuan Basin, SW China. Petroleum Exploration and Development, 50(1), 27–42. https://doi.org/10.1016/S1876-3804(22)60367-7 [Google Scholar] [CrossRef]
20. Awada, A., Santo, M., Lougheed, D., Xu, D., Virues, C. (2016). Is that interference? A work flow for identifying and analyzing communication through hydraulic fractures in a multiwell pad. SPE Journal, 21(5), 1554–1566. https://doi.org/10.2118/178509-PA [Google Scholar] [CrossRef]
21. Rao, X., Cheng, L., Cao, R., Jia, P., Wu, Y. et al. (2019). A modified embedded discrete fracture model to study the water blockage effect on water huff-n-puff process of tight oil reservoirs. Journal of Petroleum Science and Engineering, 181(3), 106232. https://doi.org/10.1016/j.petrol.2019.106232 [Google Scholar] [CrossRef]
22. Rao, X., Cheng, L., Cao, R., Jia, P., Wu, Y. et al. (2019). An efficient three-dimensional embedded discrete fracture model for production simulation of multi-stage fractured horizontal well. Engineering Analysis with Boundary Elements, 106(5), 473–492. https://doi.org/10.1016/j.enganabound.2019.06.006 [Google Scholar] [CrossRef]
23. Hu, J., Sun, R., Zhang, Y. (2020). Investigating the horizontal well performance under the combination of micro-fractures and dynamic capillary pressure in tight oil reservoirs. Fuel, 269(4), 117375. https://doi.org/10.1016/j.fuel.2020.117375 [Google Scholar] [CrossRef]
24. Ge, X., Guo, T., Ma, Y., Wang, G., Li, M. et al. (2022). Fracture development and inter-well interference for shale gas production from the Wufeng-Longmaxi Formation in a gentle syncline area of Weirong shale gas field, Southern Sichuan, China. Journal of Petroleum Science and Engineering, 212(11), 110207. https://doi.org/10.1016/j.petrol.2022.110207 [Google Scholar] [CrossRef]
25. Liao, S., Hu, J., Zhang, Y. (2022). Investigation on the influence of multiple fracture interference on hydraulic fracture propagation in tight reservoirs. Journal of Petroleum Science and Engineering, 211(5), 110160. https://doi.org/10.1016/j.petrol.2022.110160 [Google Scholar] [CrossRef]
26. Qin, J. Z., Zhong, Q. H., Tang, Y., Yu, W., Sepehrnoori, K. (2022). Well interference evaluation considering complex fracture networks through pressure and rate transient analysis in unconventional reservoirs. Petroleum Science, 20(1), S1995822622002448. https://doi.org/10.1016/j.petsci.2022.09.029 [Google Scholar] [CrossRef]
27. Zhang, S., Liu, Z., Shi, A., Wang, X. (2019). Development of accurate well models for numerical reservoir simulation. Advances in Geo-Energy Research, 3(3), 250–257. https://doi.org/10.26804/ager.2019.03.03 [Google Scholar] [CrossRef]
28. Gupta, I., Rai, C., Devegowda, D., Sondergeld, C. H. (2021). Fracture hits in unconventional reservoirs: A critical review. SPE Journal, 26(1), 412–434. https://doi.org/10.2118/203839-PA [Google Scholar] [CrossRef]
29. Pei, Y., Yu, W., Sepehrnoori, K., Gong, Y., Xie, H. et al. (2021). The influence of development target depletion on stress evolution and infill drilling of upside target in the permian basin. SPE Reservoir Evaluation & Engineering, 24(3), 570–589. https://doi.org/10.2118/205476-PA [Google Scholar] [CrossRef]
30. Marongiu-Porcu, M., Lee, D., Shan, D., Morales, A. (2016). Advanced modeling of interwell-fracturing interference: An eagle ford shale-oil study. SPE Journal, 21(5), 1567–1582. https://doi.org/10.2118/174902-PA [Google Scholar] [CrossRef]
31. Thompson, L. G. (2018). Horizontal well fracture interference–semi-analytical modeling and rate prediction. Journal of Petroleum Science and Engineering, 160(5), 465–473. https://doi.org/10.1016/j.petrol.2017.10.002 [Google Scholar] [CrossRef]
32. He, Y., Cheng, S., Qin, J., Chai, Z., Wang, Y. et al. (2018). Analytical interference testing analysis of multi-segment horizontal well. Journal of Petroleum Science and Engineering, 171(7), 919–927. https://doi.org/10.1016/j.petrol.2018.08.019 [Google Scholar] [CrossRef]
33. Chen, J., Wei, Y., Wang, J., Yu, W., Qi, Y. et al. (2021). Inter-well interference and well spacing optimization for shale gas reservoirs. Journal of Natural Gas Geoscience, 6(5), 301–312. https://doi.org/10.1016/j.jnggs.2021.09.001 [Google Scholar] [CrossRef]
34. Tang, H., Yan, B., Chai, Z., Zuo, L., Killough, J. et al. (2019). Analyzing the well-interference phenomenon in the eagle ford shale/austin chalk production system with a comprehensive compositional reservoir model. SPE Reservoir Evaluation & Engineering, 22(3), 827–841. https://doi.org/10.2118/191381-PA [Google Scholar] [CrossRef]
35. Yu, W., Xu, Y., Weijermars, R., Wu, K., Sepehrnoori, K. (2017). Impact of well interference on shale oil production performance: A numerical model for analyzing pressure response of fracture hits with complex geometries. SPE Hydraulic Fracturing Technology Conference and Exhibition, D021S003R008. The Woodlands, Texas, USA. https://doi.org/10.2118/184825-MS [Google Scholar] [CrossRef]
36. Dong, M., Yue, X., Shi, X., Ling, S., Zhang, B. et al. (2019). Effect of dynamic pseudo threshold pressure gradient on well production performance in low-permeability and tight oil reservoirs. Journal of Petroleum Science and Engineering, 173(2), 69–76. https://doi.org/10.1016/j.petrol.2018.09.096 [Google Scholar] [CrossRef]
37. Guo, J., Zhang, S., Zhang, L., Qing, H., Liu, Q. (2012). Well testing analysis for horizontal well with consideration of threshold pressure gradient in tight gas reservoirs. Journal of Hydrodynamics, 24(4), 561–568. https://doi.org/10.1016/S1001-6058(11)60278-3 [Google Scholar] [CrossRef]
38. Zeng, J., Wang, X., Guo, J., Zeng, F., Zhang, Q. (2018). Composite linear flow model for multi-fractured horizontal wells in tight sand reservoirs with the threshold pressure gradient. Journal of Petroleum Science and Engineering, 165(5), 890–912. https://doi.org/10.1016/j.petrol.2017.12.095 [Google Scholar] [CrossRef]
39. Kim, H., Onishi, T., Chen, H., Datta-Gupta, A. (2021). Parameterization of embedded discrete fracture models (EDFM) for efficient history matching of fractured reservoirs. Journal of Petroleum Science and Engineering, 204(3–4), 108681. https://doi.org/10.1016/j.petrol.2021.108681 [Google Scholar] [CrossRef]
40. Zhao, Y., Yang, H., Wu, J., Liu, C., Chang, C. et al. (2022). Choke management simulation for shale gas reservoirs with complex natural fractures using EDFM. Journal of Natural Gas Science and Engineering, 107(4), 104801. https://doi.org/10.1016/j.jngse.2022.104801 [Google Scholar] [CrossRef]
41. Wang, C., Ran, Q., Wu, Y. S. (2019). Robust implementations of the 3D-EDFM algorithm for reservoir simulation with complicated hydraulic fractures. Journal of Petroleum Science and Engineering, 181(2), 106229. https://doi.org/10.1016/j.petrol.2019.106229 [Google Scholar] [CrossRef]
42. Chai, Z., Tang, H., He, Y., Killough, J., Wang, Y. (2018). Uncertainty quantification of the fracture network with a novel fractured reservoir forward model. SPE Annual Technical Conference and Exhibition, D031S030R006. Dallas, Texas, USA. https://doi.org/10.2118/191395-MS [Google Scholar] [CrossRef]
Cite This Article
 Copyright © 2023 The Author(s). Published by Tech Science Press.
This work is licensed under a Creative Commons Attribution 4.0 International License , which permits unrestricted use, distribution, and reproduction in any medium, provided the original work is properly cited.
 Downloads
 Citation Tools