
 Submit a Paper
 Propose a Special lssue
 Open Access
ARTICLE

Study on Evacuation Strategy of Commercial High-Rise Building under Fire Based on FDS and Pathfinder
1 Key Laboratory of Concrete and Prestressed Concrete Structures of Ministry of Education, Southeast University, Nanjing, 210096, China
2 Nanjing Yang Zi State-Owned Investment Group, Nanjing, 210096, China
* Corresponding Author: Ying Wang. Email:
Computer Modeling in Engineering & Sciences 2024, 138(2), 1077-1102. https://doi.org/10.32604/cmes.2023.030023
Received 19 March 2023; Accepted 21 June 2023; Issue published 17 November 2023
 View Full Text
 Download PDF
Abstract
With the development of economy and society and the growth of population, the high-rise and multi-function of commercial buildings have become an international trend. But it also poses huge fire hazards. Most of the existing studies’ research objects are predominantly high-rise residential buildings, without considering the impact of different functional zones (Standard floor, entertainment zone, office zone, equipment room and so on) and personnel distribution of commercial buildings evacuation. And the influence of using elevators to carry evacuees on the refuge floor on personnel evacuation is rarely studied. In this work, the fire scenario of the Yangtze River International Conference Center, a high-rise commercial building, is simulated with the Pyrosim program to get the necessary parameters under various fire scenarios and to calculate the available evacuation time TASET. At the same time, according to the complex functional zone of the commercial high-rise building and the distribution of people in different time periods, a reasonable evacuation strategy is developed and simulated by Pathfinder software. The results indicate that unorganized evacuation will lead individuals to take the erroneous evacuation route, resulting in a vast region of congestion; comprehensive consideration of the time staggering and the reasonable distribution of evacuation routes can significantly improve evacuation efficiency, and the TRSET of night and working hours is 36.6%–55.3% and 49.9%–79.6% of unorganized evacuation, respectively. For the night fire, 60% of the people use elevator-refuge floor to evacuate is the optimal strategy; for the fire during working hours, half of the people on standard floors use the elevator to evacuate and people on multifunctional floors evacuate in four batches is the best plan. The results of this study can provide viable solutions and a foundation for analyzing the fire evacuation and safety of big commercial high-rise buildings.Keywords
With the growth of population and economic and development of society, the creation of high-rise and integrated buildings has become a worldwide trend [1], which also poses numerous possible safety risks, including fire. According to the national fire data in 2021, the national fire rescue teams recorded 4057 high-rise building fires and 168 fatalities in 2021, an increase of 22.6% in fatalities compared to the previous year, including 3438 high-rise residential fires and 155 fatalities accounted for 84.7% and 92.3% of high-rise structure fires, respectively [2].The question of how to reduce the frequency of high-rise building fires and minimize the number of casualties caused by high-rise fires has garnered widespread interest from all sectors of society.
Existing research on super high-rise building fire has mostly concentrated on two aspects: the development pattern of super high-rise building fire and the evacuation of people during super high-rise building fire [3]. In early research, fire experiments were the most prevalent research method. In 1985, Marshall [4] conducted a fire test in a laboratory stairway of actual size 1/5 and tracked the levels of CO2 to study the spread pattern of fire smoke in a structure. Zhu [5] conducted an experiment on flue gas movement of shaft structure of super tall building, and discussed the influence of chimney effect, external wind force, pressure difference, CO concentration and fire source location on smoke diffusion. Due to the exorbitant cost of conducting fire experiments, the research of fire development patterns is gradually being supplanted by computer simulations as computer technology advances. Peppes et al. [6] built a numerical model of a fire in stairwells of a high-rise building, got the distribution of gas concentration, pressure, and other factors in the building through simulation, and analyzed the smoke flow pattern. Chen et al. [7] built a multi-layer zone model, divided the room where the fire occurred into several horizontal zones. Then, they calculated the vertical distribution of temperature under building fire using Runge-Kutta integration method, and subsequently enhanced the fire model based on this. Li [8] carried out fire simulation for high-rise structures, built a fire model using BIM and Pyrosim as the framework, and quantitatively assessed the temperature field, CO concentration, and other safety indicators under fire to ensure the scientific nature of the evacuation plan.
There are numerous floors and large vertical evacuation distances in high-rise buildings. For high-rise or super-high-rise buildings intended for commercial usage, the structures are more complicated, and the functional zones are numerous, which will make personnel evacuation extremely difficult. Despite the fact that, according to traditional fire escape theory, elevator escape is a dangerous method of egress, the use of stairs alone can no longer meet the requirements for emergency evacuation as the height of buildings increases [9]. Butler et al. [10] proposed a combined evacuation technique utilizing elevators and stairwell refuge floors in the case of a high-rise building fire, but no pertinent experimental validation was conducted. Zhu [11] separated the evacuation process of high-rise buildings into three processes: “horizontal evacuation”, “horizontal evacuation pathfinding mechanism”, and “vertical evacuation”, and conducted actual scene experiments respectively to analyze the decision-making preference of the psychological state during the evacuation process. Lotfia et al. [12] established a BIM model of a 28-story building and simulated post-earthquake fire. The results showed that the existing facilities were insufficient to provide safety guarantee for post-earthquake fire evacuation, and provided suggestions for the evacuation of high-rise buildings. Helbing et al. [13] conducted a simulation research on the panic phenomena generated during the evacuation of high-rise buildings and proposed a method to reduce the incidence of trampling incidents during the evacuation process; Liu et al. [14] simulated a fire in a 26-floor prefabricated house, and studied the evacuation situation under the fire with Pathfinder software, and discussed the feasibility and science of elevator and stair evacuation strategy. Ding [15] used Pathfinder software to simulate the convergence of the evacuation process in high-rise buildings and evaluated the feasibility of using elevators and staircases for mixed evacuation, but did not account for the utilization of refuge floors in in personnel evacuation.
In summary, existing studies on fire development and evacuation of high-rise buildings are primarily focused on high-rise residential buildings, without taking into account the influence of different functional zones and personnel distribution of comprehensive commercial buildings on the evacuation of people, and rarely considering the use of elevators to carry evacuees on the refuge floor. To address the existing problems, this work takes the Yangtze River International Conference Center, a commercial super high-rise building, as the research object, and simulates its fire scenarios with the commercial software Pyrosim to obtain the relevant parameters under different fire scenarios. Simultaneously, we optimize the comprehensive utilization of stairways and elevator-refuge floors for the real functional zones of the commercial high-rise building and simulate the evacuation process with Pathfinder software to obtain the optimal ratio of two different evacuation methods, providing a feasible plan and foundation for the personnel evacuation of large commercial high-rise buildings fire.
2 Theory of Fire and Personnel Evacuation in High-Rise Buildings
2.1 Basic Theory of Fire Development
Heat Release Rate (HRR) refers to the quantity of heat released per unit time, and the unit is W. In fire scenario settings, HRR is also referred to as the fire source power. Based on combustion experiments, researchers discovered that the heat release rates of various combustibles at the beginning of a fire evolve approximately according to the law of time squared, also known as t2 type fire [16], which can be written as the Eq. (1):
where
In fire scenario design, based on the various fire growth coefficients, t2 type fires are further subdivided into four types: slow, medium, fast, and ultra-fast, whose common scenarios and growth coefficients have the values presented in Table 1 [17].
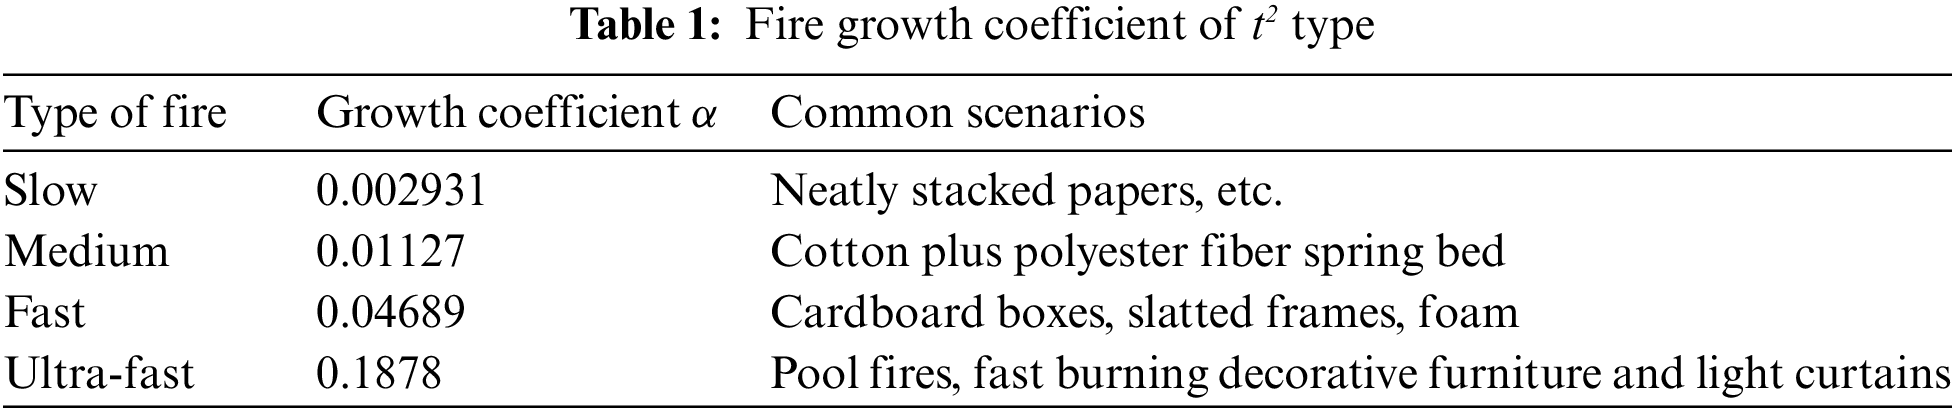
In this paper, due to the abundance of wooden furniture, curtains, clothing, and cables in the hotel, the fire type for simulation is specified as an Ultra-fast fire.
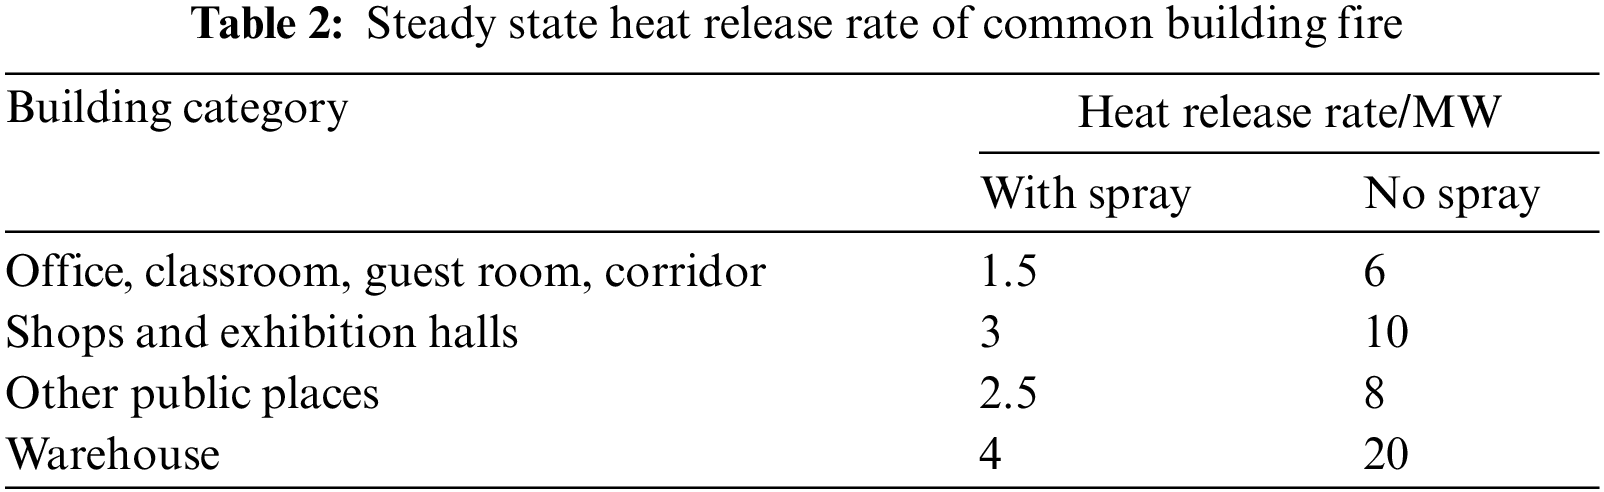
Fires may boom if not effectively controlled during the rapid growth phase, and after a period of combustion, the heat release rate will tend to a constant value that no longer increases, which is referred to the steady-state heat release rate of fire, as shown in Table 2.
2.2 Basic Theory of Personnel Evacuation under Fire
Whether people can evacuate safely under fire is determined by the available evacuation time TASET and the necessary evacuation time TRSET in this fire scenario. When the available evacuation time TASET is greater than the necessary evacuation time TRSET, it means that the evacuation time is sufficient and evacuees can escape from the fire scene before the fire danger limit state is reached; conversely, it means that the evacuation is hazardous, and people cannot evacuate the dangerous areas in time within the safe time at this time [18].
(1) Available evacuation time TASET
In the process of personnel evacuation safety assessment, establishing safety evacuation determination criteria is an important basis for determining the available evacuation time TASET. Therefore, it is necessary to analyze the fire safety factors and use them to determine the tolerance limit of personnel. These factors include temperature, visibility, toxic gas concentration, etc. [16], the international safety evacuation determination criteria are as follows:
(a) The temperature at 2 m above the ground shall not exceed 60°C.
(b) The visibility at 2 m above the ground shall not less than 10 m.
(c) The CO concentration at 2 m above the ground shall not exceed 500 ppm.
According to the above criteria, the available evacuation time TASET can be expressed by Eq. (2):
where, Ta is the time required for the temperature to exceed 60°C at 2 m above ground level; Tb is the time required for visibility to be less than 10 m at 2 m above ground level; and Tc is the time required for the CO concentration to exceed 500 ppm at 2 m above ground level.
(2) Necessary evacuation time TRSET
The necessary evacuation time, TRSET is the time required by a specific fire scenario for personnel to evacuate to a safe area from the occurrence of fire. This time is primarily governed by three components, which can be described by the Eq. (4)
where,
Since the time of
3 Numerical Simulation of High-Rise Commercial Building Fire Based on Pyrosim
Yangtze River International Conference Center, located in Nanjing Jiang Bei New District, is an international conference center integrating conference, exhibition, office, and supporting hotel functions, with a total construction area of approximately 187000 square meters. Fig. 1a shows the architectural appearance. Its main body consists of a large exhibition and conference hall with a total span of more than 130 m and a 34-story high-rise hotel, whose building elevation is shown in Fig. 2b.

Figure 1: Yangtze river international conference center

Figure 2: BIM model and pyrosim model for fire simulation
In this research, the building will serve as the object of a numerical simulation investigation of the fire process. In accordance with the Construction Drawing Design Description of Yangtze River International Conference Center, the commercial BIM software Revit is used to establish the 3D model of the high-rise hotel of Yangtze River International Conference Center. Import it into Pyrosim 2019, the initial building model for fire simulation is obtained illustrated in Fig. 2.
3.2.1 Setting of Fire Source Location
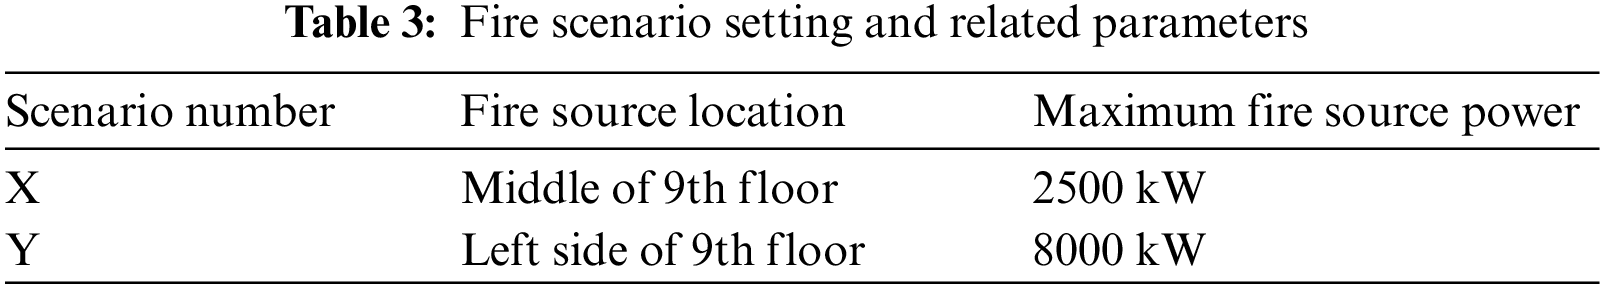
Since the fire mainly affects the space above the fire floor, the 9th floor is selected as the fire floor in order to expand the fire impact scope. And define two fire source locations, X near the middle stair and Y near the left stair, as shown in Fig. 3.

Figure 3: Structural layout and fire source location of the 9th floor
According to Eq. (2) and Table 1, the steady-state fire power is taken as 2.5 and 8 MW, respectively, in consideration of the large scale of the hotel, complicated structure, and wide variety of combustible materials. In this paper, two different fire scenarios are established, and Table 3 lists the important parameters of each scenario: When calculated according to the ultra-fast type of fire, taking the fire growth coefficient
3.2.2 Material and Background Parameter Setting
Using Material and Surface commands in Pyrosim software, the construction component materials are defined. Combining with the actual situation in Nanjing, the ambient temperature is set to 20°C, the relative humidity is set to 40%, and the atmospheric pressure is defaulted to standard atmospheric pressure; the smoke generation rate is set to 5% and the CO generation rate is set to 3‰ according to the response settings for hotel fires in the literature [16].
The analysis of grid sensitivity indicates that the empirical value of the grid size of 1/4-/16 of the characteristic flame diameter is the most appropriate [16], and the characteristic flame diameter D* is calculated by using Eq. (4)
where:
Combining the above calculated grid empirical values with the computing power of personal computers, all fire scenarios in this paper take a grid size of 0.2 m in the vicinity of the ignition point, and the grid size is 1.0 m at the location far from the ignition point. The total number of cubic meshes in this model is 415854.
3.2.4 Detection Device and Output Parameter Setting
Pyrosim provides numerous detection devices and variables output functions. According to the safety evacuation standards, CO concentration detection devices and temperature sensors are installed at the stairway entrance of each floor above the fire floor. Temperature and CO concentration slices are installed at each evacuation channel and corridor locations throughout the building. Smoke height monitoring is installed at the stairway entrance of the refuge floor, elevator waiting area and corridor.
3.3 Analysis on Operation Results of Fire Scenario
3.3.1 Analysis of Fire Scenario X
(1) Analysis of temperature field
As shown in Fig. 4, it is the image of the heat release rate varies with time of scenario X. The fire scene takes approximately 100 s to reach the maximum fire power, and then fluctuates around the maximum heat release rate. The average heat release rate in the stable phase is approximately 2250 kW, which is consistent with the ultra-fast fire scene established in this scene, reaching the maximum heat release rate of 2500 kW at 115.4 s.

Figure 4: Heat release rate-time image of scene X
Fig. 5 shows the temperature slices (The location of the temperature slice is indicated in Fig. 3) and 60°C temperature contour surface clouds in the corridor site (y = 17 m) of the high-rise building at 600 and 1200 s after the fire in scenario X. From the temperature slice nephogram, when the fire occurred 600 s, the temperature field in the middle of the fire floor and the adjacent floors above changes significantly, and the local temperature reaches more than 60°C. The staircase location of heat expansion of the air also along the corridor to the horizontal direction of diffusion, causing the temperature of the neighboring floors corridor to rise to about 40°C. When the fire has been burning for 1200 s, the hot air spreads in a horizontal and vertical direction, and its impact extends to the huge portion of the area above the fire floor. Simultaneously, as the fire spreads, areas below room temperature appear on the floors blow the location of the fire source (see dark blue areas in the Nephogram), suggesting that the heat from the areas below the location of the fire source is absorbed by the fire source. According to the 60°C isosurface, only the fire location and a small part of its upper portion have temperatures exceeding 60°C.

Figure 5: Temperature isosurface and 60°C isosurface at corridor location (y = 17 m) in scenario X at different moments
Fig. 6 shows the curve of temperature variation with time at the location of stairs on some floors. Which Fig. 6a is the central staircase location temperature change curve, it can be observed that after the fire, the fire floor and above the floor of the central stairway temperature are rising trend, the temperature and the distance from the fire floor is inversely proportional. Only the neighboring floors of the staircase temperature exceeds 50°C, and only the central staircase of the fire floor temperature exceeds 60°C, a with noticeable fluctuations. As Fig. 6b shows the temperature curve of the stairs on the left side of some floors, it is evident that the temperature of the stairs on the left side of each floor after the fire is not high and does not reflect the relationship between the temperature and the distance from the fire floor being inversely proportional. Even the 9th floor even has a trend of temperature decline, indicating that the fire source absorbs heat from other locations on the fire floor.
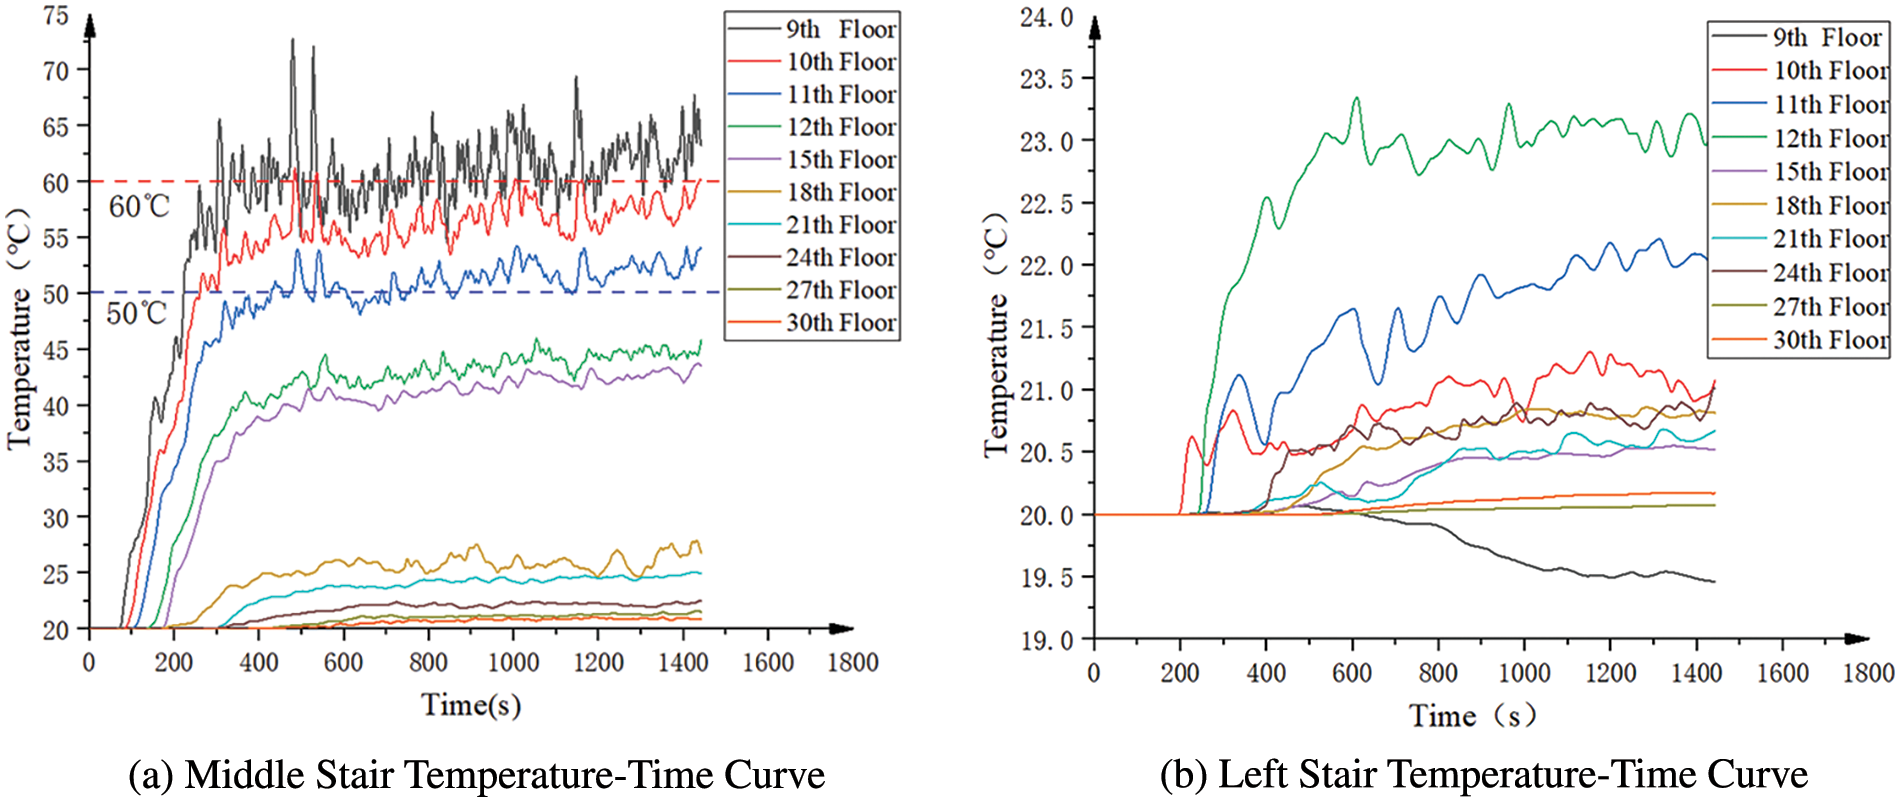
Figure 6: Temperature-time curve of stairs in partial floors of scenario X
Based on the above analysis, it can be observed that the temperature field in this scenario will not have a substantial impact on the evacuation of individuals within 20 min of the fire. Additionally, the general legislation of building fire development can be obtained: The fire source will absorb the surrounding heat, so that the adjacent floors below and around the local temperature reduction. Heat expansion of the air primarily along the stairs and other vertical channels flowing rapidly upward, resulting in notable temperature changes in the vertical direction, but also along the corridor and other channels to the horizontal direction of flow.
(2) Analysis of flue gas diffusion
Fig. 7 shows the 3D photos of smoke and the isosurfaces of visibility at 10 m in the high-rise building at 600 and 1200 s after the fire broke out. When the fire has been burning for 600 s, the smoke has rapidly spread along the vertical passage of the high-rise building and the influence range has reached the top floor. But the smoke concentration is not high at the moment and only the visibility of the stairs adjacent to the fire floor is lower than 10 m, which has little influence on evacuation. When the fire has been burning for 1200 s, smoke begins to spread around and below after reaching the top of the building. It has spread throughout the entire area above the fire floor, approximately 50% of the area visibility has been less than 10 m, which will have a certain impact on personnel evacuation at this time.
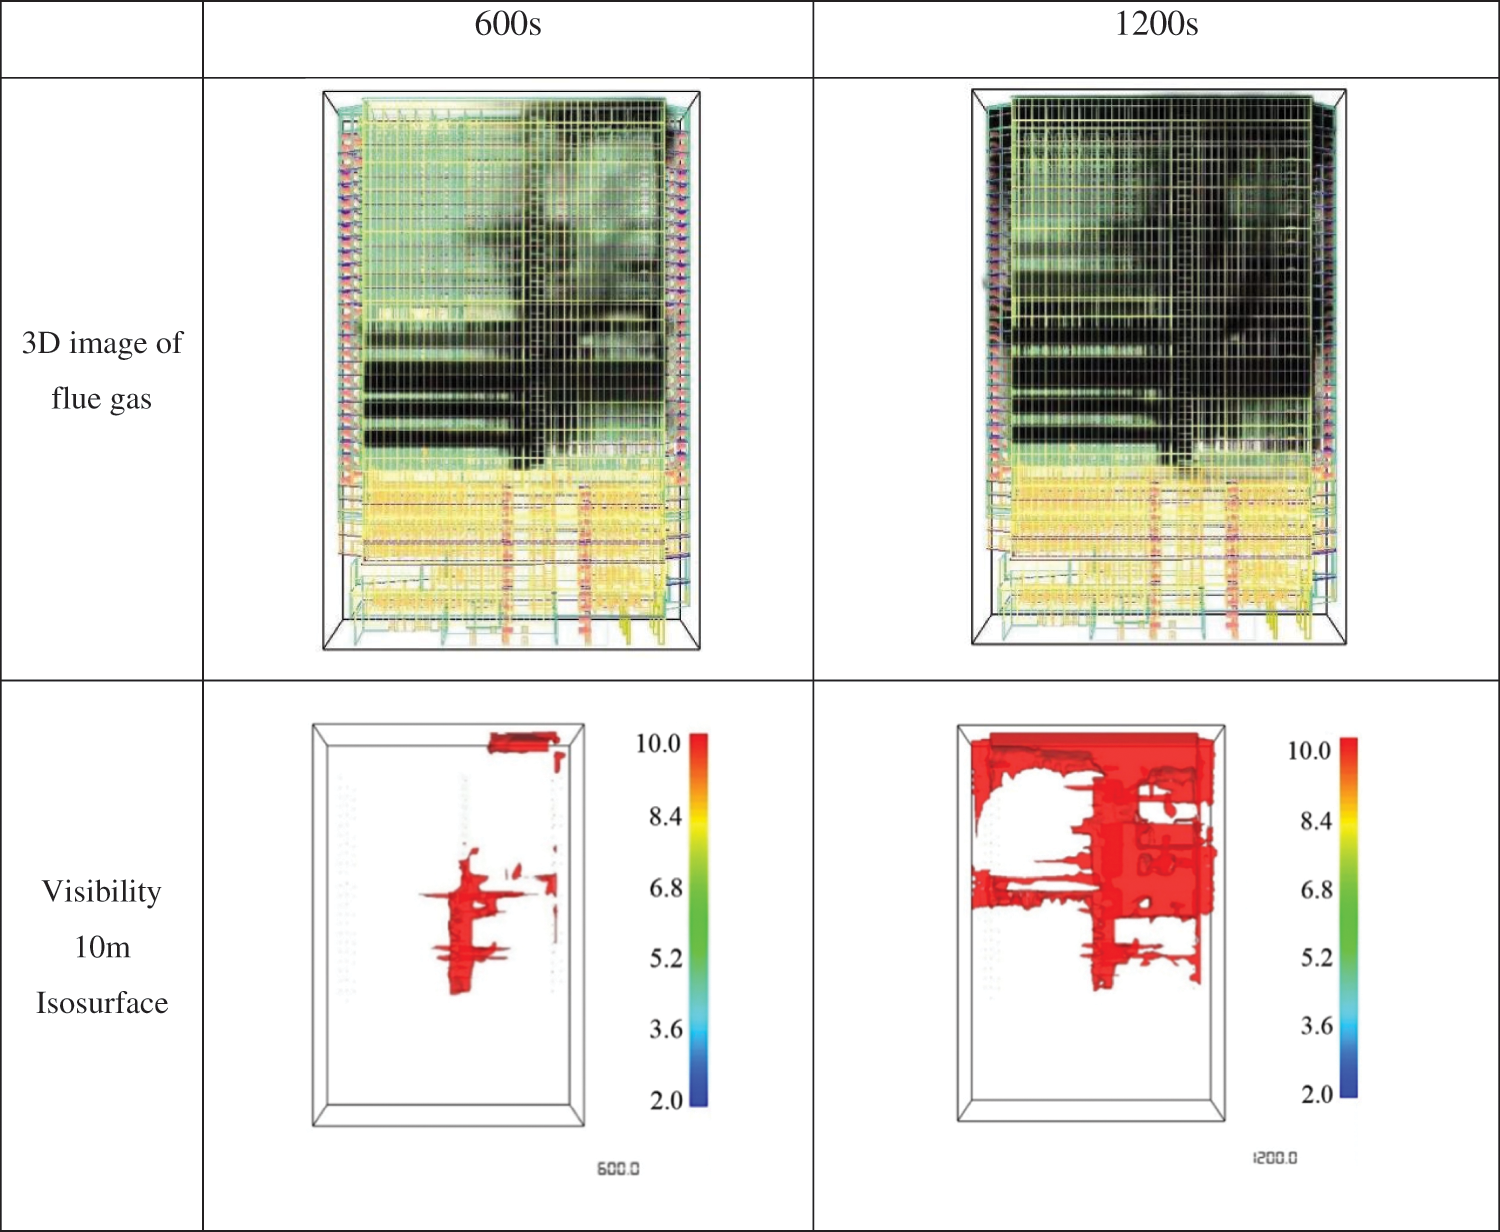
Figure 7: 3D image of smoke and visibility isosurface in scenario X at different times
(3) Analysis of CO concentration
Fig. 8 shows the corridor CO concentration slices after 600 and 1200 s of the fire in this scenario. Within 1200 s of the fire, the maximum concentration of CO does not exceed 45 ppm, which is significantly below the safety determination criterion of 500 ppm; therefore, it is assumed that CO will not impede the safe evacuation in this fire scenario.

Figure 8: Nephogram of CO concentration in scenario X at different times
According to the analysis of fire scenario X, neither the temperature field nor the CO concentration will have a significant effect on the evacuation of people within 20 min after the fire. The increase in smoke concentration will reduce visibility above the fire floor but will have little effect on the escape routes on both sides.
3.3.2 Analysis of Fire Scenario Y
Fig. 9 shows the heat release rate curve in Y fire scenario. In this scenario, the heat release rate of the fire source develops to the stable stage after about 200 s, and the average heat release rate in the stable stage is about 7500 kW. The results are consistent with the ultra-fast fire model with a maximum ignition power of 8000 kW, which will theoretically reach the maximum ignition power in 206.4 s.
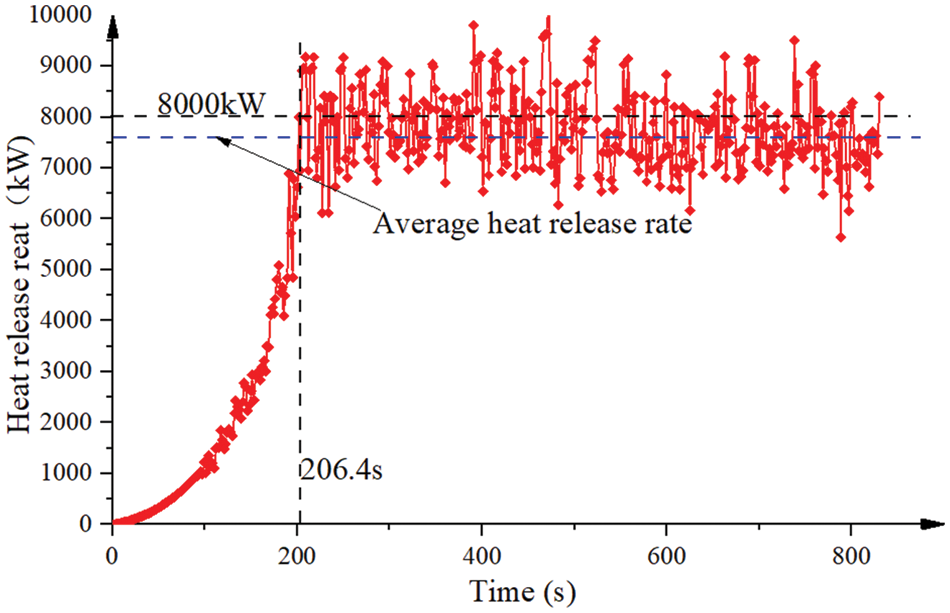
Figure 9: Heat release rate-time image of scene Y
(1) Analysis of temperature field
The Fig. 10 shows that the temperature slices and 60°C isosurfaces of the corridor location at 480 and 840 s following the fire for scenario Y. As shown in the image, when the fire lasts for 480 s in this scenario, only the temperature around the left side of the fire floor reaches 60°C, which has no obvious impact on the safety of evacuees. When the fire occurs for 840 s, the temperature influence range includes the left staircase of all floors above the fire floor and spread to the right down the hallway. Currently, the left staircase was inaccessible, while the central and right staircases were less affected.
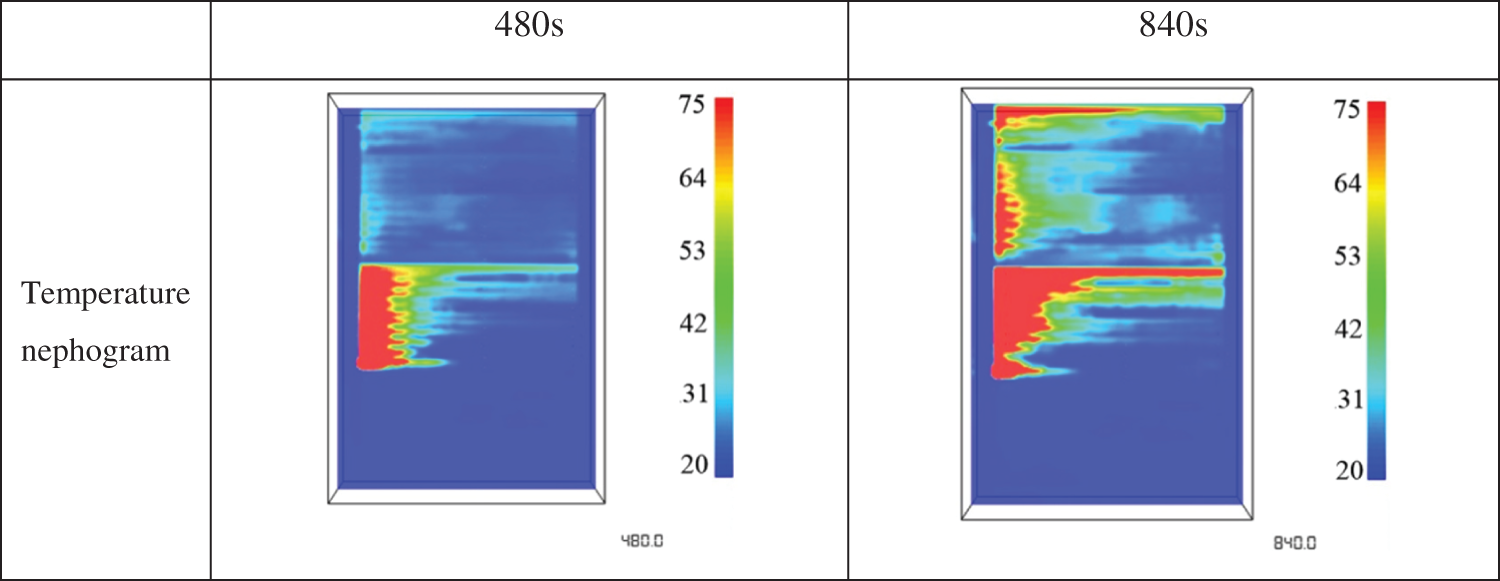

Figure 10: Temperature isosurface and 60°C isosurface at corridor location (y = 17 m) in scenario Y at different times
(2) Analysis of visibility
Fig. 11 shows the 3D images of smoke at 480 and 840 s of fire occurrence in the scenario Y, as well as the isosurface map of 5 and 10 m visibility. As shown in the figure, when the fire lasts for 480 s, a larger range of smoke has been produced, and visibility 10 m isosurface covers half of the area above the 9th floor. When t = 840 s, visibility 10 m isosurface impact range has covered almost all of the area above the 9th floor, and it is not recommended to continue evacuation at this time.

Figure 11: 3D image of smoke and visibility isosurface in scenario Y at different moments
(3) Analysis of CO concentration
As shown in Fig. 12 are slices of CO concentration at the corridor location at 840 and 480 s after the commencement of fire in the scenario Y. It can be shown that within 1000 s of the fire, the maximum concentration of CO does not exceed 80 ppm, which is still far below the safety determination level of 500 ppm. Therefore, it is believed that CO will not impede the safe evacuation in this fire scenario.

Figure 12: Nephogram of CO concentration in scenario Y at different times
Due to the fact that the fire in this scenario mainly affects the stairs on the left side, the elevator and refuge floor can be used for evacuation. The preceding analysis demonstrates that the corridors of some floors will be affected by smoke during the development of the fire in this scenario, and that people evacuated using the elevator and refuge floor will be exposed to the corridor of the refuge floor and the elevator waiting area for a period of time. Therefore, it is necessary to conduct a quantitative study on the smoke situation in the evacuation floor. 1.8 m is deemed to be the maximum height of smoke impacting the evacuation of people, and the range above 1.8 m is considered safe.
The smoke height test device is installed in the middle of the corridor and the elevator waiting area on the 20th refuge floor, and the curve of smoke height variation with time is shown in Fig. 13. Fig. 13a demonstrates that the smoke height in the middle position of the corridor on the 20th floor refuge floor fluctuates significantly within 500 s after the fire, as a result of the flow of the rapidly heated airflow. only a few moments of the smoke height in this phase fall below the critical value of 1.8 m, and when the time reaches 500 s, the smoke height stabilizes at approximately 1.35 m. Fig. 13b shows that the smoke height in the elevator waiting area exhibits obvious fluctuations in the initial stage, but the overall trend is downward and stabilizes at around 1.2 m after 820 s, whereas it is higher than the critical height of 1.8 m before 820 s. Since people taking the elevator in the refuge floor are exposed to the elevator waiting area for a long period of time and corridor location has little impact on evacuation, it can be assumed that the smoke height at the refuge floor before 820 s has little impact on people evacuated by elevator.
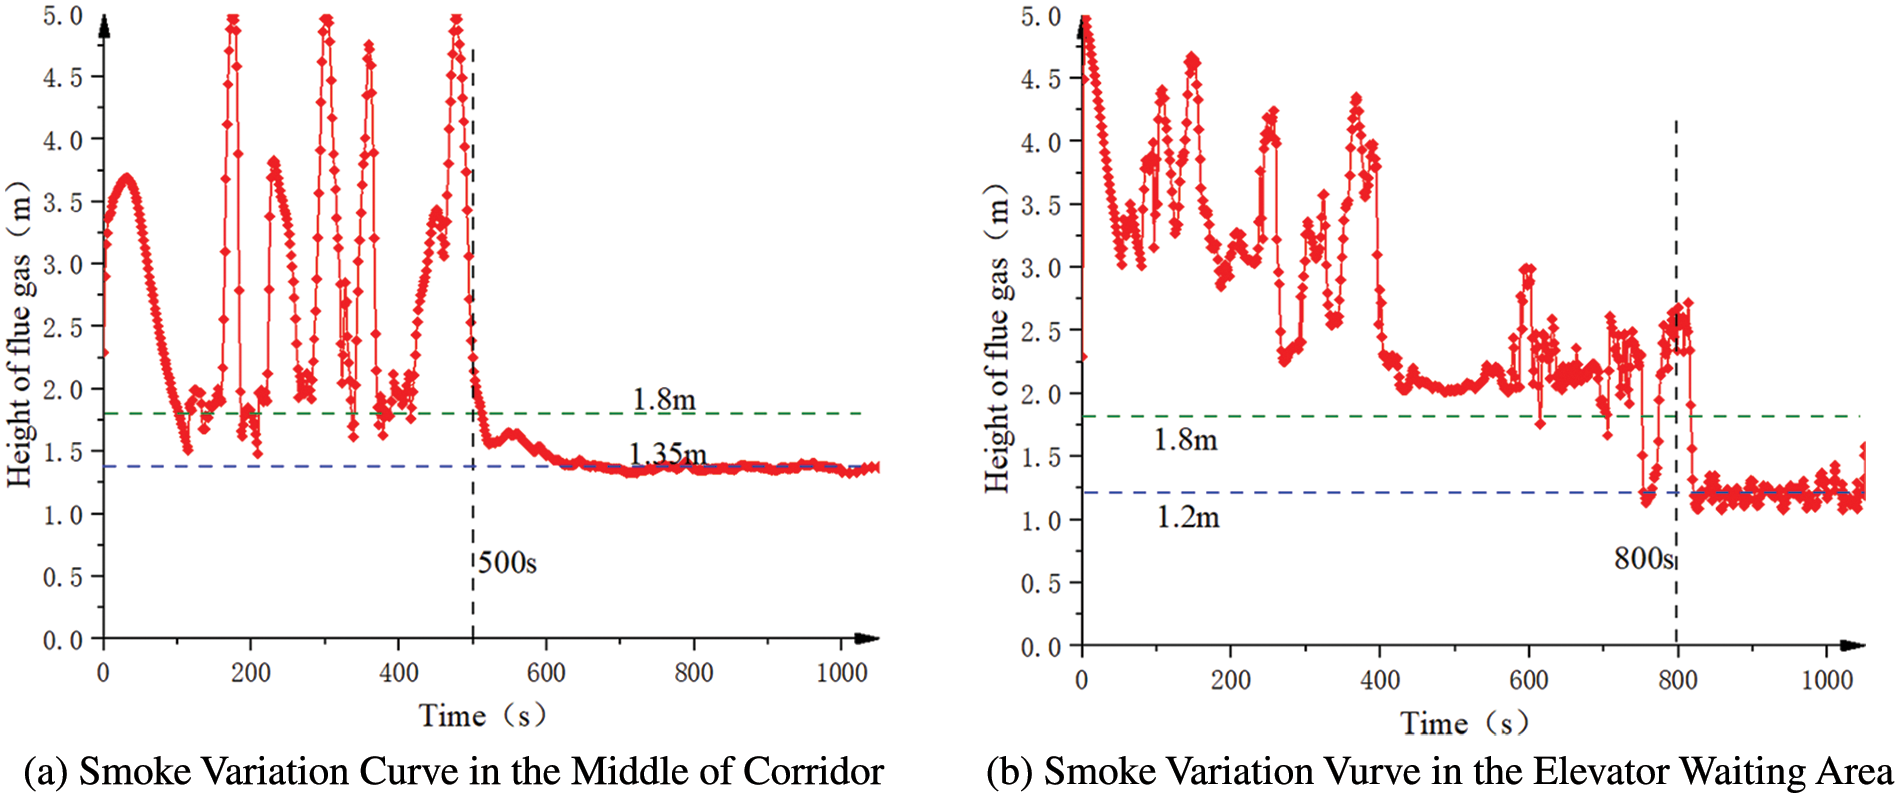
Figure 13: Variation curve of smoke height in corridor and elevator waiting area on the 20th floor of scenario Y
In conclusion, CO concentration will have no impact on personnel evacuation for the fire scenario Y (ultra-fast type fire growth model, whose maximum fire power is 8000 kW and fire source close to the left staircase on the 9th floor). When t = 840 s, both temperature field and visibility will affect personnel evacuation to some extent; the central staircase, elevator, and right staircase can be selected for evacuation; and the available evacuation time TASET in this scenario is taken as 840 s.
4 Simulation of Personnel Evacuation in Super High-Rise Building Fire Based on Pathfinder
Pathfinder is an evacuation simulation engineering software. The software provides users with model import capabilities and a 3D visual interface to import building models and define evacuee parameters and behaviors. The solver of the software also has a powerful simulation engine, which can simulate personnel evacuation according to user Settings. The result file can generate the heat map of personnel density at different times and the utilization rate of each escape channel and other data. The FDS model used for fire simulation in Section 3 is imported into Pathfinder 2019 and identified and adjusted to obtain the Yangtze International Conference Center 3D model in Pathfinder. In the pathfinder model, only the floor, partition wall and evacuation channel can be identified. The evacuees take different evacuation behaviors according to the commands set by users, and randomly choose evacuation ways to go to the nearest exit without specific instructions. Unreasonable evacuation schemes will lead to calculation termination due to excessive congestion of some channels.
In order to study the feasibility of using elevators, stairs, and evacuation floors for evacuation, this section uses the emergency evacuation simulation software Pathfinder to simulate the evacuation of people from the Yangtze River International Conference Center under the conditions of fire scenario Y (the fire source is located in the middle of the 9th floor and the maximum heat release rate is 8000 kW).
4.1 Zone Division and Evacuation Path Definition
Because of the numerous floors and complicated structure of the Yangtze River International Conference Center, the main body of the building is divided into zones and the zones involved are numbered, in order to reasonably deploy evacuation strategies and facilitate the description of the model and data collation.
The high-rise hotel of the Yangtze River International Conference Center has a total of 34 floors, with the 8th and 20th floors serving as refuge floors, designated as refuge floor I and refuge floor II respectively. As illustrated in Fig. 14a, each refuge floor is divided into left and right 2 refuge rooms, designated Ia, Ib, IIa, and IIb, respectively. As shown in Fig. 14b, the high-rise building is separated into three zones by utilizing two refuge floors: 1st to 7th floors are separated into the Zone A, which consists primarily of conference halls, multi-purpose halls, and a variety of leisure functional zones. 9th–19th floors are separated into the Zone B, which is positioned between two refuge floors and consists entirely of standard guest room floors; 21th–34th floors are separated into the Zone C, which consists primarily of standard guest room floors and equipment rooms, etc. Using the aforementioned zoning system, multiple evacuation schemes can be designed for people in different areas, and the adjacent refuge floor can be used reasonably to relieve evacuation pressure during the peak evacuation period and increase evacuation efficiency.
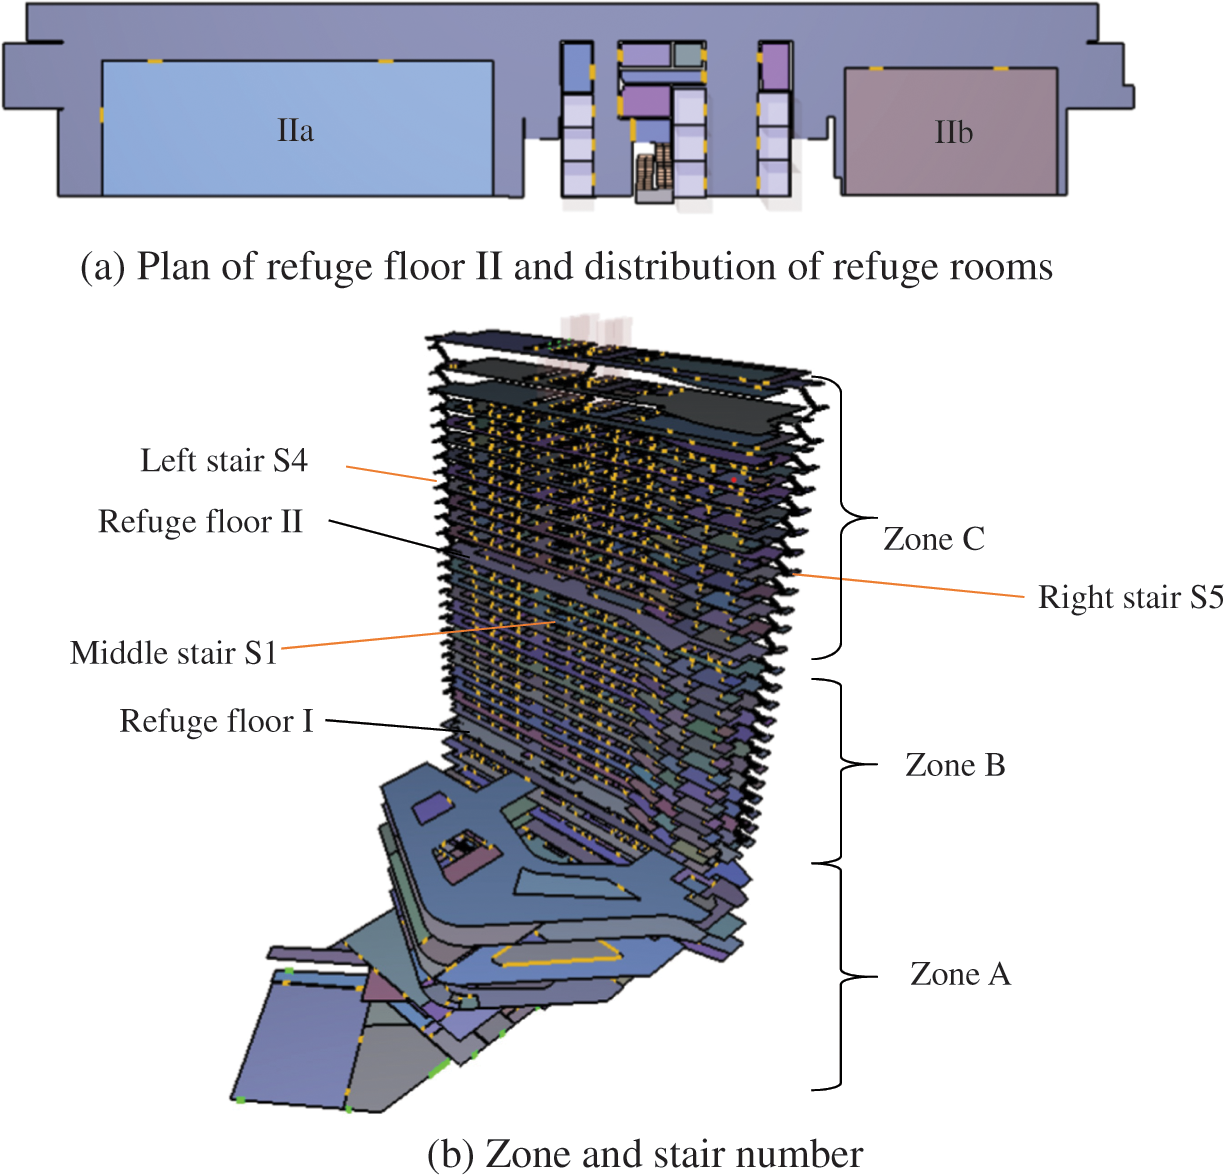
Figure 14: Zone division and numbering of Yangtze River International Conference Center
The main part of the high-rise building contains 9 elevators and 5 staircases, with the middle staircase S1 connecting the ground floor to any floor, S2 and S3 connecting the 1st floor to the 8th floor, and S4 and S5 on both sides connecting the 9th floor to the top floor.
4.2 Formulation of Evacuation Strategy
In order to make full use of the refuge floor and elevator, verify the feasibility of the mixed evacuation strategy of elevator-refuge floor and stairs in the evacuation process of super high-rise buildings, and take into account the reasonable allocation of time and space resources to prevent too many people in a certain channel at the same time, the evacuation crowd is now divided into two major groups: the elevator-refuge floor evacuation group and the stair evacuation group.
The evacuation flow of the evacuation group from the elevator-refuge floor is depicted in Fig. 15a.
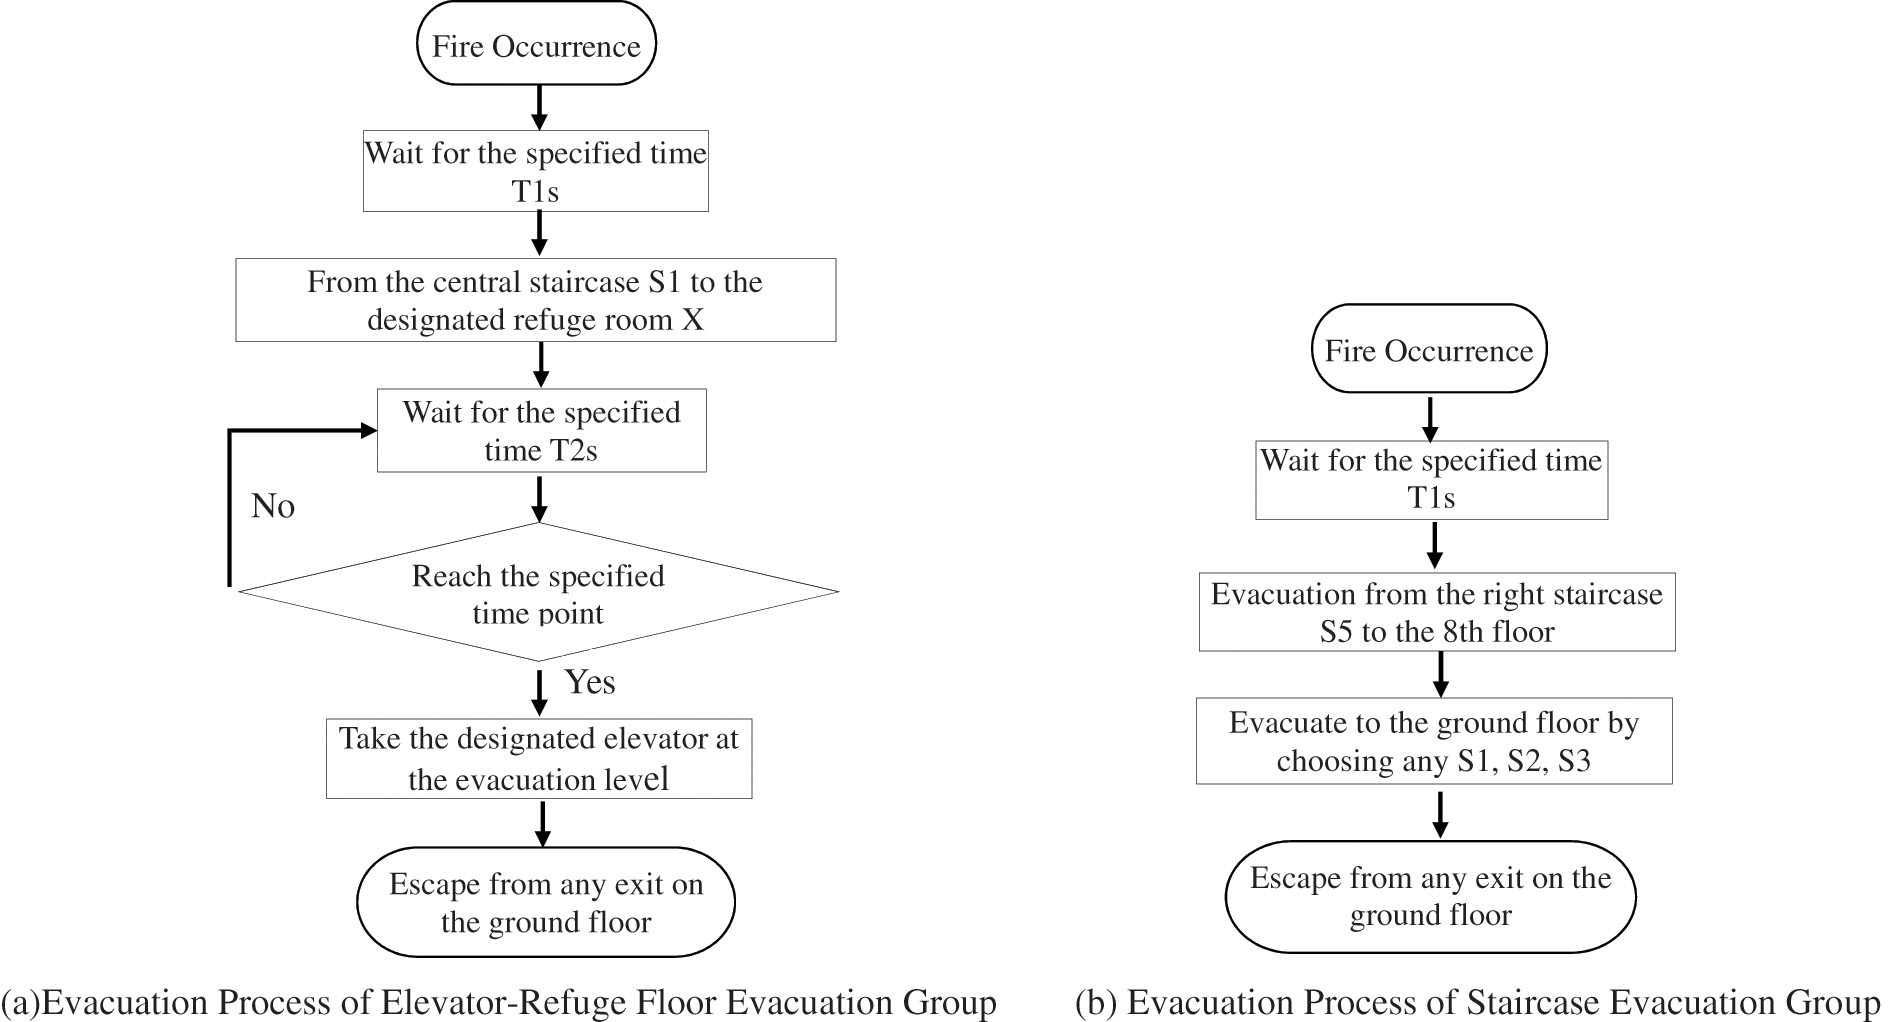
Figure 15: Flow chart of personnel evacuation behavior
(1) In the event of a fire, the designated evacuation crowd is divided into three groups on average and instructed to wait for T1 = 0, 30, 60 s, etc. This behavior serves two purposes: first, it can simulate the difference between the fire alarm
(2) After arriving at the designated time T1, evacuate the people in zone B to the refuge floor I from the central staircase and distribute the crowd equally into the refuge rooms Ia and Ib. At the same time, evacuate the people in area C to the refuge rooms IIa and IIb on the refuge floor II from the central staircase.
(3) The acceleration of the elevator is 1.2 m/s and the maximum speed is 2.5 m/s. The time from the first floor to the refuge floor I and refuge floor II is 21.2 and 44.5 s, respectively. The return time is the same as above, and it takes 14 s for the elevator to load and unload passengers, respectively. Therefore, it takes about 70 s that elevator is called on the first floor and go to the refuge floor I to pick up evacuees for safe escape, those who arrive at the refuge floor I must wait for 70, 140, 210 s....., until the last batch of evacuees using the elevator is evacuated, and then leave the refuge floor to take the elevator in order to maximize the protective effect of the refuge. Similarly, the cycle time for the elevator carries evacuees from refuge floor II is around 120 s, therefore evacuees on refuge floor II must wait for 120, 240, 360 s.....
Fig. 15b shows the evacuation process of people utilizing stairs. After the occurrence of a fire, people will also wait in place for the specific time and then carry out the staggered evacuation. The S4 stairs on the right side are used for evacuation to avoid impact on those evacuating to the refuge floor.
4.3 Definition of Evacuee Parameters
Since the people involved in daily access to the Yangtze River International Conference Center are young and middle-aged predominantly, the ratio of adult males, adult females, elderly, and children in the evacuation population is set at 4:4:1:1. According to statistical data from the published literature [19,20], the shoulder width of adult males is assumed to follow a normal distribution with a mean value of 42.5 cm. Likewise, the shoulder width data of females, the elderly, and children are assumed to follow a normal distribution with mean values of 39.5, 38, and 30 cm, respectively. According to the data from the SFPE manual, we take the evacuation speed of 1.35, 1.15, 0.8, and 0.9 m/s for adult male, adult female, elderly, and children, respectively [21].
The distribution of personnel is closely related to the time period: During the day, the majority of people congregate in the Zone A to attend meetings or various entertainment activities. At night, people in the hotel are mostly resting in the guest rooms, and there are fewer individuals in Zone A. Currently, the guest rooms are full, people are on higher floors, and the average distance from the escape exit is far. Therefore, this chapter will formulate evacuation strategies and simulate personnel evacuation respectively for two periods of night and working hours. In these two periods, the total number of people in the building is 1280, only the people are distributed on different floors.
4.4 Study on Evacuation Strategy of Fire Personnel at Night
4.4.1 Personnel Evacuation Simulation Scheme at Night
At night, when the guest rooms are full, there are around 30 people on each floor, the floor of zone A is set up with a random distribution of 50 to 100 individuals based on the actual situation, and there are 1280 people in the entire building.
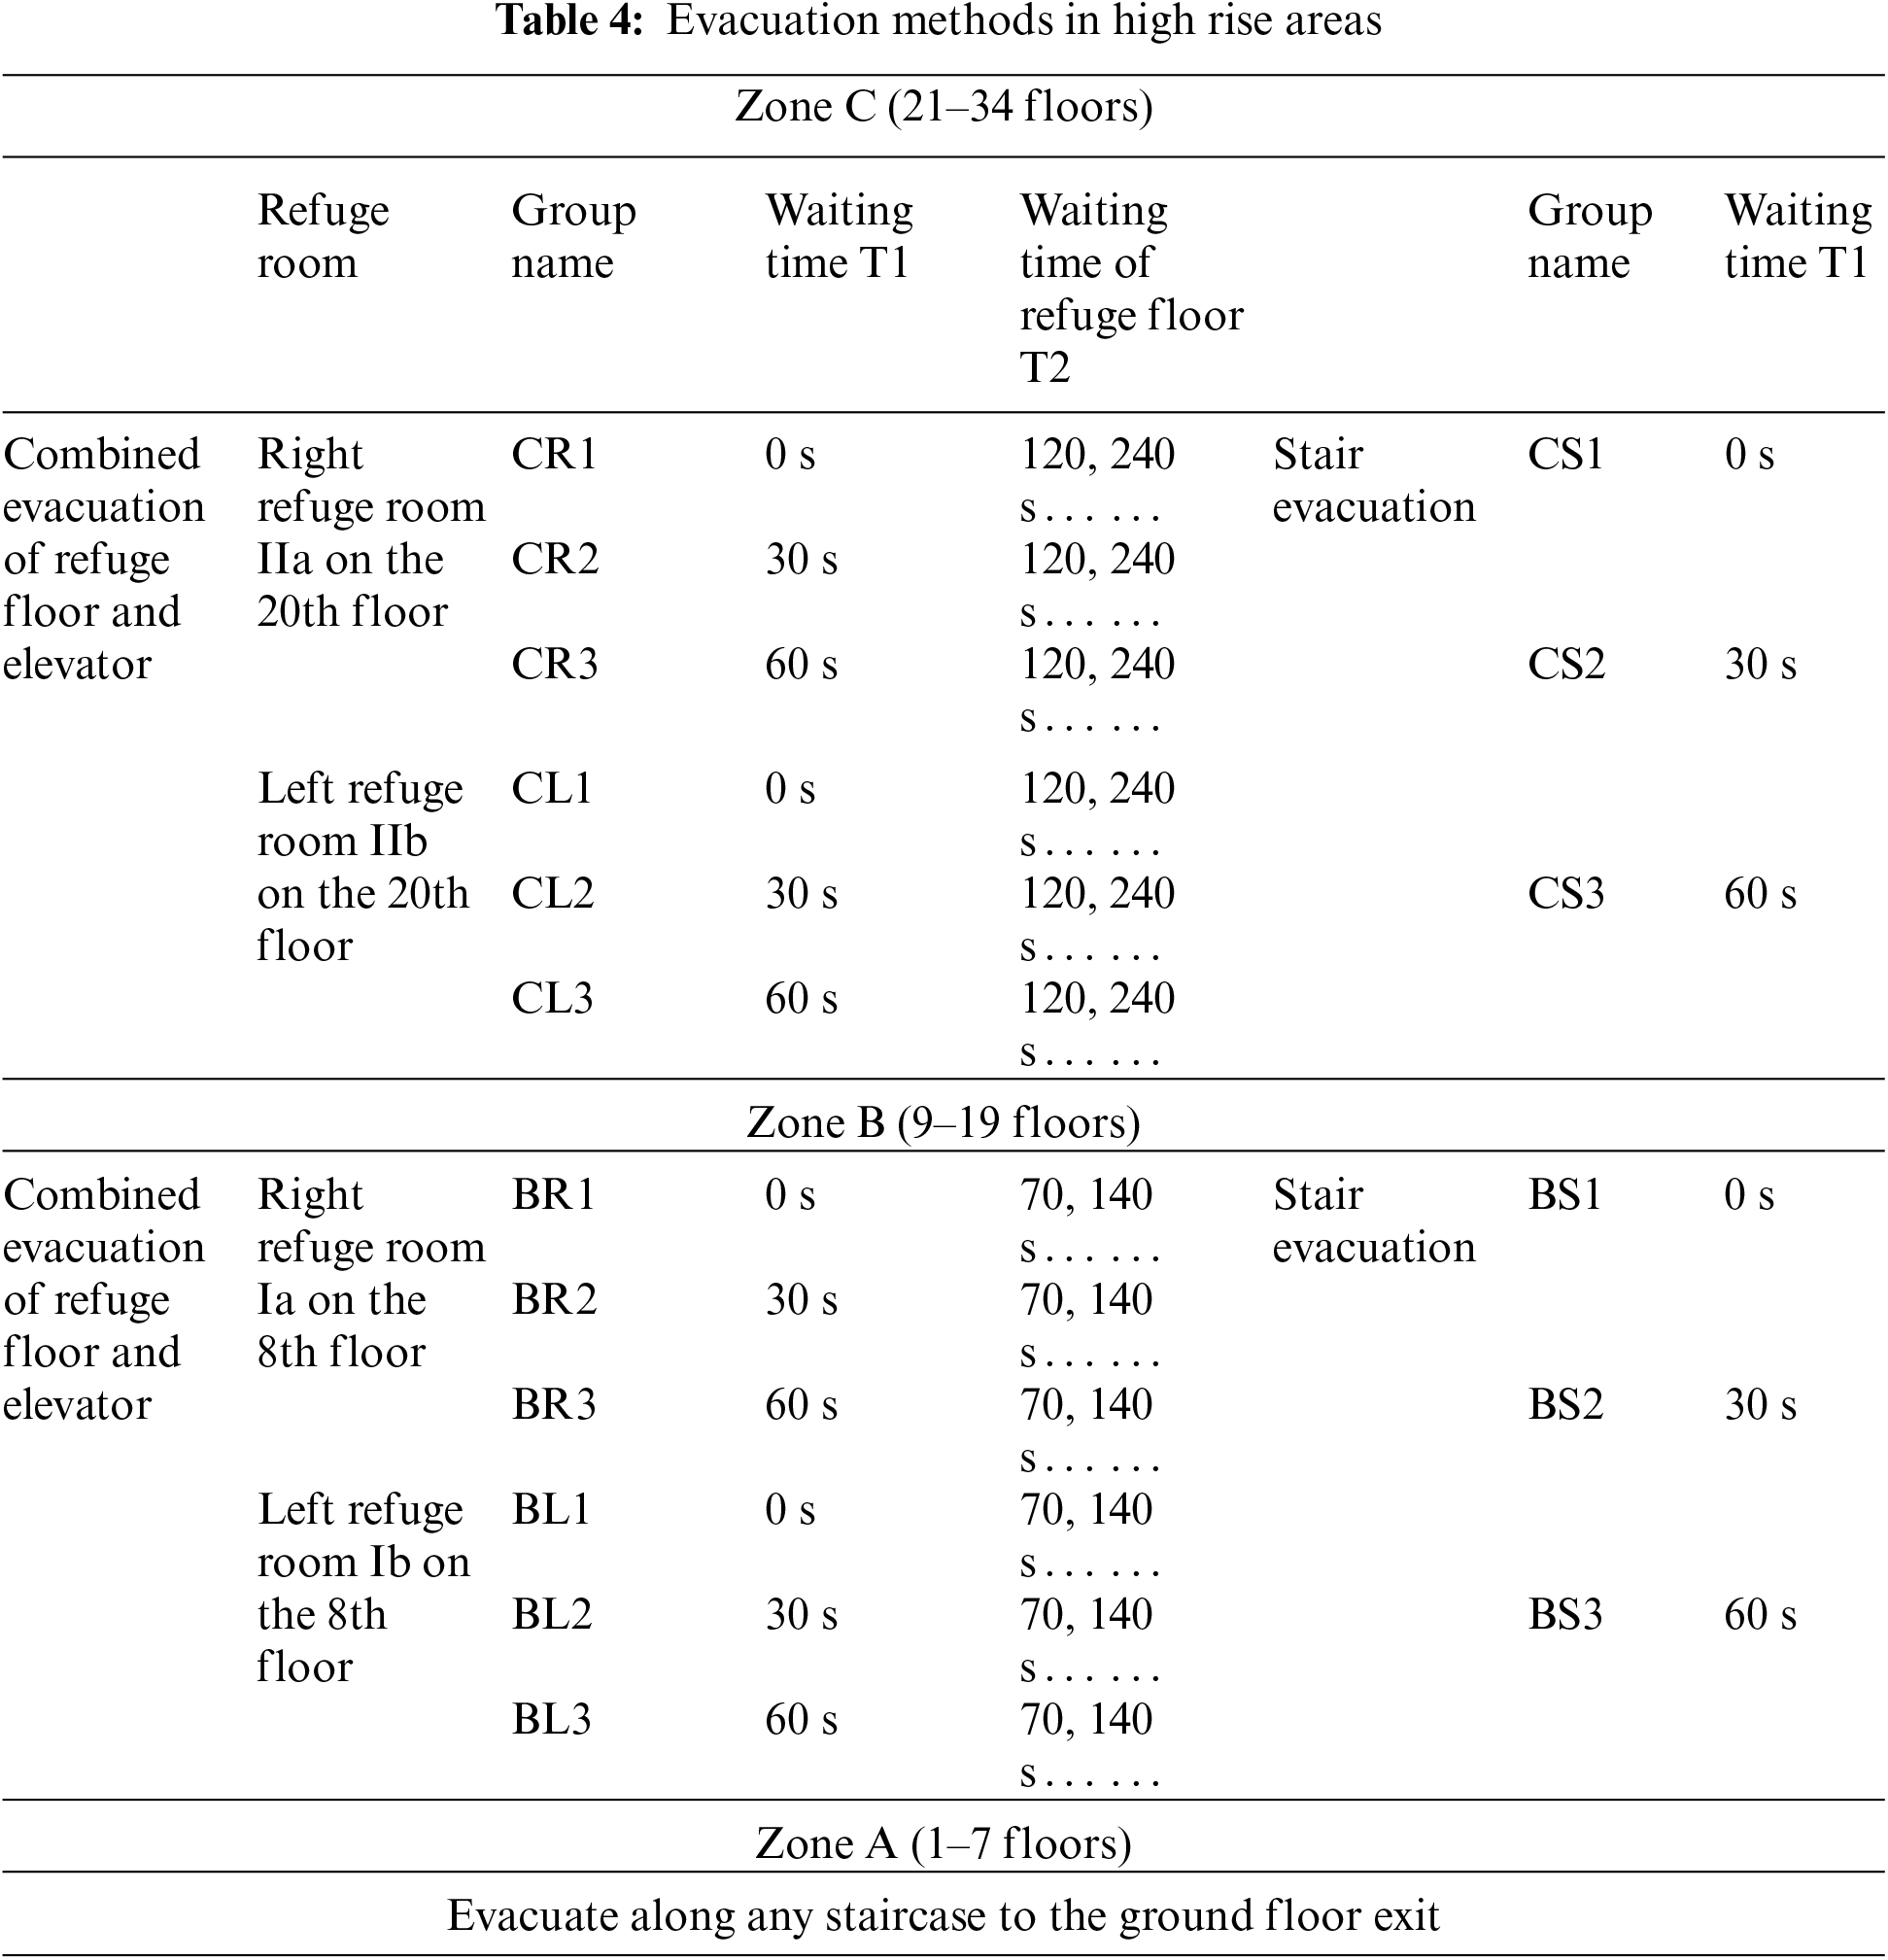
According to the above parameter settings and the area where the personnel are located, in order to make full use of the staircases and temporary refuge rooms, it is determined that personnel in Zone B and Zone C reach the designated refuge room on the designated refuge floor in proportion and wait for the elevator rescue, while the rest of the personnel evacuate through the staircases. All people in Zone A evacuate using the staircases. The evacuation methods for each area of the high-rise are detailed in Table 4.
According to the simulation analysis of fire scenario Y in Chapter 2, the available evacuation time TASET in this scenario is 840 s. Therefore, the design of the evacuation scheme should make comprehensive use of elevators, stairs and refuge floors, determine the optimal proportion of personnel in the two evacuation modes, and control the necessary evacuation time TRSET within 840 s. Therefore, the following evacuation schemes are set up.
(1) Unorganized evacuation: This scenario is not constrained by the evacuation principles created in the preceding section and is used to simulate a free evacuation without an evacuation plan, in which all 1,280 occupants can escape the building in any way they want.
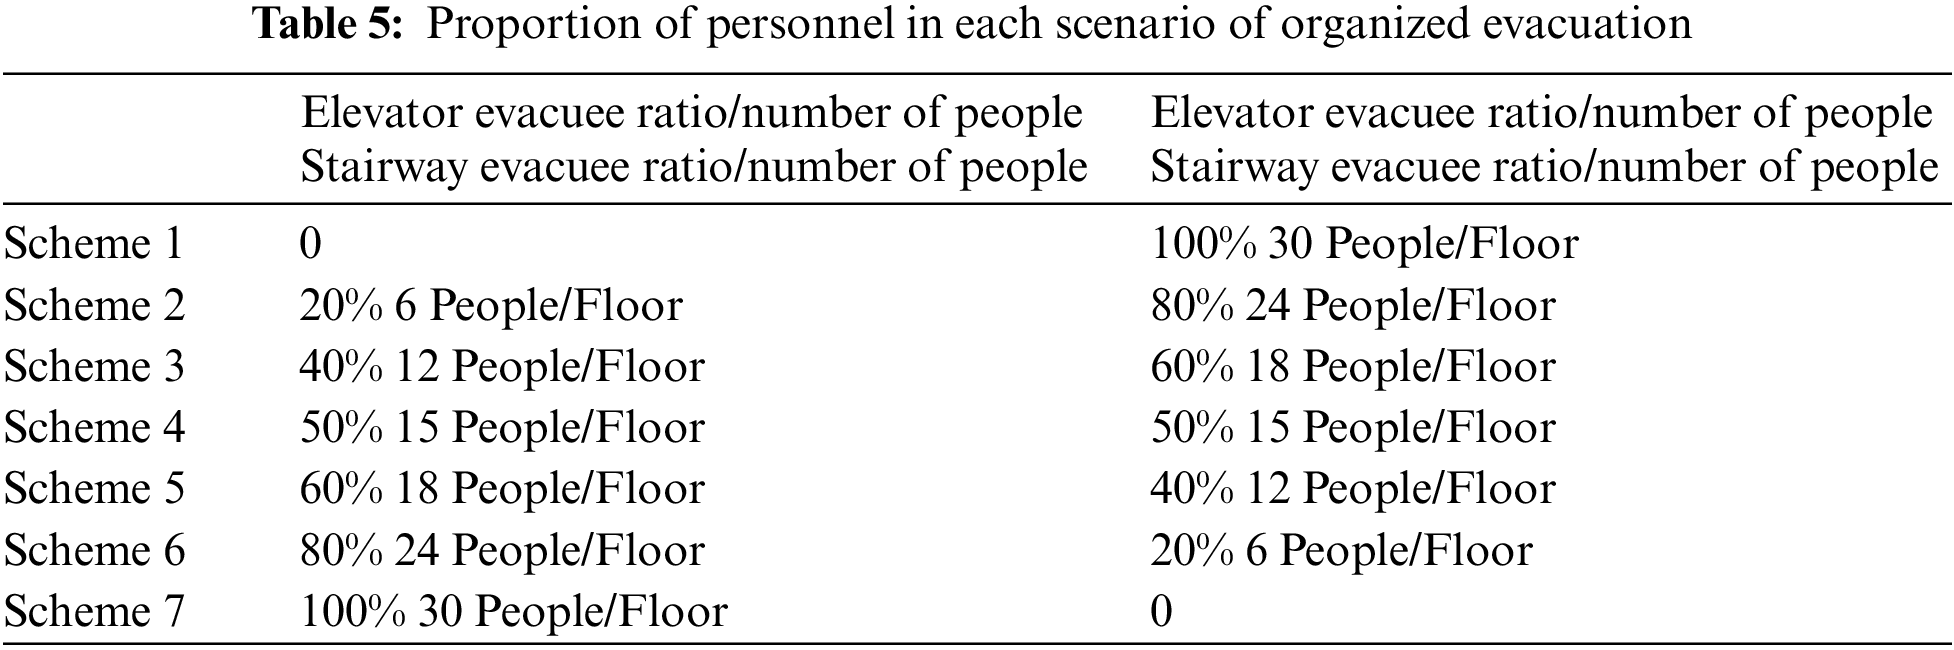
(2) Organized evacuation: The people evacuated utilizing stairwells and elevators in the typical floor are divided into seven schemes based on their proportions, as illustrated in Table 5.
4.4.2 Night Evacuation Simulation Results
(1) Simulation results of unorganized evacuation at night
Establish the model of unorganized evacuation scheme and perform simulation calculations. In this scenario, evacuated individuals randomly choose stairs or elevators on different floors for evacuation. The evacuation is completed in 1980 s, which has seriously exceeded the available evacuation time at that time.
Fig. 16 shows the curve of the remaining number of people in the high-rise building during the unorganized evacuation. It can be found that at the beginning of the evacuation, people evacuate more quickly; after 500 s, 505 people have already escaped from the building, as indicated by point M1 in the figure; this is because the crowd in Zone A is closer to the escape exit and less prone to congestion, so they escaped quickly within the safe time. Then, the curve has a stepped pattern, indicating that the individuals in some locations B and C are divided into certain batches by the elevator round-trip, resulting the efficiency of evacuation reduce significantly. After 1200 s, there are still 107 people trapped in the building (see point M2 in the figure); finally, the curve tends to be horizontal, showing that some people chose the incorrect evacuation method. And the last 27 people still take 480 s after 1500 s to find the escape exit.

Figure 16: Unorganized evacuation curve at night
The preceding analysis demonstrates that in the absence of evacuation plans and evacuation drills, unorganized personnel evacuation in super high-rise buildings can have a detrimental impact on evacuation efficiency, and the actual time consumed by personnel evacuation has significantly exceeded the available evacuation time. Posing a significant risk in actual fire scenarios, therefore, it is necessary to conduct organized personnel evacuation.
(2) Simulation results of organized evacuation at night
According to the evacuation behaviors defined in Table 5 and the personnel distribution ratios shown in Table 6, the behaviors of personnel are defined in Pathfinder, respectively, the models of organized evacuation scenarios 1–7 are constructed and run for calculation. The necessary evacuation time
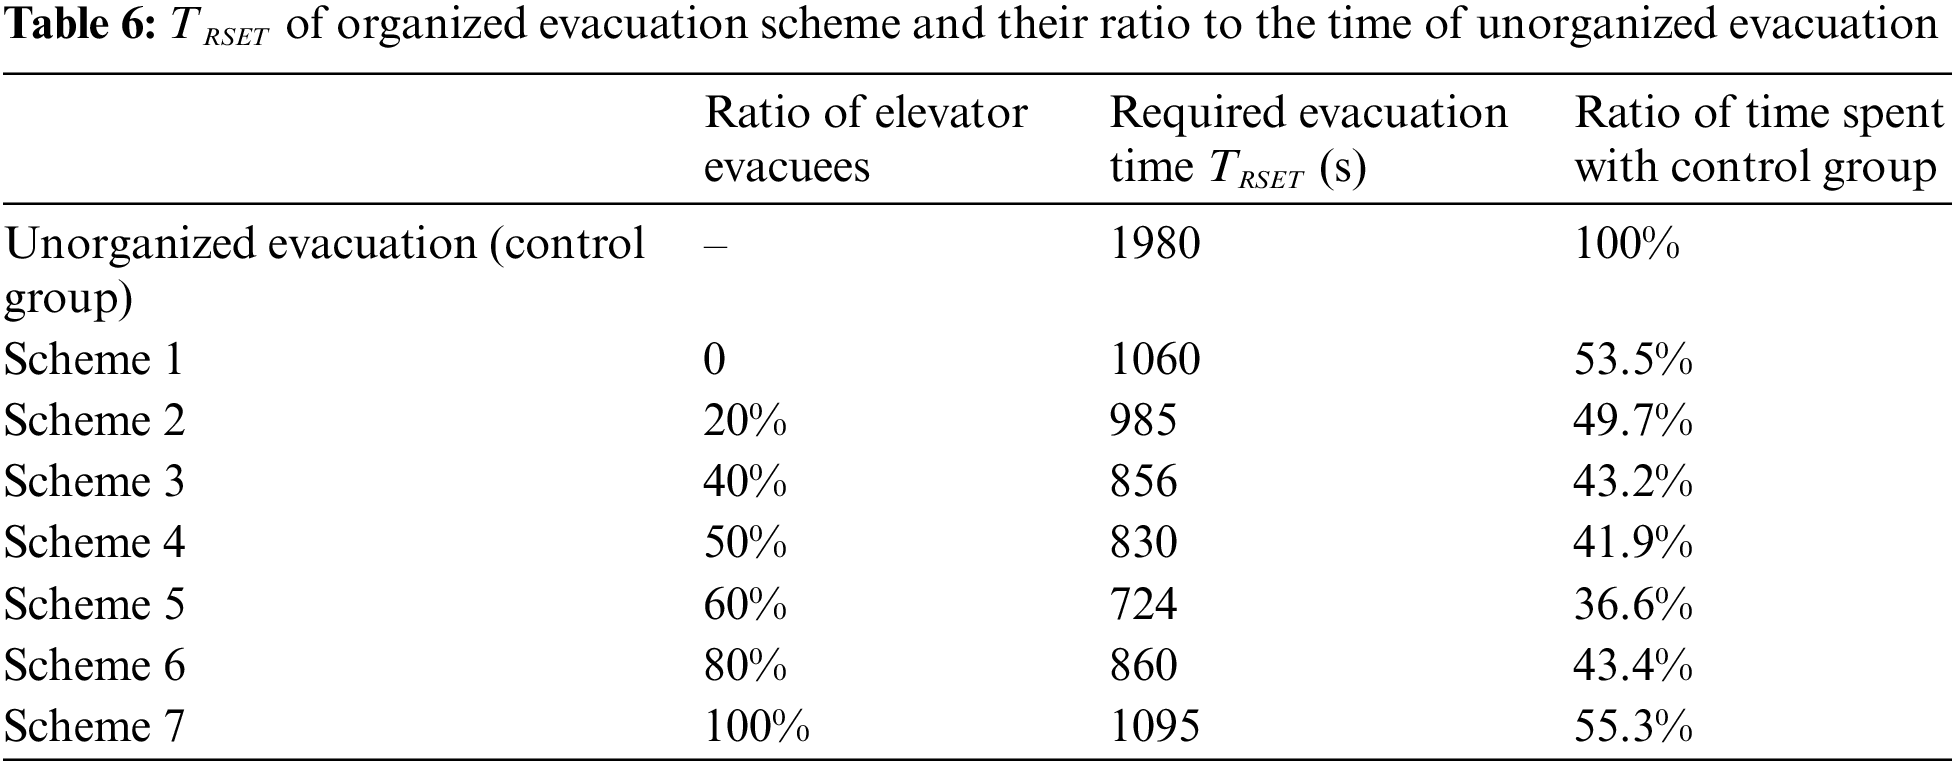
As shown in Fig. 17, the curves of the Personnel evacuation process in different Schemes during organized evacuation are plotted. In the case of organized evacuation, the curves of all evacuation schemes decrease with relatively stable slopes, demonstrating the absence of large-scale congestion and ineffective evacuation.Since the evacuation simulation is based on a fire scenario Y with a fire on the left staircase, and the available evacuation time TASET in this scenario is 840 s, only schemes 4 and 5 are completely safe evacuation scenarios, but since the exceeded available evacuation time TASET of schemes 3 and 6 is not much, and the flow of people has already escaped the danger area above the 9th floor at that moment. Therefore, it is believed that a more effective evacuation can be conducted if the proportion of evacuees using the elevator-refuge floor is is controlled at 40%–80%.

Figure 17: Curves of personnel evacuation process in different schemes of organized evacuation at night
4.5 Study on Fire Evacuation Strategy during Working Hours
During working hours, people are mainly concentrated in the conference hall, exhibition hall and other functional areas in Zone A, but some people still rest in the guest rooms. Therefore, the number of people on the standard floor is reduced to 10 people on each floor, and the rest people are evenly distributed to each floor in Zone A.
4.5.1 Personnel Evacuation Simulation Scheme during Working Hours
(1) Unorganized evacuation: the unorganized evacuation scheme is still set in the evacuation simulation during working hours, which is used to form a contrast with the scheme setting evacuation rules. All 1280 people in the hotel can choose the evacuation way to escape from the building.
(2) Organized evacuation: The formulation of evacuation strategy in case of fire during working hours still needs to consider the proportion of people evacuated from the elevator to the refuge floor in Zone B and C.
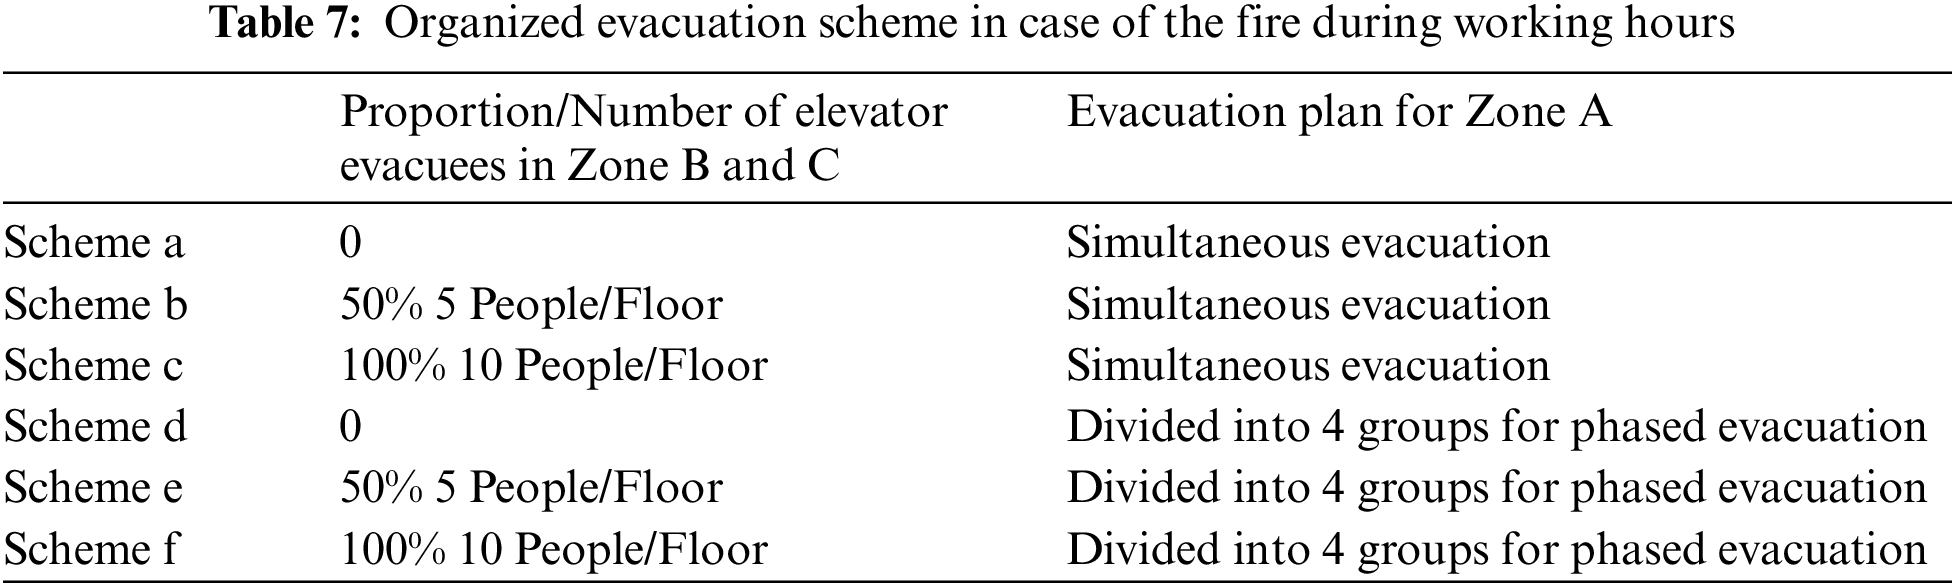
Since people in the hotel are mainly distributed in Zone A during working hours, and there are only 250 people in Zone B and C, which is not easy to get congested, the proportion of people who use the elevator-refuge floor does not need to be divided into multiple schemes. It is only necessary to consider that the evacuation personnel using the elevator-refuge floor account for 0%, 50% and 100% of the total number of people. The two evacuation modes still follow the behavior process shown in Fig. 13.
Because the people in Zone A are very dense, which is easy to cause congestion, it is necessary to set the phased evacuation strategy for the people in Zone A. The people on each floor in Zone A are divided into 4 groups in equal proportion. When the fire breaks out, the members of the four groups wait in place for 0, 30, 60 and 90 s respectively to start evacuate.
Table 7 lists the organized evacuation scheme in case of a fire during working hours based on the preceding evacuation strategies.
4.5.2 Working Hours Evacuation Simulation Results
(1) Simulation results of unorganized evacuation during working hours
The model of unorganized evacuation at night is established and calculated. In this scenario, people in the building randomly choose evacuation methods to escape from the hotel. Fig. 18 shows the curve of the remaining number of people in the building changing with time during evacuation. As can be seen from the figure, 1280 people in the hotel have been evacuated after 1017 s since the fire broke out. There are several relatively stable stages in the evacuation curve, N1 and N2 as shown in the figure, indicating that congestion or wrong route selection leads to reduced evacuation efficiency.

Figure 18: Unorganized evacuation curve during working hours
(2) Simulation results of organized evacuation during working hours
According to the parameters set in Table 7, 6 evacuation strategies for fire during working hours are modeled and calculated, and TRSET of each strategy and its ratio to the time used for unorganized evacuation are obtained, as shown in Table 8. It can be seen that the design of evacuation schemes for people in different zones can improve evacuation efficiency in different degrees, and the TRSET of necessary evacuation time can be reduced to 49.9%–85.1% of unorganized evacuation.
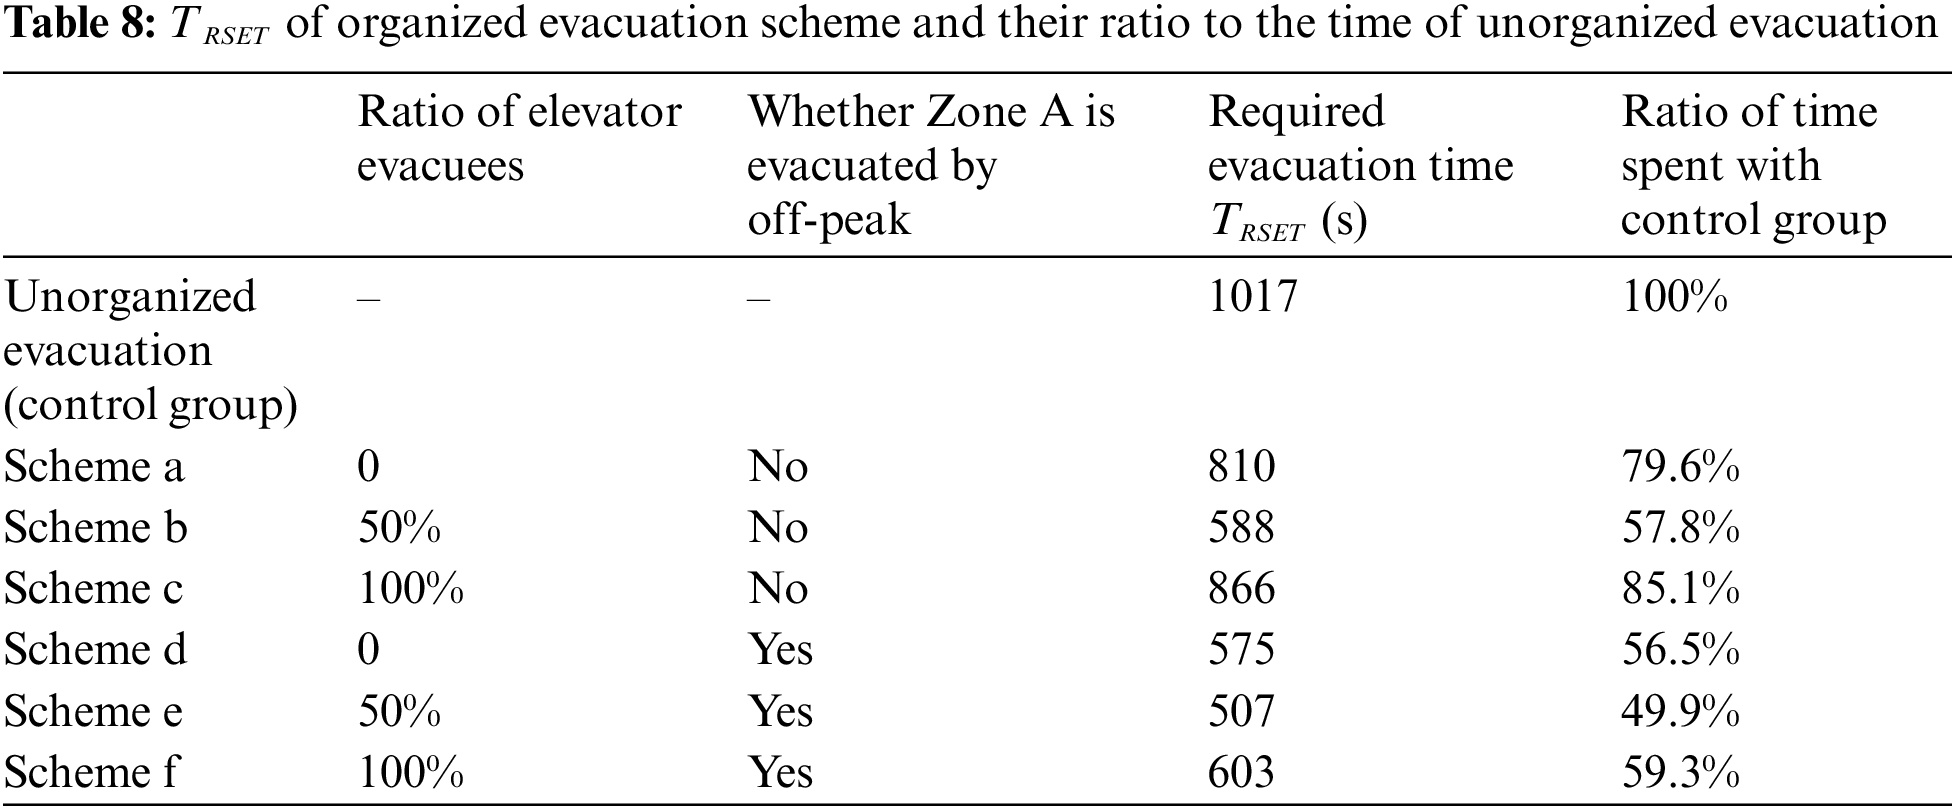
Fig. 19 shows the evacuation process diagram of six organized evacuation schemes during working hours. As can be seen from the figure, the evacuation curves of plans d, e and f are significantly lower than those of plans a, b and c, indicating that for dense personnel in Zone A, 4 batches of phased evacuation can significantly improve the evacuation efficiency during working hours, and the simultaneous evacuation of dense personnel is an important cause of congestion. For scheme d, e and f with phased evacuation, the evacuation curves in the early stage basically coincide, but scheme e has higher efficiency in the later stage, while the curves of schemes d and f tend to be gentle in the later stage.

Figure 19: Curves of personnel evacuation process in different schemes of organized evacuation during work hours
This is because the people in Zone A left the building in batches in the early stage, and the few remaining people in Zone B and C left the building in the end. It is more reasonable when 50% of the people in Zone B and C choose the elevator-refuge floor to evacuate, which can help improve the overall evacuation efficiency. This rule is also reflected in schemes a, b and c that do not set Zone A as phased evacuation, and the evacuation efficiency of scheme b in the later stage is significantly higher than that of scheme a and scheme c.
For the problem of complex structure of super high-rise commercial buildings, frequent fires, and evacuation difficulties, this paper conducts fire numerical simulation, using the high-rise hotel of the Yangtze River International Conference Center as the research object. Different evacuation simulation strategies are proposed and simulated in the context of specific fire scenarios. Relevant conclusions are as follows.
(1) The fire model built in this paper using Pyrosim can simulate the fire growth of super high-rise buildings, and the error between the obtained heat release rate curve and the theoretical value is acceptable. A fire with a maximum heat release rate of 2000 kW does not have a significant effect on the evacuation of people in 1200 s, while a fire with a maximum heat release rate of 8000 kW has an evacuation time TASET of approximately 840 s.
(2) When the fire occurs, the fire source will absorb the surrounding heat, so that the adjacent floors below and around the local temperature reduction. Heat expansion of the air primarily along the stairs and other vertical channels flowing rapidly upward, resulting in a notable increase in temperature in the vertical direction, but also along the corridor and other channels to the horizontal direction of flow. The evacuation of people on the floor below the fire source is not affected.
(3) When the evacuation of the crowd is not planned or rehearsed, the unorganized evacuation causes the crowd to choose the incorrect evacuation route, resulting in severe congestion, and the TRSET reaches 1980 s at night and 1017 s during working hours, which significantly exceeds the available evacuation time TASET.
(4) When the fire source is distant from the elevator, it is feasible to evacuate utilizing the elevator-refuge floor. Using the evacuation strategy proposed in this paper, which considers the staggered time and the reasonable distribution of evacuation routes, the evacuation efficiency can be significantly improved, and TRSET of night and working hours is 36.6%–55.3% and 49.9%–79.6% of unorganized evacuation, respectively.
(5) According to the evacuation strategy in this paper, when a fire breaks out at night, a better evacuation effect can be achieved when 40%–80% of people are evacuated by using the Elevator-refuge floor, when the ratio is 60%, TRSET is only 724 s, which is the optimal evacuation scheme. For the fire occurring during working hours, when half of the personnel in Zone B and Zone C are evacuated by elevator, and the personnel in Zone A are evacuated by 4 batches at different peaks, it only takes507 s, which is the optimal scheme.
The research results of this paper can provide reliable suggestions for personnel evacuation under fire in high-rise commercial buildings with complex structures, but there are still many shortcomings in this paper. For example, the setting of fire scene and the simulation of fire dynamics do not consider the influence of mechanical smoke exhaust, spray system and other equipment. At the same time, the setting of personnel evacuation strategy does not consider the influence of artificial assisted rescue and other factors, and the setting of fire background is relatively simple. We will conduct more detailed and in-depth research on the above issues in the future.
Acknowledgement: Thanks to the help of four anonymous reviewers and journal editors, the logical organization and content quality of this paper have been improved.
Funding Statement: The works described in this paper are substantially supported by the grant from the Key Technologies Research and Development Program (Grant No. 2021YFF0602005), the National Natural Science Foundation of China (No. 51678135), and the Fundamental Research Funds for the Central Universities (Nos. 2242022k30031, 2242022k30033).
Author Contributions: The authors confirm contribution to the paper as follows: study conception and design: Zheng Yan, Ying Wang; data collection: Zheng Yan, Ying Wang, Longxiao Chao; analysis and interpretation of results: Longxiao Chao, Jian Guo; draft manuscript preparation: Ying Wang, Zheng Yan. All authors reviewed the results and approved the final version of the manuscript.
Availability of Data and Materials: Due to the ongoing nature of the project on which this research is based, the original data cannot be publicly shared. For those interested in this study, please contact the corresponding author of this paper for further information and access to the relevant data.
Conflicts of Interest: The authors declare that they have no conflicts of interest to report regarding the present study.
References
1. Li, D. C. (2018). Study on fire smoke spread law in vertical shaft of high-rise residential building. China: Anhui University of Science and Technology. [Google Scholar]
2. Tencent. National fire data released in 2021: High incidence of residential fire deaths. https://new.qq.com/rain/a/20220125A06EA800 [Google Scholar]
3. Yan, W. D. (2010). Experimental study on evacuation of multi-storey and multi-room building fire. Chengdu, China: Southwest Jiaotong University Press. [Google Scholar]
4. Marshall, N. R. (1985). Behavior of hot gases flowing within a staircase. Fire Safety Journal, 9, 245–255. [Google Scholar]
5. Zhu, J. (2008). Study on the law and control of smoke movement in vertical shaft structure of super tall building (Ph.D. Thesis). China: University of Science and Technology of China. [Google Scholar]
6. Peppes, A., Santamouris, M., Asimakopoulos, D. N. (2002). Experimental and numerical study of buoyancy-driven stairwell flow in a three storey building. Building and Environment, 37(5), 497–506. [Google Scholar]
7. Chen, X. J., Yang, L. Z., Deng, W. C., Fan, W. C. (2004). A multi-layer zone model for predicting temperature distribution in a fire room. Progress in Natural Science, 14, 536–540. [Google Scholar]
8. Li, Z. Y. (2021). Research on fire simulation and evacuation planning of high-rise public building based on BIM. Tianjin, China: Tianjin University of Technology. [Google Scholar]
9. Li, L., Wang, S. W., Li, R. H., Zhi, M., Wang, W. T. et al. (2021). Study on the joint evacuation simulation of stairs and elevators in high-rise buildings. Fire Science and Technology, 40(2), 197–201. [Google Scholar]
10. Butler, K., Kuligowski, E., Furman, S., Peacock, R. (2017). Perspectives of occupants with mobility impairments on evacuation methods for use during fire emergencies. Fire Safety Journal, 91, 955–963. [Google Scholar]
11. Zhu, Y. (2021). Study on experimental and simulation model of building evacuation considering psychological factors of personnel. China: Tsinghua University. [Google Scholar]
12. Lotfia, N., Behnam, B., Peyman, F. (2021). A BIM-based framework for evacuation assessment of high-rise buildings under post-earthquake fires. Journal of Building Engineering, 43, 102559. [Google Scholar]
13. Helbing, D., Farkas, I., Vicsek, T. (2000). Simulating dynamical features of escape panic. Central European Journal of Engineering, 11(6), 487–490. [Google Scholar]
14. Liu, C. F., Xu, Q., Qi, Q., Jia, Z. C., Guo, X. D. et al. (2022). Study on simulation and strategy of fire emergency evacuation in high-rise residential buildings. Journal of Catastrophology, 37(2), 174–181. [Google Scholar]
15. Ding, Y. C. (2014). Computer simulation research on vertical evacuation characteristics and evacuation strategy of high-rise buildings. China: University of Science and Technology of China. [Google Scholar]
16. Li, S. L., Li, X. B. (2019). Numerical simulation of FDS fire. Beijing, China: Chemical Industry Press. [Google Scholar]
17. Li, C. Y. (2020). Research on several typical building firefighting based on numerical simulation. Beijing, China: Chemical Industry Press. [Google Scholar]
18. Liu, H. F. (2019). Research on fire development and personnel evacuation of high-rise residential buildings. China: China University of Mining and Technology. [Google Scholar]
19. Society of Fire Protection Engineers (2007). SFPE engineering guide to performance-based fire protection. 2nd edition, pp. 1–207. National Fire Protection Association. [Google Scholar]
20. Chen, T., Yang, R., Sun, Z. H., Weng, W. G. (2007). A new composite fire evacuation (CFE) model based on human behavior. Proceedings: Building Simulation,703–708. [Google Scholar]
21. Yu, H. (2020). Research on fire safety evacuation of subway station based on fire dynamics and crowd evacuation simulation. China: South China University of Technology. [Google Scholar]
Cite This Article
 Copyright © 2024 The Author(s). Published by Tech Science Press.
This work is licensed under a Creative Commons Attribution 4.0 International License , which permits unrestricted use, distribution, and reproduction in any medium, provided the original work is properly cited.
 Downloads
 Citation Tools