
 Submit a Paper
 Propose a Special lssue
 Open Access
ARTICLE
An Innovative Deep Architecture for Flight Safety Risk Assessment Based on Time Series Data
1 Civil Aviation Flight Technology and Flight Safety Research Base, Civil Aviation Flight University of China, Guanghan, 618307, China
2 Airport Academy, Civil Aviation Flight University of China, Guanghan, 618307, China
3 School of Economics and Management, Civil Aviation Flight University of China, Guanghan, 618307, China
4 China Academy of Civil Aviation Science and Technology, Beijing, 101300, China
5 Flight Training Standards Branch, Civil Aviation Flight University of China, Guanghan, 618307, China
* Corresponding Author: Peiwen Zhang. Email:
(This article belongs to the Special Issue: Advanced Computational Models for Decision-Making of Complex Systems in Engineering)
Computer Modeling in Engineering & Sciences 2024, 138(3), 2549-2569. https://doi.org/10.32604/cmes.2023.030131
Received 23 March 2023; Accepted 01 August 2023; Issue published 15 December 2023
 View Full Text
 Download PDF
Abstract
With the development of the integration of aviation safety and artificial intelligence, research on the combination of risk assessment and artificial intelligence is particularly important in the field of risk management, but searching for an efficient and accurate risk assessment algorithm has become a challenge for the civil aviation industry. Therefore, an improved risk assessment algorithm (PS-AE-LSTM) based on long short-term memory network (LSTM) with autoencoder (AE) is proposed for the various supervised deep learning algorithms in flight safety that cannot adequately address the problem of the quality on risk level labels. Firstly, based on the normal distribution characteristics of flight data, a probability severity (PS) model is established to enhance the quality of risk assessment labels. Secondly, autoencoder is introduced to reconstruct the flight parameter data to improve the data quality. Finally, utilizing the time-series nature of flight data, a long and short-term memory network is used to classify the risk level and improve the accuracy of risk assessment. Thus, a risk assessment experiment was conducted to analyze a fleet landing phase dataset using the PS-AE-LSTM algorithm to assess the risk level associated with aircraft hard landing events. The results show that the proposed algorithm achieves an accuracy of 86.45% compared with seven baseline models and has excellent risk assessment capability.Keywords
Nomenclature
| LSTM | Long short-term memory network |
| PS-AE-LSTM | Improved risk assessment algorithm |
| AE | Autoencoder |
| PS | Probability severity |
| VANETs | Vehicular Ad-hoc networks |
| PS | Probability and severity |
| IATA | International air transport association |
| FHE | Fully homomorphic encryption |
| QAR | Quick access recorder |
| FDR | Flight data recorder |
| ANN | Artificial neural network |
| DBN | Deep belief network |
| NTSB | National transportation safety board |
| RF | Random forest |
| CNN | Convolutional neural networks |
| SVM | Support vector machines |
| e.g. | |
| sigmoid | |
| expect | |
| risk level | |
| probability | |
| severity | |
| tanh function | |
| element-wise multiplication | |
Due to the rapid development of wireless sensors, fast storage, and artificial intelligence technologies, the aviation industry is facing an unprecedented amount and variety of data. International Air Transport Association (IATA) requires airlines to monitor this data to enhance flight safety. And the European Civil Aviation Organization (EUROCONTROL) is also proactively embracing the challenges that artificial intelligence poses to the civil aviation industry. However, as the complexity of the causes of accidents increases, the concept of risk management is introduced [1], and identification methods based on normal and abnormal patterns showed some drawbacks in assessing complex risks. Traditional risk analysis methods based on expert experience are undergoing advances and breakthroughs in related processes [2,3], gradually emerging a trend to integrate flight data monitoring with risk assessment [4]. Therefore, exploring a risk assessment algorithm based on flight data is essential.
Risk assessment techniques for flight data monitoring fall into three categories: physical, statistical, and artificial intelligence. Based on the changing nature of security and risk in the Big Data era, the physical modeling approach relies on converting data into knowledge [5]. However, there are more stringent requirements in the knowledge and data transformation paradigm, and few studies have performed risk analysis on normal data. In risk management, there is a lack of transformation paradigm between risk and data and a problem of credibility of risk threshold classification. Compared with physical models, statistical models have the advantages of being more straightforward, more convenient, and better performance, reducing the requirements for knowledge and data transformation. In the statistical model, Wang et al. [6] proposed a risk evaluation method based on a statistical theory called the risk quantification method of risk probability and severity (PS). They are using the data characteristics of the normal distribution to calculate the risk value. Zhao et al. [7] classified the risk interval based on the truncated normality of the vertical acceleration data. In addition, there are some risk assessment methods based on normal cloud models [8].
In terms of risk assessment, several civil aviation bodies are actively exploring the integration of artificial intelligence, using its ability to process large amounts of data to solve complex risk assessment problems. The European Civil Aviation Organization (EUROCONTROL) is conducting several studies in the area of AI [9], including the traffic forecasting, the use of AI to automate flight planning, and the use of machine learning models for the Optimized Approach Interval Tool (COAST). In addition, according to the latest FLYAI data [10], specific AI techniques include neural networks [11], linear regression [12], Markov chains [13], random forests and other algorithmic models [14]. These machine learning, deep learning models focus on solving various prediction, classification and evaluation problems by learning large amounts of flight data and creating complex non-linear relationships between inputs and outputs. Typical machine learning algorithms are widely used. In terms of machine learning, Lv et al. [15] adopted three machine learning algorithms, Random Forest (RF), support vector machines (SVM), and Logistic Regression (LR), to detect the association between the overrun risk index and the flight parameter data. Zhou et al. [16] utilized the SVM model to identify the hazards present in the electrical system according to the status of each component of the aircraft’s electrical system. With the development of machine learning, in deep learning (DL), models such as LSTM, AE, and Convolutional Neural Networks (CNN), have obtained excellent results in risk assessment. In conclusion, all the above artificial intelligence techniques are well represented in the field of intelligent aviation safety, but the research focus is different for two different types of data, structured data and unstructured data. On the one hand, structured data refers to raw flight data such as Quick Access Recorder (QAR), Flight Data Recorder (FDR) and statistically processed safety data. Research techniques mainly include Bayesian belief network models [17], local outlier probability models [18], artificial neural network (ANN) [19], and deep belief network (DBN) models [20] in machine learning and deep learning for solving security risk assessment and prediction problems. On the other hand, in the study of unstructured data such as National Transportation Safety Board (NTSB) accident reports responding to aviation safety, some scholars [21] have proposed the classification of aviation safety accidents by using word embedding methods and LSTM models through the accident investigation reports to further respond to the accidents, which is mainly used to solve the problem of accident classification. In particular, structural data is the main subject of current research, and the processing and analysis of QAR data is a top priority of current research due to the advantages of completeness and reliability of QAR data. In this regard, related scholars [22–24] have proposed using an LSTM model to analyze QAR data for predictive evaluation of the associated risks. After that, affiliated scholars made continuous improvements based on LSTM. For example, Rong et al. [25] applied a LSTM model for variational autoencoder model with a multi-headed self-attentive mechanism to detect abnormal patterns. Liu et al. [26] proposed several deep learning models to perform health monitoring of aircraft systems, among which the LSTM-AE obtained promising results. Ning et al. [27] proposed an autoencoder model based on long short-term memory networks to detect and classify faults in aircraft systems using original time series data. Kang et al. [28] proposed the CNN-LSTM and Temporal and Global (TG)-attention encoder-decoder architectures to evaluate the landing safety based on the final landing distance. In summary, the advantages of LSTM-based correlation models for time series prediction and classification have been further developed for use in the field of civil aviation safety. Using flight parameter data, it is possible to provide better support for aviation safety risk assessment.
The above research shows that, firstly, the current deep learning models are widely applied in complex system fault detection and are less employed in flight safety risk assessment. Secondly, few scholars further analyze the risk level label, and most studies ignore the label quality issue. More importantly, in assessment results, most scholars only focus on normal and abnormal risk levels, while few researchers focus on abnormal data in borderline normal levels. Compared with the data analysis of abnormal levels afterward, the potential risk data hidden in the normal level often becomes especially important, which has excellent theoretical and practical significance for flight safety assessment and pilot operation level evaluation. Currently, the problem of risk level classification in flight safety risk assessment is still facing significant challenges in deep learning research.
In this paper, the aim of this research is to explore a more accurate model for the assessment of risk. It provides flight safety managers with a new risk assessment method that facilitates the quantitative assessment of the risk rank of the occurrence of overrun events such as heavy landings and tail grabs in flight. For this purpose, we propose a PS-AE-LSTM network. Experiments on real-world data show that they are superior to other baselines.
The main contributions of this article can be summarized as follows:
(1) PS-AE-LSTM, a novel deep architecture for risk assessment, is proposed, which is the first to combine statistical methods with deep learning methods. It further improves the classification accuracy.
(2) The Monte Carlo method is applied to the flight data to obtain a large amount of actual random flight data. It can solve the problem of missing data.
(3) Broader applicability, the algorithm applies to most of the risk assessment of overrun events based on flight data and even extends to risk evaluation of normally distributed data in other fields.
The rest of the paper is organized as follows: Section 2 gives relevant background theories, including the PS model, AE, and LSTM network; Section 3 illustrates the algorithm proposed in the article; Section 4 presents the experimental results, compared with the baselines; Section 5 concludes this paper and provides further work.
2.1 The PS Model Based on Normally Distributed Data
QAR data is high-dimensional time series data. According to the QAR data characteristics, most aircraft performance parameters satisfy the normal distribution characteristics [29–31], such as the vertical grounding load, grounding pitch angle, etc. In this regard, this section mainly focuses on the risk modeling of QAR normal distribution data. To better utilize deep learning models and avoid false positive and false negative results due to threshold errors [18], this paper proposes to use statistical theory to construct a risk-level model and improve the labeling quality of deep learning, thus improving the performance of risk assessment algorithms.
The safety risk is the projected likelihood and severity of the consequence or outcome of an existing hazard or situation. The safety risk probability (P) and severity (S) assessment process can be used to derive a safety risk index. Therefore, this paper's quantitative risk evaluation model is the product of the likelihood of an accident and its severity, as shown below:
R represents the event risk value; P represents the probability of the event occurring, and S represents the event’s severity. Combined with statistical theory, the normal distribution function of the flight parameters of a known model, assuming that the value of a flight parameter
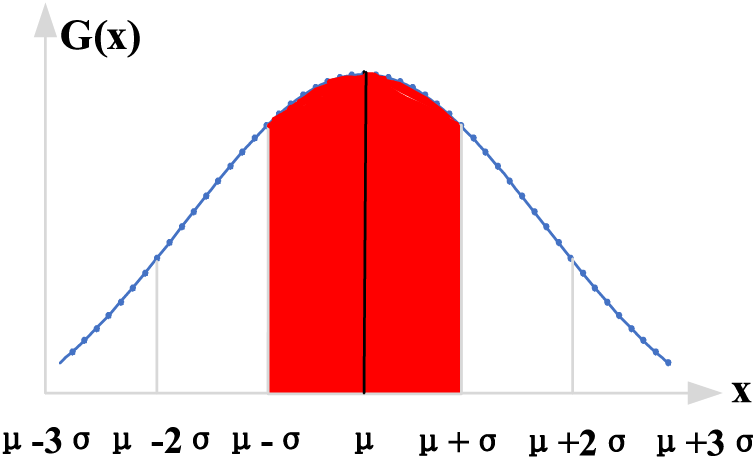
Figure 1: Normal distribution of risks
S is the severity of the event, and the deviation of the sample data
Based on the above Eqs. (1)–(3), the risk level R is obtained and calculated as follows:
where
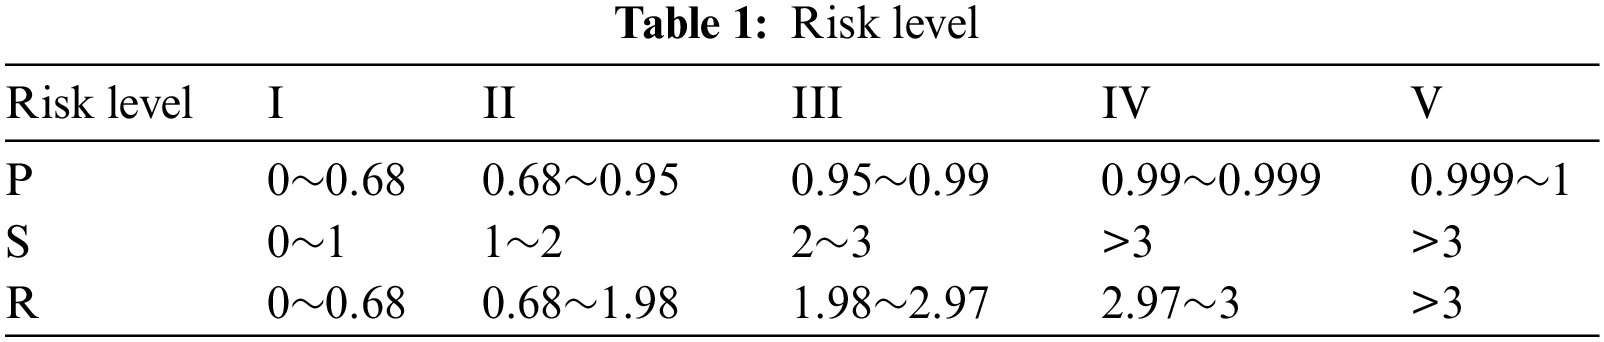
Autoencoder (AE) belongs to the self-supervised learning algorithm category, a feed-forward neural network with two parts: encoding and decoding [32]. The encoder transforms the input vector into an intermediate hidden vector. The decoder takes the intermediate hidden vector as input and makes the output approximately restore the initial input vector. For the input vector x, the AE encoder approximates
Simple three-layer autoencoder structure, including input, hidden, and output layers. For the encoder, given an input vector x, the encoder implements a non-linear mapping through the sigmoid function as follows:
where
To better represent the statistical characteristics of the flight data, the information on hidden characteristics is presented for subsequent evaluation. In this paper, we propose to use a three-layer autoencoder to reconstruct QAR data. The whole AE structure channel, firstly, converts the input flight parameter matrix into input vectors. Secondly, by the encoding structure, the input vectors are gradually converted into intermediate hidden vectors, and then by the encoding structure, the intermediate hidden vectors are reconstructed into the final output vectors as well as matrix. The whole autoencoder structure is shown in Fig. 2.
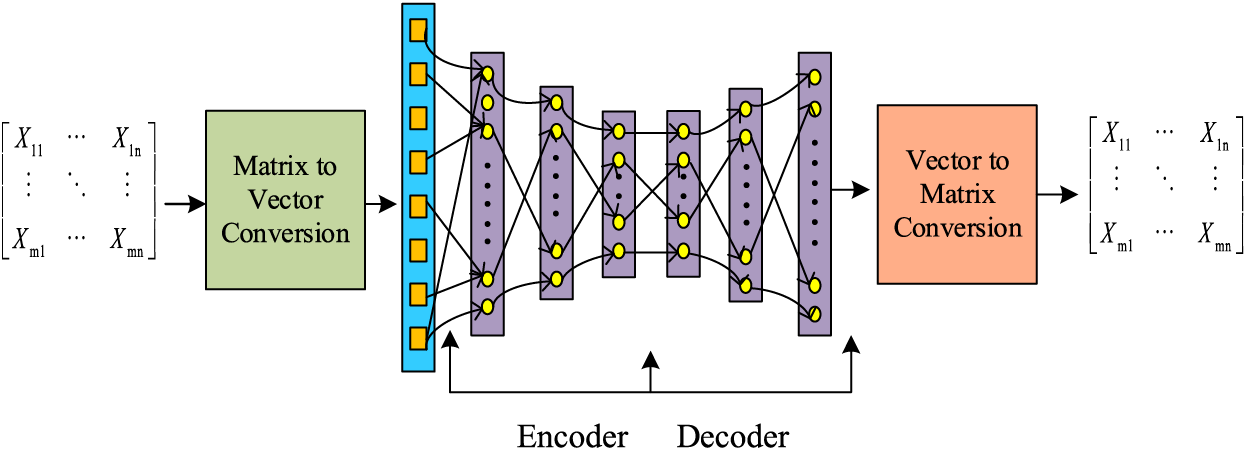
Figure 2: The structure of an autoencoder block
2.3 Long Short-Term Memory Network—LSTM
The LSTM was proposed by Hochreiter and Schmidhuber (1997) with only input-output gates. Schmidhuber and Cummins (2000) modified the original LSTM structure by adding forgetting gates [33], and thus the LSTM structure with forgetting gates has received much attention since then.
In the time series, we define {x1, x2, x3,…, xt} as the input series.
where
Figure 3: The structure of an LSTM block
3 The Proposed Model PS-AE-LSTM
This section focuses on the proposed risk assessment algorithm PS-AE-LSTM. The algorithm’s overall framework is shown in Fig. 4, and it is easy to see that the core architecture is generally divided into two phases. (1) Pre-processing stage of risk labeling based on PS statistics. (2) Classification stage of risk level based on deep learning, where the core framework of AE-LSTM is shown in Fig. 5, which consists of two main parts. The first part is AE, which realizes data reconstruction so that the algorithm’s output can express the input as closely as possible. It minimizes the training error and improves the AE training data expression effect. The second part is the LSTM network. To better learn the QAR time series data features, this paper chooses the LSTM model with three “gates,” selective feature learning, the encoded feature vector as the LSTM feature vector matrix, and the input of the LSTM module. Then, the output of the last LSTM unit is passed through the fully connected layer (FC) and the softmax layer, and the classification result is output in the form of probability. Finally, it is converted to the one-hot encoding form.
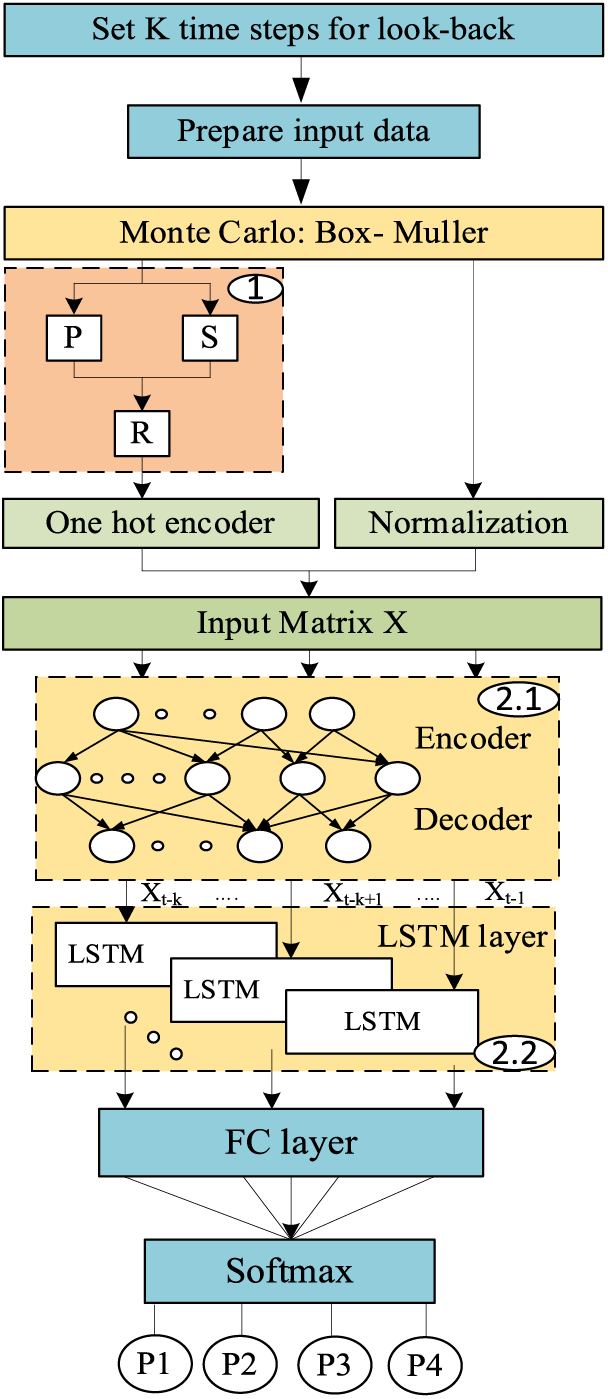
Figure 4: The architecture of the proposed PS-AE-LSTM classification autoencoder
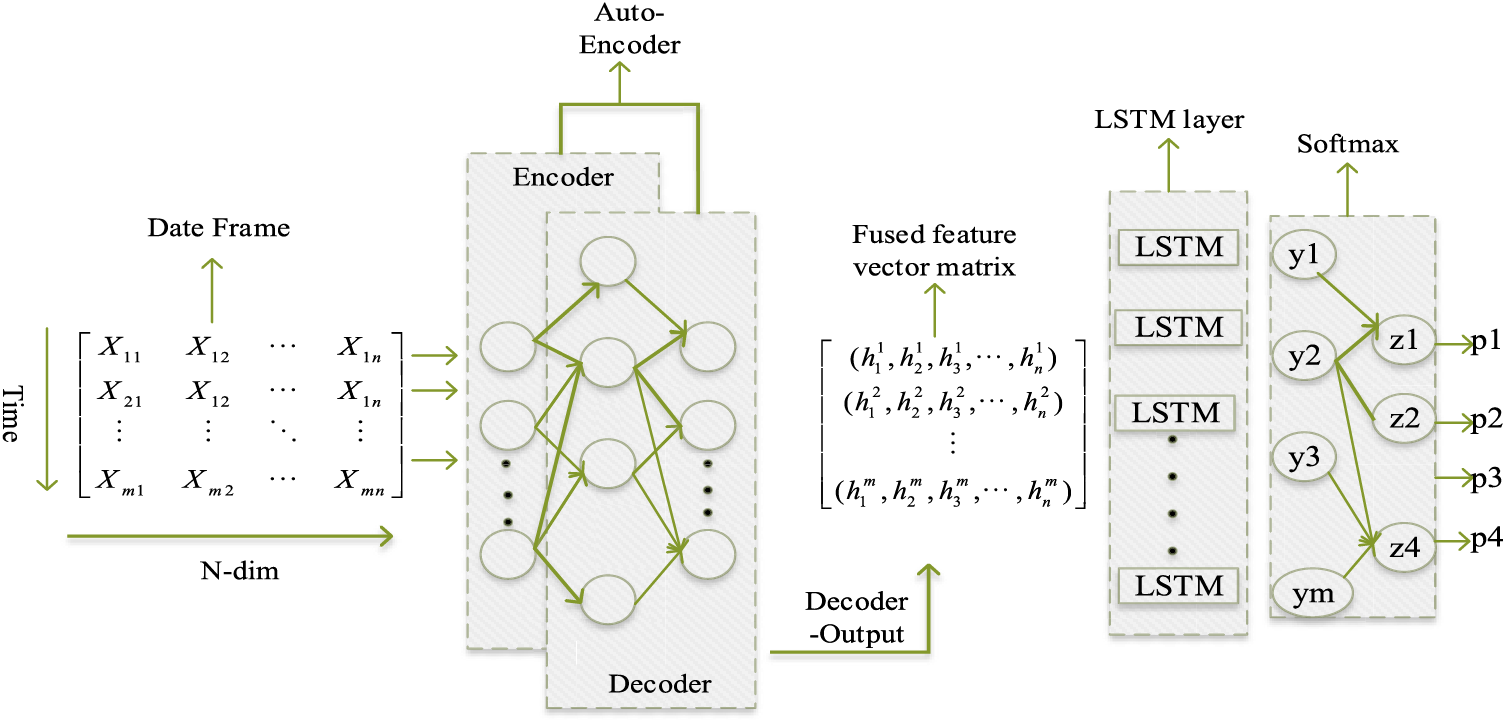
Figure 5: AE—LSTM framework
3.1 Data Processing—Monte Carlo Method
The Monte Carlo method is a statistical method of simulating a test by generating random numbers and sampling them in a known probability distribution. Applicable to the simulation of all stochastic events, the expansion of a small number of samples to solve known problems.
The problem of restricted flight data limits risk assessment and, to some degree, does not meet the requirements for massive data in deep learning. In this paper, according to the airline flight quality monitoring standards, corresponding QAR data is selected as the sample data combined with the Monte Carlo method to solve the problem of insufficient samples.
Among them, there are many ways for Monte Carlo to generate random numbers satisfying the normal distribution, the Box–Muller transform algorithm is relatively convenient and effective, and the formula is shown below:
where
With the sample’s available data, calculate the sample’s mean and variance, and generate random numbers by Box–Muller transformation with the following Eqs. (16)–(19):
where
3.2 Data Normalization Process
The original time series of the flight parameters under the target interval will be obtained to eliminate the dimensional differences between the flight parameters. In this paper, the normalization operation is performed on the flight data, and the normalization formula is as follows:
where
3.3 Parameter Adjustment Details
The adjustment of hyperparameters is a problematic issue of research. Specifically, we divide the datasets into three parts in the ratio of 6:1:3: training set, validation set, and test set.
The training set is used for model training. The test set is used for testing the model performance. The validation set is used to determine the optimal parameters and prevent overfitting of the model. For the selection of parameters in this paper, we determine the depth and width of the network by the grid search method.
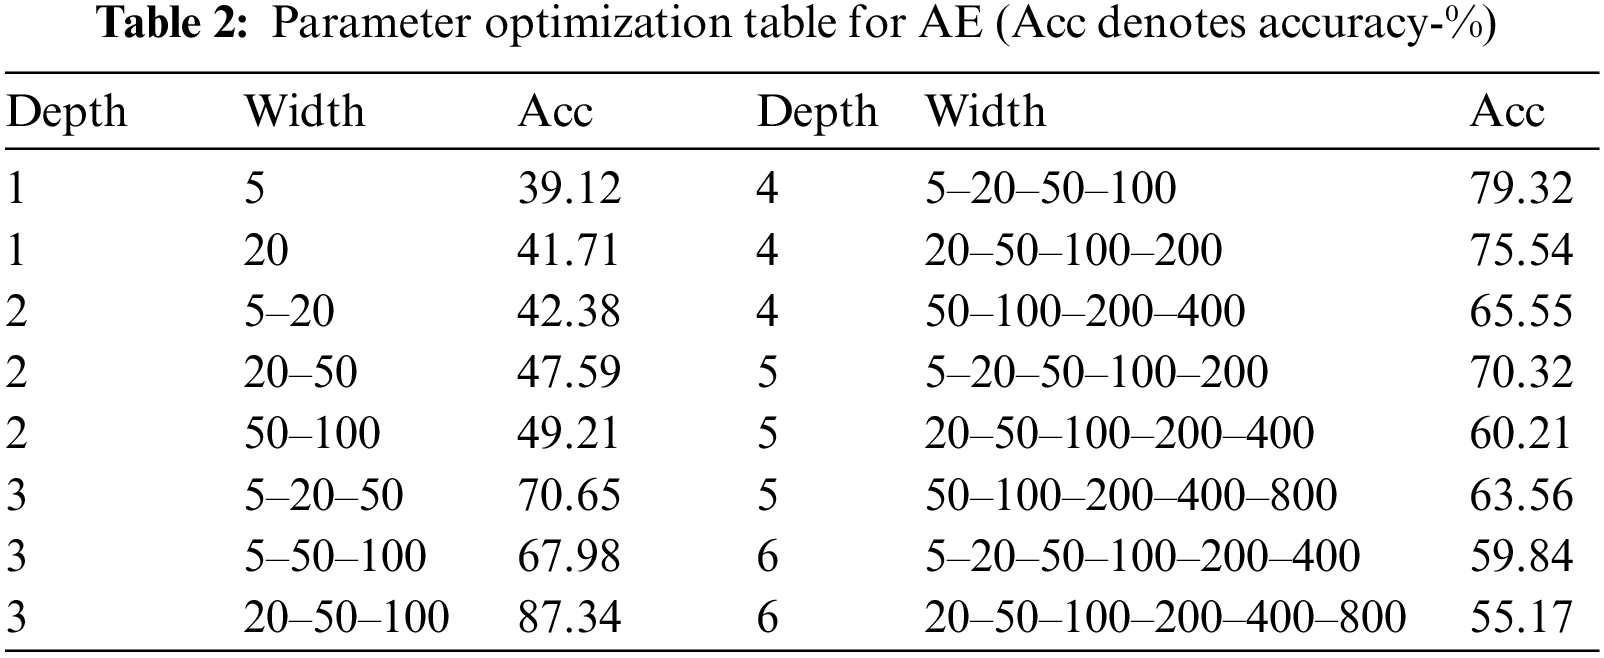
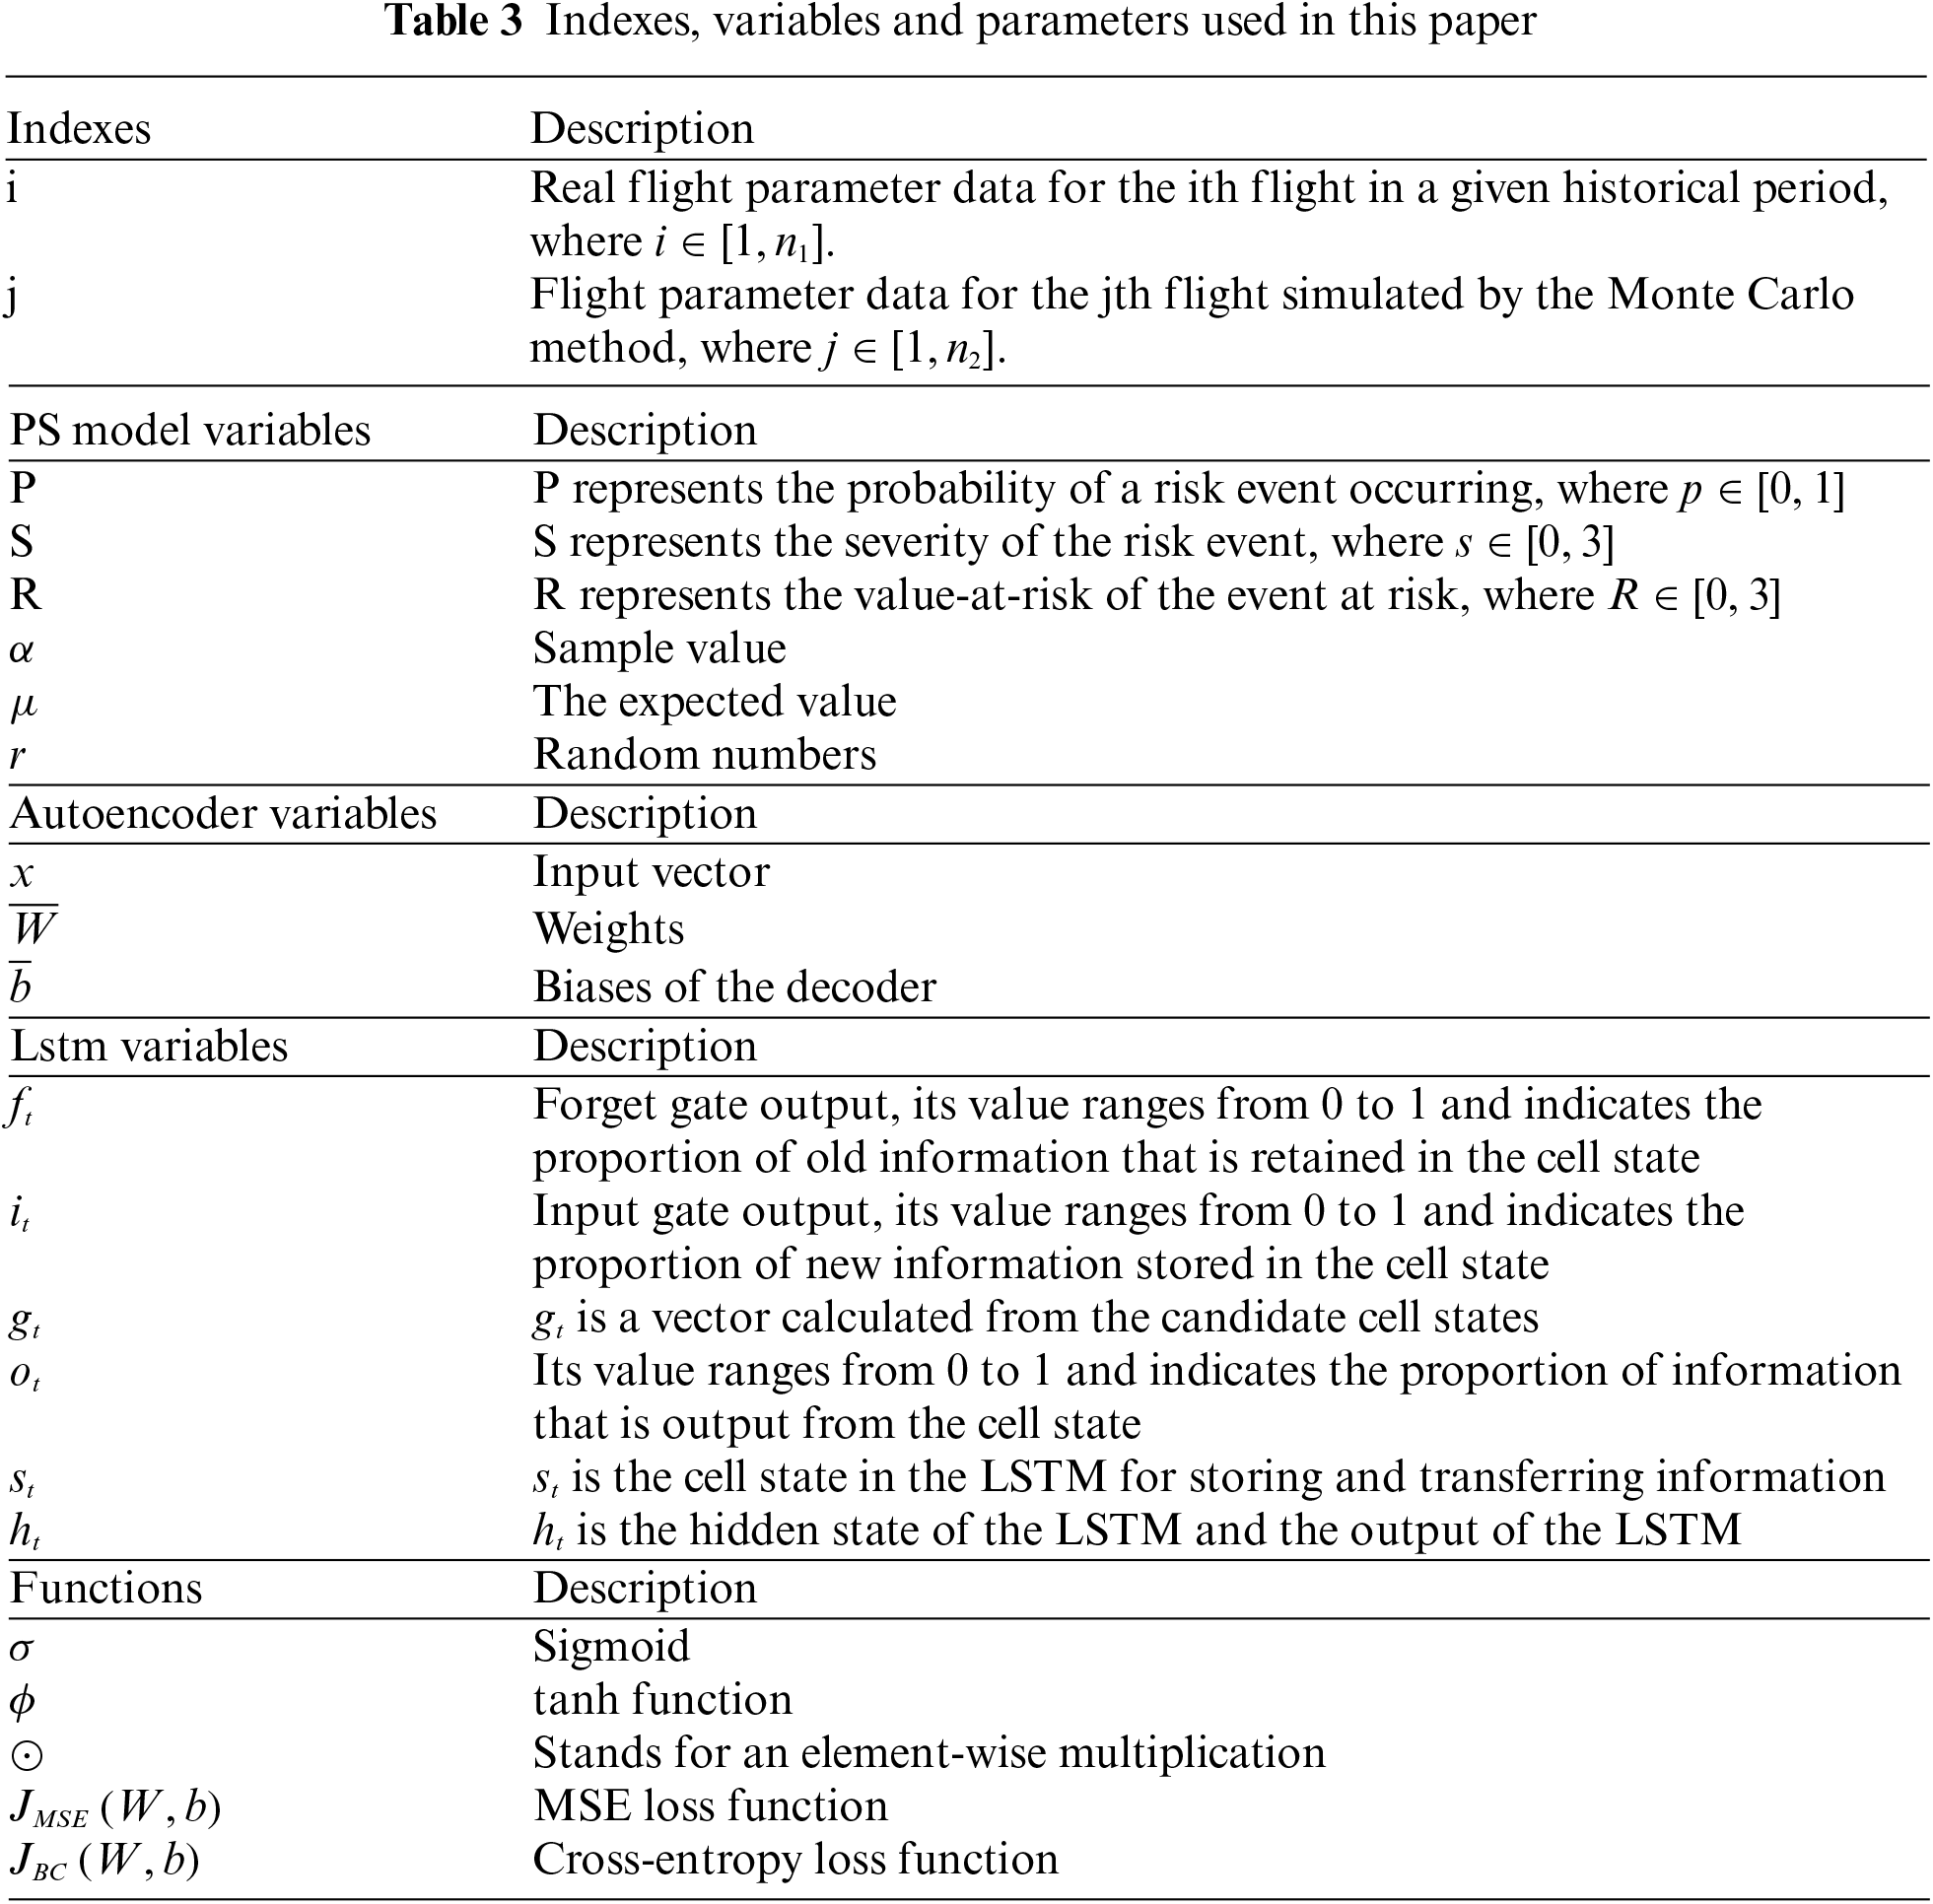
Table 2 shows the adjustment of the autoencoder network structure. For the non-linear problem, the activation function used for the autoencoder is Relu, and the loss function is mean square error (MSE). In this paper, the autoencoder-trained data is used for the classification of subsequent structures, and the loss function used is the Cross-Entropy loss function. It is fine-tuned using the adaptive moment estimation algorithm (ADAM), and the learning rate is set to 0.001. All the indexes, variables and parameters used in this paper are listed in Table 3.
4 Experimental Validation: Hard Landing Risk Classification
QAR is a system to obtain aircraft operation data quickly and is an important data source for flight quality monitoring, referring to the Flight Operations Quality Assurance (FOQA) aircraft quality monitoring project specification advisory circular (AC-121/135-FS-2012-45R1). This paper uses the risk assessment of hard landing events as an example for model validation, and the feature parameters of the relevant overrun events of a hard landing are selected. That is vertical acceleration (Vrtg), descent rate (Lvv), lateral acceleration (Ltacc), roll angle (Roll), angle of attack (AO), rate of change of pitch angle (P-rate), etc. Among the key indicator parameters, examples of original parameter data for Vrtg are shown in Table 4 below.
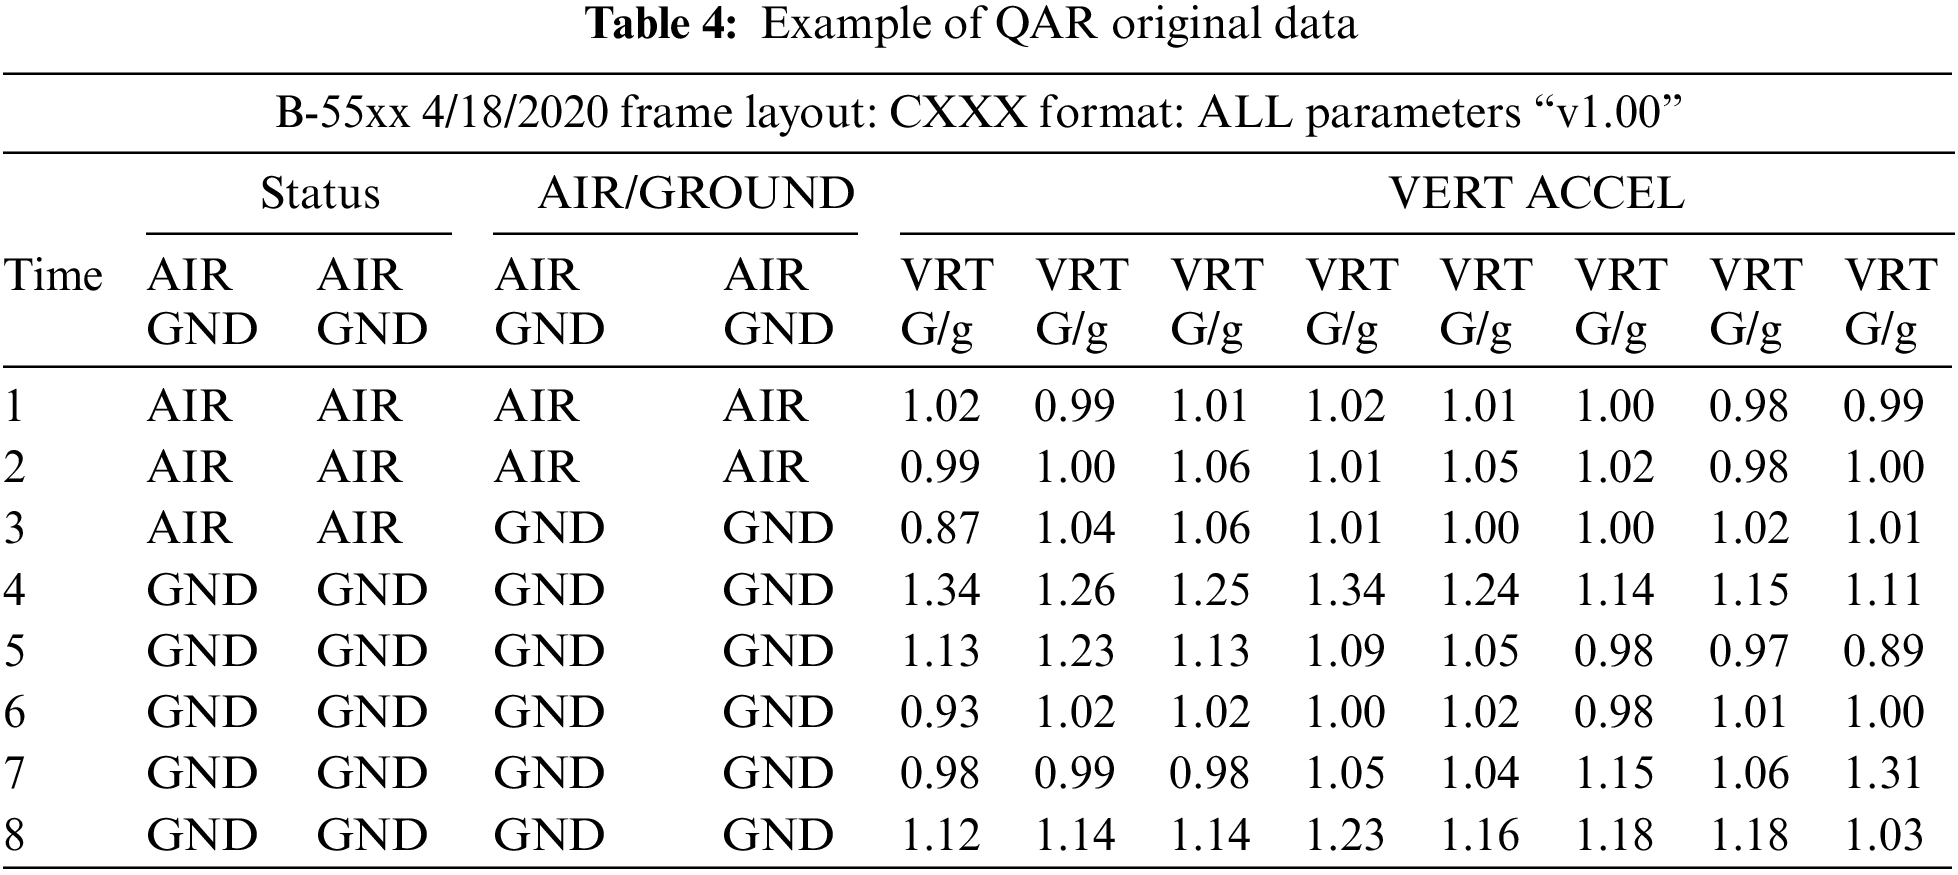
where time represents the time status before and after landing, 8 s in total, status represents the status data of AIR/GROUND and VERT ACCEL parameters recorded under the sensor. AIR: The recorded value of the air-ground electric gate, meaning the main wheel of the aircraft in the air; GND: The recorded value of the air-ground gate, called Ground, represents the main wheel of the aircraft touches the Ground; VERT ACCEL: Vertical acceleration, meaning the vertical acceleration value of the aircraft, abbreviated as VRTG in the QAR raw data table, the corresponding value represents the multiple of gravitational acceleration g.
In this paper, we selected 1000 landing sample data of a fleet, took the time series data of 2 s before and 5 s after the landing grounding for a total of 8 s, selected 5 data features, constructed sample data shape
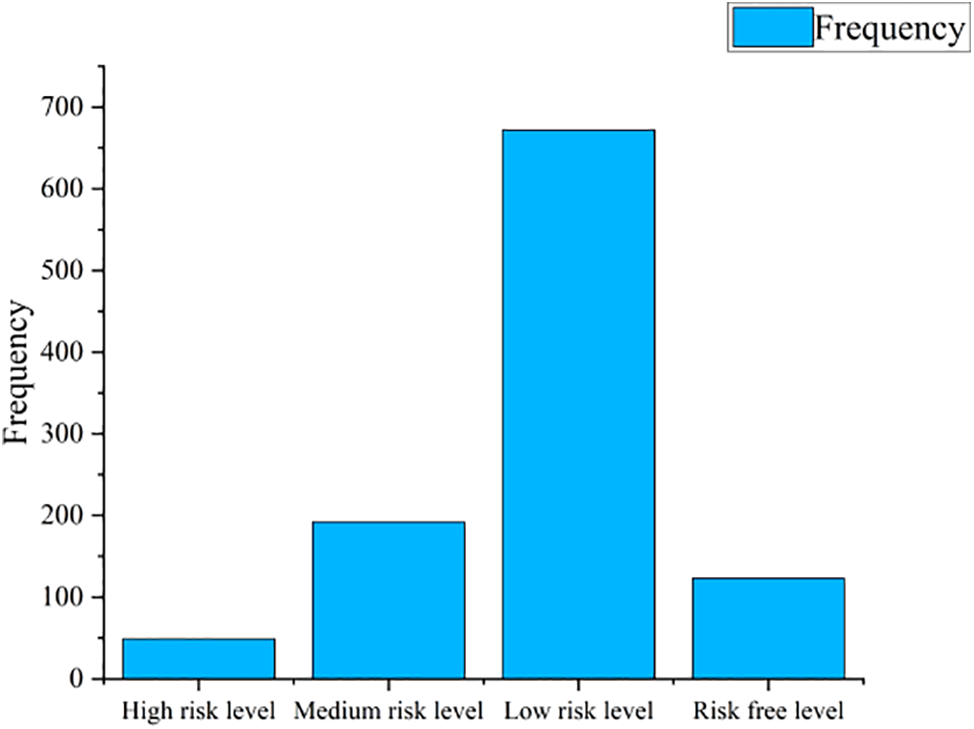
Figure 6: Distribution of risk levels for the original sample
This section analyzes some of the flight parameter data during the landing phase, as shown in Fig. 7 below. As can be seen, the flight parameters changed during the landing phase, and they changed dramatically in the interval before and after the landing time, which fully confirms the learning potential of deep learning in terms of flight parameters. Among them, the change of VRTG is the critical parameter to respond to the hard landing, and pitch angle and angle of attack are the specific expressions of the hard landing operation. Based on the research assumptions of the PS model, the K-S one-sample test was used to assess the normality of the data, as shown in Fig. 8a below and reflected in the form of histograms in Fig. 8b, which shows the data distributions of the overrun events with excessive vertical landing loads and excessive pitch angles.
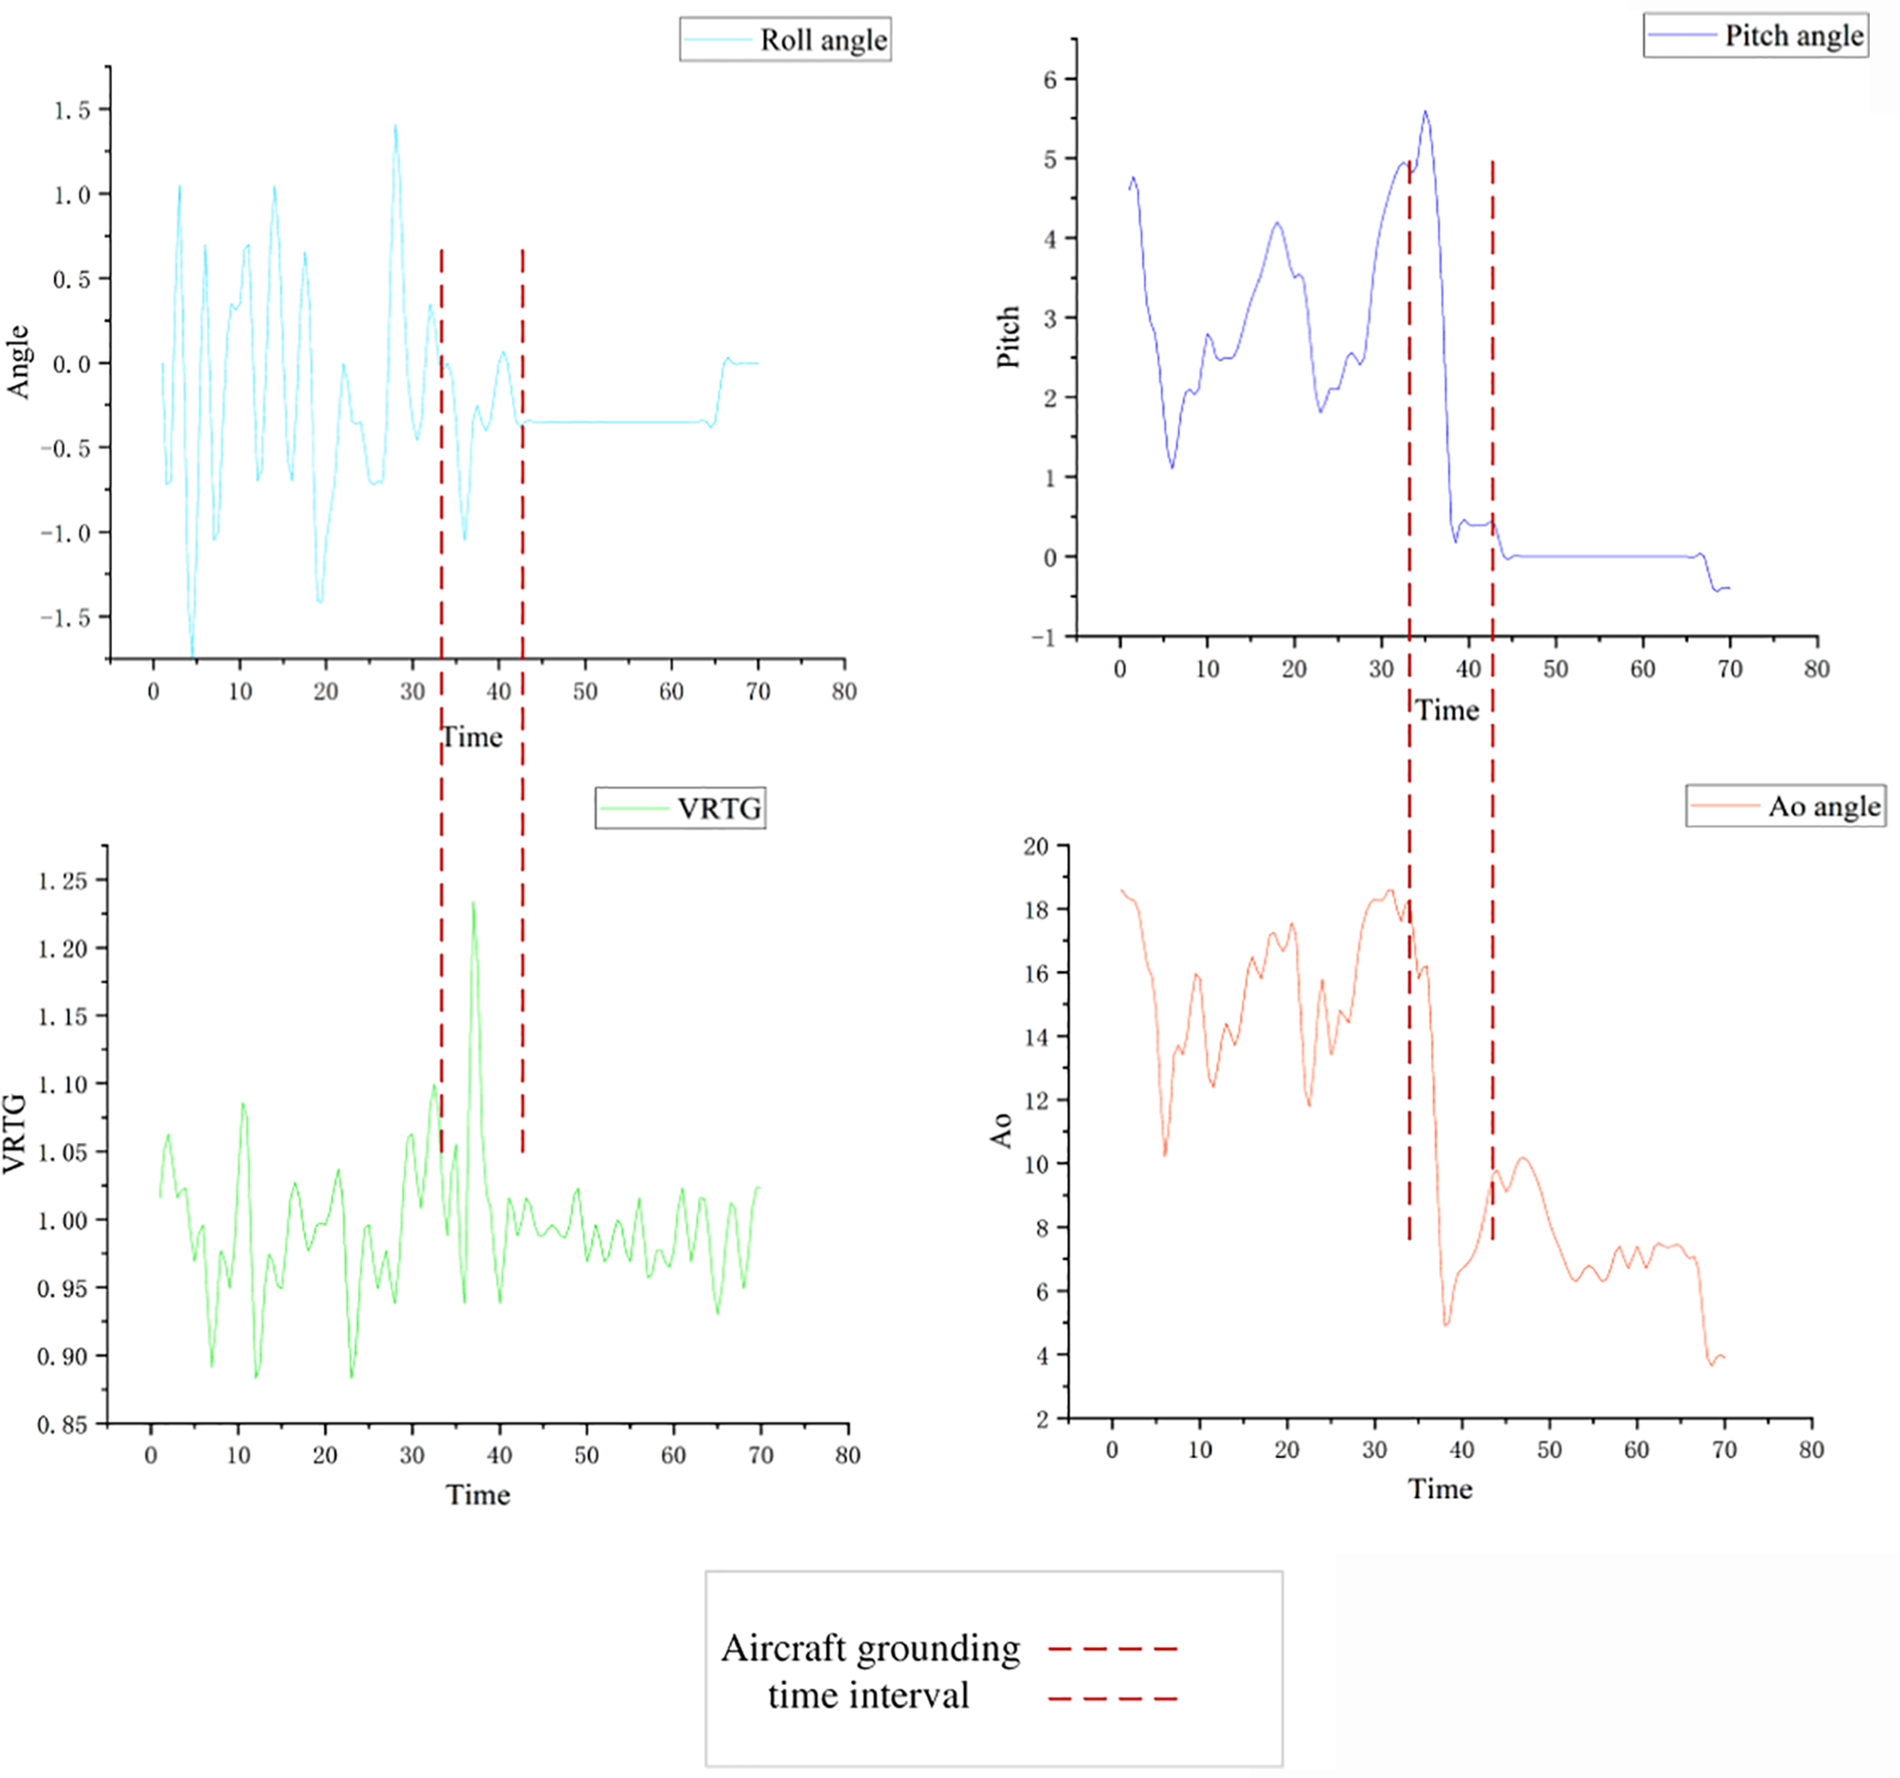
Figure 7: Variation of flight parameters
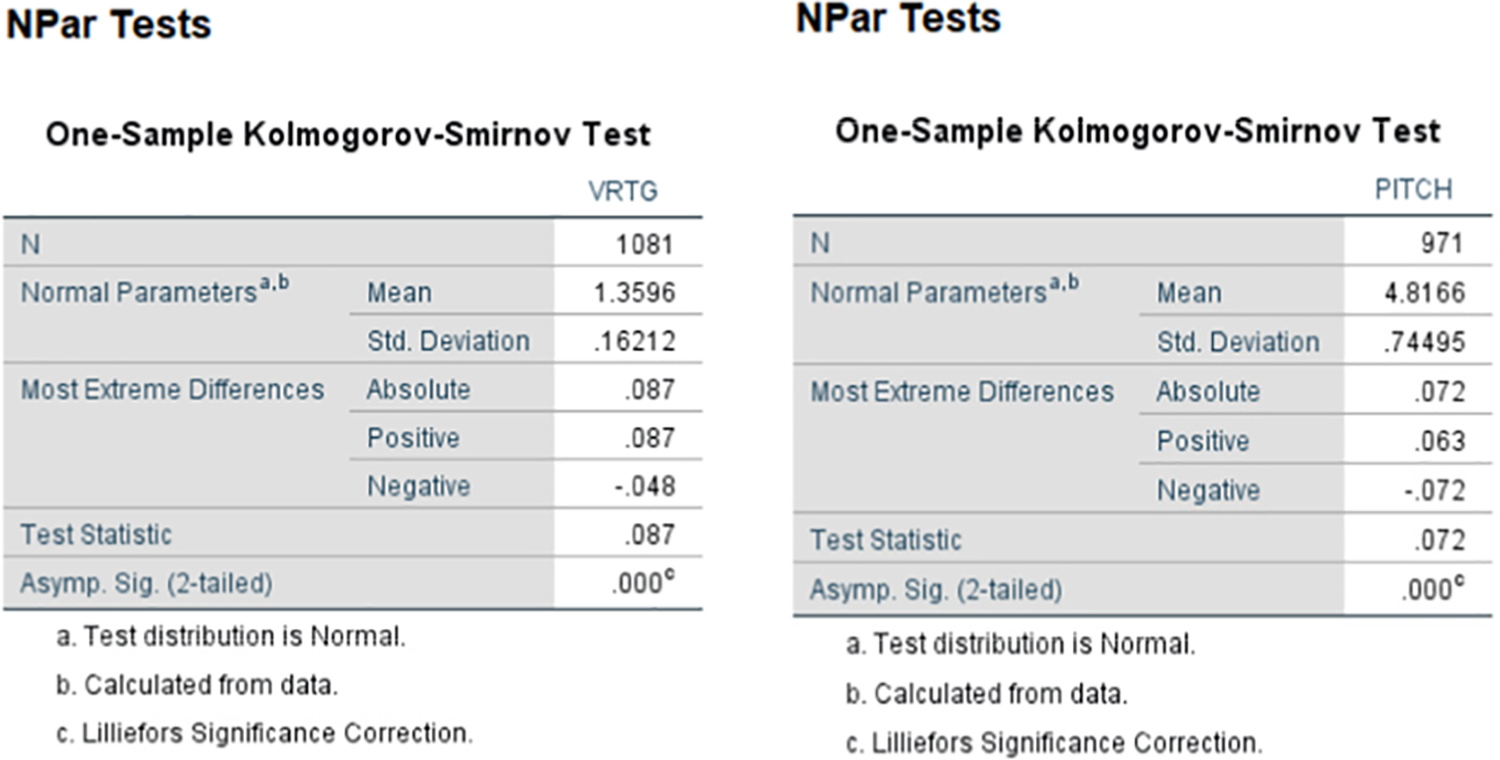
Figure 8a: Original data normality test
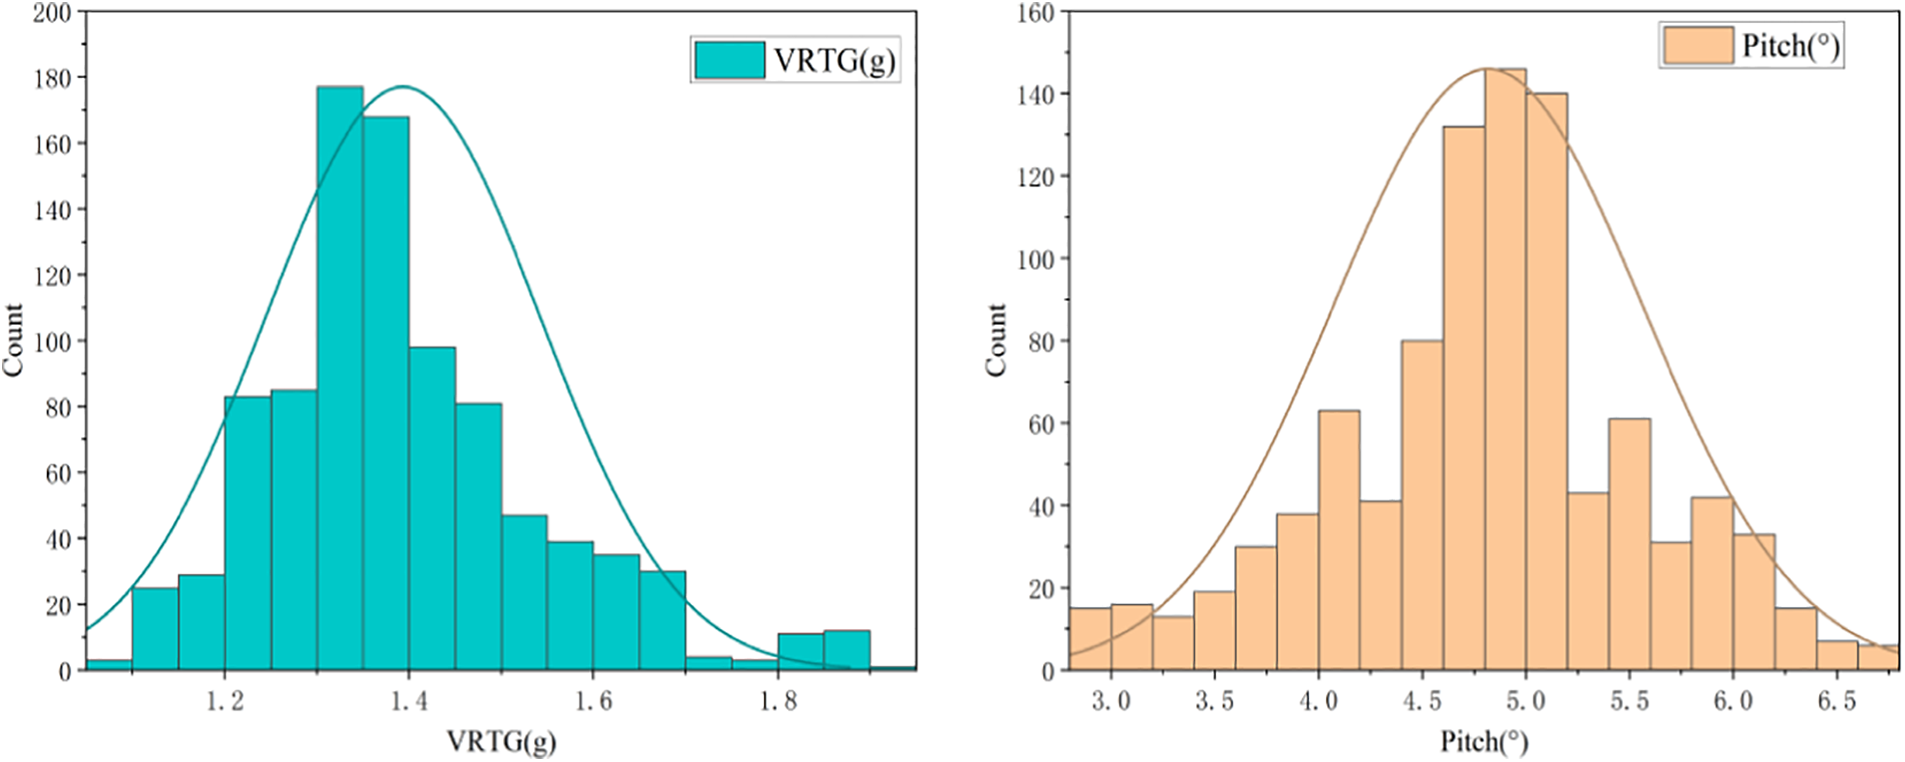
Figure 8b: Distribution of overrun events
In this paper, we choose traditional classifier performance evaluation metrics such as precision, recall, F1 score, and accuracy.
where TP (True Positive) is the number of instances correctly detected as anomalous; TN (True Negative) is the number of instances correctly detected as normal; FP (False Positive) refers to the number of normal patterns miss-classified as anomalous; FN (False negatives) refers to the number of abnormal patterns erroneously identified as normal.
The TensorFlow deep learning framework based on the Python platform builds our model and the baselines. This experiment uses the Keras2.4.2 framework TensorFlow2.4 backend. CPU E5-2689 16-core 32 G, GPU NVIDIA GeForce RTX 3070, 200 Gb SSD constitute the experimental server environment. We use python language to write the PS module, including the data generated in Monte Carlo, and use the Keras framework to build the deep learning module. To address the data imbalance in the training set, 1875 high-risk, medium-risk, low-risk, and no-risk data were generated in the training set, respectively. The dataset is divided into three parts in the evaluation classification task: the first 60% training set, 10% validation set, and the remaining 30% test set. As mentioned earlier, this paper’s training set, validation set, and test set contain 7500, 1250, and 3750 samples, respectively. We use the Adam optimization algorithm for training and set the batch to 64. The specific network structure of the proposed model and its complexity is shown in Fig. 9 below.
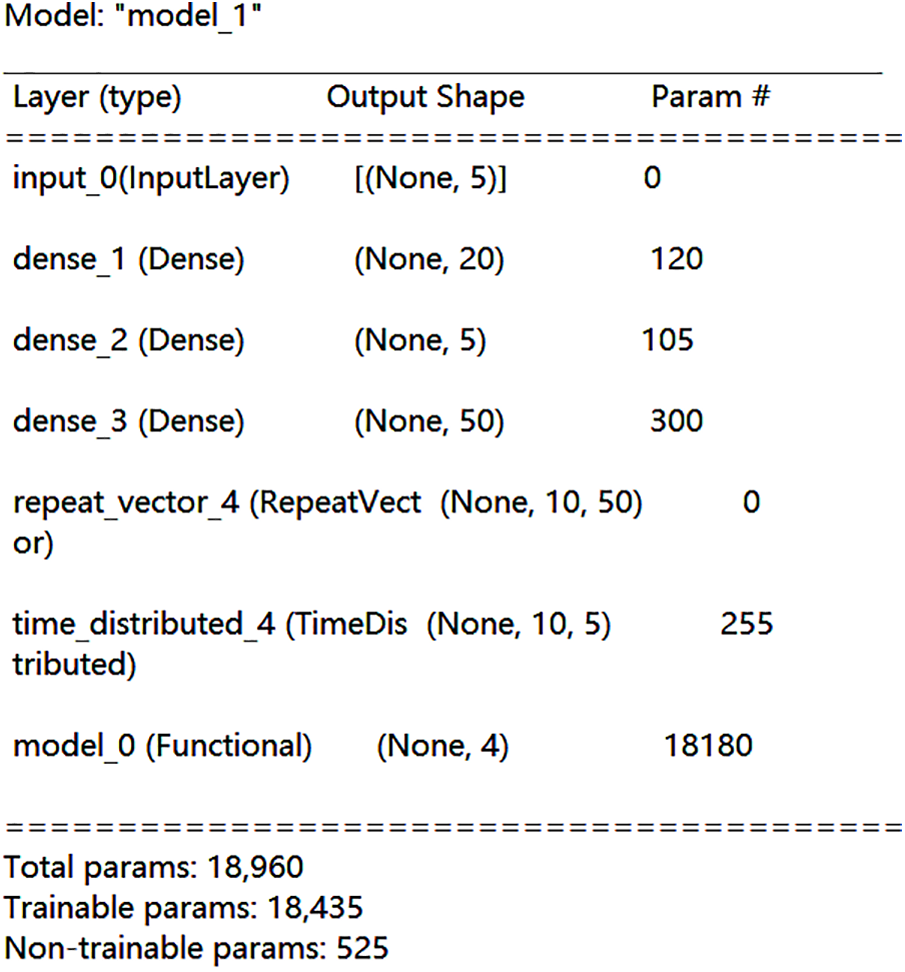
Figure 9: Network structure and parameter information
To validate the superiority of the proposed PC-AE-LSTM algorithm, we selected four classical machine learning algorithms from the current state of research for comparison and analysis based on data from the EUROCONTROL [9] and FLYAI reports [10], combined with research on civil aviation safety and machine learning methods. The proposed model was compared with four baseline assessment models as well as the current state-of-the-art civil aviation overrun event safety assessment models, respectively, support vector machines (SVM), logistic regression (LR), Back Propagation (BP), Long Short-Term Memory Network (LSTM), and bayesian deep learning. Radial Basis Function Network (RBF). Meanwhile, we compare and verify the effectiveness of each component of the algorithm, respectively LSTM, AE-LSTM, and PS-AE-LSTM.
SVM, LR, and BP algorithms are traditional machine learning algorithms mainly applied to general event classification. Bayesian neural networks are used to support risk decisions by probabilistic prediction of vertical landing velocity [34]. Radial Basis Function (RBF) network is a specific kind of artificial neural network that can express the relationship between input and output extremely well [35]. Still, they cannot capture time-dependent features, while LSTM is an artificial intelligence algorithm that can capture time-dependent features. Still, it is not as efficient as the AE autoencoder for anomaly detection. The AE structure can reshape the typical characteristics of flight data and make the reconstruction errors of various risk categories more polarizing [36]. Overall, the PS-AE-LSTM is a risk-level assessment algorithm that combines the advantages of the above models, and the model architecture consists of two parts: PS and AE-LSTM. The PS module is employed to extract the labels of the data and improve the label quality. The AE-LSTM module extracts the reconstructed data and captures the temporal features to obtain the risk level assessment finally.
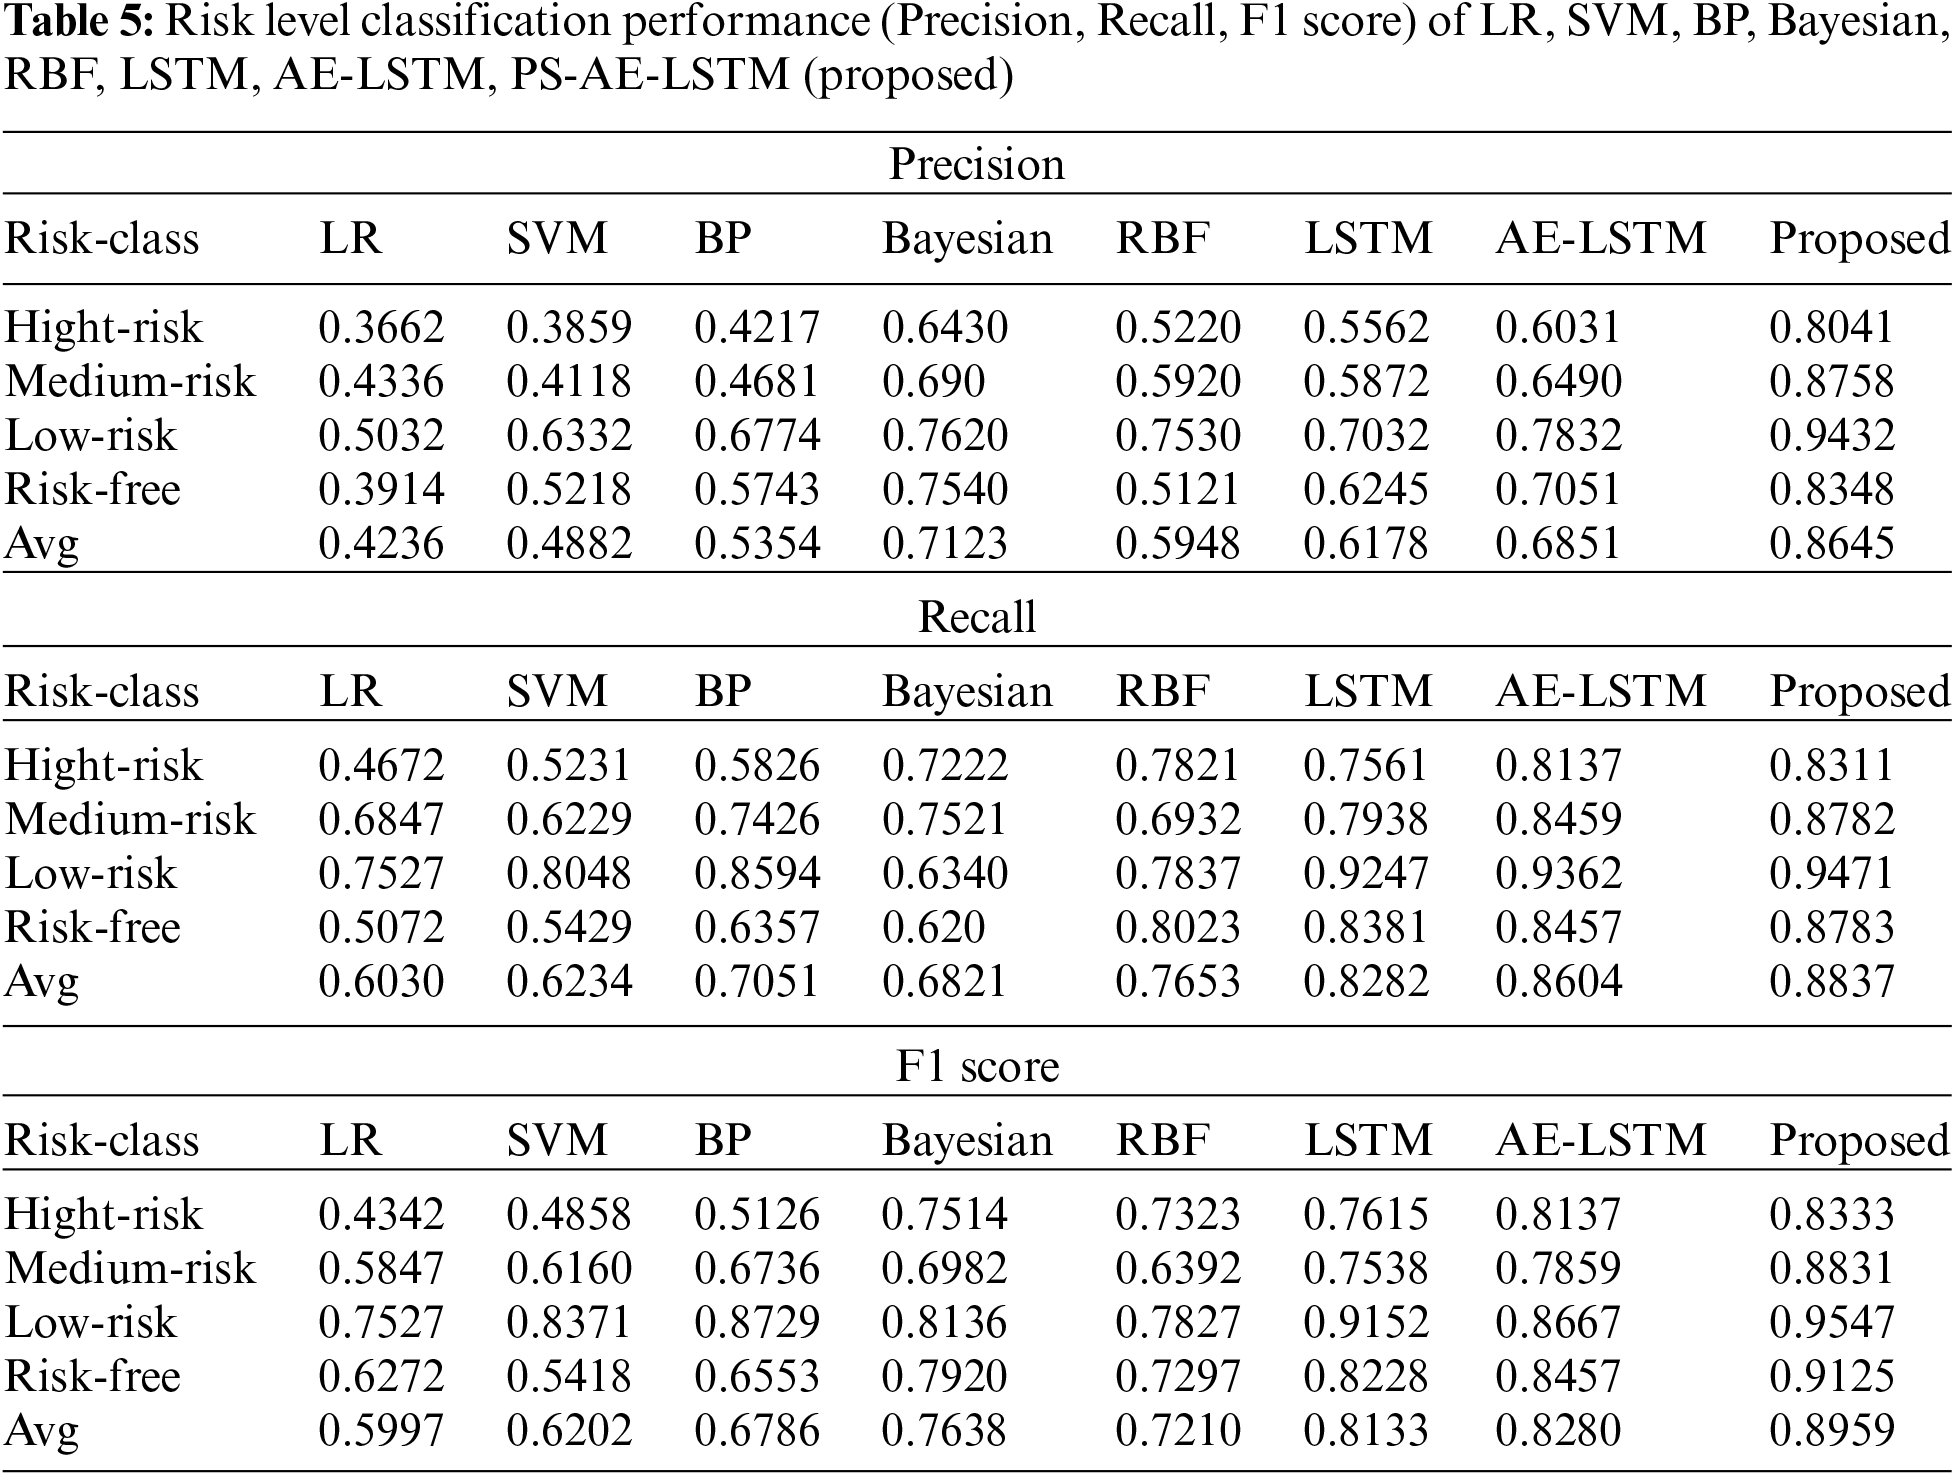
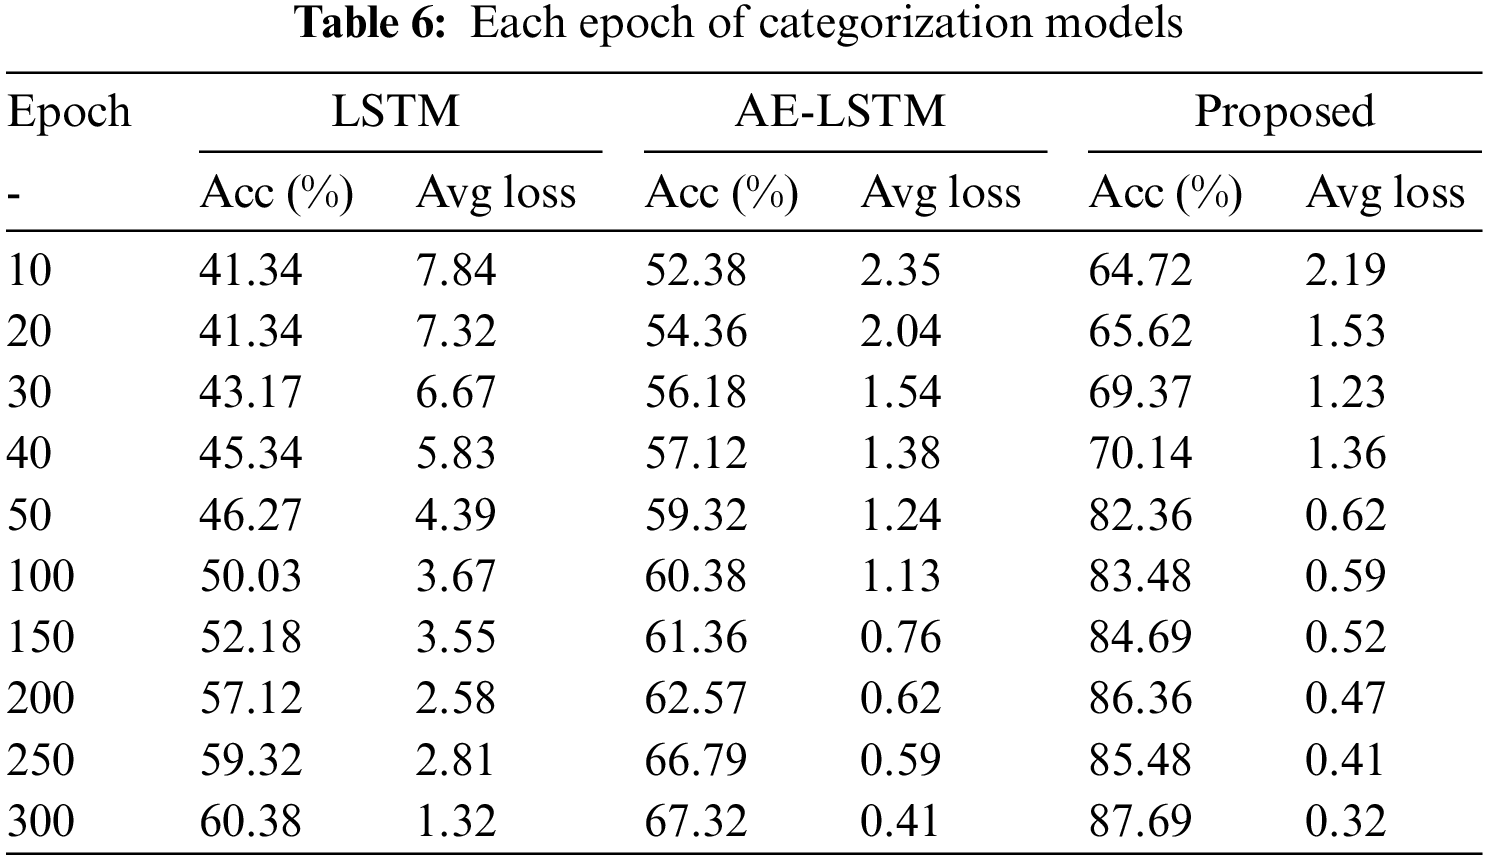
Fig. 10 shows the accuracy of six risk assessment models for hard landing events, which use a grid search approach to select the optimal parameters. From Fig. 10, it is evident that the LR algorithm exhibits the worst results, with precision and recall less than 0.5. Second, the SVM model’s accuracy has improved but is still less than 0.6, probably related to the dimensionality of the input parameters. SVM has better accuracy in lower dimensions. The BP model is 11% higher than the LR and 5% higher than the SVM in terms of accuracy but still lower than the accuracy of the LSTM model. In conclusion, LR, SVM, and BP algorithms are far less accurate than deep learning algorithms because simple machine learning models do not capture deeper connections between data and lose temporal features. The accuracy can reach about 62% using only the LSTM model, which is higher than SVM, LR, BP, etc. After adding the AE structure, the performance is improved by about 7%, resulting from data reconstruction. When adding the PS module to AE-LSTM, the accuracy is dramatically improved by about 25%, making the PS-AE-LSTM algorithm the most accurate. To further evaluate the change in accuracy of the algorithm after embedding the PS module. Fig. 11 shows the accuracy change after different epochs for LSTM, AE-LSTM, and PS-AE-LSTM, which verified the effectiveness of each component of the algorithm. Compared the proposed method with the latest Bayesian deep learning model and the RBF network model, the accuracy of the two models is 76.2% and 78.3% in low risk and 64.3% and 52.2% in high risk, respectively, which is far inferior to the proposed method, proving the superiority of the PS-AE-LSTM model.
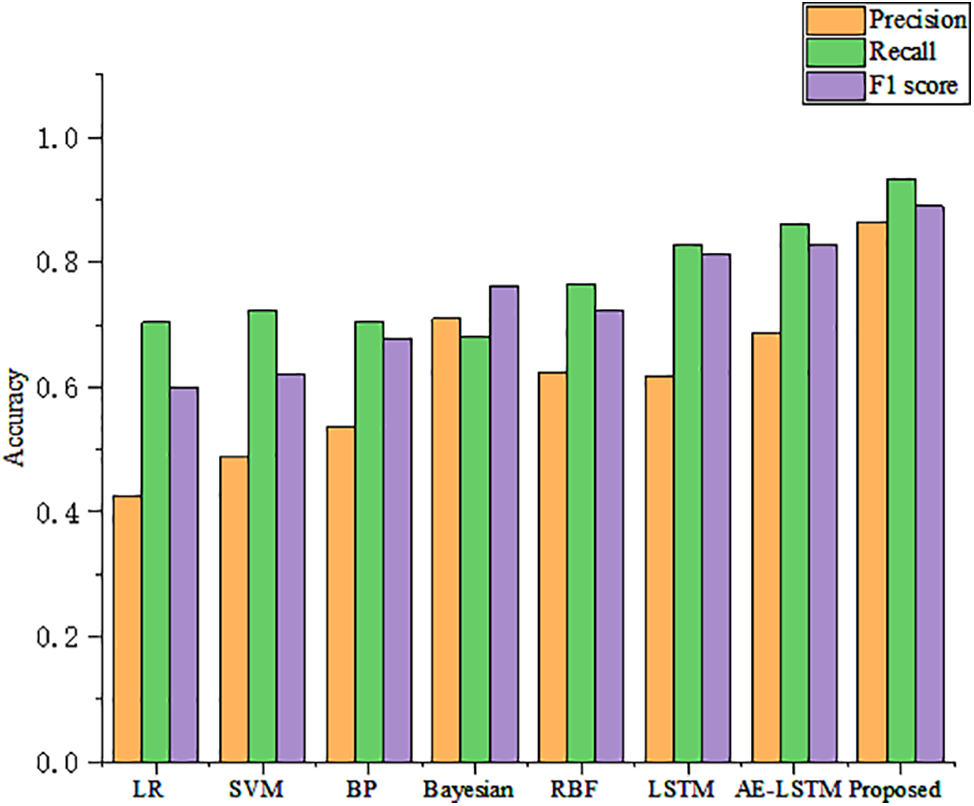
Figure 10: Accuracy of 6 risk assessment models
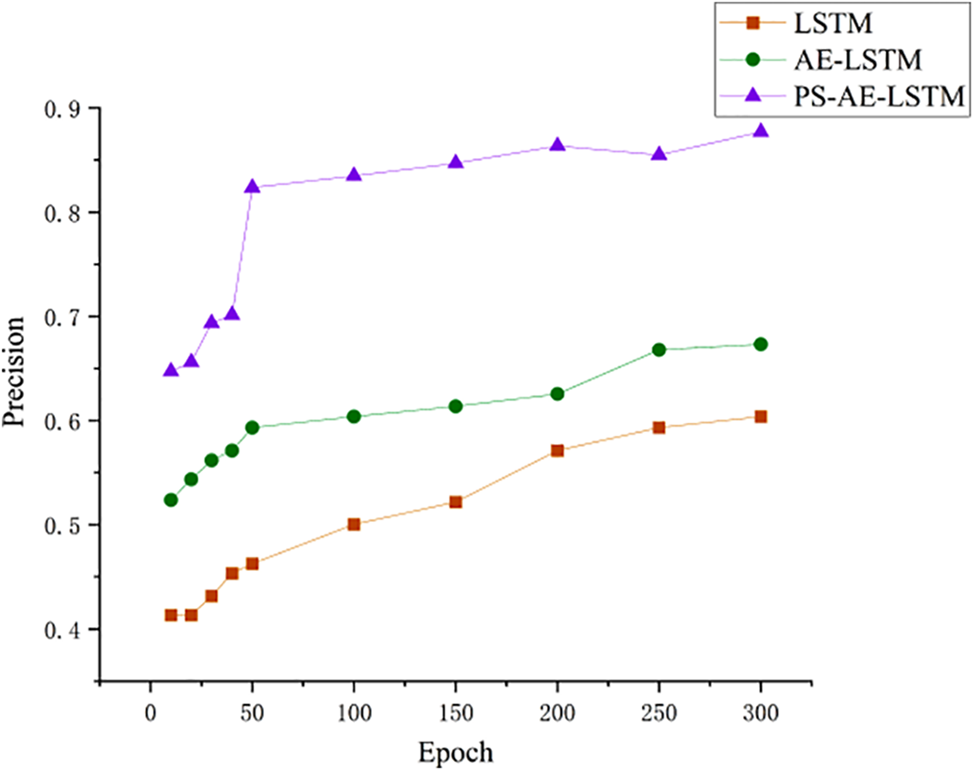
Figure 11: Each epoch of categorization models
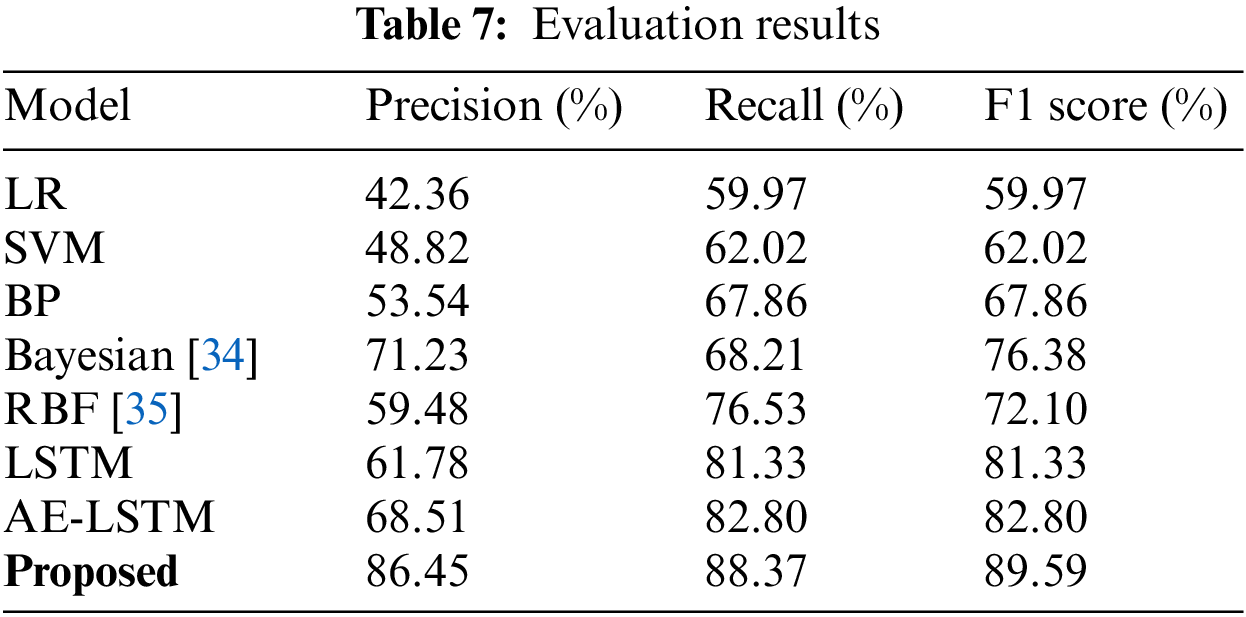
Table 5 shows six abovementioned algorithms specific to the risk level assessment on a landing dataset. Table 6 shows the impact of each component of the algorithm on the experimental accuracy after each Epoch. The average accuracy, recall, and F1 score of all algorithms are shown in Table 7, which verifies the superiority of the proposed algorithm compared to the traditional deep learning methods, which have the best performance.
We propose a deep PS-AE-LSTM architecture for risk-level assessment, which takes flight data as the object and statistics as the theoretical basis, and integrates PS models into AE-LSTM deep learning models to form a unified framework. The first layer adopts the PS module to extract the flight data and calculate the risk value. In the second layer, we employ an autoencoder combined with LSTM for time sensitivity to assess the risk level. Experiments on real-world flight data illustrate the superior performance against seven baseline models. Compared with the artificial neural network model, the proposed model can both well handle the time series data and improve the label quality, solving the problem of difficulty in quantitatively determining the assessment labels in flight safety-related artificial neural networks and improving the accuracy of risk assessment. The model provides flight safety technical support to frontline personnel in the flight safety control department, providing reliable risk assessment results for overrun events such as heavy landings and tail wipes, facilitating the improvement of flight quality for the entire flight team and further safeguarding flight safety. It can also be used by flight training organisations to assess the quality of flight training and the level of mastery of a specific operational skill. More importantly, the proposed PS-AE-LSTM algorithm is a general algorithm applicable to the risk level assessment for almost all overrun events, which can be widely applied to the assessment of flight safety. For example, risk assessment of aircraft tail wipe based on the effect of pitch angle and other data on overrun events, risk assessment of aircraft hard landing based on the impact of vertical load and other data on overrun events, assessment of overrun events based on the distance of the contact point, etc.
It is worth pointing out that the proposed PS-AE-LSTM algorithm is a general algorithm that can solve most risk assessment problems on normally distributed data, not limited to flight safety. Furthermore, we will investigate the challenge of choosing multiple inputs for the model and constructing a model framework based on the overall risk assessment at a particular flight phase.
Acknowledgement: We would like to thank those who contributed to our research. We are particularly grateful to flight instructors Yunsong Lu, Hong Huang and Wuyang Song from the Civil Aviation Flight University of China for their expert support and validation work in this research.
Funding Statement: This research was funded by the National Natural Science Foundation of China (U2033213); supported by the Fundamental Research Funds for the Central Universities (FZ2021ZZ01, FZ2022ZX50).
Author Contributions: Conceptualization, F.Y. and H.S.; methodology, F.Y. and P.Z.; software, F.Y. and P.Z.; validation, F.Y. and Y.Z.; formal analysis, F.Y. and H.S.; writing—original draft preparation, F.Y.; writing—review and editing, F.Y. and P.Z.; supervision, Y.J.; project administration, H.S. All authors have read and agreed to the published version of the manuscript.
Availability of Data and Materials: Partial data contained in this study can be obtained upon request to the corresponding author. Readers can also request part of the original data and the results of data processing in this paper.
Conflicts of Interest: The authors declare that they have no conflicts of interest to report regarding the present study.
References
1. Insua, D. R., Alfaro, C., Gomez, J., Hernandez-Coronado, P., Bernal, F. (2018). A framework for risk management decisions in aviation safety at state level. Reliability Engineering & System Safety, 179(2), 74–82. [Google Scholar]
2. Badánik, B., Jánossy, M., Dijkstra, A. (2021). The use of expert judgement methods for deriving accident probabilities in aviation. Promet—Traffic&Transportation, 33(2), 205–216. [Google Scholar]
3. Bigün, E. S. (1995). Risk analysis of catastrophes using experts’ judgements: An empirical study on risk analysis of major civil aircraft accidents in Europe. European Journal of Operational Research, 87(3),599–612. [Google Scholar]
4. Oster, C. V., Strong, J. S., Zorn, C. K. (2013). Analyzing aviation safety: Problems, challenges, opportunities. Research in Transportation Economics, 43(1), 148–164. [Google Scholar]
5. Papanikou, M. (2020). Risk assessment: Knowledge management paradigms, big data, and aviation policy making. In: Ismyrlis, V., Tarnanidis, T., Moschidis, E. (Eds.Knowledge management practices in the public sector, pp. 47–75. Netherland, NL: IGI Global. [Google Scholar]
6. Wang, L., Sun, R., Wu, C., Cui, Z., Lu, Z. (2014). Quantitative evaluation model of heavy landing risk based on flight QAR data. China Safety Science Journal, 24(2), 88–92 (In Chinese). [Google Scholar]
7. Zhao, X., Li, B. (2017). Optimization model of civil aircraft landing vertical acceleration standard. Journal of Shenyang Normal University (Natural Science Edition), 35(1), 61–67 (In Chinese). [Google Scholar]
8. Wang, L., Guo, S. G., Ren, Y. (2019). Landing operation risk evaluation based on normal cloud of flight data. Journal of Safety and Environment, 19(5), 1555–1561. [Google Scholar]
9. Eurocontrol (2023). Artificial intelligence. https://www.eurocontrol.int/artificial-intelligence (accessed on 18/03/2023). [Google Scholar]
10. Eurocontrol (2023). FLY AI report. https://www.eurocontrol.int/publication/fly-ai-report (accessed on 20/03/2023). [Google Scholar]
11. Krzykowska, K., Krzykowski, M. (2019). Forecasting parameters of satellite navigation signal through artificial neural networks for the purpose of civil aviation. International Journal of Aerospace Engineering, 2019, 7632958. [Google Scholar]
12. Kalayci, S., Yazici, S. (2016). The impact of export volume and GDP on USA’s civil aviation in between 1980–2012. International Journal of Economics and Finance, 8(1), 229–235. [Google Scholar]
13. Denizhan, B., Doğru, A. (2017). Analysis of employability for the civil aviation maintenance graduates of Turkey. European Journal of Training and Development, 41(9), 800–813. [Google Scholar]
14. Neretin, E., Nguyen, M., Nguyen, P. (2023). Using data-driven approach in 4D trajectory prediction: A comparison of common AI-based models. Proceedings of 10th International Conference on Recent Advances in Civil Aviation, pp. 125–133. Singapore: Springer Nature Singapore. [Google Scholar]
15. Lv, H., Yu, J. J., Zhu, T. Y. (2018). A novel method of overrun risk measurement and assessment using large scale QAR data. 4th IEEE International Conference on Big Data Computing Service and Applications (IEEE BigDataService), pp. 213–220. Bamberg, Germany. [Google Scholar]
16. Zhou, D., Zhuang, X., Zuo, H., Cai, J., Bao, H. (2020). Hazard identification and prediction system for aircraft electrical system based on SRA and SVM. Proceedings of the Institution of Mechanical Engineers, Part G: Journal of Aerospace Engineering, 234(4), 1014–1026. [Google Scholar]
17. Cankaya, B., Topuz, K., Delen, D., Glassman, A. (2023). Evidence-based managerial decision-making with machine learning: The case of Bayesian inference in aviation incidents. Omega, 120, 102906. [Google Scholar]
18. Oehling, J., Barry, D. J. (2019). Using machine learning methods in airline flight data monitoring to generate new operational safety knowledge from existing data. Safety Science, 114, 89–104. [Google Scholar]
19. Liu, J. Q., Feng, Y. W., Teng, D., Chen, J. Y., Lu, C. (2023). Operational reliability evaluation and analysis framework of civil aircraft complex system based on intelligent extremum machine learning model. Reliability Engineering & System Safety, 235(1), 109218. [Google Scholar]
20. Ni, X., Wang, H., Che, C., Hong, J., Sun, Z. (2019). Civil aviation safety evaluation based on deep belief network and principal component analysis. Safety Science, 112(8), 90–95. [Google Scholar]
21. Zhang, X., Srinivasan, P., Mahadevan, S. (2021). Sequential deep learning from NTSB reports for aviation safety prognosis. Safety Science, 142(3), 105390. [Google Scholar]
22. Tong, C., Yin, X., Li, J., Zhu, T., Lv, R. et al. (2018). An innovative deep architecture for aircraft hard landing prediction based on time-series sensor data. Applied Soft Computing, 73(7), 344–349. [Google Scholar]
23. Chen, H., Shang, J., Zhao, X., Li, X., Zheng, L. et al. (2020). A deep learning method for landing pitch prediction based on flight data. 2020 IEEE 2nd International Conference on Civil Aviation Safety and Information Technology (ICCASIT), pp. 199–204. Weihai, China, IEEE. [Google Scholar]
24. Zhang, H. C., Zhu, T. Y. (2018). Aircraft hard landing prediction using LSTM neural network. 2nd International Symposium on Computer Science and Intelligent Control (ISCSIC), pp. 1–5. Stockholm, Sweden. [Google Scholar]
25. Rong, C., Ouyang, S., Sun, H. (2022). Anomaly detection in QAR data using VAE-LSTM with multihead self-attention mechanism. Mobile Information Systems, 2022(6), 8378187. [Google Scholar]
26. Liu, C., Sun, J., Liu, H., Lei, S., Hu, X. (2020). Complex engineered system health indexes extraction using low frequency raw time-series data based on deep learning methods. Measurement, 161(1), 107890. [Google Scholar]
27. Ning, S., Sun, J., Liu, C., Yi, Y. (2021). Applications of deep learning in big data analytics for aircraft complex system anomaly detection. Proceedings of the Institution of Mechanical Engineers, Part O: Journal of Risk and Reliability, 235(5), 923–940. [Google Scholar]
28. Kang, Z., Shang, J., Feng, Y., Zheng, L., Wang, Q. et al. (2021). A deep sequence-to-sequence method for accurate long landing prediction based on flight data. IET Intelligent Transport Systems, 15(8), 1028–1042. [Google Scholar]
29. Wang, L., Wu, C., Sun, R. (2014). An analysis of flight quick access recorder (QAR) data and its applications in preventing landing incidents. Reliability Engineering & System Safety, 127(2), 86–96. [Google Scholar]
30. Wang, L., Zhang, J., Dong, C., Sun, H., Ren, Y. (2019). A method of applying flight data to evaluate landing operation performance. Ergonomics, 62(2), 171–180. [Google Scholar] [PubMed]
31. Sun, R., Liu, X., Gao, L., Zhan, X. (2019). Safety evaluation of aircraft in final approach based on QAR data. 2019 5th International Conference on Transportation Information and Safety (ICTIS), pp. 1062–1067. Liverpool, UK, IEEE. [Google Scholar]
32. Wang, Y., Yao, H., Zhao, S. (2016). Auto-encoder based dimensionality reduction. Neurocomputing, 184(4), 232–242. [Google Scholar]
33. Yu, Y., Si, X., Hu, C., Zhang, J. (2019). A review of recurrent neural networks: LSTM cells and network architectures. Neural Computation, 31(7), 1235–1270. [Google Scholar] [PubMed]
34. Kong, Y., Zhang, X., Mahadevan, S. (2022). Bayesian deep learning for aircraft hard landing safety assessment. IEEE Transactions on Intelligent Transportation Systems, 23(10), 17062–17076. [Google Scholar]
35. Ma, L., Pan, D., Wu, Z. (2013). ANN RBF based approach of risk assessment for aviation ATM network. Sensors and Transducers, 159(11), 132–137. [Google Scholar]
36. Chen, L., Qin, K., Hao, K. (2021). Time series anomaly detection method based on integrated LSTM-AE. Journal of Huazhong University of Science and Technology (Natural Science Edition), 49(11), 35–40 (In Chinese). [Google Scholar]
Cite This Article
 Copyright © 2024 The Author(s). Published by Tech Science Press.
This work is licensed under a Creative Commons Attribution 4.0 International License , which permits unrestricted use, distribution, and reproduction in any medium, provided the original work is properly cited.
 Downloads
 Citation Tools