
 Submit a Paper
 Propose a Special lssue
 Open Access
ARTICLE

Simulation of Corrosion-Induced Cracking of Reinforced Concrete Based on Fracture Phase Field Method
1 College of Mechanics and Materials, Hohai University, Nanjing, 210098, China
2 State Key Laboratory of Disaster Reduction in Civil Engineering & College of Civil Engineering, Tongji University, Shanghai, 200092, China
* Corresponding Author: Xin Gu. Email:
Computer Modeling in Engineering & Sciences 2024, 138(3), 2257-2276. https://doi.org/10.32604/cmes.2023.031238
Received 24 May 2023; Accepted 27 July 2023; Issue published 15 December 2023
 View Full Text
 Download PDF
Abstract
Accurate simulation of the cracking process caused by rust expansion of reinforced concrete (RC) structures plays an intuitive role in revealing the corrosion-induced failure mechanism. Considering the quasi-brittle fracture of concrete, the fracture phase field driven by the compressive-shear term is constructed and added to the traditional brittle fracture phase field model. The rationality of the proposed model is verified by a mixed fracture example under a shear displacement load. Then, the extended fracture phase model is applied to simulate the corrosion-induced cracking process of RC. The cracking patterns caused by non-uniform corrosion expansion are discussed for RC specimens with homogeneous macroscopically or heterogeneous with different polygonal aggregate distributions at the mesoscopic scale. Then, the effects of the protective layer on the crack propagation trajectory and cracking resistance are investigated, illustrating that the cracking angle and cracking resistance increase with the increase of the protective layer thickness, consistent with the experimental observation. Finally, the corrosion-induced cracking process of concrete specimens with large and small spacing rebars is simulated, and the interaction of multiple corrosion cracking is easily influenced by the reinforcement spacing, which increases with the decrease of the steel bar interval. These conclusions play an important role in the design of engineering anti-corrosion measures. The fracture phase field model can provide strong support for the life assessment of RC structures.Keywords
Concrete is an important building material, and its fracture characteristics play a key role in engineering safety [1]. The cracking failure of reinforced concrete (RC) structures caused by rebar corrosion and rust expansion has always been one of the main problems encountered in the service of concrete infrastructure, especially in the marine environment. The rebar corrosion process can be divided into three stages. In the first stage, once the chloride ion concentration around the reinforcement reaches the threshold, the protective passive film around the reinforcement starts to dissolve, leading to the start of reinforcement corrosion. In the second stage, the corrosion products of reinforcement continuously form, resulting in tensile stress in the concrete at the corrosion site. In the third stage, the rust expansion-induced crack initiates and gradually extends to the whole protective layer, which may cause the protective layer to peel off from the concrete structural members, e.g., beams, columns, and piers [2].
The simulation research of the concrete fracture process, especially the crack initiation and propagation, has attracted great attention. The failure simulation methods used for concrete materials and structures are usually classified into two broad categories, i.e., discrete crack approach vs. smeared or diffuse damage approach. In the discrete approach, cracks are either formed by the separation of elements [3,4] or by adding discontinuous enrichment functions in the elements [5,6], which makes the initiation of cracks dependent on mesh division or crack preset. For the former, the fracture energy will be overestimated because the crack can only propagate along the boundary of the element. Sanz et al. [7] developed an expansive joint element to simulate the oxide expansion and used an adaptable embedded cohesive crack element to describe concrete cracking, by which the numerical crack pattern agreed well with their experimental observations. For the latter, that is the extended finite element method (XFEM), the crack can propagate freely in the fixed mesh because of the employ of the level sets representation technology of cracks [8]. Therefore, the XFEM was used to simulate the concrete cover cracking due to the corrosion of steel bars [9,10]. Recently, the effect of transverse cracks on corrosion-induced cracking has been investigated based on a three-dimensional diffusion-mechanical XFEM simulation [11], where the corrosion-induced crack paths under different transverse crack morphology were tracked without remeshing. Nevertheless, in the XFEM model, the crack initiation, the crack extending direction, and the cracking distance must be well-defined according to certain fracture criteria.
For the diffuse damage approach, the damage is used to describe the crack initiation and evolution. However, if the concrete is treated as a homogeneous material, it is difficult to simulate the effect of damage localization. Based on the elastic damage model, Zhu et al. simulated the localized damage distribution by introducing the random mechanical characteristics with Weibull distribution [12,13]; however, the damage pattern differs from the actual concrete fracture mode, which limited the application of the elastic damage model in concrete structures because of the homogenization treatment requirement. Another way to promote damage localization is to employ the nonlocal integral averaging operator for the damage variable or related stress, and strain variables [14–17]. In the nonlocal damage model, although the problem of mesh sensitivity and size effect is solved, the stress locking cannot be avoided because no energy release mechanism of the microstructure is reflected. Recently, an integral nonlocal peridynamic model, first proposed by Silling et al. [18,19], has been widely followed with interest [20–24] because of its strong failure simulation capability. Zhao et al. proposed a partially-homogenized stochastic peridynamic model with the simplest constitutive relation to simulate the concrete fracture caused by rebar corrosion [25]. Although the corrosion cracking of the concrete cover layer is successfully presented, the computational cost of peridynamics is still very high.
Another diffuse approach simulating crack growth is the very popular phase field method [26–32], where the crack is characterized as a continuous damage function defined by order parameters. The phase-field model is mainly formulated based on the variational approach to fracture mechanics [33–37], where the free energy degradation function is sometimes employed to promote damage localization. Because no need to deal with the update of crack geometry, the phase-field approach has been successfully applied to the simulation of the non-uniform corrosion fracture of reinforced concrete [38,39], where the chloride and oxygen diffusion, electrochemical reaction, and concrete cover cracking were coupled at mesoscale for RC. However, the effect of the interfacial transition zone (ITZ) between aggregates and cement paste on the corrosion-induced cracking path has not been deeply investigated. In addition, only the circular aggregate is involved, while the polygonal aggregate is not yet considered.
In summary, because of the advantages of the fracture phase field method in tracking crack propagation with no requirement for explicit fracture criteria and mesh reconstruction, the fracture phase field method will be adopted and modified to simulate the corrosion-induced cracking of RC structures for the possible quasi-brittle fracture. The cracking patterns of different RC specimens macroscopically homogeneous or microscopically heterogeneous with different polygonal aggregate distributions will be explored respectively. Furthermore, the effects of protective layer thickness on the corrosion-induced cracking path will be investigated for the concrete specimens with single-, double-, or multi-steel bars.
This paper is organized as follows. In Section 2, an extended fracture phase field for mixed mode fracture is constructed. In Section 3, the rationality verification of the proposed fracture phase model is provided by a designed example. The elliptical non-uniform corrosion distribution model of reinforced concrete is given in Section 4. In Section 5, the fracture phase field simulations of rust expansion failure of RC specimens with single-, double-, and multi-steel bars at the homogeneous macroscale and the heterogeneous mesoscale are presented respectively, in which the cracking patterns are discussed in detail. Finally, Section 6 summarizes the present study.
2 An Extended Phase Field Model for Mixed Mode Fracture
The total potential energy for a cracking system is composed of elastic strain potential energy, dissipative potential energy generated by fracture, and external force potential energy [40], that is
where
Bourdin et al. [26] defined the fracture phase field by introducing an order parameter variable
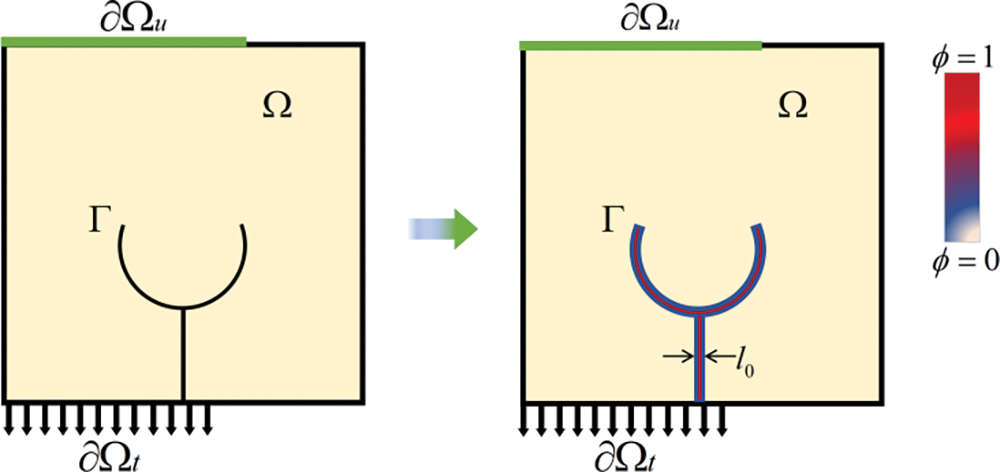
Figure 1: Phase-field approximation of the crack surface
where
where
Francfort et al. [40] pointed out that the release of elastic energy drives the evolution of the fracture phase field. Assuming that the crack is only driven by the tensile strain [41], the strain tensor
where
where
where
where
Without considering the kinetic energy term, the total Lagrangian energy functional can be expressed as the sum of the fracture energy of Eq. (4), the elastic energy of Eq. (7), and the external force potential energy caused by the external load.
The above energy functional integral equation is discretized by finite element method and introduces the interpolation mode of displacement and fracture phase field of element, the corresponding finite element incremental solution format can be obtained by variational extreme value of functional
where
where ‘
where m are parameters much smaller than one, introduced for numerical convergence. The submatrixes in the generalized stiffness matrix
To facilitate implementation in COMSOL software, the corresponding strong form of the differential equations are adopted as follows:
For the solution strategy of the coupled Eq. (14), the staggered iteration scheme is adopted to ensure the convergence of solving process, and the loading step must be small enough to ensure the stability of calculation results. The numerical solution flow is shown in Fig. 2.

Figure 2: Flow chart of numerical calculation
To refine the cracked presentation results, a mixed fracture phase field variable
3 Validation of the Extended Phase Field Model
To verify the rationality of the proposed phase field model, an example of crack tracking under shear load is designed as follows: A plate with a horizontal edge crack is fixed on the bottom and a horizontal displacement u* is applied to the top boundary under the normal constraint, as shown in Fig. 3a. For simplicity, the complete loss coefficient of shear stiffness

Figure 3: The mixed fracture phase distribution for different value of
4 Corrosion Distribution Model of Reinforced Concrete
In the early study of the distribution characteristics of corrosion products, there was a lack of accurate tests and observation instruments. Researchers believed that the distribution of corrosion product layers around reinforcement was uniform. Based on this assumption, theoretical analysis [43] and test methods [44] can be simplified. However, with the deepening of research, it is found that the assumption of uniform distribution of corrosion products in reinforced concrete is inconsistent with the actual situation. Based on the electro-chemical coupling model of RC sample, the corrosion depth of steel bars at the upstream surface takes on a Gaussian distribution, as shown in Fig. 4. Yuan et al. [45] gained the oval distribution of reinforcement corrosion for the case of the accelerated corrosion of RC under an artificial climate environment by using electron microscopy scanning and electron probe technology, as shown in Fig. 5. In the polar coordinate system established at the centroid of the reinforcement, the corrosion amount of the reinforcement surface is represented by the loss of radius, and the expression of the radius loss can be written as follows:
where R is the radius of the reinforcement,

Figure 4: The distribution of rebar corrosion depth

Figure 5: Model of non-uniform corrosion and expansion distribution of steel bar
After the steel bars are corroded, the molar volume of ferric hydroxide generated is larger than that of iron, resulting in expansion. The volume of corrosion products is about three to four times that of the original steel bars [46]. Even if the corrosion depth is Gaussian distribution with the angle around the steel bar, due to the limitations of the surrounding concrete, the corrosion products will still be filled in an elliptical distribution. When the corrosion products fill the gap between the reinforcement and the concrete, the surrounding concrete will be squeezed, resulting in expansion force. The force is in direct proportion to the volume after corrosion, oval in shape, and opposite to the direction of corrosion. The rust expansion effect is achieved by applying displacement to the nodes on the reinforcement surface. From the radius loss expression of Eq. (15), the expansion distribution during the corrosion process of the reinforcement surface can be obtained as follows:
where
5 Simulation of Rust Expansion Failure of Reinforced Concrete Specimens
5.1 Cases of Concrete With a Single Steel Bar
Take the reinforced concrete test specimen with a square cross-section as an example, the side length of the cross-section is 100 mm, the diameter of the steel reinforcement is 16 mm, and the thickness of the concrete protective layer is c. In the numerical simulation, the plane strain problem is considered. The bottom edge of the reinforced concrete specimen is fixed. The displacement loads with oval distribution, whose maximum amplitude is denoted by

To investigate the influence of the concrete protective layer on the corrosion expansion failure of reinforced concrete, three different thicknesses, i.e., c = 15 mm, c = 20 mm and c = 25 mm, are selected for analysis. The calculation results are correspondingly shown in Figs. 6–8. As can be seen in Fig. 6, for the case of c = 15 mm when

Figure 6: Cracking patterns with c = 15 mm at representative loading levels

Figure 7: Cracking patterns with c = 20 mm at representative loading levels

Figure 8: Cracking patterns with c = 25 mm at representative loading levels

Figure 9: Experimental test cracking pattern in different circumferential cross-sections [11] (Copyright obtained: https://s100.copyright.com/CustomerAdmin/PLF.jsp?ref=e36d7096-2f67-4cfb-aa9b-d7e7a3ec52f4)
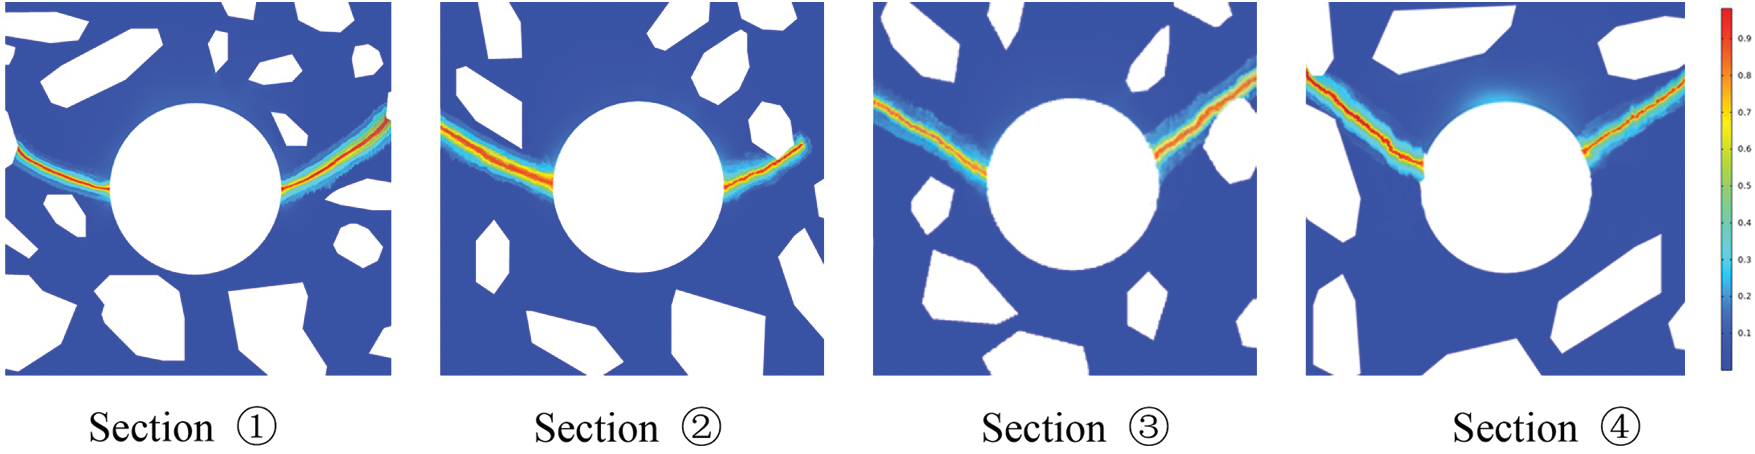
Figure 10: Numerical verification of experimentally tested cracking patterns for different circumferential cross-sections
To investigate the evolution of load exerted on concrete by rust expansion during reinforcement corrosion, the curves of the reaction force at the maximum corrosion location on the surface of reinforcement in RC samples with different cover thicknesses vs. rust expansion are extracted from the numerical results, presented as in Fig. 11. As can be seen that the limit reaction force or the limit bearing capacity increases as the thickness of protective layer increases. Moreover, the left and middle subfigures illustrate that the reaction force at the maximum corrosion position rapidly decreases and tends to zero when damage occurs at that position; and then, as the rust expansion proceeds, the middle crack develops towards the upstream surface, and the reaction force rebounds slightly followed by softening release. However, for the thickest protective layer in right subfigure, the damage at corrosion area occurs when the cracks on both sides are far from fully developed, and the corresponding reaction force is rapidly released without subsequent rebound; that is, the intermediate damage does not develop cracks due to dispersion towards the adjacent reinforcement surface.

Figure 11: Curves of reaction force at the maximum corrosion location vs. maximum rust expansion for different cover thicknesses (left c = 15 mm, middle c = 20 mm, right c = 25 mm)
In general, concrete material at the mesoscale is considered to consist of three phases, i.e., randomly distributed aggregate, a hardened cement paste, and the interface transition zone (ITZ) between them. Compared with the cement paste, aggregate is almost impermeable, and hence the distribution of aggregate may directly affect the diffusion path of chloride ions. As shown in Fig. 12, the polygonal aggregate is generated for mesoscale modeling of concrete, and the thickness of ITZ is set as 0.3–0.6 mm [49]. The mechanical properties of aggregate, cement paste, and ITZ are listed in Table 2 [2,47], where Young’s modulus and the tensile strength of ITZ are the smallest among those of the three material phases. To capture the significant differences in stress distribution around cracks, the mesh generation still needs to be very dense, nevertheless, the quadratic element is adopted, especially in the areas around reinforcement and ITZ, as shown in Fig. 13, and other examples follow the same meshing principle.

Figure 12: Meso-scale model of concrete with a steel reinforcement


Figure 13: Finite element mesh of the model
To illustrate the effect of randomly distributed aggregate, Sample A with the random distribution of mostly elongated and sharp aggregates, Sample B with three gradation random distribution of blunt polygon aggregates, and Sample C with two gradation random distribution of blunt polygon aggregates, are chosen as presented in Figs. 14–16. The thickness of the concrete protective layer is all set as 15 mm. The geometry, loading, and boundary of the inhomogeneous concrete specimens are the same as those of the above homogeneous concrete specimen. Taking the fracture phase field modeling, the calculation results are shown in Figs. 14–16, correspondingly. It is interesting to note that the generation of cracks is more or less similar to the case of homogeneous concrete, but the growth and development of cracks along the ITZ locally depend on the distribution of aggregates. It means that the existence of aggregate can hinder and delay the propagation of cracks. Therefore, the more the aggregate grading, the larger the particle content can be designed. If the interface strength is sufficient, it is not easy to rust, and even with the same degree of rust, it is not easy to crack and expand.

Figure 14: Cracking patterns of Sample A at representative loading levels

Figure 15: Cracking patterns of Sample B at representative loading levels

Figure 16: Cracking patterns of Sample C at representative loading levels
When it comes to the mechanism of rust expansion and fracture, the simulation results of homogeneous concrete can basically show a rough propagation path. However, due to the principle of weakest component strength, which means that the initiation of rust expansion and crack is determined by the ITZ in the concrete around the steel bar, further crack propagation will be induced by the ITZ. Therefore, the strength homogenization treatment of homogeneous concrete is not suitable, which leads to inaccurate rust crack paths.
5.2 Cases of Concrete with Multiple Steel Bars
In this section, the corrosion cracking process of reinforced concrete with different spacing arrangements of steel bars is studied. The first example is a test specimen with 110 mm spacing between two steel bars, and the diameter of both rebars is 16 mm, as shown in the left of Fig. 17. The loading and boundary of the specimen are the same as in the previous case of concrete with a single steel bar. Fig. 18 shows the cracking patterns at three representative loading levels. Similar to the case of a single steel bar, the protective layer in the case of two steel bars is still cut into two wedges, while the protective layer is thin enough and the distance between reinforcements is large enough.
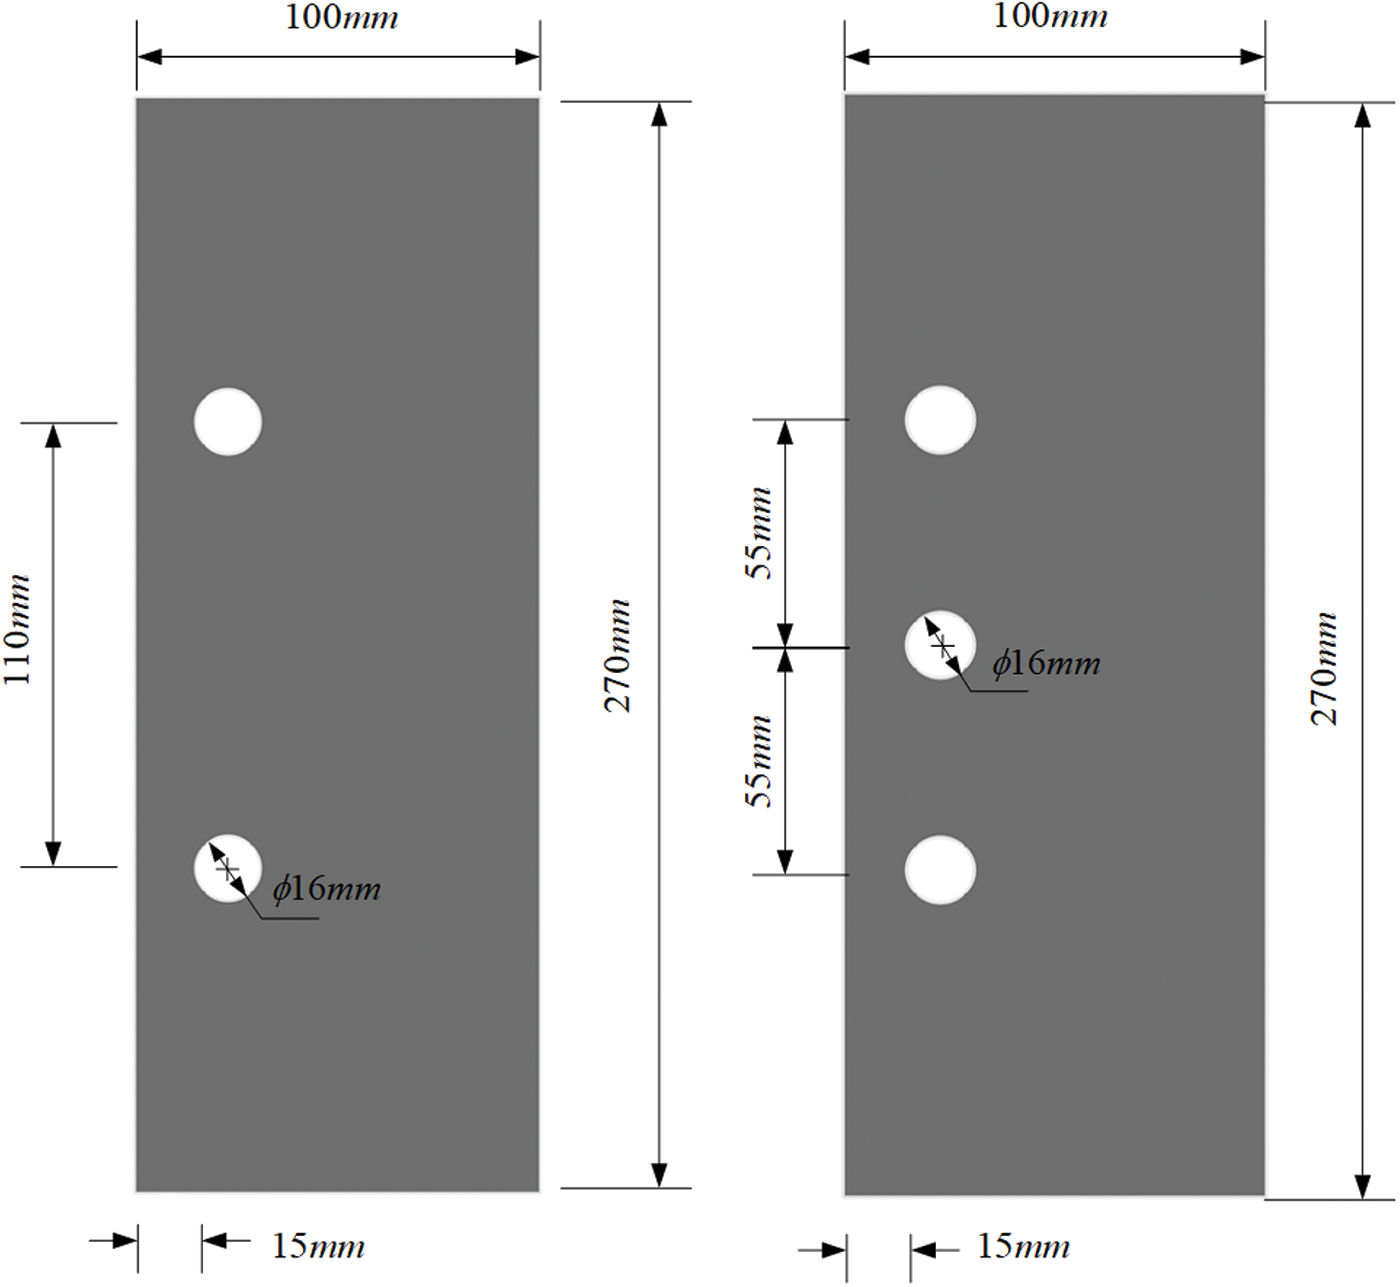
Figure 17: Model of concrete with different spacing arrangements of rebars
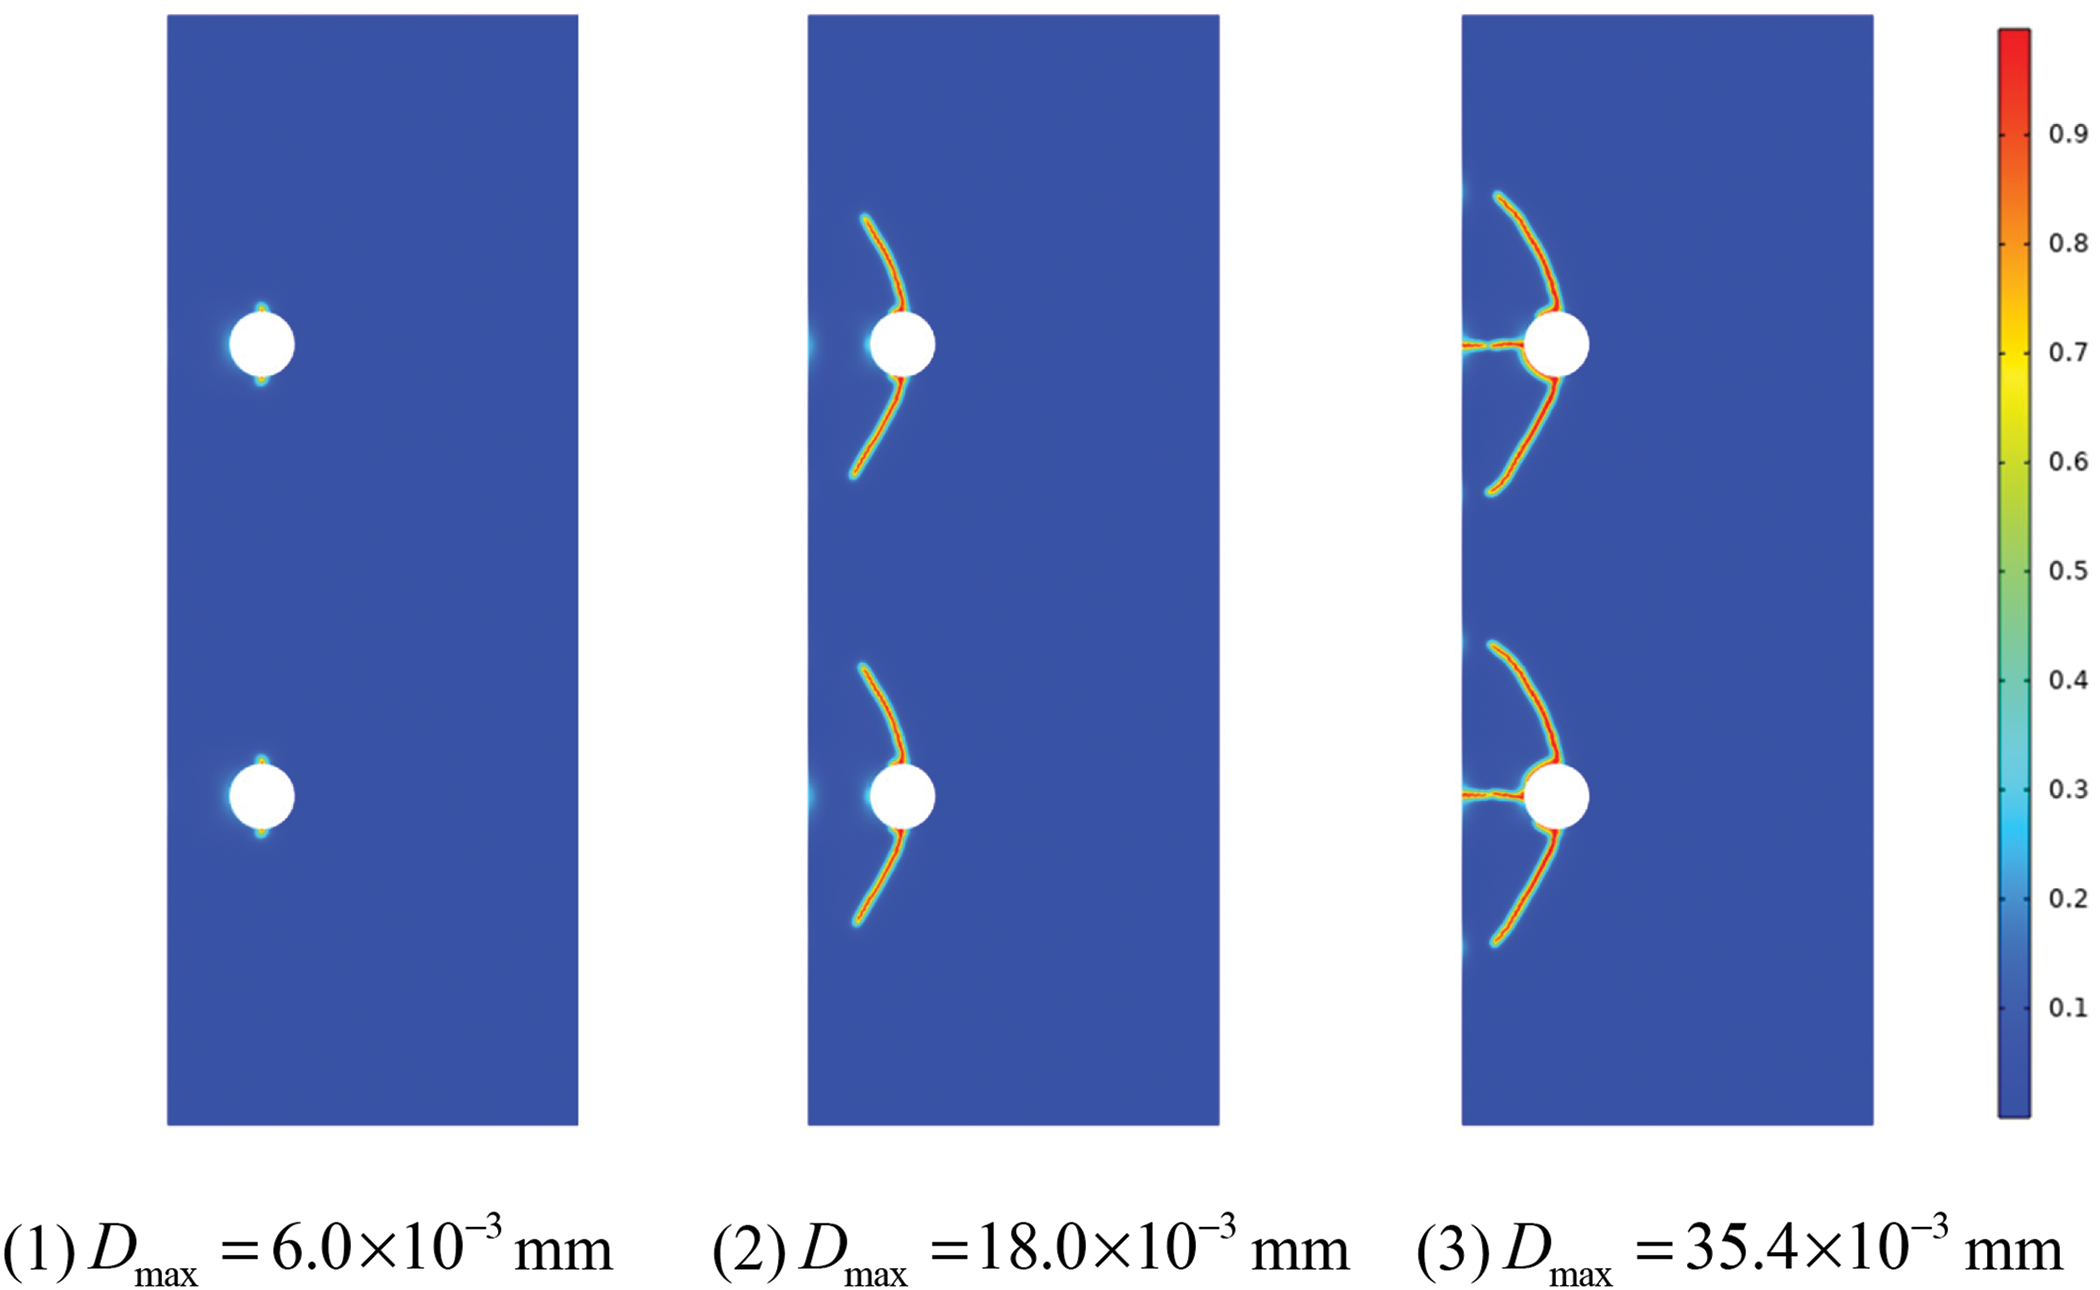
Figure 18: Cracking patterns with large spacing rebars at representative loading levels
To investigate the multiple cracking interactions during the corrosion process, we next consider another specimen with a small spacing reinforcement arrangement. Except for reducing the spacing between reinforced bars to 50 mm, the calculated parameters, constraints, and loads of the latter example are still the same as the former, as shown in the right of Fig. 17. The numerical simulated cracking process is presented in Fig. 19, in which the crack pattern is similar to that of a single steel bar at the initial stage. However, when the cracks further expand, the propagation path will be affected by adjacent cracks, and then the cracks connect and penetrate each other, and finally, the phenomenon of layered peeling emerges. It is of interest to note that the simulation results are in good agreement with the experimental results in the Cady et al. [50]. All of these fully demonstrate the feasibility of the fracture phase field method to simulate the corrosion cracking failure of reinforced concrete.
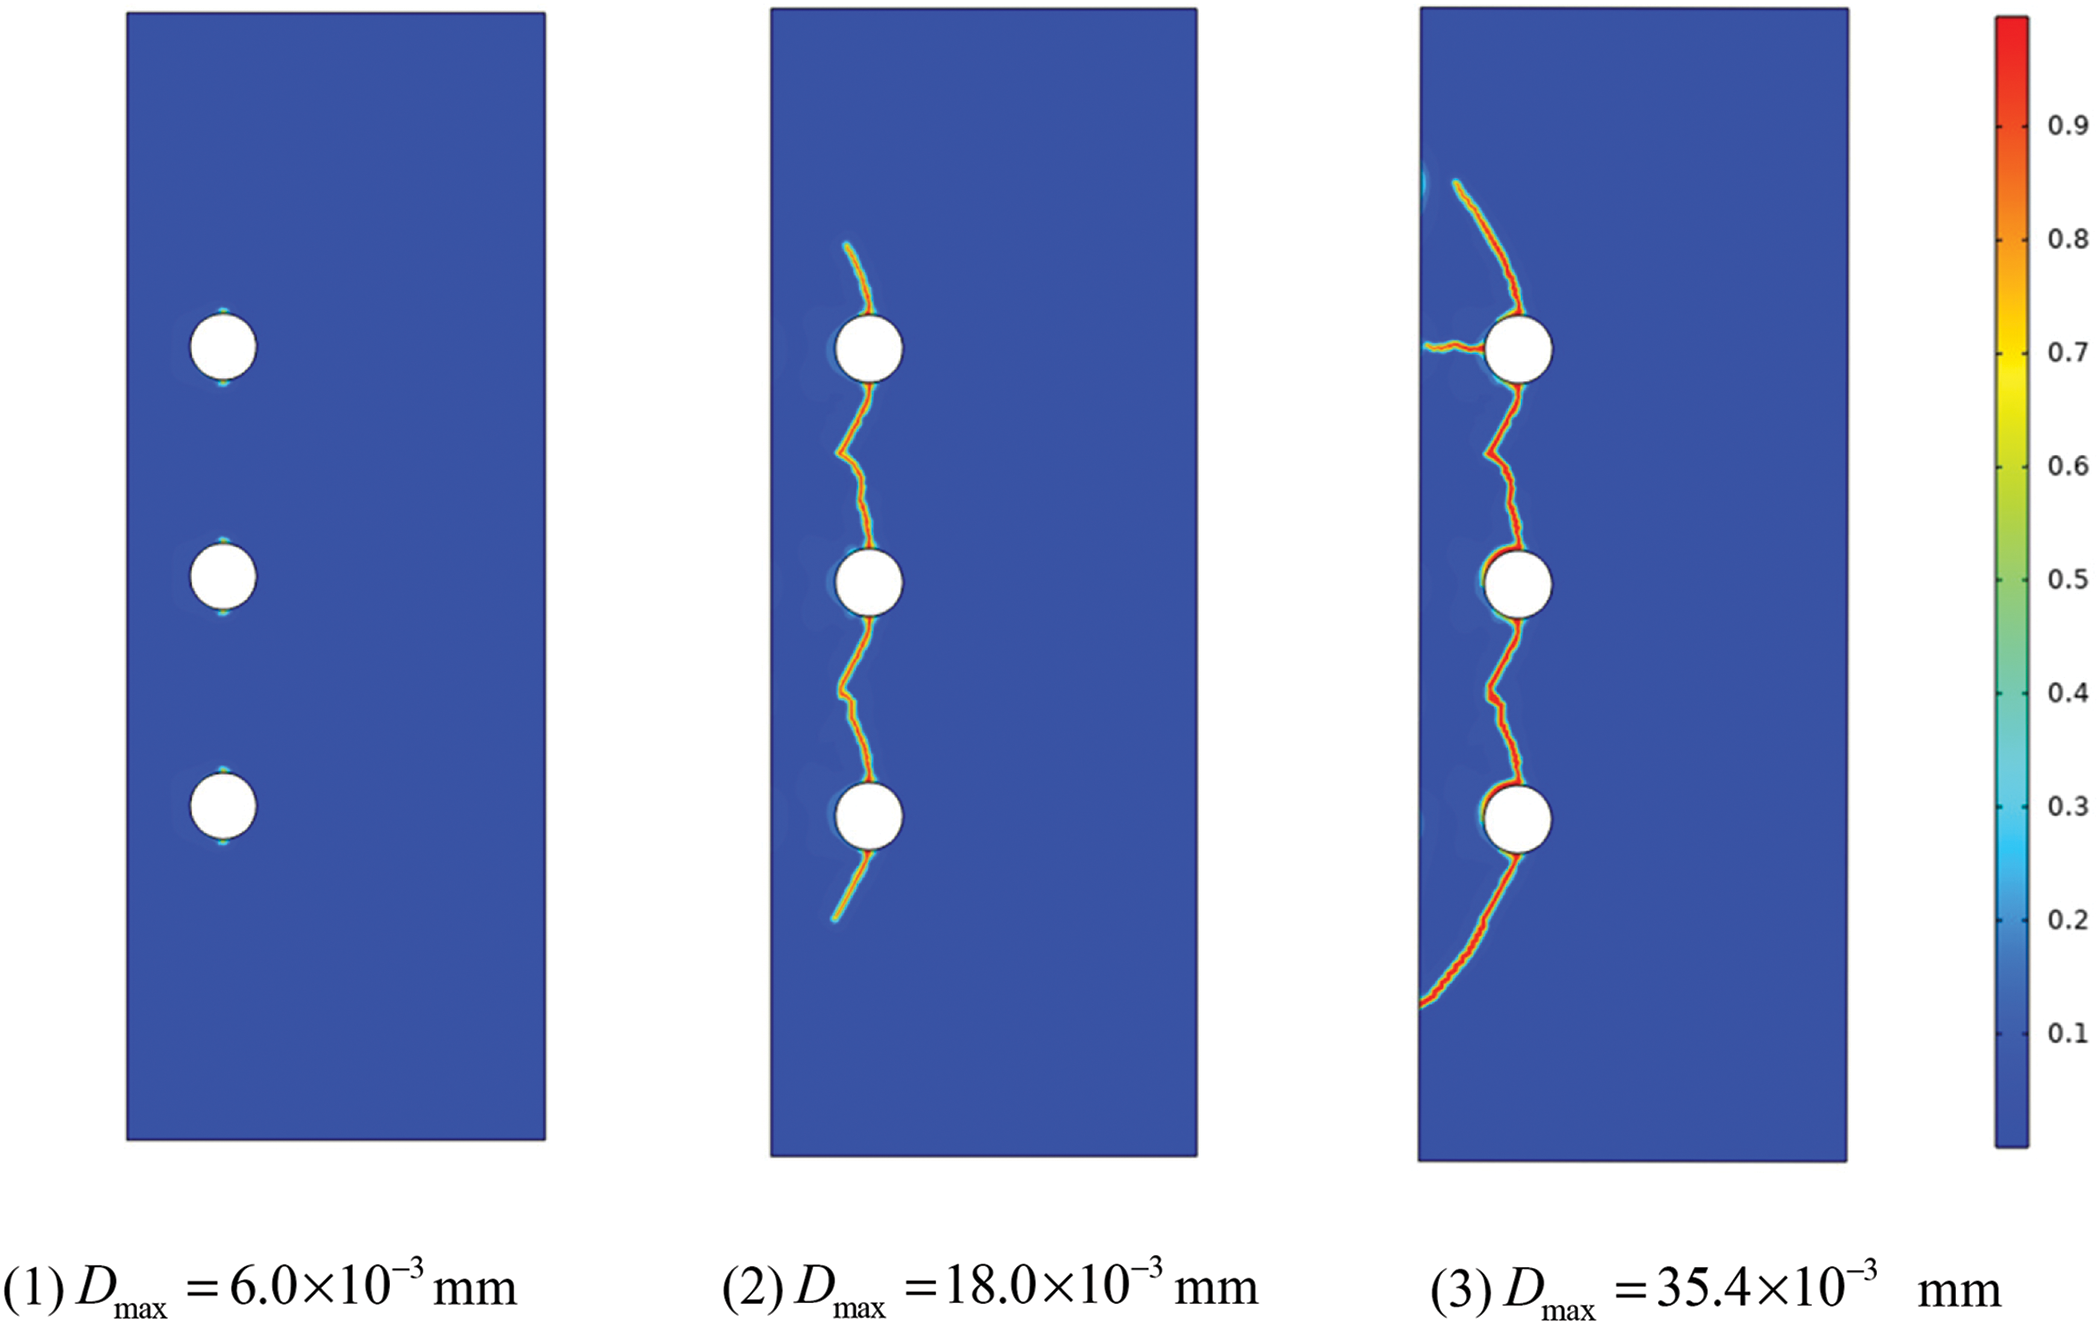
Figure 19: Cracking patterns with small spacing rebars at representative loading levels
Considering the quasi-brittle fracture of concrete, the fracture phase field driven by the compressive-shear term is constructed and added to the traditional brittle fracture phase field model. The rationality of the proposed model is verified by a designed example of mixed cracking under a shear load. The fracture phase field models of RC specimens homogeneous macroscopically or heterogeneous with different polygonal aggregate distributions at the mesoscopic scale are established, and their non-uniform corrosion-induced cracking process and cracking patterns are simulated successfully. Then, the effects of protective layer thickness on the crack propagation path and cracking resistance are investigated. Finally, the corrosion-induced cracking process of concrete specimens with large and small spacing rebars is simulated, and the interaction mechanism of multiple corrosion cracking is also explored. Some conclusions are obtained as follows:
1) The advantages of fracture phase fields in tracking the corrosion-induced crack propagation are again demonstrated, namely, no need for explicit fracture criteria, no need to preset cracks, and no need to re-mesh.
2) The corrosion-induced cracking of concrete is still mainly mode I cracking because the critical fracture energy release rate of mode II is much greater than that of mode I for concrete material, which is the square magnitude of the fracture toughness ratio.
3) The cracking resistance of concrete increases with the increase of the protective layer thickness under the same corrosion expansive level. The thicker the concrete protective layer is, the closer the crack propagation direction is to the direction parallel to the surface of the protective layer, which confirms the findings of Bažant.
4) Aggregate within the concrete can hinder and delay the propagation of cracks, while the weak ITZ can induce cracks to grow or develop towards itself, which results in the corrosion-induced cracking path locally depending on the distribution, shape, and grade of aggregates. Nevertheless, the cracking pattern for heterogeneous concrete with different randomly distributed aggregates is more or less similar to the case of homogeneous concrete under the same non-uniform corrosion of steel bar.
5) The cracks caused by the rust expansion of adjacent reinforcements are easy to coalesce with the decrease of reinforcement spacing; that is, when the spacing of reinforcement is closer, the rust expansion cracks are easier to connect and penetrate.
It should be noted that the Phase-field model of compression shear fracture proposed in this paper is not perfect, for example, the correlation between residual shear stiffness and spherical stress has not been established, and how to properly calibrate the length scale parameters of mode I and mode II fractures. The more efficient adaptive algorithm and the more perfect fracture Phase-field model will be explored in another paper.
Acknowledgement: The financial support of the National Natural Science Foundation of China and the Fundamental Research Funds for the Central Universities is gratefully acknowledged.
Funding Statement: This work has been partially supported by the National Natural Science Foundation of China (Qing Zhang, Nos. 11932006, U1934206, 12172121), and the Fundamental Research Funds for the Central Universities (Xin Gu, No. B210201031).
Author Contributions: The authors confirm contribution to the paper as follows: study conception and design: Xiaozhou Xia; computational simulation: Changsheng Qin; analysis and interpretation of results: Xiaozhou Xia, Guangda Lu, Xin Gu; draft manuscript preparation: Xiaozhou Xia, Xin Gu, Guangda Lu, Qing Zhang. All authors reviewed the results and approved the final version of the manuscript.
Availability of Data and Materials: Readers can access the data used in the study by Email xiaxiaozhou@163.com.
Conflicts of Interest: The authors declare that they have no conflicts of interest to report regarding the present study.
References
1. Xiao, Y. X., Lu, N. W., Chen, F. H. (2020). The shear capacity of steel-ultra-high performance concrete composite board connectors. Journal of Transport Science and Engineering, 36(1), 44–49 (In Chinese). [Google Scholar]
2. Chen, A. R., Pan, Z. C., Ma, R. J. (2017). Mesoscopic simulation of steel rebar corrosion process in concrete and its damage to concrete cover. Structure and Infrastructure Engineering, 13(4), 478–493. [Google Scholar]
3. Ortiz, M., Pandolfi, A. (1999). Finite-deformation irreversible cohesive elements for three-dimensional crack-propagation analysis. International Journal for Numerical Methods in Engineering, 44(9), 1267–1282. [Google Scholar]
4. Zhang, Y. F., Xia, X. Z., Wu, Z., Zhang, Q. (2020). The effect of initial defects on overall mechanical properties of concrete material. Computers, Materials & Continua, 62(1), 413–442. https://doi.org/10.32604/cmc.2020.04660 [Google Scholar] [CrossRef]
5. Moës, N., Dolbow, J., Belytschko, T. (1999). A finite element method for crack growth without remeshing. International Journal for Numerical Methods in Engineering, 46(1), 131–150. [Google Scholar]
6. Khoei, A. R. (2014). Extended finite element method: Theory and applications. Hoboken: John Wiley & Sons. [Google Scholar]
7. Sanz, B., Planas, J., Sancho, J. M. (2013). An experimental and numerical study of the pattern of cracking of concrete due to steel reinforcement corrosion. Engineering Fracture Mechanics, 114, 26–41. [Google Scholar]
8. Stolarska, M., Chopp, D. L., Moës, N., Belytschko, T. (2001). Modelling crack growth by level sets in the extended finite element method. International Journal for Numerical Methods in Engineering, 51(8), 943–960. [Google Scholar]
9. Mirzaee, M. J., Alaee, F. J., Hajsadeghi, M., Zirakian, T. (2017). Numerical modeling of concrete cover cracking due to steel reinforcing bars corrosion. Structural Engineering and Mechanics, 61(6), 693–700. [Google Scholar]
10. Guzmán, S., Gálvez, J. C., Sancho, J. M. (2011). Cover cracking of reinforced concrete due to rebar corrosion induced by chloride penetration. Cement and Concrete Research, 41(8), 893–902. [Google Scholar]
11. Yu, S., Jin, H. (2020). Modeling of the corrosion-induced crack in concrete contained transverse crack subject to chloride ion penetration. Construction and Building Materials, 258(1), 119645. [Google Scholar]
12. Zhu, W. C., Teng, J. G., Tang, C. A. (2004). Mesomechanical model for concrete. Part I: Model development. Magazine of Concrete Research, 56(6), 313–330. [Google Scholar]
13. Teng, J. G., Zhu, W. C., Tang, C. A. (2004). Mesomechanical model for concrete. Part II: Application. Magazine of Concrete Research, 56(6), 331–345. [Google Scholar]
14. Bazant, Z. P., Lin, F. B. (1988). Nonlocal smeared cracking model for concrete fracture. Journal of Structural Engineering, 114(11), 2493–2510. [Google Scholar]
15. Bazant, Z. P., Pijaudier-Cabot, G. (1988). Nonlocal continuum damage, localization instability and convergence. Journal of Applied Mechanics, 55(2), 287–293. [Google Scholar]
16. Jirasek, M. (1998). Nonlocal models for damage and fracture: Comparison of approaches. International Journal of Solids and Structures, 35(31–32), 4133–4145. [Google Scholar]
17. Bažant, Z. P., Jirásek, M. (2002). Nonlocal integral formulations of plasticity and damage: Survey of progress. Journal of Engineering Mechanics, 128(11), 1119–1149. [Google Scholar]
18. Silling, S. A. (2000). Reformulation of elasticity theory for discontinuities and long-range forces. Journal of the Mechanics and Physics of Solids, 48(1), 175–209. [Google Scholar]
19. Silling, S. A., Askari, E. (2005). A meshfree method based on the peridynamic model of solid mechanics. Computers & Structures, 83(17–18), 1526–1535. [Google Scholar]
20. Agwai, A., Guven, I., Madenci, E. (2011). Predicting crack propagation with peridynamics: A comparative study. International Journal of Fracture, 171(1), 65–78. [Google Scholar]
21. Bobaru, F., Zhang, G. (2015). Why do cracks branch? A peridynamic investigation of dynamic brittle fracture. International Journal of Fracture, 196(1–2), 59–98. [Google Scholar]
22. Breitenfeld, M. S., Geubelle, P. H., Weckner, O., Silling, S. (2014). Non-ordinary state-based peridynamic analysis of stationary crack problems. Computer Methods in Applied Mechanics and Engineering, 272(2), 233–250. [Google Scholar]
23. Gu, X., Zhang, Q., Xia, X. Z. (2017). Voronoi-based peridynamics and cracking analysis with adaptive refinement. International Journal for Numerical Methods in Engineerin, 112(13), 2087–2109. [Google Scholar]
24. Gu, X., Zhang, Q. (2020). A modified conjugated bond-based peridynamic analysis of impact failure for concrete gravity dam. Meccanica, 55(3), 547–566. [Google Scholar]
25. Zhao, J., Chen, Z., Mehrmashhadi, J., Bobaru, F. (2020). A stochastic multiscale peridynamic model for corrosion-induced fracture in reinforced concrete. Engineering Fracture Mechanics, 229, 106969. [Google Scholar]
26. Bourdin, B., Francfort, G. A., Marigo, J. J. (2000). Numerical experiments in revisited brittle fracture. Journal of the Mechanics and Physics of Solids, 48(4), 797–826. [Google Scholar]
27. Karma, A., Kessler, D. A., Levine, H. (2001). Phase-field model of mode III dynamic fracture. Physical Review Letters, 87(4), 45501. [Google Scholar]
28. Hakim, V., Karma, A. (2009). Laws of crack motion and phase-field models of fracture. Journal of the Mechanics and Physics of Solids, 57(2), 342–368. [Google Scholar]
29. Hofacker, M., Miehe, C. (2013). A phase field model of dynamic fracture: Robust field updates for the analysis of complex crack patterns. International Journal for Numerical Methods in Engineering, 93(3), 276–301. [Google Scholar]
30. Wu, J. Y. (2017). A unified phase-field theory for the mechanics of damage and quasi-brittle failure. Journal of the Mechanics and Physics of Solids, 103(4), 72–99. [Google Scholar]
31. Fei, F., Choo, J. (2020). A phase-field model of frictional shear fracture in geologic materials. Computer Methods in Applied Mechanics and Engineering, 369(2), 113265. [Google Scholar]
32. Wu, J. Y., Nguyen, V. P., Nguyen, C. T., Sutula, D., Sinaie, S. et al. (2020). Phase-field modeling of fracture. Advances in Applied Mechanics, 53(2), 1–183. [Google Scholar]
33. Miehe, C., Welschinger, F., Hofacker, M. (2010). Thermodynamically consistent phase-field models of fracture: Variational principles and multi-field FE implementations. International Journal for Numerical Methods in Engineering, 83(10), 1273–1311. [Google Scholar]
34. Tanné, E., Li, T., Bourdin, B., Marigo, J. J., Maurini, C. (2018). Crack nucleation in variational phase-field models of brittle fracture. Journal of the Mechanics and Physics of Solids, 110(12), 80–99. [Google Scholar]
35. Bourdin, B., Francfort, G. A. (2019). Past and present of variational fracture. SIAM News, 52(9), 104. [Google Scholar]
36. Mandal, T. K., Nguyen, V. P., Wu, J. Y. (2020). Evaluation of variational phase-field models for dynamic brittle fracture. Engineering Fracture Mechanics, 235(1), 107169. [Google Scholar]
37. Wu, J. Y., Huang, Y., Zhou, H., Nguyen, V. P. (2021). Three-dimensional phase-field modeling of mode I+ II/III failure in solids. Computer Methods in Applied Mechanics and Engineering, 373(48), 113537. [Google Scholar]
38. Zhang, C. H., Xu, W. Q., Yang, J. L., Cao, K. Z., Wen, D. B. et al. (2022). Application of phase-field method in corrosion fracture of reinforced concrete. Advances in Mechanical Engineering, 14(6). https://doi.org/10.1177/16878132221108282 [Google Scholar] [CrossRef]
39. Fang, X., Pan, Z., Chen, A. R., Tian, H., Ma, R. J. (2023). Phase-field method for modeling non-uniform corrosion-induced cracking in concrete. Engineering Fracture Mechanics, 281(6), 109131. [Google Scholar]
40. Francfort, G. A., Marigo, J. J. (1998). Revisiting brittle fracture as an energy minimization problem. Journal of the Mechanics and Physics of Solids, 46(8), 1319–1342. [Google Scholar]
41. Miehe, C., Hofacker, M., Welschinger, F. (2010). A phase field model for rate-independent crack propagation: Robust algorithmic implementation based on operator splits. Computer Methods in Applied Mechanics and Engineering, 199(45–48), 2765–2778. [Google Scholar]
42. Borden, M. J., Verhoosel, C. V., Scott, M. A., Hughes, T. J., Landis, C. M. (2012). A phase-field description of dynamic brittle fracture. Computer Methods Applied Mechanics and Engineering, 217(8), 77–95. [Google Scholar]
43. Al-Harthy, A. S., Stewart, M. G., Milliard, J. (2011). Concrete cover cracking caused by reinforcement corrosion. Magazine of Concrete Research, 63(9), 655–667. [Google Scholar]
44. Williamson, S. J., Clark, L. A. (2000). Pressure required to cause cover cracking of concrete due to reinforcement corrosion. Magazine of Concrete Research, 52(6), 455–467. [Google Scholar]
45. Yuan, Y., Ji, Y. (2009). Modeling corroded section configuration of steel bar in concrete structure. Construction and Building Materials, 23(6), 2461–2466. [Google Scholar]
46. Xu, W., Li, Y., Li, H., Wang, K., Zhang, C. et al. (2022). Corrosion mechanism and damage characteristic of steel fiber concrete under the effect of stray current and salt solution. Construction and Building Materials, 314(3), 125618. [Google Scholar]
47. Liu, G., Li, Q., Zuo, Z. (2016). Implementation of a staggered algorithm for a phase field model in Abaqus. Chinese Journal of Rock Mechanics and Engineering, 35(5), 1019–1030. [Google Scholar]
48. Bažant, Z. P. (1979). Physical model for steel corrosion in concrete sea structures—Application. Jouranl of the Structural Divison, 105(5), 1155–1166. [Google Scholar]
49. Kim, S. M., Ai-Rub, R. K. A. (2011). Meso-scale computational modeling of the plastic-damage response of cementitious composites. Cement and Concrete Research, 41(3), 339–358. [Google Scholar]
50. Cady, P. D., Weyers, R. E. (1984). Deterioration rates of concrete bridge decks. Journal of Transportation Engineering, 110(1), 34–44. [Google Scholar]
Cite This Article
 Copyright © 2024 The Author(s). Published by Tech Science Press.
This work is licensed under a Creative Commons Attribution 4.0 International License , which permits unrestricted use, distribution, and reproduction in any medium, provided the original work is properly cited.
 Downloads
 Citation Tools