
 Submit a Paper
 Propose a Special lssue
 Open Access
ARTICLE

Research on Condenser Deterioration Evolution Trend Based on ANP-EWM Fusion Health Degree
1 College of Automation Engineering, Shanghai University of Electric Power, Shanghai, 200090, China
2 Shanghai Key Laboratory of Power Station Automation Technology, Shanghai, 200072, China
3 Empower Information Technology (Shanghai) Co., Ltd., Shanghai, 201508, China
4 China Nuclear Power Engineering Design Co., Ltd., Shenzhen, 518052, China
* Corresponding Author: Haixin Wang. Email:
(This article belongs to the Special Issue: Machine Learning-Guided Intelligent Modeling with Its Industrial Applications)
Computer Modeling in Engineering & Sciences 2024, 139(1), 679-698. https://doi.org/10.32604/cmes.2023.043377
Received 30 June 2023; Accepted 20 September 2023; Issue published 30 December 2023
 View Full Text
 Download PDF
Abstract
This study presents a proposed method for assessing the condition and predicting the future status of condensers operating in seawater over an extended period. The aim is to address the problems of scaling and corrosion, which lead to increased loss of cold resources. The method involves utilising a set of multivariate feature parameters associated with the condenser as input for evaluation and trend prediction. This methodology offers a precise means of determining the optimal timing for condenser cleaning, with the ultimate goal of improving its overall performance. The proposed approach involves the integration of the analytic network process with subjective expert experience and the entropy weight method with objective big data analysis to develop a fusion health degree model. The mathematical model is constructed quantitatively using the improved Mahalanobis distance. Furthermore, a comprehensive prediction model is developed by integrating the improved Informer model and Markov error correction. This model takes into account the health status of the equipment and several influencing factors, including multivariate feature characteristics. This model facilitates the objective examination and prediction of the progression of equipment deterioration trends. The present study involves the computation and verification of the field time series data, which serves to demonstrate the accuracy of the condenser health-related models proposed in this research. These models effectively depict the real condition and temporal variations of the equipment, thus offering a valuable method for determining the precise cleaning time required for the condenser.Keywords
In the preceding thirty years, the secondary loop systems of nuclear power plants have encountered diverse levels of degradation and deterioration in their crucial equipment. Hence, conducting research on the health status of nuclear power unit equipment carries significant importance [1]. The condenser, being a crucial heat exchange apparatus within the conventional island of nuclear power plants, has a direct influence on the safety of the turbine unit by ensuring its proper and steady operation. The extended exposure of condensers to seawater might result in the occurrence of scaling and corrosion. Presently, the prevailing method for cleaning condensers involves the utilisation of conventional online rubber ball cleaning equipment in order to uphold cleanliness and optimise heat transfer efficiency. Nevertheless, the utilisation of rubber balls for cleaning purposes incurs a substantial financial burden, while inadequate cleaning intervals, whether too prolonged or excessively brief, can lead to unnecessary energy consumption [2,3]. The determination of condenser cleaning time holds considerable importance in enhancing the operational dependability of the condensing system and the economic efficiency of the turbine unit. Therefore, it is important to conduct monitoring and analysis of the condenser’s status in order to determine the appropriate timing for cleaning the condenser equipment. This can be achieved by quantitatively assessing the degree of equipment health.
For the purpose of successfully cleaning the condenser, it is essential to accurately evaluate its overall condition. Currently, the predominant approach employed to assess the condition of the equipment is based on the notion of health degree. Nevertheless, the concept of a “healthy degree” lacks quantifiability and necessitates the identification and analysis of pertinent aspects that contribute to its attainment. The establishment of a scientifically valid assessment approach for determining the status of equipment is deemed required [4,5]. The assessment methods can be broadly categorised into subjective weighting methods and objective weighting methods. Subjective weighing methods are predominantly exemplified by two prominent approaches, namely the Analytic Hierarchy Process (AHP) and the Fuzzy Comprehensive Evaluation method (FCE). The literature employs the use of AHP [6,7] in order to establish an evaluation model that is based on scientific principles. This approach presents the benefits of a straightforward procedure and yielding intuitive outcomes. Nevertheless, the susceptibility of this phenomenon to subjective factors, such as expert knowledge and experience, should be acknowledged. As a result, it is possible that this could result in inaccuracies when evaluating the outcomes. The FCE [8] methodology employs fuzzy mathematics in order to thoroughly evaluate a wide range of criteria that pose challenges in terms of quantitative assessment. In their study, Hassan et al. [9] utilised a Fuzzy Analytic Hierarchy Process (FAHP) methodology to evaluate the level of satisfaction among borrowers. Nevertheless, their methodology exclusively facilitates a thorough fuzzy assessment, without immediately offering a quantitative depiction of the level of health of the item. The Principal Component Analysis (PCA) and the Entropy Weighting Method (EWM) are the primary objective weighting approaches. In their study, Giorgi et al. [10] employed an enhanced Principal Component Analysis (PCA) technique to extract the feature parameters that carry the most relevant information for the purpose of monitoring the health status of engines. Nevertheless, the use of PCA involves the conversion of correlated indicators into principle components, hence resulting in the potential loss of certain information. This loss of information can subsequently lead to the wrong determination of weights. In their study, Erkhembaatar et al. [11] employed the entropy weighting approach to ascertain the significance coefficients of indicators. In their study, Zavadskas et al. [12] utilised the Entropy Weighting Method to evaluate alternative solutions. Their objective was to identify the most optimal alternative solution by identifying the most suitable criteria. In their study, Gorgij et al. [13] employed the Exponential Weighted Moving Average (EWM) technique to construct a model for evaluating groundwater quality. The researchers evaluated the weights of pertinent factors in order to assess the water quality level of 21 groundwater samples. This model is well-suited for scenarios that involve several indications, since it has the capability to objectively reflect the significance of these indicators based on big data analysis. Nevertheless, it is worth noting that this issue can be delicate, potentially resulting in the inefficiency of parameters. Hence, there is a need for a more precise approach to ascertain the weights of feature parameters in order to quantify the degree of equipment health. By integrating the benefits of subjective weighting methods and objective weighting methods, a more comprehensive depiction of equipment health status can be attained through mutually reinforcing approaches.
The assessment of the operational condition and estimation of the cleaning duration of the condenser are crucial tasks in evaluating the health status of the equipment, as per the healthy degree model. In their study, Ma [14] focused on the determination of the equipment health index and its status after a one-year period. This was achieved by establishing a functional link between the equipment health index and the failure rate. Furthermore, Alinejad et al. [15] proposed a complete approach to determine the equipment health index by employing the Monte Carlo method. Nevertheless, the aforementioned approaches solely consider the past health condition, neglecting the influence of previous running parameters on the future condition of the equipment. On the other hand, deep learning techniques facilitate the implementation of multilayer nonlinear transformations, hence enhancing the ability to extract and discern correlations among input parameters. The utilisation of layer-by-layer coding networks and Deep Neural Networks (DNN) for condition monitoring of wind turbine main bearings and gearboxes has been proposed in references [16,17]. The operational data of condensers comprises multidimensional time series, wherein there exists temporal dependence between the current and historical moment data. The modelling methods mentioned above have limitations due to their reliance on single time point input and their inability to account for time series dependencies. In recent times, there has been an increase in the utilisation of LSTM techniques by researchers for the purpose of forecasting the operational condition of nuclear power plants. In their study, Zhang et al. [18] employed a Long Short-Term Memory (LSTM) neural network to forecast the pressure of steam generators by utilising a fusion technique for multi-sensor signals. The experimental outcomes provided confirmation of the LSTM model’s effectiveness in predicting the operational condition of nuclear power plants. Babu et al. [19] employed a Long Short-Term Memory (LSTM)-based neural network to estimate the state of water health. Similarly, Tuerxun et al. [20] utilised LSTM to predict renewable energy generation in wind farms. However, it should be noted that the training pace of this model is relatively slow while achieving comparable prediction accuracy. In comparison to alternative deep learning approaches, the Informer model is employed for the purpose of extracting time connections between input sequences, resulting in superior accuracy in temporal prediction. In their study, Bommidi et al. [21] put out the utilisation of the Informer model for the prediction of wind speed indicators characterised by intricate uncertainties. Li et al. [22] introduced a novel approach for predicting the Remaining Useful Life (RUL) of rolling bearings. This method combines multiscale degradation metrics with the Informer model, addressing the limitations of traditional prediction models in terms of slow runtime and limited reliance on long time series data. However, it is important to note that the generalisation of this approach still requires improvement, particularly when handling feature parameters with varying probability distributions. In response to the variability in condenser performance caused by external factors, certain scientists have proposed integrating error correction techniques with predictive models as a means to improve the resilience and adaptability of these models. The researchers in the study conducted by Theocharides et al. [23] utilised linear regression as a method to address the prediction bias associated with solar radiation angles. This approach resulted in improved accuracy of day-ahead forecasts for photovoltaic power generation. The aforementioned model possesses the merits of being straightforward and exhibiting a notable degree of computational efficacy. Nevertheless, the performance of this method is influenced by the distribution of data and the underlying assumptions of the model, limiting its ability to capture non-linear correlations. Zou et al. [24] employed a Markov chain methodology to rectify the prediction outcomes pertaining to China’s Gross Domestic Product (GDP). The present model incorporates the empirical data collected throughout a specific historical timeframe, effectively accounting for the cumulative effects of inaccuracies. This study aimed to examine the progression of condenser health status. This paper presents a novel approach by integrating the Informer model with the MC error correcting method to estimate the health of condensers, taking into account the natural state transition patterns in health evolution. This methodology enables enhanced precision in forecasting the condition of equipment, particularly within the framework of extensive data settings.
In order to effectively schedule the cleaning time of equipment and optimise the monitoring of condenser health status, as well as accurately predict the equipment’s deterioration trend, this paper proposes two models: a fusion health degree model utilising high-dimensional Mahalanobis distance, and a combined prediction model that incorporates this health degree. The initial step involves utilising a collection of multivariate feature parameters associated with health degree as the input. This input is then utilised to construct a fusion health degree model, employing high-dimensional Mahalanobis distance. The fusion model integrates both subjective Analytic Network Process (ANP) and objective Entropy Weight Method (EWM), and is commonly referred to as ANP-EWM. In this study, we propose the utilisation of a refined Informer model in conjunction with a Markov error correction technique referred to as Generalised Correntropy-Informer-Markov Error Correction (GC-Informer-MEC). The Informer model utilises the generalized correlation entropy as its loss function to enhance the correlation between feature data and the sequential correlation of time-series data. This approach addresses the issue of low prediction accuracy observed in Informer models when handling non-Gaussian probability distribution parameters. Furthermore, the issue of unpredictability in the process of predicting the level of health degree is mitigated through the implementation of enhanced error correcting techniques. This research shows that the condenser’s calculated health degree using the proposed approach is congruent with its real health condition based on the examination of field time-series data. The provided analysis delivers a quantitative assessment of the equipment’s health status based on its running time. This analysis effectively forecasts the future trend of the condenser and provides a dependable reference for selecting the optimal cleaning time for the condenser.
2 Building of Weight Fusion Health Degree Model Based on High-Dimensional Mahalanobis Distance
Let
where
Taking into account the varying degrees of influence that each characteristic parameter within the multivariate characteristic parameters has on the equipment’s health status, we introduce weights to enhance their significance in determining the health degree. Thus, the fusion healthiness model can be formulated as follows:
where
2.1 Calculation of
The Analytic Network Process (ANP) is a hierarchical multi-criteria decision-making method that builds upon the AHP method. ANP takes into account the multi-level structure and the interdependencies among numerous indicators, resulting in an enhanced approach [26]. This study focuses on the condenser as the subject of investigation, employing a thermodynamic mechanism analysis. The primary objective is to develop a health evaluation system comprising four distinct characteristic factors. The comprehensive evaluation of the condenser equipment’s performance can be achieved to a certain extent by considering the overall heat transfer coefficient and cleaning coefficient. Condensate subcooling degree
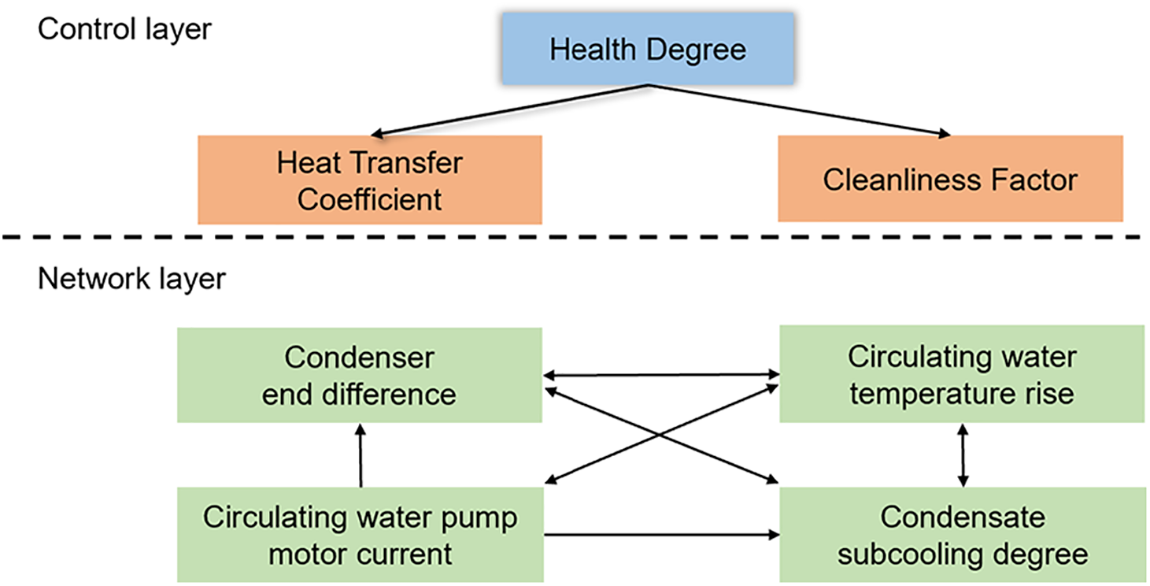
Figure 1: The hierarchical structure of analytic network process
Based on the above hierarchical structure, with the control layer as the main criterion and the four characteristic parameters in the network layer as the secondary criterion, the elements are compared in pairs to build an initial unweighted supermatrix
where the column vector of
Taking the overall heat transfer coefficient and the overall cleaning coefficient as the secondary criterion, a judgment matrix is established by pairwise comparison, and then the weight supermatrix
On the basis of formulas (3) and (5), the weighted supermatrix
Finally, the weight is obtained by calculating the limit weighted supermatrix, and the priority of the feature variable is determined:
where
2.2 Calculation of
According to the above four characteristic parameters and the data set of
The entropy value
where
Further, the weight vector calculated by the entropy weighting method is obtained as [29]:
where
2.3 Health Degree Model of Weight Fusion
To enhance the precision of assessing the health degree, the health degree model is constructed by incorporating the high-dimensional Mahalanobis distance. Additionally, a fusion weighting method is employed, which combines both subjective and objective weighting methods, to determine the weights assigned to the characteristic parameters that represent the health degree. This methodology circumvents the inherent subjectivity associated with the ANP and addresses the computational bias resulting from the limited data available in the EWM.
where
3 Combined Prediction Model Based on GC-Informer and Markov Error Correction
Various aspects in the operational environment of nuclear power plants have an impact on the operating parameters of the condenser. The equipment parameter data in this context generally follows a non-Gaussian distribution. The health degree time-series data is subject to the influence of the equipment operating environment and many characteristics, resulting in a non-Gaussian distribution. In order to further understand the deterioration trend of the condenser and improve the stability and accuracy of the health degree prediction model, aiming at the problem that the Informer model has low prediction accuracy for non-Gaussian distribution parameters, an improved combination prediction model of Informer and MEC is established. By changing model loss function and increasing the error correction amount to achieve the purpose of accurately predicting the health degree of the condenser. This model comprehensively takes into account the impact of historical running data on health status. It utilizes various time series as input variables in order to forecast the health degree of the condenser.
The GC-Informer prediction model obtains the temporal dependence of the five-dimensional feature parameter set including the historical health degree of the condenser through the encoder, and generates the health prediction result through the decoder. Considering the significance of time in health degree prediction, before inputting the model, time stamp encoding is used to encode the year, month, day, hour, minute and other information in the data to improve the predictive ability of the model in long-term series. The operation is as follows:
The encoder is mainly composed of multi-head probsparse self-attention mechanism modules and distillation modules. It takes the historical running data
Among them,
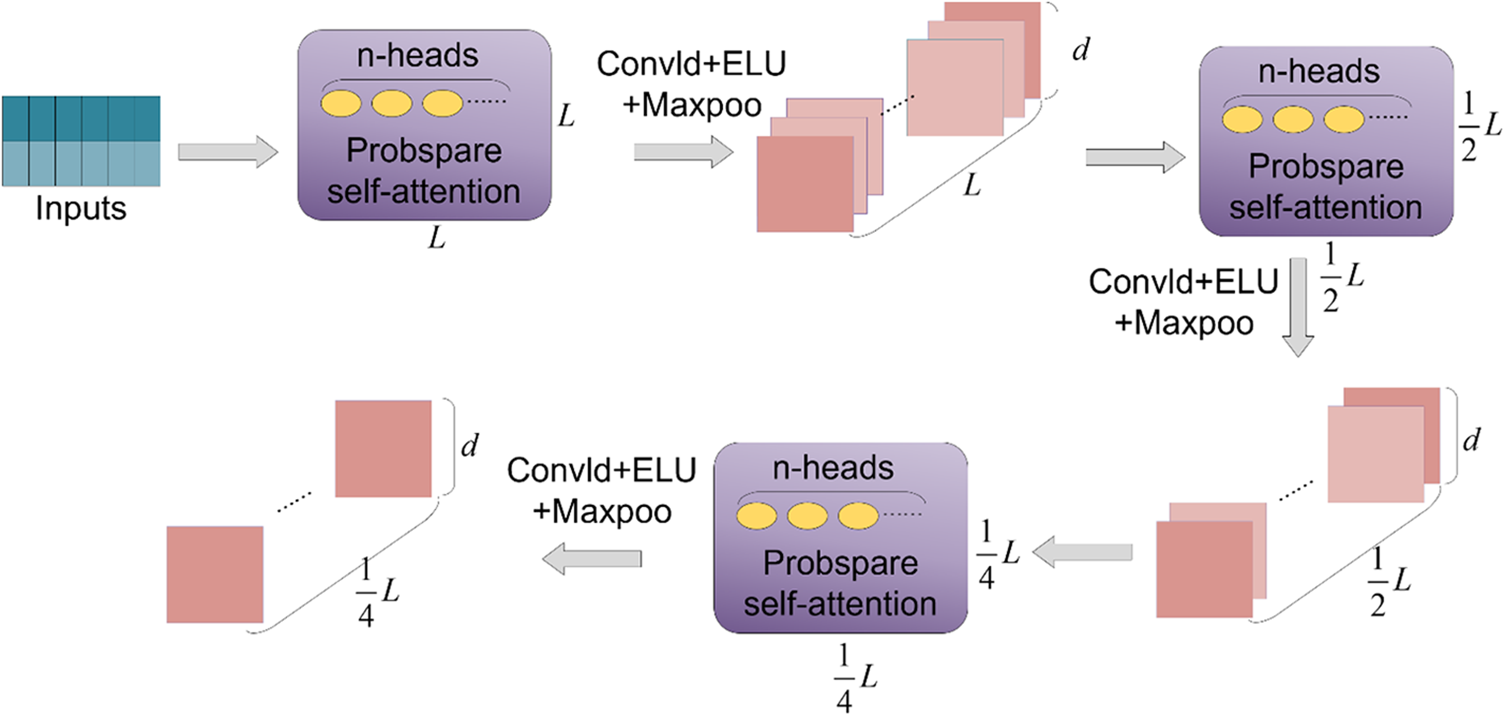
Figure 2: Encoder structure
3.1.2 Multi-Head Probsparse Self-Attention Mechanism
The self-attention mechanism assigns weight coefficients by calculating the similarity between the Query and Key [31]:
where
where
where the first term is the Log-Sum-Exp (LSE) of
The input to the decoder is a five-dimensional data sequence, including the historical health index of the condenser, along with a segment of zeros that is equal to the prediction step length. Zeros are used as placeholders for the predicted values to prevent the model from accessing future sequence information during training. The input vector is represented as shown in Eq. (19).
Within the decoder, the input time series data is first calculated by the masked multi-head probsparse self-attention mechanism module, and then the sparse self-attention operation is performed with the feature map output by the encoder. The resulting computation is then passed through a fully connected layer to obtain the prediction result
where
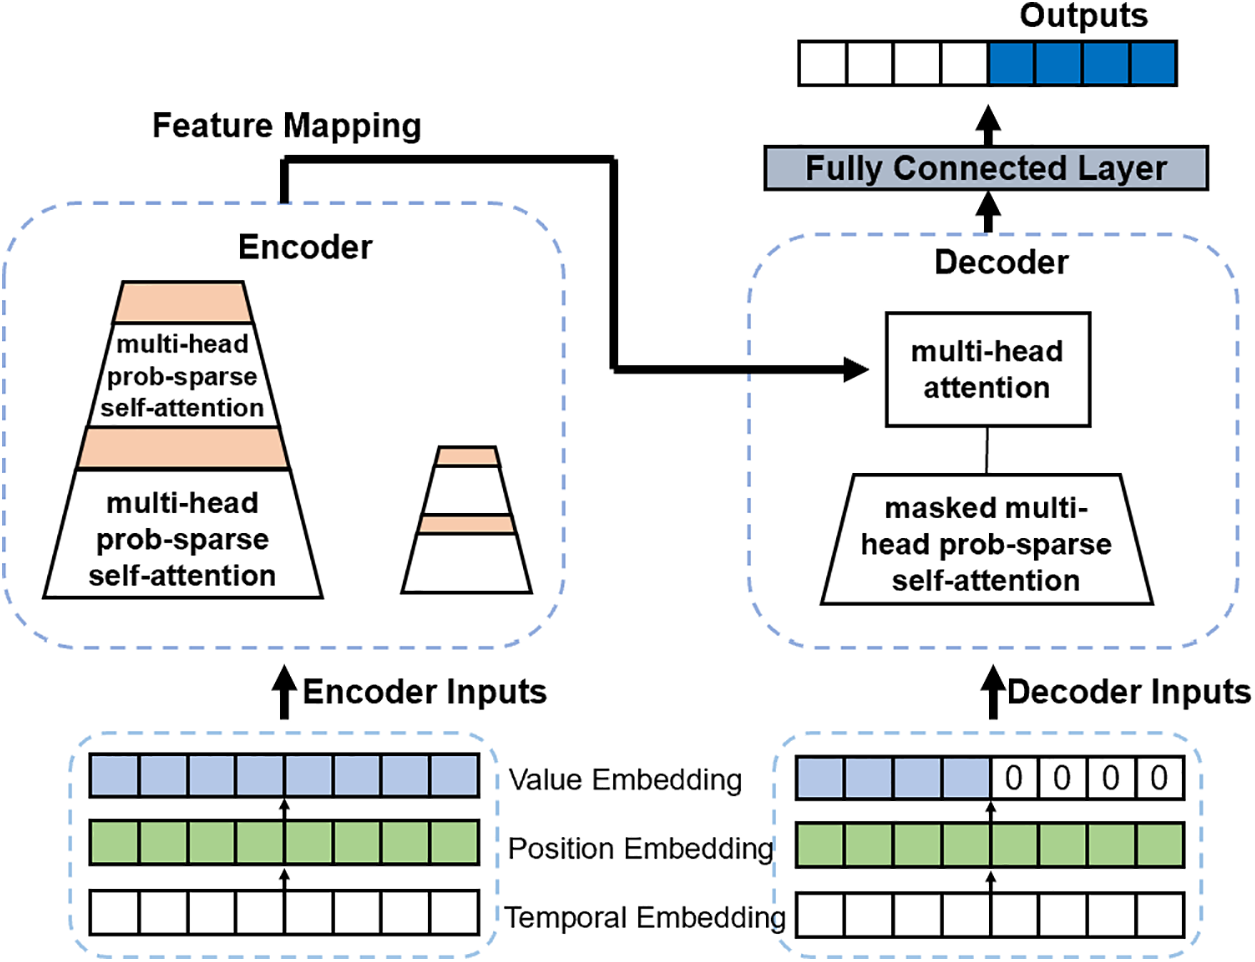
Figure 3: Informer model structure
Considering the presence of randomness in the prediction process and aiming to enhance the prediction accuracy of condenser health degree, a Markov chain is applied to partition the development pattern and potential outcomes of condenser health into different states. The transition rules between different states are studied to modify the predicted results of condenser health degree. Characterized by the transition matrix, in the process of solving the state probability, the states are divided into
where the
where
Assuming that the current state is
Finally, an error correction value
where
3.3 Establishment of GC-Informer-MEC Combined Prediction Model
Based on the above theories, this paper combines GC-Informer and MEC to establish a combined predicting model that improves Informer and Markov error correction. The input of the prediction model is
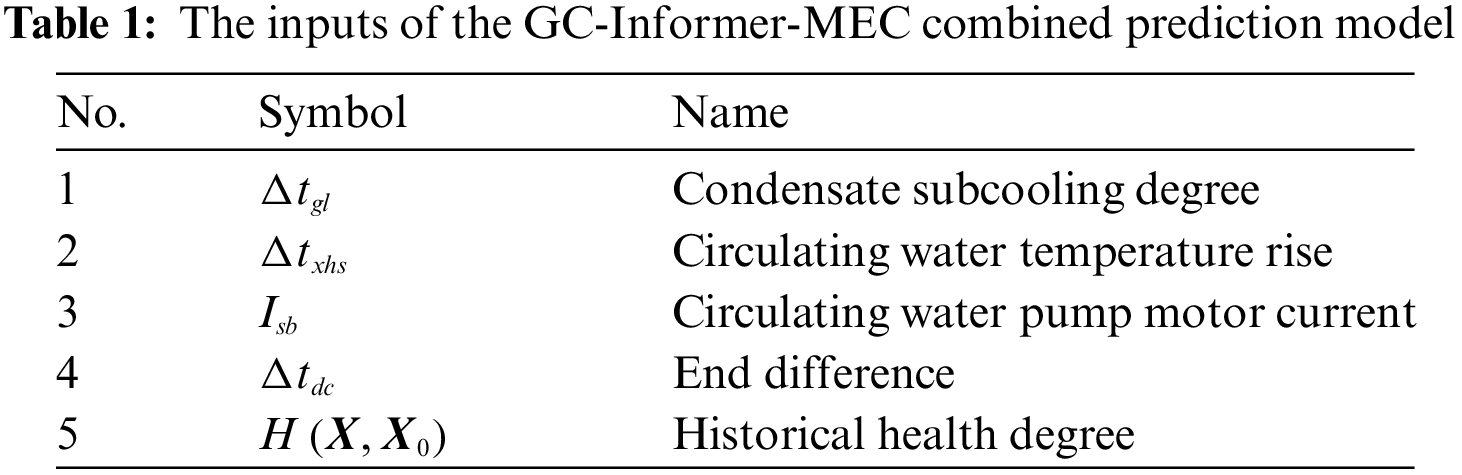
In order to enhance the reliability of predicting outcomes, the data utilised for the model is divided into three distinct sets: training datasets
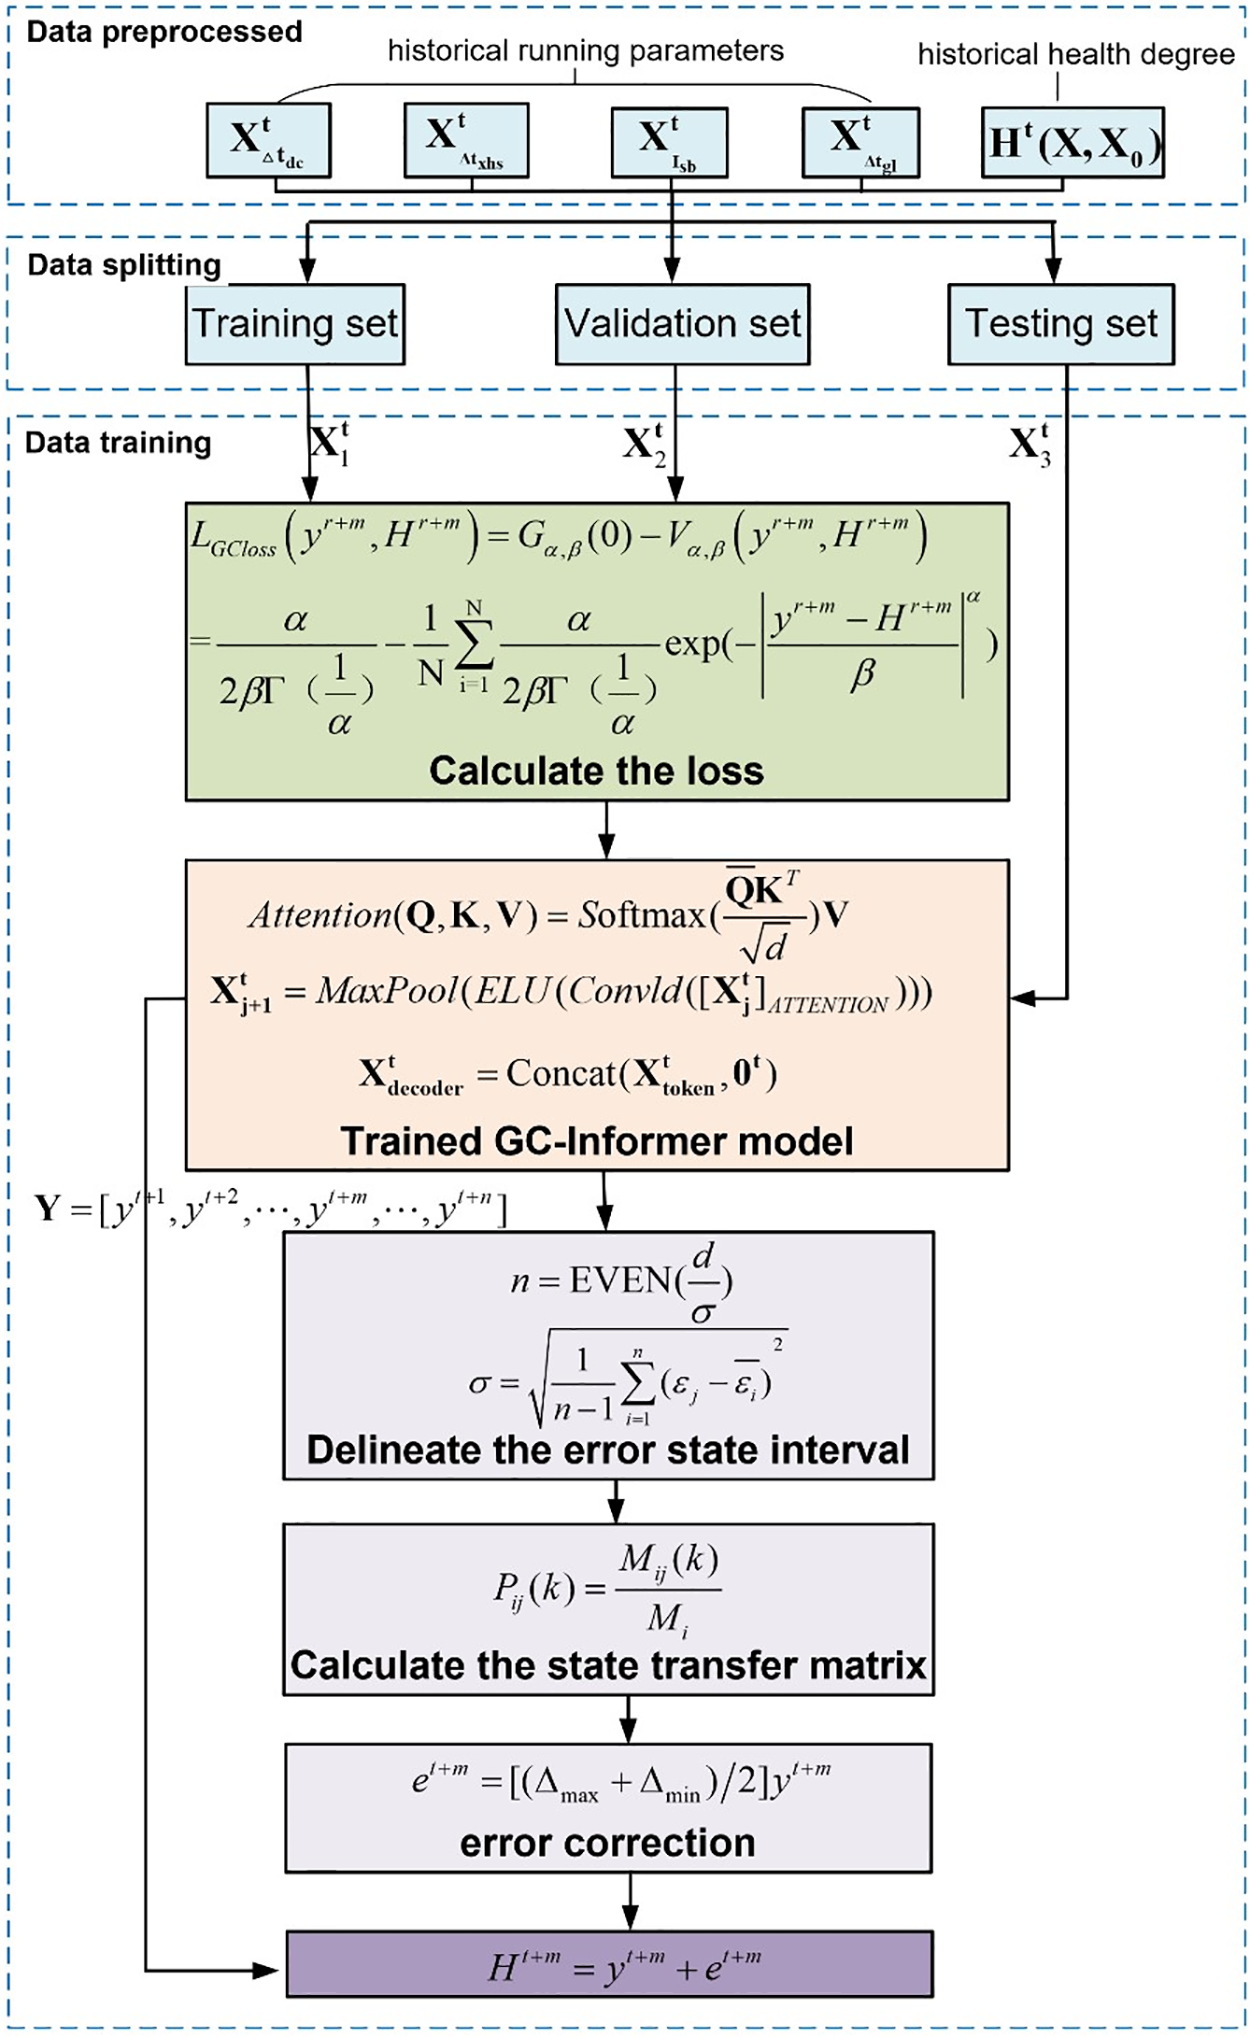
Figure 4: GC-Informer-MEC model
This paper utilizes an example dataset comprising 12,960 sets of field operation data from January to March 2022 of a domestic 1000 MW nuclear power plant unit for validation and analysis. Using four characteristic parameters
4.1 Calculation of Condenser Health Degree
Through the hierarchical analysis of the fusion health degree model, the overall heat transfer coefficient and the overall cleanliness coefficient are taken as the determining factors, and the initial unweighted supermatrix for the control layer health degree indicator is obtained as follows:
Using the overall heat transfer coefficient being superior to the overall cleanliness coefficient as a sub-criterion, the weight supermatrix is obtained as:
The weighted supermatrix
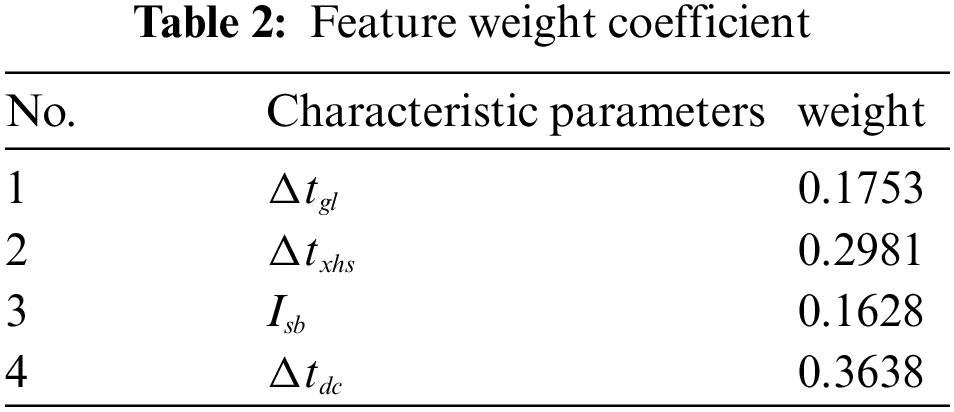
Ultimately, the weight vector of the feature parameters based on the analytic network process according to Eq. (7) is:
The weight vector
Weighting was performed using the fusion weighting method based on Eq. (11). The subjective AHP and objective EWM based weighting methods contributed to proportions
4.2 Validation of Condenser Health Degree Trend Prediction
On the basis of the fusion health degree model, the health degree of the condenser is predicted in multiple steps with 12960 sets of data in the example data set, and then the deterioration evolution trend of the condenser can be judged. Next, based on Eqs. (21) and (22), the training set data were used to partition the error state space. By considering the relative error, the error sequence was divided into four state intervals, which are defined as follows:
In order to demonstrate the improvement in the accuracy of condenser health degree prediction achieved by the multidimensional inputs GC-Informer-MEC combination prediction model proposed in this paper, predictions were made using only one-dimensional time-series data consisting of historical health information as the model input. These health prediction results were then compared with the approach presented in this paper, as depicted in Fig. 5. The image depicts three curves: green, blue, and orange. These curves correspond to the actual health degree, health degree forecasts derived from five-dimensional time-series data as input, and health degree predictions derived from one-dimensional time-series data as input, respectively. The graphic illustrates three vertical dashed lines, where the black line represents the commencement of the prediction, and the two red lines represent the anticipated condenser cleaning times for the multi-input and single-input scenarios, respectively.
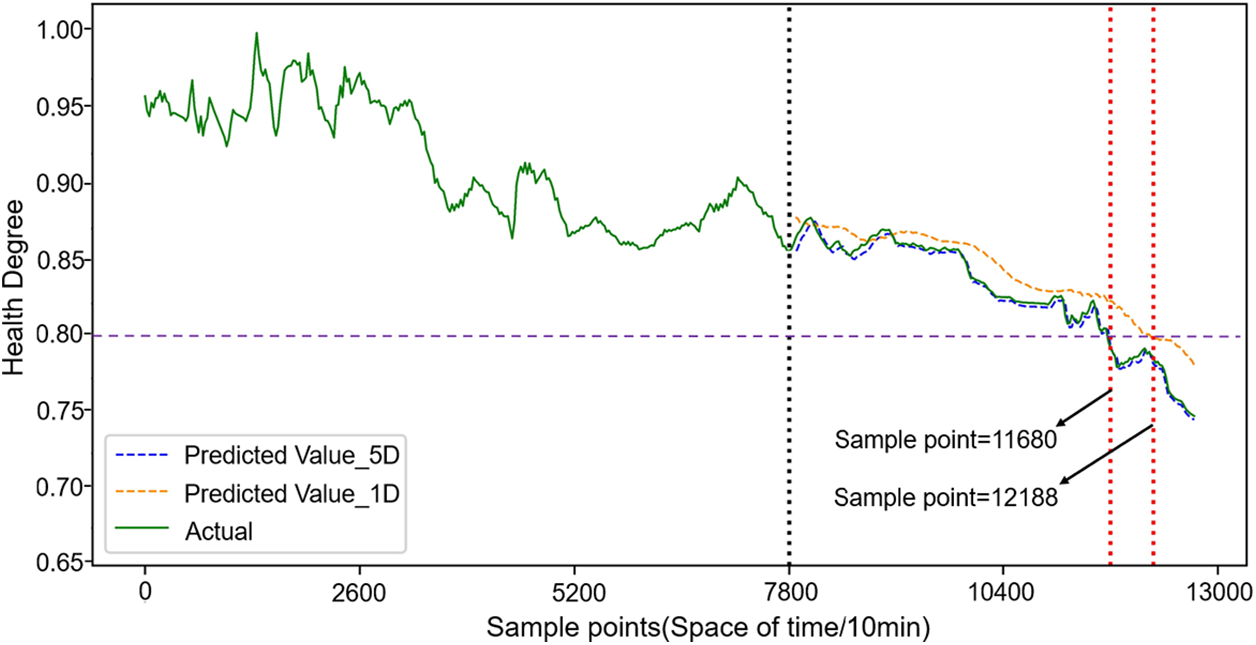
Figure 5: GC-Informer-MEC model prediction results
Upon careful examination of Fig. 5, it becomes apparent that the utilisation of both historical running parameters and historical health degree as inputs to the model regularly results in projected health degrees that closely coincide with the genuine degree. This alignment demonstrates a notable level of accuracy and few discrepancies. In contrast, employing a solitary metric of previous health degree for the purpose of predicting future health outcomes results in diminished levels of accuracy. In this study, the determination of the optimal time point for condenser cleaning is based on the application of a health degree threshold of 0.8. The single-input prediction model exhibits a delay of 508 sample points, each representing a 10-minute interval, compared to the multi-input prediction model in predicting the cleaning time point. As a result, the single-input prediction model indicates a cleaning time point that is approximately 84 h later than that of the multi-input prediction model. The delay has the potential to have a negative impact on the operational quality of the equipment, resulting in extended operation of the condenser at a reduced efficiency level. This, in turn, can lead to a decline in the economic efficiency of the secondary loop. When the condenser operates below a health degree of 0.8, performing timely cleaning can increase its efficiency by 1
When calculated at 460 RMB per metric ton of standard coal, utilizing the multi-input prediction model for timely cleaning of the condenser equipment can result in a cost saving of 123,648 RMB.
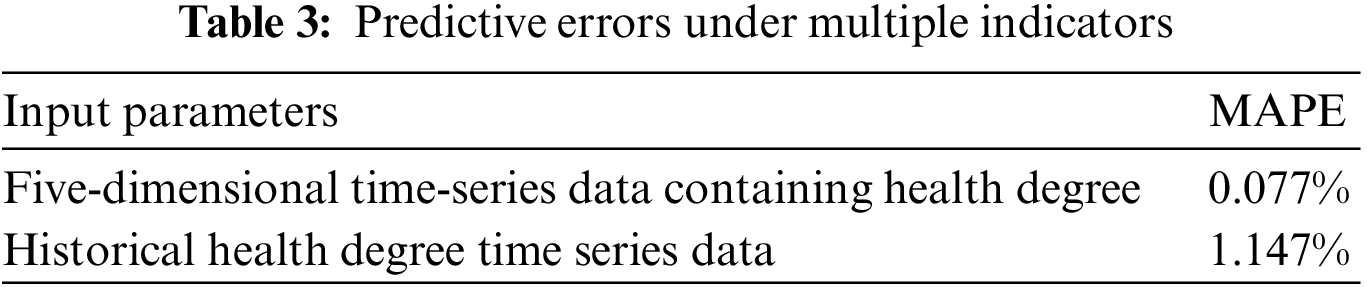
The prediction errors are presented in Table 3. The analysis table illustrates that incorporating numerous data inputs significantly improves the predictive accuracy of the model. Furthermore, it indicates that the selected historical running parameters of the condenser have a certain impact on the forecast of the health degree. When solely utilising health degree time series data as the primary input for the prediction model, there is a notable discrepancy in the projected health outcomes, despite the approximate alignment of the predicted trend with the actual health progression. This approach provides an impartial reflection of the anticipated future evolution trend of condenser equipment. The predictive model demonstrates strong performance in accurately projecting future trends for a single time-series. In situations when exactitude is not the primary concern, a solitary indicator may be employed to forecast the forthcoming condition of the apparatus. In scenarios where the precise prediction of equipment condition is of utmost importance, the construction of multi-dimensional time series allows for more accurate forecasts of the health level. This, in turn, aids operators in effectively monitoring the health status of the condenser equipment and facilitates the development of a well-informed cleaning schedule for the condenser.
In order to assess the enhanced efficacy of the GC-Informer-MEC prediction model in comparison to utilising a solitary model, three commonly applied prediction models, specifically Informer, Long Short-Term Memory (LSTM), and Deep Neural Network (DNN), were chosen as control experimental groups for the purpose of comparing their respective prediction performances. The sample data for this study consists of 12,960 sets of field operating data obtained from a 1000 MW unit of a nuclear power plant. To create a training set, the historical data from the prior 7,800 sets at the projected time were picked. The comparative analysis of the projected outcomes derived from the utilisation of multi-source time-series data is presented in Fig. 6.
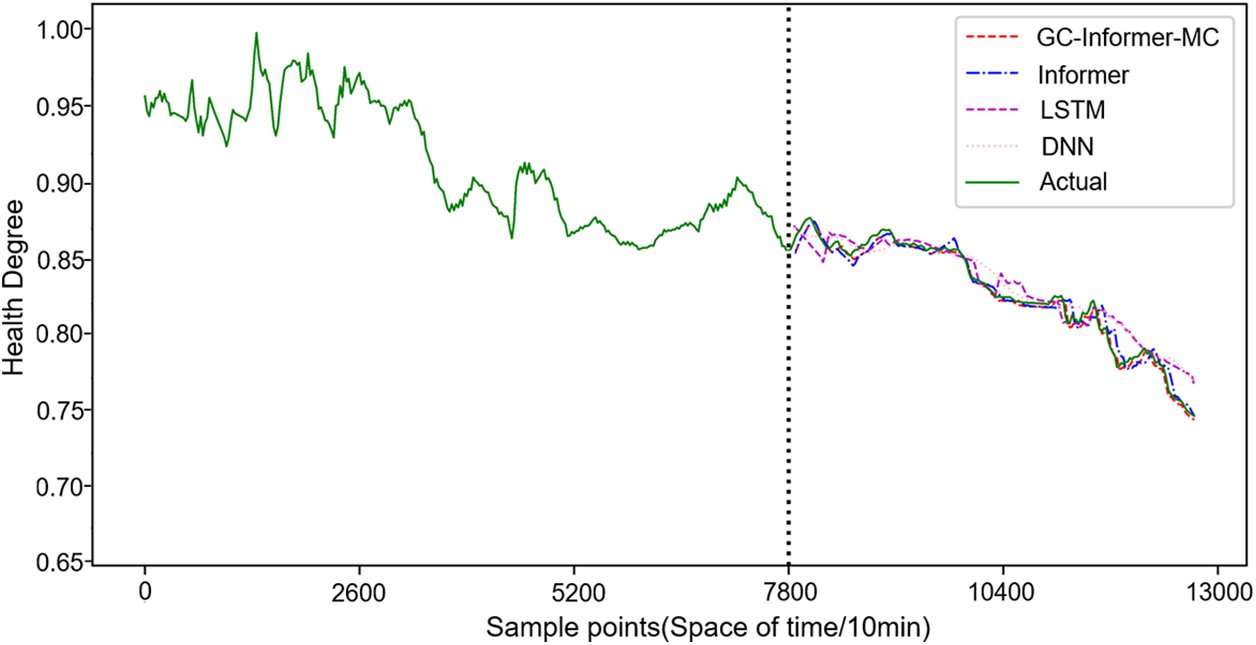
Figure 6: Comparison of prediction results of different models
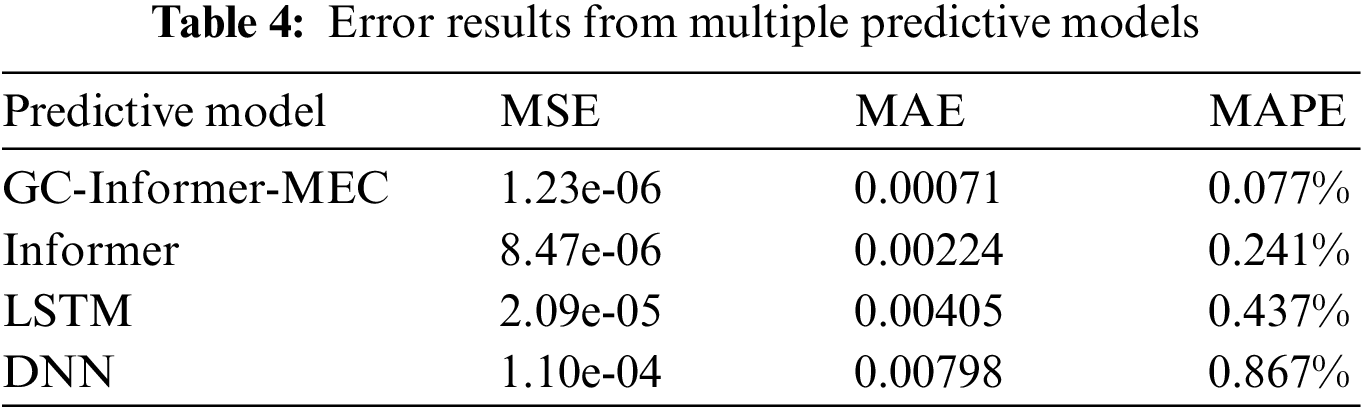
Upon examination of Fig. 6, it becomes apparent that the chosen prediction models, namely Informer, LSTM, and DNN, demonstrate differing levels of accuracy in forecasting the future trend of the health degree. These models closely align with the progression of the actual health degree. Nevertheless, the efficacy of forecasting future health outcomes varies based on the selected predictive model. The present study highlights the effectiveness and accuracy of the suggested GC-Informer-MEC combined prediction model, as evidenced by the results presented in Fig. 6. Table 4 displays the discrepancies observed in the forecast outcomes across several prediction models.
Aiming at the problem of determining the cleaning time for condensers, this paper proposes a fusion health degree model based on improved Mahalanobis distance. On the basis of the fusion health degree model, a combined prediction model based on GC-Informer-MEC is established to predict the health degree of the condenser, and then the state trend of the deterioration and evolution of the condenser can be judged. Applying the above method to an example, the following conclusions are obtained:
The improvement of the Mahalanobis distance is achieved by the utilisation of a weighting method that combines the analytic network process and the entropy weight method. This approach allows for the integration of expert knowledge and objective observations, enabling a quantitative assessment of the actual status of the condenser’s health. The GC-Informer-MC combination prediction model is constructed based on the health degree, utilising past running parameters and historical health degree data. In contrast to a single-input model, the combined model has the capability to anticipate condenser deterioration durations at 508 sample locations, hence facilitating prompt equipment cleaning and resulting in an estimated cost savings of roughly 123,648 RMB. In contrast to a singular prediction model, the utilisation of this approach yields a more refined forecast and study of the degradation pattern exhibited by the condenser. Consequently, it furnishes a more precise benchmark for ascertaining the optimal timing for equipment cleaning.
Health indicators, which are derived from the measurement of health status, are extensively utilised in various industrial processes. However, further enhancements are needed in order to get a more precise depiction of equipment status through the utilisation of health degree indicators. In our future research, we aim to improve the health degree model by employing optimisation methods. Additionally, we plan to implement online weight updates for the subjective and objective source weights, denoted as
Acknowledgement: The author greatly appreciates the editor’s encouragement and the anonymous reviewers’ suggestions to improve our paper.
Funding Statement: This work was supported by the National Natural Science Foundation of China (51906133).
Author Contributions: The authors confirm contribution to the paper as follows: study conception and design: Hong Qian; data collection: Guangji Wang, Qingyun Yan; analysis and interpretation of results: Haixin Wang; draft manuscript preparation: Haixin Wang, Hong Qian. All authors reviewed the results and approved the final version of the manuscript.
Availability of Data and Materials: The data used this study was obtained from the actual operation records of the condenser at Fangchenggang Nuclear Power Plant from January to March 2022. Due to safety and confidentiality requirements of the nuclear power plant, this data cannot be released.
Conflicts of Interest: The authors declare that they have no conflicts of interest to report regarding the present study.
References
1. Zong, L., Zhou, K., Huang, J., Si, X., Xu, Q. (2022). Numerical simulation study on flow accelerated corrosion downstream of throttle orifice plate for carbon steel feedwater pipeline of secondary circuit in a nuclear power unit. Power Equipment, 36(2), 75–82. [Google Scholar]
2. Huang, P. (2011). Self-rotating ball spraying device of rubber ball cleaning system for condenser in power plant (Master’s Thesis). Tsinghua University, Beijing, China. [Google Scholar]
3. Ma, H., Yu, S., Li, C., Zhang, Z., Feng, G. et al. (2018). Influence of rubber ball on-line cleaning device on chiller performance. Applied Thermal Engineering, 128(3), 1488–1493. [Google Scholar]
4. Zheng, M. (2018). Study on economic operation and maintenance of condensate system of pressurized-water reactor nuclear power station (Master’s Thesis). Shanghai University of Electric Power, Shanghai, China. [Google Scholar]
5. Dong, Y., Li, Y., Cao, H., He, C., Gu, Y. et al. (2013). Real-time health condition evaluation on wind turbines based on operational condition recognition. Proceedings of the CSEE, 33(11), 88–95, 15 (In Chinese). [Google Scholar]
6. Xing, X., Xu, H., Liao, M., Cao, X. (2021). Comprehensive evaluation method of distribution terminal units health status based on a cloud model and D-S evidence theory. Power System Protection and Control, 49(13), 72–81. [Google Scholar]
7. Hou, X., Dong, K. (2017). Health evaluation model of important equipments in intranet based on AHP and entropy analysis. 2nd International Conference on Mechatronics Engineering and Information Technology (ICMEIT 2017), pp. 267–270. Dalian, China, Atlantis Press. [Google Scholar]
8. Zhu, A., Zhao, Q., Gui, L., Yang, T., Yang, X. et al. (2023). Operation state of the wind turbine pitch system based on fuzzy comprehensive evaluation. Energy Engineering, 120(2), 425–444. [Google Scholar]
9. Hassan, M., Iqbal, S., Garg, H., Hassan, S. G., Yan, Y. (2023). An integrated FCEM-AHP approach for borrower’s satisfaction and perception analysis of microfinance institution. Computer Modeling in Engineering & Sciences, 134(1), 559–584. https://doi.org/10.32604/cmes.2022.021385 [Google Scholar] [CrossRef]
10. de Giorgi, M. G., Strafella, L., Menga, N., Ficarella, A. (2022). Intelligent combined neural network and kernel principal component analysis tool for engine health monitoring purposes. Aerospace, 9(3), 118. [Google Scholar]
11. Erkhembaatar, N., Bataa, O. (2019). Determining ICT indicators using entropy theory. 2019 21st International Conference on Advanced Communication Technology (ICACT), pp. 217–221. PyeongChang, Korea (South). https://doi.org/10.23919/ICACT.2019.8702010 [Google Scholar] [CrossRef]
12. Zavadskas, E. K., Podvezko, V. (2016). Integrated determination of objective criteria weights in MCDM. International Journal of Information Technology & Decision Making, 15(2), 267–283. [Google Scholar]
13. Gorgij, A. D., Kisi, O., Moghaddam, A. A., Taghipour, A. (2017). Groundwater quality ranking for drinking purposes, using the entropy method and the spatial autocorrelation index. Environmental Earth Sciences, 76(7), 269. [Google Scholar]
14. Ma, W. (2021). Research on state evaluation of power distribution equipment based on health index (Master’s Thesis). Xi’an University of Technology, Xi’an, China. [Google Scholar]
15. Alinejad, B., Fotuhi-Firuzabad, M., Parvania, M. (2011). Composite system well-being analysis using sequential monte carlo simulation and fuzzy algorithm. 7th International Conference on Electrical and Electronics Engineering (ELECO), pp. 191–195. Tehran, Iran. [Google Scholar]
16. Zhao, H., Liu, H. (2018). Fault detection of wind turbine main bear based on deep learning network. Acta Energiae Solaris Sinica, 39(3), 588–595. [Google Scholar]
17. Wang, L., Zhang, Z., Long, H., Xu, J., Liu, R. (2017). Wind turbine gearbox failure identification with deep neural networks. IEEE Transactions on Industrial Informatics, 13(3), 1360–1368. [Google Scholar]
18. Zhang, S., Lu, T., Zeng, H., Xu, C., Zhang, Z. et al. (2021). Multi-feature fusion multi-step state prediction of nuclear power sensor based on LSTM. Nuclear Power Engineering, 42(4), 208–213. [Google Scholar]
19. Babu, C. S., Rao, A. J., Srinivas, K., Narayana, S. (2021). Chronological Harris hawks-based deep LSTM classifier in wireless sensor network for aqua status prediction. Ecohydrology, 14(6), e2302. [Google Scholar]
20. Tuerxun, W., Xu, C., Guo, H., Guo, L., Zeng, N. et al. (2022). A wind power forecasting model using LSTM optimized by the modified bald eagle search algorithm. Energies, 15(6), 2031. [Google Scholar]
21. Bommidi, B. S., Kosana, V., Teeparthi, K., Madasthu, S. (2022). A hybrid approach to ultra short-term wind speed prediction using CEEMDAN and Informer. 2022 22nd National Power Systems Conference (NPSC), New Delhi, India, NPSC. [Google Scholar]
22. Li, G., Ma, P., Zhang, H., Wang, C. (2023). A method for predicting the remaining life of rolling bearings by using informer model. Mechanical Science and Technology for Aerospace Engineering, 1–8. https://doi.org/10.13433/j.cnki.1003-8728.20230117 [Google Scholar] [CrossRef]
23. Theocharides, S., Makrides, G., Livera, A., Theristis, M., Kaimakis, P. et al. (2020). Day-ahead photovoltaic power production forecasting methodology based on machine learning and statistical post-processing. Applied Energy, 268, 115023. [Google Scholar]
24. Zou, Y., Yang, D., Pan, Y. (2021). An improved grey markov chain model with ANN error correction and its application in gross domestic product forecasting. Journal of Intelligent & Fuzzy Systems, 40(6), 12371–12381. [Google Scholar]
25. Choe, J. S., Takata, K., Inoue, E., Kim, T. N., Mitsuoka, M. et al. (2017). Judging the abnormalities of agricultural machinery by using mahalanobis’ distance. Journal of the Faculty of Agriculture Kyushu University, 62(2), 469–476. [Google Scholar]
26. Moslem, S., Duleba, S. (2018). An application of analytic network process for evaluating public transport supply quality. 5th International Conference on Road and Rail Infrastructure (CETRA), pp. 1573–1578. Zadar, Croatia. [Google Scholar]
27. JB/T 3344-1993 (1993). Condenser performance test regulations. https://www.cssn.net.cn/cssn/productDetail/580a18b97a4718442376c4bfabd0bba0 [Google Scholar]
28. Ren, Z. (2020). Evaluation method of port enterprise product quality based on entropy weight TOPSIS. Journal of Coastal Research, 103(1), 766–769. [Google Scholar]
29. Qian, H., Xu, B., Zhang, J. (2022). Research on deterioration evolution trend of primary loop piping in nuclear power plant based on fusion health index. Annals of Nuclear Energy, 179, 109394. https://doi.org/10.1016/j.anucene.2022.109394 [Google Scholar] [CrossRef]
30. Liu, F., Dong, T., Liu, Y. (2022). An improved informer model for short-term load forecasting by considering periodic property of load profiles. Frontiers in Energy Research, 10, 950912. [Google Scholar]
31. Gu, J., Yang, J. (2023). Multivariate load predicion method based on sampling convolutional interaction network and improved informer. Power System & Automation, 45(2), 109–111+115. [Google Scholar]
32. Liu, J., Wu, D., Wang, Z., Jin, X., Dong, F. et al. (2020). Automatic sleep staging algorithm based on random forest and hidden markov model. Computer Modeling in Engineering & Sciences, 123(1), 401–426. https://doi.org/10.32604/cmes.2020.08731 [Google Scholar] [CrossRef]
Cite This Article
 Copyright © 2024 The Author(s). Published by Tech Science Press.
This work is licensed under a Creative Commons Attribution 4.0 International License , which permits unrestricted use, distribution, and reproduction in any medium, provided the original work is properly cited.
 Downloads
 Citation Tools