
 Submit a Paper
 Propose a Special lssue
 Open Access
ARTICLE

Impact Analysis of Microscopic Defect Types on the Macroscopic Crack Propagation in Sintered Silver Nanoparticles
1 School of Reliability and Systems Engineering, Beihang University, Beijing, 100191, China
2 School of Mechanics, Civil Engineering and Architecture, Northwestern Polytechnical University, Xi’an, 710072, China
3 China Aerospace Components Engineering Center, Beijing, 100098, China
* Corresponding Authors: Bo Wan. Email: ; Yutai Su. Email:
Computer Modeling in Engineering & Sciences 2024, 139(1), 441-458. https://doi.org/10.32604/cmes.2023.043616
Received 07 July 2023; Accepted 16 October 2023; Issue published 30 December 2023
 View Full Text
 Download PDF
Abstract
Sintered silver nanoparticles (AgNPs) are widely used in high-power electronics due to their exceptional properties. However, the material reliability is significantly affected by various microscopic defects. In this work, the three primary micro-defect types at potential stress concentrations in sintered AgNPs are identified, categorized, and quantified. Molecular dynamics (MD) simulations are employed to observe the failure evolution of different microscopic defects. The dominant mechanisms responsible for this evolution are dislocation nucleation and dislocation motion. At the same time, this paper clarifies the quantitative relationship between the tensile strain amount and the failure mechanism transitions of the three defect types by defining key strain points. The impact of defect types on the failure process is also discussed. Furthermore, traction-separation curves extracted from microscopic defect evolutions serve as a bridge to connect the macro-scale model. The validity of the crack propagation model is confirmed through tensile tests. Finally, we thoroughly analyze how micro-defect types influence macro-crack propagation and attempt to find supporting evidence from the MD model. Our findings provide a multi-perspective reference for the reliability analysis of sintered AgNPs.Keywords
Nomenclature
| Mises strain | |
| Tensile stress | |
| S | Separation displacement |
| Lcz | Cohesive zone length |
| E | Elasticity modulus |
| M | A constant |
| GIC | Critical fracture energy |
| Ti | Interface stress |
| KIC | Stress intensity factor |
| Poisson’s ratio | |
| lce | Each cohesive element size |
| Ne | Cohesive element number in a cohesive zone |
| k | Stiffness value |
| hthickness | Initial constitutive thickness of the cohesive element |
| Sdi | Damage initiation separation displacement |
| Sdf | Failure separation displacement |
| Tmax | Maximum traction stress |
Sintered silver nanoparticles (AgNPs) enable chip-to-substrate bonding through low-temperature sintering [1,2]. They are widely used in high-power electronic packaging due to their excellent thermal conductivity and mechanical properties [3,4]. Elevated temperature and pressure enhance the densification of the sintered AgNPs. However, we need to consider the impact of sintering conditions on the fragile device structure, so that the sintering conditions are reduced to allow a certain number of defects in the sintered silver layer in order to protect the chip’s integrity [5]. Despite recent advancements in sintering technology, the sintered layer will unavoidably contain various types of defects. These defects significantly impact the overall reliability [6].
Penetrating cracks in sintered AgNPs can cause the chip interconnect structure to collapse. Many studies have focused on predicting cracks through defects. Su et al. [7] characterized cavity properties in sintered AgNPs using Gaussian random fields and developed a thermal elastic-plastic phase field model to simulate defect evolution into cracks. Zhu et al. [8] analyzed how porosity affects AgNPs’ fracture behavior and demonstrated diverse crack patterns in intricate porous networks. Although the phase field method has great flexibility in describing interface evolution, the extensive list of physical parameters required are often difficult to measure or lack experimental data [9]. Li et al. [10] observed plastic deformation of the defect tip due to stress concentration. This blunting effect, while reducing stress concentration, impedes crack propagation and enhances material toughness [11]. Fracture parameters like crack tip displacement [12], J integral [13], and stress intensity factor [14] are widely used to assess crack growth based on plastic characteristics. It is important to note that the initiation and evolution of microscale defects can lead to changes in these fracture parameters. Therefore, when using these fracture parameters to analyze AgNPs’ crack growth, the influence of microscopic defects needs to be considered.
Macroscopic crack characterization in metallic materials depends on atomic arrangement and microstructure [15,16]. However, analyzing material failure behaviors at only one single scale has inherent limitations. Analyzing solely at the microscale presents temporal and computational constraints, while focusing solely on the macroscale impedes exploring failure mechanisms. This predicament has spurred the emergence of the multiscale simulation. Rudd et al. [17] categorized multiscale simulations as parallel and serial. The parallel multiscale method provides precise local details, but with substantial computational demands. The serial multiscale method has a clearly defined process that the core algorithm runs independently on different scales, but it sacrifices some details and traceability in the simulation process. Considering the computational resource consumption, the serial multiscale method is more widely adopted. For example, Xu et al. [18] transferred the physical parameters obtained from the generalized particle dynamics to the finite element model, and analyzed the interrelation between different scales in the BCC-Fe fracture process from the stress intensity factor view. Furthermore, to achieve a more comprehensive understanding of sintered AgNPs reliability, changes in their crystal structures and failure mechanisms cannot be ignored. Yao et al. [19] established nanoporous silver structures with varying pore morphologies (cube, gyroid, sphere, and spinodal decomposition) and conducted atomic-scale deformation observations based on MD. Specifically, they found that a particular structure created Lomer-Cottrell locks at dislocation junctions during uniaxial stretching. Furthermore, the impact of porosity on dislocation nucleation and tensile strength was discussed. Zhu et al. [20] compared the microstructural evolution of single-crystal and twinned nanosilver by MD simulation. Their focus was on how grain boundaries hinder crack propagation and dislocation transmission. Long et al. [21] clarified the fracture mechanism of sintered AgNPs under varying temperature and strain rate conditions by using crystal plasticity theory. They also studied how the initial crystal orientation affected the material’s plastic strain. However, current research falls short in summarizing defect types and how they influence the failure process in sintered AgNPs.
Sintered AgNPs typically exhibit a multi-defect structure with varying morphologies [3,22]. Previous studies have shown that defects can act as precursors for crack propagation [23–25]. Thus, understanding the growth, aggregation, and failure mechanisms of different microscopic defects is crucial for predicting the crack state in sintered AgNPs. This study aims to elucidate the influence of different defect types in sintered AgNPs on crack propagation and delineate the quantitative relationship between tensile strain and the transition of the failure mechanism. The impact of defect type on macroscopic crack propagation is explored using traction-separation (T-S) curves derived from the microscopic scale. The rest of this paper is organized as follows: Section 2 simulates the failure evolution and calculates energy release rates of different microscopic defect. Section 3 establishes a macroscopic crack propagation model with bridging microscopic failure information, and validates the model. Section 4 discusses the impact of microscopic defect types on macroscopic crack propagation. Section 5 gives an outlook. Section 6 provides a summary of the paper.
2 Failure Evolution Process and Energy Release Rate Calculation of Microscopic Defects
2.1 Identification, Classification, and Quantification of Microscopic Defects
The AgNPs specimen is sintered at 250°C for 2 h without pressure. Details of the sintering process are available in Section 3. Microscopic morphology of sintered AgNPs is captured using a Hitachi SU8000 scanning electron microscope (SEM). The image undergoes pre-processing, including noise reduction and binarization. Subsequently, defect edges are extracted using an 8-neighborhood edge detection algorithm [26]. Identify and classify the morphology of microdefects where stress concentration may occur, which are rectangular, arc and triangle defects, as shown in Fig. 1.
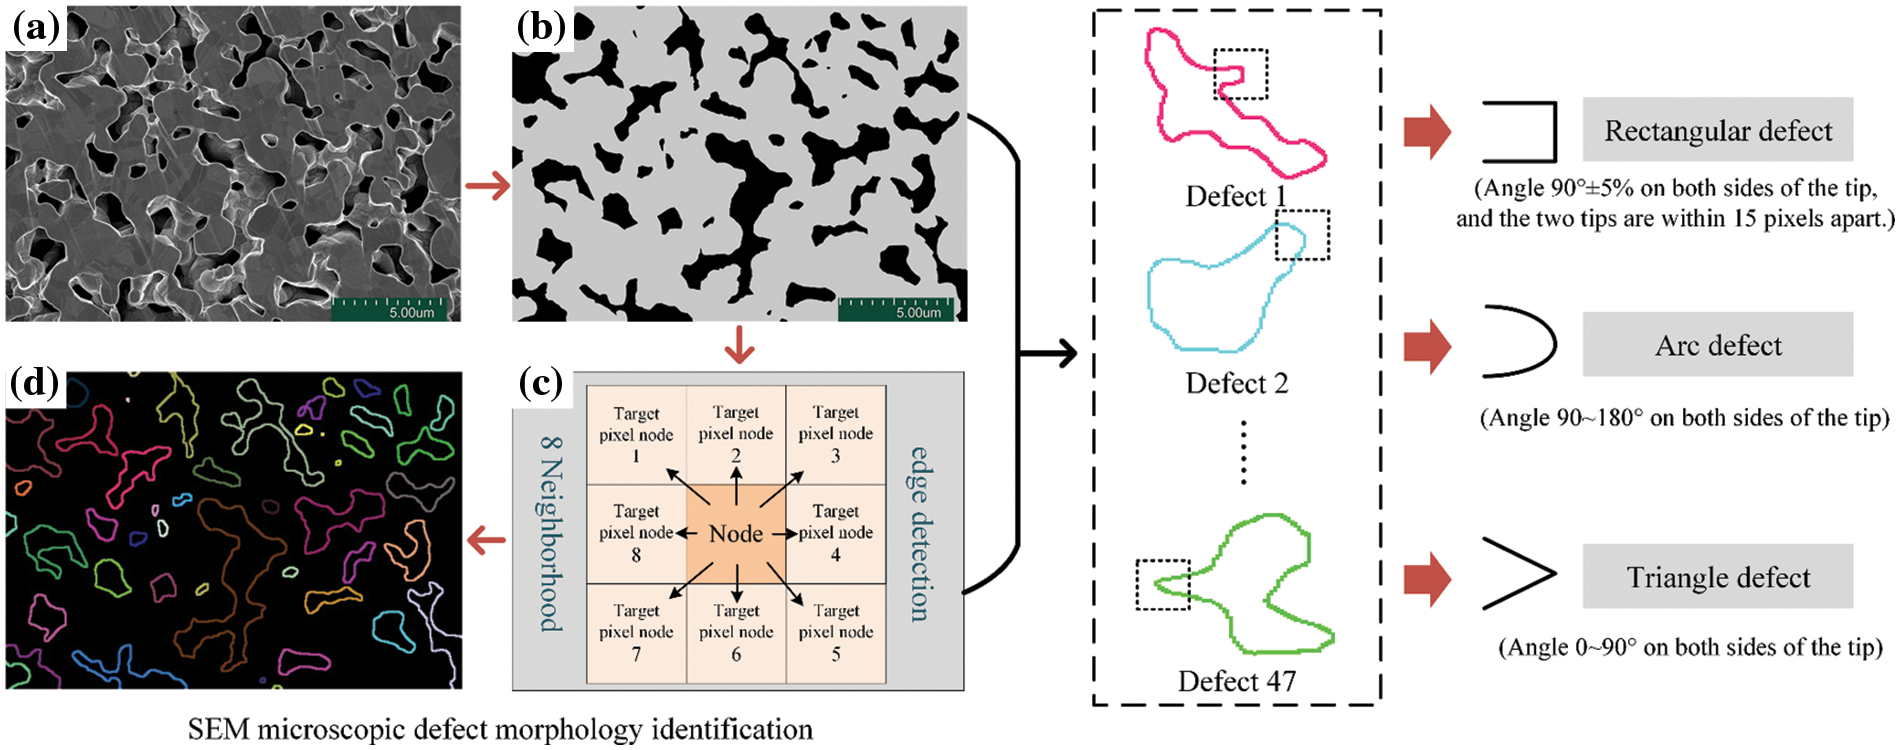
Figure 1: Defect types identification and classification of sintered AgNPs. (a) Cross-sectional SEM image; (b) pre-processed images; (c) principle of the 8-neighborhood edge detection algorithm; (d) defect morphology identification
Defect quantification is performed on SEM images from five different locations in the sintered AgNPs specimen, as shown in Fig. 2. Arc defects constitute the primary defect type, comprising an average proportion of almost 60%. Moreover, only a small number of rectangular defects are observed.
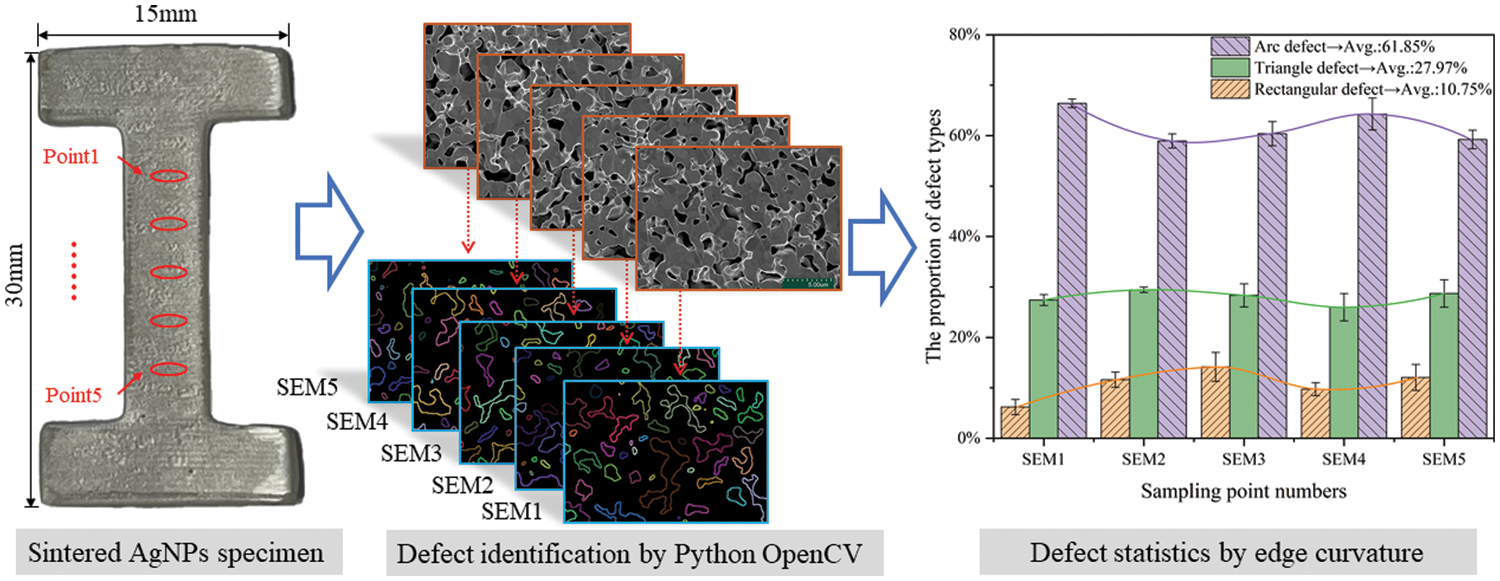
Figure 2: Quantification of defect characteristics of sintered AgNPs specimen
2.2 Microscopic Molecular Dynamics Modeling
The sintered AgNPs MD models with different defects on the one side are developed using LAMMPS software, as shown in Fig. 3. In a small local area, the simultaneous existence of multiple defects is not considered and sintered AgNPs remain as face-centered cubic (FCC) structure. Most prior studies have adopted a similar approach [18,27,28]. MD simulation accuracy relies on selecting the appropriate interatomic potential function. Forces between silver atoms are described using the embedded atom method (EAM) metal potential function by Williams et al. [29]. The validity of this potential function has been confirmed [30–32]. The lattice constant of AgNPs is a = 4.09 Å. The model size is 80a × 60a × 10a. The crystal directions [100], [010], [001] correspond to the three axes (x, y, z axes) of the cartesian coordinate system. A preset defect with dimensions of 6a × 2a × 10a is inserted at the left center of the MD model. In order to analyze the behavior of different defects during stress loading, 21 subregions have been uniformly separated along the X-axis in the direction of the defect tip [18]. Furthermore, each subregion is subdivided into upper and lower sections along the centerline, enabling the extraction of separation displacements and traction stress on both sides of the defect.
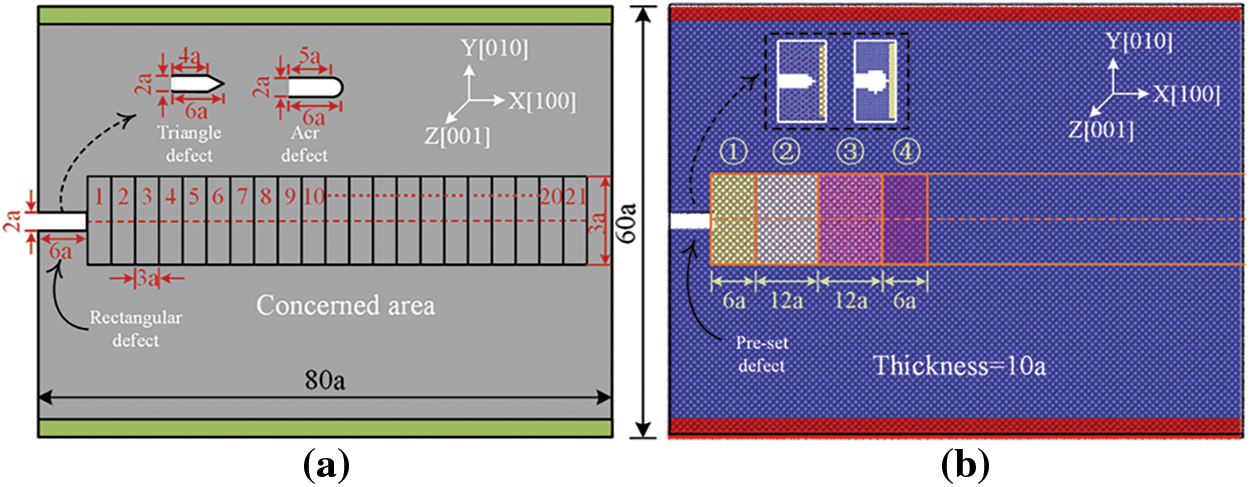
Figure 3: Sintered AgNPs model with preset defects (a) schematic model (b) MD model
Periodic boundary conditions are used in the initial MD simulation. System Equilibrium is achieved using energy minimization method. Then, the ambient temperature is set to 300 K, and the time step is 0.001 ps. The system relaxes for 20 ps at canonical ensemble (NVT) and 20 ps at Nose-Hoover isobaric-isothermal ensemble (NPT) with 0 Gpa. Before starting uniaxial stretching, the stretching Y-direction is set to a non-periodic boundary condition to avoid the thickness effect [33]. The upper and lower edge atoms are respectively fixed, and both ends are stretched simultaneously at a rate of 0.1 Å/ps in NVT. This stretch rate is commonly used in MD [18,34]. The loading time is 500 ps with the 0.001 ps time step. At the same time, the model information is output every 250 steps, including atomic coordinates, atomic stress, system temperature, system energy, and other parameters. The open-source software open visualization tool (OVITO) is used to visualize and analyze microscopic simulation results [35].
2.3 Evolution Process and Failure Mechanism Analysis
During the stretching process, the strain components in all six directions of the atom are outputted. The Mises strain is calculated using Eq. (1).
where
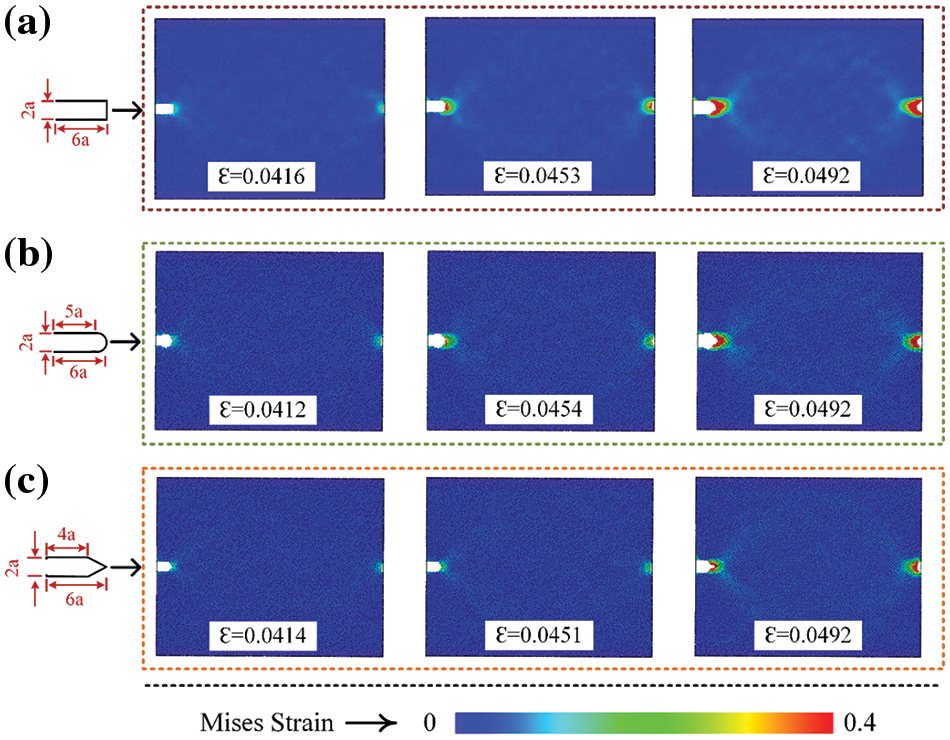
Figure 4: Atomic mises strains of three defects at the beginning of stretching. (a) Pre-rectangular defect (b) pre-arc defect (c) pre-triangle defect
Figs. 5–7 illustrate the failure evolution and crystal structure changes for three defect types. The formation and vanishing of stacking faults (SF) can be indicated by changes in the number of HCP atoms (red line) in FCC metals [34]. Initially, the crystal structure is dominated by FCC. The defect front continuously emits dislocations during stretching, leading to some extent passivation of nearby atoms (represented by white atoms in the structure). This leads to stress concentration at the defect tip. Not only slip bands and passivation atoms can be clearly visible, but also dislocations and dislocation loops appear near the defects. This deformation mechanism reduces excessive stress concentration in the system. Furthermore, the continuous emission of dislocations leads to the formation of SFs [36], which are closely stacked HCP layer structures. At other strain rates, extrinsic stacking faults (ESF) appear as two HCP layer structures intercalated with FCC layers. More ESFs are observed in Figs. 5–7e and 7f due to the effect of continuous tensile loading, which means that triangle and arc defects will fail completely faster.
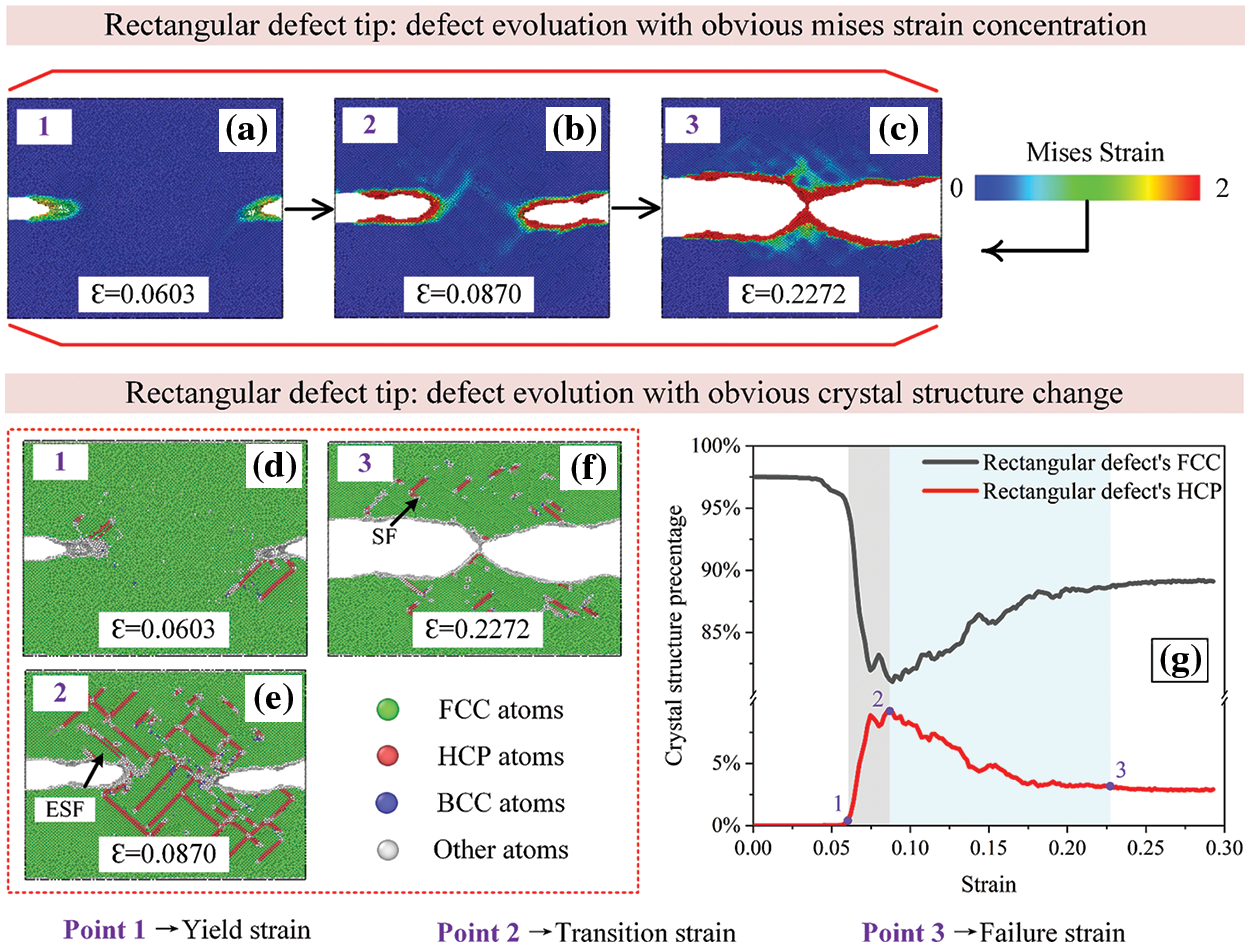
Figure 5: Failure evolution process and crystal structure changes in the rectangular defect
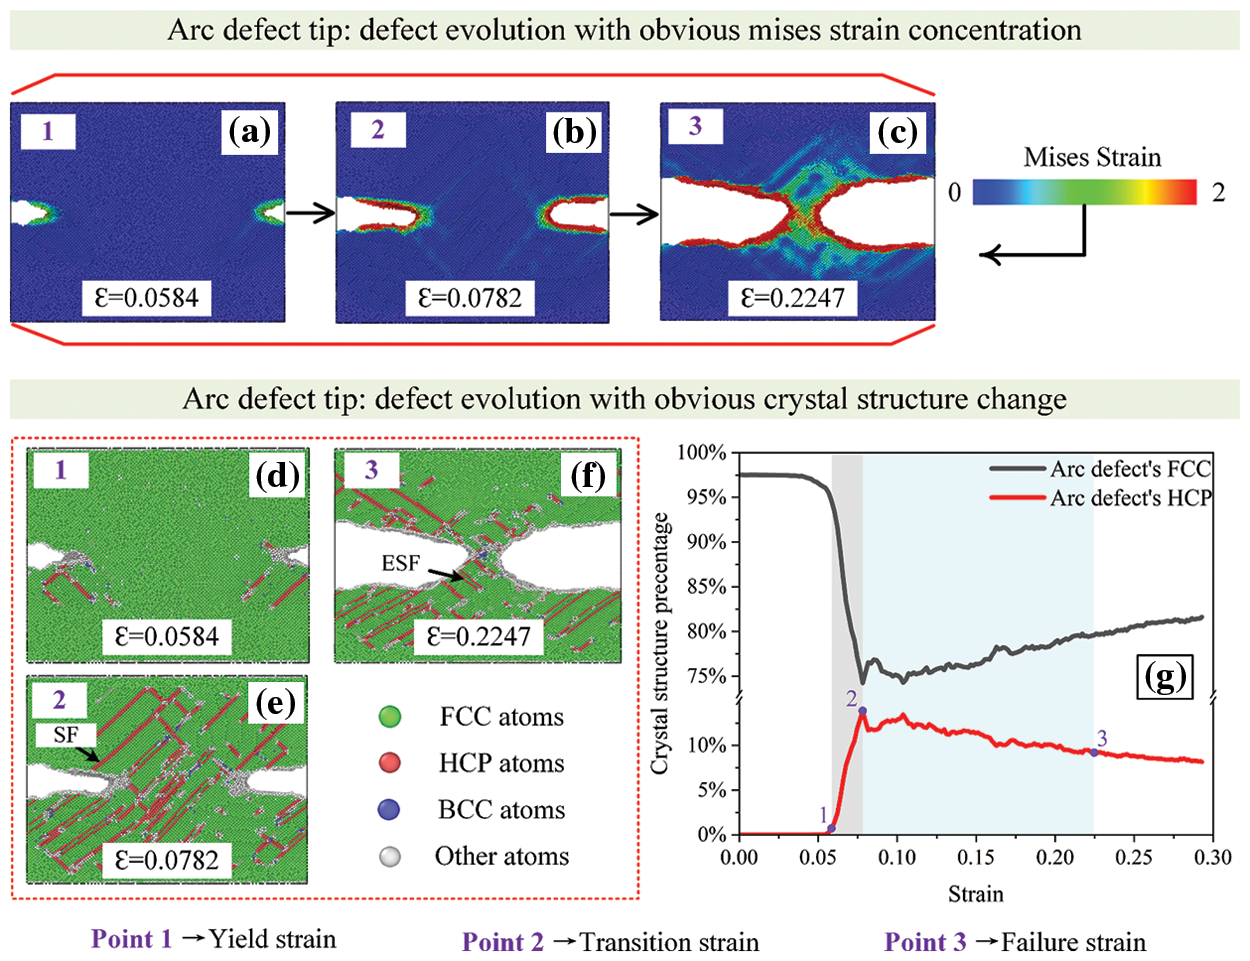
Figure 6: Failure evolution process and crystal structure changes in the arc defect
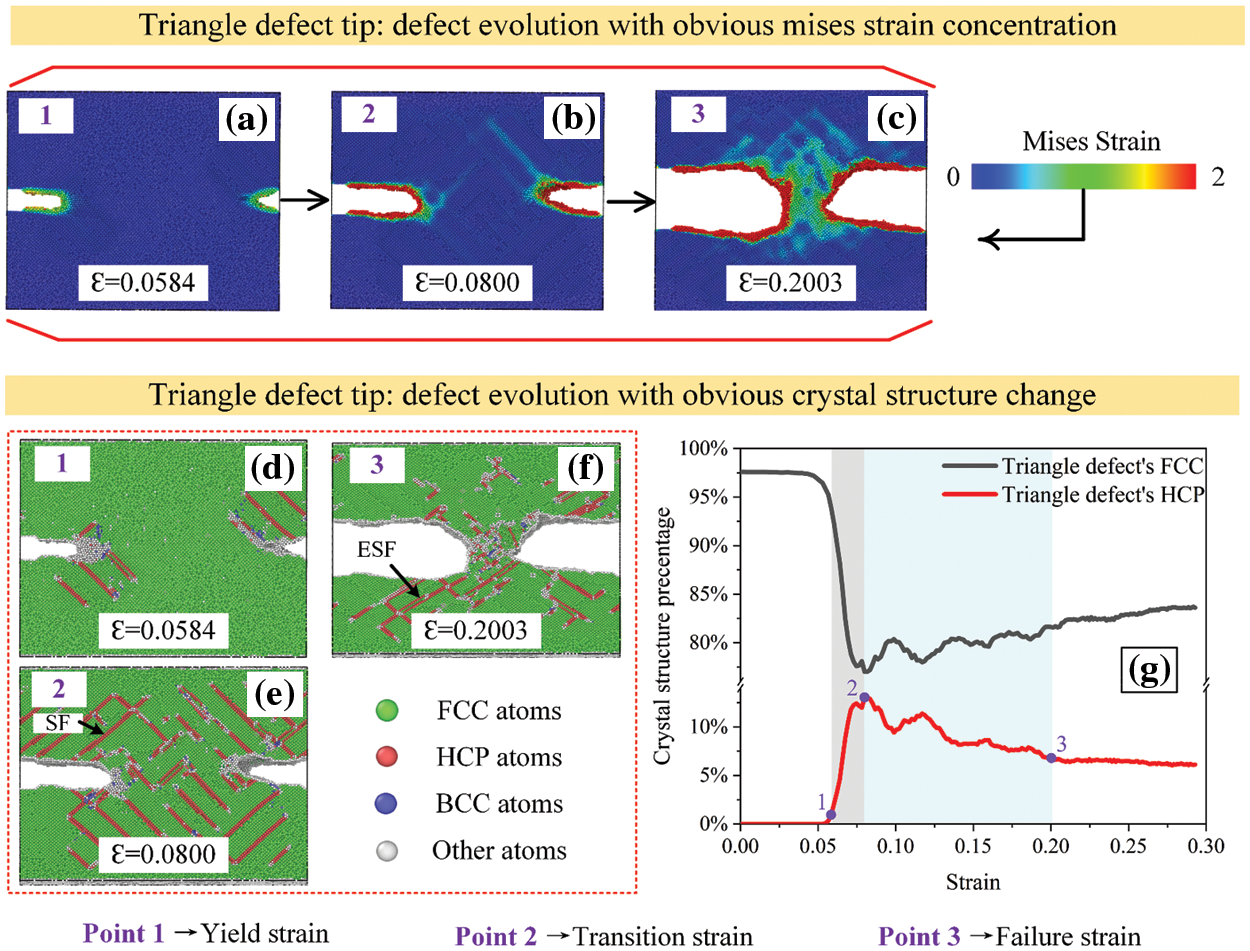
Figure 7: Failure evolution process and crystal structure changes in the triangle defect
After analyzing the crystal structure percentage curve and the atomic crystal structure diagram at different stages, we find that the plastic deformation process dominated by dislocation nucleation mainly occurred in Figs. 5–7g’s gray area before reaching the peak of the HCP curve. At the same time, the cyan area represents the rapid necking process dominated by dislocation movement. Therefore, we can use the strain amount at each stage to represent the transition of the tensile failure mechanism and the change of the tensile failure process. The yield strain (point 1, corresponding to the elastic limit) is defined as the point in Figs. 5–7g rising stage where the elastic deformation is roughly 0%–2% [37]. The transition strain (point 2, corresponding to the failure mechanism from dislocation nucleation to dislocation motion) is defined as the curve’s peak point. The position where the fluctuation of the HCP crystal structure is less than 10% is defined as the failure strain (point 3, corresponding to a complete failure). By comparing the relationship between the defect types and the three strain points, we note that the defect type has less influence on the yield strain but more on the transition strain. The stress-concentrated triangle defect reaches the transition strain more quickly and thus turns to the rapid necking stage. It indicates that the initial defect morphology can either accelerate or decelerate the failure process. The rectangular defects generated fewer dislocation nucleations, reducing the likelihood of dislocation movement and causing a delay in reaching the failure strain. As a result, rectangular defects had a larger failure strain compared to arc and triangle defects.
Besides crystal structure analysis, we integrate subregions to avoid size effects [38] and extract the mechanical information from the defect evolution area. Displacements of upper and lower subregions are separately computed and summed to obtain the separation S. The average atomic stress in the subregion is designated as traction stress T. Fig. 8 shows the calculation results of the four subregions. Fluctuations in the T-S curve signify resistance changes during defect evolution, which is related to dislocation nucleation and movement. Since defects are preset in perfect crystals, the initial evolution process is very smooth. The purple curve displays pronounced fluctuations in the middle and late stages of stretching, suggesting increased dislocation activity, faster approach to the failure strain point, and noticeable necking. This aligns with our earlier analysis of triangle defect failure characteristics.
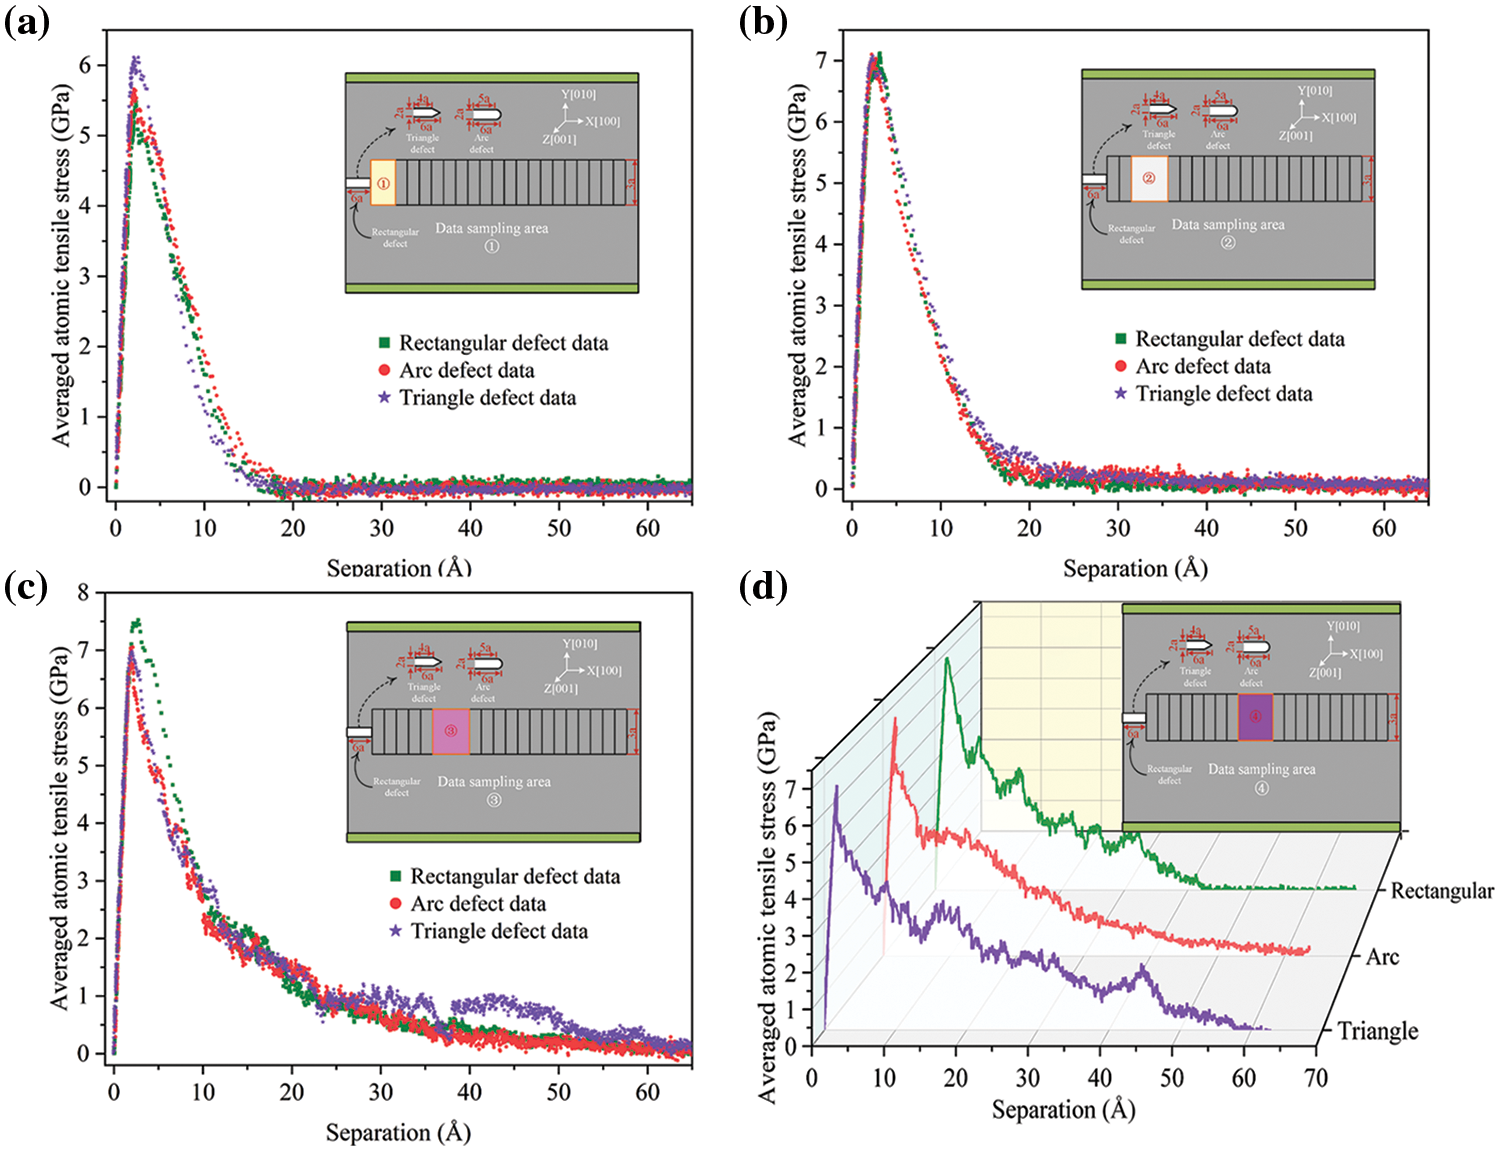
Figure 8: Traction (averaged atomic tensile stress) and separation on the defect evolution path
2.4 Energy Release Rate Calculation of Microscopic Defects
In general, the main crystal structure of the sintered AgNPs is still FCC and contains a certain number of dislocations [38,39]. The number of dislocations generated by the model with preset defects in the early and end stages of stretching is different from the actual situation, which leads to differences in the resistance of defect evolution. So, we consider subdomain region 3 in the mid-stretching stage to be the stable evolution area. To avoid the accumulation of atomic stress in the fractured region affecting the defect evolution region, the data with a separation displacement within 6a (3 times the preset defect width) are selected for subsequent analysis. The area beneath the T-S curve represents the energy release rate, also referred to as fracture energy. This is Griffith’s theory [40], which represents the energy required for the crack to begin propagating instability [41,42]. Therefore, Eq. (2) proposed by Needleman [43] is used to fit T-S curves corresponding to different defect types, and calculate the energy release rate, as shown in Fig. 9.
where T(S) is traction stress (unit: GPa), S is the separation displacement (unit: Å), a and b are coefficients.
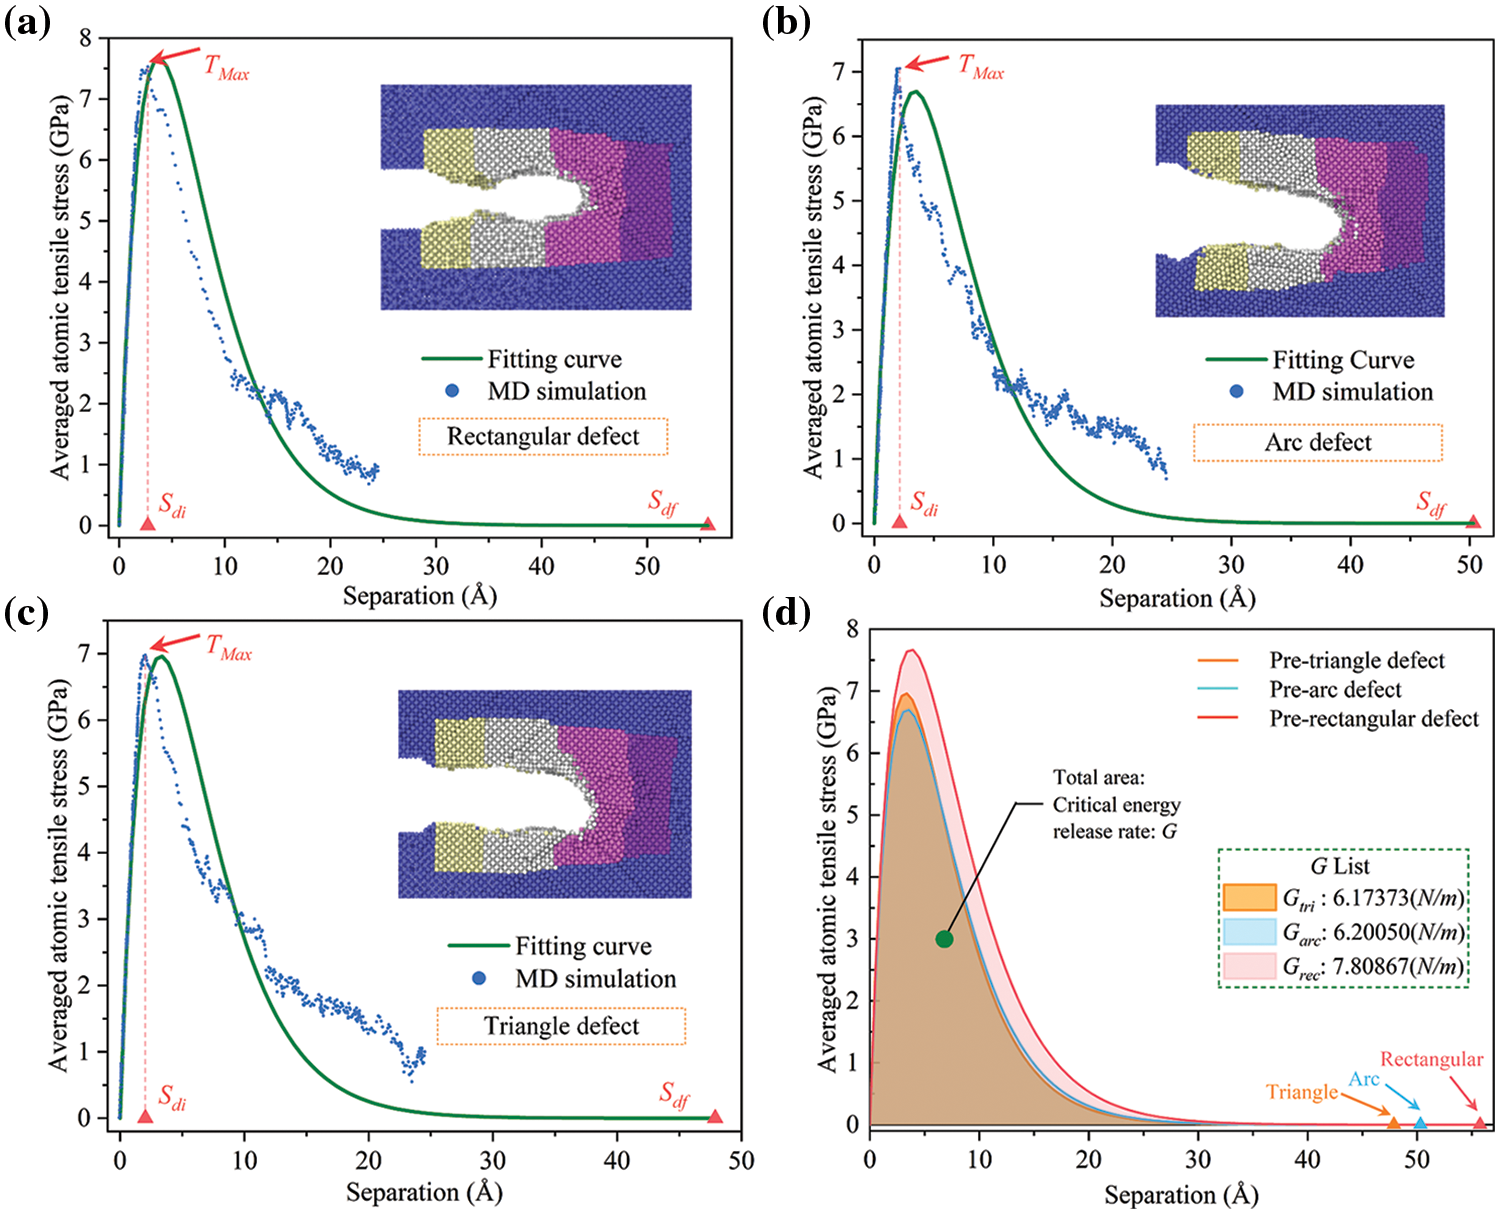
Figure 9: T-S curve fitting results and energy release rate of three defects (a) rectangular defect (b) arc defect (c) triangle defect (d) critical energy release rate
The calculation results of the energy release rate about the triangle and arc defects are very close. On the contrary, the rectangular defect has a higher yield strength and energy release rate due to the scattered stress distribution at the front end and the formation of fewer dislocations. This aligns with the pattern of failure characteristics observed in Section 2.3 for rectangular defects.
3 Macroscopic Crack Propagation Model of Sintered AgNPs with Bridging Micro-Failure Information
3.1 Bridging Micro-Failure Information for Cohesive Elements
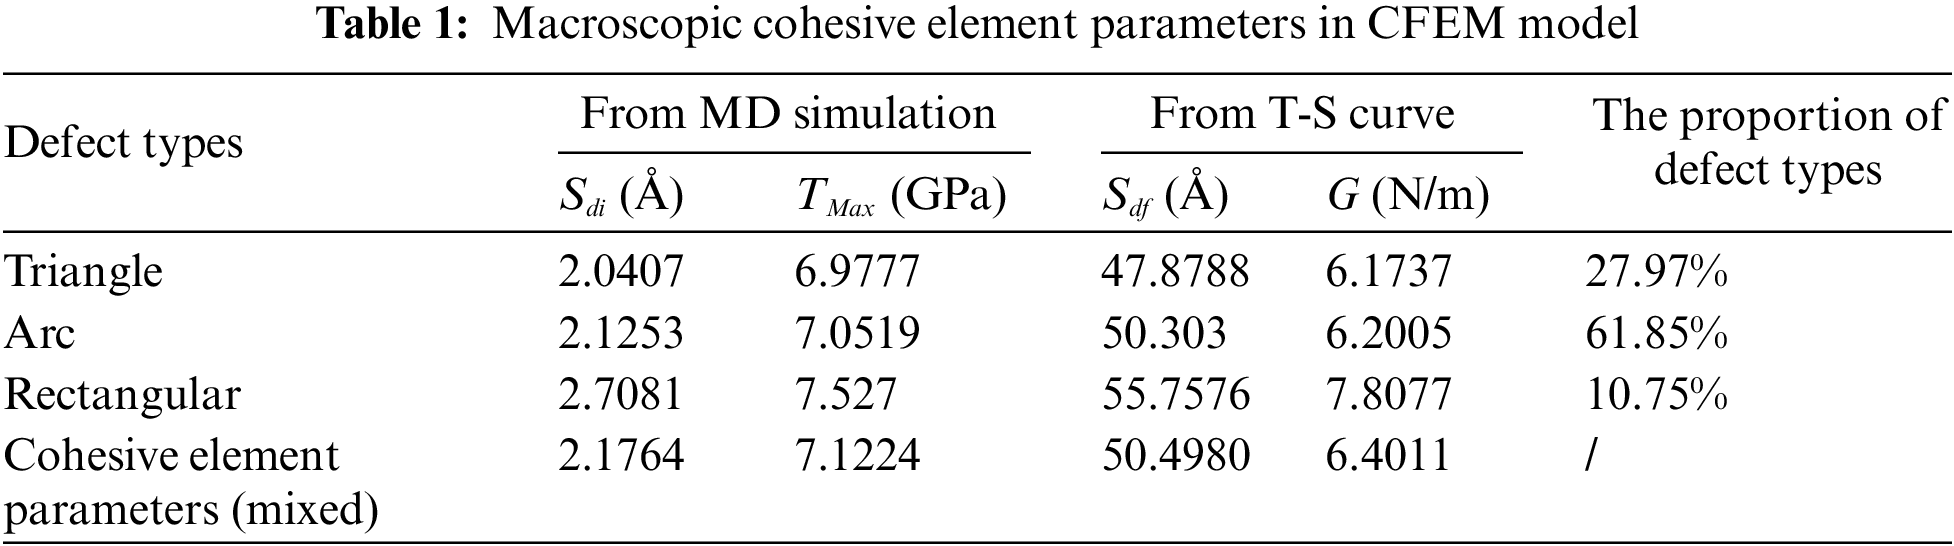
We analyzed microscale defect evolution and gathered valuable characteristic information on their paths. Excitingly, the common cohesive theory simulating cracks is based on interface degradation. The cohesive constitutive model is also described by the T-S curve. So, the T-S curve successfully establishes the coupling link between the microscopic MD and the macroscopic cohesive finite element method (CFEM). The failure behaviors of different defects in sintered AgNPs can be distinguished by T-S curves and transferred between scales. Generally, cohesive elements within a macroscopic finite element model correspond to the combined effects of multiple microscopic defects. The combined effect is simplified as a weighted sum of independent defect contributions in this paper. So, Parameters of macroscopic cohesive elements are calculated based on the three defects’ percentage from Fig. 2 and shown in Table 1. This approach approximates complex defects in the actual sintered structure by mixing different types of micro failure information in proportion. In addition, the cohesive element parameters corresponding to the three defect types can also be used independently to analyze the effect of a single type on the macroscopic crack propagation.
3.2 Establish Macroscopic CFEM Model
The macroscopic CFEM model built in ABAQUS is based on the sintering and tensile tests that have been carried out. For sintering, the workbench is initially covered with a high-temperature protective film to aid demolding after the process. Then, inject the AgNPs solder paste into the automatic dispensing machine to produce the I-shape sample. Finally, the sample is placed in a 250°C pressureless environment within a high-temperature box for 2 h to obtain a sintered AgNPs specimen, as shown in Fig. 10a. A 1 mm notch is pre-set to facilitate breaking the specimen from the middle, which is a common treatment for tensile tests.
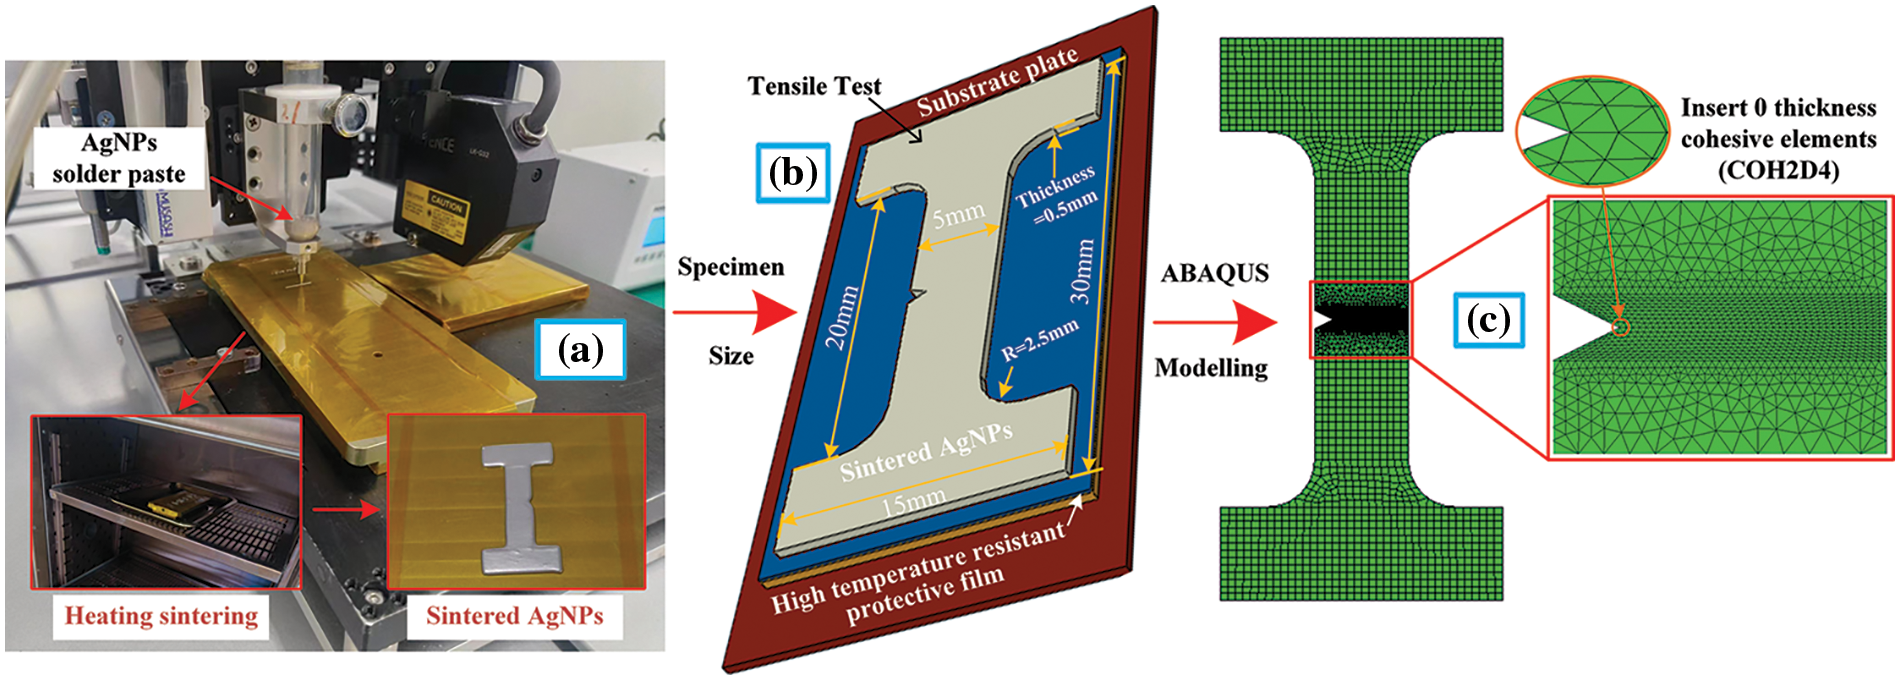
Figure 10: Sintered AgNPs specimen (a) preparation process (with a 1 mm notch) (b) size information (c) CFEM mesh information
The model size is 15 mm × 30 mm × 0.5 mm and contains 0 thickness cohesive elements, as shown in Fig. 10. Generally, cohesive element size should not surpass the cohesive zone. Accuracy and convergence can be ensured when 3 to 5 cohesive elements are present in the cohesive zone [18]. The formula for calculating the cohesive zone length is shown in Eq. (3).
where M is a constant usually taken as 1, E is the elasticity modulus, Ti is the interface stress, GIC is the material interface critical fracture energy. Under the assumption that the material is linear elastic, there is a relationship between the fracture energy and the stress intensity factor KIC in Eq. (4).
The maximum interface traction stress corresponding to the mixed defect is Ti = 7.1224 GPa from Table 1. The stress intensity factor KIC of bulk Ag ranges from
where lce is each cohesive element size, Ne = 3 is the cohesive element number in a cohesive zone.
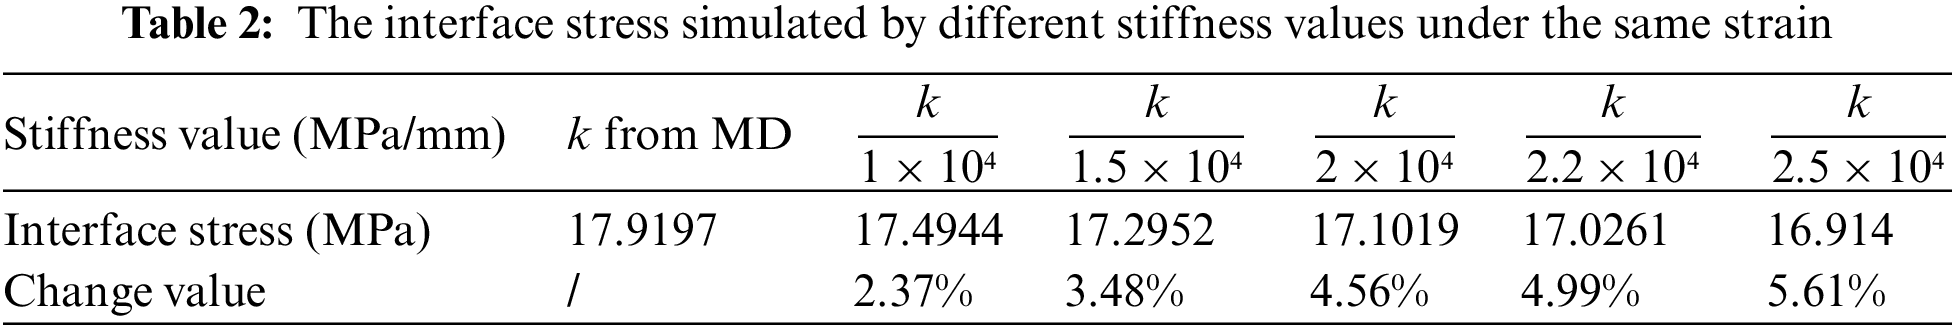
The cohesive element parameters in ABAQUS are determined by the T-S curve from MD simulation, and the element stiffness is calculated by Eq. (6). The initial stiffness is set to a large value to ensure the ideal cohesive fracture behavior and preserve the integrity of the cohesive element mesh before failure. However, this extremely large value can impede computational convergence in actual simulations. For this case, a stiffness value near the threshold value is generally set to ensure the calculation’s stability. Table 2 compares interface stresses simulated with different stiffness values. We opt for a stiffness value with approximately a 5% change for subsequent simulations. The maximum nominal stress criterion is selected as the cohesive element failure criterion. Energy damage evolution characterizes damage in terms of the energy release rate required for failure after damage initiation. The viscosity coefficient is set to 1 × 10⁻⁵ for the CFEM stabilization requirement. Outside the cohesive zone, material parameters are elastic modulus E = 40 GPa and Poisson’s ratio v = 0.25 [45].
where k is the stiffness value in CFEM, hthickness is the user-specified initial constitutive thickness of the cohesive element (typically specified as 1.0).
3.3 Model Validity Verification
The numerical simulation adopts a strain rate of 0.01% consistent with the tensile test. The crack propagation of sintered AgNPs specimen is shown in Fig. 11. The cohesive element failure is a transient process during stretching. Damage accumulation begins once the load reaches the crack initiation criterion, and the cohesive element’s state is marked as 0 (delete mesh) when the stiffness degradation of the crack tip reaches 1. Multiple crack initiation locations are observed in the CFEM model. Stress propagation along the cohesive element can lead to crack bifurcation due to imbalanced cohesive element stresses on both sides of a mesh unit. The crack bifurcation destroys the butterfly-shaped stress distribution, accelerating the generation of irregular cracks. Crack bifurcation and irregular crack patterns observed in SEM analysis support these findings [19,46]. Stress–strain curves during the stretching process are extracted and compared with the tensile test, as shown in Fig. 12. The simulation results are close to the experimental results. Thus, the authors consider the macroscopic crack propagation model with bridging microscopic failure information is valid. The microscopic failure characteristics of defects can be captured by cohesive constitutive parameters, which in turn impact the macroscopic tensile fracture model.
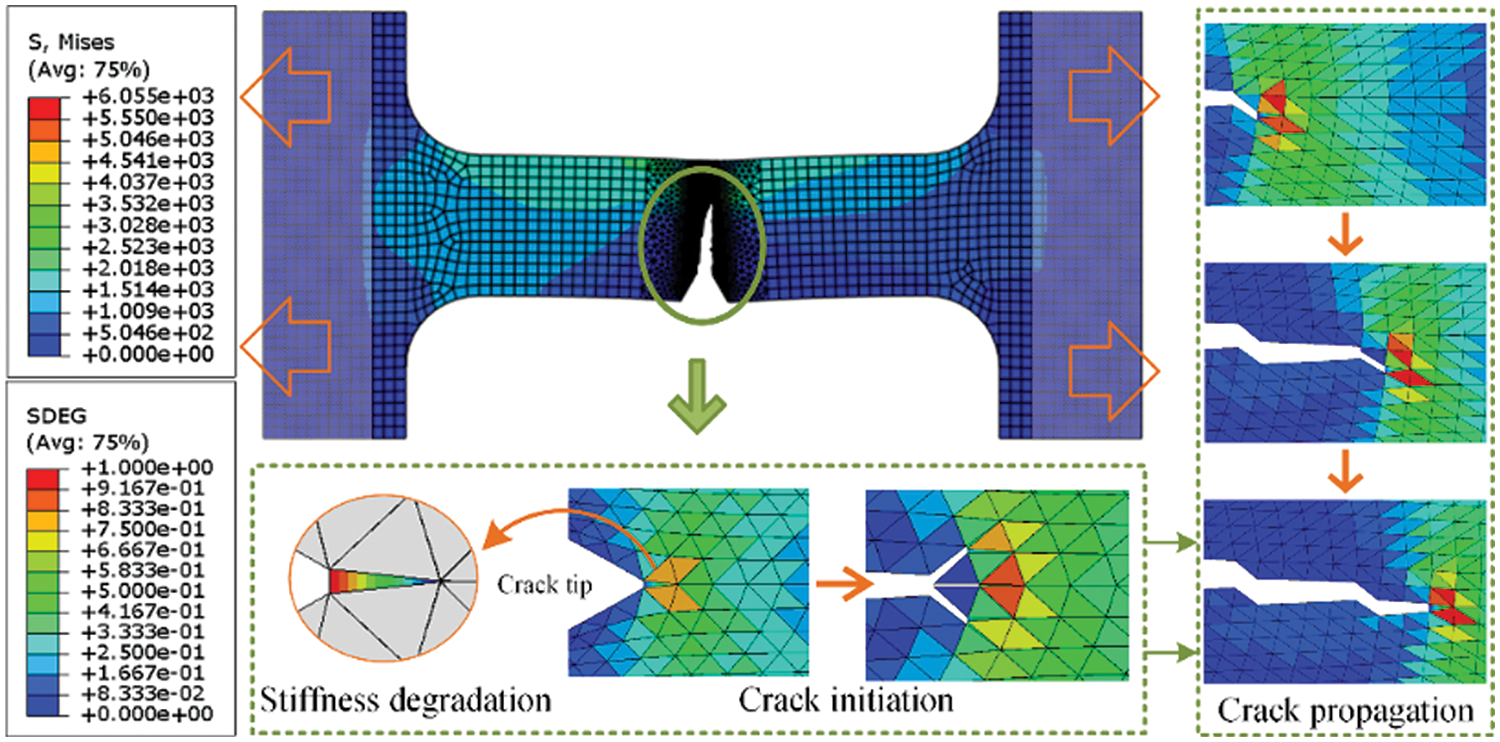
Figure 11: The macroscopic crack propagation of sintered AgNPs specimen
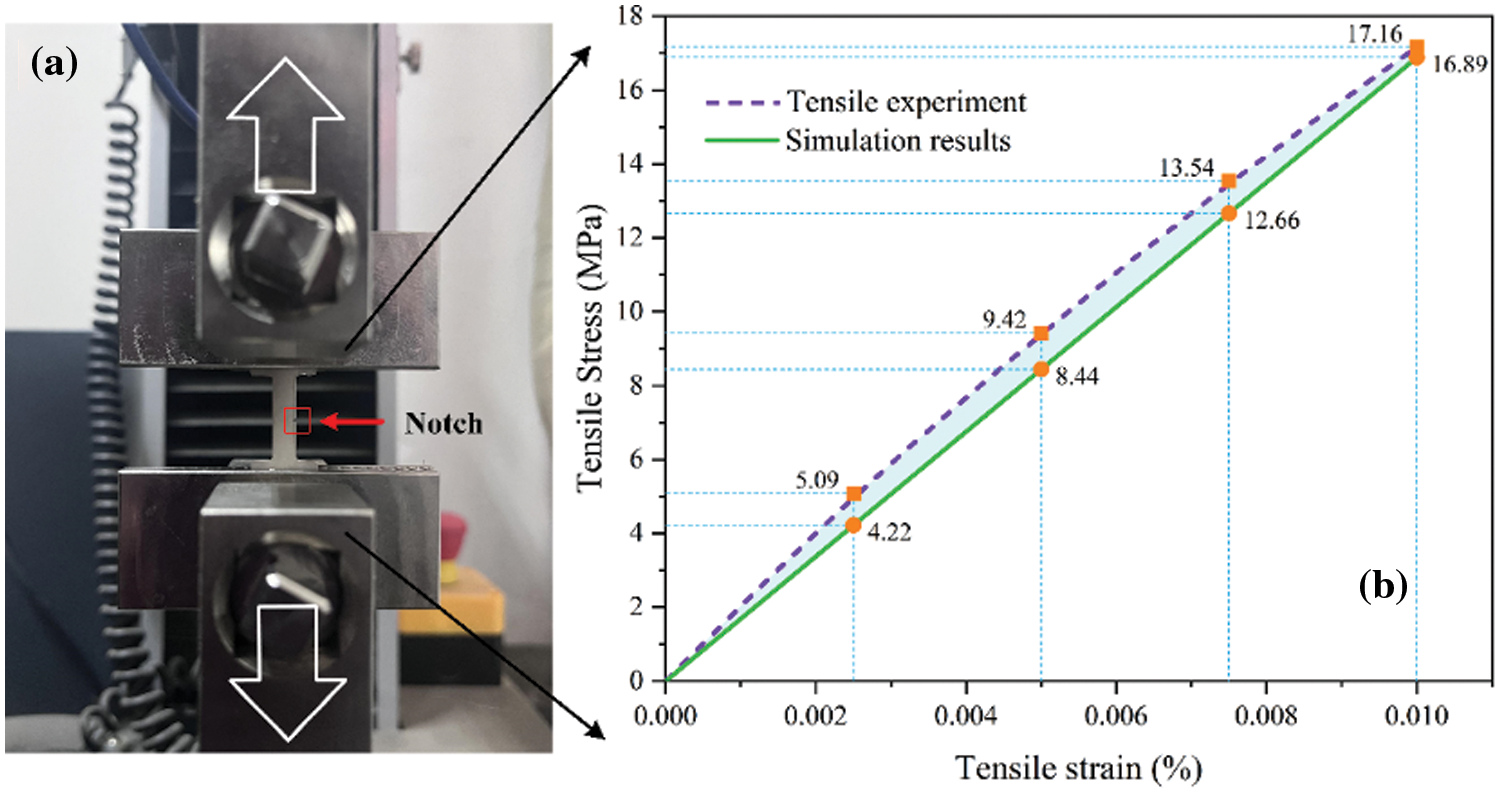
Figure 12: Uniaxial tensile test of the sintered AgNPs specimen. (a) Tensile test process with 0.01 mm/min rate (b) comparison of experimental and simulation results
4 Discussion on the Influence of Microscopic Defect Types on Macroscopic Crack Propagation
The T-S curve bridges the microscopic defects evolution and the macroscopic cracks propagation successfully. This section will discuss how various microscopic defect types influence macroscopic crack propagation. Cohesive parameters for different microscopic defect types are available in Table 2. Uniaxial tensile fracture simulations are conducted on workpieces with different defects. The relationship between interfacial stress and transverse crack length is illustrated in Fig. 13.
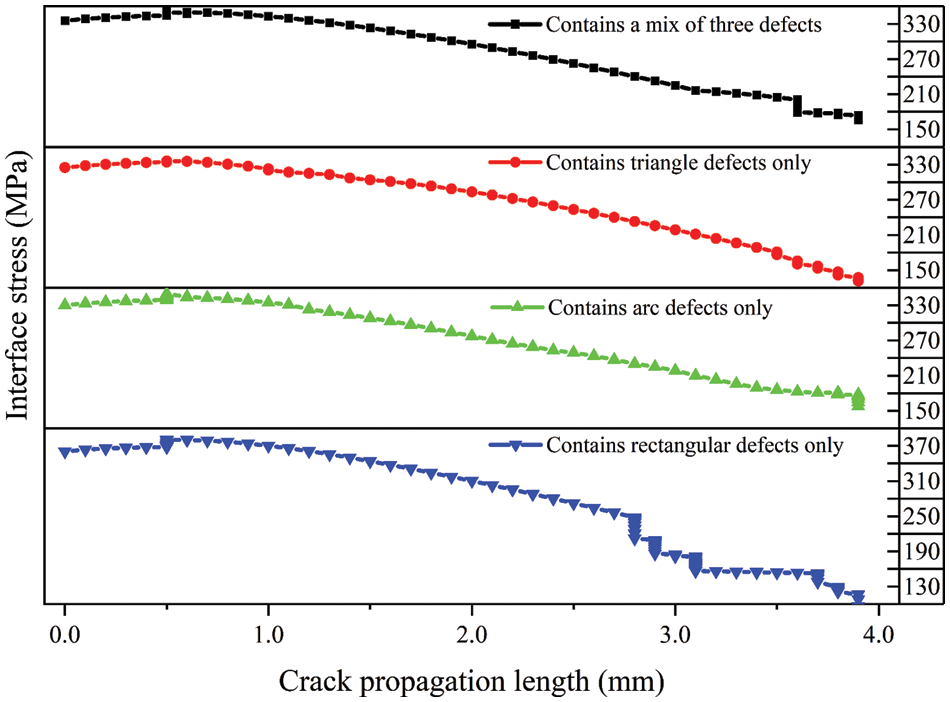
Figure 13: The relationship between crack transverse length and interface stress of the sintered AgNPs specimen with different defect types
In sintered AgNPs with only triangle and arc defects, the interfacial stress is relatively small. It could be due to the stress in these two kinds of defects is highly concentrated at the tip. Stress loading causes a significant number of dislocation emissions, facilitating the formation of SFs (mentioned in Section 2.3). So, a small force is sufficient to promote dislocation motion. From the macro perspective, the crack propagation process is relatively stable without significant crack bifurcation, and the curve is relatively smooth (as shown by the red and green dots in Fig. 13). On the contrary, the rectangular defect exhibits larger interfacial stress and significant stress fluctuations during crack propagation (as shown by the blue dots in Fig. 13). The stress distribution at the front of the rectangular defect is relatively scattered, leading to fewer dislocation nucleations under stress loading. This implies that the macroscopic cohesive element corresponding to the rectangular defect can absorb more energy. On the other hand, as dislocation emissions accumulate gradually at the front of the rectangular defect, localized dislocation motion leads to energy release. At the same time, irregular crack formation creates a force imbalance in the cohesive elements on both sides of the crack propagation direction, leading to crack bifurcation. From the macro perspective, these reasons will lead to abrupt changes in interface stress.
Tensile stress-strain curves of sintered AgNPs with different defects are extracted, as shown in Fig. 14. The CFEM model with only rectangular defects shows significantly higher yield strength. Furthermore, the area under the stress-strain curve indicates material toughness. Sintered AgNPs with rectangular defects have the highest toughness, absorbing more energy during plastic deformation and displaying greater resistance to brittle fracture. These findings are in line with the defect characteristics observed in MD simulations. Moreover, it can be concluded that the pivotal factors affecting crack propagation are the critical stress and fracture energy of the cohesive element from the fracture theory of CFEM. By comparing the performance of different defects in Figs. 13 and 14, it can be seen that the critical maximum traction corresponding to different microscopic defect types will directly affect the macrostructure strength, and the crack propagation process is closely related to the failure displacement.
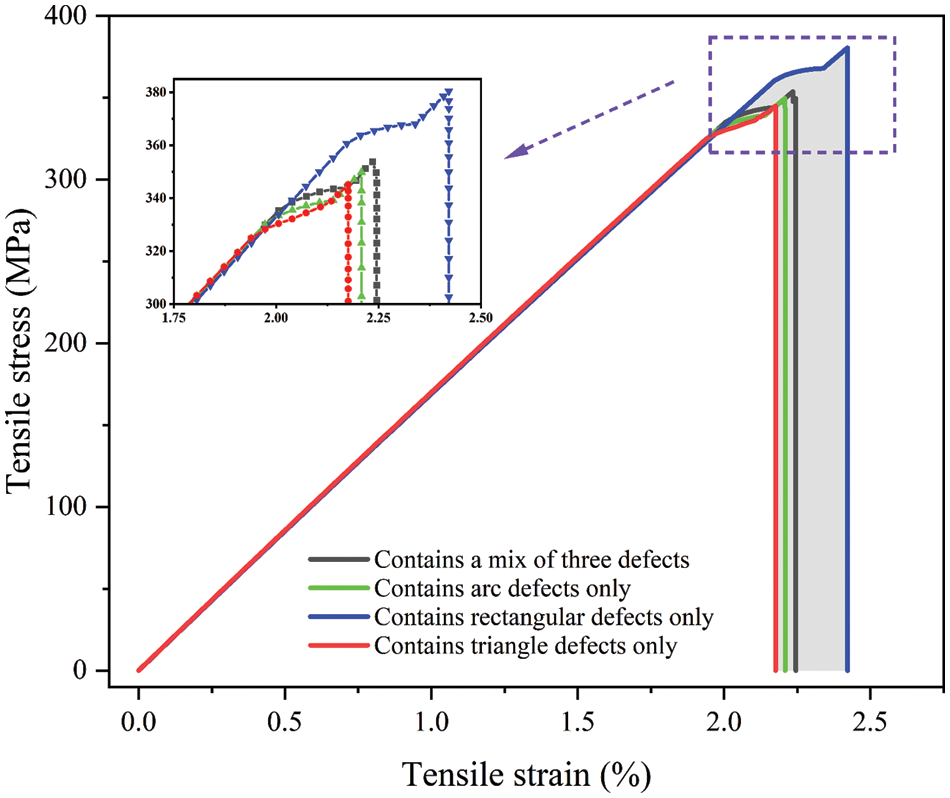
Figure 14: The relationship between crack transverse length and interface stress of the sintered AgNPs specimen with different defect types
This study examines the influence of three typical microscopic defects on macroscopic crack propagation. The results show that rectangular defects can enhance the crack resistance in sintered AgNPs. Moreover, this paper indirectly provides a standardized process for rapidly predicting macroscopic material properties based on microscopic defect morphology. Optimizing the sintering process does not require huge material performance tests on sintered samples. Instead, using the observation equipment combined with the proposed method (including a series of computer operations such as microscopic morphology extraction, defect type counting, and macro CFEM modeling.) enables a rapid preliminary assessment of the sintering effect. Predicted material properties serve as a guide for improving the sintering process and inspiring user confidence.
Beyond the 8-neighborhood algorithm employed in this work for identifying the microscopic defect morphology of sintered AgNPs, similar results can be obtained using other methods like the watershed algorithm or connected component labeling algorithm [47]. Moreover, even some observation equipment with image processing programs like FIB and 3D X-ray can also achieve this target. Thus, the acquisition of micro-defect information will not be an obstacle to the proposed method implementation.
This paper provides a descriptive perspective from Å to mm scale units about how microscopic defect types impact the macroscopic crack propagation of sintered AgNPs. The main conclusions are summarized as follows:
(1) Microscopic defects in sintered AgNPs are identified, classified, and quantified as rectangles, arcs, and triangles. MD observations reveal significant atomic passivation in all three defect fronts during stretching, and dislocations will continuously emit to form SFs/ESFs. By defining the yield strain point, transition strain point and failure strain point, it is clarified that all three defects will undergo a plastic deformation process dominated by dislocation nucleation to the rapid necking process dominated by dislocation movement during the stretching process. Notably, the type of defect has a more significant influence on the transition strain than the yield strain. E.g., defects like triangles and arcs with stress concentration rapidly reach the transition strain point and progress to the rapid necking stage, while this process is slower for rectangular defects. Thus, the defect type affects not only material strength but also the speed of failure evolution.
(2) The effectiveness of the macroscopic crack propagation model with bridging microscopic failure information has been verified. Thus, T-S curves can be used to distinguish the microscopic failure behavior of different defect types and transfer information between micro and macro scales. The model with only rectangular defects exhibits larger interfacial stress and obvious stress fluctuation during crack propagation. In contrast, the crack propagation processes associated with arc and triangle defects appear comparatively smoother. The presence of rectangular defects enhances the toughness and resistance to cracking of the sintered AgNPs compared to arc and triangle defects. This is attributed to the higher yield strength and fracture energy corresponding to rectangular defects, as observed in MD simulations.
Acknowledgement: We are very grateful to the editors and reviewers for their valuable comments on the simulation analysis and English writing, which have been very helpful in improving the quality of the manuscript. Thanks to the high-performance computer platform of Beihang University for providing computing services.
Funding Statement: This project was supported by the China Scholarship Council (CSC) (No. 202206020149), the Academic Excellence Foundation of BUAA for PhD Students, the Funding Project of Science and Technology on Reliability and Environmental Engineering Laboratory (No. 6142004210106).
Author Contributions: Zhongqing Zhang: Conceptualization, Methodology, Investigation, Writing—Original Draft, Visualization. Bo Wan: Visualization Writing—Review & Editing. Guicui Fu: Supervision, Resources. Yutai Su: Formal Analysis, Writing—Review & Editing. Zhaoxi Wu: Resources, Software. Xiangfen Wang: Visualization. Xu Long: Investigation.
Availability of Data and Materials: The datasets generated during and/or analyzed during the current study are available from the corresponding author on reasonable request.
Conflicts of Interest: The authors declare that they have no conflicts of interest to report regarding the present study.
References
1. Liu, W., An, R., Wang, C., Zheng, Z., Tian, Y. et al. (2018). Recent progress in rapid sintering of nanosilver for electronics applications. Micromachines, 9(7), 346. [Google Scholar] [PubMed]
2. Zhang, H., Wang, W., Bai, H., Zou, G., Liu, L. et al. (2019). Microstructural and mechanical evolution of silver sintering die attach for SiC power devices during high temperature applications. Journal of Alloys and Compounds, 774, 487–494. [Google Scholar]
3. Hu, B., Yang, F., Peng, Y., Hang, C., Chen, H. et al. (2019). Effect of SiC reinforcement on the reliability of Ag nanoparticle paste for high-temperature applications. Journal of Materials Science: Materials in Electronics, 30(3), 2413–2418. [Google Scholar]
4. Paknejad, S. A., Mannan, S. H. (2017). Review of silver nanoparticle based die attach materials for high power/temperature applications. Microelectronics Reliability, 70, 1–11. [Google Scholar]
5. Zhang, Z., Chen, C., Suetake, A., Hsieh, M. C., Iwaki, A. et al. (2021). Pressureless and low-temperature sinter-joining on bare Si, SiC and GaN by a Ag flake paste. Scripta Materialia, 198, 113833. [Google Scholar]
6. Yan, J. (2021). A review of sintering-bonding technology using Ag nanoparticles for electronic packaging. Nanomaterials, 11(4), 927. [Google Scholar] [PubMed]
7. Su, Y., Fu, G., Liu, C., Zhang, K., Zhao, L. et al. (2021). Thermo-elasto-plastic phase-field modelling of mechanical behaviours of sintered nano-silver with randomly distributed micro-pores. Computer Methods in Applied Mechanics and Engineering, 378, 113729. [Google Scholar]
8. Zhu, J., Su, Y., Chuantong, C., Siow, K. S., Tang, R. et al. (2021). Porosity effect on fracture behavior of sintered silver nanoparticles by phase-field modeling. 2021 IEEE 23rd Electronics Packaging Technology Conference (EPTC), pp. 317–321. Singapore. [Google Scholar]
9. Zhuang, X., Zhou, S., Huynh, G. D., Areias, P., Rabczuk, T. (2022). Phase field modeling and computer implementation: A review. Engineering Fracture Mechanics, 262, 108234. [Google Scholar]
10. Li, X., Li, X., Jiang, X. (2017). Influence of a micro-crack on the finite macro-crack. Engineering Fracture Mechanics, 177, 95–103. [Google Scholar]
11. Li, X., Yang, H., Zan, X., Li, X., Jiang, X. (2018). Effect of a micro-crack on the kinked macro-crack. Theoretical and Applied Fracture Mechanics, 96, 468–475. [Google Scholar]
12. Calabretta, M., Sitta, A., Oliveri, S. M., Sequenzia, G. (2022). Copper to resin adhesion characterization for power electronics application: Fracture toughness and cohesive zone analysis. Engineering Fracture Mechanics, 266, 108339. [Google Scholar]
13. Xu, M., Liu, Y., Yuan, H. (2022). On ΔJ characterization of elastic–plastic crack-tip fields under fatigue loading conditions. International Journal of Fatigue, 160, 106849. [Google Scholar]
14. Yongle, H., Yifei, L., Fei, X., Binli, L., Xin, T. (2020). Physics of failure of die-attach joints in IGBTs under accelerated aging: Evolution of micro-defects in lead-free solder alloys. Microelectronics Reliability, 109, 113637. [Google Scholar]
15. Tan, Y., Li, X., Chen, G., Gao, Q., Lu, G. Q. et al. (2020). Effects of thermal aging on long-term reliability and failure modes of nano-silver sintered lap-shear joint. International Journal of Adhesion and Adhesives, 97, 102488. [Google Scholar]
16. Chen, C., Suganuma, K. (2019). Microstructure and mechanical properties of sintered Ag particles with flake and spherical shape from nano to micro size. Materials & Design, 162, 311–321. [Google Scholar]
17. Rudd, R. E., Broughton, J. Q. (2000). Concurrent coupling of length scales in solid state systems. Physica Status Solidi (b), 217(1), 251–291. [Google Scholar]
18. Xu, T., Stewart, R., Fan, J., Zeng, X., Yao, A. (2016). Bridging crack propagation at the atomistic and mesoscopic scale for BCC-Fe with hybrid multiscale methods. Engineering Fracture Mechanics, 155, 166–182. [Google Scholar]
19. Yao, Y., Huang, Q., Wang, S. (2020). Effects of porosity and pore microstructure on the mechanical behavior of nanoporous silver. Materials Today Communications, 24, 101236. [Google Scholar]
20. Zhu, Y., Hu, X., Ni, Y. (2021). Molecular dynamics simulation of microstructure evolution during the fracture process of nano-twinned Ag. Engineering Fracture Mechanics, 248, 107743. [Google Scholar]
21. Long, X., Chong, K., Su, Y., Du, L., Zhang, G. (2023). Connecting the macroscopic and mesoscopic properties of sintered silver nanoparticles by crystal plasticity finite element method. Engineering Fracture Mechanics, 281, 109137. [Google Scholar]
22. Su, Y., Shen, Z., Long, X., Chen, C., Qi, L. et al. (2023). Gaussian filtering method of evaluating the elastic/elasto-plastic properties of sintered nanocomposites with quasi-continuous volume distribution. Materials Science and Engineering: A, 872, 145001. [Google Scholar]
23. Zhao, Z., Zou, G., Zhang, H., Ren, H., Liu, L. et al. (2018). The mechanism of pore segregation in the sintered nano Ag for high temperature power electronics applications. Materials Letters, 228, 168–171. [Google Scholar]
24. Yao, Y., Gong, H. (2019). Damage and viscoplastic behavior of sintered nano-silver joints under shear loading. Engineering Fracture Mechanics, 222, 106741. [Google Scholar]
25. Long, X., Guo, Y., Su, Y., Siow, K. S., Chen, C. (2022). Constitutive, creep, and fatigue behavior of sintered Ag for finite element simulation of mechanical reliability: A critical review. Journal of Materials Science: Materials in Electronics, 33(5), 2293–2309. [Google Scholar]
26. Pham, M. V., Ha, Y. S., Kim, Y. T. (2023). Automatic detection and measurement of ground crack propagation using deep learning networks and an image processing technique. Measurement, 215, 112832. [Google Scholar]
27. Zhu, J., He, X., Yang, D., Bie, Z., Mei, H. et al. (2021). A peridynamic model for fracture analysis of polycrystalline BCC-Fe associated with molecular dynamics simulation. Theoretical and Applied Fracture Mechanics, 114, 102999. [Google Scholar]
28. Ding, J., Zheng, H., Tian, Y., Huang, X., Song, K. et al. (2020). Multi-scale numerical simulation of fracture behavior of nickel-aluminum alloy by coupled molecular dynamics and cohesive finite element method (CFEM). Theoretical and Applied Fracture Mechanics, 109, 102735. [Google Scholar]
29. Williams, P. L., Mishin, Y., Hamilton, J. C. (2006). An embedded-atom potential for the Cu-Ag system. Modelling and Simulation in Materials Science and Engineering, 14(5), 817–833. [Google Scholar]
30. Kumar Panda, A., Divakar, R., Singh, A., Thirumurugesan, R., Parameswaran, P. (2021). Molecular dynamics studies on formation of stacking fault tetrahedra in FCC metals. Computational Materials Science, 186, 110017. [Google Scholar]
31. Balbuena, C., Gianetti, M. M., Soulé, E. R. (2021). Molecular dynamics simulations of the formation of Ag nanoparticles assisted by PVP. Physical Chemistry Chemical Physics, 23(11), 6677–6684. [Google Scholar] [PubMed]
32. Li, S., Liu, Y., Ye, H., Liu, X., Sun, F. et al. (2022). Sintering mechanism of Ag nanoparticle-nanoflake: A molecular dynamics simulation. Journal of Materials Research and Technology, 16, 640–655. [Google Scholar]
33. Wu, C. D., Cheng, Y. W., Hong, G. W. (2020). Mechanical response of nanoporous nickel investigated using molecular dynamics simulations. Journal of Molecular Modeling, 26(7), 185. [Google Scholar] [PubMed]
34. Wei, Y., Qiao, L., Han, K., Yang, L. (2022). Transient dislocation emission from the nanosized interface of Cu–Ag composite under the coupled thermal-mechanical shock: Molecular dynamics simulations study. Physica B: Condensed Matter, 644, 414245. [Google Scholar]
35. Stukowski, A. (2009). Visualization and analysis of atomistic simulation data with OVITO–The open visualization tool. Modelling and Simulation in Materials Science and Engineering, 18(1), 015012. [Google Scholar]
36. Linda, A., Tripathi, P. K., Nagar, S., Bhowmick, S. (2022). Effect of pressure on stacking fault energy and deformation behavior of face-centered cubic metals. Materialia, 26, 101598. [Google Scholar]
37. Liang, T., Zhou, D., Wu, Z., Shi, P., Chen, X. (2018). Length-dependent dual-mechanism-controlled failure modes in silver penta-twinned nanowires. Nanoscale, 10(44), 20565–20577. [Google Scholar] [PubMed]
38. Gu, M., Liu, T., Xiao, X., Li, G., Liao, W. (2022). Simulation and experimental study of the multisized silver nanoparticles sintering process based on molecular dynamics. Nanomaterials, 12(6), 1030. [Google Scholar] [PubMed]
39. Zhang, Z., Fu, G., Wan, B., Su, Y., Jiang, M. (2021). Research on sintering process and thermal conductivity of hybrid nanosilver solder paste based on molecular dynamics simulation. Microelectronics Reliability, 126, 114203. [Google Scholar]
40. Griffith, A. A., Taylor, G. I. (1921). VI. The phenomena of rupture and flow in solids. Philosophical Transactions of the Royal Society of London, 221(582–593), 163–198. [Google Scholar]
41. Kendall, K. (2022). New theory explaining Griffith strength results on nano-cracked glass fibres. Philosophical Transactions of the Royal Society A: Mathematical, Physical and Engineering Sciences, 380(2232), 20210348. [Google Scholar]
42. Wang, R., Liu, Y., Mao, J., Liu, Z., Hu, D. (2022). Cyclic cohesive zone model damage parameter acquisition for fatigue crack growth considering crack closure effect. International Journal of Fatigue, 163, 107021. [Google Scholar]
43. Needleman, A. (1990). An analysis of decohesion along an imperfect interface. International Journal of Fracture, 42, 21–40. [Google Scholar]
44. Kariya, Y., Yamaguchi, H., Itako, M., Mizumura, N., Sasaki, K. (2013). Mechanical behavior of sintered nano-sized Ag particles. Smart Process Journal  , 2(4), 160–165. [Google Scholar]
45. Youssef, T., Rmili, W., Woirgard, E., Azzopardi, S., Vivet, N. et al. (2015). Power modules die attach: A comprehensive evolution of the nanosilver sintering physical properties versus its porosity. Microelectronics Reliability, 55(9), 1997–2002. [Google Scholar]
46. Chen, C., Nagao, S., Suganuma, K., Jiu, J., Zhang, H. et al. (2016). Self-healing of cracks in Ag joining layer for die-attachment in power devices. Applied Physics Letters, 109(9), 093503. [Google Scholar]
47. Bieniek, A., Moga, A. (2000). An efficient watershed algorithm based on connected components. Pattern Recognition, 33(6), 907–916. [Google Scholar]
Cite This Article
 Copyright © 2024 The Author(s). Published by Tech Science Press.
This work is licensed under a Creative Commons Attribution 4.0 International License , which permits unrestricted use, distribution, and reproduction in any medium, provided the original work is properly cited.
 Downloads
 Citation Tools