
 Submit a Paper
 Propose a Special lssue
 Open Access
ARTICLE

A Railway Fastener Inspection Method Based on Abnormal Sample Generation
1 Higher Vocational and Technical College, Shanghai University of Engineering Science, Shanghai, 200437, China
2 School of Urban Railway Transportation, Shanghai University of Engineering Science, Shanghai, 201620, China
3 Shanghai Engineering Research Centre of Vibration and Noise Control Technologies for Rail Transit, Shanghai University of Engineering Science, Shanghai, 201620, China
* Corresponding Author: Liming Li. Email:
(This article belongs to the Special Issue: Failure Detection Algorithms, Methods and Models for Industrial Environments)
Computer Modeling in Engineering & Sciences 2024, 139(1), 565-592. https://doi.org/10.32604/cmes.2023.043832
Received 13 August 2023; Accepted 24 October 2023; Issue published 30 December 2023
 View Full Text
 Download PDF
Abstract
Regular fastener detection is necessary to ensure the safety of railways. However, the number of abnormal fasteners is significantly lower than the number of normal fasteners in real railways. Existing supervised inspection methods have insufficient detection ability in cases of imbalanced samples. To solve this problem, we propose an approach based on deep convolutional neural networks (DCNNs), which consists of three stages: fastener localization, abnormal fastener sample generation based on saliency detection, and fastener state inspection. First, a lightweight YOLOv5s is designed to achieve fast and precise localization of fastener regions. Then, the foreground clip region of a fastener image is extracted by the designed fastener saliency detection network (F-SDNet), combined with data augmentation to generate a large number of abnormal fastener samples and balance the number of abnormal and normal samples. Finally, a fastener inspection model called Fastener ResNet-8 is constructed by being trained with the augmented fastener dataset. Results show the effectiveness of our proposed method in solving the problem of sample imbalance in fastener detection. Qualitative and quantitative comparisons show that the proposed F-SDNet outperforms other state-of-the-art methods in clip region extraction, reaching MAE and max F-measure of 0.0215 and 0.9635, respectively. In addition, the FPS of the fastener state inspection model reached 86.2, and the average accuracy reached 98.7% on 614 augmented fastener test sets and 99.9% on 7505 real fastener datasets.Keywords
As an essential transportation mode, urban rail transit has been widely recognized and applied in various domains due to its advantages, including high transportation efficiency, large transportation volume, and low energy consumption. Therefore, the safety and reliability of urban railway transportation have become a significant issue for researchers and scholars. In urban rail transportation, the track bears the weight of the train. As shown in Fig. 1, the fastener, as a key component of the track structure, stably fixes the steel rail to the rail sleeper and provides cushioning and shock absorption. Therefore, fasteners are vital for the safety and reliability of railway transportation.

Figure 1: Railway image. (a) Includes WJ7 fasteners (b) Includes WJ8 fasteners
In general, prolonged high-speed and high-load operation of trains and the influence of the railway environment will result in fasteners experiencing a certain degree of wear and tear, such as fracture, offset loosening, and deformation, and even become lost or experience other complex defects [1]. These abnormal fasteners can seriously threaten the safety of railway transportation if they are not detected and repaired in time. Therefore, this paper focuses on the automatic positioning and detection method of railway fasteners on the basis of sample generation to enhance the safety of rail transit.
In recent years, the emerging, popular technology of computer vision has made non-destructive testing of railway transportation feasible and improved the efficiency and accuracy of inspecting. The common methods currently used in the field of computer vision include traditional image processing, machine learning, and deep learning. However, when dealing with complex images, traditional image processing and machine learning methods [2,3] may not be able to extract the features of objects accurately, and they require manual design of features and classifiers, which usually increases the time cost and reduces the detection efficiency. With the development of deep learning, defect detection methods based on deep convolutional neural networks (DCNNs) are capable of automatically learning features within images. These methods exhibit a high degree of adaptability, enabling them to perform localization, classification, and prediction on large-scale datasets. These methods have been extensively studied and applied to defect detection in the railway domain. References [4,5] used DCNNs for fast and automated detection of train wheel defects, coupled with data augmentation techniques to achieve condition monitoring and fault diagnosis. Wang et al. [6] proposed a cascade DCNN to solve the loosening detection problem of bolts. In literature [7], Wei et al. proposed a condition monitoring method based deep learning for the pantograph slide plate. References [8,9] developed various models for rail surface and fastener defect detection based on DCNN. In this paper, we mainly focus on railway fasteners. Existing automated detection methods for fasteners still present numerous challenges, such as the following:
1) Sample imbalance in the railway fastener dataset is not considered. Gibert et al. [10] proposed a multitask learning framework to detect defects on fasteners. Wei et al. [11] studied the localization of fastener regions by using vertical and horizontal projections in traditional image processing techniques, followed by fastener classification using support vector machine (SVM). Bai et al. [12] applied the support vector data description (SVDD) algorithm to classify defective fasteners on the basis of the detection results of the improved Faster R-CNN. However, the failure rate of fasteners is typically low in real railway lines, resulting in far fewer abnormal fastener samples than normal fastener samples. DCNN requires a balanced training sample size, and training on an imbalanced fastener dataset cannot extract sufficient features of abnormal fastener. This condition leads to the detection model being unable to accurately identify abnormal fasteners, thus reducing the stability and accuracy of the model and significantly affecting the fastener inspection task and line maintenance scheduling. Therefore, solving the problem of imbalanced fastener samples is imperative.
2) Data augmentation methods for fastener images can only increase the number of abnormal fastener images and in essence cannot increase the defective state of fasteners, i.e., it cannot consider the diversity of different broken positions and offset orientations in fasteners. Chandran et al. [13] expanded a dataset by applying rotation, flip, and scale transformations to fastener images. Xiao et al. [14] used copy-and-paste method to enhance the defects in the training images and then used ResNet-101 backbone to extract the features of fasteners. Liu et al. [15] proposed template matching with prior knowledge of fasteners, which reduced the imbalance of samples by random sorting. Liu et al. [16] improved the inspection performance by constructing fastener sample pairs. Wang et al. [17] used generative adversarial network (GAN) for fastener image generation to improve the inspection performance. Yao et al. [18] utilized GAN to track the distribution of faulty data and established a mapping relationship between image data to generate negative samples. However, the abnormal state of railway fasteners exhibits various patterns. Simply increasing the quantity of abnormal fastener images would prevent the inspection model from fully learning the features of abnormal fasteners, thereby limiting its effectiveness in practical inspection task. Therefore, we simulate field-based defect scenarios by adding fastener abnormal states to effectively improve the accuracy and robustness of the actual fastener inspection task.
In addition, few shot learning methods can partially address the problem of imbalanced samples, such as Siamese network [19], matching network [20], learning to learn [21], and prototypical network [22]. However, the existing methods cannot fundamentally solve the problem because of the limited abnormal fasteners, resulting in insufficient detection performance. Moreover, these few shot learning models need to be retrained at each actual inspection and cannot be universally applied to the fastener inspection task.
Through a review of the above literature, one can conclude that defect detection on unbalanced fastener datasets still faces challenges. Therefore, this paper solves the problem by generating a large number of abnormal fastener samples.
The specific contributions are as follows:
1. In this paper, we propose a hierarchical learning method to solve the sample imbalance problem in supervised fastener detection, which has three stages: fastener localization based on lightweight YOLOv5s, abnormal fastener sample generation based on saliency detection, and fastener state detection.
2. A novel fastener saliency detection network called F-SDNet, which extracts the foreground clip region of fastener images, is proposed. On the basis of the clip region, data augmentation is used to generate abnormal fastener samples (e.g., broken, loosen and missing fasteners). Our method can balance normal and abnormal fastener samples, which is beneficial for training a robust inspection model.
3. A ResNet-based [23] model called fastener ResNet-8 is proposed for fastener state inspection. We evaluate our method by using 7505 real fastener images, achieving a precision of 99.9%. Our method demonstrates outstanding performance regarding accuracy and speed. It effectively solves the problem of imbalanced fastener samples, proving its effectiveness in real railway inspection scenarios.
In the following sections of this paper, we provide an overview of the proposed method and introduce the detailed model architecture in Section 2, including fastener localization model, abnormal fastener sample generation based on saliency detection, and fastener inspection model. We show experimental results and comparison results with other methods in Section 3. We present the conclusion and outlook in Section 4.
This paper proposes a hierarchical learning method to solve the problem of imbalanced dataset. The method consists of three stages. First, a lightweight object detection network is used for rapid fastener localization. Second, the clip region is extracted based on a saliency detection model. This step is followed by the application of random cropping, rotation, and background fusion to generate abnormal fastener samples. Finally, a CNN-based fastener state inspection model is constructed, which includes normal and abnormal fasteners. The framework of the proposed method is illustrated in Fig. 2.

Figure 2: Framework of the proposed method
2.1 Fastener Localization Based on Lightweight YOLOv5s
Traditional fastener localization methods are mainly based on a prior information such as track structure and geometric features of fasteners [24–26], which cannot be adapted to new track and fastener types. In recent years, deep learning-based object detection methods have been widely applied to fastener localization. In [11], Faster R-CNN-based fastener localization model has a high parameter count and slow detection speed. Wei et al. [27] proposed an improved YOLOv3 model to locate fasteners. Chen et al. [28] designed a lightweight YOLO architecture to locate fasteners, reducing runtime memory and increasing detection speed. Qi et al. [29] introduced MYOLOv3-Tiny and reduced the model parameters, but the accuracy of fastener detection was not satisfactory.
The actual railway environment is complex, and railway inspection images have problems such as small object segmentation, low contrast between fasteners and background, and grayscale images instead of color images, thus requiring a finer model that can balance detection accuracy and inference speed in practical fastener inspection tasks. Therefore, You Only Look Once (YOLO) [30], which is a single-stage algorithm, is more suitable for the application scenario of high-accuracy, high-efficiency, and real-time detection in this paper.
We considered the YOLOv5 series, which offers a balance between detection speed and performance, because of the specific nature of railway images and the demand for efficiency in daily fastener detection. Compared with YOLOv3 and YOLOv4, YOLOv5 has undergone improvements in algorithmic structure and network architecture, thereby exhibiting superior performance and scalability. Among the YOLOv5 models, we selected YOLOv5s, which is the smallest network model with the lowest GFLOPs, as the base network for fastener localization tasks. Starting from the redundancy of information, we utilize sparse training and channel pruning techniques to design a lightweight YOLOv5s (Fig. 3). The aim is to improve localization speed while maintaining a certain level of accuracy, making it more suitable for the localization and segmentation of fastener regions. The final results consist of fastener images and missing fastener images, which form the original fastener datasets.

Figure 3: Lightweight flowchart of the fastener localization model
A pruning factor
where
Inspired by the pruning strategy in [31], a global threshold-based approach is adopted to prune the model, as illustrated in Fig. 4. First,

Figure 4: Channel pruning process
2.2 Abnormal Fastener Sample Generation Based on Saliency Detection
Saliency detection is extensively utilized in image processing and computer vision, playing an important role in segmentation tasks by quickly and accurately locating salient regions in images and highlighting the foreground clip region of fasteners. Earlier saliency detection algorithms [32,33] were based on manually designed features, which were time consuming and had inadequate performance. Currently, saliency detection has advanced rapidly with the development of deep learning. References [34,35] applied multiscale feature fusion strategies that help combine feature information from different scales, which can extract the information of salient objects more effectively. Wei et al. [36] designed F3-Net, which contains a cross-feature fusion mechanism. The feature maps of most saliency detection models can generally reflect the approximate location of the objects but are not effective in recovering object details for complex structures. Zhao et al. [37] proposed an edge-guided strategy to generate high-quality edge information by using local edge information and global location information. Liu et al. [38] used side output supervision to obtain clear boundaries of salient objects. Qin et al. [39] proposed BASNet, which accurately segments salient objects while maintaining high-quality boundaries.
Accurately segmenting the foreground clip region of fastener images is necessary to improve the authenticity of the generated abnormal fastener samples. However, the existing saliency detection models [26–33] can extract most of the features of the fasteners but still cannot accurately segment the boundaries due to the low contrast and similar grayscale features between the foreground and the background in real fastener images. Therefore, we designed a fastener saliency detection network (F-SDNet) to segment the foreground clip region of fastener images. As shown in Fig. 5, F-SDNet generates a coarse clip saliency map through a feature extraction module and a saliency prediction module, and then refines the clip edges through a boundary aware module. F-SDNet facilitates multiscale learning, enhances boundary features, and generates more accurate saliency maps, providing a basis for generating abnormal fastener samples. The detailed descriptions of the network modules and loss function can be found in Section 2.2.2.
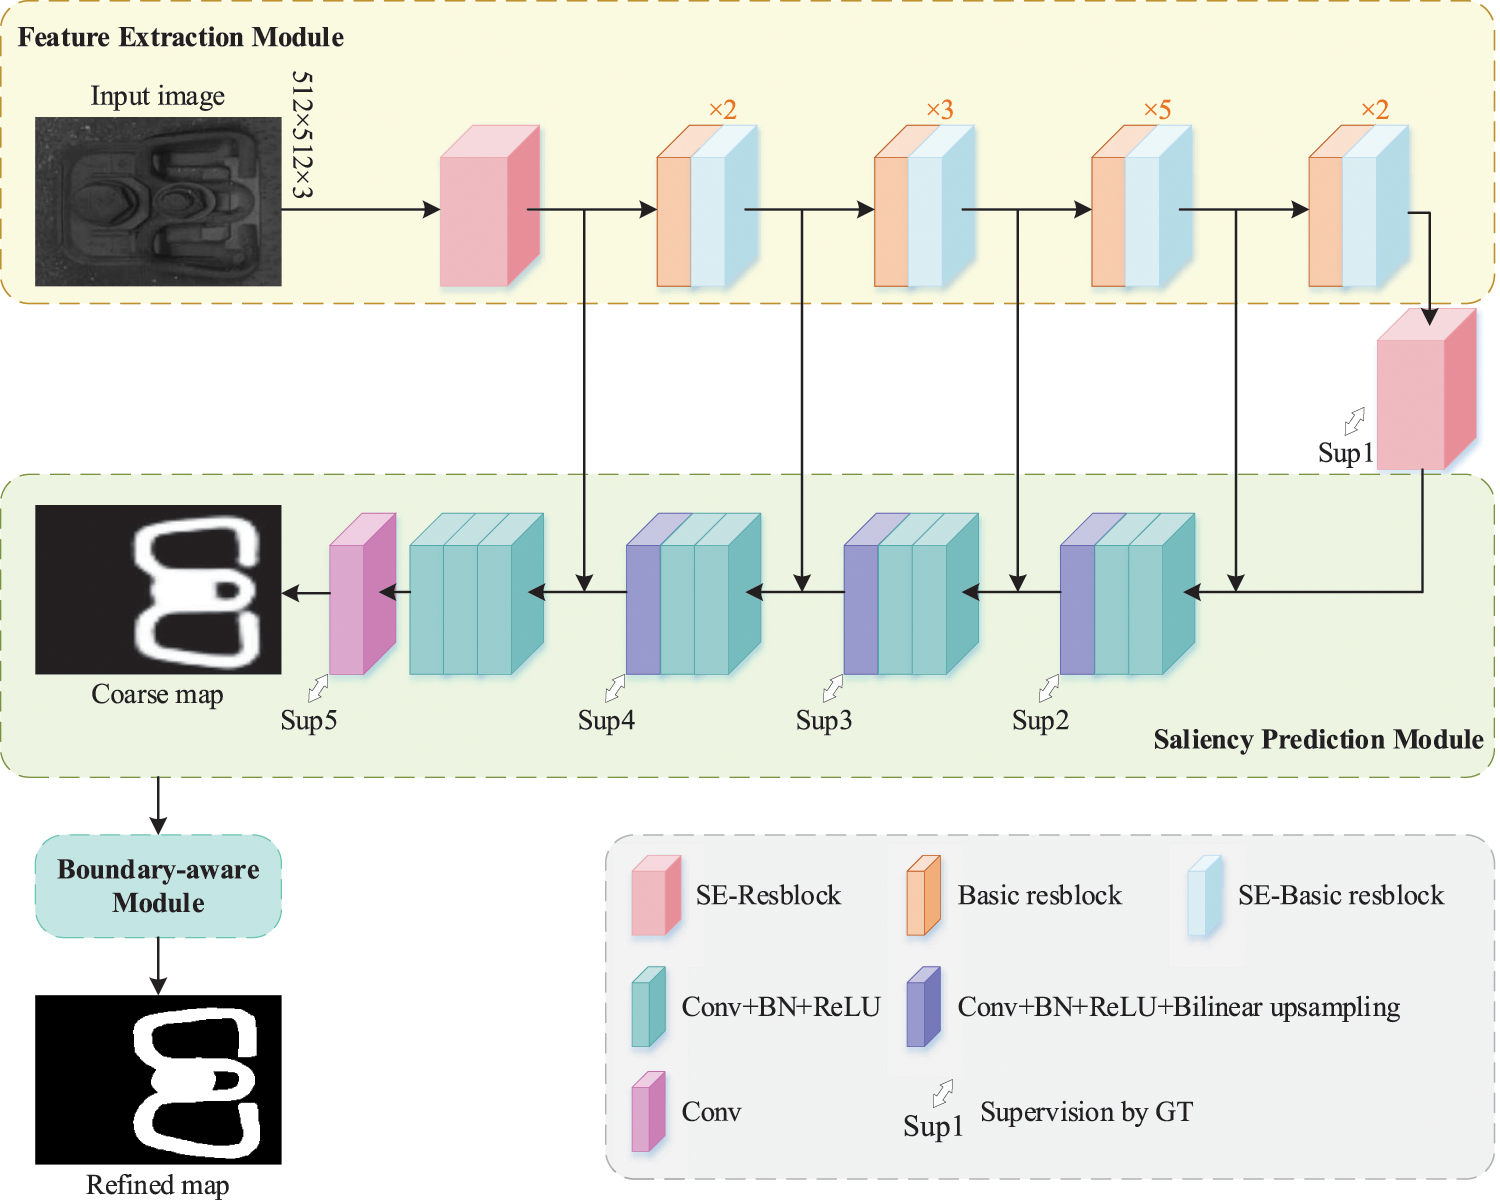
Figure 5: Architecture of our proposed clip saliency detection network F-SDNet
F-SDNet consists of three main modules. The first module is the clip feature extraction module based on the improved ResNet-50. The second module is the clip saliency prediction module, which generates clip coarse saliency maps. In addition, referring to the deep supervision mechanism in [37], the proposed joint loss function is supervised for each layer of the output feature maps. The third module is the encoder-decoder-based clip boundary-aware module, which mainly serves to refine the coarse saliency map.
(1) Feature extraction module
ResNet is one of the most commonly used feature extraction networks in deep learning. Its deeper network structure, fewer parameters, and good generalization ability make it well suited for image feature extraction tasks. To better extract the features of fasteners, we choose the improved ResNet-50 as the backbone network and designed a clip feature extraction module. This module aims to address the problems of low contrast and similarity between foreground and background features in fastener images. It enhances the attention and discriminability of the clip regions in fastener images, enabling more accurate feature extraction of clip regions.
The feature extraction module consists of five stages. Stage 1 is SE-Resblock, as shown in Fig. 6. Unlike the input convolution layer of original ResNet-50, SE-Resblock has 64 convolution filters with a size of 3 × 3 and a stride of 1, and it incorporates the SE [40] attention mechanism. A basic residual block consists of three convolution layers and a residual connection, where the first and third convolution layers use a 1 × 1 kernel, and the second convolution layer uses a 3 × 3 kernel. However, this structure fails to accurately capture the edge feature information of clips. We introduce the SE attention mechanism named SE-Basic resblock in the last residual block of stages 2–5 (Fig. 7). By incorporating the SE attention mechanism at each stage, the feature extraction module adaptively emphasizes significant feature channels, contributing to better extraction of important information such as the shape and localization of the clip.

Figure 6: SE-resblock

Figure 7: SE-basic resblock
(2) Saliency prediction module and joint loss
Inspired by U-Net [41] and U2-Net [42], this section designs a clip saliency prediction module based on a decoder structure. Five stages are set up in the saliency prediction module to match the input and output feature maps at the corresponding scale. Each stage consists of three convolution layers, and each convolution is followed by a BN and a ReLU activation function. Bilinear interpolation is used as the upsampling method.
Furthermore, we propose a joint loss to supervise the output feature maps of the last layer in each stage, aiming to improve the accuracy of the coarse saliency map structure.
BCE loss, which is widely used for binary classification problems, aims to minimize the difference between the true labels and the predicted labels. Dice loss is a commonly used loss function for image segmentation problems. The formulas are as follows:
We propose a joint loss by integrating BCE loss and Dice loss, which is defined as follows:
where
(3) Boundary-aware module
The unclear edges of the coarse saliency map generated by the saliency prediction module can lead to differences between the subsequently generated abnormal fasteners and the real abnormal fasteners, which affects the performance of the inspection model. Therefore, we design a boundary-aware module to optimize the clip regions and the boundaries (Fig. 8).

Figure 8: Detailed structure of clip boundary-aware module
The boundary-aware module references the U-shaped encoder-decoder and residual architecture. This module performs boundary refinement on the coarse saliency maps generated by the saliency prediction module and adds the coarse saliency maps
The boundary-aware module consists of an input layer, an encoder, a bridge stage, a decoder, and an output layer. Unlike the structure of the feature extraction module and the saliency prediction module, the encoder and decoder of the boundary-aware module include only four stages, and each stage consists of a cascade structure of 3 × 1 and 1 × 3 convolution layers, followed by max pooling. We adopt a convolution with 64 kernels of size 3 × 3 in the bridge stage at the bottom layer, followed by a BN and a ReLU. Boundary details are optimized further by using CBAM [43] to connect the feature maps before max pooling in the encoder with the corresponding stage of feature maps after upsampling in the decoder, which helps capture boundary details and important contextual information within the clip region, thereby improving the recognition accuracy of clip boundary details.
2.2.3 Abnormal Fastener Sample Generation
The high-speed railway WJ7 fastener is composed of a screw spike, clip, flat washer, insulated gauge block, gauge baffle, under-rail pad, iron pad, insulation plate under iron pad, and pre-embedded sleeves (Fig. 9).
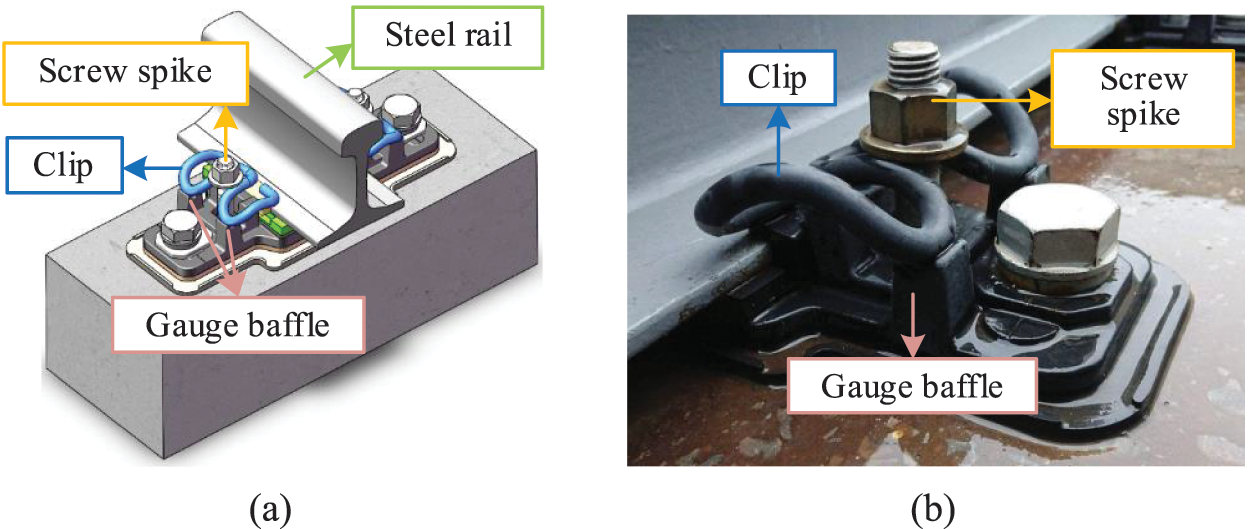
Figure 9: Assembly forms of the fastener system. (a) Fastener assembly image (b) Real fastener image
As shown in Fig. 10a, the stress is highest in the curved section where the rear end of the clip contacts the gauge baffle. The maximum stress reaches 1312 MPa, which is nearly equivalent to the strength of the clip material 60Si2Mn. When the train passes, the movement mode of the clip generally takes on a butterfly shape, resulting in fatigue fracture of the clip. The real broken position of the clip is consistent with the finite element stress analysis result, with the broken position primarily concentrated in the curved section where the rear end of the clip contacts the gauge baffle.

Figure 10: Fastener analysis. (a) Fastener finite element stress analysis result (b and c) Real broken fastener
The detailed process of generating abnormal fastener samples based on the foreground clip region images obtained from Section 2.2 is as follows (Fig. 11):
1) Different broken positions are chosen manually based on the fastener’s force analysis result, and broken positions of the clip are chosen randomly at the same time.
2) The clip region is cropped based on the broken position, or a rotation factor is used to rotate the clip to obtain an abnormal clip.
3) The abnormal clip is combined with the background image to generate abnormal fasteners. In this study, completely missing fastener images are used as background image.

Figure 11: Process of abnormal fastener sample generation
2.3 Fastener State Inspection Model
We propose a fastener state inspection model called Fastener ResNet-8, which is based on a lightweight version of ResNet (Fig. 12). The model can detect four types of fastener states: normal WJ7, normal WJ8, abnormal WJ7, and abnormal WJ8, where abnormal fasteners contain defects such as breakage, loosening, and loss. To improve the classification speed of the network, we design a lightweight classification network, reducing the redundant classification performance. In addition, contextual features are connected and degradation is prevented through skip connection, thereby facilitating better training and optimization of the network and ensuring detection accuracy.

Figure 12: Architecture of fastener ResNet-8
The model mainly consists of an input convolution layer, three residual blocks, and a fully connected layer. The input convolution layer has 64 convolution filters with a size of 3 × 3, stride of 2, and padding of 1. The residual blocks have 64 convolution filters with a size of 3 × 3, stride of 1, and padding of 1, but the first convolution layer in the second and third residual blocks has a stride of 2. The rest of the design follows ResNet-18, including the initial 7 × 7 convolution and max pooling, and the final global average pooling layer and fully connected layer. Compared with the original minimal ResNet-18, Fastener ResNet-8 reduces the number of stacked residual blocks, significantly reducing the parameter calculation and improving the speed of classification prediction. The model is trained using a cross-entropy loss function, which is defined as follows:
where N is the number of training samples, C is the number of classes,
The fastener image acquisition system in this study primarily consists of the linear image acquisition unit and the track inspection beam (Fig. 13). The image acquisition system includes an industrial high-speed linear CCD camera and non-visible light sources. A high-precision speed sensor is installed on the wheelset to achieve synchronized image capture and spatial equidistant sampling with two CCD linear cameras. The main parameters of the image acquisition unit are shown in Table 1.

Figure 13: Image acquisition system
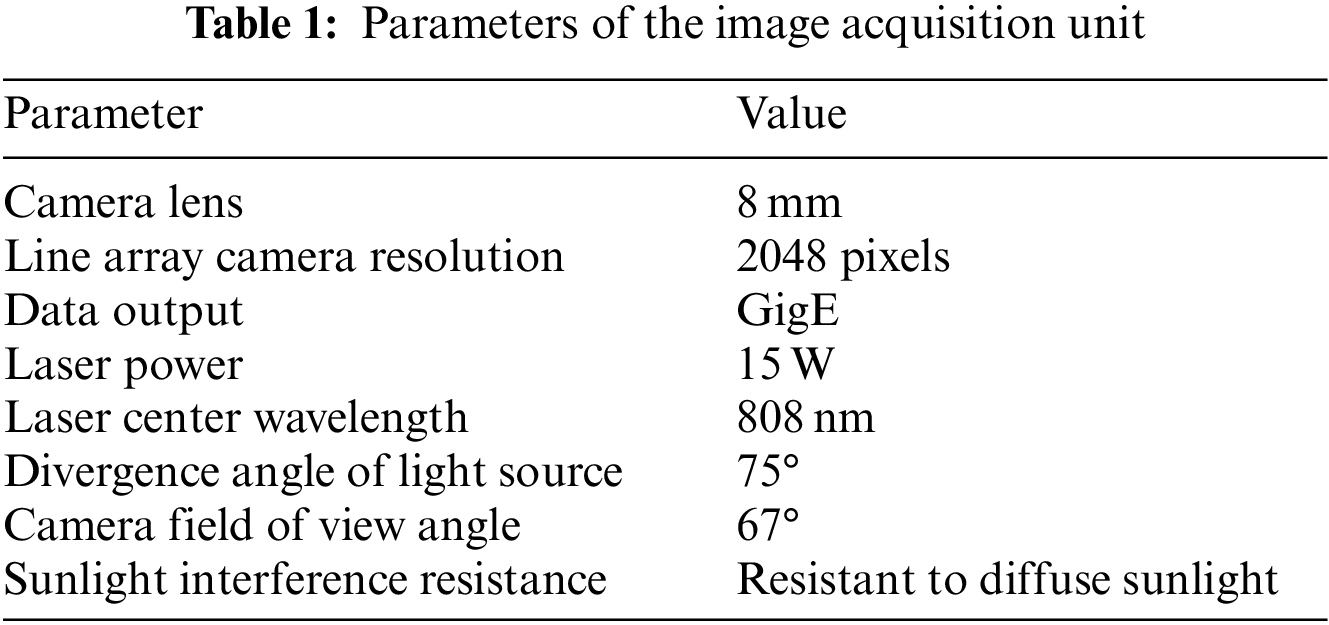
The maximum inspection speed of the track inspection vehicle is about 180 km/h, each image field of view has a size of 1500 mm × 1500 mm, and a single image acquisition unit can capture about 33 images per second, containing about 200 fasteners.
3.2.1 Experimental Environment
To verify the performance of the proposed fastener defect detection method based on data expansion, we conducted experiments on railway fastener region localization, abnormal fastener sample generation based on saliency detection, and fastener state inspection under the same computer hardware configuration (Table 2).

3.2.2 Overall Training Process
The overall training process of this paper is shown in Fig. 14 and can be described as follows:

Figure 14: Overall training process
Step 1: Labelimg software is used to annotate real railway images collected in railway lines, and lightweight YOLOv5s is trained for the fastener localization model.
Step 2: Labelme software is used to annotate the original fastener dataset, and F-SDNet is trained to generate abnormal fasteners.
Step 3: Fastener ResNet-8 is trained with the generated abnormal fastener samples and original fastener images to obtain the fastener state inspection model.
3.3.1 Fastener Localization Dataset
Currently, there is no publicly available dataset of railway fasteners. In this paper, a total of 225 railway images containing WJ7 fasteners and 80 images containing WJ8 fasteners were collected. Table 3 provides detailed information.

This experiment uses the railway images that we collected for training, and the training parameters of YOLOv5s based on sparse training are shown in Table 4. Fig. 15 shows the channel numbers in each layer of the model before and after pruning, with a total of 6294 channels pruned. Table 5 provides a comparison of the model parameters before and after pruning. Following fine-tuning of the pruned model, the parameter count decreased by 76.6%, while the mean average precision (mAP) of model decreased by only 3.2% compared with the value before pruning. The experimental results show that the sparse training and channel pruning strategy used in this section can significantly reduce the model’s parameters and size while improving detection speed, with only a minimal loss in model performance.


Figure 15: Number of channels in each layer of the model before and after pruning

To further validate the performance of our proposed lightweight YOLOv5s, this study conducts comparative experiments with four other object detection methods: Faster-RCNN [44], YOLOv3 [45], Tiny-YOLOv3, YOLOv4 and the original YOLOv5s, where the backbone of Faster-RCNN is ResNet-50 and the backbone of YOLOv3 is Darknet53. The comparative results of the five methods are shown in Table 6.

In the experiments for fastener localization, we evaluate the effectiveness of the proposed method by using the following evaluation metrics: precision, recall, mAP, model size, FPS, and comprehensive evaluation indicator
Therefore, in this paper, we employ lightweight YOLOv5s to accomplish fast localization and segmentation of railway fastener regions. The localization results are shown in Fig. 16.

Figure 16: Results of fastener positioning. (a) WJ7 fasteners. (b) WJ8 fasteners
3.4 Abnormal Fastener Sample Generation Based on Saliency Detection
In this experiment, 1750 fastener images were resized to 512 × 512 × 3 and allocated to the training set, validation set, and test set in an 8:1:1 ratio. We choose the Adam optimizer to train F-SDNet, setting the training to 50 epochs. We set the batch size to 8 because of GPU memory limitations. The learning rate is fixed at 0.001, and we do not incorporate learning rate decay because this strategy can lead to an increase in training error.
To further quantify and compare the performance of our proposed F-SDNet, we introduce MAE, max F-measure (max-Fm), mean F-measure (mean-Fm), max E-measure (max-Em), mean E-measure (mean-Em), S-measure (Sm), AP, and AUC in the saliency detection experiment.
MAE is defined as the difference between predicted saliency map
F-measure, denoted as
where
where
S-measure evaluates the structural similarity between the predicted saliency map and the binary ground truth based on object perception
where
On the basis of the values of true positive rate (TPR) and false positive rate (FPR), an ROC curve can be constructed. The area under the ROC curve is known as the AUC.
3.4.3 Comparisons with State-of-the-Arts
The superiority of the proposed F-SDNet was demonstrated by using seven existing salient object detection methods for visual comparison: BASNet [39], EDRNet [46], EGNet [37], PoolNet [38], R2-Net [47], RESCSFNet [48], and U2-Net [42]. Fig. 17 displays the predicted saliency maps of the fasteners, with the first and ninth rows being abnormal fasteners. The first row represents broken fasteners, while the ninth row represents loose fasteners. The remaining rows are normal fasteners. Evidently, other existing models exhibit poor performance in detecting normal and broken fasteners and fail to detect loose fasteners. In contrast, the predicted saliency maps of F-SDNet are closest to the ground truth, not only accurately identifying the foreground clip region of fasteners but also effectively suppressing background noise with better stability and robustness.

Figure 17: Visual comparison of fastener saliency maps. (a) Source image (b) GT (c) Ours (d) BASNet (e) EDRNet (f) EGNet (g) PoolNet (h) R2-Net (i) RESCSFNet (j) U2-Net
Quantitative comparative experiments were conducted using the evaluation metrics introduced in Section 3.3.2 to further evaluate the effectiveness of the proposed F-SDNet for fastener saliency detection. BASNet, EDRNet, EGNet, PoolNet, R2-Net, RESCSFNet, and U2-Net were compared, as shown in Table 7. Our proposed method consistently achieves the highest scores in all evaluation metrics, providing objective evidence of its superior detection accuracy and segmentation performance. As depicted in Fig. 18, the curves of “Ours” consistently remain above those of other methods in the F-measure curve, E-measure curve, and P-R curve, with the largest S-measure score. This finding indicates that our method’s predicted saliency maps closely match the ground truth.


Figure 18: Evaluation curves on the eight models. (a) F-measure curves (b) E-measure curves (c) PR curves (d) S-measure curves
3.4.4 Abnormal Fastener Sample Generation
With the use of the abnormal fastener sample generation method based on F-SDNet, a total of 6330 abnormal WJ7 fasteners and 1275 abnormal WJ8 fasteners are generated. As shown in Fig. 19, the generated abnormal fasteners include broken and loose ones.

Figure 19: Generated abnormal fastener samples
Among the abnormal fastener samples generated in Section 2.2 and the original fastener samples obtained in Section 2.1, 4000 images were selected as the pre-training dataset, where the ratio of four classes (normal WJ7, abnormal WJ7, normal WJ8, abnormal WJ8) is set to 1:1:1:1 to ensure the balance of sample numbers. The ratio of training set, validation set, and test set is 7:1.5:1.5, i.e., the training set contains 2772 fastener samples; the validation set and test set each contain 614 fastener samples; and the input image sizes for training, validation, and testing are set to 224 × 224 × 3 in this section. The above dataset is fed into Fastener ResNet-8 with the parameter configuration in Table 8 for training to generate the fastener state inspection model, and the training loss function curve is shown in Fig. 20.
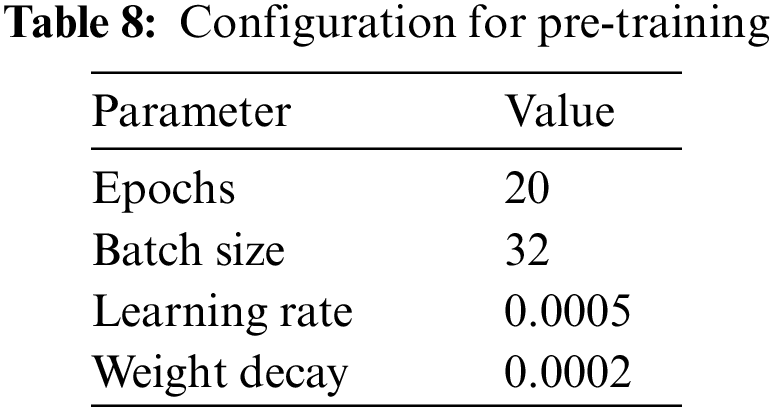

Figure 20: Training loss function curve of Fastener ResNet-8
We compared Fastener ResNet-8 with six state-of-the-art models, using detection accuracy (Acc), FPS, and model size as the evaluation index. The results are shown in Table 9, and Acc is defined as follows:

Our model significantly outperforms the lightweight networks MobileNetv3 [49] and EfficientNetv2 [50] in terms of accuracy. In addition, our model achieves a classification speed of 86.2 f/s, i.e., the detection time for each fastener image is 11.6 ms, surpassing other classification networks. Although the MobileNetv3 model is the smallest in size, it achieves an accuracy of only 47.8% and is unable to accomplish the fastener inspection task.
To verify the detection accuracy of Fastener ResNet-8, we test 614 fastener samples from the test set. As depicted in Fig. 21, the detection accuracy for abnormal fasteners reaches 100%. However, there are prediction errors for normal fasteners, with 2 normal WJ7 fasteners being incorrectly predicted as abnormal WJ7 fasteners and 6 normal WJ8 fasteners being incorrectly predicted as abnormal WJ8 fasteners. These prediction errors fall within an acceptable range, and Fastener ResNet-8 achieves an average accuracy of 98.7%. Thus, satisfactory results were obtained overall.

Figure 21: Classification confusion matrix of Fastener ResNet-8
To further validate the feasibility of our proposed fastener state inspection model in practical applications, we randomly localize and segment 7505 fastener samples from real railway images. These samples are fed into the trained Fastener ResNet-8 model for detection, and the classification results are shown in Table 10 and Fig. 22.


Figure 22: Classification confusion matrix of 7505 real fasteners
As observed from the confusion matrices in Figs. 21 and 22, Fastener ResNet-8 can classify WJ8 fasteners accurately, while a minor classification error occurs in identifying normal WJ7 fasteners. On a total of 6908 normal WJ7 samples, 6907 samples were correctly classified, while one sample was misclassified as an abnormal WJ7 fastener. The misclassified fastener is depicted in Fig. 23. Manual inspection found that the normal fastener is located at the ends of the railway image. The saved images are cropped based on a fixed length because of the continuous capturing of railway images using a linear CCD camera. As a result, incomplete fastener regions are present at the ends of images, which visually resemble broken fasteners, leading to the erroneous classification. In addition, fasteners that are obscured by foreign objects are misclassified as abnormal fasteners but are reclassified after manual review. This paper can detect broken fasteners, loose fasteners and missing fasteners, as shown in Fig. 24.

Figure 23: Misclassified WJ7 fastener

Figure 24: Abnormal fastener detection results. (a and b) broken fasteners (c) loose fastener (d) missing fastener
In real railway scenarios, the occurrence of abnormal fasteners is significantly lower than that of normal fasteners. Imbalanced datasets can affect the stability and accuracy of inspection models. Therefore, we proposed a novel data augmentation-based method for fastener defect detection. This method used a saliency detection network to segment the foreground clip region of fasteners. Then, on the basis of the segmented clips, random cropping, rotation, and background fusion were performed to generate a large number of abnormal fastener samples. Finally, we fed the augmented fastener dataset into the classification model to classify WJ7 and WJ8 fasteners into normal and abnormal states. Experimental results demonstrate the outstanding performance of our fastener defect detection method in imbalanced datasets, achieving remarkable accuracy and speed with strong robustness. It can be applied to various types of fastener detection tasks and has significant theoretical and practical value.
The fastener inspection system in this paper adopts the offline inspection method. First, inspection images are collected using a track inspection vehicle. Then, the collected inspection images are processed using the server in the background. Finally, the inspection results are published after manual review. The limitation of the proposed method is that the detection speed of the fastener state inspection model, Fastener ResNet-8, is 86 frames per second, whereas a single image acquisition unit can collect around 200 fasteners per second. As a result, it cannot meet the demand for real-time detection.
In the future, we will further optimize the inspection model to improve its accuracy and speed to achieve real-time detection. Meanwhile, we will extend the proposed method to research on imbalanced sample defect detection in track surface structures based on deep learning.
Acknowledgement: The authors wish to express sincere appreciation to the reviewers for their valuable comments, which significantly improved this paper. The authors would like to give thanks to the Shanghai University of Engineering Science, for promoting this research and providing the laboratory facility and support.
Funding Statement: This work was supported in part by the National Natural Science Foundation of China (Grant Nos. 51975347 and 51907117) and in part by the Shanghai Science and Technology Program (Grant No. 22010501600).
Author Contributions: The authors confirm contribution to the paper as follows: study conception and design: Shubin Zheng, Yue Wang, Liming Li; data collection: Yue Wang, Liming Li; analysis and interpretation of results: Yue Wang, Xieqi Chen; draft manuscript preparation: Shubin Zheng, Lele Peng, Zhanhao Shang. All authors reviewed the results and approved the final version of the manuscript.
Availability of Data and Materials: Not applicable.
Conflicts of Interest: The authors declare that they have no conflicts of interest to report regarding the present study.
References
1. Kaewunruen, S., Osman, M. H. B., Rungskunroch, P. (2019). The total track inspection. Frontiers in Built Environment, 4, 84. https://doi.org/10.3389/fbuil.2017.00003 [Google Scholar] [CrossRef]
2. Yang, J., Tao, W., Liu, M., Zhang, Y., Zhang, H. et al. (2011). An efficient direction field-based method for the detection of fasteners on high-speed railways. Sensors, 11(8), 7364–7381. [Google Scholar] [PubMed]
3. Feng, H., Jiang, Z., Xie, F., Yang, P., Shi, J. et al. (2014). Automatic fastener classification and defect detection in vision-based railway inspection systems. Proceedings of the IEEE Transactions on Instrumentation & Measurement, 63(4), 877–888. https://doi.org/10.1109/TIM.2013.2283741 [Google Scholar] [CrossRef]
4. Ye, Y. G., Zhu, B., Huang, P., Peng, B. (2022). OORNet: A deep learning model for on-board condition monitoring and fault diagnosis of out-of-round wheels of high-speed trains. Measurement, 199, 111268. https://doi.org/10.1016/j.measurement.2022.111268 [Google Scholar] [CrossRef]
5. Xing, Z. Y., Zhang, Z. Y., Yao, X. W., Qin, Y., Jia, L. M. (2022). Rail wheel tread defect detection using improved YOLOv3. Measurement, 203, 111959. https://doi.org/10.1016/j.measurement.2022.111959 [Google Scholar] [CrossRef]
6. Wang, J., Li, L. M., Zheng, S. B., Zhao, S. G., Chai, X. D. et al. (2022). A detection method of bolts on axlebox cover based on cascade deep convolutional neural network. Computer Modeling in Engineering & Sciences, 134, 1671–1706. https://doi.org/10.32604/cmes.2022.022143 [Google Scholar] [CrossRef]
7. Wei, X. K., Jiang, S. Y., Li, Y., Li, C. L., Jia, L. M. et al. (2019). Defect detection of pantograph slide based on deep learning and image processing technology. IEEE Transactions on Intelligent Transportation Systems, 21(3), 947–958. [Google Scholar]
8. Shang, L., Yang, Q., Wang, J. (2018). Detection of rail surface defects based on CNN image recognition and classification. Proceedings of the 20th International Conference on Advanced Communication Technology, pp. 45–51. Chuncheon, Korea (South). [Google Scholar]
9. Zheng, D. Y., Li, L. M., Zheng, S. B., Chai, X. D., Zhao, S. G. et al. (2021). A defect detection method for rail surface and fasteners based on deep convolutional neural network. Computational Intelligence and Neuroscience, 2021(12), 1–15. [Google Scholar]
10. Gibert, X., Patel, V. M., Chellappa, R. (2017). Deep multitask learning for railway track inspection. Proceedings of the IEEE Transactions on Intelligent Transportation Systems, 18(1), 153–164. https://doi.org/10.1109/TITS.2016.2568758 [Google Scholar] [CrossRef]
11. Wei, X., Yang, Z., Liu, Y., Wei, D., Jia, L. et al. (2019). Railway track fastener defect detection based on image processing and deep learning techniques: A comparative study. Engineering Applications of Artificial Intelligence, 80, 66–81. https://doi.org/10.1016/j.engappai.2019.01.008 [Google Scholar] [CrossRef]
12. Bai, T., Yang, J., Xu, G., Yao, D. (2021). An optimized railway fastener detection method based on modified faster R-CNN. Measurement, 182, 109742. https://doi.org/10.1016/j.measurement.2021.109742 [Google Scholar] [CrossRef]
13. Chandran, P., Asber, J., Thiery, F., Odelius, J., Rantatalo, M. (2021). An investigation of railway fastener detection using image processing and augmented deep learning. Sustainability, 13(21), 12051. https://doi.org/10.3390/su132112051 [Google Scholar] [CrossRef]
14. Xiao, L., Wu, B., Hu, Y. (2021). Missing small fastener detection using deep learning. Proceedings of the IEEE Transactions on Instrumentation and Measurement, 70, 1–9. https://doi.org/10.1109/TIM.2020.3023509 [Google Scholar] [CrossRef]
15. Liu, J., Huang, Y., Wang, S., Zhao, X., Zou, Q. et al. (2022). Rail fastener defect inspection method for multi railways based on machine vision. Railway Sciences, 1(2), 210–223. https://doi.org/10.1108/RS-04-2022-0012 [Google Scholar] [CrossRef]
16. Liu, J., Huang, Y., Zou, Q., Tian, M., Wang, S. C. et al. (2019). Learning visual similarity for inspecting defective railway fasteners. IEEE Sensors Journal, 19(16), 6844–6857. https://doi.org/10.1109/JSEN.2019.2911015 [Google Scholar] [CrossRef]
17. Wang, Y. X., Girshick, R., Hebert, M., Hariharan, B. (2018). Low-shot learning from imaginary data. Proceedings of the IEEE Conference on Computer Vision and Pattern Recognition, pp. 7278–7286. Salt Lake City, UT, USA. https://doi.org/10.48550/arXiv.1801.05401 [Google Scholar] [CrossRef]
18. Yao, D., Sun, Q., Yang, J., Liu, H. C., Zhang, J. et al. (2020). Railway fastener fault diagnosis based on generative adversarial network and residual network model. Shock and Vibration, 2020, 1–15. [Google Scholar]
19. Zagoruyko, S., Komodakis, N. (2015). Learning to compare image patches via convolutional neural networks. Proceedings of the IEEE Conference on Computer Vision and Pattern Recognition, pp. 4353–4361. Boston, MA, USA. https://doi.org/10.1109/CVPR.2015.7299064 [Google Scholar] [CrossRef]
20. Vinyals, O., Blundell, C., Lillicrap, T., Kavukcuoglu, K., Wierstra, D. (2017). Matching networks for one shot learning. Advances in Neural Information Processing Systems, 29. https://doi.org/10.48550/arXiv.1606.04080 [Google Scholar] [CrossRef]
21. Wang, Y. X., Hebert, M. (2016). Learning to learn: Model regression networks for easy small sample learning. Computer Vision–ECCV 2016, pp. 616–634. Amsterdam, The Netherlands, Springer International Publishing. [Google Scholar]
22. Snell, J., Swersky, K., Zemel, R. (2017). Prototypical networks for few-shot learning. Advances in Neural Information Processing Systems, 30, 4077–4087. [Google Scholar]
23. He, K., Zhang, X., Ren, S., Sun, J. (2015). Deep residual learning for image recognition. Proceedings of the IEEE Conference on Computer Vision and Pattern Recognition, pp. 770–778. Las Vegas, NV, USA. https://doi.org/10.48550/arXiv.1512.03385 [Google Scholar] [CrossRef]
24. Li, Y., Trinh, H., Haas, N., Otto, C., Pankanti, S. (2014). Rail component detection, optimization, and assessment for automatic rail track inspection. IEEE Transactions on Intelligent Transportation Systems, 15(2), 760–770. https://doi.org/10.1109/TITS.2013.2287155 [Google Scholar] [CrossRef]
25. Prasongpongchai, T., Chalidabhongse, T. H., Leelhapantu, S. (2017). A Vision-based method for the detection of missing rail fasteners. IEEE International Conference on Signal and Image Processing Applications (ICSIPA), pp. 419–424. Kuching, Malaysia. https://doi.org/10.1109/ICSIPA.2017.8120647 [Google Scholar] [CrossRef]
26. Fan, H. P., Cosman, C., Hou, Y., Li, B. (2018). High-speed railway fastener detection based on a line local binary pattern. IEEE Signal Processing Letters, 25(6), 788–792. https://doi.org/10.1109/LSP.2018.2825947 [Google Scholar] [CrossRef]
27. Wei, X., Wei, D., Suo, D., Jia, L., Li, Y. (2020). Multi-target defect identification for railway track line based on image processing and improved YOLOv3 model. IEEE Access, 8, 61973–61988. https://doi.org/10.1109/ACCESS.2020.2984264 [Google Scholar] [CrossRef]
28. Chen, J., Liu, Z., Wang, H., Núñez, A., Han, Z. (2018). Automatic defect detection of fasteners on the catenary support device using deep convolutional neural network. IEEE Transactions on Instrumentation and Measurement, 67(2), 257–269. https://doi.org/10.1109/TIM.2017.2775345 [Google Scholar] [CrossRef]
29. Qi, H., Xu, T., Wang, G., Cheng, Y., Chen, C. (2020). MYOLOv3-tiny: A new convolutional neural network architecture for real-time detection of track fasteners. Computers in Industry, 123, 103303. https://doi.org/10.1016/j.compind.2020.103303 [Google Scholar] [CrossRef]
30. Redmon, J., Divvala, S., Girshick, R., Farhadi, A. (2016). You only look once: Unified, real-time object detection. Computer Vision & Pattern Recognition, 2016, 779–788. https://www.zhangqiaokeyan.com/academic-conference-foreign_meeting_thesis/0705016000238.html [Google Scholar]
31. Liu, Z., Li, J., Shen, Z., Huang, G., Yan, S. et al. (2017). Learning efficient convolutional networks through network slimming. Proceedings of the IEEE International Conference on Computer Vision, pp. 2736–2744. Venice, Italy. https://doi.org/10.48550/arXiv.1708.06519 [Google Scholar] [CrossRef]
32. Zhu, W., Liang, S., Wei, Y., Sun, J. (2014). Saliency optimization from robust background detection. 2014 IEEE Conference on Computer Vision and Pattern Recognition, pp. 2814–2821. Columbus, USA. https://doi.org/10.1109/CVPR.2014.360 [Google Scholar] [CrossRef]
33. Peng, H., Li, B., Ling, H., Hu, W., Xiong, W. et al. (2017). Salient object detection via structured matrix decomposition. IEEE Transactions on Pattern Analysis and Machine Intelligence, 39(4), 818–832. https://doi.org/10.1109/TPAMI.2016.2562626 [Google Scholar] [PubMed] [CrossRef]
34. Chen, S., Tan, X., Wang, B., Hu, X. (2019). Reverse attention for salient object detection. Proceedings of the European Conference on Computer Vision, pp. 234–250. Munich, Germany. https://doi.org/10.48550/arXiv.1807.09940 [Google Scholar] [CrossRef]
35. Liu, N., Han, J., Yang, M. H. (2018). PiCANet: Pixel-wise contextual attention learning for accurate saliency detection. IEEE Transactions on Image Processing, 29, 6438–6451. https://doi.org/10.48550/arXiv.1812.06314 [Google Scholar] [CrossRef]
36. Wei, J., Wang, S., Huang, Q. (2019). F3Net: Fusion, feedback and focus for salient object detection. Proceedings of the AAAI Conference on Artificial Intelligence, 34(7), 12321–12328. Honolulu, HI, USA. https://doi.org/10.48550/arXiv.1911.11445 [Google Scholar] [CrossRef]
37. Zhao, J. X., Liu, J., Fan, D. P., Cao, Y., Yang, J. F. et al. (2019). EGNet: Edge guidance network for salient object detection. Proceedings of the IEEE/CVF International Conference on Computer Vision, pp. 8779–8788. Seoul, Korea (South). [Google Scholar]
38. Liu, J. J., Hou, Q., Cheng, M. M., Feng, J., Jiang, J. (2019). A simple pooling-based design for real-time salient object detection. Proceedings of the IEEE/CVF Conference on Computer Vision and Pattern Recognition, pp. 3917–3926. Long Beach, CA, USA. [Google Scholar]
39. Qin, X., Zhang, Z., Huang, C., Gao, C., Dehghan, M. et al. (2019). BASNet: Boundary-aware salient object detection. Proceedings of the 2019 IEEE/CVF Conference on Computer Vision and Pattern Recognition (CVPR), pp. 7471–7481. Long Beach, CA, USA. https://doi.org/10.1109/CVPR.2019.00766 [Google Scholar] [CrossRef]
40. Hu, J., Shen, L., Albanie, S., Sun, G., Wu, E. (2018). Squeeze-and-excitation networks. Proceedings of the IEEE Conference on Computer Vision and Pattern Recognition, pp. 7132–7141. Salt Lake City, UT, USA. https://doi.org/10.48550/arXiv.1709.01507 [Google Scholar] [CrossRef]
41. Ronneberger, O., Fischer, P., Brox, T. (2015). U-Net: Convolutional networks for biomedical image segmentation. Medical Image Computing and Computer-Assisted Intervention–MICCAI 2015, pp. 234–241. Munich, Germany, Springer International Publishing. [Google Scholar]
42. Qin, X., Zhang, Z., Huang, C., Dehghan, M., Zaiane, O. R. et al. (2020). U2-Net: Going deeper with nested U-structure for salient object detection. Pattern Recognition, 106, 107404. https://doi.org/10.1016/j.patcog.2020.107404 [Google Scholar] [CrossRef]
43. Woo, S., Park, J., Lee, J. Y., Kweon, I. S. (2018). CBAM: Convolutional block attention module. Proceedings of the European Conference on Computer Vision (ECCV), pp. 3–19. Munich, Germany. [Google Scholar]
44. Ren, S., He, K., Girshick, R., Sun, J. (2017). Faster R-CNN: Towards real-time object detection with region proposal networks. IEEE Transactions on Pattern Analysis and Machine Intelligence, 39(6), 1137–1149. https://doi.org/10.1109/TPAMI.2016.2577031 [Google Scholar] [PubMed] [CrossRef]
45. Redmon, J., Farhadi, A. (2018). YOLOv3: An incremental improvement. Salt Lake City, UT, USA. [Google Scholar]
46. Song, G., Song, K., Yan, Y. (2020). EDRNet: Encoder–decoder residual network for salient object detection of strip steel surface defects. IEEE Transactions on Instrumentation and Measurement, 69(12), 9709–9719. https://doi.org/10.1109/TIM.2020.3002277 [Google Scholar] [CrossRef]
47. Feng, M., Lu, H., Yu, Y. (2020). Residual learning for salient object detection. Proceedings of the IEEE Transactions on Image Processing, 29, 4696–4708. https://doi.org/10.1109/TIP.2020.2975919 [Google Scholar] [PubMed] [CrossRef]
48. Gao, S. H., Tan, Y. Q., Cheng, M. M., Lu, C. Z., Chen, Y. P. et al. (2020). Highly efficient salient object detection with 100 K parameters. European Conference on Computer Vision, pp. 702–721. Cham: Springer International Publishing. [Google Scholar]
49. Howard, A., Sandler, M., Chu, G., Chen, L. C., Chen, B. et al. (2019). Searching for MobileNetV3. Proceedings of the IEEE/CVF International Conference on Computer Vision, pp. 1314–1324. Seoul, Korea (South). [Google Scholar]
50. Tan, M., Le, Q. V. (2021). EfficientNetV2: Smaller models and faster training. International Conference on Machine Learning, pp. 10096–10106. PMLR. [Google Scholar]
51. Krizhevsky, A., Sutskever, I., Hinton, G. E. (2017). ImageNet classification with deep convolutional neural networks. Communications of the ACM, 60(6), 84–90. https://doi.org/10.1145/3065386 [Google Scholar] [CrossRef]
52. Szegedy, C., Liu, W., Jia, Y., Sermanet, P., Reed, S. et al. (2015). Going deeper with convolutions. Proceedings of the IEEE Conference on Computer Vision and Pattern Recognition, pp. 1–9. Boston, MA, USA. https://doi.org/10.48550/arXiv.1409.4842 [Google Scholar] [CrossRef]
Cite This Article
 Copyright © 2024 The Author(s). Published by Tech Science Press.
This work is licensed under a Creative Commons Attribution 4.0 International License , which permits unrestricted use, distribution, and reproduction in any medium, provided the original work is properly cited.
 Downloads
 Citation Tools