
 Submit a Paper
 Propose a Special lssue
 Open Access
ARTICLE

Stroke Risk Assessment Decision-Making Using a Machine Learning Model: Logistic-AdaBoost
1 School of Science, Wuhan University of Technology, Wuhan, 430070, China
2 Wuhan University of Technology Hospital, Wuhan University of Technology, Wuhan, 430070, China
* Corresponding Author: Tingting Huang. Email:
Computer Modeling in Engineering & Sciences 2024, 139(1), 699-724. https://doi.org/10.32604/cmes.2023.044898
Received 11 August 2023; Accepted 28 September 2023; Issue published 30 December 2023
 View Full Text
 Download PDF
Abstract
Stroke is a chronic cerebrovascular disease that carries a high risk. Stroke risk assessment is of great significance in preventing, reversing and reducing the spread and the health hazards caused by stroke. Aiming to objectively predict and identify strokes, this paper proposes a new stroke risk assessment decision-making model named Logistic-AdaBoost (Logistic-AB) based on machine learning. First, the categorical boosting (CatBoost) method is used to perform feature selection for all features of stroke, and 8 main features are selected to form a new index evaluation system to predict the risk of stroke. Second, the borderline synthetic minority oversampling technique (SMOTE) algorithm is applied to transform the unbalanced stroke dataset into a balanced dataset. Finally, the stroke risk assessment decision-making model Logistic-AB is constructed, and the overall prediction performance of this new model is evaluated by comparing it with ten other similar models. The comparison results show that the new model proposed in this paper performs better than the two single algorithms (logistic regression and AdaBoost) on the four indicators of recall, precision, F1 score, and accuracy, and the overall performance of the proposed model is better than that of common machine learning algorithms. The Logistic-AB model presented in this paper can more accurately predict patients’ stroke risk.Keywords
As basic public services in a country, the quality and level of medical and health services have an important impact on people’s health. The continuous improvement in the extent of medical and health services is also a key factor in promoting the sustainable development of the medical and health industry. The rise and development of artificial intelligence and big data have provided a strong boost to improve medical and health services. Aligned with artificial intelligence and big data, providing personalized, intelligent assistance to medical and digital diagnosis technology not only improves diagnostic accuracy and efficiency but also reduces operating costs and increases economic benefits, promoting the sustainable development of the medical and health industry. Considering this, this paper is committed to studying intelligent, assisted medical treatment and digital diagnosis technology for stroke and proposes a method based on machine learning to assist the clinical diagnosis of stroke to provide more accurate, efficient and intelligent support for its clinical diagnosis.
Stroke, also called cerebrovascular accident, is a type of disease in which brain tissue is damaged due to the sudden rupture or blockage of a blood vessel in the brain, preventing blood flow to the brain. Stroke, as a chronic noncommunicable disease, is very harmful, and its prevalence and mortality rate continue to rise. Stroke has become a serious health hazard worldwide. The incidence, recurrence, disability and mortality rates of stroke patients are very high, greatly reducing patient quality of life [1]. In China, two out of every five people die of cardiovascular disease. It is projected that approximately 330 million people currently suffer from stroke, with 13 million stroke patients [2], which represents the second largest group of patients among the total number of patients with cardiovascular diseases. Early prevention is very important because stroke is irreversible, not easy to cure, the cost of care is high, and the medical burden is increasing. However, many patients do not benefit from early treatment, which is usually because they do not know the symptoms of stroke, do not find emergency treatment or do not have an emergency response. There are many factors affecting the development of stroke, and some studies have pointed out that age, heart disease, diabetes mellitus, hypertension, sex, dyslipidemia and poor lifestyle habits are all factors contributing to an increased risk of stroke [3,4].
There is no specific method for treating stroke, but we can accurately predict the risk of stroke and implement early prevention and early intervention. Thus, stroke risk assessment is of great significance in preventing, reversing and reducing the spread and health hazards of stroke. The early detection and prevention of stroke can accurately identify early and potential stroke patients in advance and accurately control their conditions in a targeted manner, effectively preventing the vast development of stroke and improving the quality of life of patients. In addition, the early detection and prevention of stroke can effectively identify the main pathogenic factors of stroke for hierarchical management and early intervention in high-risk groups to reduce the risk of disease, which has important practical significance for the intelligent prevention and treatment of stroke.
With the constant accumulation of medical data and the continuous development of machine learning algorithms, machine learning has entered the field of medicine, where large amounts of data provide training support for machine learning as well as new methods for discovering disease patterns [5]. Machine learning methods process data efficiently and mine it for hidden patterns. These excellent algorithmic features can find the source and related attributes of a disease better and faster, leading to disease diagnosis and prediction.
The research on stroke risk assessment has been very intensive, but there are still some issues in the context of the existing work. First, the evaluation indices for stroke risk assessment are not uniform enough, and there are no clear specifications, which easily leads to certain models performing well when all of the evaluation indices are present. However, once some of the indices are missing or replaced, the assessment produced by the model will be greatly compromised. Second, there is a serious imbalance in the stroke dataset, and related studies have performed stroke risk assessment without a providing good solution to solving this problem. Some of the studies in the literature simply increase the sample size in a few categories. However, when the sample size of two dataset categories differs greatly, simply increasing the sample size of a few categories will lead to overfitting and is prone to generating spurious relationships. Some literature sources account for unbalanced datasets in ways that are too cumbersome, which will improve the classification effect of the model but has little value in practical applications. Finally, there is the issue of the accuracy of the model’s assessment. Related studies usually single out a certain machine learning algorithm for training and then finally compare the results with those of other machine learning algorithms to conclude that a certain algorithmic model is suitable for stroke risk assessment. Single algorithmic models are more or less flawed, which is caused by that algorithm itself and is difficult to avoid. Thus, assessing stroke incidence risk using these single algorithms may not being less accurate, but the accuracy is not too high either. Moreover, these models are usually compared with only 2–3 common machine learning algorithms and not with the rest of the algorithmic models, making the results not very convincing. Considering this, this paper aims to establish a stroke assessment model based on machine learning that can effectively reduce the risk of citizens suffering from the onset of stroke by using a number of methods to find the influencing factors associated with stroke and then constructing an integrated model to assess stroke risk. Compared to the literature, the main contributions of this paper are summarized as follows:
(1) A new index system of stroke risk assessment is constructed. CatBoost is used to perform feature selection for all features of stroke, and the importance ranking of all features of stroke disease is determined. The index system screened by using the feature selection method of CatBoost is not only representative but also more common, which is conducive to promotion.
(2) Borderline SMOTE is applied to transform the unbalanced stroke dataset into a balanced dataset, which solves the defect of fuzzy boundaries after generating new samples by using the SMOTE algorithm.
(3) A new Logistic-AB model is developed to predict the risk of stroke. The model not only improves upon traditional logistic regression but also takes the output of AdaBoost as a reference to prevent obvious misclassification in logistic regression, which further improves classification. After comprehensive comparison with other models, the Logistic-AB model proposed in this paper is more predictive and more suitable for evaluating the risk of diseases.
The structure of the rest of this paper is as follows: Section 2 gives a literature review; Section 3 designs the stroke evaluation index system; Section 4 proposes a new stroke risk assessment decision-making model (Logistic-AB) based on machine learning; Section 5 provides an empirical analysis of stroke risk assessment; and Section 6 summarizes the whole paper systematically, points out the shortcomings and puts forward the prospects.
In the research area of stroke risk prediction, Manuel et al. [6] suggested using patient self-reported information to accurately predict the health behaviors of patients with sudden stroke, and this information can be combined with the results from a survey of population health to predict the risk of individual stroke, which can be used to project the health of the population or to issue certain stroke prevention measures for the patients. Lumley et al. [7] developed a new stroke prediction model for Americans that used an interactive Java application for risk prediction to predict the factors associated with stroke. They used the model to empirically analyze a patient and determine their risk of stroke over a five-year period. In addition, foreign studies have evaluated the prediction model with the help of the calculated AUC; for example, in an improvement to the Framingham stroke scale, the area under curve (AUC) was determined to be 0.726 for males and 0.656 for females [8]. Domestic studies have also used this method, and the results obtained were similar to those from other countries. The area under the receiver operating characteristic (ROC) curve of the pooled queuing equation was 0.713 for males and 0.818 for females [9]. Moreover, a stroke risk calculator predicted the risk of stroke over 5–10 years, but not at an age less than 20 years, and the performance of the model for males and females was 0.740 and 0.715, respectively, as determined by the AUC [10,11]. In addition, by analyzing the factors influencing the onset of stroke, the impact of education has been used abroad to control the factors contributing to the onset of the disease, thus achieving “prevention of the disease before it occurs”. The current system of disease prevention, control and health care delivery in China has not identified a cause for the high mortality rate of stroke.
Ten years ago, academics used simple mathematical formulas for stroke risk prediction due to the small amount of available data. Currently, with the improvements in data collection techniques and computer data processing capabilities, researchers have begun to use advanced methods, such as multiple linear regression and neural networks, to process historical data with certain results. Although this method combines multiple nonlinear complexities, the accuracy is low and suboptimal. Taking the study of Sun et al. [12] on stroke patients as an example, the risk factors for the occurrence of stroke were obtained through retrospective statistics, which are highly representative. Aslam et al. [13] studied the etiology and risk factors for stroke in young adults, and the research results showed that common risk factors for ischemic stroke in the local young population included hypertension, diabetes mellitus and smoking. Wang et al. [14] applied a novel metaCCA method to identify the risk genes for stroke that may overlap with seven correlated risk factors, including atrial fibrillation, hypertension, coronary artery disease, heart failure, diabetes, body mass index, and total cholesterol level. By empirical analysis, Asowata et al. [15] concluded that the main factors causing stroke are hypertension, dyslipidemia, diabetes mellitus, and a family history of cardiovascular disease.
With the constant advancements in science, researchers have begun to apply mathematical statistics to disease prediction models, which has led to quantitative predictions of disease progression. Currently, simple mathematical models based on statistical theory are mainly used to predict trends of disease development [16]. Disease patterns are approximated by using methods such as regression, and calculations and predictions are made with the help of statistical analysis software. Researchers have proposed a variety of models to predict chronic disease pathogenic factors, risk factors, and treatment strategies and have achieved significant results in practical application [17]. A widely used model for predicting the 10-year risk of ischemic cardiovascular disease [18] has gained acceptance in the medical community. However, this model treats coronary heart disease and stroke as the same disease for the prediction, rather than creating a stroke-only prediction model. In clinical practice, it is most common to use algorithms based on Bayesian networks or neural networks to build different predictive models for diseases. Wang et al. [19] used decision trees to develop a risk prediction model for hemorrhagic transformation in acute ischemic stroke. Xu et al. [20] used factor analysis and logistic regression to conclude that the incidence of stroke in Dali was associated with blood glucose, age and sex. Xu [21] performed a screening to obtain the factors influencing the development of progressive ischemic stroke by comparison and logistic regression analysis. Other studies have used Cox regression model analysis to obtain the risk factors affecting the development of stroke, but the results were not accurate enough because of the small number of cases due to long intervals between the pre- and postvisits, resulting in many lost visits [22,23]. In addition, efforts have been made in China to prevent stroke early, but the outcomes have been less than satisfactory. For example, the Prediction for ASCVD Risk in China (China-PAR) model, developed by Gu Dongfeng et al., has attracted much attention in China as an atherosclerotic cardiovascular disease (ASCVD) risk prediction tool [24]. This model has high prediction accuracy among the Chinese population, but it mainly focuses on the prediction of cardiovascular diseases. Benameur et al. [25] compared the performance of three parametric imaging techniques (covariance analysis and parametric imaging based on Hilbert transform and that based on the monogenic signal) used in cardiac MRI for the regional quantification of cardiac dysfunction, and the three approaches were evaluated using cine-MRI frames acquired from three planes of view.
With the in-depth application of big data, stroke risk prediction methods based on machine learning have become the focus of research in recent years [26], because their superior algorithms can identify the source of morbidity and the related attributes faster and more accurately and provide strong support for subsequent precision medicine [27]. For example, Kumar et al. [28] applied curve fitting and an artificial neural network (ANN) to model the condition of patients to determine whether a patient is suffering from heart disease. Chang et al. [29] used machine learning algorithms to predict the risk of stroke incidence in Jiangxi and established two models, a support vector machine model and a plain Bayes model, and found that the support vector machine performed better after comparing the results. Yu et al. [30] used decision trees, multilayer perceptron and convolutional networks in machine learning to compare the prediction results with the results from traditional multifactorial logistic regression and finally found that convolutional neural networks have higher accuracy in stroke risk prediction. Arif et al. [31] developed a Lasso-logistic regression model that can manage SARS-CoV-2 infections of varying severity (severe, moderate, and mild) by using machine learning, and the results showed that the number of deaths has been reduced thanks to the established prediction method that enables early detection in patients across these three severity levels.
However, one of the problems machine learning faces in stroke research is how unbalanced data should be analyzed, and the general idea has been to reconstruct the dataset. For this, a combination of oversampling, under-sampling and SMOTE algorithms can be used [32–34]. Combining the active learning support vector machine (SVM) algorithm and SMOTE algorithm [35] can provide a good solution to the problem of unbalanced datasets. On this basis, Xu et al. [36] proposed an improved synthetic minority oversampling technique (ISMOTE) algorithm from the perspective of oversampling, which improves the classification performance of unbalanced datasets. Tao et al. [37] integrated the idea of negative immunity to generate artificial minority class samples, which can offer a good solution to the problem of underrepresentation of minority class samples. The problem of SVM classification bias can be effectively improved by integrating cost-sensitive learning, oversampling and under-sampling [38,39]. In the problem of breast cancer data classification, Wang et al. [40] used a combination of SMOTE, particle swarm optimization and the C5.0 algorithm in their research and found that this method can significantly improve the classification effect. In addition, Sun et al. [41] observed that using the SMOTE algorithm can effectively solve the problem of unbalanced data. The above methods mainly focus on small datasets and do not consider the processing methods for large datasets.
Based on existing research and aiming to objectively predict and identify of stroke, this paper proposes a new stroke risk assessment decision-making model based on machine learning named Logistic-AdaBoost (Logistic-AB). First, this paper preliminarily screens the stroke-related influencing factors, uses the CatBoost method to further select the initial screening indices to obtain the final indices, and constructs a new index system for stroke assessment. Second, the borderline SMOTE algorithm is used to balance the data, which can solve the defects of fuzzy boundaries after the generation of new samples by the SMOTE algorithm. Finally, after learning the common stroke risk assessment models, this paper proposes a stroke risk assessment decision-making model named Logistic-AB and uses 10 homogeneous machine learning algorithms to evaluate the overall prediction performance of this new model.
3 Construction of the Stroke Evaluation Index System
This section begins with the preprocessing of the collected data and correlation analysis to obtain the influential factors related to stroke. Then, the criteria for constructing the evaluation index system are elaborated and preliminary screening indicators are provided, which helps to more intuitively and comprehensively understand the relevant factors affecting the incidence of stroke. Finally, the CatBoost feature selection method is used to filter the preliminary screening indicators to obtain the final stroke risk assessment index system.
The data in this paper are acquired from the publicly available dataset Kaggle 2021 (https://www.kaggle.com/datasets/fedesoriano/stroke-prediction-dataset). First, we examine the dataset find that only the body mass index data had missing values; its overall distribution is shown in Fig. 1. Fig. 1 shows that the body mass index data tended to be normally distributed, so the median is used to fill in the missing data. Then, we review the dataset for outliers. Through observation, we find that there is only one outlier in the data for the attribute of sex, so it is directly removed.
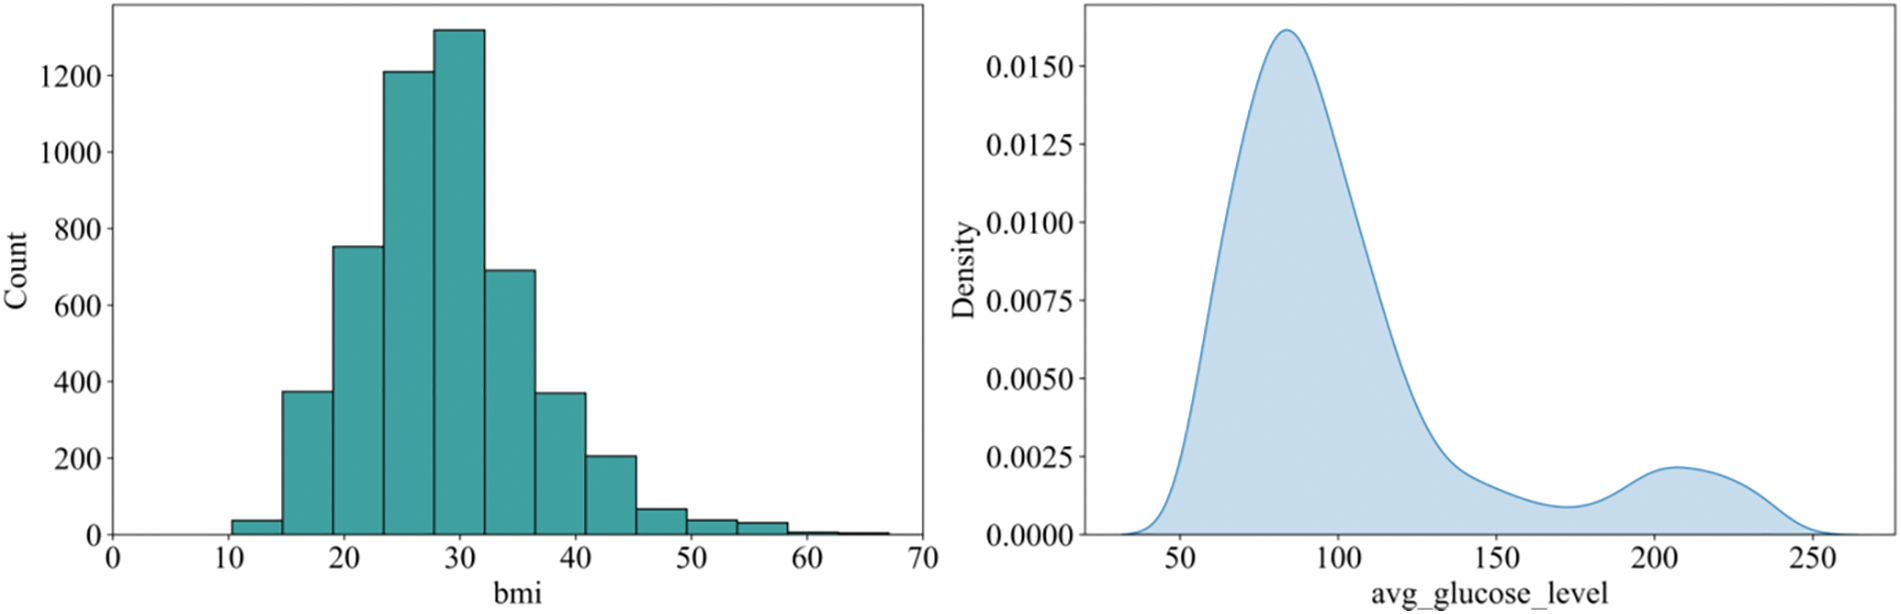
Figure 1: Distribution of body mass index and log blood glucose levels
In addition, considering the large difference between the extreme values of the average blood glucose value, the data show an obvious right-skewed trend, so the extreme outliers are deleted. However, we find that the average blood glucose values still remain heavily right-skewed, so we take the logarithm of all the average blood glucose values. Finally, we find that the processed data fluctuate less and that the distribution tends to be more normal, as shown in Fig. 1.
3.2 Criteria for Selecting the Relevant Features for Prediction
The following criteria are given to select the relevant features for stroke risk assessment decision-making:
Systematic principle: There should be a certain logical relationship between the indicators, which should not only be related to stroke but also have an internal relationship among themselves.
Principle of typicality: Evaluation indicators should have a certain typical representation, so the number of indicators should not only be as small as possible but also fully and comprehensively reflect the risk of stroke.
Dynamic principle: With the continuous improvement of technology, influencing factors related to stroke will continue to be discovered. Therefore, stroke risk assessment should be a dynamic concept, and the selection of indicators should have dynamic variability.
Simple and scientific principle: The selection of indicators should follow a scientific basis, neither too much nor too little, which can objectively and truly reflect the risk of stroke. Moreover, indicator data should be easy to obtain and simple to calculate.
Quantifiability principle: There are many factors affecting stroke, and the selected indicators should be quantified as much as possible to facilitate subsequent data analysis.
Practicality principle: When selecting features, we should consider whether it is practical and whether more common and understandable indicators should be chosen while trying to avoid obscure and infrequently used indicators.
3.3 Preliminary Screening Indicators
To construct a scientific and reasonable evaluation index system, the evaluation indices selected should be considered from various aspects. The risk factors for stroke vary from region to region depending on the population, but it is generally agreed that the main risk factors should meet the following criteria [42]. First, the risk factor exists in a large number of people. Second, the risk factor has a significant independent effect on the risk of stroke. Finally, the risk of the onset of the disease can be reduced through treatment and prevention. After reviewing the relevant literature [43–47], the following initial screening indicators are selected in this paper:
(1) Age
Uncontrollable factors such as sex and age are factors that influence the occurrence of cardiovascular disease (CVD), and the risk of cardiovascular disease usually increases with age. Studies have shown that men are generally more likely to develop CVD than women, but this difference decreases with age, and the sex difference in CVD recurrence rates also decreases [43].
(2) Hypertension
One of the major risk factors for stroke is high blood pressure, which stimulates the development of cerebral atherosclerosis. In the atherosclerotic region, the vessel wall becomes thicker, the lumen becomes narrower or the plaque ruptures to form a thrombus, causing conditions, such as cerebral arterial blockage, that can result in cerebral ischemia or stroke. Statistically, the effective control of blood pressure can reduce the prevalence of stroke in patients by 50% [44].
(3) Heart disease and blood sugar levels
Heart disease and blood glucose levels are also important factors that influence the incidence of stroke, and in general, the risk of stroke in patients with heart disease exceeds the risk of individuals without heart disease by more than twofold; moreover, high blood glucose levels also increase the risk of stroke. According to a previous study, there is a significant difference between the prevalence of stroke and the prevalence of heart disease (
(4) Type of work, marital status and place of residence
Different types of work, marital statuses, and living places bring different stresses to people, such as if they have been engaged in high-intensity work for a long time, living in a depressing place for a long time, or facing various problems in their marriage, which will increase stress levels and make individuals more prone to diseases. Some studies have shown that the incidence of stroke also varies in different occupational groups [46].
(5) Smoking and body mass index
Cigarettes contain many toxic components, such as nicotine and carbon monoxide. Moreover, smoking can lead to increased blood viscosity and hypoxia in the cells lining the blood vessels and contribute to atherosclerosis, thus increasing the prevalence of stroke. Additionally, the higher the body mass index (BMI) is, the higher the prevalence of stroke is [47].
The evaluation indices for stroke risk assessment in the initial screening of this paper are shown in Table 1.
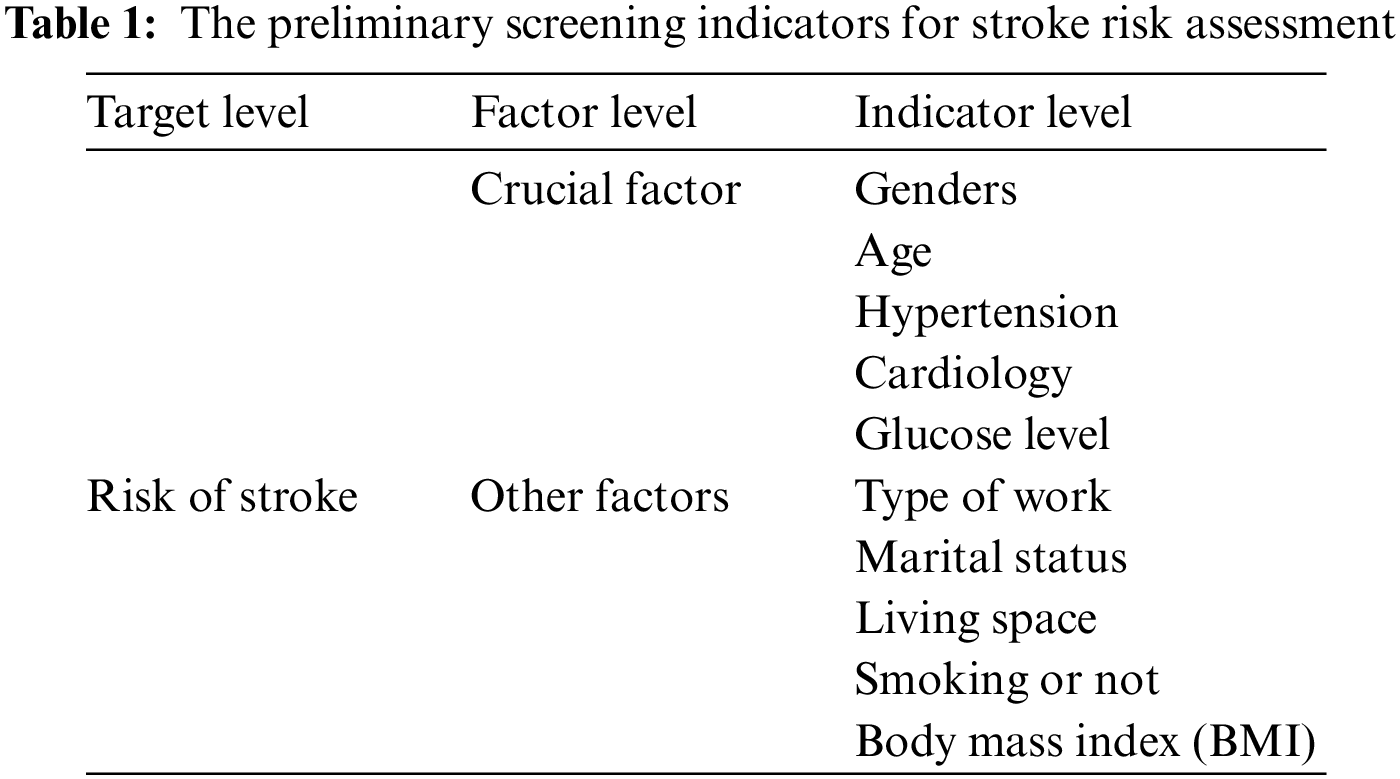
As the indicators in the initial screening may have a higher correlation, the model will appear to have multiple covariants. Although the assessment can also produce good results without processing, the practical significance is not very large, so the correlation of the indicator data needs to be tested first. From Fig. 2, it can be seen intuitively which characteristics are better correlated with stroke, which are age, high blood pressure, heart disease, marital status, average blood glucose level and body mass index. While age, type of work and marital status had higher correlations, it can be determined that the initial screening indicators need to be further screened.
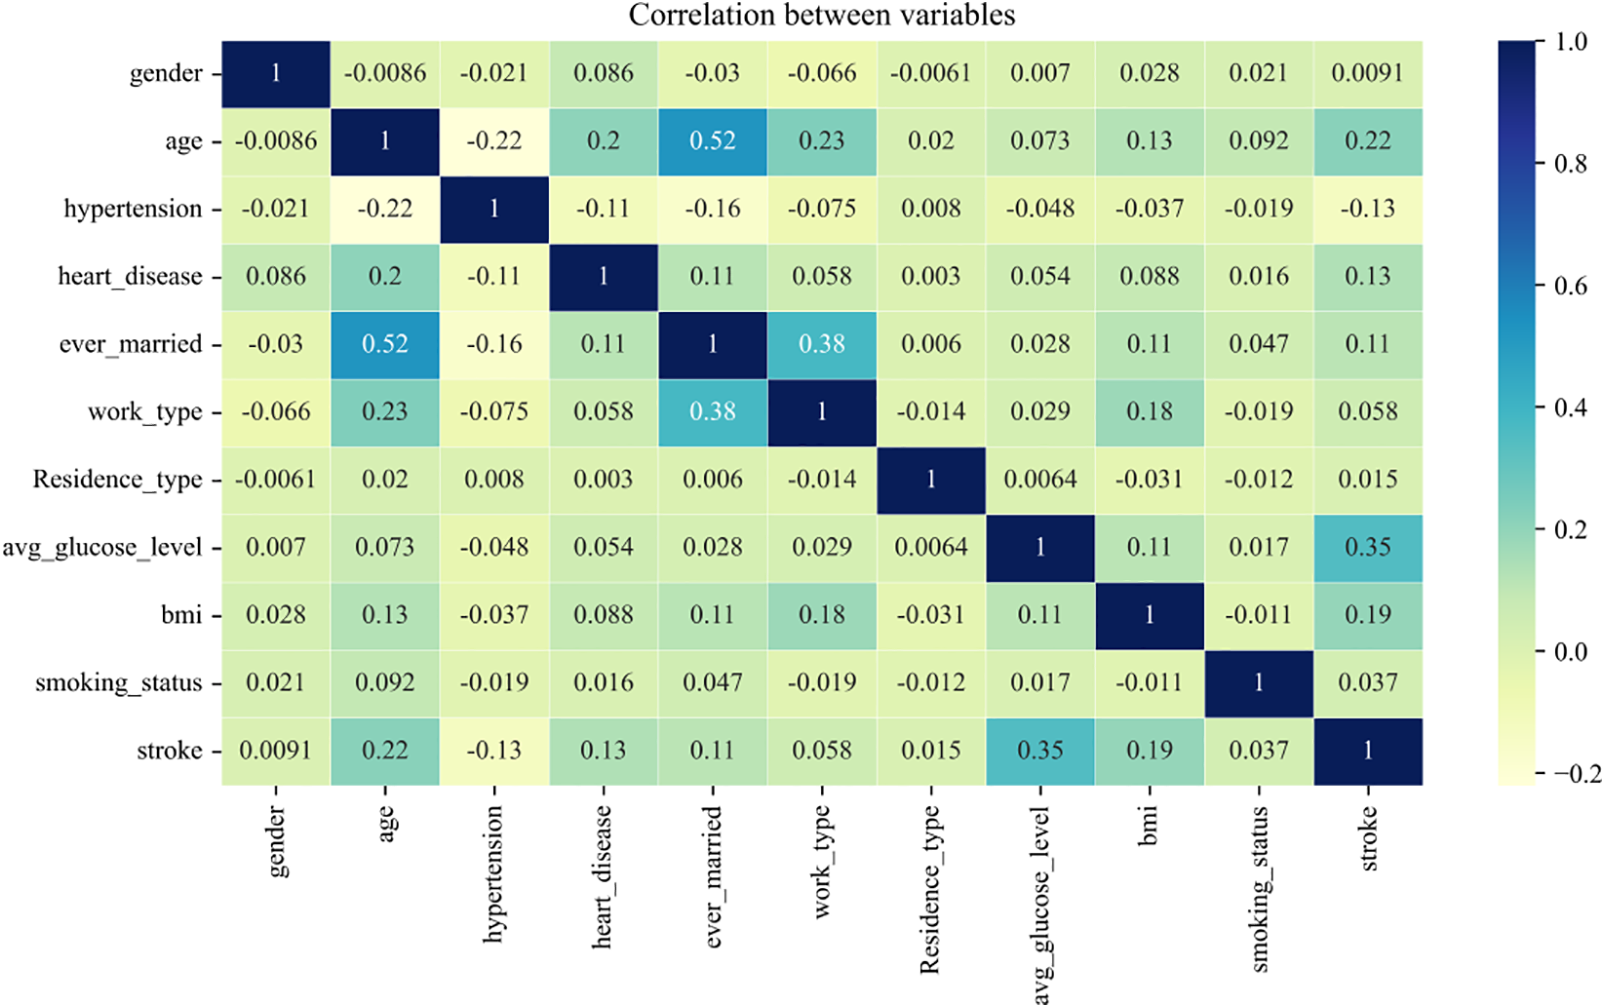
Figure 2: Correlation coefficients of initial screening indicators
3.4 Feature Selection by CatBoost
Based on the above, it is found that there is a correlation between the indicators, so this paper further screens the indicators after the initial selection. Feature selection [48–50], also known as feature subset selection (FSS) or attribute selection, selects N features (N < M) from the existing M features to reduce the dimensionality of the dataset. Machine learning often suffers from overfitting, and to address this, four methods are usually considered, such as collecting more data. To reduce complexity, the complexity penalty can be introduced by using regularization methods. In addition, simple models with fewer parameters or dimensionality reduction of the data (e.g., feature selection) can be considered. Of these, the first is difficult to implement, and thus, the second and fourth methods are usually used. Feature selection generally includes filter, wrapper, and embedded methods.
The filtered approach (see Fig. 3) evaluates the importance of each feature independently during the feature selection process, regardless of the training process of the model. This approach uses some statistical methods or information theoretic techniques to measure the degree of association or importance of each feature with the target variable. Some of the commonly used filtering methods include mutual information, information gain, analysis of variance (ANOVA) and the chi-square test. These methods select important features based on the magnitude of the measure by calculating some measure between the feature and the target variable. The advantage of filtered methods is that they are simple and fast to use, but they ignore the correlation between features.

Figure 3: Filtration
The wrapper approach embeds feature selection into the model training process and evaluates the importance of features by iteratively selecting different subsets of features and training the model, as shown in Fig. 4. This approach uses the performance of the model directly as the criterion for feature selection, which is more similar to the application scenario of the final model. Common wraparound approaches include recursive feature elimination (RFE) [51,52] and genetic algorithms [53,54] based on feature selection. RFE is an iterative approach that starts with all features, then removes one or more of the less important features at a time, and then trains the model and evaluates its performance. This process is performed iteratively until a specified number of features or optimal performance is reached. The advantage of the wrapped approach is that it can take into account the correlation between features, but the computational complexity is higher because it requires repeated training of the model.

Figure 4: Packaging method
The embedded approach embeds feature selection into the model training process and selects features through the model’s own feature importance assessment, as shown in Fig. 5. This approach considers the contribution of features and the quality of splitting them during the training process of the model and ranks the features according to these metrics.

Figure 5: Embedding method
CatBoost [55,56] is an algorithm based on a gradient boosting decision tree that calculates feature importance scores during the training process of each tree. These scores can reflect the extent of the contribution of each feature to the model performance. The get_feature_importance method provided by CatBoost can be used to obtain the feature importance score. The core rationale of CatBoost is gradient boosting, an ensemble learning method that constructs a strong classifier by combining multiple weak classifiers, where each weak classifier is trained on the residual of the previous weak classifier. In this way, each weak classifier can focus on solving problems that the previous weak classifier could not solve, thereby gradually improving the performance of the entire model. Another important feature of CatBoost is its ability to automatically process class features. In the traditional gradient lifting algorithm, the category features need to be processed by one-hot encoding, which leads to a sharp increase in the dimension of the feature space, thus increasing the model complexity and training time. CatBoost uses a sort-based approach to class features that converts class features into numerical features, avoiding the problem of unique thermal coding.
Compared with the algorithms of gradient boosting decision tree (GBDT), eXtreme Gradient Boosting (XGBoost), and Light Gradient Boosting Machine (LightGBM), the CatBoost algorithm has many advantages, but the most helpful in the identification of important features related to stroke risk are the following two. (i) Processing of type features. This allows us to consider not being concerned with type features through feature engineering before training the model. (ii) Predictive offset processing. This can reduce the overfitting of the model and improve the prediction effect of the model.
Under the CatBoost framework, the following methods can be used for feature selection:
1) Control the process of feature selection by tuning the model parameters, e.g., setting one_hot_max_size to limit the dimensionality of the one-hot encoded features or using colsample_bylevel and colsample_bytree to control the proportion of features sampled in each tree.
2) Use the get_feature_importance method to obtain the importance score of each feature and perform feature ranking and selection based on this score.
3) CatBoost can be combined with other feature selection methods, such as filtering or wrapping methods, to filter a specific subset of features.
CatBoost can be expressed as:
where
where
The algorithm pseudo code is shown below:

The preliminary screening indicators for stroke risk assessment determined from the above process are shown in Fig. 6. The indicators affecting whether or not one will have a stroke are ranked as follows: age, body mass index, blood glucose level, high blood pressure, heart disease, marital status, type of work, smoking status, place of residence, and sex. In view of the small number of characteristics in the sample, in this paper, place of residence and sex are deleted, and the remaining eight characteristics are used as the main influencing factors of stroke. Therefore, the final indicator system constructed in this paper consists of age, body mass index, blood glucose level, high blood pressure, heart disease, marital status, type of work and smoking status.

Figure 6: CatBoost feature selection results
The insights into the 8 selected indicators used to construct the index evaluation system for stroke risk prediction are as follows. Age is one of the most important factors, suggesting that the risk of stroke increases with age. Body mass index and blood glucose level are also very important indicators, which suggests that obesity and high blood glucose are among the major risk factors for stroke. High blood pressure and heart disease are also more important characteristics, which is in line with previous findings. In addition, it was found that marital status and type of job were also strongly associated with the risk of stroke, which may be due to the effects of marital and job stability on physical and mental health. Finally, smoking is another important factor, as it can lead to vasoconstriction and increase the risk of stroke. Based on these results, this paper suggests that these major influencing factors should be the focus for the prevention and treatment of stroke. In addition, more frequent examinations and monitoring, as well as appropriate lifestyle modifications and pharmacological measures to reduce the incidence of stroke, are recommended for those that are high risk.
4 Stroke Risk Assessment Model
In this section, based on the evaluation indices selected in Section 3, first, borderline SMOTE is used to balance the data, and second, a new fusion model is proposed to assess the risk of stroke incidence based on the theories of Logistic and AdaBoost algorithms, denoted as the Logistic-AB model in this paper. Moreover, the results from the test of this model are compared with the results from ten machine learning algorithms.
In practice, many industries collect data with unbalanced characteristics. Existing algorithms perform better for majority class data processing than for minority class data processing, so there is a need to improve the classification of minority class data for prediction. In actuality, the number of stroke patients is much lower than the number of normal people. With a sample size of 99% of normal people as the entire sample, the classifier can achieve global accuracy of up to 99% simply by determining that all people are normal. However, there are fewer uses for such classifiers in practical applications. The most critical aspect of the stroke risk assessment problem is the precise identification of stroke patients. However, commonly used classification algorithms tend to neglect the identification of certain minority class samples when building classification models with unbalanced data, thus leading to the models having insufficient practical application value.
To avoid the above situation, this article first balances the unbalanced data during the model implementation process. The most common methods of balancing data are under-sampling and oversampling. Under-sampling is the random selection of a portion of samples from the majority category so that the majority category has the same or close to the same number of samples as the minority category. The advantage of this method is that it is computationally fast, but the disadvantage is that some important information is lost, which may increase the error rate of the model. Oversampling is the addition of new samples to the minority category so that the majority and minority categories have the same number of samples. This approach has the advantage of avoiding loss of information, but it may also lead to overfitting problems, as the newly generated samples may be very similar to the original samples.
The simplest method of oversampling is “random oversampling”, but since this method only replicates a few classes of samples and does not generate new samples, it is prone to overfitting. Therefore, the SMOTE algorithm was applied here.
SMOTE [57] is a technique for generating minority samples that can effectively improve the problem of data imbalance. The flow of the algorithm is as follows:
1. Calculate the Euclidean distance from each minority class sample
2. Determine the proportion of data that is unbalanced and set the sampling multiplier
3. For each randomly selected nearest neighbor
From the above algorithm process, it can be seen that the SMOTE algorithm generates new samples but ignores the distribution characteristics of minority samples, which easily leads to marginalization of the data distribution. In a binary classification problem, if a negative class sample is at the edge of the sample set, a new sample artificially synthesized from that sample will also be at the edge; then, the cycle continues to generate new samples that only get closer to the edge position. This tends to cause the distance between the positive and negative class samples and the threshold to decrease, so that there will be a lot of trouble during the subsequent generation of new samples belonging to the positive or negative class. Therefore, although the algorithm balances the dataset, it increases the difficulty of the classification algorithm in terms of classification.
4.1.2 Borderline SMOTE Algorithm
Based on this defect of the SMOTE method, the borderline SMOTE algorithm [58], which is also an oversampling method, was proposed, which, unlike the SMOTE algorithm, performs near-neighbor linear interpolation on boundary samples, making the newly generated samples more reasonable. The specific steps are described below:
1. Obtain
2. Classify a few of the samples. Assuming that the number of samples belonging to the majority class is m′ in the m immediate neighborhood of the minority class sample, clearly, 0 ≤ m′ ≤ m; if m′ = m,
3. Using the sampling multiplier
4. Combine the original training sample
Compared with the SMOTE algorithm, the borderline SMOTE algorithm adopts near-neighbor linear interpolation for boundary samples, which avoids the problem that the data tend to be marginalized in the SMOTE algorithm. In addition, the borderline SMOTE algorithm focuses on boundary samples, which can avoid such samples being misclassified, and this algorithm can increase the distribution of boundary minority samples, making the sample distribution more reasonable. Based on the improved algorithm sample set, the learning prediction effect is more ideal.
Data classification is a fundamental problem in the field of machine learning and data analysis, and many related studies and many research results have been obtained. At present, the more common and representative classification algorithms include K-nearest neighbors (KNN), decision trees, Bayes, random forest (RF), SVM, logistic regression, neural networks and AdaBoost [59,60]. Logistic regression is a widely used model in the field of disease classification, which is highly efficient in terms of training, has a low computation cost, fast, requires few storage resources, and has a good explanatory model, making it easy to understand and implement. However, the disadvantage of logistic regression is that it cannot handle nonlinear problems well, and it is easy to overfit. Under the framework of AdaBoost, a variety of regression classification models can be used to build weak learners, which are very flexible. As a simple binary classifier, AdaBoost has a simple construction, high classification accuracy, and understandable results. Compared with the bagging algorithm and RF algorithm, AdaBoost fully considers the weight of each classifier. In particular, AdaBoost is not prone to overfitting. Thus, based on the advantages and disadvantages of the logistic regression model and AdaBoost algorithm, this paper considers the integration of these two machine learning methods to propose a new model, i.e., the Logistic-AB model, for stroke risk assessment.
Logistic regression is a generalized linear regression analysis model with the regression equation shown below:
where
when
AdaBoost [61] is a boosting algorithm proposed by Yoav Freund and Robert Schapire known as adaptive boosting. The boosting algorithm, also known as boosting, allows weak learners to be boosted to strong learners through continuous learning. Using an iterative algorithm, each step generates a new learner that has been boosted by modifying the learner obtained in the previous step, and then a strong learner is obtained by integrating the learners generated during the iteration process.
The AdaBoost algorithm is adaptive in the sense that for the current base classifier
The algorithm steps are as follows:
Input: training data
Output: final classifier.
1) Initialize the weight distribution of the training data.
2) For
(a) Based on the weight distribution
(b) Calculate the classification error rate of
(c) Calculate the coefficient of
where log is the natural logarithm.
(d) Update the weight distribution of the training dataset,
where
which makes
3) Construct linear combinations of basic classifiers.
Obtain the final classifier.
For misclassified samples, if
For correctly classified samples, if
The parameters in the AdaBoost algorithm are as follows. (i) base_estimator: weak learner parameter. (ii) n_estimators: parameter for the number of weak learners, which has a default value of 50. (iii) learning_rate: weight reduction coefficient of the weak learner. This value ranges from 0 to 1. Generally, the step size and the maximum number of iterations are used together to determine the fitting effect of the algorithm, so the parameters n_estimators and learning_rate should be adjusted together. (iv) algorithm: parameters of the classification algorithm, with the default being SAMME.R. (v) loss: error calculation function. The options are linear, square, and exponential. In general, the default option is linear.
For the binary classifier, the ensuing classification error rate is 50%. For any weak learner with higher performance than random classification, there is always
4.2.3 The Architecture and Key Components of the Logistic-AB Model
This paper adopts a similar approach to logistic regression by dividing the training sample points into four intervals via the probability-based classification method and calculating the probability of correct classification in each interval. This is also combined with the evaluation results from AdaBoost to provide credible support for logistic regression, thus reducing the risk of misjudgment. From Section 4.1, the data in this paper have been balanced by the borderline SMOTE algorithm; thus, the probability of stroke patients as well as normal individuals is 0.5 and the intervals are divided equally, i.e., the four intervals of the logistic output probability are:
The algorithm steps of the Logistic-AB model are given as follows:
Step 1: Based on the above four intervals, the training set is divided into four intervals, denoted as
Step 2: The test set is also divided into
Step 3: Based on the classification accuracies
The architecture and key components of the Logistic-AB model are shown in Fig. 7.

Figure 7: The architecture and key components of the Logistic-AB model
The architecture and key components of the Logistic-AB model given in Fig. 7 can be described as follows. First, the probability interval [0,1] is divided into four consecutive reciprocal intervals due to the balancing of data after the parity, and then the training and test sets are divided into four subsets based on the intervals. Next, the data are classified by using the logistic regression model and AdaBoost model, and the classification accuracy is calculated for the four subsets. Finally, the test set is classified accordingly, the accuracy of the training set is used to judge the test set, and the results are comprehensively evaluated. This proposed model not only integrates the advantages of logistic regression and AdaBoost but also complements their disadvantages, which not only results in a faster training speed but also ensures good accuracy and precision.
5 Empirical Analysis of Stroke Risk Assessment
This chapter focuses on the empirical analysis of the previous discussion. It begins with correlation analysis of age, mean blood glucose levels, body mass index, stroke, heart disease and hypertension from the data. The data are then balanced using borderline SMOTE. Finally, the data are trained and evaluated with the Logistic-AB model established in the previous section, and the training effect graph is constructed. The evaluation results are then compared and analyzed with the training results of ten common machine learning algorithms: random forest, SVM, logistic, KNN, Bayesian, decision tree, AdaBoost, gradient boosting, XGB, and CatBoost, through which the strengths and weaknesses of the Logistic-AB model established in this paper can be determined.
The studies in this section aim to examine the relationship between age, average blood glucose levels, and body mass index with stroke, heart disease, and high blood pressure. The results of the study show that all of these factors are related to the development of these diseases.
First, this paper examined the relationship between age and stroke, heart disease, and hypertension, as shown in the first panel of Fig. 8. As seen from the graph, the probability of developing these diseases gradually increases with age. The probability of stroke and heart disease increases significantly, especially after the age of fifty. In addition, there was an increased probability of hypertension. It can therefore be concluded that people are more prone to these three types of diseases as they age.
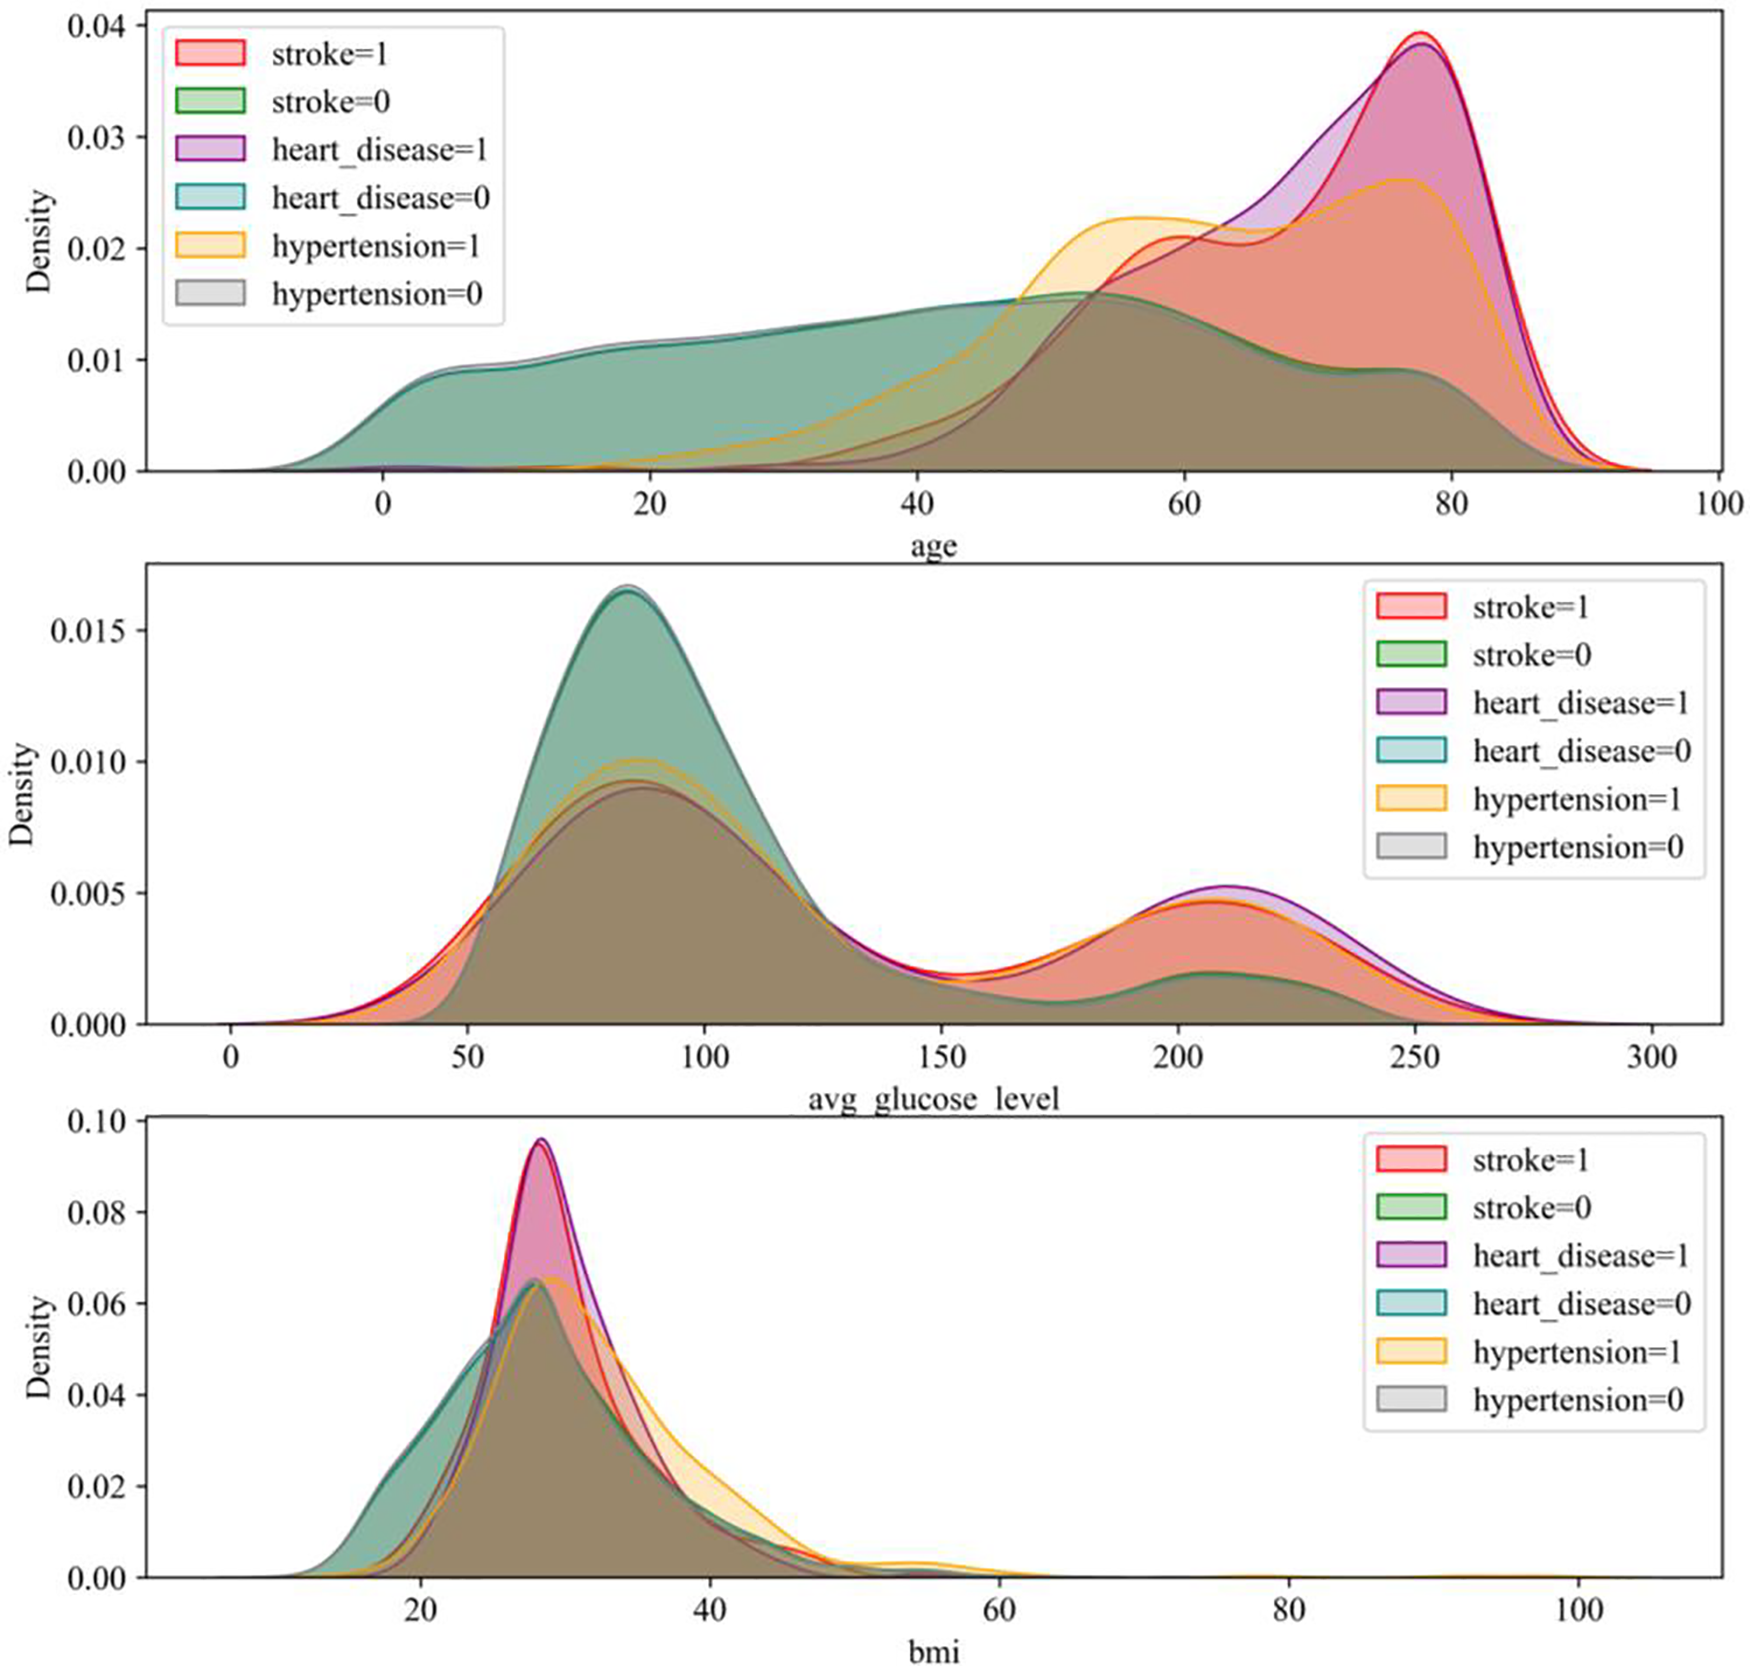
Figure 8: Correlation diagram
Second, this paper examined the relationship between average blood glucose levels and stroke, heart disease, and high blood pressure. As shown in the second panel of Fig. 8, the graph has two crests. At a glycemic index of 80, the probability of stroke, heart disease and high blood pressure are all higher, suggesting that blood sugar levels are linked to these diseases. In addition, the probability of these diseases begins to reverse when the glycemic index exceeds 150, with the difference between the two reaching a maximum at approximately 175. It can therefore be concluded that elevated blood glucose increases the risk of these three types of diseases.
Finally, this section looks at the relationship between body mass index and stroke, heart disease, and hypertension. As shown in the third panel of Fig. 8, the graph shows that individuals with a BMI of 30 are more likely to suffer from stroke and heart disease, but there is no significant correlation between the development of high blood pressure and BMI. It can therefore be concluded that being overweight also increases the risk of stroke and heart disease.
Overall, the findings in this section suggest a relationship between age, mean blood glucose levels, and body mass index and stroke, heart disease, and hypertension. Therefore, attention should be given to these factors, and measures should be taken to prevent and treat these diseases. For example, the incidence of these diseases can be reduced by eating a balanced diet, exercising moderately and maintaining a healthy weight.
In the field of machine learning, the quality of the dataset determines the quality of the model. Therefore, before training the dataset, the quality of the dataset needs to be ensured by splitting. However, in practice, an imbalance in the dataset is encountered, which means that some sample types have much smaller sample sizes than others.
To solve this problem, this paper uses an approach called hierarchical cross-validation. This approach ensures that the number of samples of each type in the training and test sets is preserved. In this paper, all the data are divided into five training and test sets, and hierarchical cross-validation is used to ensure the quality of the dataset.
However, even with the use of hierarchical cross-validation, the dataset may still be unbalanced, so measures need to be taken to balance the dataset. This paper uses a method called borderline SMOTE, which generates synthetic data to increase the number of samples from a small number of classes to balance the dataset.
The processing results are shown in Fig. 9. The left panel shows the dataset before processing, and the right panel shows the results after borderline SMOTE processing. After treatment, the distribution of samples becomes more reasonable, and the number of samples of each type is relatively balanced. This allows the model to be trained and evaluated more accurately.

Figure 9: Borderline SMOTE before and after treatment
In conclusion, when dealing with unbalanced datasets, methods such as hierarchical cross-validation and borderline SMOTE need to be used first to ensure data quality. Using these methods leads to more accurate and useful models and provides better support for practical applications.
5.3 Experimental Results and Analysis
ROC curves, also known as subject operating characteristic curves, are mainly used in the field of assessment. The relationship between sensitivity and specificity can be effectively demonstrated by plotting ROC curves. The horizontal coordinate of the ROC curve indicates specificity, while the vertical coordinate represents sensitivity. A lower horizontal coordinate indicates higher accuracy of the algorithm, while a higher vertical coordinate indicates higher accuracy of the algorithm.
The AUC, also known as the area under the ROC curve, can be used as a measure of the evaluation accuracy of the algorithm. The larger this area is, the larger the AUC value is and the better the evaluation accuracy of the algorithm is. In machine learning model evaluation, using ROC curves and AUC values has become a very important method to better evaluate the effectiveness of the model and to improve the evaluation of the model.
In summary, ROC curves are a very practical way of assessing the effectiveness of a model by plotting the relationship between sensitivity and specificity and showing the accuracy of the algorithm in graphical form. When using ROC curves and AUC values for model evaluation, it is necessary to select the appropriate threshold as accurately as possible to ensure the best performance of the algorithm.
In this paper, Logistic-AB was used to train the model, and the results are shown in Fig. 10. In Fig. 10, we can see that all four subsets are trained very well and have corresponding AUC values of 0.92, 0.94, 0.92 and 0.93.

Figure 10: ROC graph
These results demonstrate the effectiveness of the fusion algorithm used in this paper and demonstrate the broad applicability of this method on multiple datasets. It is also noted that in each of these subsets, the performance is different from the others, and therefore, careful consideration is required when selecting the best model.
It is worth noting that these results only represent results under the particular dataset and parameter settings currently used in this paper. In practice, users are advised to adapt this model to meet their needs and further optimize it based on their specific dataset.
In conclusion, very good training results have been achieved by using the fusion algorithm proposed in this paper. It is believed that these results will have a positive impact on future research and applications.
5.3.2 Evaluation Metrics and Analysis of the Experimental Results
In this paper, the results are evaluated by using accuracy, precision, recall and the F1 score [62].
Accuracy is the proportion of correctly classified samples to the total number of samples predicted by the model and is calculated as follows:
where TP represents the number of positive class samples predicted as positive by the classification model, FN represents the number of positive class samples predicted as negative by the classification model, TN represents the number of negative class samples predicted as negative by the classification model, and FP represents the number of negative class samples predicted as positive by the classification model.
Accuracy refers to the proportion of correct predictions that would have been correct (the larger the value, the better; 1 is ideal), which is defined by the following formula:
Recall refers to the ratio of the number of positive cases correctly identified by the classifier out of all the actual positive cases (the larger the value, the better; 1 is ideal), and its formula is as follows:
The F1 score is a weighted average of precision and recall and is defined by Eq. (17):
where P and R represent precision and recall, respectively, and a higher F1 score indicates a better model.
Here, to show the superiority of the new model proposed in this paper, ten homogeneous machine learning algorithms are selected for comparison with the Logistic-AB model by using the evaluation metrics of accuracy, precision, recall and F1 score, and the results are shown in Table 2.
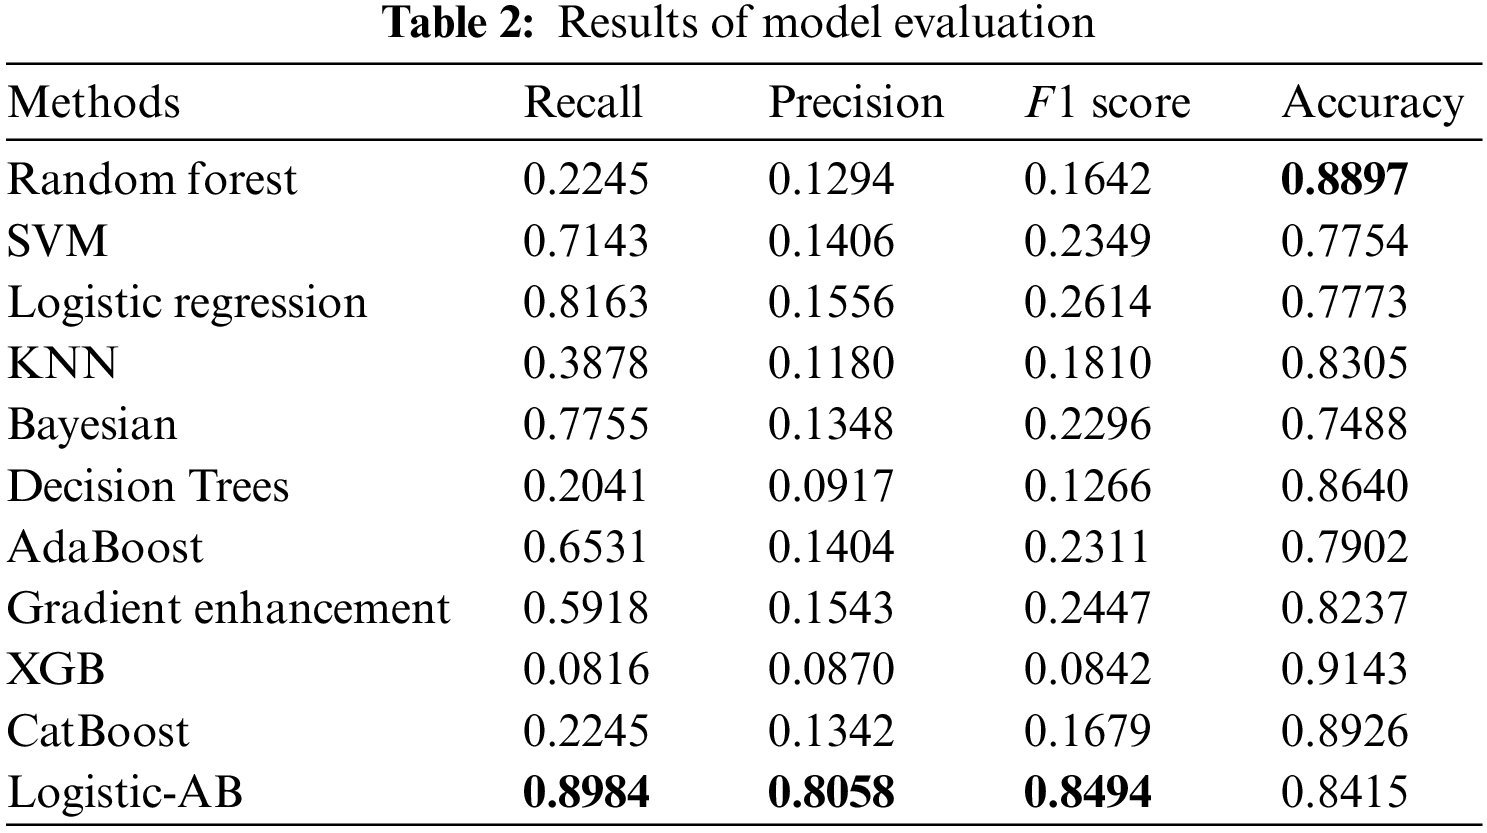
Table 2 gives the comparative results from 10 machine learning algorithms as well as those from the presented Logistic-AB model on the model prediction performance for stroke risk assessment. The overall prediction performance of all models is evaluated by four specific evaluation metrics, i.e., recall, precision, F1 score, and accuracy. From Table 2, we can see that the Logistic-AB algorithm performs better than the two single algorithms in terms of the four indicators (recall, precision, F1 score, and accuracy), regardless of whether the logistic regression or AdaBoost algorithm is used. Although random forest, decision tree, and XGB all performed much better in terms of accuracy, they could not match the Logistic-AB algorithm on the other three indicators. Specifically, the Logistic-AB algorithm is far ahead of the other algorithms in the two key indicators of the F1 score and precision.
In summary, the overall performance of the Logistic-AB algorithm proposed in this paper when applied to stroke risk assessment is better than that of common machine learning algorithms. The traditional logistic regression method classifies the results with 0.5 as the cutoff, while the Logistic-AB algorithm proposed in this paper divides the interval into four parts, thus greatly reducing the risk of misjudgment. In addition, the Logistic-AB algorithm uses the output results of AdaBoost as a reference to prevent obvious misjudgments in logistic regression, which further improves the classification effect. In this sense, the Logistic-AB model proposed in this paper has excellent performance in stroke risk assessment. This method not only has important practical application significance in the medical field but also provides a new idea and method for risk assessment research on machine learning algorithms in other fields.
With the deepening of internet technology in the medical field, health management practices driven by medical big data are gradually taking shape. Of the three components of health management, i.e., health detection, risk assessment and precision intervention, the most critical is the management of various risk factors throughout the process, which is achieved with effective predictive tools to improve health management. Therefore, a comprehensive study of the influencing factors and risk assessment of stroke patients can help with rehabilitation and early detection and promote the whole process of patient health management, changes in the medical service model and innovation of the management mechanism. This paper establishes a new stroke risk assessment model by screening important influencing factors as well as balancing data, which provides theoretical guidance for the rational diagnosis, timely treatment and effective intervention among high-risk groups and lays the foundation for achieving indirect economic and good social benefits. The main contributions of this study include the following: a new index system of stroke risk assessment is constructed by using the feature selection method of CatBoost; the unbalanced stroke dataset is transformed into a balanced dataset by using the borderline SMOTE algorithm; and a new Logistic-AB model is developed to predict the risk of stroke.
In conclusion, this paper has successfully performed stroke risk assessment by constructing an integrated algorithmic model, Logistic-AB. The Logistic-AB model far exceeded other machine learning algorithms in terms of the main evaluation metrics. The application of the Logistic-AB model is promising. Moreover, this model has practical significance provides a theoretical basis and decision-making reference for related theoretical research.
However, this Logistic-AB model still has some limitations, such as the interpretability of the results and the sensitivity to outliers and unbalanced data. In this sense, it is necessary to clean and transform the data before using this model; that is, remove the outliers and transform the unbalanced data into balanced data.
In the future, we will consider choosing better data balancing algorithms or more realistic data for more effective predictive analyses, and we will combine multiple machine learning algorithms or improve the ensemble learning algorithms to achieve more accurate and efficient predictive models.
Acknowledgement: The authors wish to express their appreciation to the reviewers for their helpful suggestions which greatly improved the presentation of this paper.
Funding Statement: This work is supported by the National Natural Science Foundation of China (No. 72071150).
Author Contributions: The authors confirm contribution to the paper as follows: study conception and design: C. Rao, M. Li, and T. Huang; data collection: F. Li; analysis and interpretation of results: C. Rao and M. Li; draft manuscript preparation: M. Li and T. Huang. All authors reviewed the results and approved the final version of the manuscript.
Availability of Data and Materials: The datasets generated and analyzed during the current study are available in the (Kaggle site survey report) repository (https://www.kaggle.com/datasets/fedesoriano/stroke-prediction-dataset).
Conflicts of Interest: The authors declare that they have no conflicts of interest to report regarding the present study.
References
1. Jiang, Q. (2017). Current situation and prospect of stroke prevention and nursing. Chinese Nursing Research, 31(1), 7–13. [Google Scholar]
2. China Cardiovascular Health and Disease Report Writing Group (2022). Summary of China cardiovascular health and disease report 2021. Chinese Circulation Journal, 37(6), 553–578. [Google Scholar]
3. Wang, Y. (2019). Research on influencing factors and risk prediction model of stroke based on big data. Guangzhou, China: Guangdong University of Technology. [Google Scholar]
4. Zhu, H., Peng, M., Wang, T., Chen, G. Z., Xie, G. H. et al. (2021). A prognosis prediction model for patients with acute stroke after endovascular thrombectomy based on the radiomics characteristics of diffusion weighted imaging and machine learning. Practical Journal of Cardiac Cerebral Pneumal and Vascular Disease, 29(9), 43–46. [Google Scholar]
5. Wang, J., Rao, C. J., Goh, M., Xiao, X. P. (2023). Risk assessment of coronary heart disease based on cloud-random forest. Artificial Intelligence Review, 56(1), 203–232. [Google Scholar]
6. Manuel, D. G., Meltem, T., Richard, P., Peter, T., Deirdre, H. et al. (2015). Predicting stroke risk based on health behaviours: Development of the stroke population risk tool (SPORT). PLoS One, 10(12), 1–16. [Google Scholar]
7. Lumley, T., Kronmal, R. A., Cushman, M., Manolio, T. A., Goldstein, S. et al. (2002). A stroke prediction score in the elderly: Validation and web-based application. Journal of Clinical Epidemiology, 55(2), 129–136. [Google Scholar] [PubMed]
8. D’Agostino, R. B., Wolf, P. A., Belanger, A. J., Kannel, W. B. (1994). Stroke risk profile: Adjustment for anti-hypertensive medication: The framingham study. Stroke, 25(1), 40–43. [Google Scholar] [PubMed]
9. Goff Jr, D. C., Lloyd-Jones, D. M., Bennett, G., Coady, S., D’Agostino, R. B. et al. (2014). 2013 ACC/AHA Guideline on the assessment of cardiovascular risk: A report of the American College of Cardiology/ American Heart Association task force on practice guidelines. Journal of the American College of Cardiology, 63(25), 2886. [Google Scholar]
10. Parmar, P., Krishnamurthi, R., Ikram, M. A., Hofman, A., Mirza, S. S. (2015). The stroke riskometer (TM) app: Validation of a data collection tool and stroke risk predictor. International Journal of Stroke, 10(2), 231–244. https://doi.org/10.1111/ijs.12411 [Google Scholar] [PubMed] [CrossRef]
11. Guan, C. M. (2014). Mining medical insurance costs under the background of big data. Xi’an, China: Xidian University. [Google Scholar]
12. Sun, H., Li, T. (2012). Stroke and its risk factors analysis. Stroke and Nervous Diseases, 19(3), 167–170. [Google Scholar]
13. Aslam, A., Khan, U., Niazi, F., Anwar, I. (2022). Etiology and risk factors of stroke in young adults: A multicentric study. Annals of Medicine and Surgery, 82, 104647. [Google Scholar] [PubMed]
14. Wang, Z., Greenbaum, J., Qiu, C., Li, K., Wang, Q. et al. (2020). Identification of pleiotropic genes between risk factors of stroke by multivariate metaCCA analysis. Molecular Genetics and Genomics, 295(5), 1173–1185. [Google Scholar] [PubMed]
15. Asowata, O. J., Sarfo, F. S., Akpa, O. M., Akinyemi, J., Okekunle, A. P. et al. (2023). Prevalence and risk factors of stroke recurrence in Ghana and Nigeria. Journal of Stroke and Cerebrovascular Diseases, 32(4), 107015. [Google Scholar]
16. Yang, M. (2013). The relationship between stroke incidence and meteorological factors and its prediction model. Journal of Guangxi University of Science and Technology, 24(4), 76–79. [Google Scholar]
17. Hu, Z. (2022). Research on key technologies of chronic disease prediction based on machine learning. Chongqing, China: University of Electronic Science and Technology of China. [Google Scholar]
18. National “Tenth Five-Year Plan” Research Group on “Comprehensive Risk Assessment and Intervention Program for Coronary Heart Disease and Stroke” (2003). Research on the risk assessment method and simple assessment tool for Chinese people’s ischemic cardiovascular disease. Chinese Journal of Cardiology, 31(12), 893–901. [Google Scholar]
19. Wang, H., Zhang, L., Wang, J., Li, J., Zhou, Y. et al. (2019). Comparison of C5.0 decision tree and RBF neural network model for risk prediction of hemorrhagic transformation in acute ischemic stroke. Chinese Journal of Disease Control & Prevention, 23(2), 228–233. [Google Scholar]
20. Xu., H., Du, X., Yang, X., Ma, R., Wang, G. M. et al. (2018). Logistic regression analysis of risk factors for stroke patients in Dali residents. Journal of Dali University, 3(8), 63–66. [Google Scholar]
21. Xu, R. W. (2018). Analysis of related factors of progressive ischemic stroke. Chinese Journal of Practical Nervous Diseases, 21(11), 1263–1266. [Google Scholar]
22. Wang, W. Y., Sang, W. W., Yan, S. M., Hong, Y., Zhang, H. et al. (2016). Cox regression analysis of 1-year recurrence risk factors in patients with acute ischemic stroke. Chinese Journal of Geriatric Heart Brain and Vessel Diseases, 18(1), 46–50. [Google Scholar]
23. Yan, L., Cao, Y., Wang, Q., Tan, Y., Wang, Z. W. et al. (2016). Cox regression analysis of factors affecting the incidence of stroke in hypertensive patients. Chinese Journal of Public Health, 32(6), 748–752. [Google Scholar]
24. Hu, S., Yang, Y., Zheng, Z., Chen, W. W., Gao, R. et al. (2019). Summary of “China Cardiovascular Disease Report 2018”. Chinese Circulation Journal, 34(3), 209–220. [Google Scholar]
25. Benameur, N., Mohammed, M., Mahmoudi, R., Arous, Y., Garcia-Zapirain, B. et al. (2021). Parametric methods for the regional assessment of cardiac wall motion abnormalities: Comparison study. Computers, Materials & Continua, 69(1), 1233–1252. https://doi.org/10.32604/cmc.2021.016860 [Google Scholar] [CrossRef]
26. Han, P. (2019). The application of artificial intelligence in stroke risk assessment. China New Telecommunications, 21(4), 68–69. [Google Scholar]
27. Wang, X., Sun, B. (2019). Construction of health management model for left-behind elderly in rural areas. Social Science Front, 4(5), 103–108. [Google Scholar]
28. Kumar, K., Kumar, N., Kumar, A., Mohammed, M. A., Al-Waisy, A. S. et al. (2022). Identification of cardiac patients based on the medical conditions using machine learning models. Computational Intelligence and Neuroscience, 2022, 5882144. [Google Scholar] [PubMed]
29. Chang, H., Yao, Y. (2022). Constructing a risk prediction model of ischemic stroke in Jiangxi region based on machine learning. Medical Journal of West China, 34(8), 1182–1186. [Google Scholar]
30. Yu, M., Liu, K., Xu, X., Luo, Y. X. (2023). Comparison of stroke risk prediction models based on machine learning. Chinese Primary Health Care, 37(3), 25–28. [Google Scholar]
31. Arif, Z. H., Cengiz, K. (2023). Severity classification for COVID-19 infections based on lasso-logistic regression model. International Journal of Mathematics, Statistics, and Computer Science, 1, 25–32. [Google Scholar]
32. Chawla, N. V., Bowyer, K. W., Hall, L. O., Kegelmeyer, W. P. (2002). SMOTE: Synthetic minority over-sampling technique. Journal of Artificial Intelligence Research, 16(1), 321–357. [Google Scholar]
33. Rao, C. J., Liu, Y., Goh, M. (2023). Credit risk assessment mechanism of personal auto loan based on PSO-XGBoost model. Complex & Intelligent Systems, 9(2), 1391–1414. [Google Scholar]
34. Chu, J. J., Xiao, X. P. (2023). Benefits evaluation of the Northeast passage based on grey relational degree of discrete Z-numbers. Information Sciences, 626(4), 607–625. [Google Scholar]
35. Zhang, Y., Li, Z. R., Liu, X. D. (2012). Active learning SMOTE based imbalanced data classification. Computer Application and Software, 29(3), 91–94. [Google Scholar]
36. Xu, D. D., Wang, Y., Cai, L. J. (2011). ISMOTE algorithm for imbalanced data set. Journal of Computer Application, 30(9), 2399–2401. [Google Scholar]
37. Tao, X. M., Xu, J., Tong, Z. J. (2010). Over-sampling algorithm based on negative immune in imbalanced data sets learning. Control and Decision, 25(6), 1–7. [Google Scholar]
38. Tang, Y., Zhang, Y. Q., Chawla, N. V., Krasser, S. (2009). SVMs modeling for highly imbalanced classifications. IEEE Transaction on Systems, Man, and Cybernetics, Part B (Cybernetics), 39(1), 281–288. [Google Scholar]
39. Xiao, Q. Z., Gao, M. Y., Chen, L., Jiang, J. C. (2023). Dynamicmulti-attribute evaluation of digital economy development in China: A perspective from interaction effect. Technological and Economic Development of Economy (In Press). [Google Scholar]
40. Wang, K. J., Makond, B., Chen, K. H., Wang, K. M. (2014). A hybrid classifier combining SMOTE with PSO to estimate 5-year survivability of breast cancer patients. Applied Soft Computing, 20(3), 15–24. [Google Scholar]
41. Sun, T., Wu, H. F., Liang, Z. G., He, W., Zhang, L. et al. (2012). SMOTE algorithm in the application of imbalanced data. Beijing Biomedical Engineering, 31(5), 528–530. [Google Scholar]
42. Tang, S., Shen, Y. (2018). Research on chronic disease management system based on customer relationship management from the perspective of health and poverty alleviation. Chinese General Practice, 21(7), 856–860. [Google Scholar]
43. Chao, B., Liu, J., Wang, Y., Yang, G., Peng, B. et al. (2019). Prevention and treatment of ischemic stroke in China: Achievements, challenges and responses. Chinese Circulation Journal, 7(11), 45–48. [Google Scholar]
44. Wang, Y., Wang, Y., Zhang, H. (2018). Relationship between cerebral artery stenosis and hypertension in patients with ischemic stroke. Clinical Research and Practice, 3(28), 36–37. [Google Scholar]
45. Bai, X., Li, Y., Yu, P., Yi, Z., Shi, X. et al. (2018). Survey on the incidence of stroke among middle-aged and elderly people in Changshou area of China and its correlation analysis with hypertension, diabetes and heart disease. Journal of Modern Laboratory Medicine, 33(1), 5–9. [Google Scholar]
46. Song, W., Wu, J., Li, Y., Zheng, H. J., Liu, H. B. et al. (2014). Statistical analysis of the relationship between stroke incidence and age, occupation, time, climate, etc. Chinese Journal of Health Statistics, 31(4), 648–650. [Google Scholar]
47. Guo, L., Yang, Y., Yang, J. (2010). Relationship between body mass index and prevalence of diabetes, coronary heart disease and stroke. Journal of Baotou Medical College, 26(5), 23–25. [Google Scholar]
48. Pathan, M. S., Nag, A., Pathan, M. M., Dev, S. (2022). Analyzing the impact of feature selection on the accuracy of heart disease prediction. Healthcare Analytics, 2(6), 100060. [Google Scholar]
49. Peng, J. J., Chen, X. G., Wang, X. K., Wang, J. Q., Long, Q. Q. et al. (2023). Picture fuzzy decision-making theories and methodologies: A systematic review. International Journal of Systems Science, 54(13), 2663–2675. [Google Scholar]
50. Rao, C. J., Gao, M. Y., Wen, J. H., Goh, M. (2022). Multi-attribute group decision making method with dual comprehensive clouds under information environment of dual uncertain Z-numbers. Information Sciences, 602(11), 106–127. [Google Scholar]
51. Lee, M., Lee, J. H., Kim, D. H. (2022). Gender recognition using optimal gait feature based on recursive feature elimination in normal walking. Expert Systems with Applications, 189(3), 116040. [Google Scholar]
52. Chen, L., Dong, T., Nan, G. F., Xiao, X. Z., Xu, M. et al. (2023). Impact of the introduction of marketplace channel on e-tailer’s logistics service strategy. Managerial and Decision Economics, 44(5), 2835–2855. [Google Scholar]
53. Xu, C., Zhang, S. W. (2024). A genetic algorithm-based sequential instance selection framework for ensemble learning. Expert Systems with Applications, 236, 121269. [Google Scholar]
54. Wen, J. H., Hong, L. J., Dai, M., Xiao, X. P., Wu, C. Z. et al. (2023). A stochastic model for stop-and-go phenomenon in traffic oscillation: On the prospective of macro and micro traffic flow. Applied Mathematics and Computation, 440(11), 127637. [Google Scholar]
55. Rastgoo, A., Khajavi, H. (2023). A novel study on forecasting the airfoil self-noise, using a hybrid model based on the combination of CatBoost and arithmetic optimization algorithm. Expert Systems with Applications, 229, 120576. [Google Scholar]
56. Wei, X., Rao, C. J., Xiao, X. P., Chen, L., Goh, M. (2023). Risk assessment of cardiovascular disease based on SOLSSA-CatBoost model. Expert Systems with Applications, 219(9), 119648. [Google Scholar]
57. Wong, W. Y., Khallel, A., Hasikin, K., Salwa, A., Razak, S. A. et al. (2022). Water quality index using modified random forest technique: Assessing novel input features. Computer Modeling in Engineering & Sciences, 132(3), 1011–1038. https://doi.org/10.32604/cmes.2022.019244 [Google Scholar] [CrossRef]
58. Saravanan, P., Arun, L. (2023). BS-SC model: A novel method for predicting child abuse using Borderline-SMOTE enabled stacking classifier. Computer Systems Science and Engineering, 46(2), 1311–1336. https://doi.org/10.32604/csse.2023.034910 [Google Scholar] [CrossRef]
59. Jiang, X. Y., Hu, Z. J., Wang, S. H., Zhang, Y. D. (2023). A survey on artificial intelligence in posture recognition. Computer Modeling in Engineering & Sciences, 137(1), 35–82. https://doi.org/10.32604/cmes.2023.027676 [Google Scholar] [PubMed] [CrossRef]
60. Peng, J. J., Chen, X. G., Long, Q. Q., Zhang, S. Z. (2023). A picture fuzzy evaluation framework based on a novel approach incorporating bidirectional projection measures and the VIKOR method. Artificial Intelligence Review. https://doi.org/10.1007/s10462-023-10576-3 [Google Scholar] [CrossRef]
61. Hu, D. W., Liu, H. Y., Zhu, Y. D., Sun, J. Z., Zhang, Z. et al. (2023). Demand response-oriented virtual power plant evaluation based on AdaBoost and BP neural network. Energy Reports, 9(S8), 922–931. [Google Scholar]
62. Rao, C. J., Liu, M., Goh, M., Wen, J. H. (2020). 2-stage modified random forest model for credit risk assessment of P2P network lending to three rurals borrowers. Applied Soft Computing, 95(1), 106570. [Google Scholar]
Cite This Article
 Copyright © 2024 The Author(s). Published by Tech Science Press.
This work is licensed under a Creative Commons Attribution 4.0 International License , which permits unrestricted use, distribution, and reproduction in any medium, provided the original work is properly cited.
 Downloads
 Citation Tools