
 Submit a Paper
 Propose a Special lssue
 Open Access
ARTICLE

Discrete Element Modelling of Damage Evolution of Concrete Considering Meso-Structure of ITZ
1 Institute of Defense Engineering, Academy of Military Sciences, Chinese People’s Liberation Army, Beijing, 100850, China
2 College of Mechanical and Vehicle Engineering, Taiyuan University of Technology, Taiyuan, 030024, China
3 State Key Laboratory of Explosion Science and Technology, Beijing Institute of Technology, Beijing, 100081, China
* Corresponding Author: Tingting Zhao. Email:
(This article belongs to the Special Issue: Recent Advances in Computational Methods for Performance Assessment of Engineering Structures and Materials against Dynamic Loadings)
Computer Modeling in Engineering & Sciences 2024, 139(3), 3495-3511. https://doi.org/10.32604/cmes.2023.046188
Received 21 September 2023; Accepted 13 December 2023; Issue published 11 March 2024
 View Full Text
 Download PDF
Abstract
The mechanical properties of interfacial transition zones (ITZs) have traditionally been simplified by reducing the stiffness of cement in previous simulation methods. A novel approach based on the discrete element method (DEM) has been developed for modeling concrete. This new approach efficiently simulates the meso-structure of ITZs, accurately capturing their heterogeneous properties. Validation against established uniaxial compression experiments confirms the precision of this model. The proposed model can model the process of damage evolution containing cracks initiation, propagation and penetration. Under increasing loads, cracks within ITZs progressively accumulate, culminating in macroscopic fractures that traverse the mortar matrix, forming the complex, serpentine path of cracks. This study reveals four distinct displacement patterns: tensile compliant, tensile opposite, mixed tensile-shear, and shear opposite patterns, each indicative of different stages in concrete’s damage evolution. The widening angle of these patterns delineates the progression of cracks, with the tensile compliant pattern signaling the initial crack appearance and the shear opposite pattern indicating the concrete model’s ultimate failure.Keywords
Concrete, being a quasi-brittle multiphase material with intricate micro-structures, finds widespread use in engineering structures [1]. Within continuum solid mechanics, concrete materials are often classified as three-phase heterogeneous media consisting of aggregates, matrix, and interfacial transition zones (ITZs) [2–4]. ITZs in concrete are narrow layers that surround aggregates, facilitating adhesion with the cement matrix [5]. ITZs represent weaker areas within the concrete, distinguished by notable differences in composition and meso-structure compared to the cement matrix. They significantly impact the fracture behavior of concrete [6,7].
Experiments utilizing electron microscopy have provided invaluable insights into the microstructure and morphology of ITZs. Scrivener et al. [8] conducted a study using scanning electron microscopy (SEM) and backscattered electron (BSE) imaging, revealing the pronounced heterogeneity of ITZs. Their findings indicated that the farther from the aggregate, the lower the observed porosity. Garboczi et al. [9] analyzed the elastic properties of ITZs and found the gradients of bulk and shear modulus. Simeonov et al. [10] also pointed out that the microstructure and elastic properties of ITZs changed by a certain gradient along the external normal direction of the aggregate. Lutz et al. [11,12] proposed a power function to express the decreasing trend in the elastic modulus of ITZs. Consequently, the oversimplified notion of considering ITZs as homogeneous thin layers surrounding the aggregate contradicts the true characteristics of ITZs. Given that ITZs exert substantial influence on concrete properties such as strength, brittleness, and fracture [13–15], studying how the microstructural and property heterogeneity of ITZs impacts the macro properties of concrete becomes imperative.
Given the difficulties in quantifying the mechanical properties of ITZs through experimental methods, numerical simulations have emerged as a valuable tool for comprehensively understanding concrete fracture behavior at the mesoscopic scale. Mesoscopic numerical simulations have been used widely to study mechanical properties and constitutive models of concrete as well as to optimize concrete designs. The fracture behavior of concrete under uniaxial compression has been extensively explored through various numerical methods, including the finite element method (FEM) [16–18] and the discrete element method [19–21]. Alongside traditional numerical techniques, novel and advantageous approaches like peridynamics and the phase field method have been introduced to investigate concrete damage [22,23]. In FEM simulations, the thickness of ITZs is often simplified as either a zero-width element or a predefined thinner layer. Wriggers et al. [24] generated spherical coarse aggregates using the Monte Carlo’s method. The ITZ was simulated by the boundaries of mesh elements, and an isotropic damage model was implemented to predict fracture propagation [25–27]. Wang et al. [28] analyzed the fracture initiation and propagation using cohesive zone elements to study the effect of meso-structure on damage and failure in concrete.
The DEM has gained widespread acceptance among researchers due to its ability to model the morphology of various concrete components and represent cracks with simplicity and accuracy [29–32]. In DEM, ITZs can be represented by specific types of bonds with distinct mechanical properties compared to the bonds within cement or aggregates. When these bonds fail, it leads to the formation of cracks within the concrete structure. Zhu et al. [33] developed a DEM model that simulated the mechanical and fracture behavior of concrete. In their model, ITZs were represented as single-layer contact bonds between aggregate and mortar particles. Remarkably, this simulation accurately predicted the stress-strain response and the extent of damage in concrete under uniaxial compression. ITZs can also be explicitly modeled by a thinner layer in DEM. Nitka et al. [34] introduced a method that involved porous ITZs with defined width around aggregates to study damage in concrete that could gather the number of cracks that occurred in ITZs.
In previous studies, the mechanical properties of ITZs have typically been simplified by merely reducing the stiffness of cement, which fails to capture the observed heterogeneity in ITZ microstructures and properties as seen in experiments. Developing a more detailed numerical model that directly incorporates gradients in properties and morphology of ITZs is crucial. This advanced model would enable a comprehensive study of the relationship between ITZs and the macro mechanical behavior of concrete, providing a more realistic description of concrete damage behavior. In this paper, a new DEM-based ITZ model is introduced. This model integrates explicit internal structures and is executed through the Particle Flow Code. The research involves creating three-phase discrete element concrete models, with a key focus on the proposed ITZ model. Subsequently, the validity of this approach is confirmed through comparison with previous experimental findings. This approach allows for the simulation of damage evolution within concrete, encompassing key aspects such as crack initiation, propagation, and penetration. Moreover, the study explores the correlation between displacement patterns of particles and the initiation and propagation of cracks, particularly in the context of compression testing. This research holds the potential to offer valuable insights into the behavior of concrete under load, specifically shedding light on the intricacies of damage and fracture processes.
2 The DEM-Based Meso-Structure Model for Concrete
2.1 Generation of Aggregates for the Two-Dimensional (2D) Concrete Model
In this work, irregular polygons, their vertices positioned along circular paths, are utilized to represent actual aggregates. The center coordinates of these circles must adhere to the following equation to ensure they remain within the specified domain boundaries [35]:
where (x, y) is the coordinate of an arbitrary point on the aggregate; (x0, y0) is the center coordinate, r is the aggregate radius; xmin, xmax, ymin, ymax limit the range for dropping aggregates.
To prevent aggregate overlap and maintain a minimum distance between them, the circle centers of any two aggregates must satisfy the following condition [35]:
where
Sharp corners within aggregates, arising from randomly chosen vertices, significantly impact concrete’s mechanical properties, including compressive strength and elastic modulus. These corners act as stress concentrators, heightening the risk of localized failures thereby diminishing the material’s overall strength and stiffness. To mitigate the formation of sharp corners and extremely short edges in aggregates, the following Eq. (3) is employed to enhance aggregate quality [35]. This aids in refining the aggregate geometry to minimize stress concentrations and enhance the concrete's structural integrity.
where Lmin and Lmax are the length of minimum and maximum edges of polygon aggregates, respectively; αmin, αmax are the shape control parameters with the value of αmin = 0.333 and αmax = 1.8 in this work.
The three-dimensional spatial grading curve of aggregates should be transformed into a two-dimensional planar grading curve to construct the 2D concrete model. The Walraven formulation [36] is adopted in this study which converts the three-dimensional Fuller grading curve to a probability distribution of two-dimensional section size of aggregates.
where Pc(D < D0) denotes the probability of aggregates with a grain size less than D0; Pk represents the fraction of the total volume occupied by aggregates; Dmax is the aggregate’s maximum size.
Beyond the previously discussed generation method for concrete microstructures, recent studies have introduced several advanced methods in this domain. Wang et al. [37] expanded the generate-and-place approach to create 2D meso-structures. This method involved randomly distributing aggregates and pores of various shapes and contents within the concrete microstructure. The random fractal method was introduced by Yang et al. [38] to generate concrete aggregates based on fractal theory. Ma et al. [39] used the convex extension method to establish polyhedrons that represent coarse aggregates in a three-dimensional space. This technique was particularly useful for constructing concrete models with a high aggregate fraction. In the present study, with aggregates occupying only 40% of the volume, the methods outlined earlier are deemed adequate for constructing the concrete model as detailed in Section 2.2. These advanced methods offer researchers enhanced flexibility and precision in generating intricate and true-to-life concrete microstructures, catering to diverse analyses and simulations.
2.2 Construction of the Interfacial Transition Zone
In the discrete element method, ITZs are created through bonded particles. Constructing the ITZ meso-structure involves identifying shared contacts between the mortar and aggregates. Subsequently, particles involved in these contacts are grouped together based on the desired thickness of the ITZs. This process establishes the interconnectedness between mortar and aggregates, simulating the interfacial transition zones within the concrete microstructure. The process detailed involves several critical steps in creating and defining the ITZs within the concrete microstructure using Particle Flow Code:
(1) Import Aggregates Data:
Import data files generated by MATLAB containing vertex locations and topology relations for aggregates. This information defines the geometry and structure of the aggregates.
(2) Aggregates Identification in PFC:
Utilize the graphical function in PFC to designate particles as either aggregates or mortar. This classification separates the particles, allocating them to their respective components.
(3) Identify Contacts and Determine ITZs:
Apply Boolean arithmetic within PFC to ascertain contacts between the aggregates and mortar. This process identifies particles forming multilayer contacts, representing the ITZs. The identified particles within the ITZ region establish multilayer contacts, depicting the transition zones.
(4) Assign Mechanical Properties:
Assign distinct mechanical property parameters for aggregates, ITZs, and mortar components. These properties define the behavior and characteristics of each segment within the concrete microstructure, accounting for their individual properties and interactions.
This comprehensive process within Particle Flow Code allows for the accurate representation of aggregates, ITZs, and mortar, enabling the simulation of concrete behavior with varying properties in different regions of the material. Upon completing the above procedure, ITZs are represented by a group of particles, typically organized into three layers, which encompass five layers of ITZ contacts surrounding the aggregates. This structure accurately depicts the behavior of ITZs within the concrete microstructure, facilitating the study of concrete properties and fracture processes. Refer to Fig. 1 for a visual representation of this ITZ model.
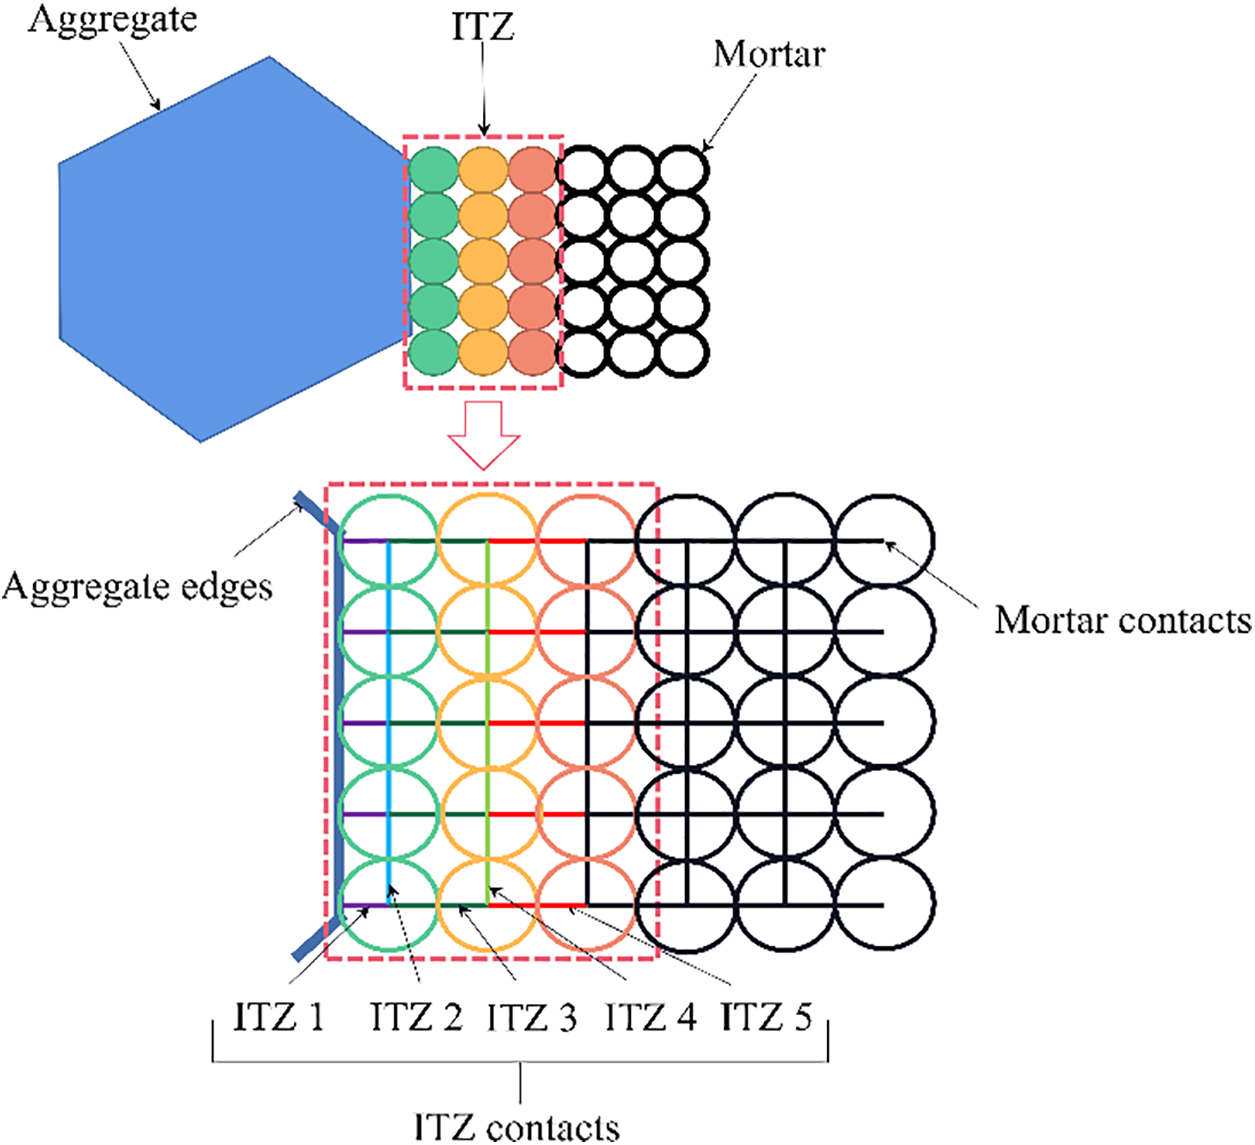
Figure 1: The illustration of ITZ meso-structure in the DEM-based model
Indeed, the new approach proposed in this method presents a significant advantage over previous models that utilized zero-thickness ITZ representations in FEM or DEM. By introducing a multi-layer structure for ITZs, this approach enables the simulation of heterogeneous properties within these transition zones. This added dimensionality allows for a more accurate representation of the complex and varied nature of ITZs, providing a more realistic depiction of their mechanical behavior within the concrete microstructure. The ITZ strength distribution of concrete is uneven and occupies a certain spatial range as observed in experiments [40]. The ITZ strength distribution of concrete can be achieved by assigning specific contact parameters that follow a certain distribution to five contacts illustrated by different colors (purple, blue, dark green, light green and red) in Fig. 1.
3 Model Calibration and Validation
To assess the effectiveness of the proposed model in this study, validation against experimental results is conducted. In the framework of the DEM, local contacts between particles affect the overall response of the model. Parameters of those contacts are difficult to obtain in a logical, theoretically rigorous way. Calibrating these meso-parameters typically involves a trial-and-error process. Researchers iteratively adjust the parameters, run simulations, and compare the model’s predictions to experimental data until a satisfactory match is achieved. This calibration process aims to fine-tune the model so that it accurately represents the real-world behavior of the materials being simulated.
The dimension of the sample is 150 mm in width and 300 mm in length, and the volume fraction of aggregates is 40%. The average radiuses of coarse, middle, and fine aggregates are set as 12.5, 8.75, and 5 mm, respectively, and the corresponding aggregate gradation is determined as 4:3:3. With these parameters, enough space is available around each aggregate for setting non-zero width ITZ meso-structures. The internal structure is constructed using the approach proposed in Section 2.2. The radius of particles in the model varies from 0.2 to 0.25 mm, depending on computing power and efficiency. The contact model is the parallel bond model (PBM). Details can be found in Potyondy’s study [41]. The final three-phase concrete model (consisting of 258,862 particles and 578,365 contacts) and the detailed view of ITZ meso-structure are shown in Fig. 2. Two wall components are established at the top and bottom of the specimens to transfer the displacement loading. The strain rate is set as 10−5 s−1, which can be translated to 0.003 m/s of walls velocity to ensure a quasi-static loading condition. It has been verified that this strain rate is sufficiently low to ensure the quasi-static loading condition in the numerical simulation using DEM [42].
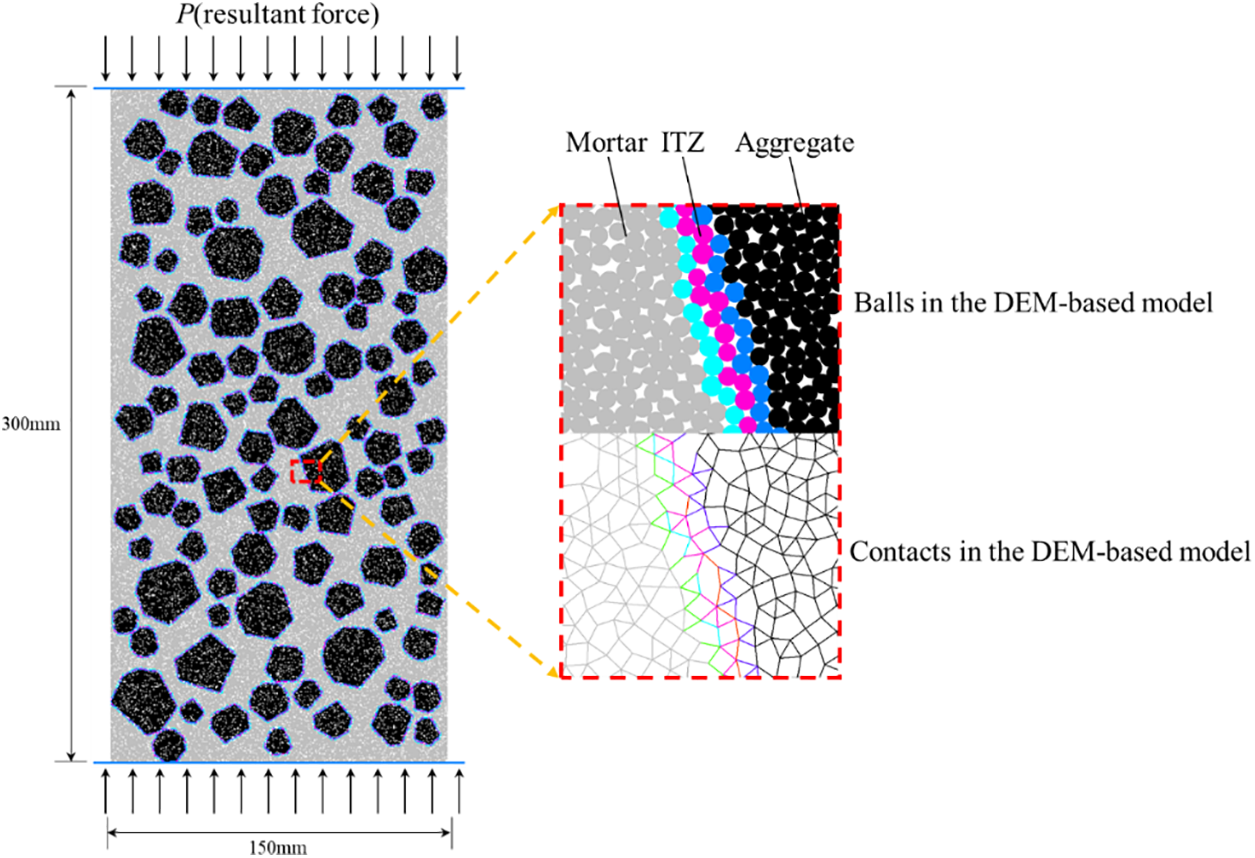
Figure 2: The illustration of ITZ meso-structure in the DEM-based model
The calibration process refers to [43], where parameters are established one at a time starting with the elastic parameters. According to Yoon [44], a variation in normal to shear ratio has a strong effect on Young's modulus; a variation in the Effective modulus of the bond has practically no effect on Poisson's ratio. After repeated calibration, the mesoscopic parameters are determined and listed in Table 1. The ratios of the strength of ITZs to mortar for five different contact layers of ITZs are shown in Table 2, which are followed by Ec, σt and c of ITZ contacts. Other parameters of ITZs are equal to those of mortar. The stress-strain curves of the current model and the experiment [45] are compared in Fig. 3. In the experiment, the raw materials used to fabricate the concrete specimens mainly include water, ordinary Portland cement, fine aggregates and coarse aggregates. The mechanical properties of aggregates can be referred to [45]. The uniaxial compressive test was conducted using a WDW-300 servo machine. To ensure a quasi-static loading condition, the loading rate was set as 0.05 mm/min. The result shows that the simulated stress-strain response is in good agreement with the results of the experiment. The peak stress and the observed curve shape are very well reproduced. However, some disparities between the predicted pre-peak and post-peak behavior and the corresponding results of the experiment have been observed. These differences may be attributed to several factors. The spatial distribution of aggregates used in the model is different from that of the experimental test, which will have an effect specifically on the post-peak behavior. Variation of elastic properties of aggregates and mortar in the experiment is not accounted for in the current model, which might be the reason for the difference in the pre-peak behavior. Despite these factors, the overall agreement between the simulation and the experiment demonstrates that the model is capable of reproducing the real mechanical behavior of concrete.
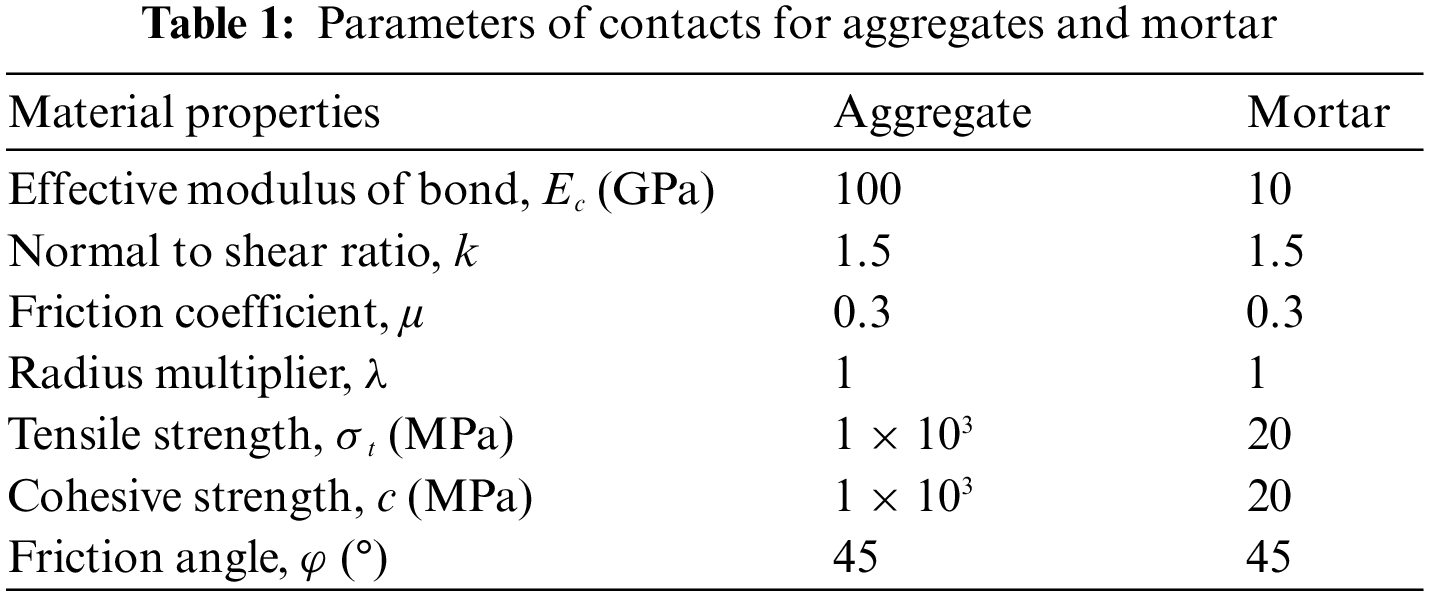
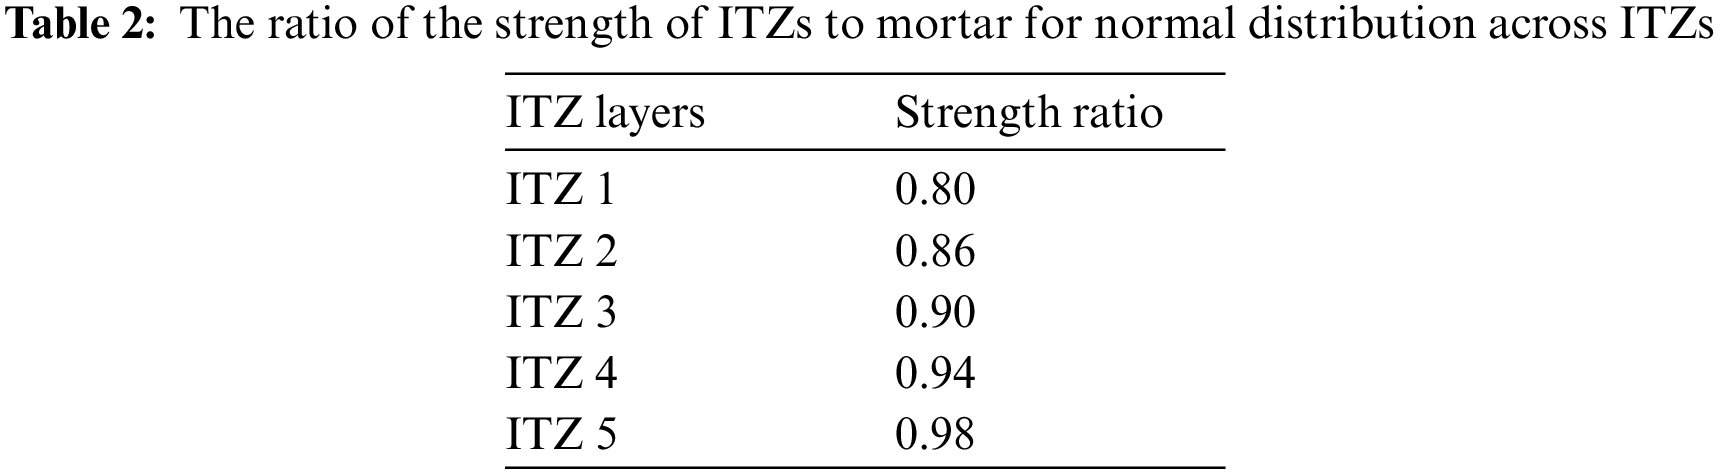
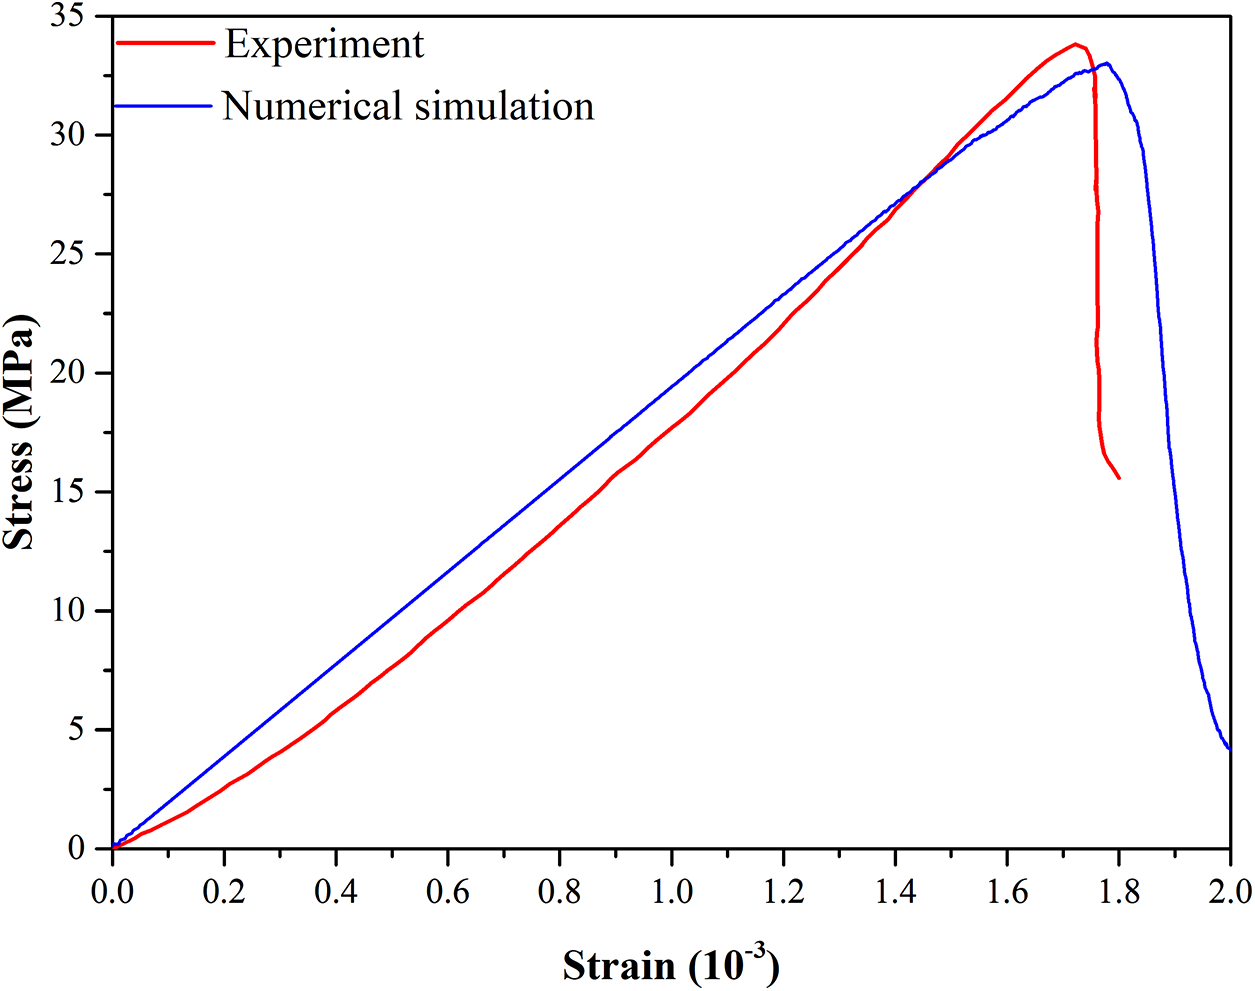
Figure 3: Comparison between strain-stress curves obtained from current model and the experimental test
The micro-crack propagation morphology in ITZs and mortar of the current model with that of Suchorzewski’s study [46] is compared in Fig. 4. It is obvious that the numerical concrete model in Fig. 4a reproduces crack bridging phenomenon of real concrete during deformation in Fig. 4b. In this model, cracks predominantly propagate through ITZs along aggregate particles as these zones are generally the weakest phases within concrete. When two interfacial cracks occur around adjacent aggregates, a crack within the mortar initiates to bridge the interfacial cracks so that a connected crack path is formed. A very high level of similarity can be seen in the crack patterns generated in the simulation and the experiment, indicating the capability of the developed model to predict the phenomenological damage and fracture processes. The successful reproduction of both the stress-strain relationship and the crack propagation phenomenon serves as a comprehensive confirmation of the current model’s capability to predict the mechanical behavior of concrete under uniaxial compression.
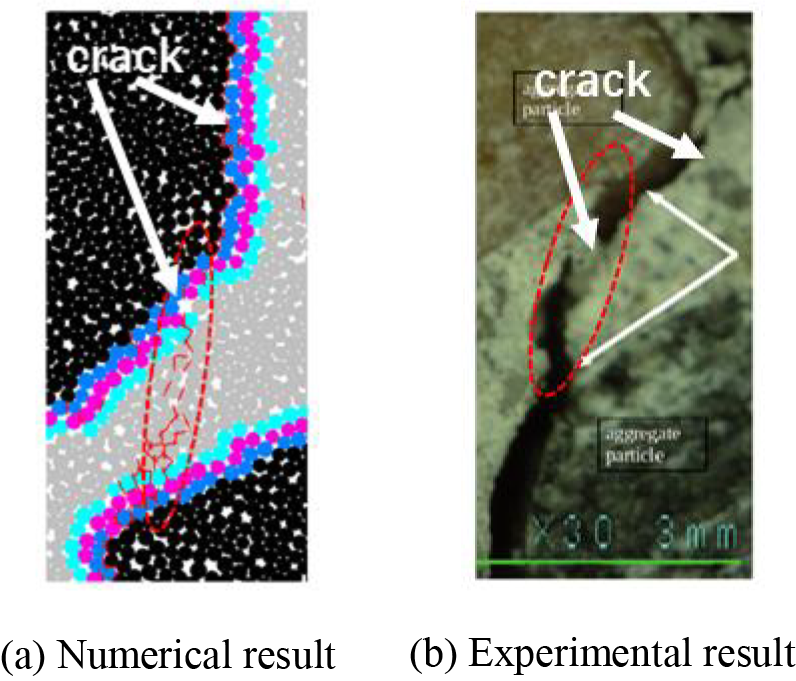
Figure 4: The illustration of ITZ meso-structure in the DEM-based model
The decision to set the radii of the particles based on the computing power of desktop computers is a practical and reasonable choice. In the current model, with an average particle radius of 0.225 mm, there are more than 260,000 particles. This configuration strikes a balance between computational feasibility and accuracy in representing the material. Setting the average particle radius at 0.025 mm, which is more in line with the typical ITZ thickness, would lead to an exceedingly large number of particles, exceeding the capabilities of desktop computers, with over 20 million particles. It's worth noting that in DEM, it is a common practice to adjust the particle size to model various materials effectively, including sand, soil, cement, and others. In this context, it is acceptable to have particle radii ranging from 0.2 to 0.25 mm, as it allows for a reasonable compromise between computational resources and accuracy. Regarding the representation of ITZs as three layers of particles in the model, it’s important to acknowledge that this expansion of the ITZ compared to real concrete could lead to an overestimation of the influence of weak zones around aggregates. This overestimation is a potential limitation to be aware of when interpreting the model’s results and their relevance to real-world conditions.
4 Damage Evolution Process Based on the Meso-Structure Model
4.1 Cracks Initiation, Propagation and Penetration Process
The current model holds a notable advantage in its capacity to thoroughly investigate and comprehensively analyze crack propagation—a task that is often challenging to achieve through experimentation alone. This upcoming section will concentrate on elucidating the entire crack evolution process, encompassing initiation, propagation, and penetration. Leveraging the numerical model and mesoscopic parameters detailed in Section 3, this analysis will provide a detailed understanding of how cracks initiate, spread, and penetrate within the concrete microstructure under various loading conditions. The loading process is divided into five stages according to the number of cracks and the stress value as shown in Fig. 5, to analyze the fracture patterns of concrete. The characteristics of each stage are described below. Stage I: During 0%–50% of the peak loading, only a few cracks, typically in single digits, appear within the concrete sample. Stage II: From 50%–80% of the peak loading, cracks continue to propagate gradually, increasing in number to approximately 1000. Stage III: The sample reaches its peak stress level, and the crack count reaches around 3000 at this stage. Stage IV: Post-peak loading sees a rapid surge in the number of cracks, escalating to approximately 10,000. Stage V: The concrete sample experiences complete destruction as the crack count reaches its maximum, culminating in the total failure of the material. The crack evolution process is illustrated in Fig. 6, and the corresponding analysis is presented as follows.
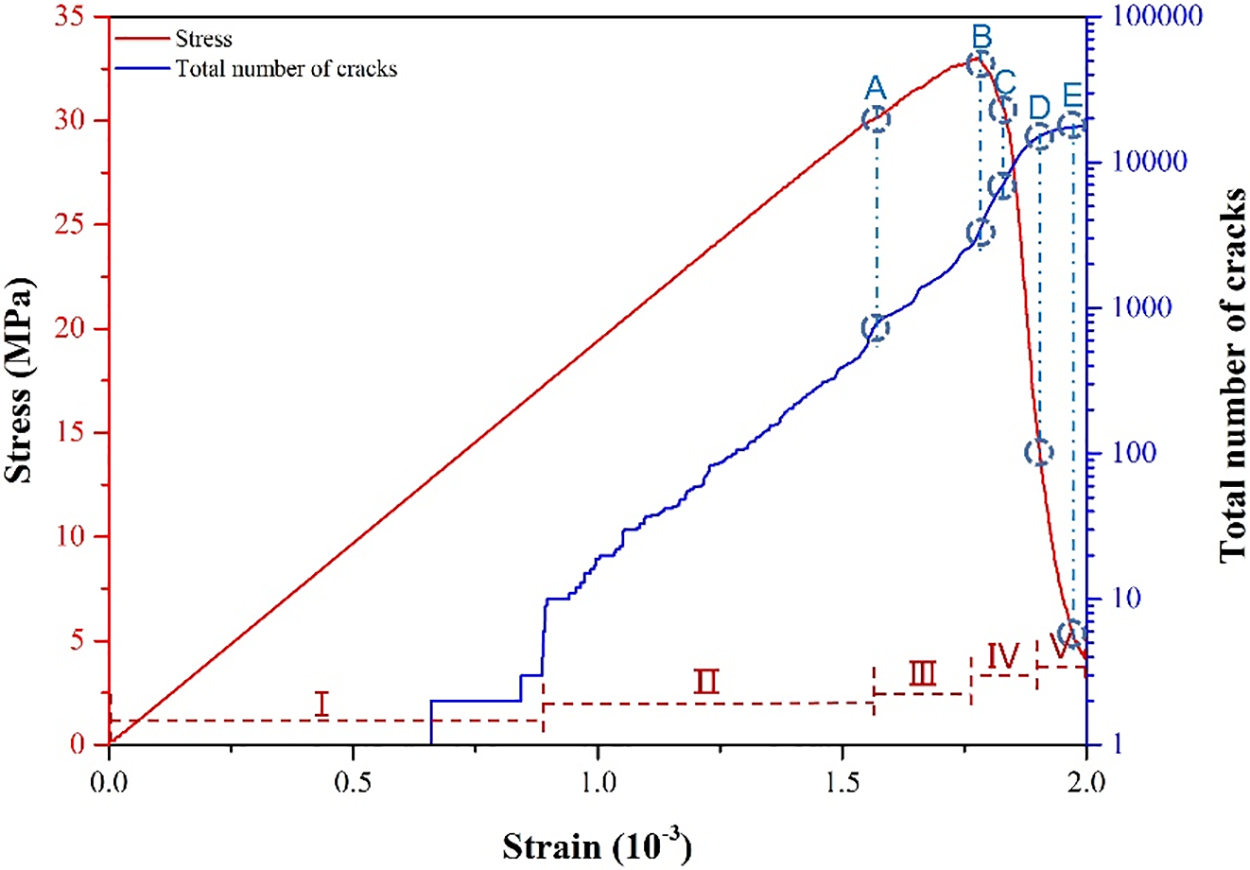
Figure 5: The stress-strain curve and cracks evolution process
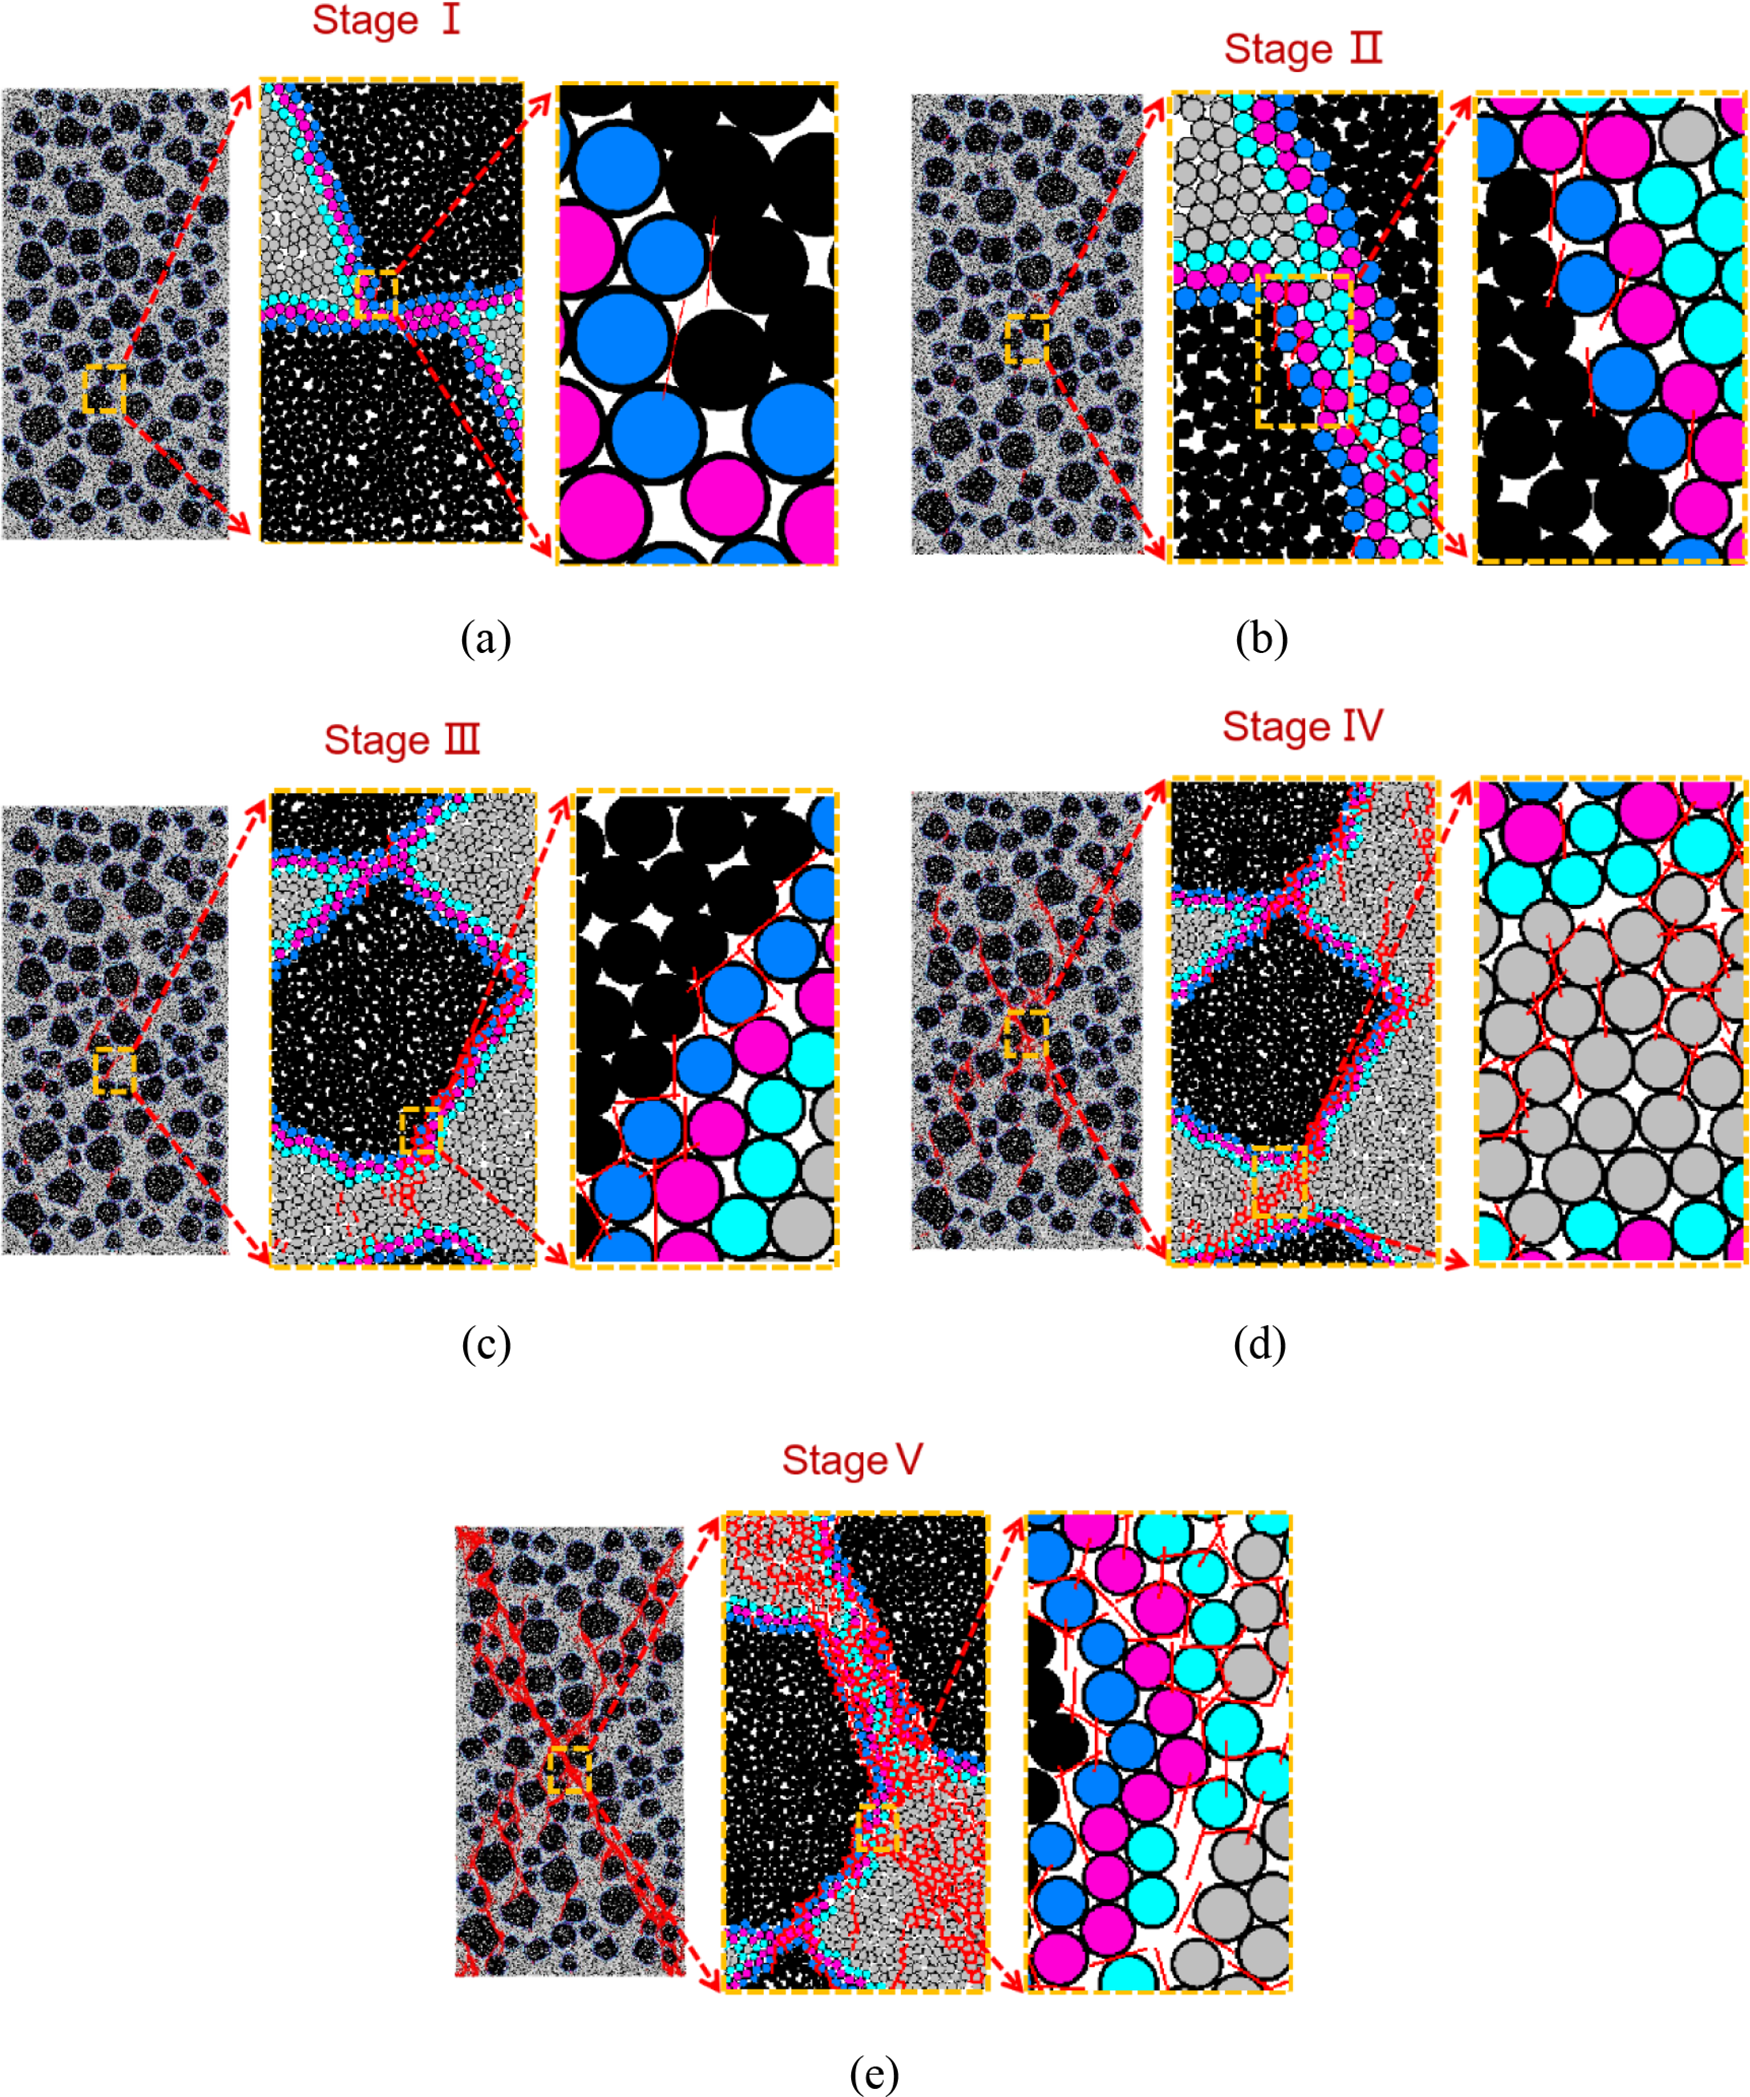
Figure 6: Cracks morphology at different stages
Stage I: The stress-strain curve shows a linear relationship, reflecting elastic deformation within the sample. Only a few initial cracks emerge within the ITZs, primarily concentrated in the center of the model. Fig. 6a demonstrates that the model experiences tensile stress in the horizontal direction due to the applied loading. This tensile stress concentrates at the center of the model, leading to the formation of the initial cracks. As anticipated, these initial cracks manifest within the ITZs, aligned parallel to the loading direction. This phenomenon aligns with the expected behavior, with the direction of crack propagation matching the direction of applied tensile stress.
Stage II: With the increasing load, the initial cracks extend outward. As shown in Fig. 6b, these cracks propagate within the area of the ITZs. Notably, no cracks are observed in the mortar or aggregate areas, underscoring the weaker nature of the ITZs within the concrete sample. Moreover, there is an observable trend where cracks in the ITZs tend to appear more readily in regions adjacent to aggregates. This trend highlights the propensity for cracks to propagate along the weaker ITZs surrounding the aggregates, emphasizing the critical role of these transition zones in the crack propagation process within the concrete microstructure.
Stage III: As cracks accumulate, partial interfacial transition zones undergo severe damage. This damage reaches a critical point where it leads to a significant separation between the aggregates and the ITZs, culminating in the emergence of a macro-crack, as depicted in Fig. 6c. The failure of these ITZs is consequential, resulting in stress release and the formation of numerous gaps around the aggregates. This significant structural damage around the aggregates signifies a critical phase in the fracture process, highlighting the pivotal role of ITZ integrity in maintaining the cohesion between aggregates and the surrounding matrix in concrete.
Stage IV: Stress levels are nearing the peak. Illustrated in Fig. 6d, cracks initially surrounding aggregates expand further into the mortar and begin to intersect with each other. The tensile force concentration at both ends of the crack leads to its propagation, exhibiting a tendency to spread from the center of the concrete specimen outward. This propagation results in the penetration of cracks, forming numerous narrow strip-like fracture areas within the material. The crack paths exhibit a tortuous nature, attributed to the presence of aggregates, contributing to the convoluted and intricate patterns observed during this phase of crack evolution.
Stage V: Macro-cracks persist and propagate further in the post-peak state until the concrete model ultimately fractures. As depicted in Fig. 6e, macro-cracks within the ITZs coalesce to form principal cracks traversing through the concrete model. The central crack of the main fracture is particularly severe, extending from the center to the corner of the model. Eventually, the concrete fractures into several fragments as a result of this extensive cracking and ultimate failure of the material. This phase represents the culmination of the fracture process, showcasing the progression from initial crack formation to the complete disintegration of the concrete specimen.
4.2 Evolution Mechanisms and Displacement Patterns of Cracks
In the early stages of failure, cracks initiate by tearing through the loading surfaces and the interfacial transition zones (ITZs). With the continuous increase in displacement loading, these cracks steadily expand, accompanied by an increase in their opening degree. Gradually, the model becomes increasingly penetrated by these expanding cracks, leading to its division into multiple sections or parts. Concurrently, as cracks propagate within the concrete, they exhibit diverse displacement forms. Using the particle displacement vector near the crack is a valuable method to analyze crack evolution under uniaxial compression. This technique involves employing the displacement vector to assess the crack state and understand the crack propagation law. By representing the particle displacement as red arrows in plots, the displacement form elucidates the direction and magnitude of movement for particles near the crack, offering insights into how cracks evolve and propagate within the concrete structure. The compression process in the concrete model reveals four primary displacement patterns, outlined in Fig. 7. (1) Tensile compliant pattern (displacement vectors move apart in nearly the same direction, indicative of tension or stretching forces within the material); (2) Tensile opposite pattern (displacement vectors diverge at a small, acute angle, signaling tension with opposing forces in the material); (3) Mixed tensile-shear pattern (displacement vectors spread apart at approximately a right angle, showcasing a combination of tension and shear forces within the concrete); (4) Shear opposite pattern (displacement vectors slide in opposite directions, suggesting predominant shear stress occurring in the material). For type 1, one displacement arrow is larger than another one, which indicates different displacement velocity on both sides of the crack. Five typical states are chosen and marked as A–E in Fig. 5. At each state, several representative locations are selected and marked by numbers, as shown in Fig. 8.
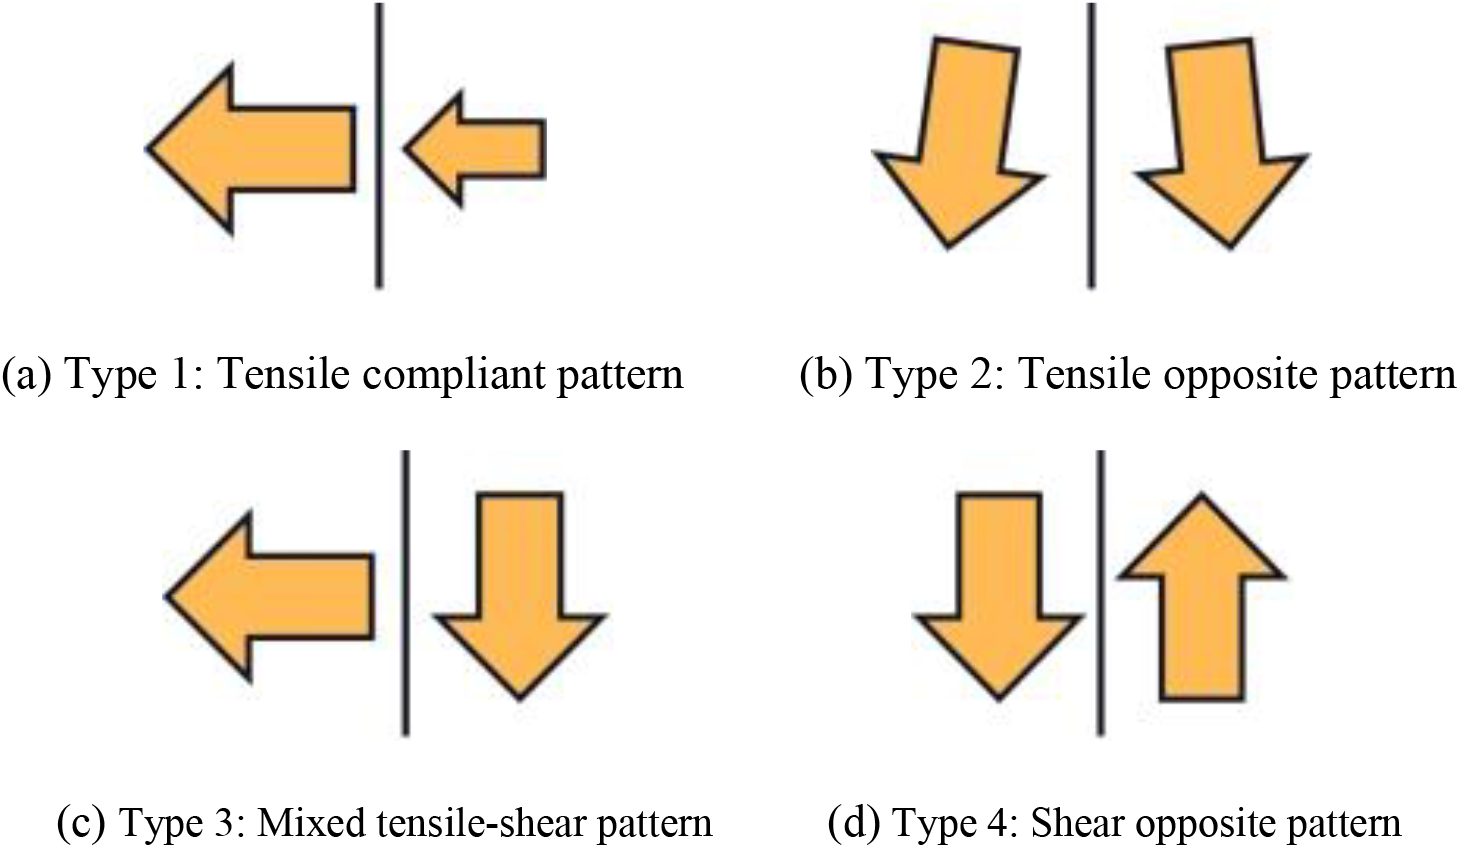
Figure 7: Four types of displacement patterns of cracks
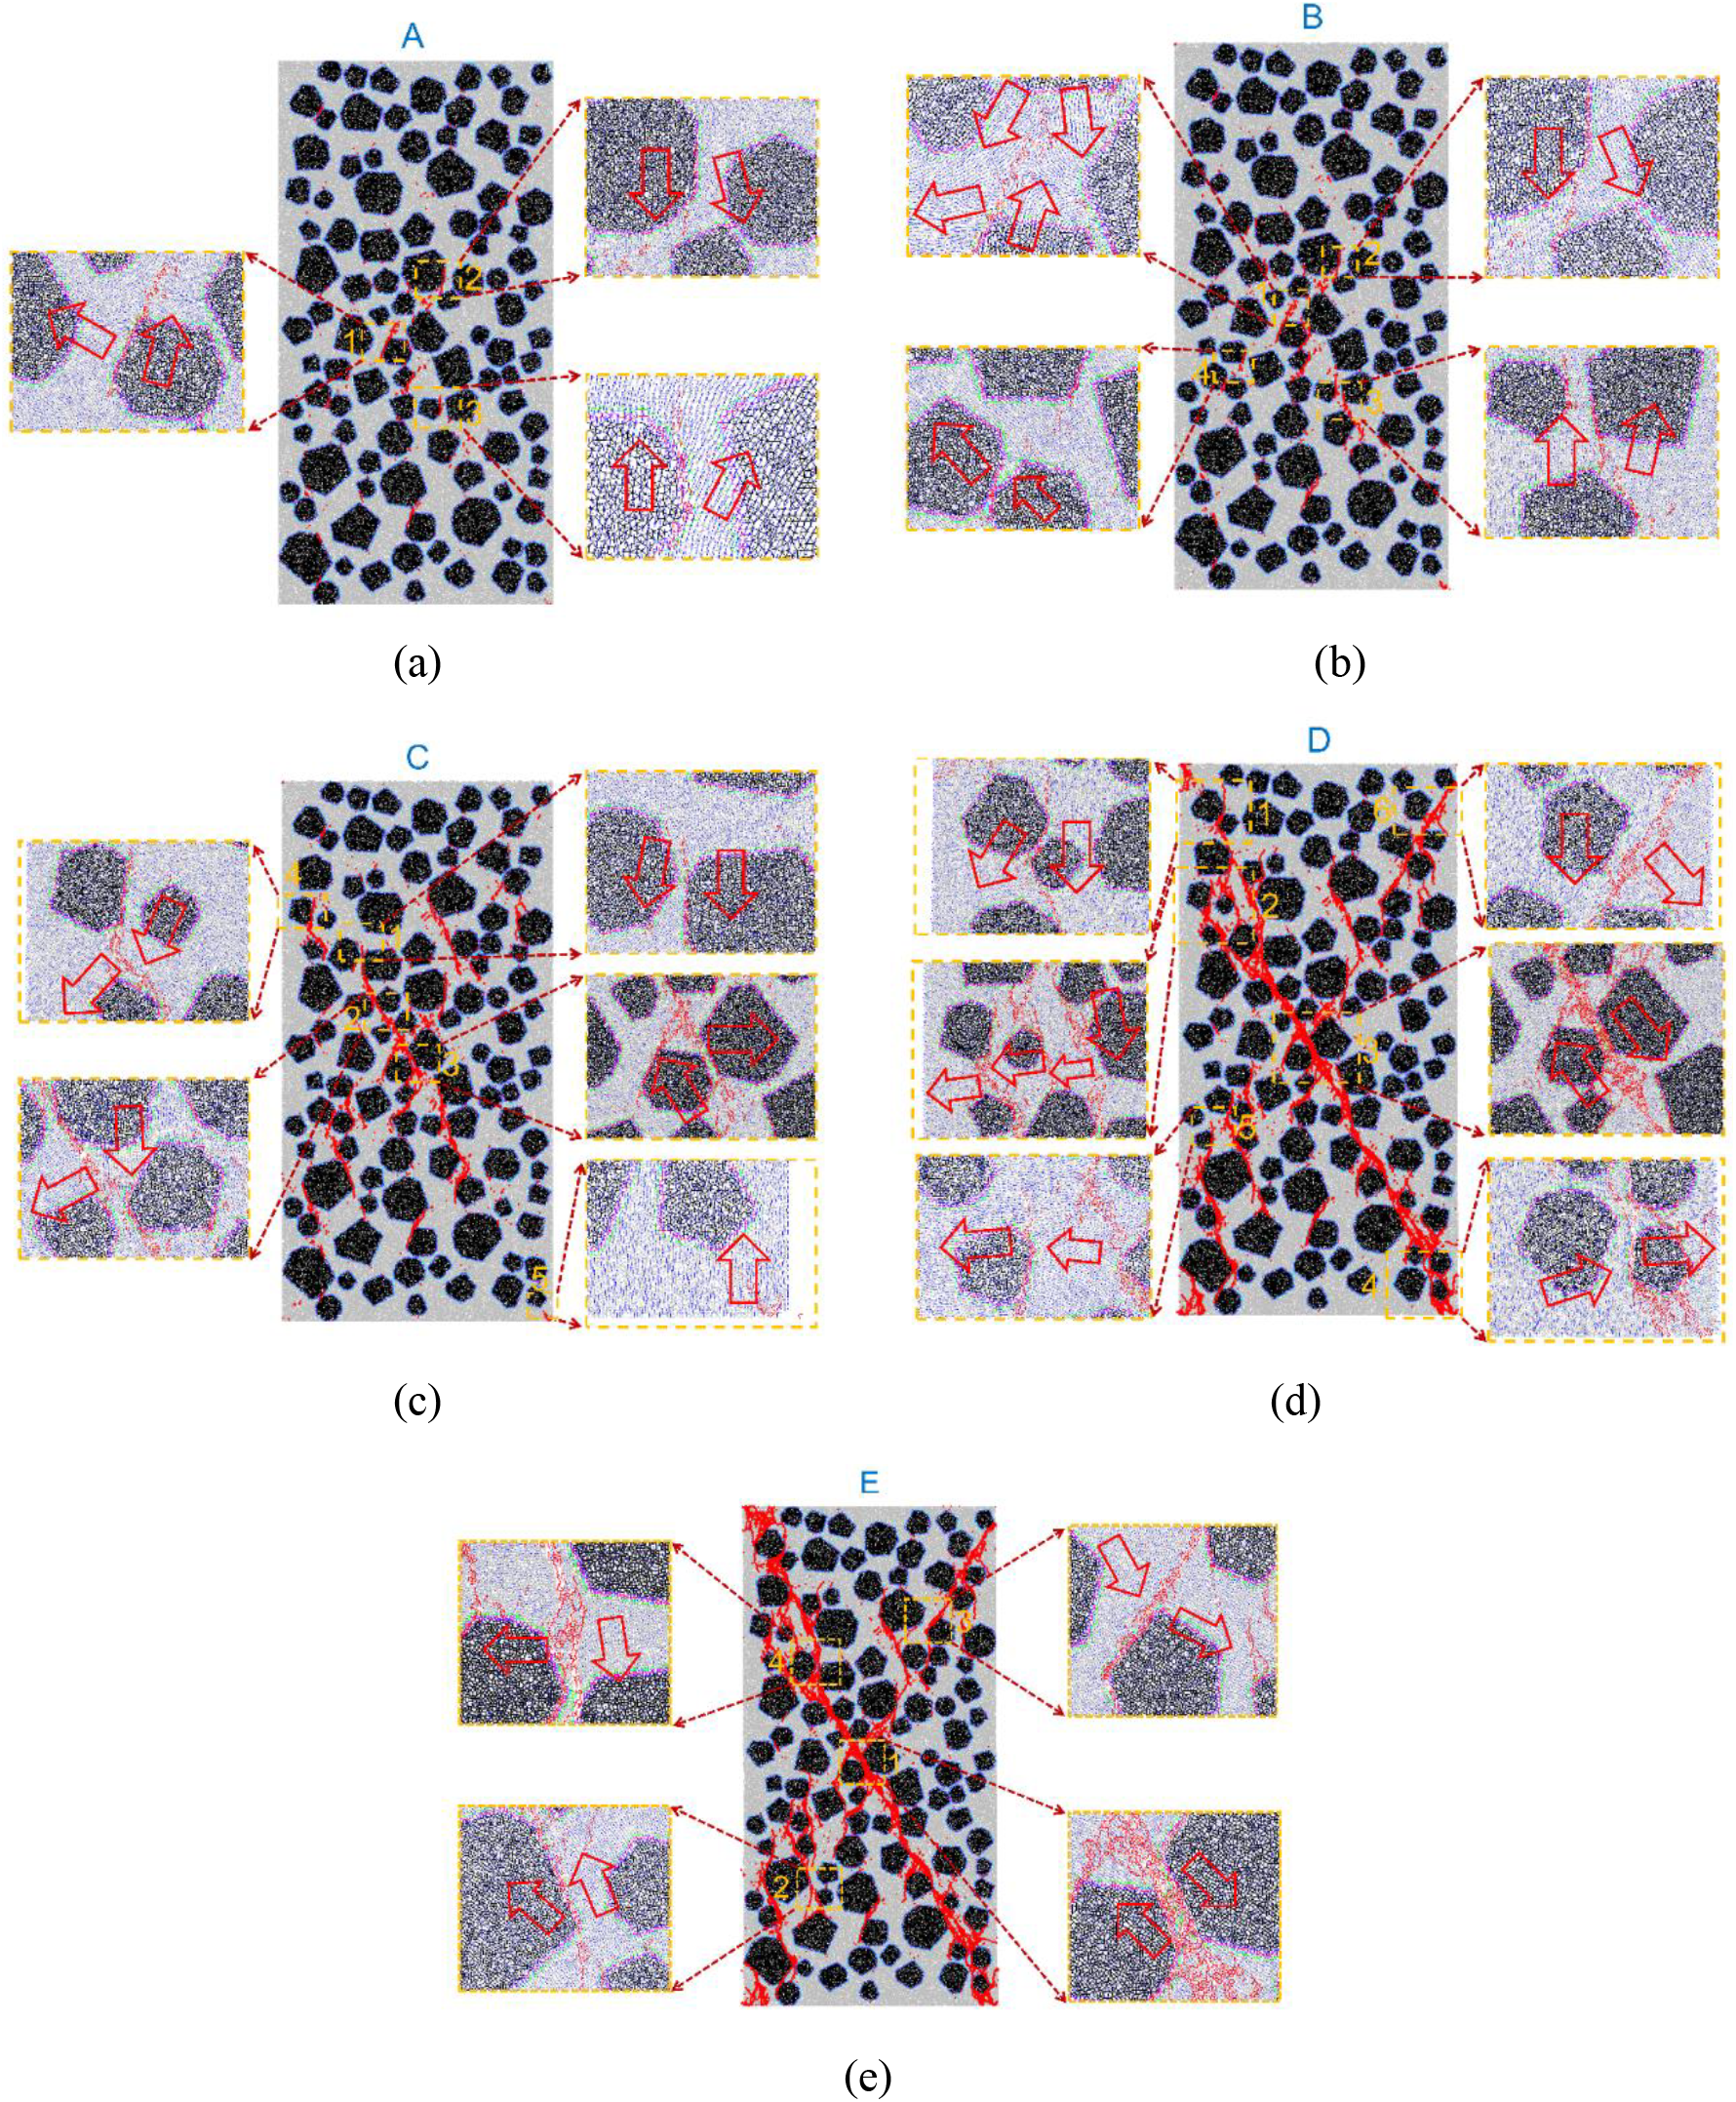
Figure 8: The illustration of the displacement vectors of cracks propagation
In Fig. 8a, the crack distribution diagram corresponding to state A illustrates micro-cracks surrounding aggregates that are extending towards the mortar. Macroscopic cracks are poised to emerge. Three specific locations (marked as 1, 2, and 3) are examined to observe displacement vectors around cracks. Location 1 illustrates the displacement vectors at the center of the concrete model. The mixed tensile-shear pattern is observed here which proves that the displacement vector direction at both ends of the crack is completely different. The tensile opposite pattern is observed at both locations 2 and 3. The opening degree of these vectors is smaller compared to location 1, indicating that the macroscopic crack is in an expansion phase but has not yet fully developed. This pattern suggests ongoing crack growth without complete macroscopic fracture formation.
In Fig. 8b, the crack distribution diagram for state B depicts the initial independent cracks connecting and merging into multiple macroscopic cracks. At location 1, alongside the previously observed mixed tensile-shear pattern, a new tensile opposite displacement vector emerges. This indicates the rapid propagation of cracks at the center of the concrete model. Regarding locations 2 and 3, the opening degree of displacement vectors gradually increases, signifying the ongoing expansion of cracks. Interestingly, a new displacement pattern, characterized by the tensile compliant type, emerges near the surface of the concrete model at location 4. This pattern involves compliant displacement vectors on both sides of cracks, representing a different mode of crack propagation near the surface compared to the previously observed patterns.
In Fig. 8c, the crack distribution diagram for state C illustrates the formation of a main macrocrack by connecting several microcracks through a convoluted path due to the presence of aggregates. Different displacement vector patterns are observed at locations 1–4, including the tensile opposite pattern, the tensile compliant pattern, and the mixed tensile-shear pattern. These diverse patterns signify the complex nature of forces influencing the main macrocrack’s behavior. The tensile-compliant displacement pattern continues to occur in the area close to the surface of concrete at location 4, and micro-cracks from the load side also start to propagate into the interior of concrete at location 5.
In Fig. 8d, the crack distribution diagram for state D reveals that a macrocrack traverses the concrete model from the top left to the bottom right, effectively splitting the entire structure. The presence of this macrocrack leads to a slowdown in the propagation velocity of other cracks. This reduction in propagation speed is attributed to the decreased efficiency of stress transfer within the separated sections of the concrete model. Locations 1, 2, 3, and 4 represent different spatial states of the major macrocracks. It is shown that the shear opposite pattern of displacement vectors appears at the center of the macrocrack, which indicates the facture of the concrete model. Along the direction of the macrocrack from the center to the end, the mixed shear tensile pattern, the tensile opposite pattern, and the tensile compliant pattern of displacement vectors appear sequentially, with the opening degree gradually decreasing.
In Fig. 8e, the crack distribution diagram for state E displays the presence of another significant macrocrack extending from the top right to the bottom left of the concrete model. This additional macroscopic crack intensifies the division of the concrete model into multiple fragments, signifying an advanced stage of cracking and severe damage within the material. At various locations throughout the concrete model, four types of displacement vectors are observed, indicating diverse patterns of deformation and crack propagation. These displacement patterns provide valuable insights into the intricate and complex processes of deformation and crack evolution occurring at different regions within the model. These observations contribute to a comprehensive understanding of the final stages of fracture and damage within the concrete specimen.
We have also investigated the effect of heterogeneity of microstructures and properties of ITZs on the macro properties of concrete by setting three different distributions of ITZ strength which are incremental distribution, U shape distribution and average distribution. Related work refers to [47]. By examining these variations, researchers can gain insights into how the heterogeneity of ITZ properties influences the behavior of concrete on a macroscopic scale.
In order to investigate the crack propagation and damage evolution of concrete under uniaxial compression comprehensively, a DEM-based model which can consider the meso-structure using defined-width ITZs is established. This simulating method has been validated by published experiment results. The model is effective in predicting the damage and failure process of concrete and can provide detailed displacement trends around cracks. The main conclusions from the study are listed as follows.
In the early stages of uniaxial compression, initial cracks tend to emerge within the interfacial transition zones of the concrete. As the applied load intensifies, these ITZ cracks gradually accumulate and amalgamate into macroscopic fractures that penetrate the mortar matrix between aggregates, resulting in a confined fracture area. Simultaneously, these fractures propagate along the peripheries of the aggregates, creating a convoluted, intricate crack pattern. The emergence of macroscopic cracks triggers force redistribution and varying displacements within the concrete structure. Subsequently, tensile forces concentrate at the tips of these cracks, steering their progression until the concrete nears failure.
Crack propagation states in concrete under uniaxial compression are evaluated using displacement vectors, unveiling four distinct displacement patterns: tensile compliant, tensile opposite, mixed tensile-shear, and shear opposite. The widening opening angles of these patterns signify the evolving stages of crack development. The presence of a tensile compliant pattern commonly accompanies the initiation of cracks, while the emergence of the shear opposite pattern signifies the imminent failure or final breakage of the concrete model. These patterns serve as indicators of different stages within the crack evolution process, providing valuable insights into the structural behavior and ultimate failure of the concrete specimen.
Acknowledgement: The authors wish to express their appreciation to the reviewers for their helpful suggestions which greatly improved the presentation of this paper.
Funding Statement: This work is partially funded by the Research Project Supported by Shanxi Scholarship Council of China (2022-067), the Opening Project of State Key Laboratory of Explosion Science and Technology (Beijing Institute of Technology) (KFJJ22-14M).
Author Contributions: Study conception and design: Weiliang Gao, Shixu Jia, Guoqiang Deng, Tingting Zhao; analysis and interpretation of results: Weiliang Gao, Guoqiang Deng, Tingting Zhao, Zhiyong Wang; draft manuscript preparation: Weiliang Gao, Shixu Jia. All authors reviewed the results and approved the final version of the manuscript.
Availability of Data and Materials: The data sets generated and analyzed in the current study are available by the authors on reasonable request.
Conflicts of Interest: The authors declare that they have no conflicts of interest to report regarding the present study.
References
1. Xu, X., Ma, T., Ning, J. (2019). Failure analytical model of reinforced concrete slab under impact loading. Construction and Building Materials, 223, 679–691. [Google Scholar]
2. Sun, J., Xie, J., Zhou, Y., Zhou, Y. (2022). A 3D three-phase meso‐scale model for simulation of chloride diffusion in concrete based on ANSYS. International Journal of Mechanical Sciences, 219, 107127. [Google Scholar]
3. Ma, H., Tu, Y., Yu, H., Diao, Y., Han, W. et al. (2023). Mechanical properties and microstructural characteristics of coral-aggregate-concrete ITZ: Experimental study. Journal of Building Engineering, 72, 106647. [Google Scholar]
4. Gao, Y., Zhu, X., Corr, D. J., Konsta-Gdoutos, M. S., Shah, S. P. (2019). Characterization of the interfacial transition zone of CNF-Reinforced cementitious composites. Cement and Concrete Composites, 99,130–139. [Google Scholar]
5. Lyu, K., Garboczi, E. J., She, W., Miao, C. (2019). The effect of rough vs. smooth aggregate surfaces on the characteristics of the interfacial transition zone. Cement and Concrete Composites, 99, 49–61. [Google Scholar]
6. Jingjing, Z., Qing, Z., Dan, H., Feng, S. (2016). A peridynamic approach for the simulation of calcium silicate hydrate nanoindentation. Advances in Cement Research, 28(2), 84–91. [Google Scholar]
7. Xia, X., Chen, F., Gu, X., Fang, N., Zhang, Q. (2021). Interfacial debonding constitutive model and XFEM simulation for mesoscale concrete. Computers & Structures, 242, 106373. [Google Scholar]
8. Scrivener, K. L., Gartner, E. M. (1987). Microstructural gradients in cement paste around aggregate particles. MRS Online Proceedings Library (OPL), 114, 77. [Google Scholar]
9. Garboczi, E. J., Bentz, D. P. (1997). Analytical formulas for interfacial transition zone properties. Advanced Cement Based Materials, 6(3–4), 99–108. [Google Scholar]
10. Simeonov, P., Ahmad, S. (1995). Effect of transition zone on the elastic behavior of cement-based composites. Cement and Concrete Research, 25(1), 165–176. [Google Scholar]
11. Lutz, M. P., Zimmerman, R. W. (1996). Effect of the interphase zone on the bulk modulus of a particulate composite. Journal of Applied Mechanics, 63(4), 855–861. [Google Scholar]
12. Lutz, M. P., Monteiro, P. J. M., Zimmerman, R. W. (1997). Inhomogeneous interfacial transition zone model for the bulk modulus of mortar. Cement and Concrete Research, 27(7), 1113–1122. [Google Scholar]
13. Sicat, E., Gong, F., Ueda, T., Zhang, D. (2014). Experimental investigation of the deformational behavior of the interfacial transition zone (ITZ) in concrete during freezing and thawing cycles. Construction and Building Materials, 65, 122–131. [Google Scholar]
14. Wong, H. S., Zobel, M., Buenfeld, N. R., Zimmerman, R. W. (2009). Influence of the interfacial transition zone and microcracking on the diffusivity, permeability and sorptivity of cement-based materials after drying. Magazine of Concrete Research, 61(8), 571–589. [Google Scholar]
15. Ma, H., Hou, D., Li, Z. (2015). Two-scale modeling of transport properties of cement paste: Formation factor, electrical conductivity and chloride diffusivity. Computational Materials Science, 110, 270–280. [Google Scholar]
16. Ren, W., Yang, Z., Sharma, R., Zhang, C., Withers, P. J. (2015). Two-dimensional X-ray CT image based meso-scale fracture modelling of concrete. Engineering Fracture Mechanics, 133, 24–39. [Google Scholar]
17. Trawiński, W., Bobiński, J., Tejchman, J. (2016). Two-dimensional simulations of concrete fracture at aggregate level with cohesive elements based on X-ray μCT images. Engineering Fracture Mechanics, 168, 204–226. [Google Scholar]
18. Trawiński, W., Tejchman, J., Bobiński, J. (2018). A three-dimensional meso-scale approach with cohesive elements to concrete fracture based on X-ray μCT images. Engineering Fracture Mechanics, 189, 27–50. [Google Scholar]
19. Zheng, J. J., Guo, Z. Q., Pan, X. D., Stroeven, P., Sluys, L. J. (2011). ITZ volume fraction in concrete with spheroidal aggregate particles and application: Part I. Numerical algorithm. Magazine of Concrete Research, 63(7), 473–482. [Google Scholar]
20. Nitka, M., Tejchman, J. (2015). Modelling of concrete behaviour in uniaxial compression and tension with DEM. Granular Matter, 17, 145–164. [Google Scholar]
21. Suchorzewski, J., Tejchman, J., Nitka, M. (2018). Experimental and numerical investigations of concrete behaviour at meso-level during quasi-static splitting tension. Theoretical and Applied Fracture Mechanics, 96, 720–739. [Google Scholar]
22. Gu, X., Li, X., Xia, X., Madenci, E., Zhang, Q. (2023). A robust peridynamic computational framework for predicting mechanical properties of porous quasi-brittle materials. Composite Structures, 303, 116245. [Google Scholar]
23. Chen, W., Gu, X., Zhang, Q., Xia, X. (2021). A refined thermo-mechanical fully coupled peridynamics with application to concrete cracking. Engineering Fracture Mechanics, 242, 107463. [Google Scholar]
24. Wriggers, P., Moftah, S. O. (2006). Mesoscale models for concrete: Homogenisation and damage behaviour. Finite Elements in Analysis and Design, 42(7), 623–636. [Google Scholar]
25. Unger, J. F., Eckardt, S., Könke, C. (2007). Modelling of cohesive crack growth in concrete structures with the extended finite element method. Computer Methods in Applied Mechanics and Engineering, 96(41–44), 4087–4100. [Google Scholar]
26. Song, S. H., Paulino, G. H., Buttlar, W. G. (2006). Simulation of crack propagation in asphalt concrete using an intrinsic cohesive zone model. Journal of Engineering Mechanics, 132(11), 1215–1223. [Google Scholar]
27. Tijssens, M. G. A., Sluys, B. L. J., van der Giessen, E. (2000). Numerical simulation of quasi-brittle fracture using damaging cohesive surfaces. European Journal of Mechanics-A/Solids, 19(5), 761–779. [Google Scholar]
28. Wang, X., Zhang, M., Jivkov, A. P. (2016). Computational technology for analysis of 3D meso-structure effects on damage and failure of concrete. International Journal of Solids and Structures, 80, 310–333. [Google Scholar]
29. Nitka, M., Tejchman, J. (2015). Modelling of concrete fracture at aggregate level using FEM and DEM based on X-ray μCT images of internal structure. Engineering Fracture Mechanics, 147, 13–35. [Google Scholar]
30. Qin, C., Zhang, C. (2011). Numerical study of dynamic behavior of concrete by meso-scale particle element modeling. International Journal of Impact Engineering, 38(12), 1011–1021. [Google Scholar]
31. Kim, H., Wagoner, M. P., Buttlar, W. G. (2008). Simulation of fracture behavior in asphalt concrete using a heterogeneous cohesive zone discrete element model. Journal of Materials in Civil Engineering, 20(8), 552–563. [Google Scholar]
32. Buttlar, W. G., You, Z. (2001). Discrete element modeling of asphalt concrete: Microfabric approach. Transportation Research Record, 1757(1), 111–118. [Google Scholar]
33. Zhu, R., Alam, S. Y., Loukili, A. (2019). A comprehensive approach for mesoscale discrete element modelling of mechanical and fracture behavior of concrete. Granular Matter, 1, 1–19. [Google Scholar]
34. Nitka, M., Tejchman, J. (2020). Meso-mechanical modelling of damage in concrete using discrete element method with porous ITZs of defined width around aggregates. Engineering Fracture Mechanics, 31, 107029. [Google Scholar]
35. Che, Q., Zhang, Y., Zhang, J., Wang, Z., Wang, Z. (2020). Study on mesoscopic modelling method of two-dimensional concrete with voids. Applied Mathematics & Mechanics, 41(2), 182–194. [Google Scholar]
36. Wang, Y., Peng, Y., Kamel, M. M. A., Gong, L. (2020). Modeling interfacial transition zone of RAC based on a degenerate element of BFEM. Construction and Building Materials, 52, 119063. [Google Scholar]
37. Wang, X. F., Yang, Z. J., Yates, J. R., Jivkov, A. P., Zhang, C. (2015). Monte Carlo simulations of mesoscale fracture modelling of concrete with random aggregates and pores. Construction and Building Materials, 75, 35–45. [Google Scholar]
38. Yang, X., Wang, F. (2015). Random-fractal-method-based generation of meso-model for concrete aggregates. Powder Technology, 284, 63–77. [Google Scholar]
39. Ma, H., Xu, W., Li, Y. (2016). Random aggregate model for mesoscopic structures and mechanical analysis of fully-graded concrete. Computers & Structures, 177, 103–113. [Google Scholar]
40. Vargas, P., Restrepo-Baena, O., Tobón, J. I. (2017). Microstructural analysis of interfacial transition zone (ITZ) and its impact on the compressive strength of lightweight concretes. Construction and Building Materials, 137, 381–389. [Google Scholar]
41. Potyondy, D. O., Cundall, P. A. (2004). A bonded-particle model for rock. International Journal of Rock Mechanics and Mining Sciences, 41(8), 1329–1364. [Google Scholar]
42. Leon, R. T., Deierlein, G. G. (1996). Considerations for the use of quasi-static testing. Earthquake Spectra, 12(1), 87–109. [Google Scholar]
43. Ibarra, J., Estay, D., Pacheco, A., Guzmán, L., Barraza, R. et al. (2022). Bond calibration method for macroparameters using the discrete element method framework. Engineering Fracture Mechanics, 262, 108223. [Google Scholar]
44. Yoon, J. (2007). Application of experimental design and optimization to PFC model calibration in uniaxial compression simulation. International Journal of Rock Mechanics and Mining Sciences, 44(6), 871–889. [Google Scholar]
45. Ren, H., Song, S., Ning, J. (2022). Damage evolution of concrete under tensile load using discrete element modeling. Theoretical and Applied Fracture Mechanics, 122, 103622. [Google Scholar]
46. Suchorzewski, J., Tejchman, J., Nitka, M. (2018). Discrete element method simulations of fracture in concrete under uniaxial compression based on its real internal structure. International Journal of Damage Mechanics, 27(4), 578–607. [Google Scholar]
47. Jia, S., Zhao, T., Wu, P., Li, Z., Wang, Z. (2023). Influence of interfacial transition zone on crack propagation process in concrete. Chinese Journal of High Pressure Physics, 37(4), 1–12 (In Chinese). [Google Scholar]
Cite This Article
 Copyright © 2024 The Author(s). Published by Tech Science Press.
This work is licensed under a Creative Commons Attribution 4.0 International License , which permits unrestricted use, distribution, and reproduction in any medium, provided the original work is properly cited.
 Downloads
 Citation Tools