
 Submit a Paper
 Propose a Special lssue
 Open Access
ARTICLE

Research on the Generation Mechanism and Suppression Method of Aerodynamic Noise in Expansion Cavity Based on Hybrid Method
1 School of Mechanotronics and Vehicle Engineering, East China Jiaotong University, Nanchang, 330013, China
2 Suzhou Automotive Research Institue, Tsinghua University, Suzhou, 215131, China
* Corresponding Author: Haitao Liu. Email:
Computer Modeling in Engineering & Sciences 2024, 139(3), 2747-2772. https://doi.org/10.32604/cmes.2024.047129
Received 26 October 2023; Accepted 02 January 2024; Issue published 11 March 2024
 View Full Text
 Download PDF
Abstract
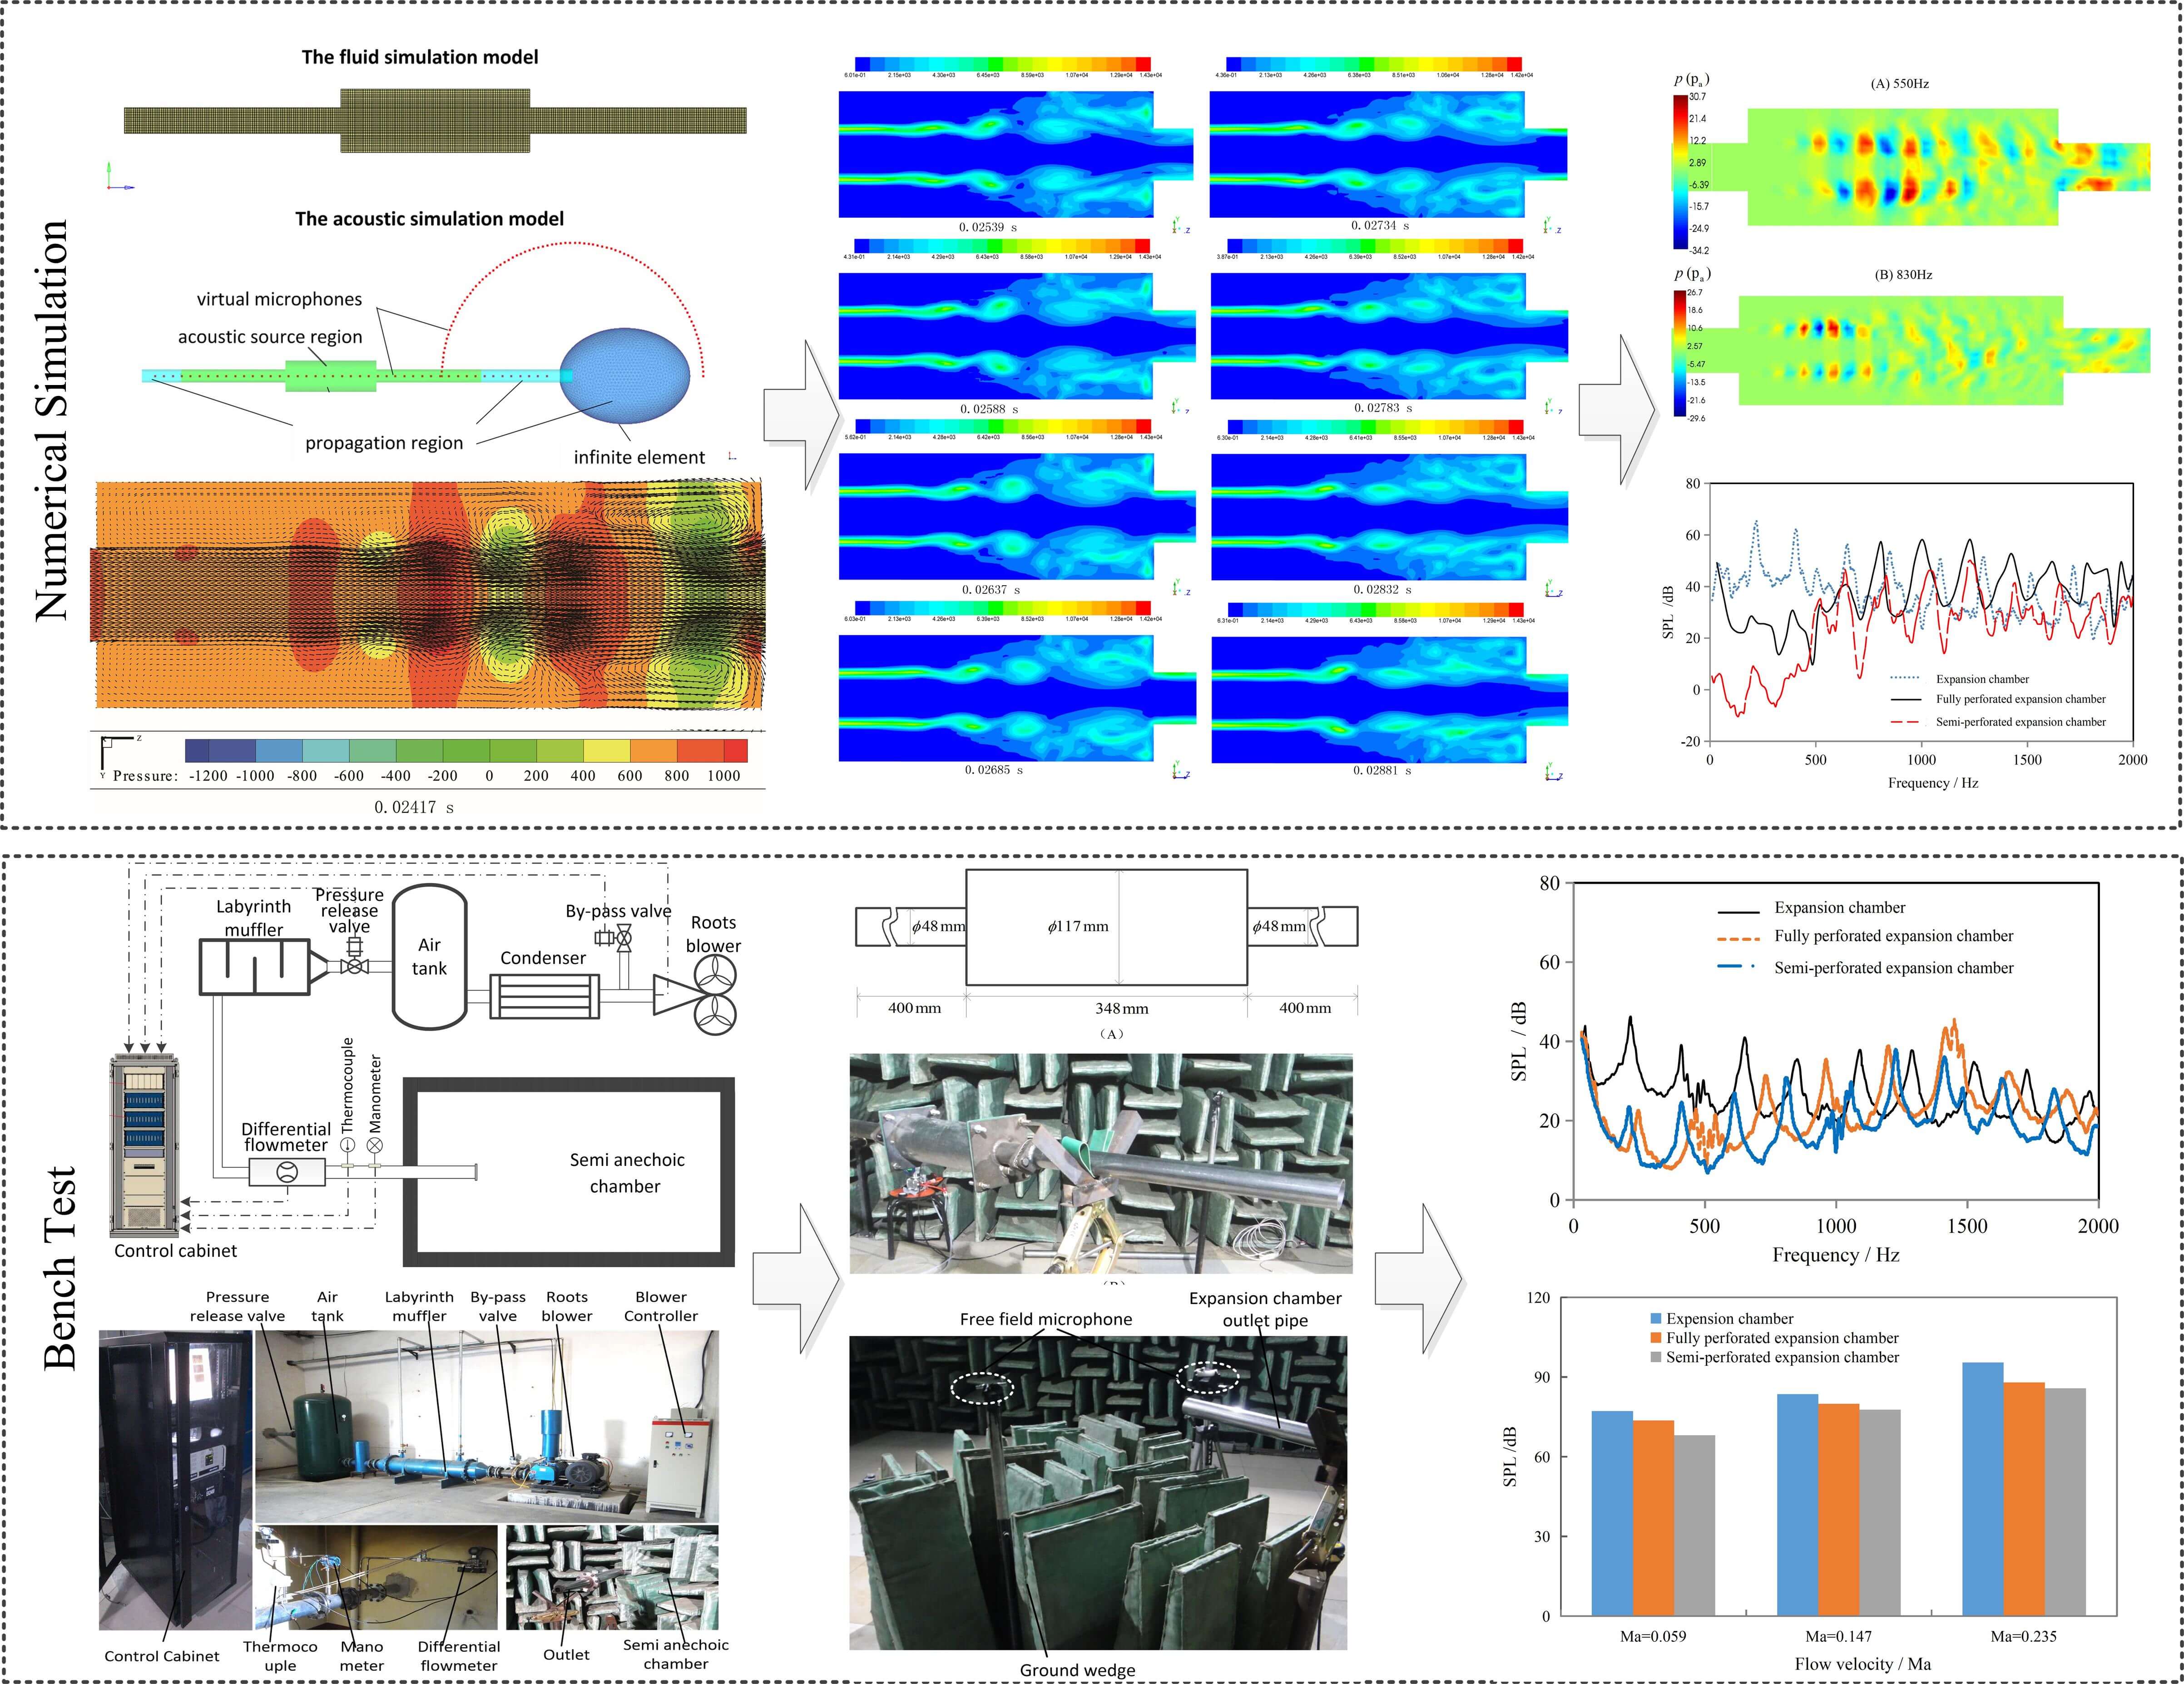
The expansion chamber serves as the primary silencing structure within the exhaust pipeline. However, it can also act as a sound-emitting structure when subjected to airflow. This article presents a hybrid method for numerically simulating and analyzing the unsteady flow and aerodynamic noise in an expansion chamber under the influence of airflow. A fluid simulation model is established, utilizing the Large Eddy Simulation (LES) method to calculate the unsteady flow within the expansion chamber. The simulation results effectively capture the development and changes of the unsteady flow and vorticity inside the cavity, exhibiting a high level of consistency with experimental observations. To calculate the aerodynamic noise sources within the cavity, the flow field results are integrated using the method of integral interpolation and inserted into the acoustic grid. The acoustic analogy method is then employed to determine the aerodynamic noise sources. An acoustic simulation model is established, and the flow noise source is imported into the sound field grid to calculate the sound pressure at the far-field response point. The calculated sound pressure levels and resonance frequencies show good agreement with the experimental results. To address the issue of airflow regeneration noise within the cavity, perforated tubes are selected as a means of noise suppression. An experimental platform for airflow regeneration noise is constructed, and experimental samples are processed to analyze and verify the noise suppression effect of perforated tube expansion cavities under different airflow velocities. The research findings indicate that the perforated tube expansion cavity can effectively suppress low-frequency aerodynamic noise within the cavity by impeding the formation of strong shear layers. Moreover, the semi-perforated tube expansion cavity demonstrates the most effective suppression of aerodynamic noise.Graphic Abstract
Keywords
Nomenclature of the Symbols
| The upstream and downstream propagation of sound pressure components in the inlet pipe of the expansion chamber | |
| The upstream and downstream propagation of sound pressure components in the outlet pipe of the expansion chamber | |
| The propagation components of flow-generated noise in the chamber, propagating upstream and downstream, respectively | |
| The spatial domain truncation scale | |
| The time domain truncation scale | |
| The velocity components | |
| The fluid density | |
| The fluid viscosity | |
| The subgrid-scale stress (SGS) | |
| The large-scale strain rate tensor | |
| The Kronecker delta function | |
| The subgrid-scale eddy viscosity | |
| The predefined constant | |
| The function of velocity components | |
| The speed of sound | |
| The Lighthill stress tensor | |
| The amount of density fluctuation | |
| The Kronecker function | |
| The pressure | |
| The spatial coordinate vectors | |
| The surface normal vector | |
| The frequency domain field quantity | |
| The time domain field quantity | |
| N | The total number of discrete points |
| The Mach number | |
| The equivalent length of the tailpipe | |
| D | The tailpipe diameter |
Resonator mufflers serve as the primary structural form employed to mitigate exhaust noise in vehicle exhaust systems [1]. These mufflers effectively function as acoustic filters by utilizing a combination of cross-section mutations, perforations, and cavities to effectively attenuate low-frequency order noise, which typically concentrates the majority of sound energy within the exhaust system. When the airflow traverses the resonator muffler, it impacts the acoustic filter’s characteristics in two primary ways. Firstly, the airflow affects the sound propagation process within the muffler and alters the sound attenuation properties of the cavity structure. Additionally, airflow passing through abrupt cross-sections generates airflow regeneration noise [2]. The intensity of airflow regeneration noise is directly proportional to the airflow velocity, resulting in a geometric increase as the velocity rises [3].
Many scholars at home and abroad have researched the acoustic performance of expansion chambers. Chang et al. [4] and Fang et al. [5] used numerical methods and analytical methods to analyze the acoustic characteristics of simple expansion chambers, and compared the results of various methods. Xiang et al. [6–8] analyzed the noise reduction performance of the multi-expansion cavity composite structure, and optimized the structure to improve the performance. Kang et al. [9] improved the accuracy of transmission loss calculations for expansion chambers using a one-dimensional correction method. Fang et al. [10,11] investigated the influence of structural parameters such as tube insertion and inlet/outlet positions on the sound attenuation performance of expansion chambers through numerical simulations and experiments. Nevertheless, these studies predominantly concentrate on analyzing the attenuation performance of the expansion cavity when used as a muffler. However, when there is airflow passing through the expansion chamber, it generates airflow regeneration noise, effectively transforming the muffler into a sound generator. Furthermore, the airflow regeneration noise increases exponentially as the flow velocity rises, emerging as a primary noise source within the muffler structure.
Various scholars have conducted extensive research on airflow regeneration noise in expansion cavities. Davie et al. [12] and English et al. [13] employed correlation-based acoustic energy flow analysis to examine the distribution and frequency characteristics of airflow regeneration noise sources within expansion cavities, along with their correlation with cavity geometry. Esaki et al. [14] and Roeck et al. [15] investigated airflow regeneration noise characteristics in expansion chambers through experimental tests and signal correlation analysis methods. These studies were further supported by visual flow field observations within the chambers. Desantes et al. [16] and Zhao et al. [17] employed numerical simulation techniques to analyze airflow regeneration noise characteristics within expansion cavities, observing resonance phenomena within the cavities and tailpipes under the influence of flow noise. The simulations assisted in experimental measurements and verification. An et al. [18] constructed an experimental platform to test and analyze cavity resonance noise caused by airflow, and a narrow-band active noise control system was utilized to mitigate cavity resonance noise. Results indicated that the active control system achieved a significant global attenuation of over 10 dB at the fundamental resonance frequency. The change law of airflow regeneration noise and flow velocity of confrontation muffler was discussed by Wu et al. [19] using fluid numerical simulation and experimental testing. Gao et al. [20] analyzed the airflow regeneration noise in a simple expansion cavity from the perspective of sound source type.
The aforementioned studies mostly relied on experimental methods, making it challenging to intuitively describe the mechanisms and processes of flow noise generation inside the expansion chamber. However, in recent years, significant advancements have been made in fluid and acoustic numerical simulation methods. These simulation techniques have become widely used for predicting the formation and distribution of fluid and acoustic fields, thereby revealing the interaction mechanisms between fluid dynamics and acoustics [21]. Domestic and international scholars have extensively utilized numerical methods to investigate the flow patterns and aerodynamic noise characteristics associated with airflow passing through cavities. For instance, Aybay et al. [22] employed Large Eddy Simulation to analyze an open rectangular cavity with a length-to-depth ratio of 5 and a width-to-depth ratio of 1. They successfully predicted turbulent flow fields and near-field cavity noise, obtaining highly precise simulation results. Bauerheim et al. [23] also utilized the large eddy simulation (LES) method to explore aerodynamic noise generated by shear flow within deep cavities, comparing their findings with experimental data. This comparison verified the pseudo-compressible LES formula’s ability to predict the feedforward excitation of deep cavity resonators and the feedback process from the resonator to the flow source. Bidur et al. [24] adopted a hybrid approach to simulate and analyze aerodynamic noise in three-dimensional cavities under transonic flow conditions. They also considered the influence of objects placed within the cavity on aerodynamic noise. Paul [25] employed the Direct Numerical Simulation (DNS) method to calculate aerodynamic noise in a cavity under low Mach number flow conditions. Their study included an analysis of aerodynamic noise characteristics and their variations under different cavity sizes and Mach number conditions. Zhang et al. [26] combined large eddy simulation and the FW-H (Ffowcs Williams and Hawkings) acoustic analogy to predict swept flow and aerodynamic noise within cavities. Their predicted results were compared with experimental data, reinforcing the method’s reliability. The research by these scholars primarily focuses on the simulation and analysis of aerodynamic noise characteristics in open cavity structures, about surface cavity structures on high-speed moving objects. These findings may not be directly applicable to predicting aerodynamic noise characteristics within pipeline cavities. Solntseva et al. [27] utilized the compressible LES method to predict the aerodynamic noise generated inside expansion cavities within pipes. They also used the linearized Euler equation (LEE) to determine the transfer characteristics of a simple expansion cavity. Nakiboglu et al. [28] employed a numerical method that combines incompressible flow simulation with vortex sound theory to predict the time-averaged sound source power generated by cavities. This approach also examined the impact of cavity depth on whistler sound. Despite the efforts to enhance the accuracy of aerodynamic noise prediction methods and assess the influence of cavity structure size on aerodynamic noise, there remains a gap in analyzing airflow patterns within expansion cavities and pipes and the mechanisms driving aerodynamic noise generation. Additionally, no effective aerodynamic noise suppression methods have been proposed based on these mechanisms. This article aims to fill these gaps by proposing effective strategies for mitigating aerodynamic noise in expansion cavities through a detailed analysis of airflow patterns and noise generation mechanisms.
In addition, the aforementioned research employed various methods to analyze the aerodynamic noise characteristics within cavities. Presently, three primary simulation and prediction techniques are used for aerodynamic noise: DNS [29], the hybrid method [30], and the Stochastic Noise Generation and Radiation method (SNGR) [31]. The DNS approach demands substantial computational resources and proves challenging for practical engineering applications. The semi-empirical method derives turbulence data from the Reynolds-Averaged Navier-Stokes (RANS) equation solution, but it may yield less precise sound source calculations. In contrast, the hybrid method, which segregates the flow and sound fields for analysis, effectively reduces computational time and resource demands while maintaining accurate results, rendering it the most versatile and widely employed technique. Consequently, this article will also employ the hybrid method to simulate and analyze the aerodynamic characteristics of the expansion chamber.
In this paper, the focus is on studying a low Mach number flow (M < 0.3) at room temperature. To balance the requirements of computing resources and accuracy, a hybrid method is employed to simulate the unsteady flow field and airflow noise inside the expansion cavity under the specified flow conditions. The simulation methodology involves two main steps. Firstly, the LES method is utilized to calculate the unsteady time-domain flow field inside the expansion chamber. This provides a detailed understanding of the flow dynamics within the cavity. Next, the acoustic analog method is employed to extract the flow noise sources from the calculated flow field results. This allows for the identification and characterization of the flow noise generated inside the expansion chamber. Finally, the finite element method (FEM) and infinite element method (IEM) are used for sound propagation calculations. These methods enable the prediction of noise propagation and distribution throughout the surrounding environment. Based on the simulation results, appropriate methods and techniques are proposed to suppress the airflow regeneration noise. Furthermore, an airflow regeneration noise test bench is constructed to validate the numerical simulation results and evaluate the effectiveness of the proposed airflow regeneration noise suppression structures. Lastly, the experimental results are analyzed to examine the suppression characteristics and behavior of airflow regeneration noise, specifically focusing on the suppression properties of a perforated tube. By following this methodology, the paper aims to provide insights into the airflow noise generation and suppression mechanisms within expansion cavities under low Mach number flow conditions.
2 Calculation Theory and Methods
In the absence of flow, the expansion chamber serves as the fundamental unit for sound absorption. However, when there is fluid flow inside the expansion chamber, the acoustic characteristics of the chamber change. Due to the influence of airflow vortices, the chamber transforms from a sound absorber to a sound emitter [15]. The acoustic properties of the expansion chamber can be described using a two-port model, as illustrated in Fig. 1.
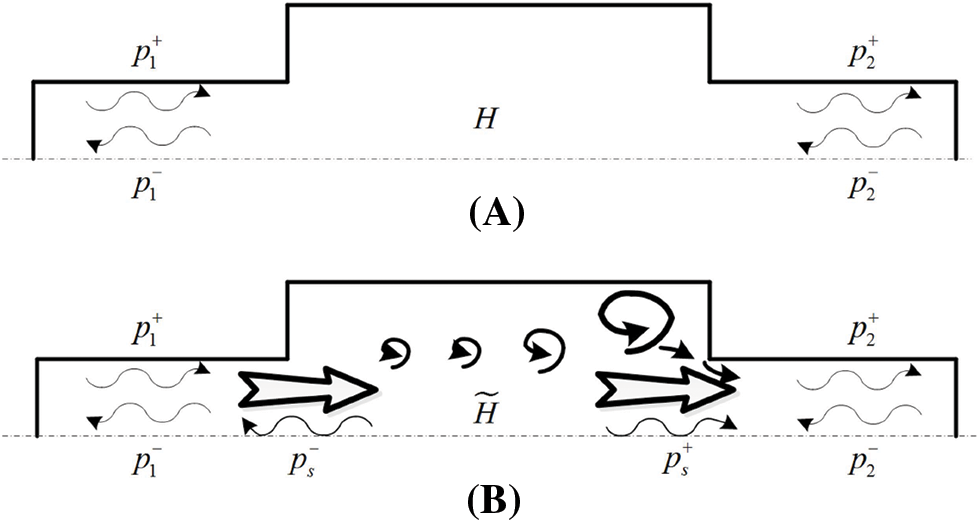
Figure 1: Schematic diagram of the two-ports model of expansion chambers. (A) Without flow; (B) with flow
In Fig. 1,
Based on the above analysis, the use of three-dimensional numerical simulation can provide a visual depiction of the flow process and distribution of noise sources within the expansion chamber. This approach is of significant importance for investigating the mechanisms behind the generation of flow-induced noise within the chamber.
2.1 Large Eddy Simulation Theory
In this study, the LES method is chosen as the numerical approach to compute three-dimensional unsteady flow fields [13]. LES utilizes a filtering operator to separate the vorticity of the flow field into large and small scales. The purpose of this filtering is to remove vorticity with scales smaller than the filter width, allowing for the direct solving of large-scale flow information while maintaining computational efficiency. The choice of LES is justified by the characteristics of the research subject in this paper. The interior of the expansion chamber does not feature intricate and fine-scale structures. As a result, the vortices generated by the flow can fully develop into large-scale vortices [2,32]. Given that accurately capturing the primary large-scale vorticity can lead to reliable simulation results, LES is employed in this study to address the unsteady flow problem within the expansion chamber. This approach strikes a balance between computational cost and accuracy, making it suitable for the research objectives.
The filtering process of the Large Eddy Simulation method can be expressed by the following convolution calculation:
where
The filter equation is used to treat the Navier-Stokes (N-S) equation under the unsteady flow field to obtain Eq. (2). Eq. (3) is the continuity equation.
The governing equation for the WALE model is:
where
where
where
2.2 Aeroacoustic Theory and Acoustic Analogy Methods
The acoustic analogy theory, initially proposed by Lighthill [33], is used to solve the calculation problem of aerodynamic noise. Eq. (8) represents the acoustic analogy theory.
where
where
The sound field resolution of Eq. (8) is as follows:
where
Lighthill’s theory was developed for aerodynamic noise generated in unbounded space and is suitable for cases where solid boundaries have a minor influence. However, in the studied object of this paper, the stationary solid boundaries also affect the acoustic field. Therefore, Curle’s extended theory is adopted to solve this problem. Curle extended Lighthill’s theory by incorporating the effects of stationary solid boundaries using the Kirchhoff method. The solution for the acoustic field according to Curle’s theory [34] is:
where
From Eq. (11), it can be observed that the analytical expression of the sound field includes flow field quantities such as velocity, density, and pressure, which need to be obtained from the fluid computational model. LES calculates the distribution of transient flow field quantities in the time domain, which needs to be interpolated onto the acoustics mesh to perform acoustic analogy calculations and obtain the turbulent noise source term in the time domain. Then, the time-frequency Fourier transform is applied to convert it into the frequency domain result, as shown in Eq. (12).
where
Once the frequency domain regenerative noise sources on the acoustics mesh are obtained, the distribution characteristics and magnitude of the regenerative noise inside the expansion chamber can be obtained through acoustic numerical simulations.
To accurately simulate the unsteady flow field inside the expansion chamber, a conventional-sized expansion chamber structure is designed. A three-dimensional model of the chamber is created using solid modeling software, and then the model is divided into grids. For the flow simulation model, a hexahedral structured grid is used to improve computational accuracy and convergence speed. The grid is refined in the near-wall region, sudden expansion, and contraction sections to adapt to the sharp velocity gradients and reduce computational errors. On the other hand, the acoustic simulation model does not require high grid quality, so a tetrahedral grid is uniformly used. The model is divided into three zones: the source zone is used to extract flow noise sources within the chamber, the propagation zone is used to calculate the sound propagation inside and outside the pipes and the infinite element is used to compute the radiation process of the sound field to the free field environment. Additionally, several virtual microphones are placed inside the pipes and 0.5 m outside the tailpipe to obtain sound pressure values in the acoustic field. The established flow simulation model and acoustic simulation model are shown in Fig. 2.
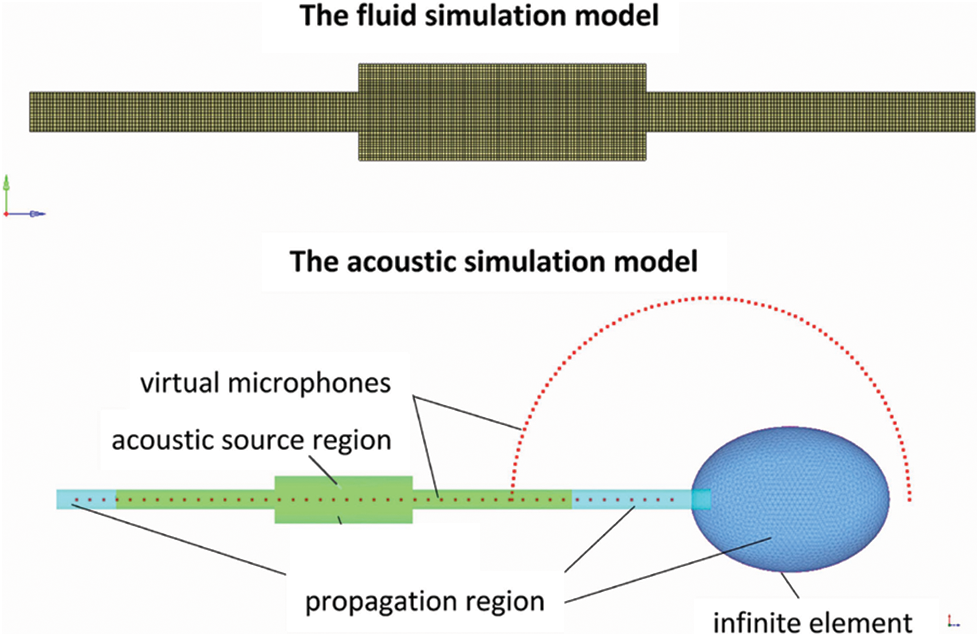
Figure 2: The fluid and acoustic simulation models
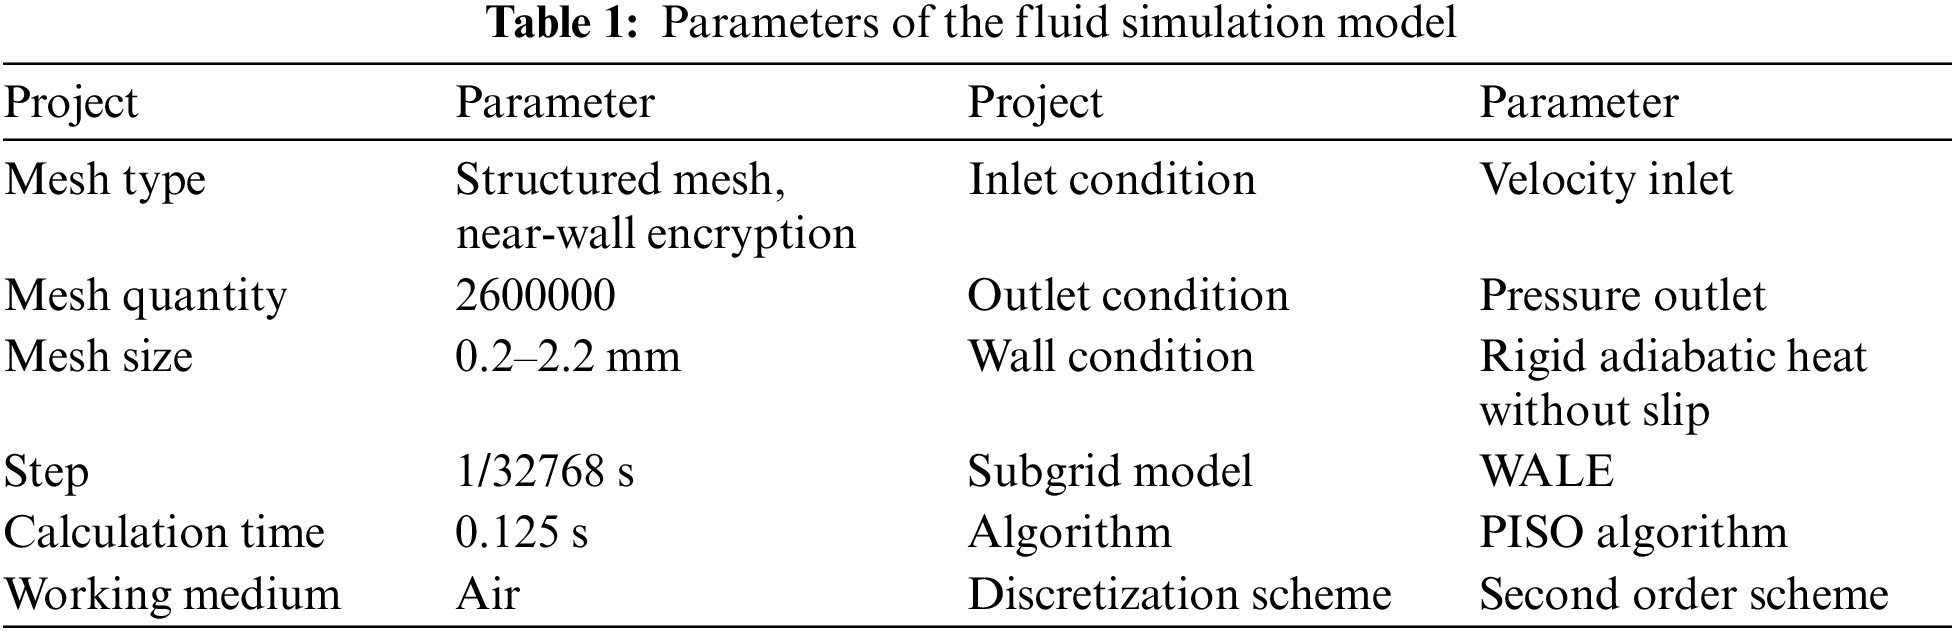
The fluid simulation model was conducted using the Fluent software platform, utilizing the LES method to calculate the unsteady flow field inside the expansion chamber. The Navier-Stokes (N-S) equation was discretized using the second-order upwind differential scheme, and the time term was discretized using the second-order implicit discrete scheme to achieve higher accuracy in fluid calculations. The Pressure Implicit Split Operator (PISO) algorithm, commonly employed for unsteady calculations, was utilized in this study. The PISO algorithm incorporates momentum correction and mesh distortion correction processes in each iteration step, resulting in more accurate pressure fields and faster convergence. Compared to the Semi-Implicit Method for Pressure-Linked Equations (SIMPLE) algorithm and the SIMPLEC (SIMPLE-Consistent) algorithm, the PISO algorithm is computationally less expensive. Hence, the PISO algorithm was chosen to simulate the unsteady flow process. The parameter settings for fluid analysis can be found in Table 1.
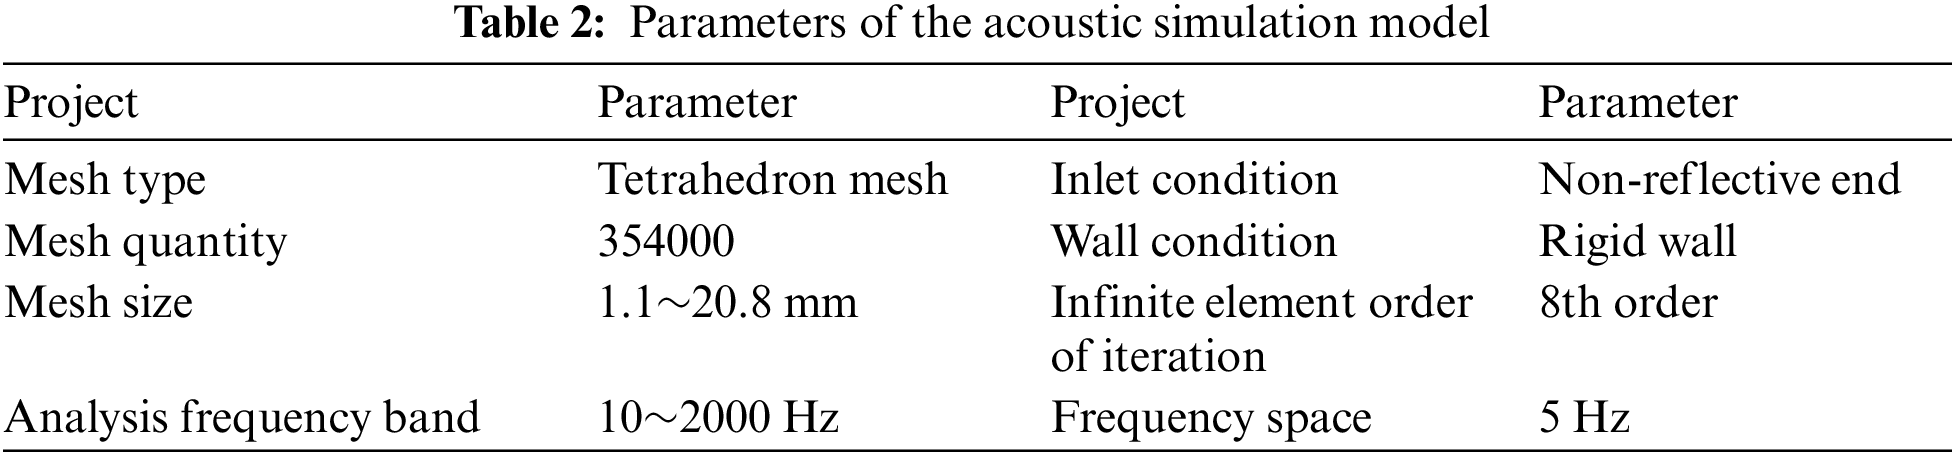
The sound field simulation is performed on the ACTRAN software platform, and the parameters and boundary conditions of the simulation model are set in Table 2.
4 Experimental Verification Platform
To verify the accuracy of the simulation results, a test platform and corresponding acoustic testing system were built to measure the aerodynamic noise of the simple expansion chamber.
The cold flow test bench is mainly composed of three-blade Roots blower, condenser, air tank, labyrinth muffler and semi-anechoic chamber, and its structural diagram is shown in Fig. 3.
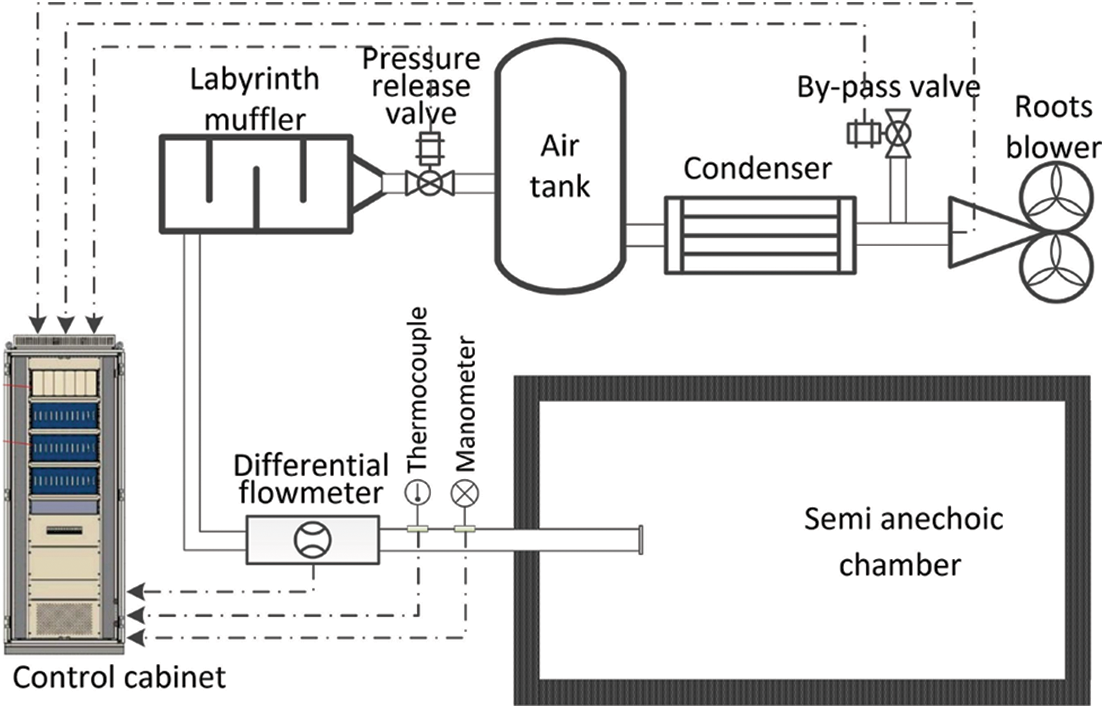
Figure 3: The schematic diagram of the test platform for the airflow regeneration noise
The three-blade Roots blower configuration is utilized in this study due to its capability to effectively reduce the fluctuations in the outlet airflow. The maximum flow rate achieved in the outlet pipe reaches 0.5 Mach, and at the highest speed, the blower can achieve a maximum volume flow rate of 22 m3/min. As the working time increases, the temperature of the outlet airflow also rises and can reach up to 100°C. To ensure consistency in the measured temperature before and after the experiment, a condenser is installed at the outlet of the blower. This condenser helps maintain the fluctuation of different test temperatures within 5

Figure 4: The picture of the test platform for the airflow regeneration noise
The flow rate control of the test bench is achieved through the implementation of the Proportional-Integral-Derivative (PID) control method. The system utilizes a combination of a differential pressure flow meter, thermocouples, and pressure gauges to gather information about the outlet flow field. Based on this information, the controller adjusts parameters such as blower speed, the opening degree of the bypass valve, and the pressure-reducing valve to achieve the desired flow rate. To ensure accurate measurements and control, the bench test system is located within a semi-anechoic chamber. The semi-anechoic chamber is designed to minimize sound reflections and external noise interference. The background noise within the semi-anechoic chamber is maintained at a level below 20 dB in the frequency band of 53 to 2000 Hz. This low background noise level allows for precise testing and analysis of the airflow regenerative noise without the interference of external acoustic disturbances.
The dimensions and actual size of the expansion chamber for the test are shown in Fig. 5.

Figure 5: The expansion chamber for the test. (A) The geometric dimension. (B) The picture of the expansion chamber
The acoustic testing system, located in a semi-anechoic chamber, is installed at the end of the cold flow test bench to measure the airflow regeneration noise of the expansion chamber. The system’s physical diagram is shown in Fig. 6.

Figure 6: The picture of the testing system for the airflow regeneration noise
In the testing system, the G.R.A.S. Type 26CA free-field microphone is employed. Two of these microphones are positioned 500 mm away from the nozzle at the tailpipe’s mouth, angled at 45 degrees relative to the pipe’s axis. Their primary role is to measure the airflow regeneration noise emitted from the expansion chamber. To reduce ground reflections’ influence on tailpipe noise and emulate a full free field environment, a large area of wedge is placed on the ground at the outlet of the tailpipe. This setup approximates the sound field conditions of a true free field. The electrical signals from the microphones are collected and analyzed using LMS’s TypeSCM02 data analyzer. This tool processes and assesses the microphone signals, enabling comprehensive characterization and evaluation of airflow regeneration noise in the frequency domain.
The background noise of the airflow regenerative noise testing platform was measured using a straight pipe, as shown in Fig. 7. As the airflow velocity increases, the background noise also increases, but overall, it remains relatively low.

Figure 7: The background noise of the test bench under different flow rates
5 Simulation Results and Analysis
5.1 Flow Field Simulation Results
The LES method is used to simulate the unsteady flow of the expansion chamber in the time domain, and the pressure nephogram and velocity vector plot results of the time domain simulation are shown in Fig. 8. The moment shown in the figure is 0.02417 s, and the airflow goes from left to right direction.

Figure 8: The LES simulation results of expansion cavity (M = 0.147)
Fig. 8 shows a cross-sectional view along the Z-Y plane of the internal flow field in the expansion chamber, displaying the pressure distribution and velocity vector field of the chamber. The figure captures the complexity of the flow inside the chamber. For illustrative purposes, the chamber can be divided into four regions, as shown in Fig. 9. Regions ① and ④ are the flow field regions of the inlet and outlet pipes of the expansion chamber, region ② is the flow field region along the axis of the chamber opposite to the inlet and outlet, and region ③ is the flow field region within the expanding section of the chamber.

Figure 9: Flow field zoning diagram
Upon a close examination of Fig. 8 and the accompanying description, several noteworthy observations come to light. Regions ① and ④ correspond to the inlet and outlet flow sections, respectively. These areas are confined by the pipe’s walls, resulting in a consistent flow direction and relatively high velocities. Notably, the vector arrows in region ② within the chamber are larger, signifying elevated flow velocities. This is primarily because air is directly discharged from region ①, travels through the chamber, and enters region ④. In contrast, the region ③ characterizes the expansion section of the chamber. This region is less directly affected by the jet flow and demonstrates lower flow velocities. At the juncture between regions ② and where high-velocity airflow intersects with low-velocity flow, a shear layer emerges. This shear layer delineates the boundary between varying flow velocities and is distinguished by changes in flow dynamics.
Due to the influence of airflow viscosity, the behavior of the flow within the shear layer becomes intricate. As the airflow is expelled from region ① and travels a certain distance, a segment of the flow within the shear layer changes direction, giving rise to vortices at the interface between regions ② and ③. These vortices form due to the instability of the shear layer and are accompanied by fluctuations in fluid pressure, leading to pressure oscillations within the expansion chamber. Propelled by the high-velocity airflow in region ②, these vortices progress downstream toward the chamber’s outlet. As they travel, they continue to increase in size and strength. Ultimately, near the outlet, the vortices encounter a constricting wall surface, causing them to rupture. This rupture results in the creation of substantial recirculation zones within the chamber. These zones signify areas of flow separation and reverse flow, further adding to the intricacies of the flow field within the expansion chamber. These observations enhance our comprehension of the flow characteristics within the expansion chamber and offer valuable insights into the distribution of flow patterns and vortices in different regions.
For unsteady flow inside the cavity, vorticity provides a clearer description of the non-steady flow process in the flow field. The vorticity is expressed as in Eq. (13).
This study employs Eq. (13) to calculate the vorticity distribution of the three-dimensional flow field within the expansion cavity. By slicing along the Z-Y plane, a vorticity contour plot is generated, as depicted in Fig. 10A. To validate the simulation results, experimental observations conducted by Esaki et al. [14] are also presented in Fig. 10B. Despite differences in the dimensions of the two expansion chambers, notable similarities are observed in the positions where the main vortices occur inside the cavity. Both the simulated and experimental results show that the vortices emerge at the midsection of the cavity, precisely at the junction of regions ② and ③. Additionally, the vortices exhibit symmetry along the central axis. This strong agreement between the simulated and experimental vorticity distributions provides a level of validation for the accuracy and correctness of the flow field simulation results.
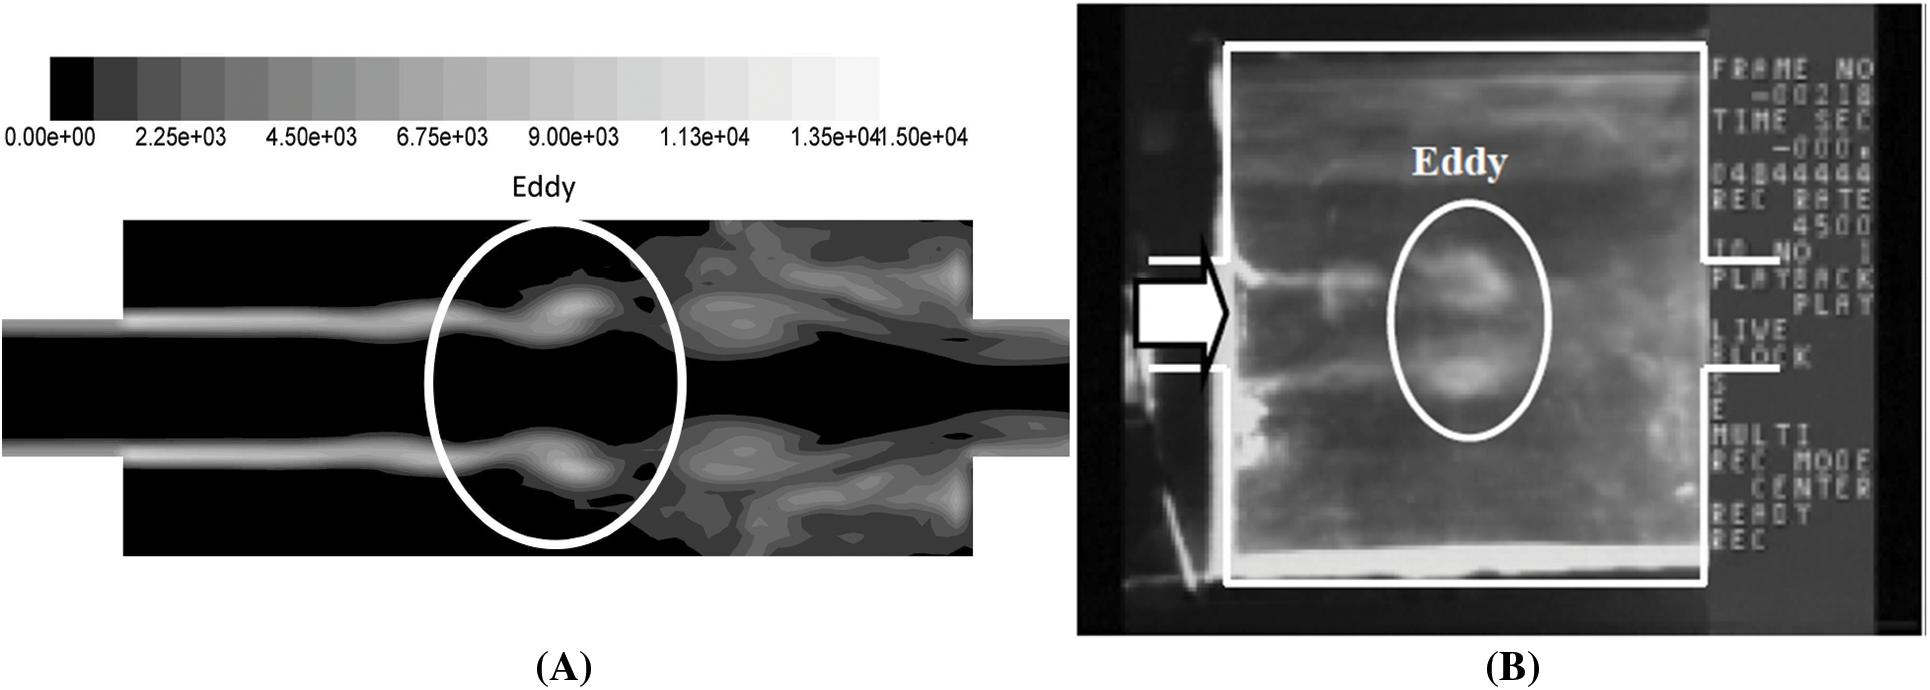
Figure 10: The comparison between simulation results and experimental results. (A) The simulation results. (B) The experiment results by flow visualization techniques
For low Mach number flows, the vorticity can provide a clearer description of the unsteady flow process in the flow field [16]. Based on the velocity distribution in the three-dimensional space inside the expansion chamber, the vorticity contour plot within the cavity can be calculated. Fig. 11 shows the vorticity contour plot on the Z-Y plane.

Figure 11: The variation of the vorticity inside the cavity with time
Fig. 11 provides a clear depiction of the temporal evolution of vorticity within the expansion cavity. As the airflow is injected from the inlet ①, a prominent and elongated shear layer forms near the junction of regions ② and ③. The influence of airflow viscosity leads to the generation of small-scale vortical structures within this strong shear layer, resulting in a belt-like distribution of vorticity. As the flow progresses downstream from the inlet ①, these small-scale vortical structures interact with the airflow, acquiring kinetic energy and gradually growing in size. Eventually, these structures detach from the shear layer and move towards the downstream contraction section. Upon interacting with the contraction wall, the vortical structures disperse, and a portion of the vorticity is carried into the outlet ④ along with the airflow. Furthermore, the presence of vortices within the cavity induces pressure fluctuations, which in turn enhance the formation and detachment of vortices within the upstream shear layer. This feedback loop between vorticity movement and pressure fluctuations plays a significant role in shaping the flow dynamics. These observations align closely with the vorticity movement trajectory proposed by Esaki et al. [14] based on experimental results.
As depicted in Fig. 11, the region near the junction of ② and ③, located in the midstream of the cavity, serves as the primary location for the detachment and rupture of vortical structures. According to the vortex sound theory, this region is the main distribution area of flow noise sources. The experimental results conducted by [14] strongly support and confirm this conclusion. The agreement between the simulated three-dimensional fluid simulation and Takashi’s experimental findings highlights the accuracy and reliability of the numerical model in capturing the unsteady flow process within the expansion cavity. This simulation provides a visual demonstration of the underlying mechanism behind the generation of cavity flow noise, shedding light on the intricate dynamics and contributing to a deeper understanding of the phenomenon.
5.2 Aerodynamic Noise Source Extraction and Sound Field Calculation
The flow field inside the expansion chamber is computed using LES, and this information is then used to calculate the airflow regeneration noise sources based on the Lighthill theory. To extract the relevant flow field information, such as flow velocity, temperature, pressure, and density, from the temporal results of the fluid simulation, the integral interpolation method is employed. Subsequently, these extracted variables are mapped onto the acoustic grid. On the acoustic grid, the Lighthill stress tensor is solved. To convert it into the frequency domain, a windowed discrete Fourier transform is applied. Finally, by performing differentiation, the frequency-domain terms representing the airflow regeneration noise sources are obtained.
The cloud plot of the Lighthill stress tensor on the Y-Z section in the frequency domain of the expansion cavity is shown in Fig. 12.
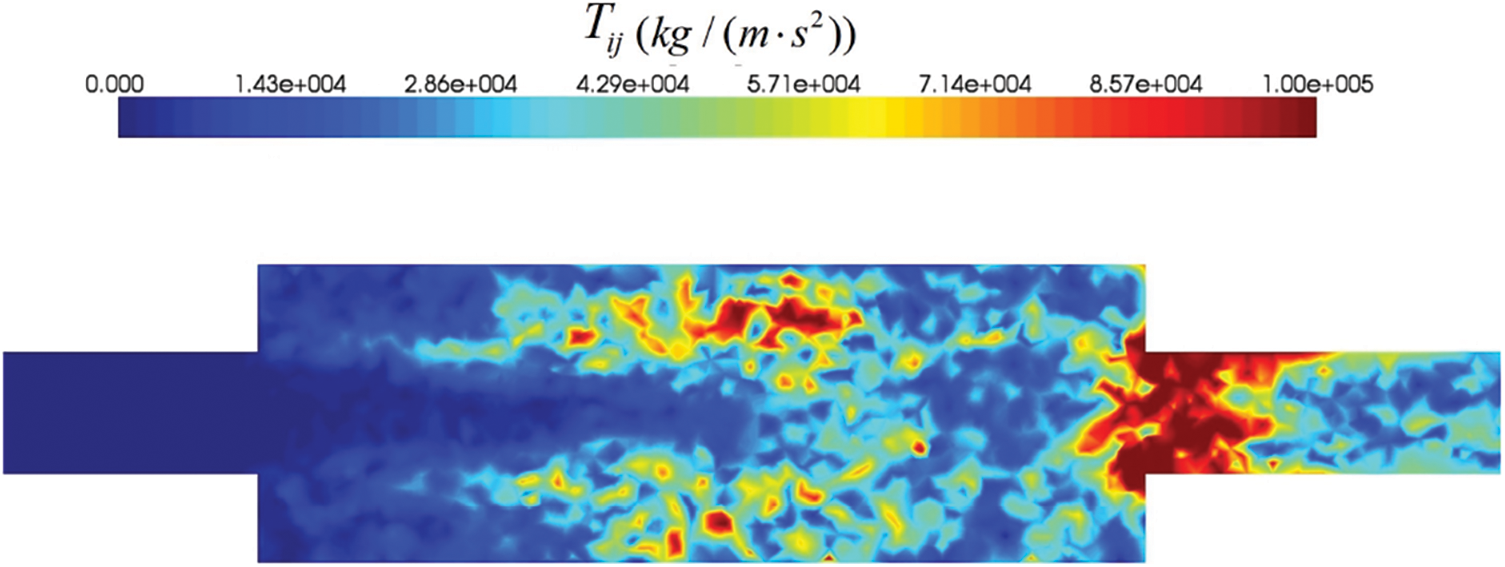
Figure 12: Lighthill stress tensor cloud in the expansion chamber
Based on the obtained Lighthill stress tensor, the sound field propagation process inside the cavity can be calculated using Eqs. (6)–(11). Fig. 13 shows the distribution of the sound field inside the cavity at two frequencies.

Figure 13: The sound field distribution in the expansion chamber. (A) 550 (B) 830 Hz
Based on the observations from Fig. 13, it is clear that the aerodynamic noise sources within the cavity are predominantly located near the shear layer. Additionally, the distribution of sound sources within the cavity varies depending on the frequency. For low-frequency sound sources, they tend to be primarily distributed in the middle and downstream sections of the cavity. This pattern corresponds to the presence of larger vortex structures, as depicted in Fig. 13A. On the other hand, high-frequency sound sources exhibit a greater concentration in the upstream section of the cavity. This concentration aligns with the existence of smaller vortex structures, as shown in Fig. 13B.
After extracting the sound sources, the propagation process of flow-induced noise can be calculated on the acoustic grid model, thereby obtaining the sound pressure levels of the far-field radiation outside the duct. The simulated far-field radiation responses at the designated points in the model are compared with the experimental results, as shown in Fig. 14.

Figure 14: Sound pressure level of the noise radiated from tailpipe nozzle (M = 0.147)
Fig. 14 shows the comparison between the simulated and experimental results for the radiated noise from the tailpipe, and the frequency resolution used both for measurements and simulations to obtain the SPL spectra was 1 Hz. The results indicate a good agreement in terms of peak frequencies and magnitudes between the simulation and experiment. From the results, it is evident that the flow-induced noise in the expansion chamber exhibits distinct resonant frequencies in the radiated noise from the tailpipe. The system can be considered as a half-wavelength resonator, and its resonant frequencies can be expressed using Eq. (14) [3].
where
The results of Eq. (14) are calculated and listed in Table 3. Meanwhile, the resonance frequencies from both the experimental and simulation results are extracted and filled into Table 3 as well for error analysis. The table is shown as follows.
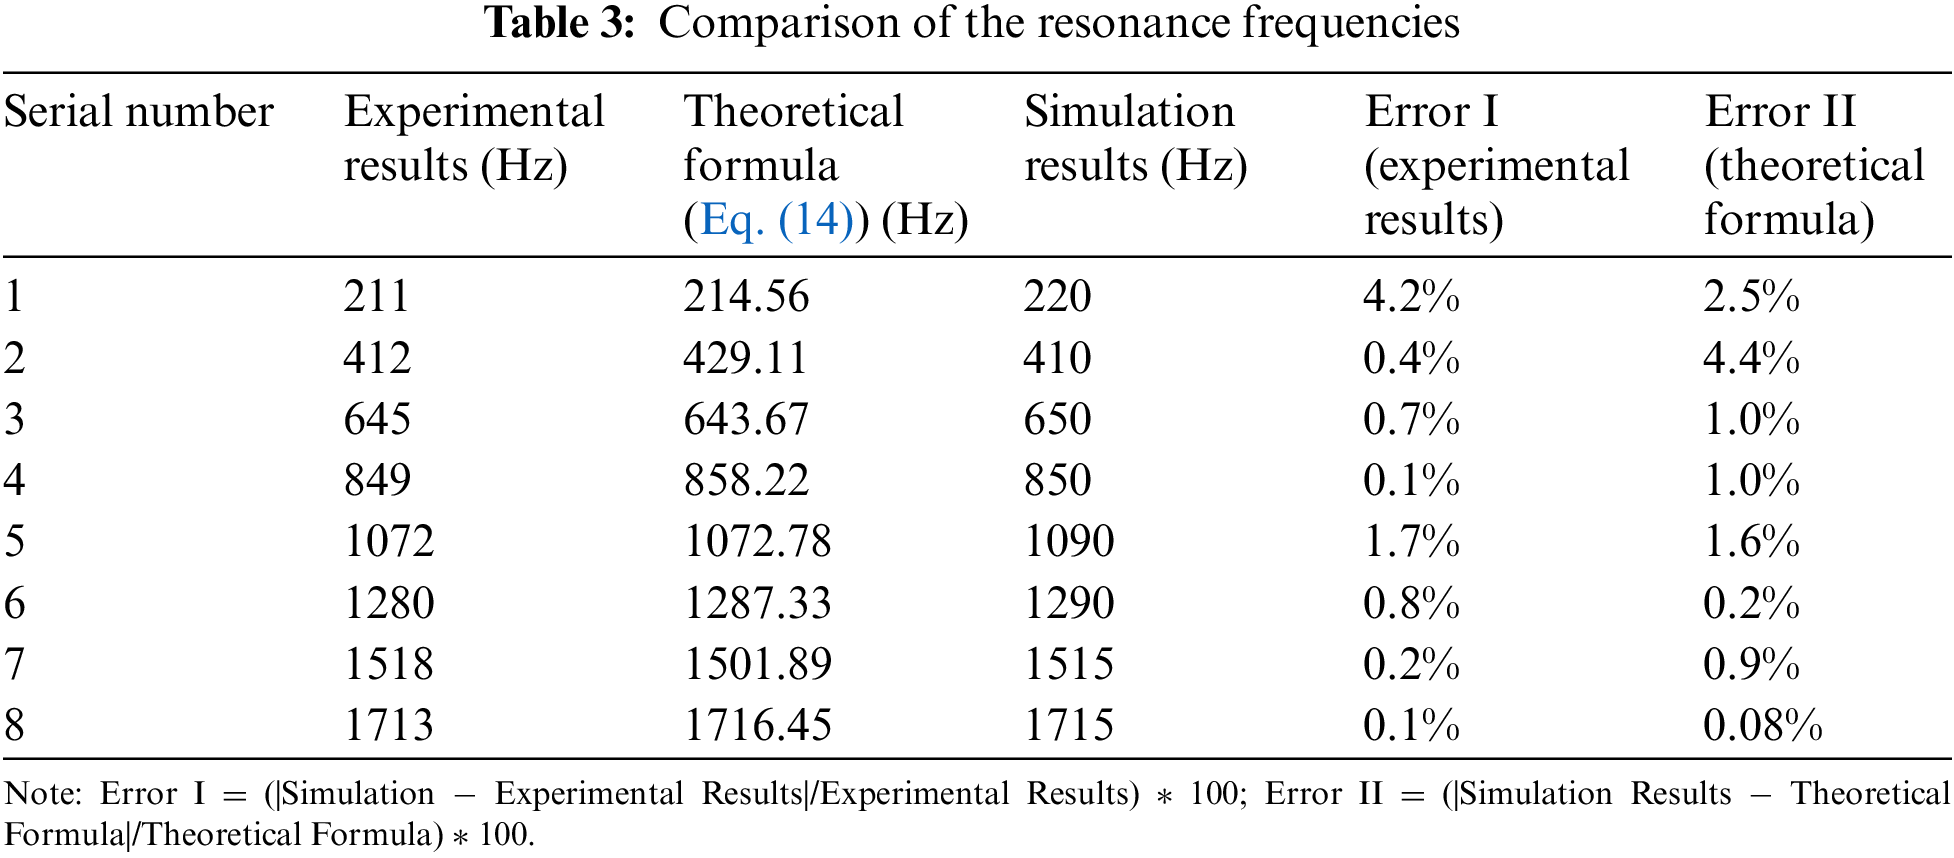
From Table 3, it can be observed that the deviations between the simulation results and the experimental results, as well as the results calculated using the theoretical formula (Eq. (14)), are all within 5
6 Methods of Suppressing Aerodynamic Noise
Based on the analysis presented earlier, it is evident that the vortices formed in the airflow shear layer directly contribute to airflow regeneration noise. To mitigate this noise, it becomes crucial to control the formation of the airflow shear layer. The presence of a step change boundary at the inlet and outlet of the expansion chamber, as depicted in Fig. 15a, is the primary cause of shear layer formation. To address this issue, perforated tubes are introduced within the chamber. These tubes effectively separate the airflow, impede shear layer formation, and allow sound waves to pass through the perforated plate, thereby achieving sound absorption within the expansion chamber. Consequently, this study proposes two distinct perforated tube structures to investigate and validate the methods and effectiveness of aerodynamic noise suppression. Both structures maintain consistent perforation sizes and numbers, as illustrated in Fig. 15.

Figure 15: Structure of perforated tube expansion chamber for aerodynamic noise suppression. (A) Fully perforated expansion chamber. (B) Semi-perforated expansion chamber
By employing the theoretical framework and methods outlined earlier, mixed simulation calculations were conducted to analyze the flow field and acoustic field for the two types of perforated tube expansion chamber structures. In the fluid simulation model, the mesh near the perforation has been encrypted. The number of CFD elements in the expansion cavity after perforation is around 3500000. In the acoustic simulation model, the mesh near the perforation has also been encrypted. And the number of elements is around 750000. The distribution of the Lighthill stress tensor, derived using the acoustic analogy method, is depicted in Fig. 16.

Figure 16: The nephogram of lighthill stress tensor in the expansion chamber with perforated tube. (A) Fully perforated expansion chamber. (B) Semi-perforated expansion chamber
Upon comparing Figs. 13 and 16, it is evident that the presence of perforated tubes effectively suppresses the formation of shear layers and disrupts the development of turbulent vortices. As a result, a significant reduction in the Lighthill stress tensor within the chamber is observed. Specifically, when comparing Figs. 16A and 16B, it becomes apparent that the fully perforated expansion chamber exhibits higher Lighthill stress tensor values at the perforations, indicating the presence of larger aerodynamic noise sources at those locations. Conversely, the semi-perforated expansion chamber demonstrates lower Lighthill stress tensor values throughout the chamber. To facilitate a more comprehensive comparison of aerodynamic noise levels between the expansion chamber, the fully perforated expansion chamber, and the semi-perforated expansion chamber, the acoustic calculation model was employed to determine the sound pressure levels of the far-field aerodynamic noise emitted from the tailpipe of the expansion structures. These sound pressure levels are illustrated in Fig. 17.

Figure 17: Comparison of simulation results of airflow regenerative noise (Ma = 0.147)
From Fig. 17, it can be observed that within the frequency range of 50–600 Hz, both the fully perforated and semi-perforated expansion chambers exhibit significantly lower aerodynamic radiation noise compared to the expansion chamber without perforations. In the frequency range of 600–2000 Hz, the fully perforated expansion chamber shows slightly higher aerodynamic radiation noise than the expansion chamber, while the semi-perforated expansion chamber consistently exhibits lower aerodynamic radiation noise levels compared to the expansion chamber. This demonstrates a significant aerodynamic noise control effect.
The main reason for the suppression of aerodynamic noise in the frequency range of 50–600 Hz is that the perforated tubes block the formation of shear layers within the chamber, preventing the generation of large vortex structures in the flow field. As a result, the low-frequency aerodynamic noise regeneration is effectively suppressed. However, further analysis is needed to determine the specific reasons for the slightly higher aerodynamic noise in the frequency range of 600–2000 Hz for the fully perforated expansion chamber.
According to the theory and methods described earlier, an analysis of the airflow inside the fully perforated expansion chamber was conducted. Fig. 18 shows a time-domain transient simulation of the fully perforated expansion chamber, including a velocity vector plot at a certain moment and a vorticity contour plot along the Y-Z plane.

Figure 18: Velocity vector and vortex nephogram in the fully perforated expansion chamber. (A) Vector plot of flow velocity in the cavity. (B) Distribution of vortex in the cavity
Fig. 18a reveals that the presence of perforated pipes restricts the formation of significant vortex structures within the flow field. However, there is evidence of backflow occurring between the perforated pipes and the expansion chamber. At the upstream section of the perforated pipe, the airflow passes through the small holes and enters the expansion chamber, while at the downstream section of the perforated pipe, the airflow flows back into the perforated pipe. In Fig. 18b, it can be observed that the vorticity values are notably high in the vicinity of the perforated section. The vorticity distribution shows that the vortices are located outside the pipe in the upstream perforated pipe section and inside the pipe in the downstream section. When considering Fig. 18a, it becomes evident that the vortex structures primarily form during the process of gas backflow within the cavity. This backflow occurs when gas is ejected through the perforations. The numerous small-scale vortex structures formed during the gas ejection process contribute to an increase in the energy of mid-to-high frequency aerodynamic noise within the fully perforated expansion chamber.
To validate the effectiveness of the aerodynamic noise suppression scheme, fully perforated and semi-perforated expansion chamber structures were fabricated, as shown in Fig. 19. Aerodynamic noise testing was conducted on the established cold-flow test bench.

Figure 19: Physical picture of the fully perforated expansion chamber and the semi-perforated expansion chamber
The experimental test results of the far-field radiated noise for the expansion chamber, fully perforated expansion chamber, and semi-perforated expansion chamber are shown in Fig. 20.

Figure 20: Comparison of test results of far-field airflow radiated noise (Ma = 0.059)
Fig. 20 indicates that in the mid-low frequency range, both the fully perforated expansion chamber and the semi-perforated expansion chamber exhibit significantly lower aerodynamic radiated noise compared to the expansion chamber. In the mid-high frequency range, the aerodynamic radiated noise of the fully perforated expansion chamber is slightly higher than that of the expansion chamber, while the semi-perforated expansion chamber demonstrates lower aerodynamic radiated noise in comparison to the expansion chamber. These experimental results align with the trends observed in the simulation results, thus validating the accuracy of the simulations. To further validate the effectiveness of the two structures in suppressing aerodynamic noise, the sound pressure levels of the far-field aerodynamic noise at the tailpipe were measured and analyzed at different flow velocities using the experimental test platform, as depicted in Fig. 21.

Figure 21: The comparison of the overall sound pressure level of radiated airflow regeneration noise at different Mach numbers
Fig. 21 provides a comparison of the overall sound pressure levels of far-field radiated aerodynamic noise. It is evident that, for different flow Mach numbers, the perforated expansion chamber exhibits lower aerodynamic noise levels than the expansion chamber, while the semi-perforated expansion chamber demonstrates even lower aerodynamic noise levels than the fully perforated expansion chamber. Furthermore, the presence of the unperforated half of the duct in the semi-perforated expansion chamber leads to the generation of standing wave effects at 1/4 wavelength, enhancing the sound absorption effect in the corresponding frequency range.
The transmission loss of the semi-perforated expansion chamber was calculated by the three-dimensional finite element method. The acoustic three-dimensional simulation model was constructed for the semi-perforated expansion chamber. The inlet boundary condition is set as unit particle vibration velocity. The outlet boundary condition is set as a non-reflecting boundary. And the wall condition is set as a rigid wall. The acoustic model is simulated on the ACTRAN software platform. Then, the incident sound power
Fig. 22 presents the results of the transmission loss for the compared schemes in this study, providing further insights into the noise reduction capabilities of the semi-perforated expansion chamber.

Figure 22: Comparison of transmission loss
In Fig. 22, it can be observed that the semi-perforated expansion chamber, with an unperforated section of the duct, exhibits a resonance peak around 450 Hz due to the quarter-wavelength tube effect. This enhances the sound absorption in the frequency range of 200 to 700 Hz. The sound absorption in this frequency range is crucial for controlling order-related noise.
Based on the analysis of the aforementioned simulations and experimental results, it can be deduced that the semi-perforated expansion chamber structure effectively suppresses both expansion turbulence and backflow turbulence. Moreover, the quarter-wavelength tube effect enhances sound absorption in the mid-low frequency range. In summary, the semi-perforated expansion chamber emerges as the optimal sound attenuation unit, offering effective noise suppression across a broad frequency range.
This study utilizes a combination of Large Eddy Simulation and acoustic analogy methods to analyze the unsteady flow and airflow regeneration noise within the expansion chamber. The LES technique is employed to compute the unsteady flow inside the expansion chamber, and the simulation results provide visual insights into the formation process of unsteady vortices induced by shear flow within the chamber. Additionally, by extracting flow field information, the spatial distribution of airflow regeneration noises is calculated. The acoustic analogy method is then applied to obtain sound pressure values of airflow regeneration noise at far-field response points. Notably, the calculated sound pressure values exhibit good agreement with experimental test results.
Based on the mechanism of airflow regeneration noise within the chamber, perforated pipes are selected as a means to suppress airflow regeneration noise. An experimental platform for airflow regeneration noise is constructed, and experimental samples are fabricated to analyze and verify the noise suppression effects of perforated expansion chambers at different Mach numbers.
The study findings include:
(1) The strong shear layer of the upstream flow in the expansion chamber generates vortex structures under the influence of viscous forces. These vortex structures gradually increase and detach during the downstream motion of the flow. The formation and detachment zones of vortex structures within the chamber are the main sources of airflow regeneration noise.
(2) Perforated pipes effectively isolate high-velocity and low-velocity flows, preventing the formation of strong shear layers. Consequently, the formation of a large number of vortex structures within the chamber is inhibited, leading to a significant reduction in airflow regeneration noise sources.
(3) The semi-perforated pipe can effectively suppress backflow within the chamber, further reducing the aerodynamic noise generated during flow passage through the perforations. Additionally, the presence of the 1/4 wavelength pipe effect enhances sound absorption in the mid-to-low-frequency range, making it an optimal sound attenuation unit.
This study offers practical guidance for the design of airflow regeneration noise reduction in exhaust and ventilation systems. Future research should consider the relationship between the structural parameters and perforation distribution of the perforated expansion chamber and the effectiveness of airflow regeneration noise suppression.
Acknowledgement: This research work is very grateful for Penggao Li’s contribution. Penggao Li provided assistance in collecting and organizing a significant portion of the literature, contributing to the rewriting of sections in the course of revising the paper.
Funding Statement: The authors wish to thank East China Jiaotong University and Suzhou Automotive Research Institue, Tsinghua University for its support. This research has been supported by the National Natural Science Foundation of China (NSFC) (Grant Nos. 12104153 and 51765017). China Postdoctoral Science Foundation (Grant No. 2021M701963), and Training Plan for Academic and Technical Leaders of Major Disciplines in Jiangxi Province, China (Grant No. 20204BCJL23034).
Author Contributions: Haitao Liu was responsible for collecting the research literature, organizing the paper structure, writing the paper. Jiaming Wang provided assistance during the initial draft writing and revision process of the article. Haitao Liu and Qian Xiao provided the research direction of this paper and performed all of the experiments. Xiuliang Zhang made part of the figures and text. Yanji Jiang checked the procedure. Haitao Liu finalized the paper and supervised the work.
Availability of Data and Materials: The data used in this study did not originate from the internet but rather from the author's simulation and experimental results. If necessary, please feel free to contact the corresponding author, Haitao Liu (2860@ecjtu.edu.cn).
Conflicts of Interest: The authors declare that they have no conflicts of interest to report regarding the present study.
References
1. Hou, Z., Xu, T., Zhang, Z., Sun, J. (2022). Case study: Numerical study of the noise reduction characteristics of corrugated perforated pipe mufflers. Noise Control Engineering Journal, 70(1), 16–36. [Google Scholar]
2. Tamaro, S., Zamponi, R., Schram, C. (2022). Development of a didactic demonstrator for flow-induced noise mechanisms and mitigation technologies. The Journal of the Acoustical Society of America, 151(8), 898–910. [Google Scholar] [PubMed]
3. Han, T., Wang, L., Cen, K., Song, B., Shen, R. et al. (2020). Flow-induced noise analysis for natural gas manifolds using LES and FW-H hybrid method. Applied Acoustics, 159, 107101. [Google Scholar]
4. Chang, Y. C., Chiu, M. C., Huang, S. E. (2019). Numerical analysis of circular straight mufflers equipped with three chambers at high-order-modes. Applied Acoustics, 155, 167–179. [Google Scholar]
5. Fang, Z., Liu, C. (2017). Acoustic attenuation analysis of oval expansion chambers with extended single inlet and double outlets. Noise Control Engineering Journal, 65(2), 83–93. [Google Scholar]
6. Xiang, L., Zuo, S., Wu, X., Zhang, J., Liu, J. (2016). Acoustic behaviour analysis and optimal design of a multi-chamber reactive muffler. Proceedings of the Institution of Mechanical Engineers, Part D: Journal of Automobile Engineering, 230(13), 1862–1870. [Google Scholar]
7. Fang, Z., Ji, Z., Liu, C. (2017). Acoustic attenuation analysis of silencers with multi-chamber by using coupling method based on subdomain division technique. Applied Acoustics, 116, 152–163. [Google Scholar]
8. Lee, S., Bolton, J. S., Martinson, P. A. (2016). Design of multi-chamber cylindrical silencers with microperforated elements. Noise Control Engineering Journal, 64(4), 532–543. [Google Scholar]
9. Kang, Z., Zheng, S., Lian, X., Liu, H. (2011). Corrected one-dimensional approach for the acoustic simulation of expansion chamber silencer. Shengxue Xuebao (Acta Acustica), 36(6), 652–657 (In Chinese). [Google Scholar]
10. Fang, Z., Ji, Z. (2013). Acoustic attenuation analysis of expansion chambers with extended inlet/outlet. Noise Control Engineering Journal, 61(2), 240–249. [Google Scholar]
11. Zhen-lin, F. Z. J. (2011). Effect of inlet and outlet locations on acoustic attenuation characteristics of elliptical and oval expansion chambers. Noise and Vibration Control, 31(4), 160–164 (In Chinese). [Google Scholar]
12. Davies, P., Holland, K. (2001). The observed aeroacoustic behaviour of some flow-excited expansion chambers. Journal of Sound and Vibration, 239(4), 695–708. [Google Scholar]
13. English, E. J., Holland, K. R. (2010). Aeroacoustic sound generation in simple expansion chambers. The Journal of the Acoustical Society of America, 128(5), 2589–2595. [Google Scholar] [PubMed]
14. Esaki, T., Yokota, S., Mikami, M., Kojima, N. (2003). Characteristics of sound sources of pulsating flow induced noise in a muffler cavity. The Proceedings of the JSME Annual Meeting, vol. 7, pp. 261–262. The Japan Society of Mechanical Engineers. [Google Scholar]
15. de Roeck, Desmet, W. (2008). Experimental acoustic identification of flow noise sources in expansion chambers. Proceedings of ISMA, pp. 455–470. Leuven, Belgium. [Google Scholar]
16. Desantes, J., Torregrosa, A., Broatch, A. (2001). Experiments on flow noise generation in simple exhaust geometries. Acta Acustica United with Acustica, 87(1), 46–55. [Google Scholar]
17. Zhao, B., Li, H. (2022). Research on suppression of airflow secondary noise in a muffler based on large eddy simulation. International Journal of Acoustics & Vibration, 27(4), 382–392. [Google Scholar]
18. An, F., Li, H., Zhang, X., Sun, C., Liu, B. (2022). Experimental research on reducing flow-induced cavity resonance with a narrowband active noise control system. Applied Sciences, 12(14), 7044. [Google Scholar]
19. Wu, D. Z., Chen, Y. W., Miao, T. C., Xu, W. W., Wang, L. Q. (2014). Study on regeneration noise of reactive muffler. Journal of Zhejiang University (Engineering Science), 48(9), 1661–1667 (In Chinese). [Google Scholar]
20. Gao, X. X., Kuang, F., Chu, Z. G. (2016). Study on regeneration noise of simple reactive muffler. Chinese Journal of Automotive Engineering, 6(6), 437–441 (In Chinese). [Google Scholar]
21. Hong, Z., Fu, Y., Chen, L., Yang, M. (2023). Experimental investigation on vortex sound interaction in self-induced acoustic resonance. Journal of Sound and Vibration, 548, 117510. [Google Scholar]
22. Aybay, O., Breuer, M., He, L. (2010). Large-eddy simulation of three-dimensional cavity flow using a time-conservative finite-volume method. STAB/DGLR Symposium, pp. 465–472. Berlin, Germany. [Google Scholar]
23. Bauerheim, M., Boujo, E., Noiray, N. (2020). Numerical analysis of the linear and nonlinear vortex-sound interaction in a T-junction. AIAA Aviation 2020 Forum, pp. 1–23. [Google Scholar]
24. Bidur, K. (2011). A numerical study of the flow around airfoils with serrated trailing edges and the aerodynamic noise based on large eddy simulation (Ph.D. Thesis). UK: Cranfield University. [Google Scholar]
25. Paul, B. S. (2016). Aeroacoustic computation of tones generated from low Mach Number cavity flows, using a preconditioned method (Ph.D. Thesis). USA: The Pennsylvania State University. [Google Scholar]
26. Zhang, N., Shen, H. C., Yao, H. Z. (2010). Numerical simulation of cavity flow induced noise by LES and FW-H acoustic analogy. Journal of Hydrodynamics, Series B, 22(5), 242–247. [Google Scholar]
27. Solntseva, V., Roeck, W. D., Desmet, W. (2008). Predicting the aerodynamic noise generation and propagation mechanisms in expansion chambers using an active bi-port formulation. 15th International Congress on Sound and Vibration, pp. 726–734. Daejeon, Korea. [Google Scholar]
28. Nakiboglu, G., Manders, H. B. M., Hirschberg, A. (2012). Aeroacoustic power generated by a compact axisymmetric cavity: Prediction of self-sustained osciallation and influence of depth. Journal of Fluid Mechanics, 703, 163–191. [Google Scholar]
29. Huang, J., Duan, L., Choudhari, M. M. (2022). Direct numerical simulation of hypersonic turbulent boundary layers: Effect of spatial evolution and Reynolds number. Journal of Fluid Mechanics, 937, A3. [Google Scholar]
30. Smith, T. A., Ventikos, Y. (2022). A hybrid computational aeroacoustic model with application to turbulent flows over foil and bluff bodies. Journal of Sound and Vibration, 526, 116773. [Google Scholar]
31. Liu, Y., Lu, W., Zhang, Q., Wang, X., Yin, X. et al. (2020). An efficient method for prediction of the flow-induced vehicle interior noise. Journal of Physics: Conference Series, 1650(1), 1–12. [Google Scholar]
32. Xu, Y., Pan, C., Feng, L., Wang, J. (2022). Formation and scaling of a coherent large-scale vortex from the impingement of a laminar synthetic jet. Experiments in Fluids, 63, 74–87. [Google Scholar]
33. Lighthill, M. J. (1952). On sound generated aerodynamically I. General theory. Proceedings of the Royal Society A: Mathematical, Physical and Engineering Sciences, 211, 564–587. [Google Scholar]
34. Curle, N. (1955). The influence of solid boundaries upon aerodynamic sound. Proceedings of the Royal Society A: Mathematical, Physical and Engineering Sciences, 231(1187), 505–514. [Google Scholar]
Cite This Article
 Copyright © 2024 The Author(s). Published by Tech Science Press.
This work is licensed under a Creative Commons Attribution 4.0 International License , which permits unrestricted use, distribution, and reproduction in any medium, provided the original work is properly cited.
 Downloads
 Citation Tools