
 Submit a Paper
 Propose a Special lssue
 Open Access
ARTICLE

Aerodynamic Features of High-Speed Maglev Trains with Different Marshaling Lengths Running on a Viaduct under Crosswinds
1 School of Rail Transportation, Wuyi University, Jiangmen, 529020, China
2 National Rail Transit Electrification and Automation Engineering Technology Research Center (Hong Kong Branch), The Hong Kong Polytechnic University, Hong Kong, 999077, China
3 Department of Civil and Environmental Engineering, The Hong Kong Polytechnic University, Hong Kong, 999077, China
* Corresponding Authors: Zheng-Wei Chen. Email: ; Su-Mei Wang. Email:
Computer Modeling in Engineering & Sciences 2024, 140(1), 975-996. https://doi.org/10.32604/cmes.2024.047664
Received 13 November 2023; Accepted 10 January 2024; Issue published 16 April 2024
 View Full Text
 Download PDF
Abstract
The safety and stability of high-speed maglev trains traveling on viaducts in crosswinds critically depend on their aerodynamic characteristics. Therefore, this paper uses an improved delayed detached eddy simulation (IDDES) method to investigate the aerodynamic features of high-speed maglev trains with different marshaling lengths under crosswinds. The effects of marshaling lengths (varying from 3-car to 8-car groups) on the train’s aerodynamic performance, surface pressure, and the flow field surrounding the train were investigated using the three-dimensional unsteady compressible Navier-Stokes (N-S) equations. The results showed that the marshaling lengths had minimal influence on the aerodynamic performance of the head and middle cars. Conversely, the marshaling lengths are negatively correlated with the time-average side force coefficient () and time-average lift force coefficient () of the tail car. Compared to the tail car of the 3-car groups, the and fell by 27.77% and 18.29%, respectively, for the tail car of the 8-car groups. It is essential to pay more attention to the operational safety of the head car, as it exhibits the highest time average . Additionally, the mean pressure difference between the two sides of the tail car body increased with the marshaling lengths, and the side force direction on the tail car was opposite to that of the head and middle cars. Furthermore, the turbulent kinetic energy of the wake structure on the windward side quickly decreased as marshaling lengths increased.Graphic Abstract
Keywords
Maglev trains, which are innovative forms of rail transit, stand out as highly promising modes of travel for the 21st century, effectively bridging the speed gap between high-speed trains and airplanes [1–4]. Compared to traditional railway trains, maglev trains offer a multitude of advantages, such as higher speeds, no wheel-rail noise, greater energy efficiency, higher safety, more comfort, and potentially lower long-term costs [5–8]. Maglev train technology has been developed and implemented in various countries globally. Notably, the first commercial maglev system was developed in Germany in the 1970s. China has constructed the world’s fastest commercially functioning maglev line, operating at a speed of 430 kilometers per hour. Additionally, Japan spearheaded the creation of the superconducting maglev train, achieving an unprecedented record-breaking speed of 603 km/h during rigorous testing in 2015 [9–11]. To better accommodate the travel needs of individuals, both the speed and length of maglev trains should be increased. It is a significant challenge to ensure the safety and stability of maglev trains when they run at high speeds in complicated environments, such as in crosswinds. Thereafter, the effect of aerodynamics needs to be considered. For this reason, research into the aerodynamic properties of maglev trains in crosswinds is essential.
Currently, studies on the aerodynamic characteristics of trains with different formations have predominantly centered around conventional wheeled rail trains. A numerical simulation of flow structure around trains (1-car group) under crosswinds was conducted by Khier et al. [12]. They found that flow separation occurs on the upper and lower leeward sides of the train, with the vortex structure varying based on the yaw angle. Ricco et al. [13] demonstrated that the pressure wave caused by long-group trains traveling through tunnels was both more intense and persisted for a longer time than that generated by short-group trains. Muld et al. [14] researched the influence of train marshaling lengths (2-car, 3-car, and 4-car groups) on the flow field using the Delayed Detached-Eddy Simulation (DDES) turbulence model. Their results indicated that the wake structure has a close relationship with the train length. García et al. [15] utilized Large Eddy Simulation (LES) to conduct a comparative analysis of the aerodynamic features of an Intercity-Express-2 (ICE2) train (1-car group) under turbulent wind conditions, considering both rough and smooth surface conditions. They revealed that within aerodynamic loads concerning both rough and smooth surface cases, two distinct peaks stand out. The initial peak correlates with sizable wind structures, causing transient loads on the train. The secondary maximum value might arise from numerical issues. Gallagher et al. [16] utilized the DDES method to analyze the aerodynamic characteristics of railway trains (4-car groups) across varying yaw angles. They validated their findings through comparisons with static wind tunnel tests, moving model tests, and field experiments. Using the DDES turbulence model, Niu et al. [17] compared the aerodynamic performances of high-speed trains with varying marshaling lengths. Their study disclosed an augmentation in drag for the tail car alongside a reduction in lateral force as train length increased. The aerodynamic feature of urban electric multiple units was studied by Liang et al. [18], and it was discovered that the aerodynamic performances of the head and middle cars remained consistent despite variations in train formation lengths. Tan et al. [2] used improved delayed detached-eddy simulation (IDDES) to determine how maglev trains of different lengths affect the flow field structure. They found that displacement and momentum thicknesses of the boundary layers for the tail car were positively correlated with train lengths when there was no ambient wind.
Although the aerodynamic property of a maglev train has long been a research focus, its performance in crosswinds has received comparatively little attention. Howell [19] explored how maglev trains respond to crosswinds by performing experiments using models in motion. These experiments involved electromagnetic suspension trains and electrodynamic suspension trains, which were then contrasted with wind tunnel tests. The findings indicated that the outcomes from the moving model on a planar track aligned closely with the wind tunnel test results for the same model, except for variations in lateral force. Ding et al. [20] conducted research on the aerodynamic lift force feature of high-speed maglev trains with 5-car groups via a numerical simulation approach. They found that the lift forces generated by the front and rear cars were greater than those of the middle car. Li et al. [21] conducted research on the transient aerodynamics of two maglev trains encountering each other in an outdoor environment by utilizing three different turbulence models. Their work underscored the superiority of the turbulent kinetic energy and dissipation rate (
It becomes imperative to extend the marshaling length beyond the scope covered in prior studies to cater to the evolving passenger travel demands. However, the above studies have not investigated the aerodynamics of maglev trains at a speed of 600 kilometers per hour with marshaling lengths ranging from 3-car to 8-car groups running on a viaduct under crosswinds (wind angle of 90°). This research uses numerical simulation to analyze the high-speed maglev train aerodynamics operating on a viaduct in crosswinds. The remaining sections of this paper are structured as follows: First, the details of the IDDES simulation are presented in Section 2, i.e., the computational model, boundary conditions, numerical methods, grid generation, and model verification. In Section 3, the results and analyses are discussed, which include the study of average aerodynamic forces, the average pressure distribution surrounding the train, and an analysis of the flow structure. Finally, in Section 4, the primary findings are summarized.
2.1 Geometry Model and Boundary Conditions
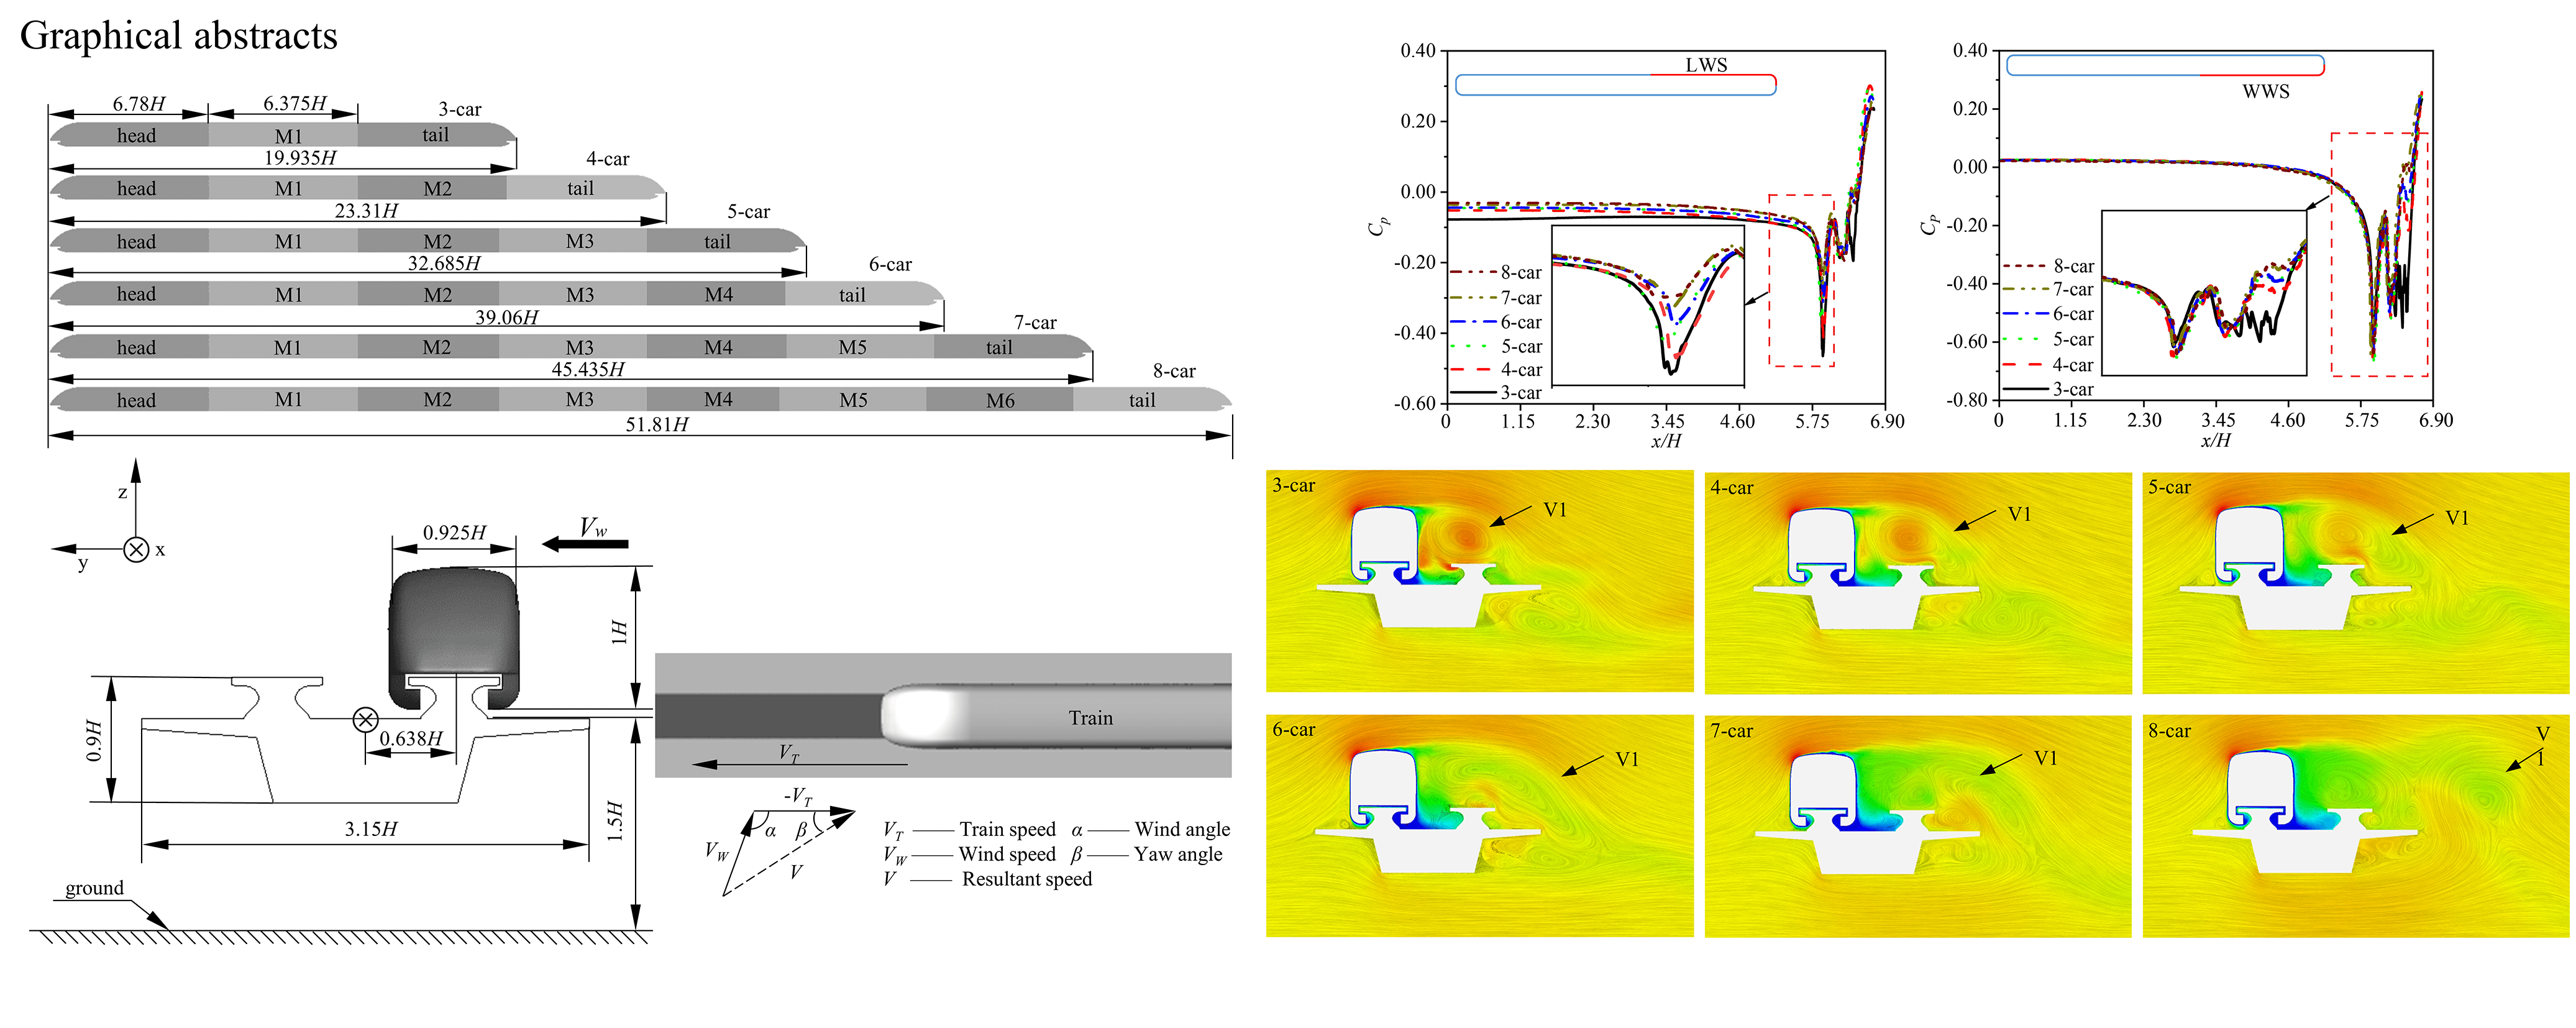
In order to investigate how marshaling lengths impact the aerodynamic features of maglev trains, a 1/10th-scale high-speed maglev train with different marshaling lengths ranging from 3-car to 8-car groups is adopted. The train comprises the head car, the middle cars (M1–M6), and the tail car. Due to grid number and computational resource limitations, certain simplifications are applied to the geometric models.
Fig. 1 illustrates the train model with different marshaling lengths. The train height, H, is 0.4 m, taken as the characteristic height. The length of the head and tail is 6.78 H, the width, W, is 0.925 H, the length of the middle car (M1-M6) is 6.375 H, and the total length of the car is
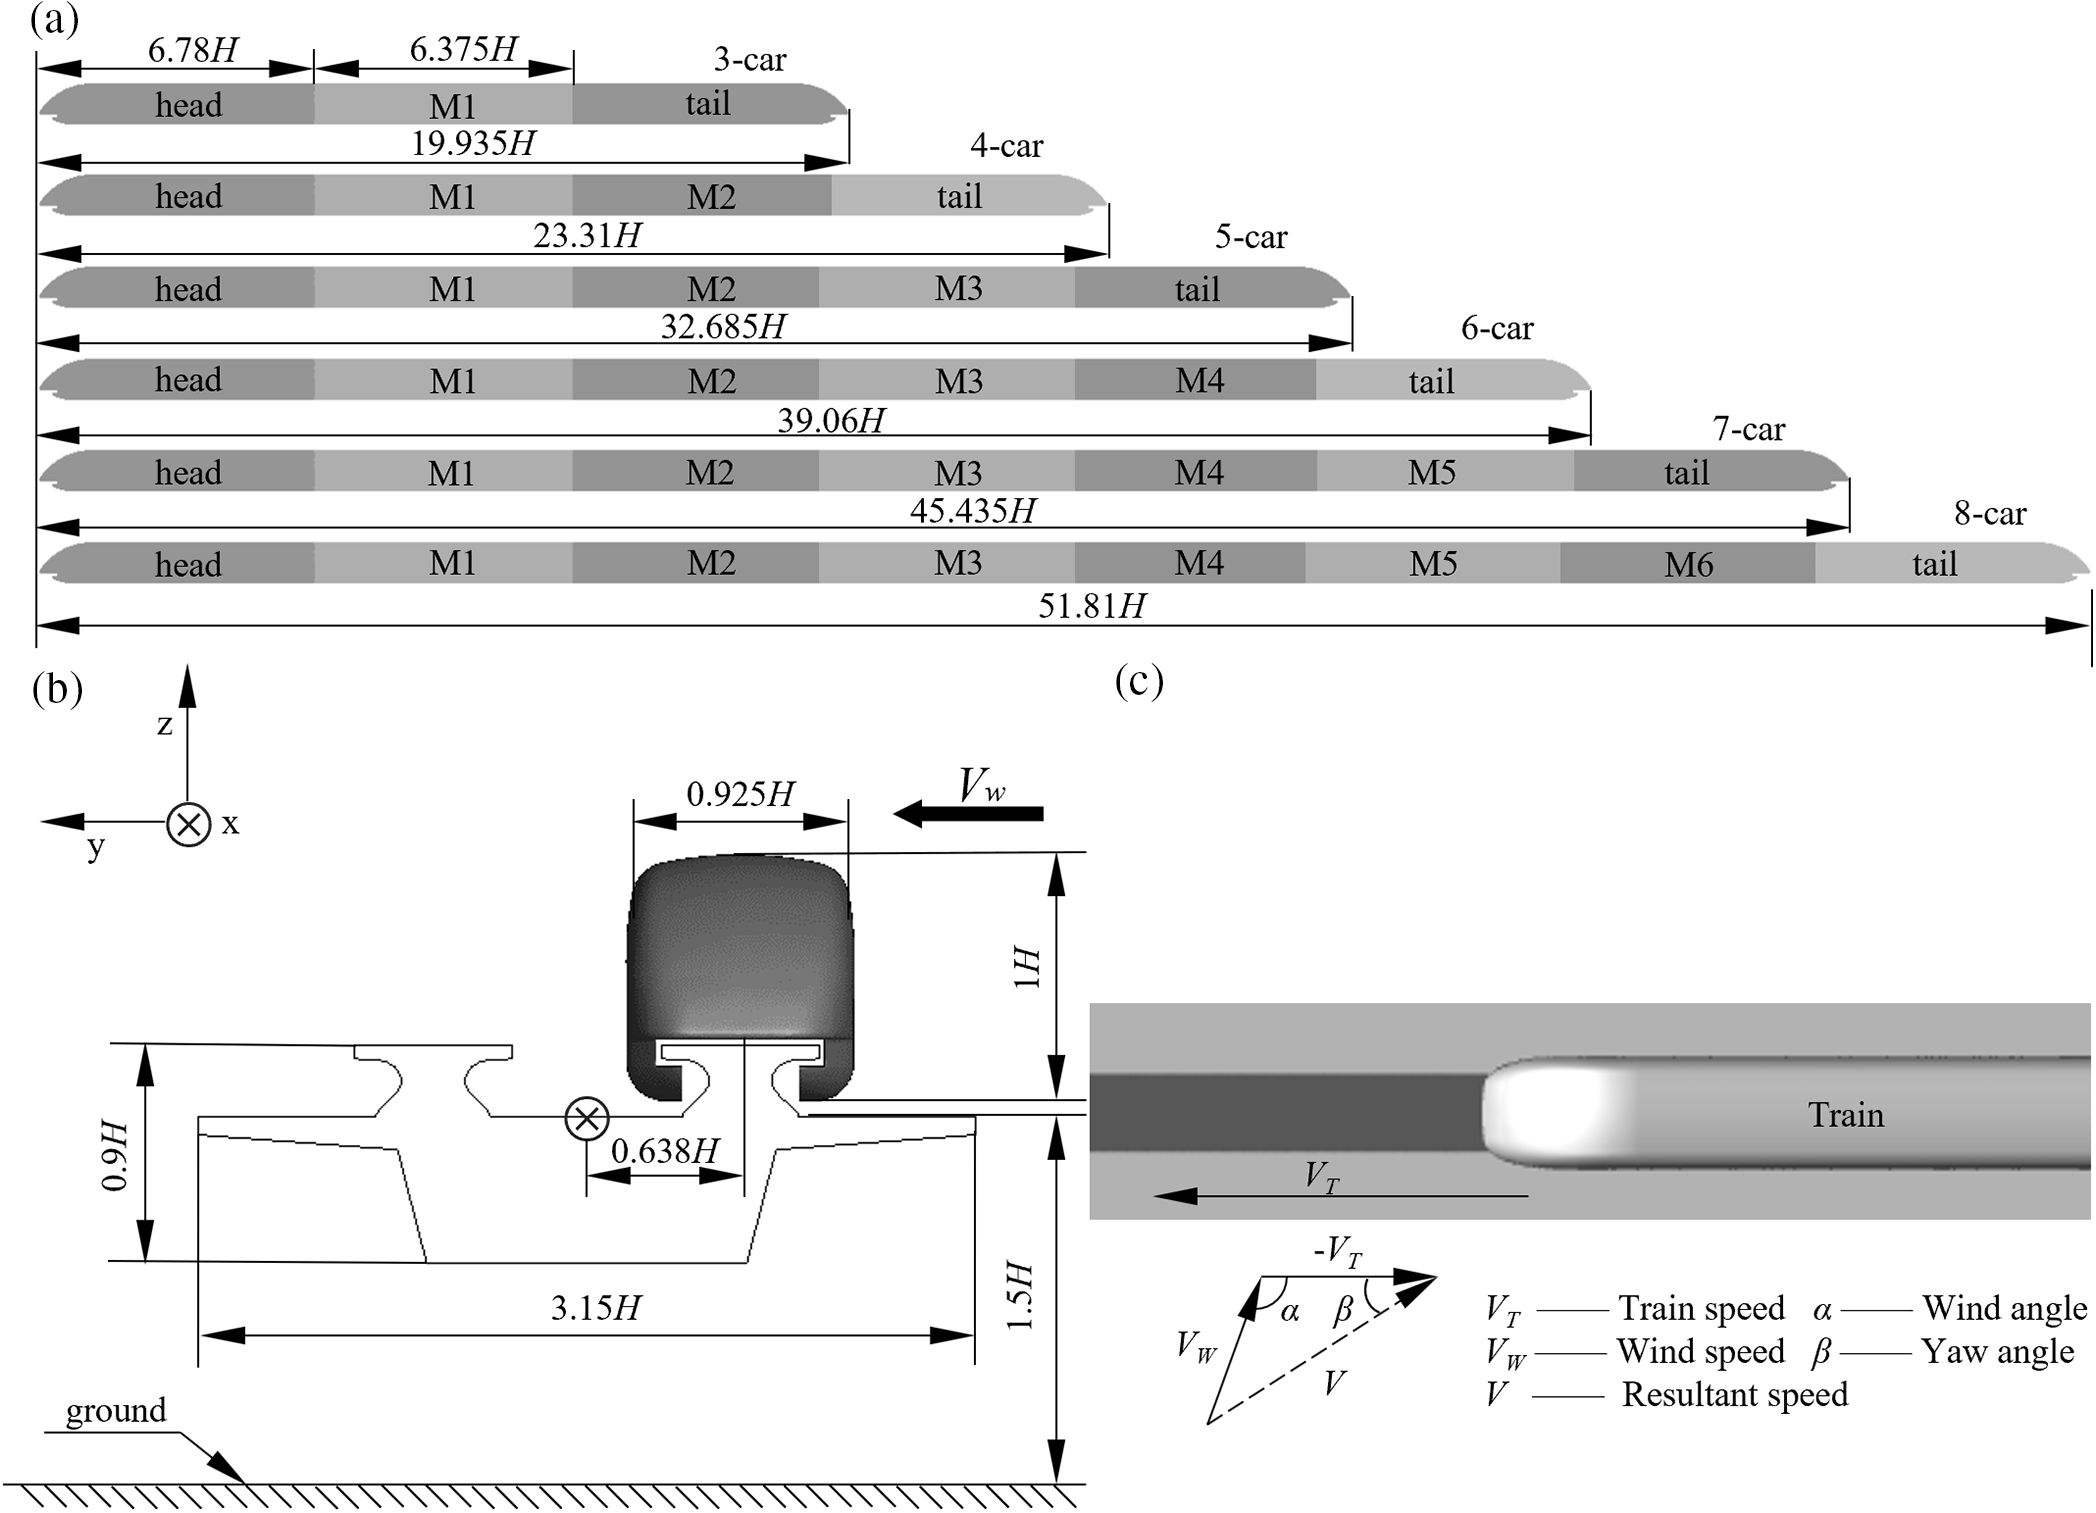
Figure 1: Geometric model: (a) train with different lengths; (b) model of train operating on the viaduct; and (c) resultant speed diagram
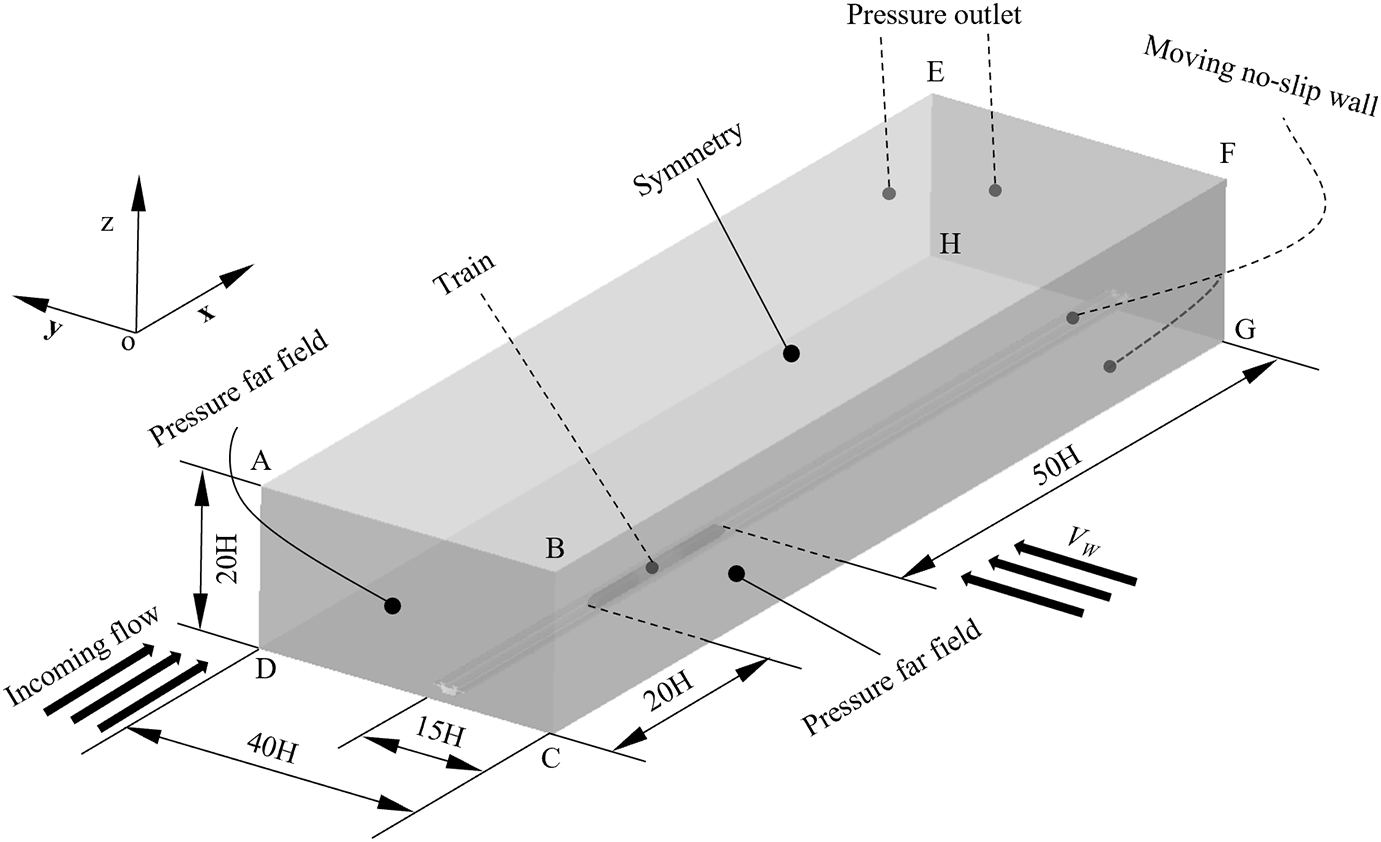
Figure 2: Computational domain and boundary conditions
In numerical simulation, common methods include the Reynolds-Averaged Navier-Strokes model (RANS) [27], LES [28], and IDDES [29], among others. The adoption of RANS models offers notable computational savings in both time and resources, but they cannot accurately predict the flow field structure. On the contrary, LES can capture smaller-scale flow field structures, yet its implementation necessitates higher grid resolutions and more extensive computational resources. To strike a balance between precision and computational efficiency, Shur et al. [30] introduced IDDES, based on the shear stress transfer
where
where
The train speed considered in this study is 600 km/h. Hence, the consideration of air compressibility becomes imperative when the Mach number
In order to create the Mosaic Poly-hexcore mesh surrounding the train, the commercial program ANSYS Fluent Meshing is utilized. Besides, grid independence simulations are performed to avoid the sensitivity of grid density. The simulation of a train with a 3-car marshaling length used coarse mesh (CM), medium mesh (MM), and fine mesh (FM), each with 14 million, 30 million, and 49 million cells, respectively. To facilitate analysis, the side force, lift force, overturning moment, and pressure are normalized for convenience. The side force coefficient (
where
In Fig. 3, the average side force coefficients
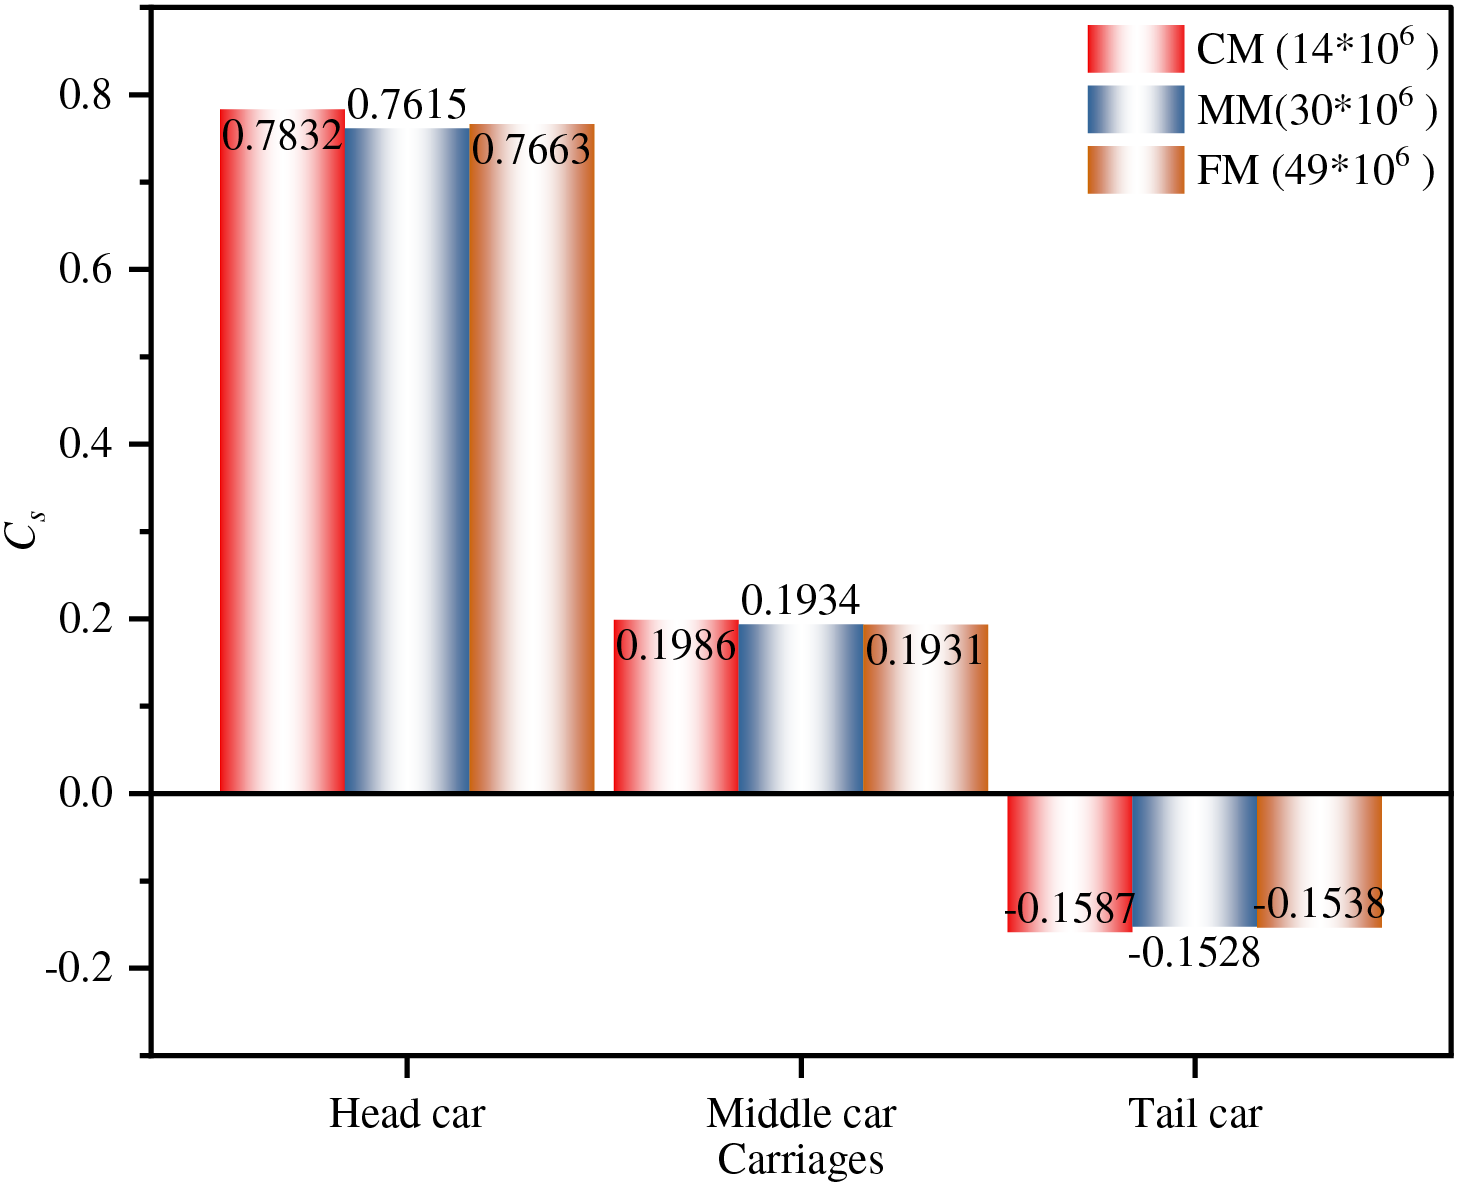
Figure 3: Average side force coefficients
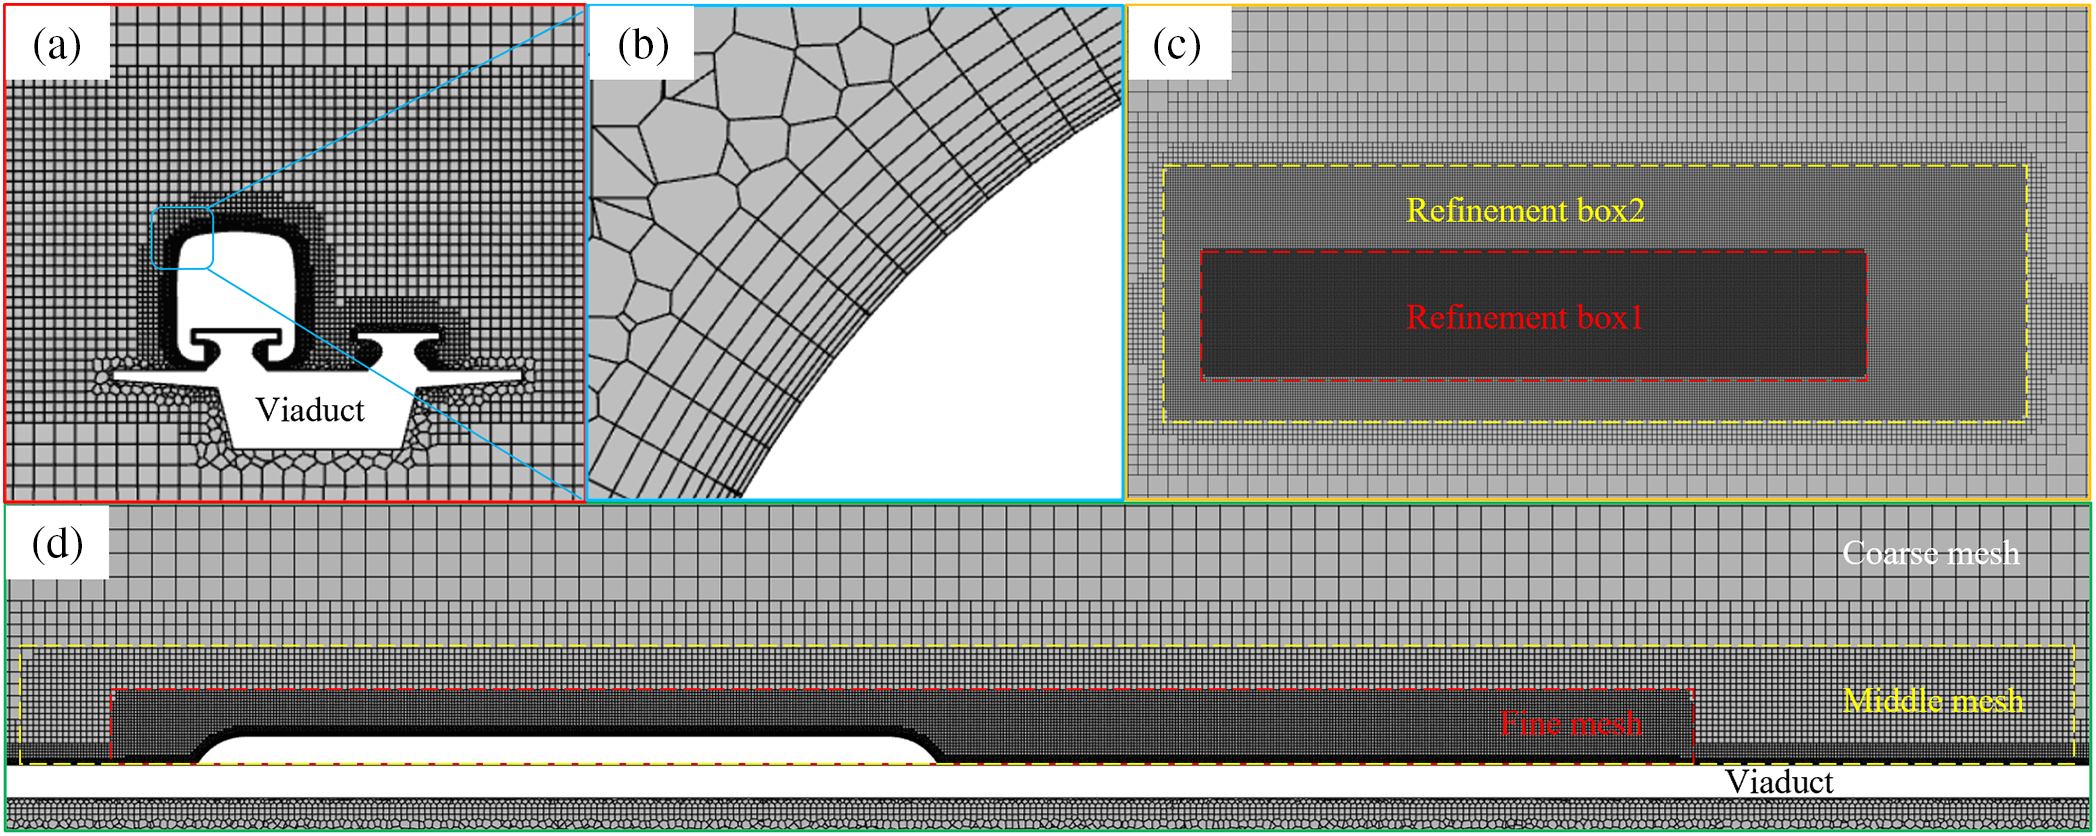
Figure 4: Computational mesh: (a) front view; (b) grid of boundary layer; (c) top view; and (d) grid around the maglev train
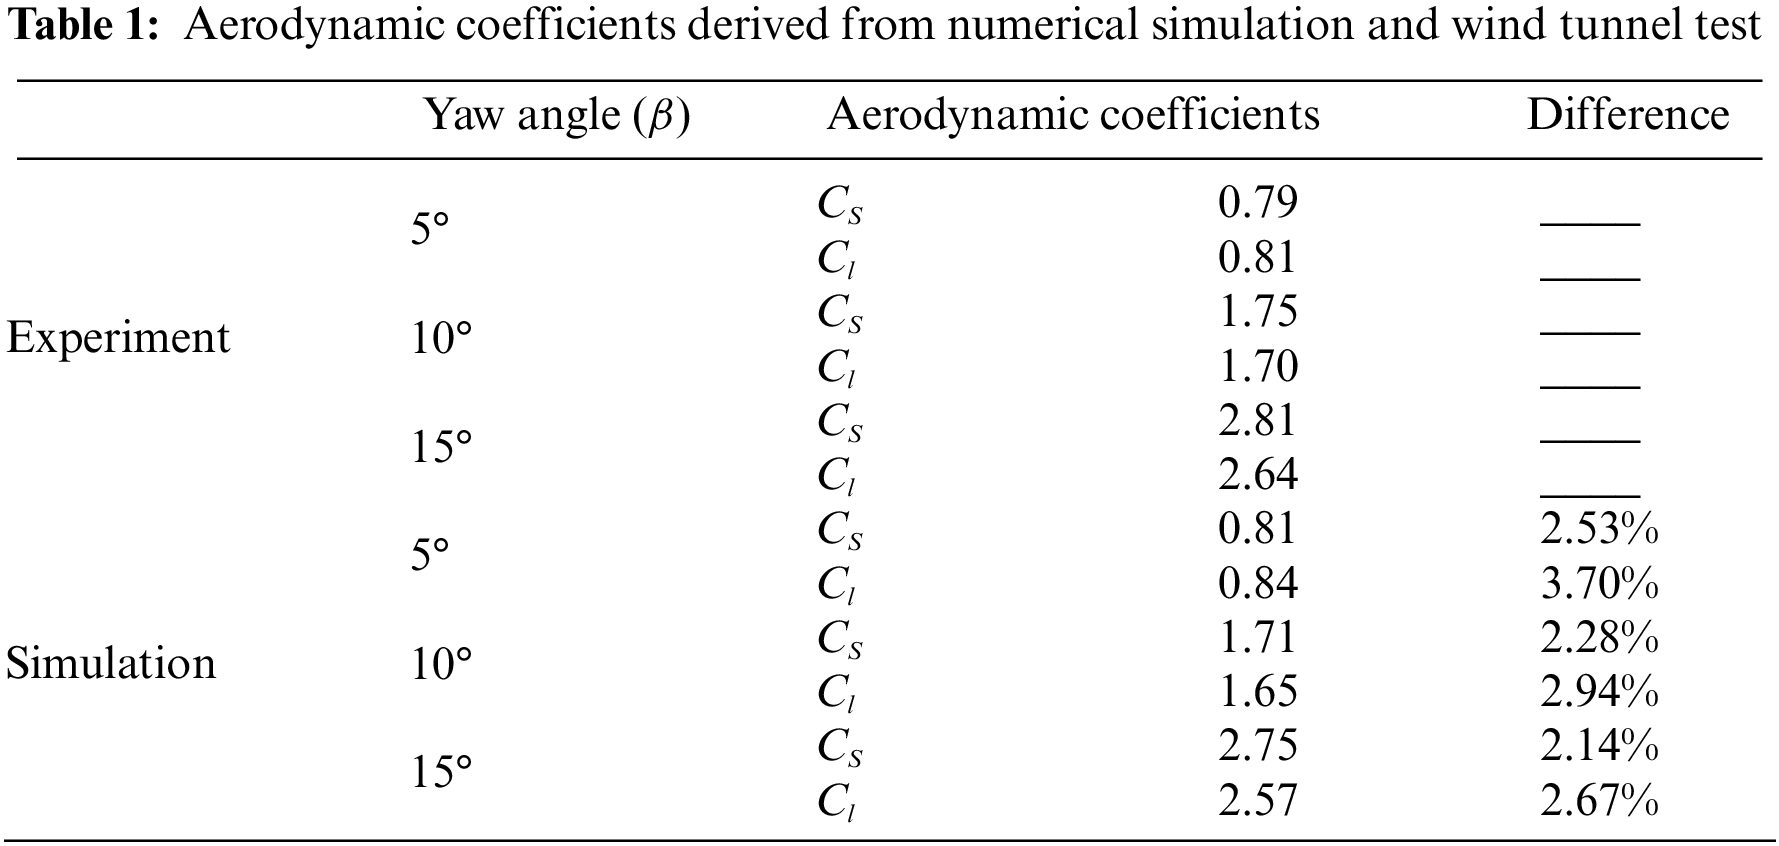
In this research, an indirect validation strategy was employed due to the absence of identical test case data. Specifically, the numerical algorithm is validated through a wind tunnel test from [26], equipped with a 1/15th-scale Intercity-Express-3 (ICE3) train model and a standard embankment with ballast and track, as shown in Fig. 5. The computational domain in the streamlined direction relative to the ICE3 train is consistent with that of the maglev train, and the inlet boundary condition is also set as pressure far field. The grid strategy and turbulence model follow those in the previous section. The incoming velocity was set to match the resultant speed, aligning with the wind speed used in the wind tunnel test, which was 50 m/s. Table 1 provides a comparison between the aerodynamic force coefficients of the train at different yaw angles as it moves along the windward line of the embankment, as obtained through numerical simulation and wind tunnel test. At a yaw angle of 5°, the maximum deviation for
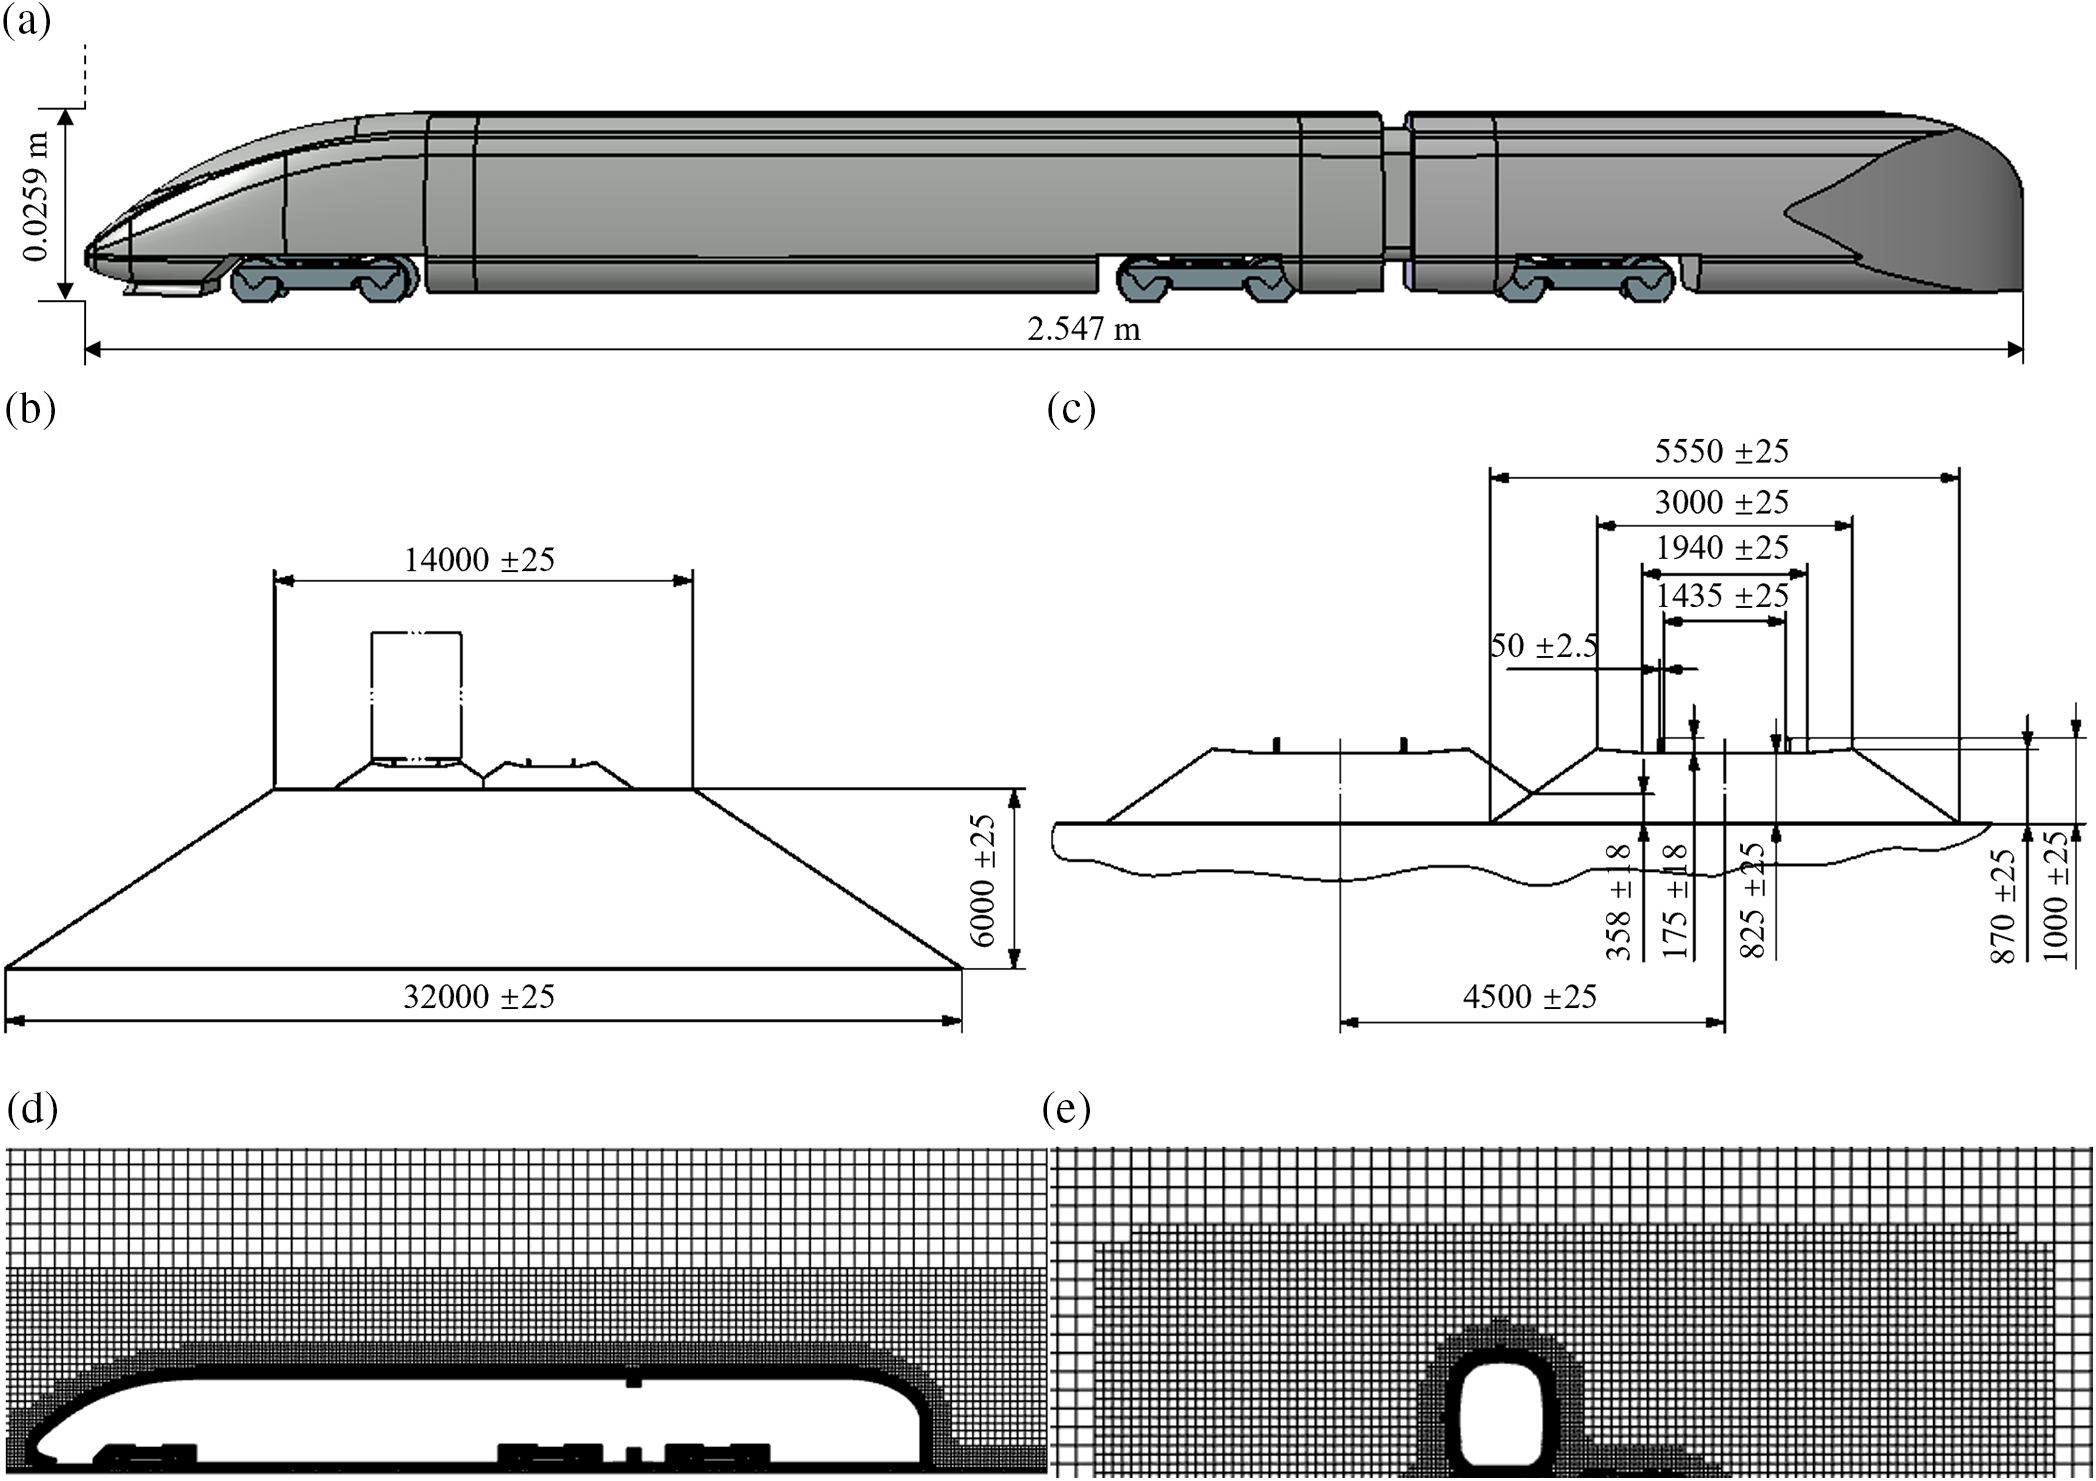
Figure 5: Computational model of wind tunnel test: (a) ICE3 train model; (b) sketch of the embankment geometry; (c) sketch of ballast geometry (unit: mm), (BS EN 14067-6) [26]; (d) mesh around the ICE3 train (side view); and (e) mesh around the ICE3 train (cross-section)
3.1 Time-Average Aerodynamic Forces Analysis
In crosswinds, high-speed trains experience significant lateral forces, potentially compromising their lateral stability [37–39]. Fig. 6 displays the time-averaged side force coefficient of high-speed maglev trains operating in a crosswind (30 m/s) for various marshaling lengths. The results show that marshaling lengths have a negligible effect on the
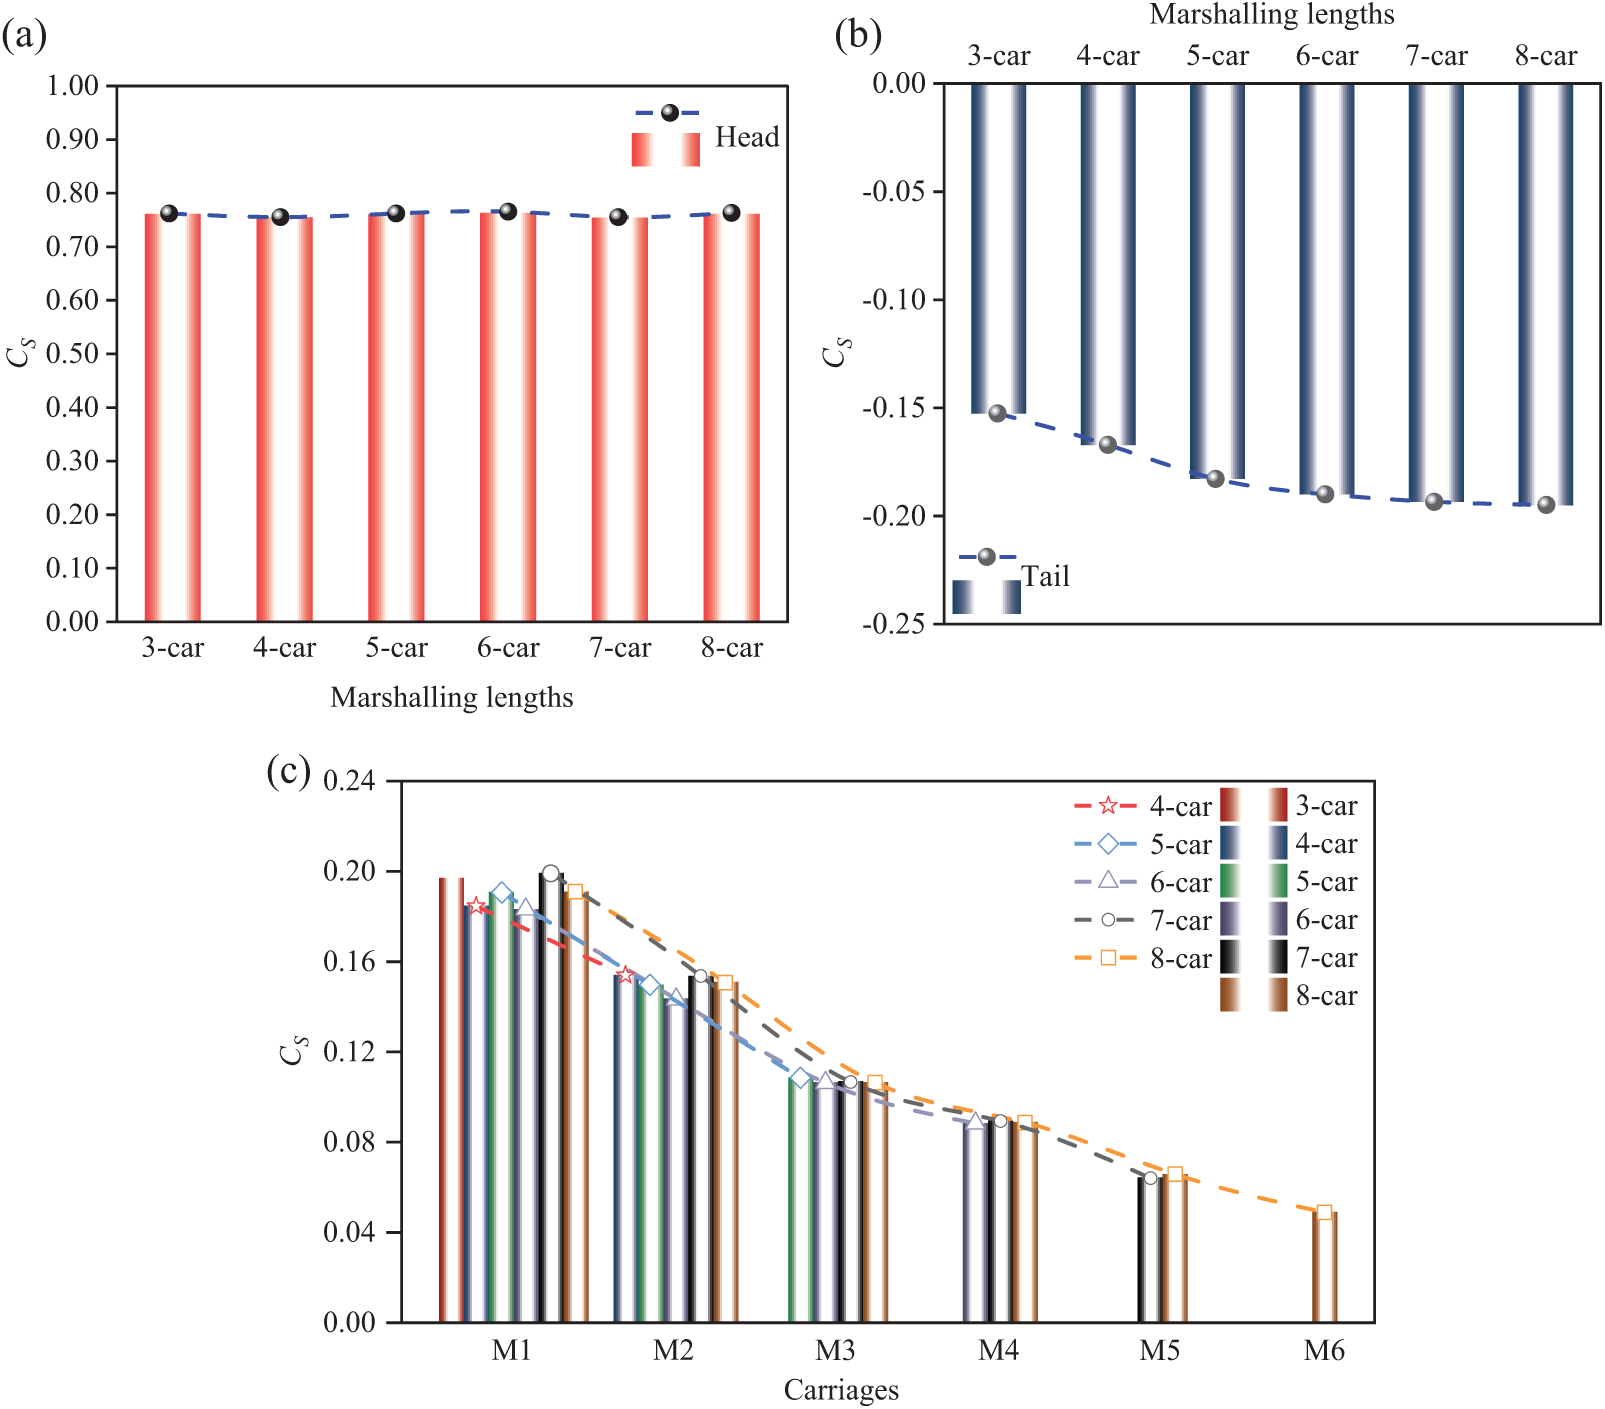
Figure 6: Time-average
Marshaling lengths affect both the lateral and vertical stability of the train in crosswinds [41–43]. Fig. 7 shows the lift force coefficients
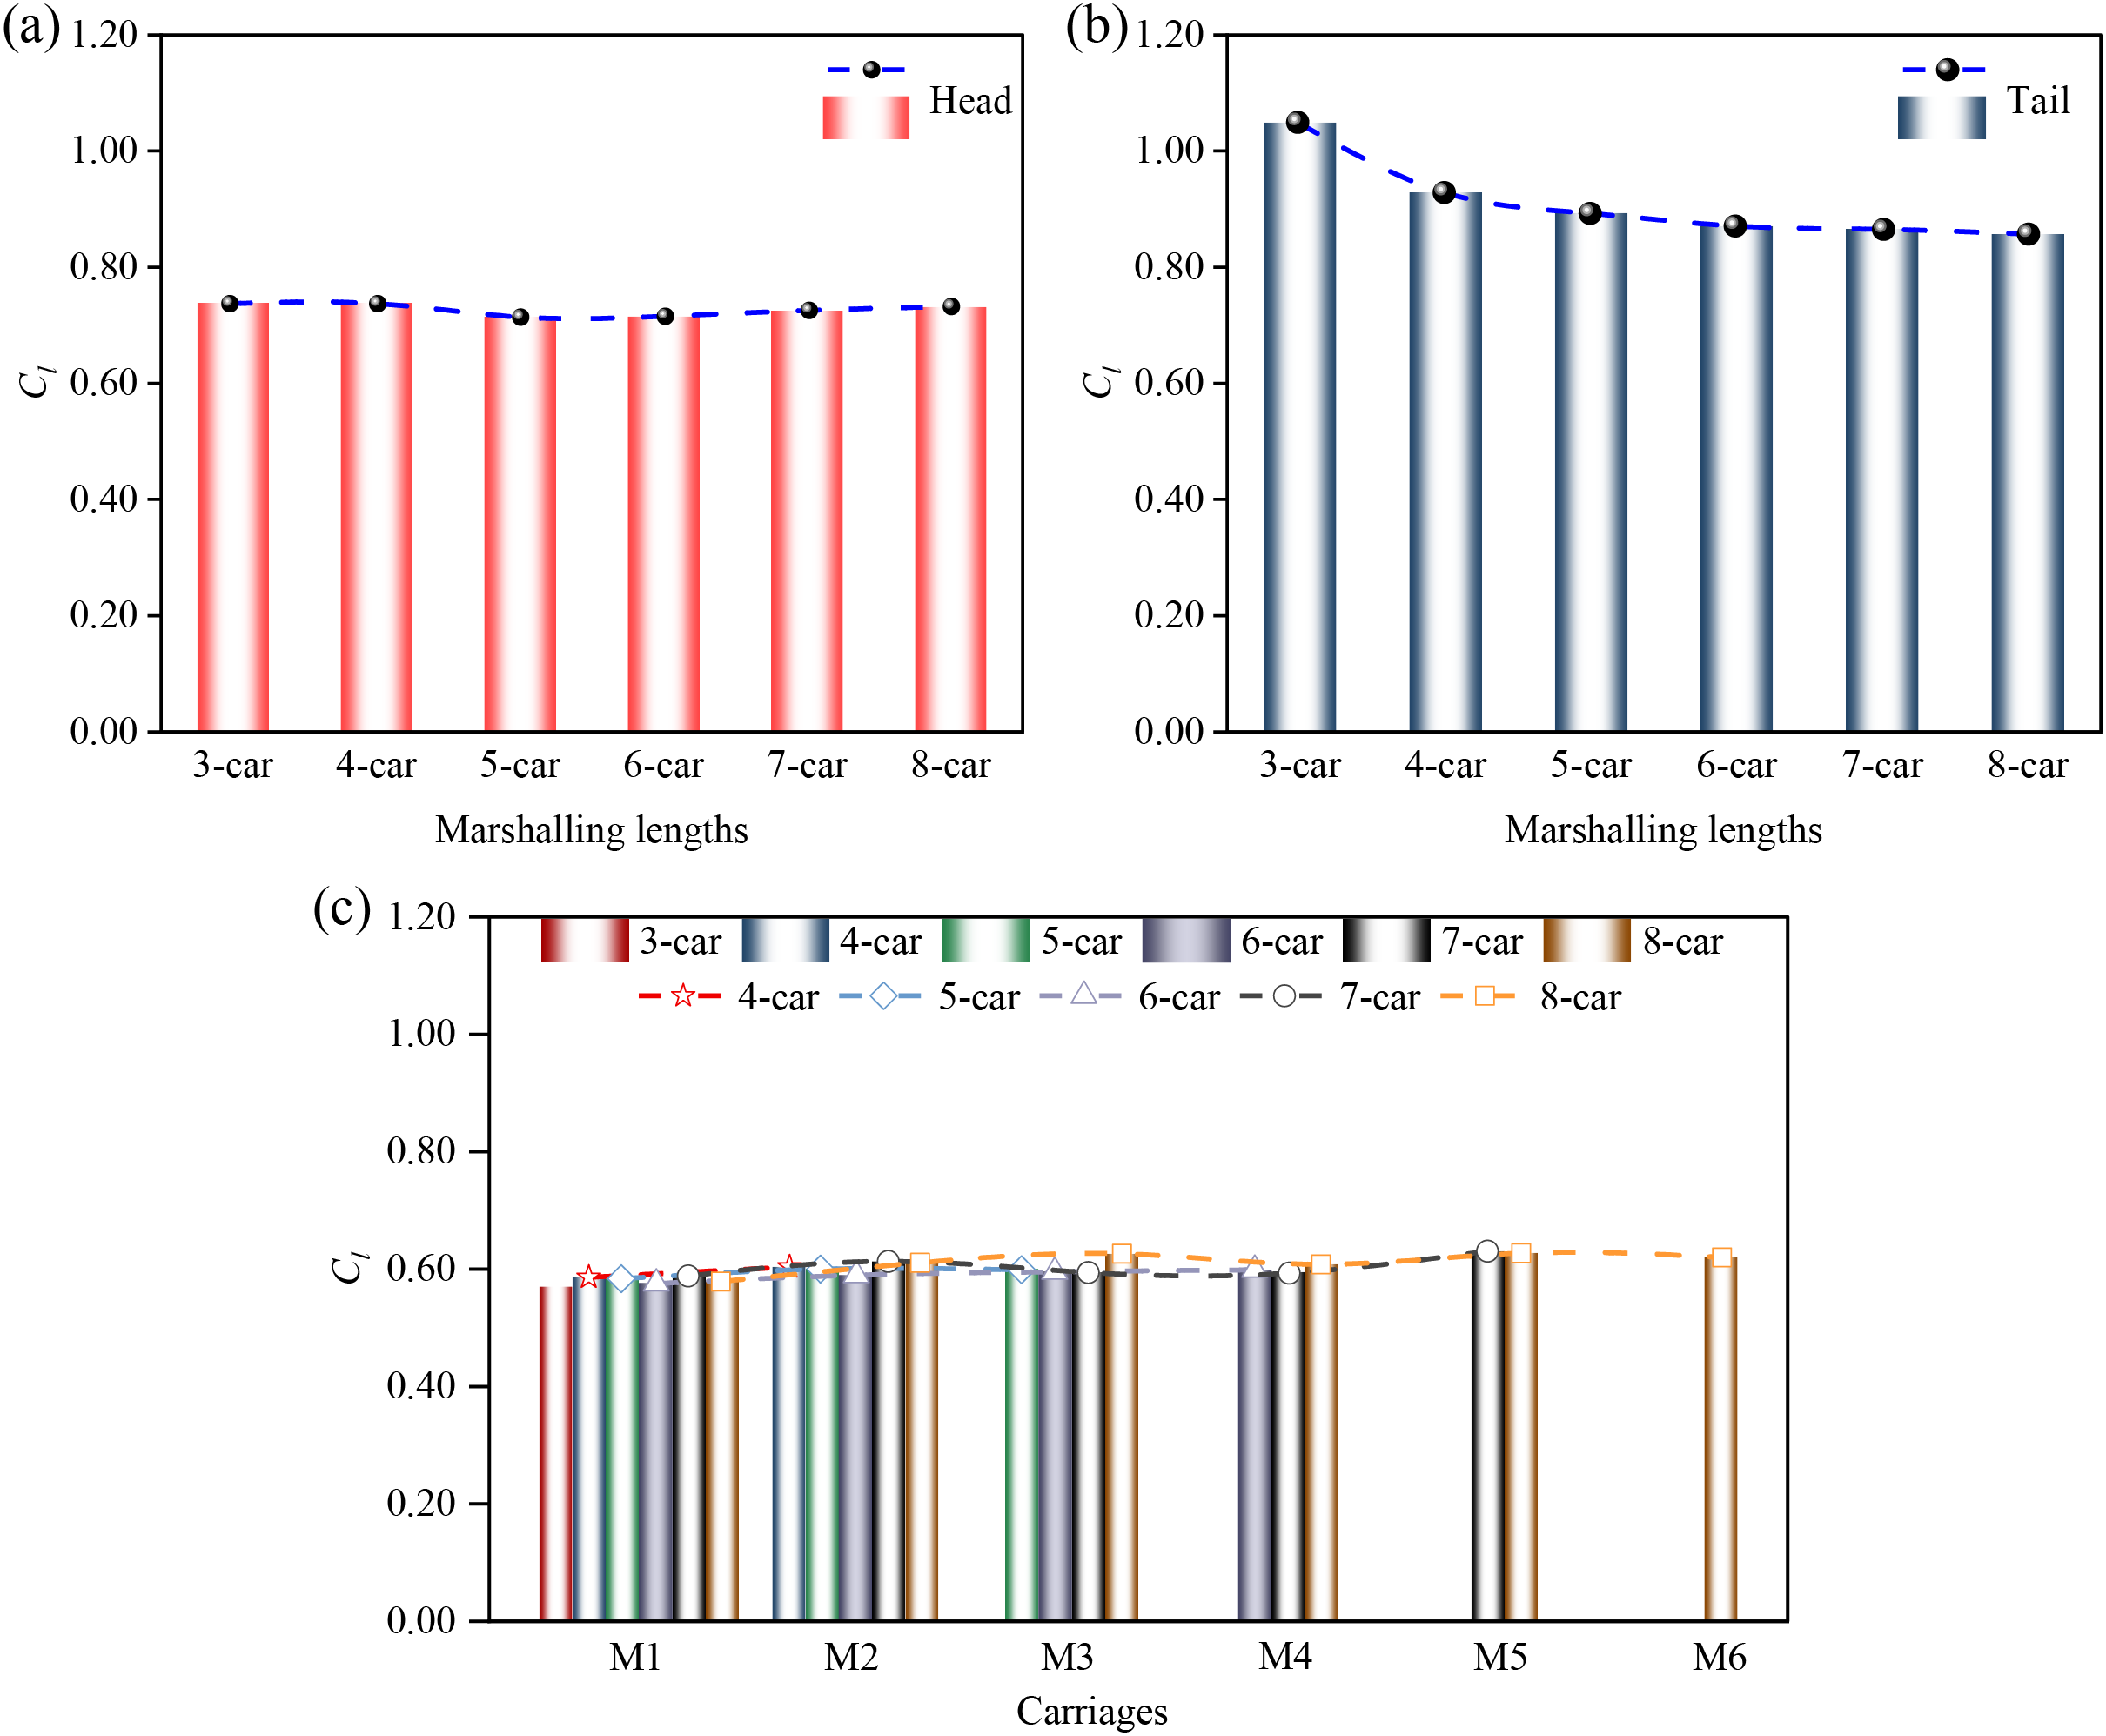
Figure 7: Time-average
It is widely acknowledged that the coefficients of side force and lift force play a role in determining the overturning moment coefficient. Fig. 8 illustrates the overturning moment coefficients
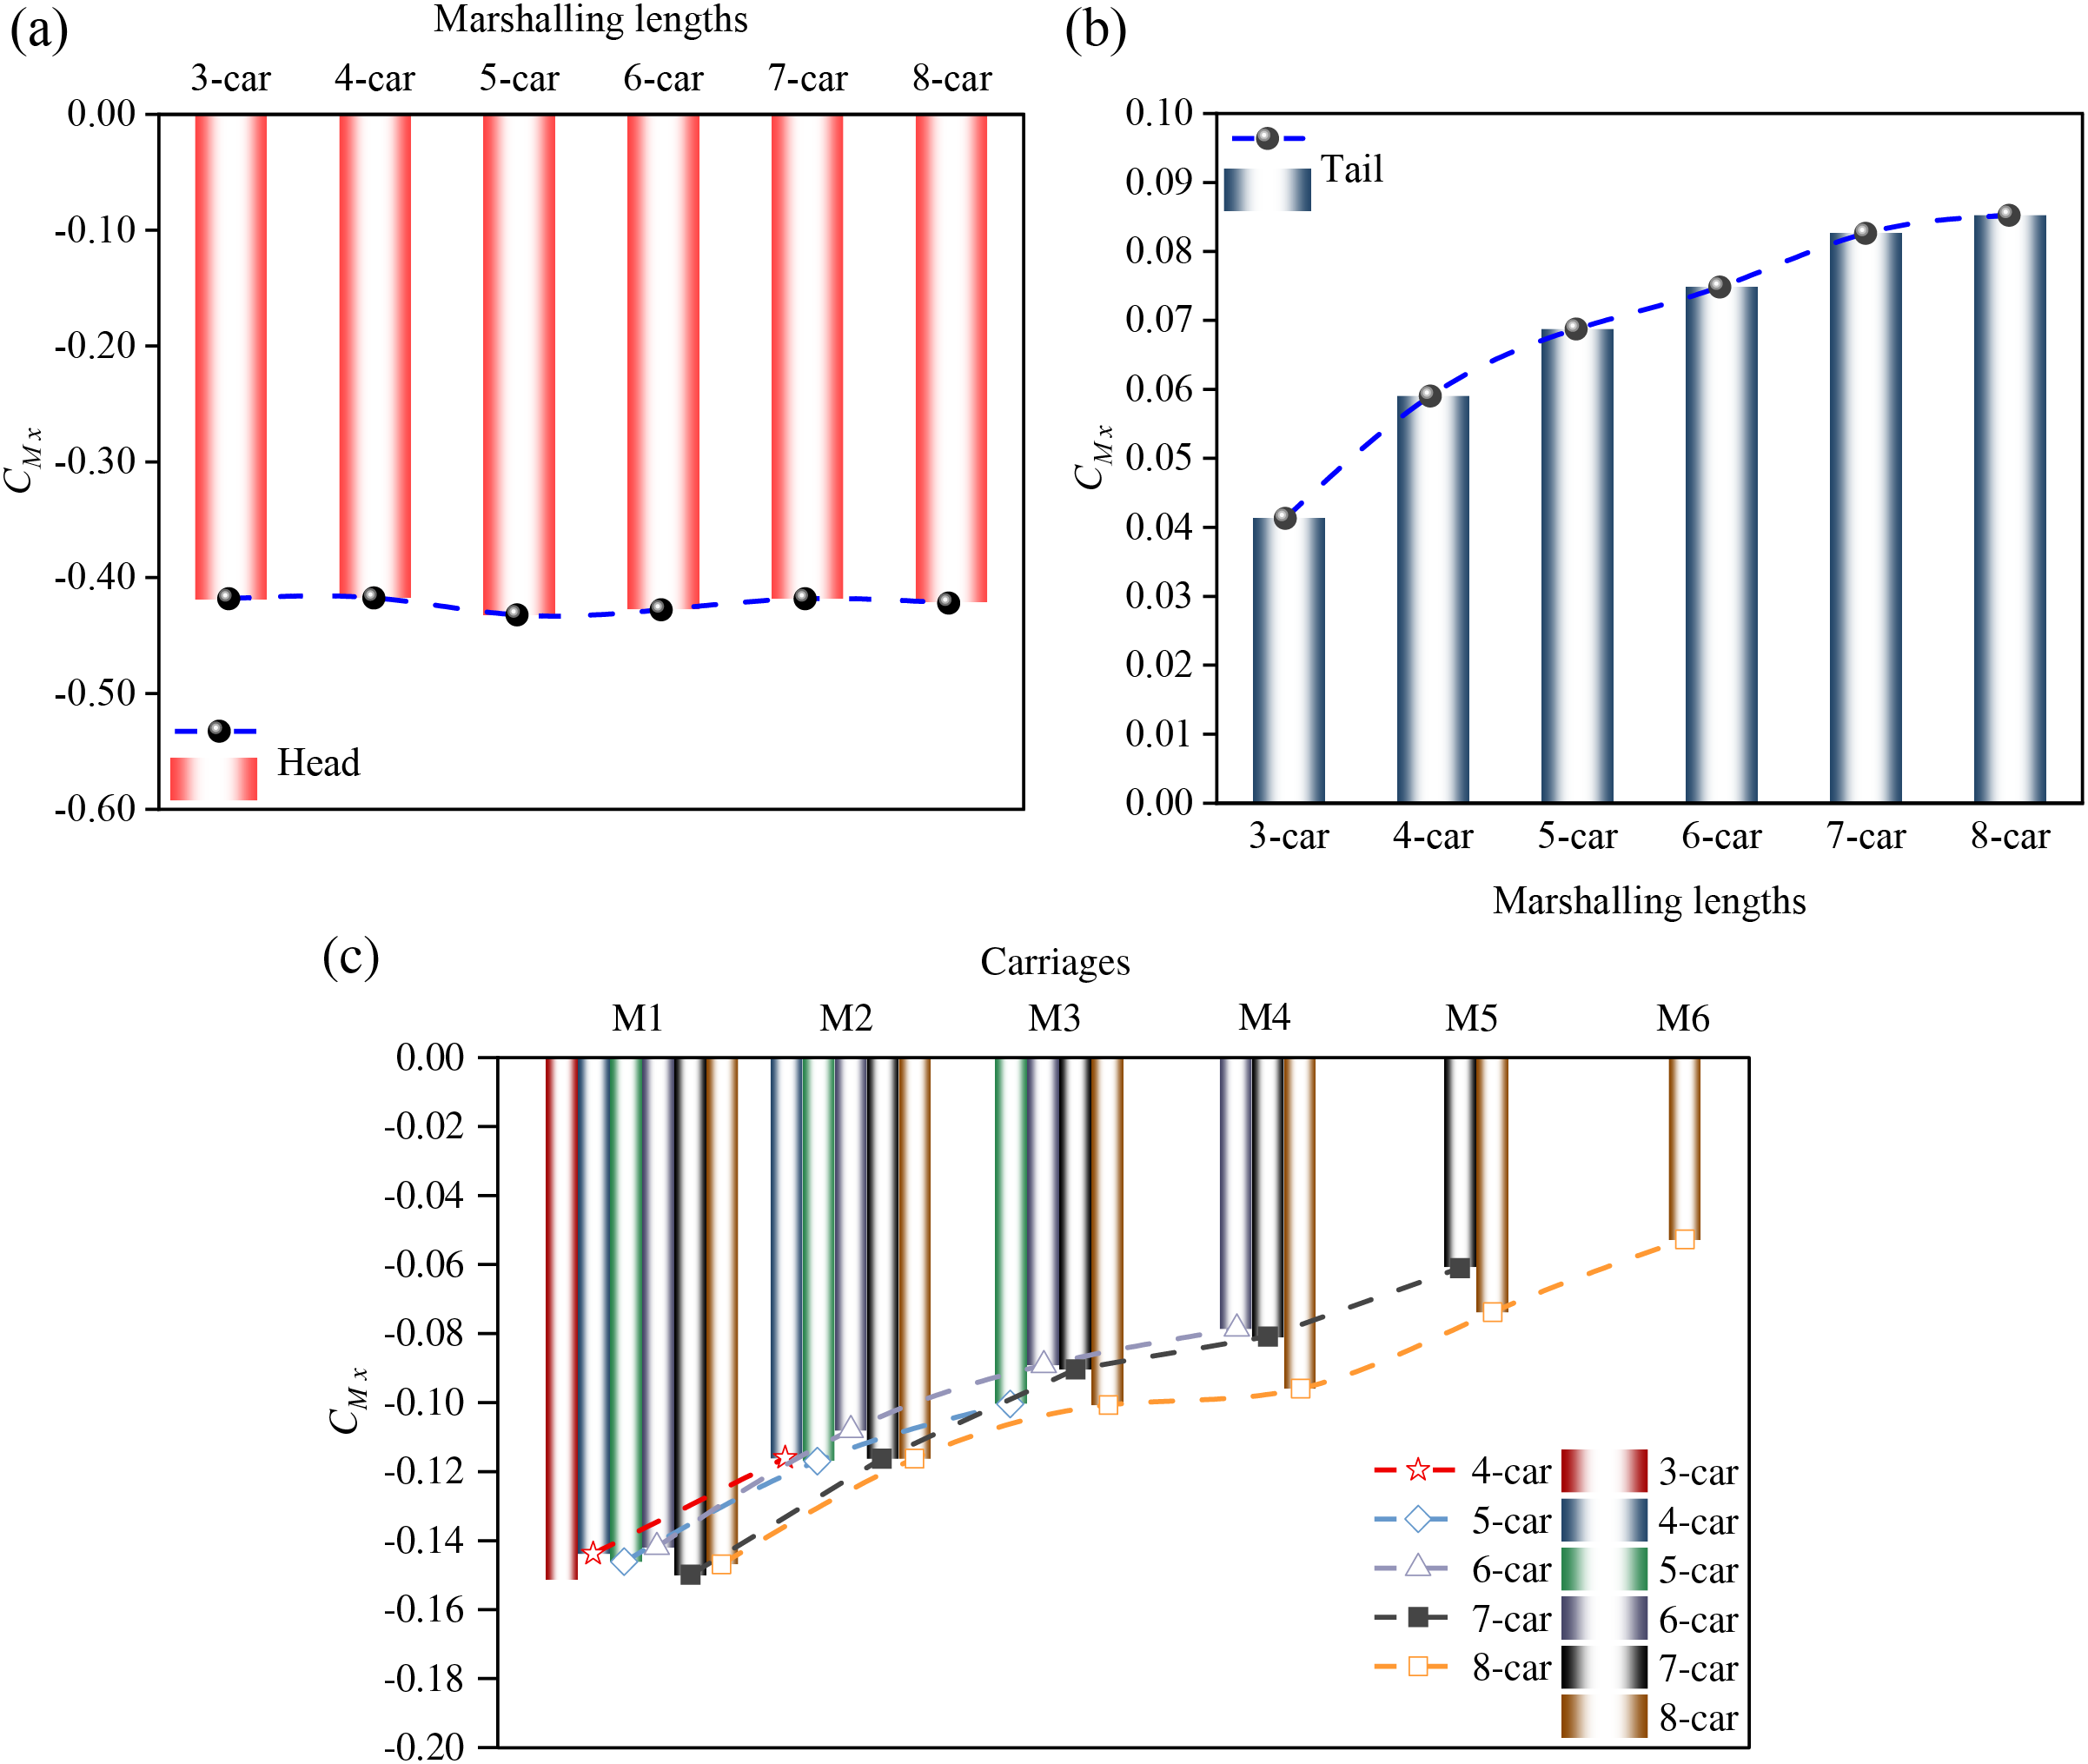
Figure 8: Time-average
3.2 Pressure Distribution around the Train
It is a well-established fact that in a windless environment, the surface pressure distribution on both the head and tail cars of the train is symmetrical [44,45]. Certainly, the pressure distribution plays a significant role in shaping the aerodynamic features of the train. Fig. 9 displays the surface pressure around the train when subjected to crosswinds. It was discovered that the surface pressure on the head car remains nearly consistent across different groups, including the nose of the head car, the red box, which is the windward side (WWS), and the black box which is the leeward side (LWS). This reflects the fact that there is only little variation in the aerodynamic pressures on the head car between 3-car and 8-car groups. However, the pressure distribution of the tail car varied significantly among the six different groups, especially towards the rear of the tail car. It is suggested that the aerodynamic forces acting on the tail car are undoubtedly influenced by the formation length. Fig. 9b shows that the negative pressure region on the tail car within the grey box (corresponding to the WWS streamline) was more extensive than in the orange box (associated with the LWS streamline). Additionally, the positive pressure area on the nose of the tail car was shifted towards the LWS. On the other hand, there was a tendency toward lower maximum negative pressure in the orange box, which might indicate a negative value for the side force.
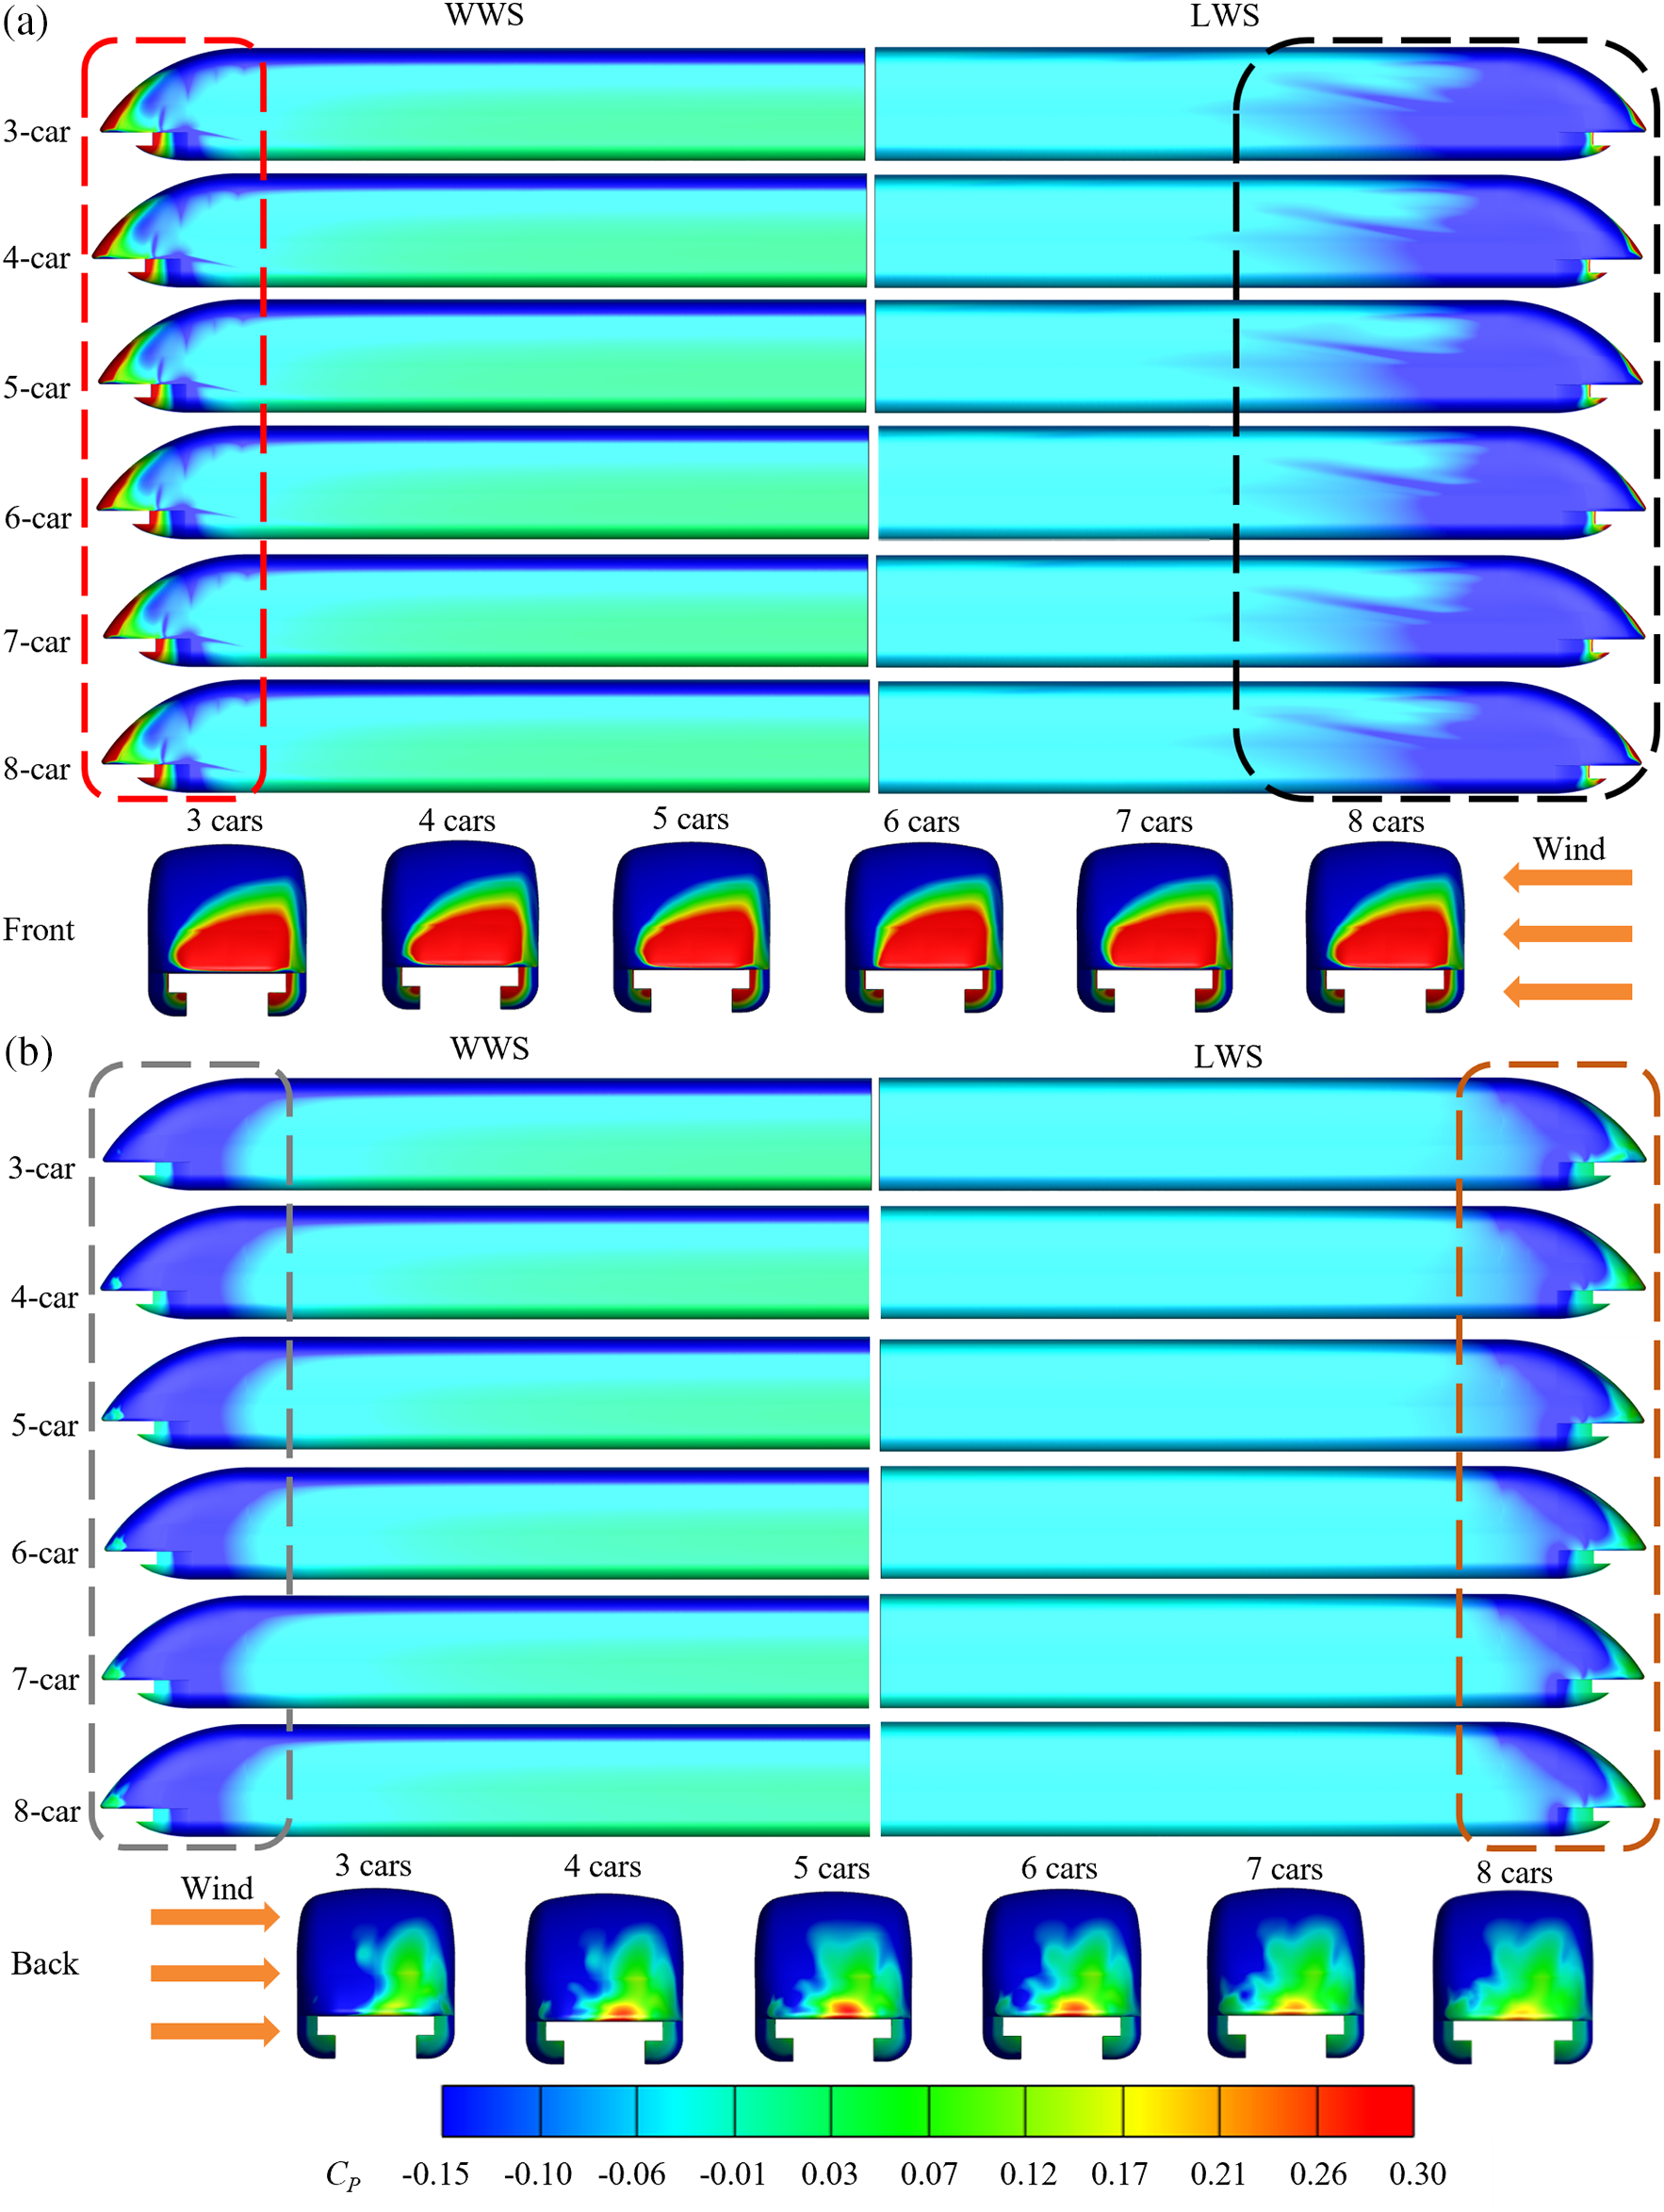
Figure 9: Mean pressure distribution contour around the train with different marshaling lengths: (a) head car and (b) tail car
Fig. 10 illustrates the distribution of the pressure coefficient
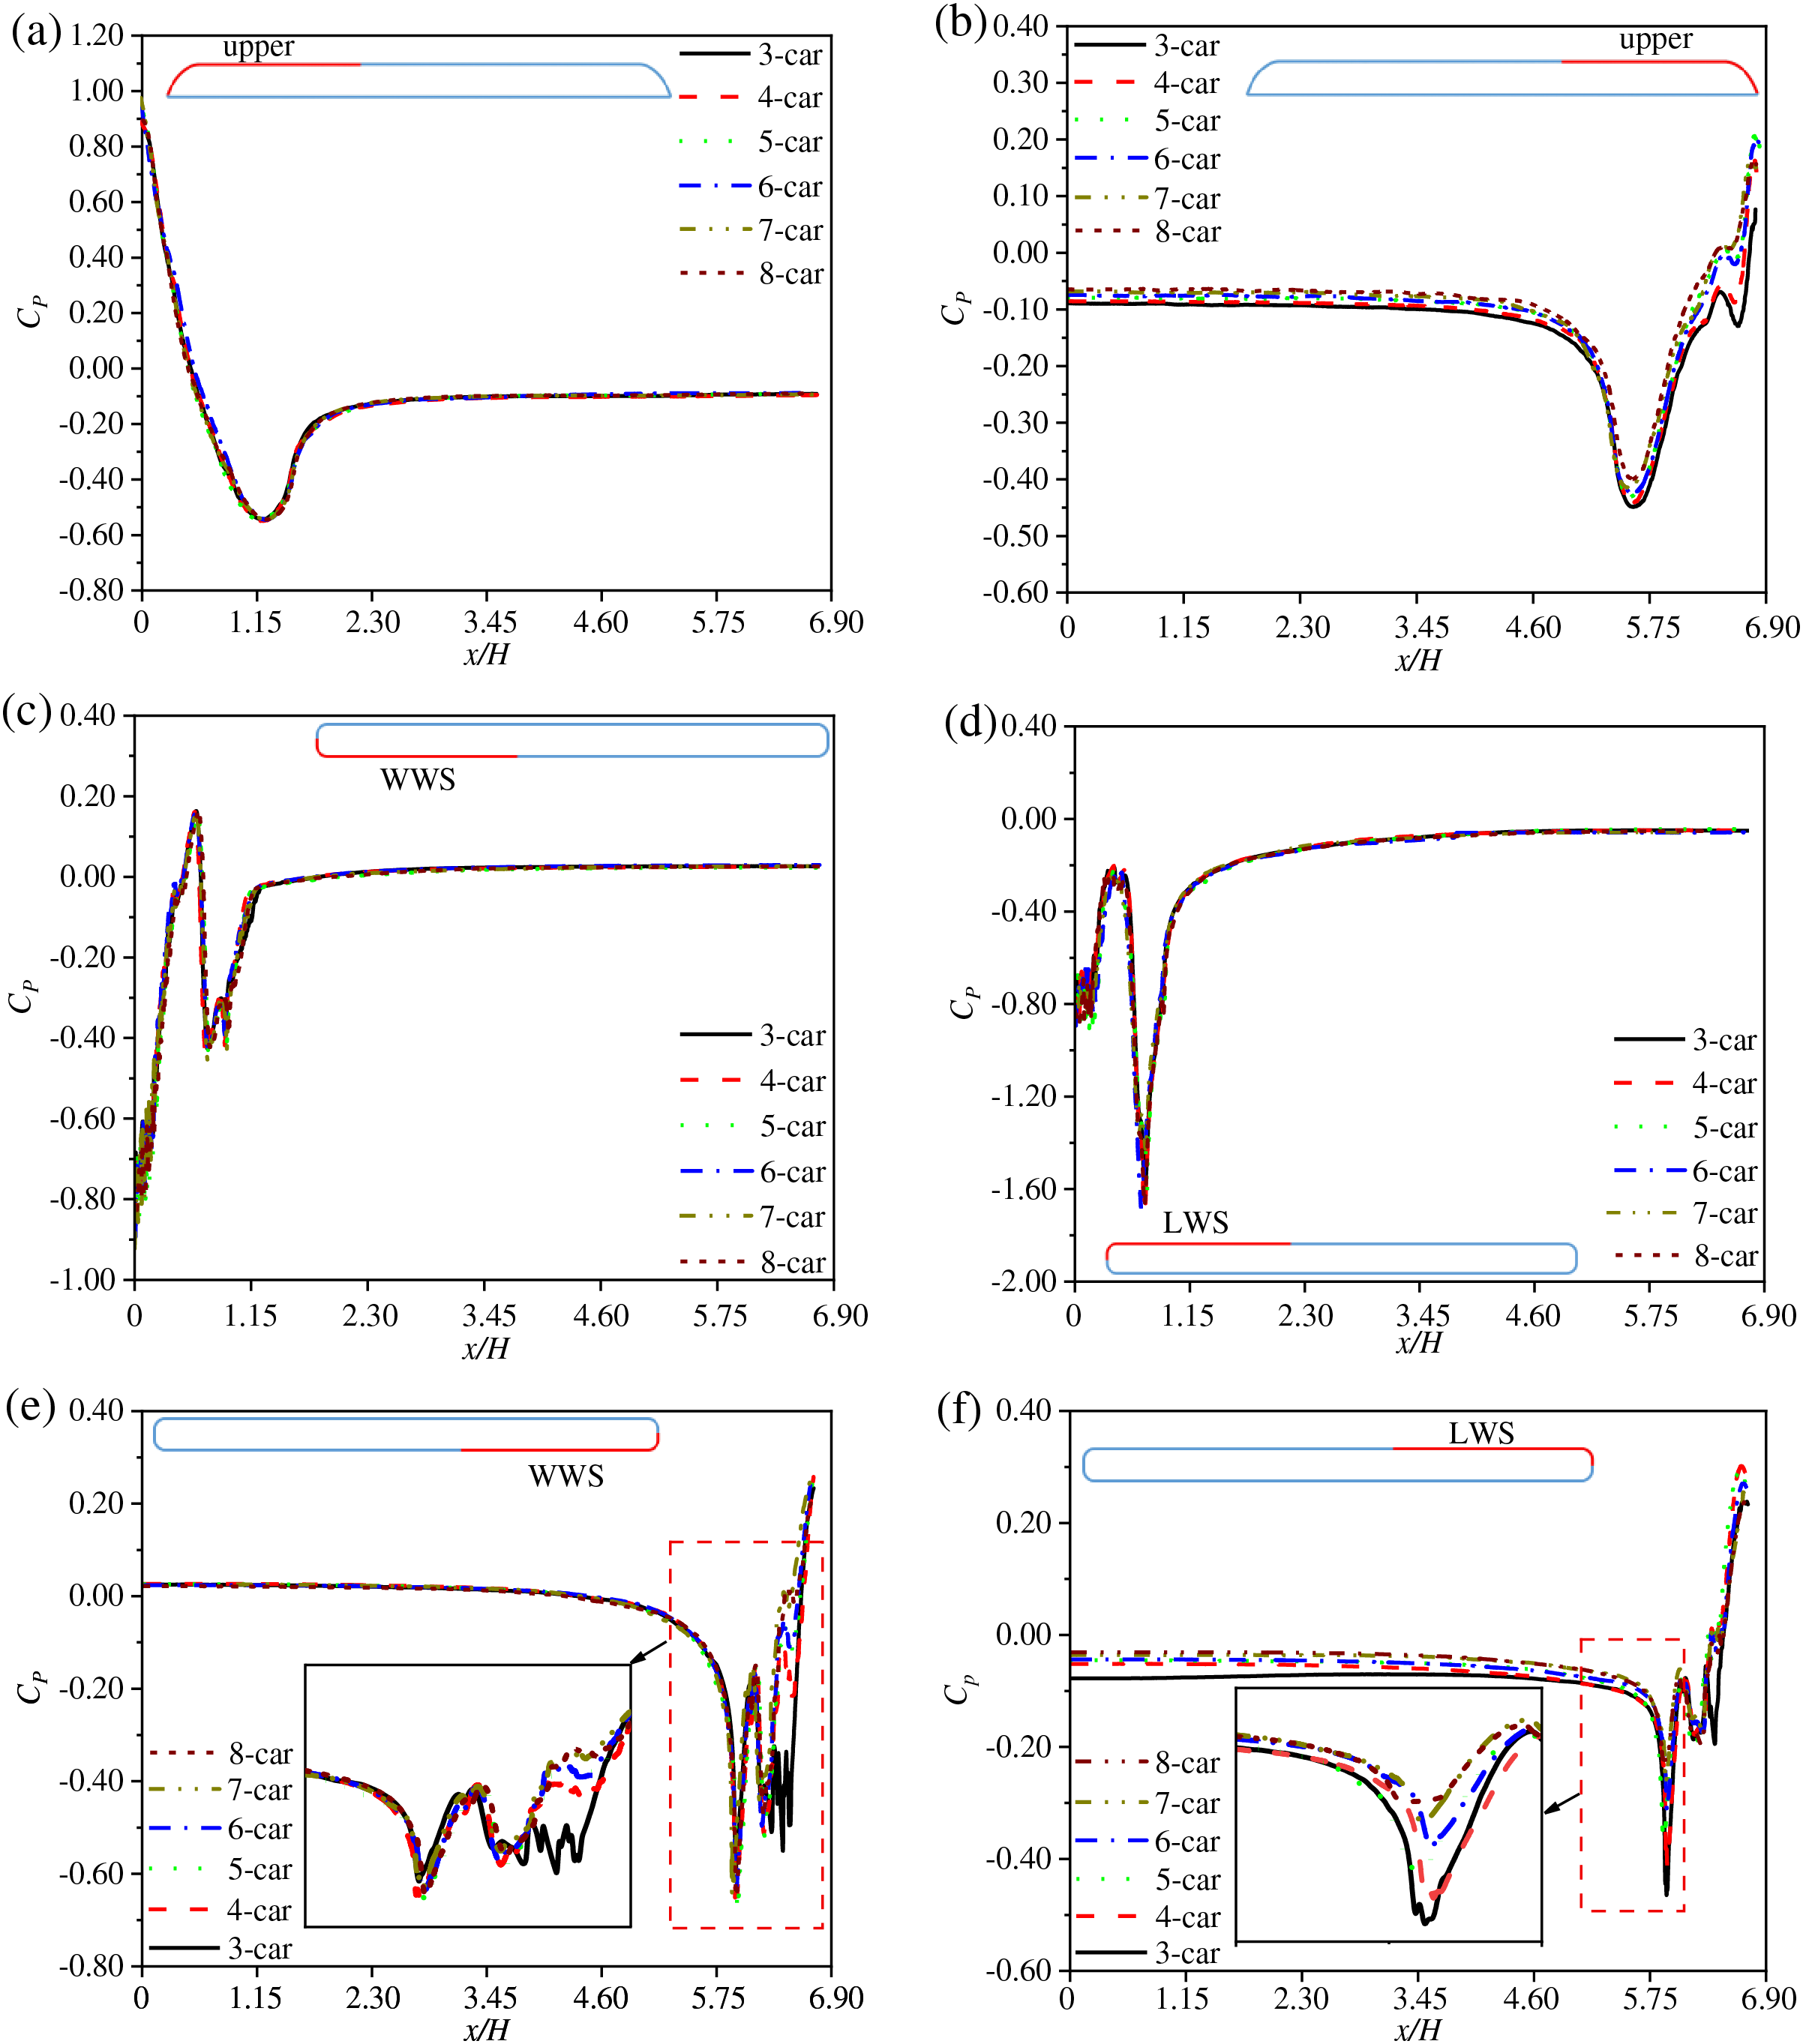
Figure 10: Mean pressure coefficient distribution around the train with different marshaling lengths: (a) longitudinal section of the head car; (b) longitudinal section of the tail car; (c, d) horizontal section of the head car (z/H = 0.29); and (e, f) horizontal section of the tail car (z/H = 0.29)
Figs. 10e and 10f show that the
When the train travels into a crosswind, the vortex structures are mostly centered on the LWS of the train [46,47]. As seen in Fig. 11a, positions X1–X8 are the middle sections of each carriage, including the head car, middle cars (M1–M6), and tail car. Fig. 11b displays the flow structure of 8-car groups, colored by the mean velocity coefficient. As the incoming air strikes the train, two primary vortex structures form on its LWS, designated as vortex V1 and V2. Vortex V1 gradually expands in scale between cross-sections X1 and X4, but its velocity gradually drops. Then, vortex V1 begins to separate after cross-section X4, separating into three smaller vortices until cross-section X6. Finally, vortex V1 dissipates downstream to the LWS of the train. Vortex V2, difficult to dissipate due to the existence of two guideways, develops similarly to V1 but merges with the vortices shed by vortex V1 and the train body into a vortex of greater scale.
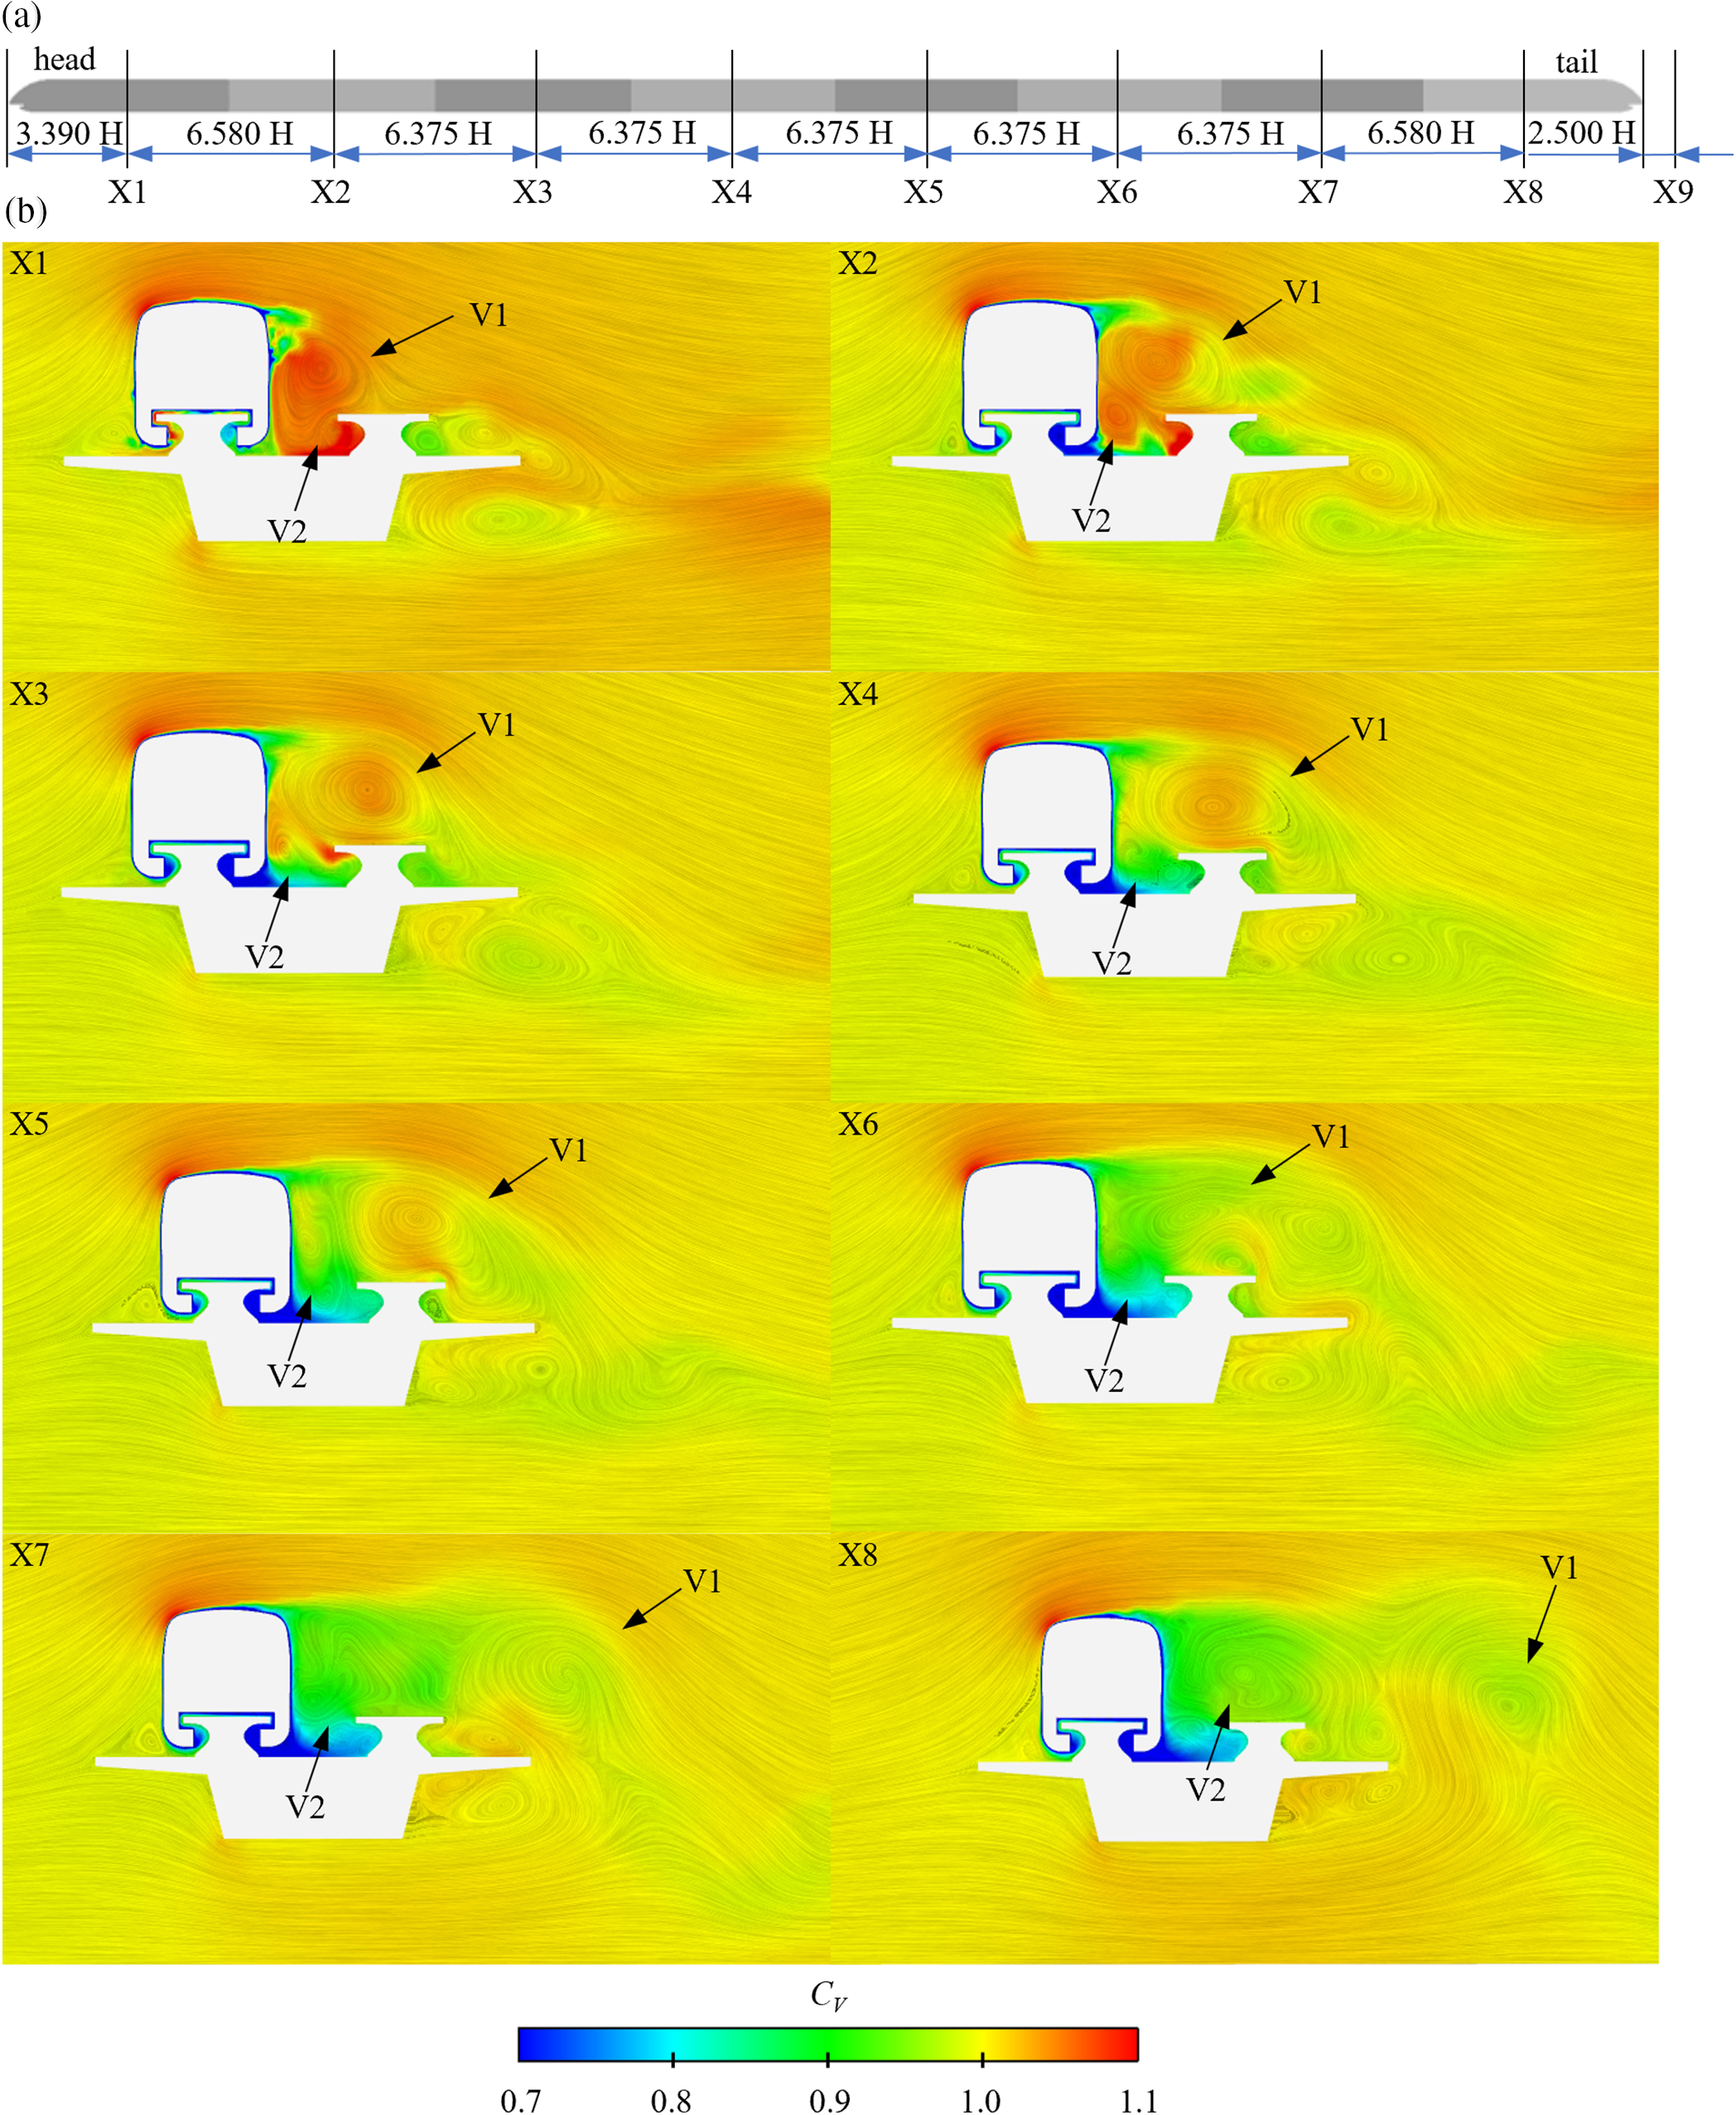
Figure 11: Velocity and flow structure distributions of 8-car marshaling lengths: (a) schematic diagram of each cross-section; and (b) flow structure contour of each cross-section
The structure of the flow field at various marshaling lengths is seen in Fig. 12. Fig. 12 clearly shows that the train’s formation length significantly affects the flow field structure of the tail car. The longer the train, the larger the scale of vortex V1 and the smaller its velocity. Vortex V1 begins to separate at cross-section X8 of the 4-car marshaling lengths, similar to vortex V1 at cross-section X4 in Fig. 11b.
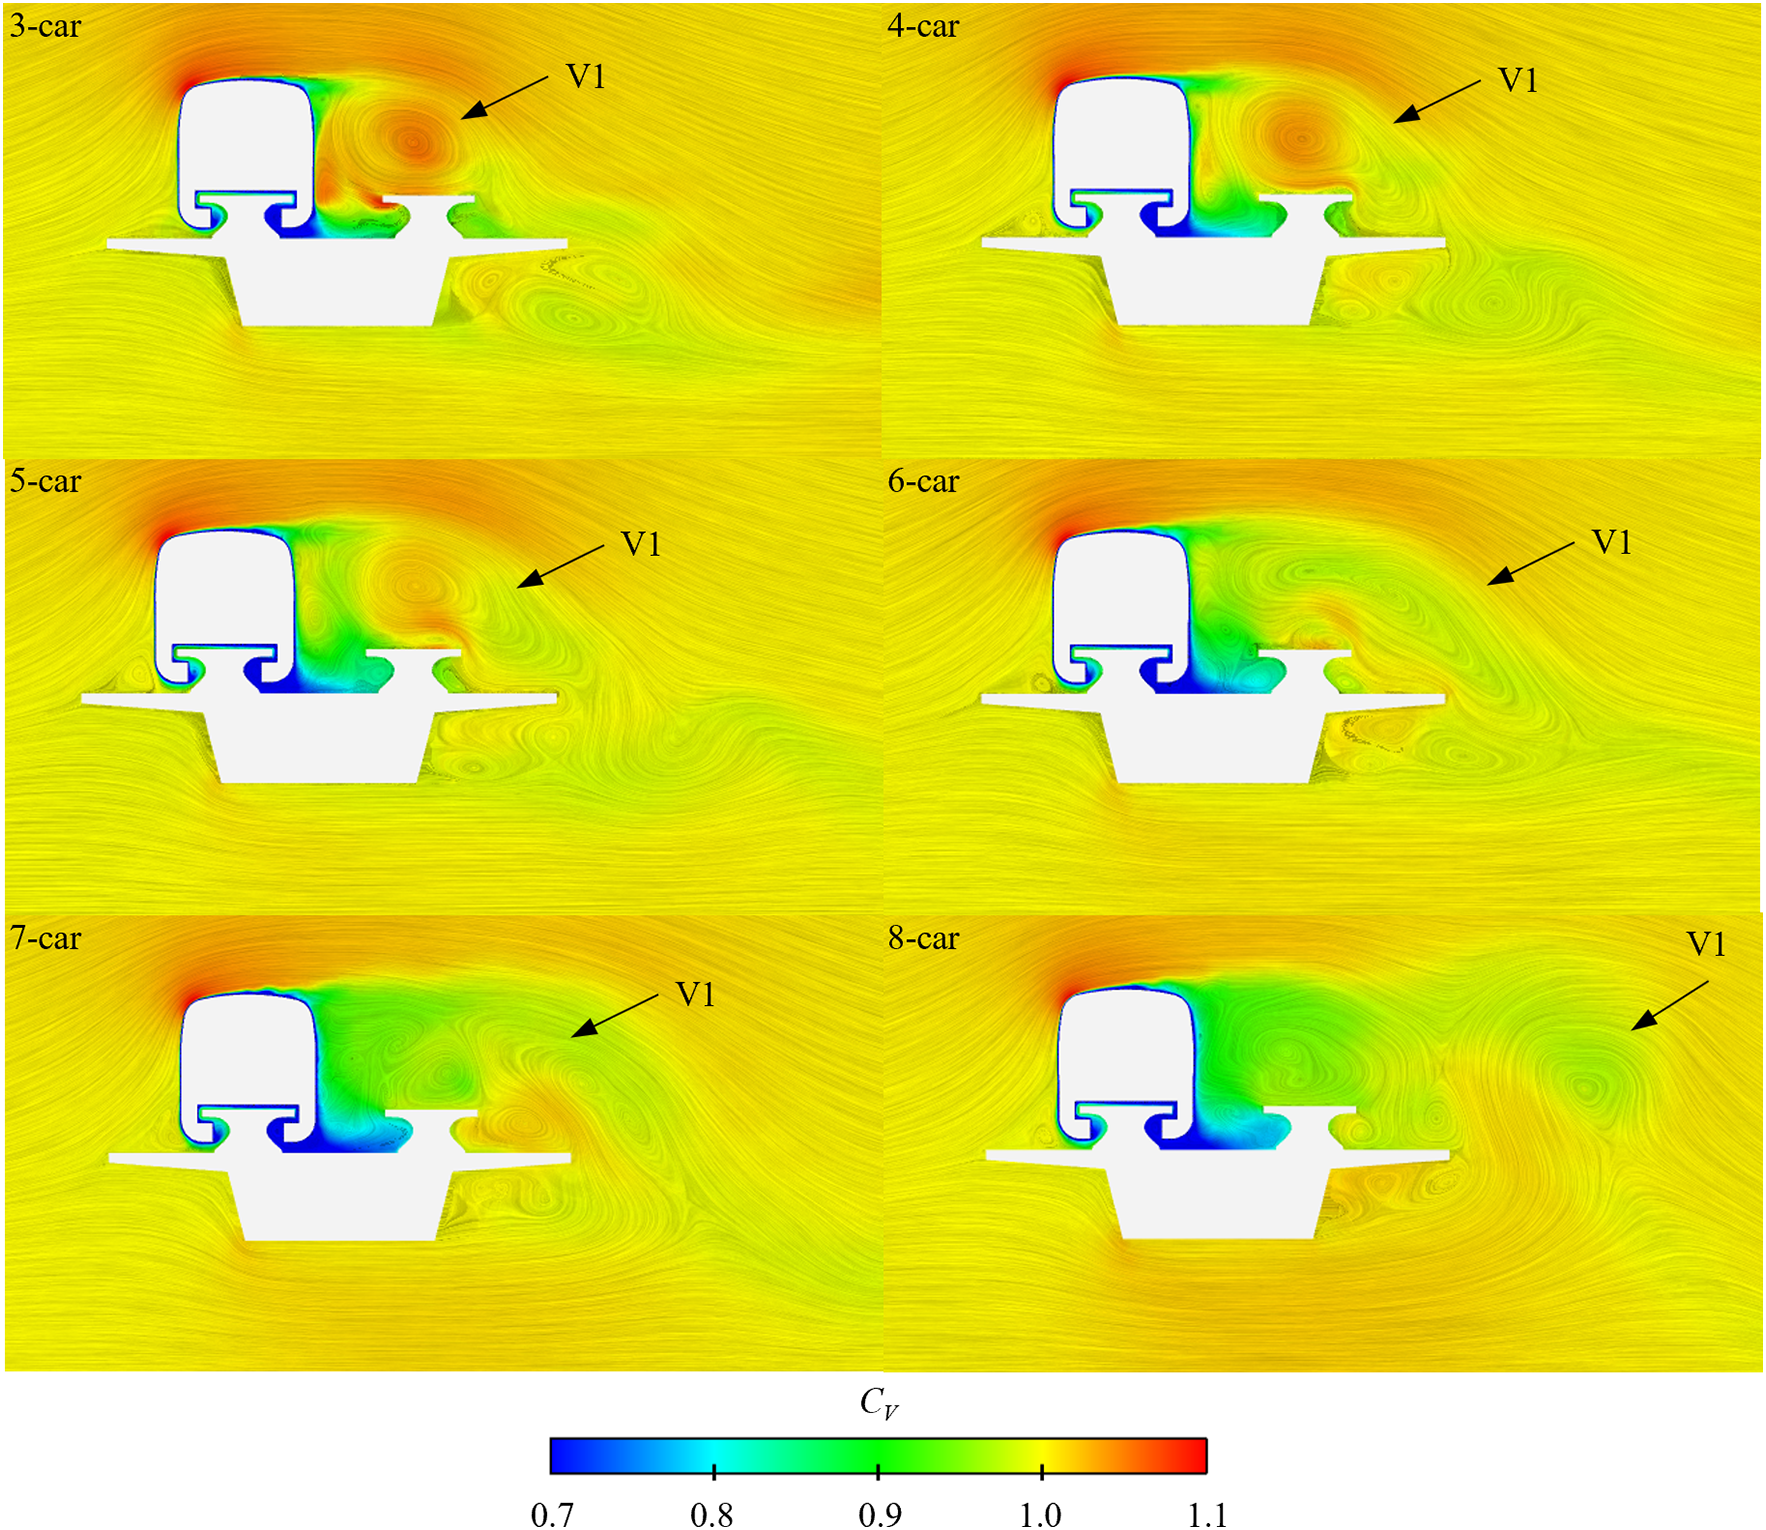
Figure 12: Velocity and flow structure distributions at cross-section X8 of different train lengths
The turbulent kinetic energy (TKE) contour of different marshaling lengths is illustrated in Fig. 13. The marshaling lengths of the train certainly affect the turbulent vortex on the LWS of the train. From Figs. 12 and 13, the increased formation length allows sufficient time for turbulent vortex V1 to evolve into a vortex of larger scale and intensity. Compared to the TKE shown by the tail car of the 3-car groups at cross-section X8, the TKE in the tail car of the 8-car groups is greater. It can be understood that both the TKE on the LWS of the train and the greater pressure on the TCB on the LWS increase as the marshaling lengths grow. The TKE on the WWS of the train varies relatively little with train length. As the train length increases, a greater disparity in TKE between the two sides of the train body leads to higher pressure on the LWS of the tail car compared to the WWS. For this reason, there is a corresponding reduction in side force as the train length grows.
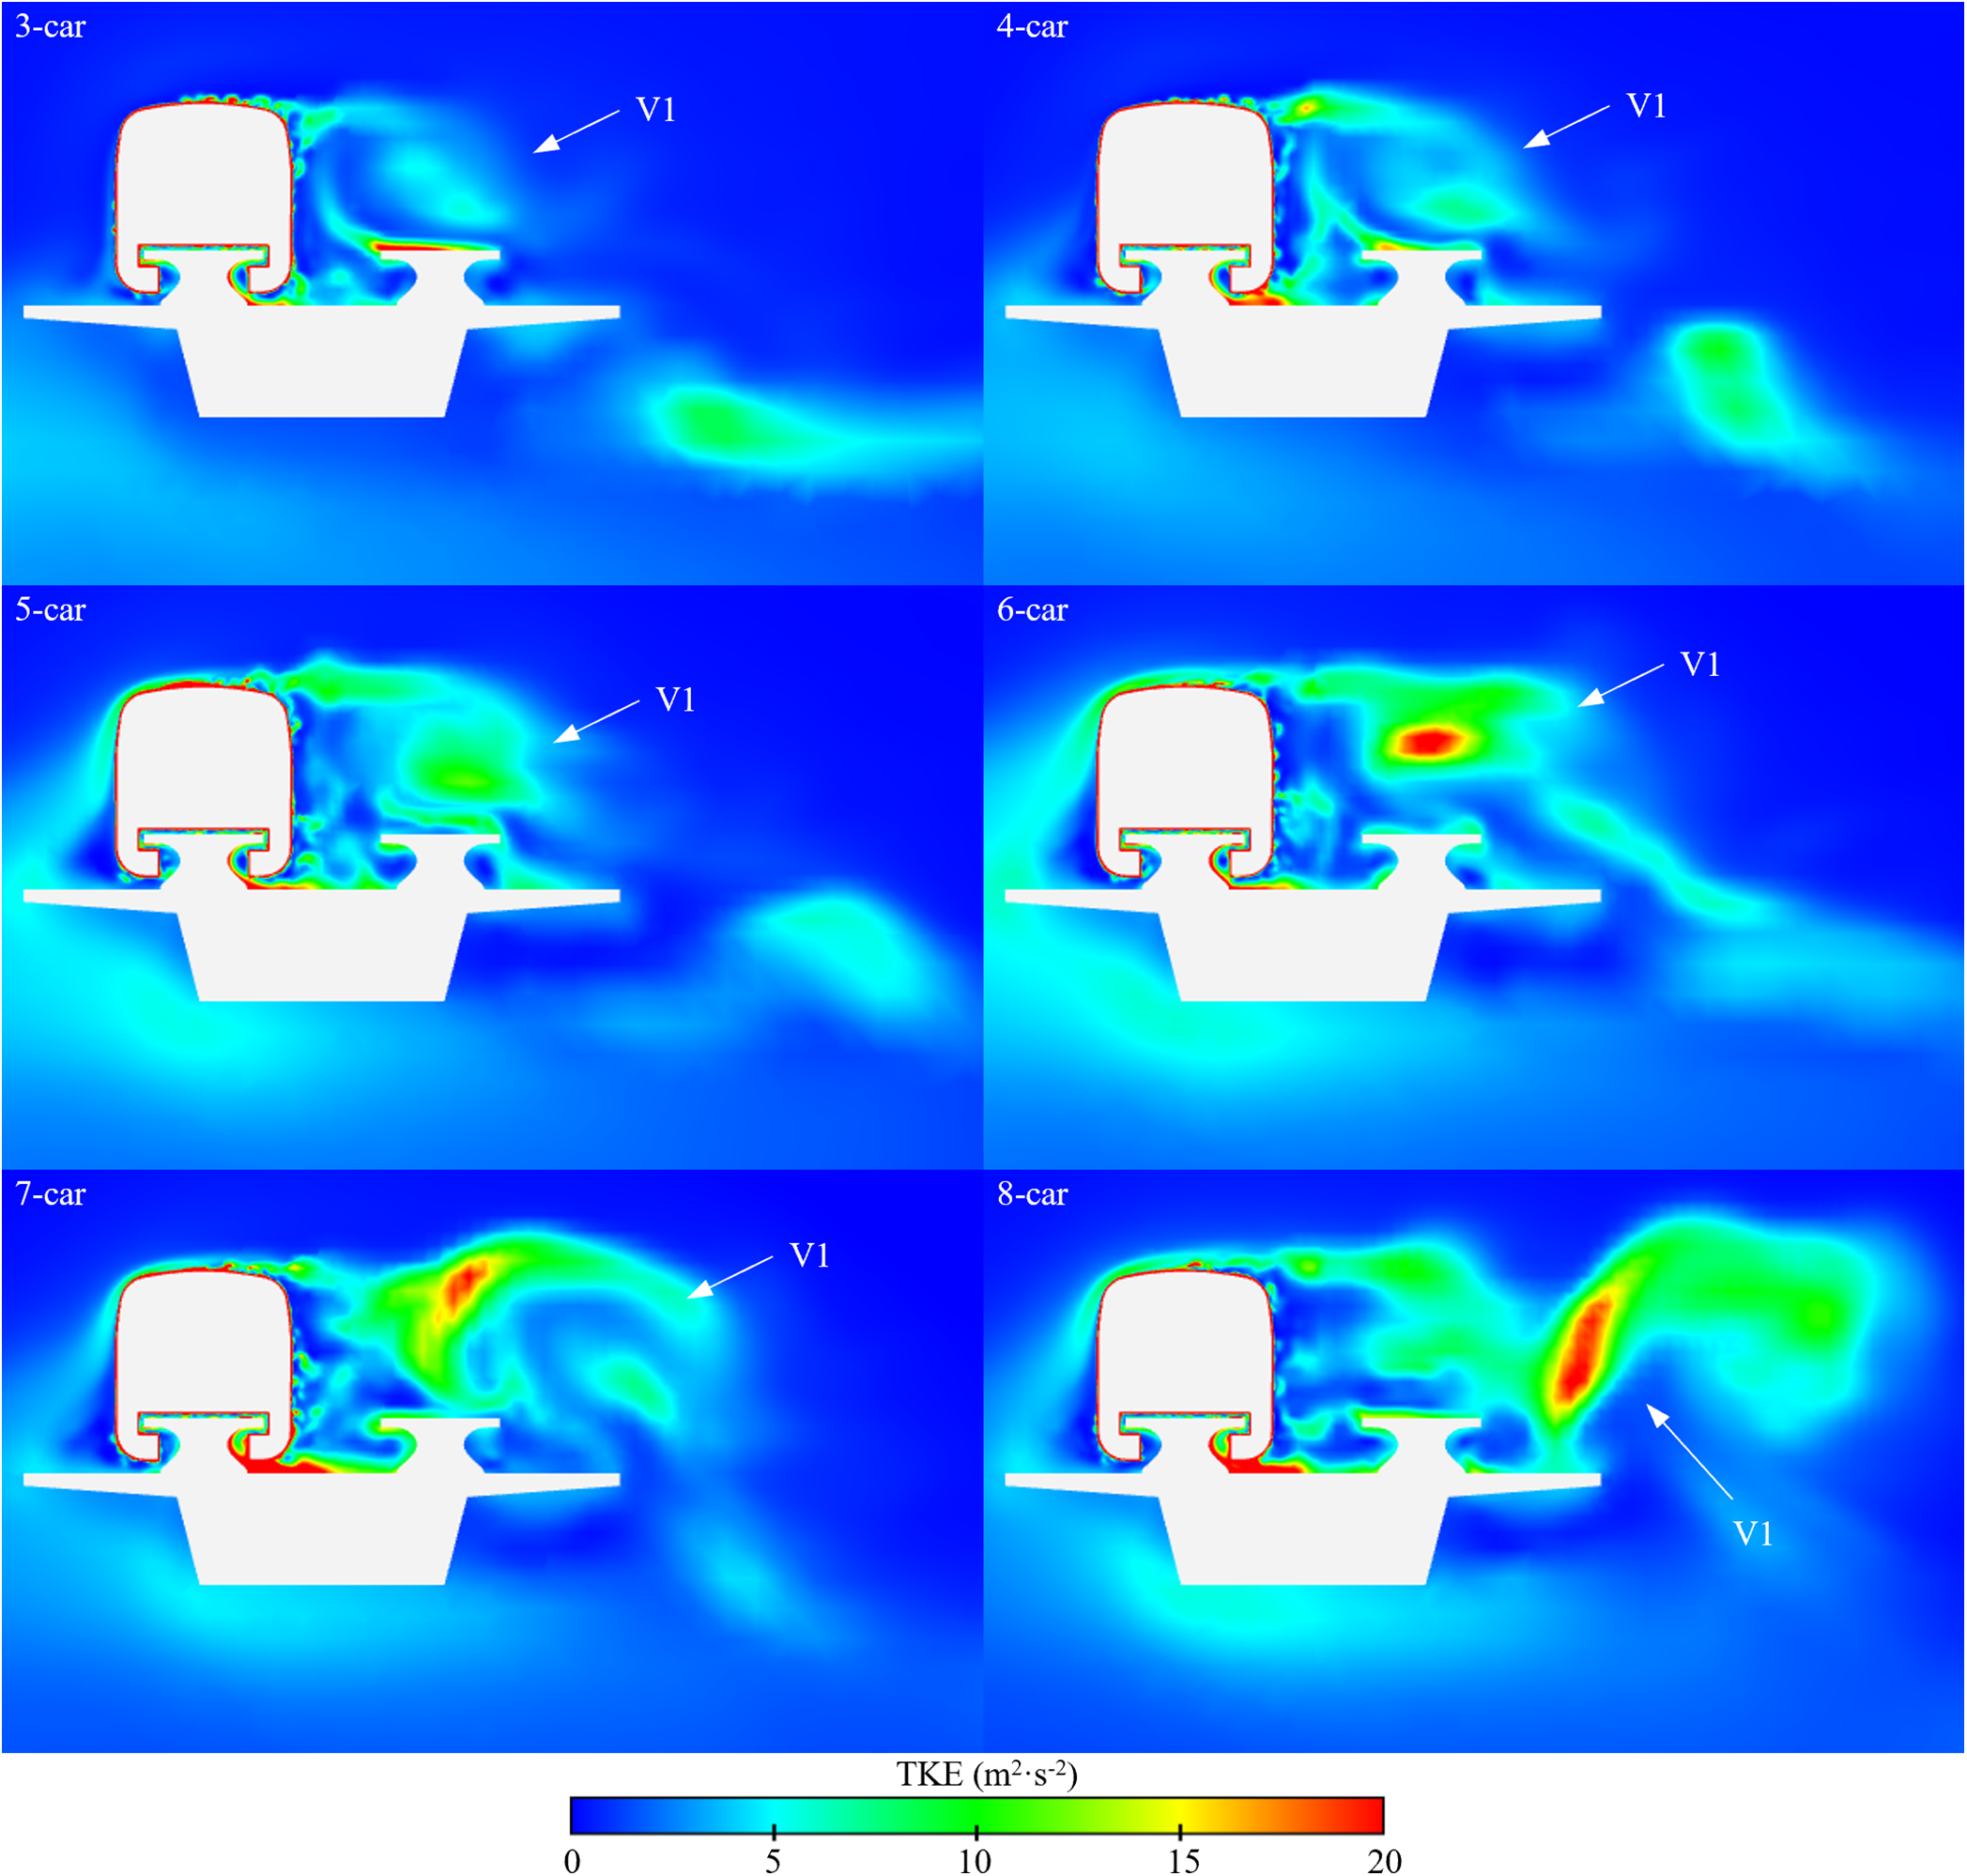
Figure 13: Turbulent kinetic energy (TKE) contour at cross-section X8 of difference train lengths
When the train operates in a windless environment, a pair of symmetrical wake structures are generated at the rear of the tail car that are essentially identical in scale and intensity [48,49]. However, the wake structures are asymmetric and inconsistent in scale and intensity when the train runs under crosswinds. The vorticity contour of different marshaling lengths is demonstrated in Fig. 13. The horizontal section Z1, shown in Fig. 14a, is at a height of 0.5 H from the bottom of the train. As depicted within the red box of Fig. 13, the intensity of the vortex on the LWS of the head car is the same for the 3-car, 5-car, and 8-car groups. This demonstrates that the length of the train has no bearing on the vorticity on the LWS of the head car. As observed in the white box in Fig. 14b, wake vortices V3 and V4 do not possess symmetry while the train is in crosswind environments. Additionally, both the scale and intensity of the wake vortex on the WWS are larger than those on the LWS. In the case of 3-car groups, vortex V2 does not have enough time and space to evolve into a more intense vortex before encountering the crosswind behind the tail car, accelerating its dissipation. For the 5-car groups, vortex V2 suffers from the wake vortex V4 and vortex V1 after the tail car, resulting in a bigger vorticity in the flow field after the tail car. When the formation length exceeds 5-car groups, vortex V2 encounters vortex V1 before the nose of the tail car, enlarging its vortex intensity.
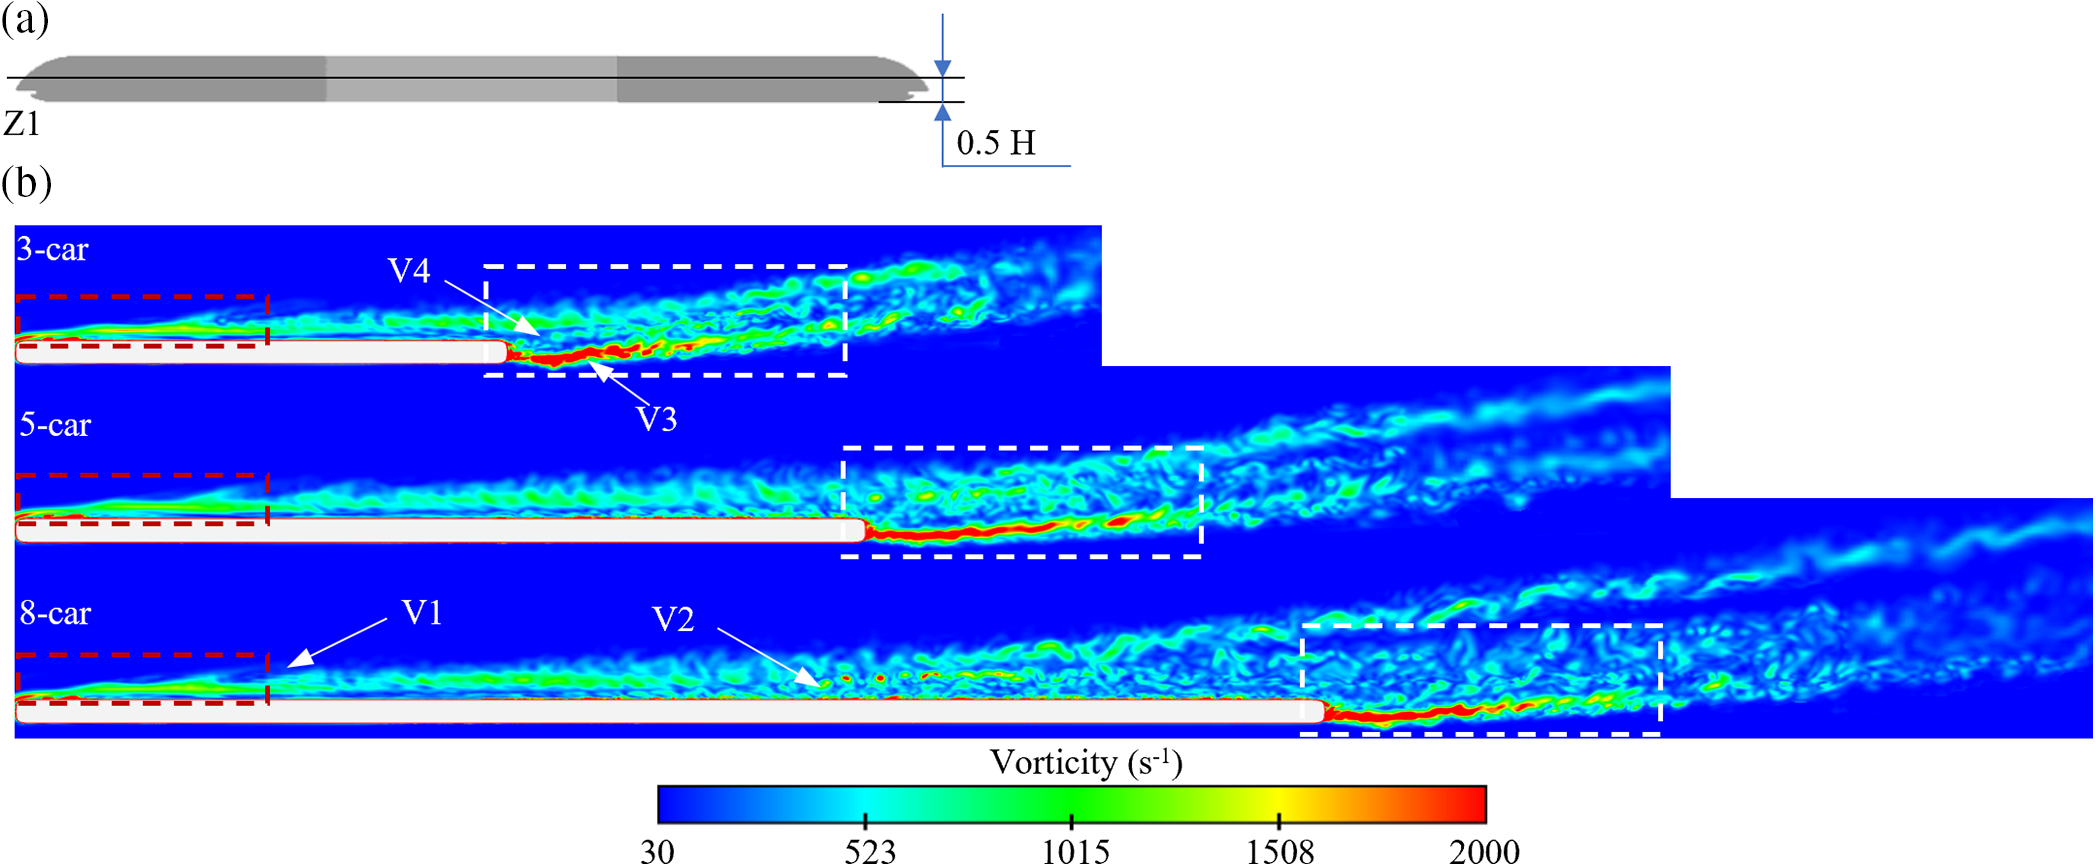
Figure 14: Vorticity contour of horizontal section Z1 of three formation groups: (a) schematic diagram of horizontal section; and (b) vorticity contour of 3-car, 5-car, and 8-car groups
In Fig. 15, the TKE contour in cross-section at a distance of 2.5 H behind the tail car for various marshaling lengths is seen. As seen in Figs. 14 and 15, the TKE of wake vortex V3 decreases gradually as the formation length increases. Because both frictional resistance and viscous resistance act upon the train’s surface, an increase in train length results in a corresponding increase in total resistance. The TKE of vortex V1 decreases, then increases, and then decreases again. Because vortex V2 encounters vortex V1 behind the tail car of the 5-car groups, there is an increase in the TKE of vortex V1.
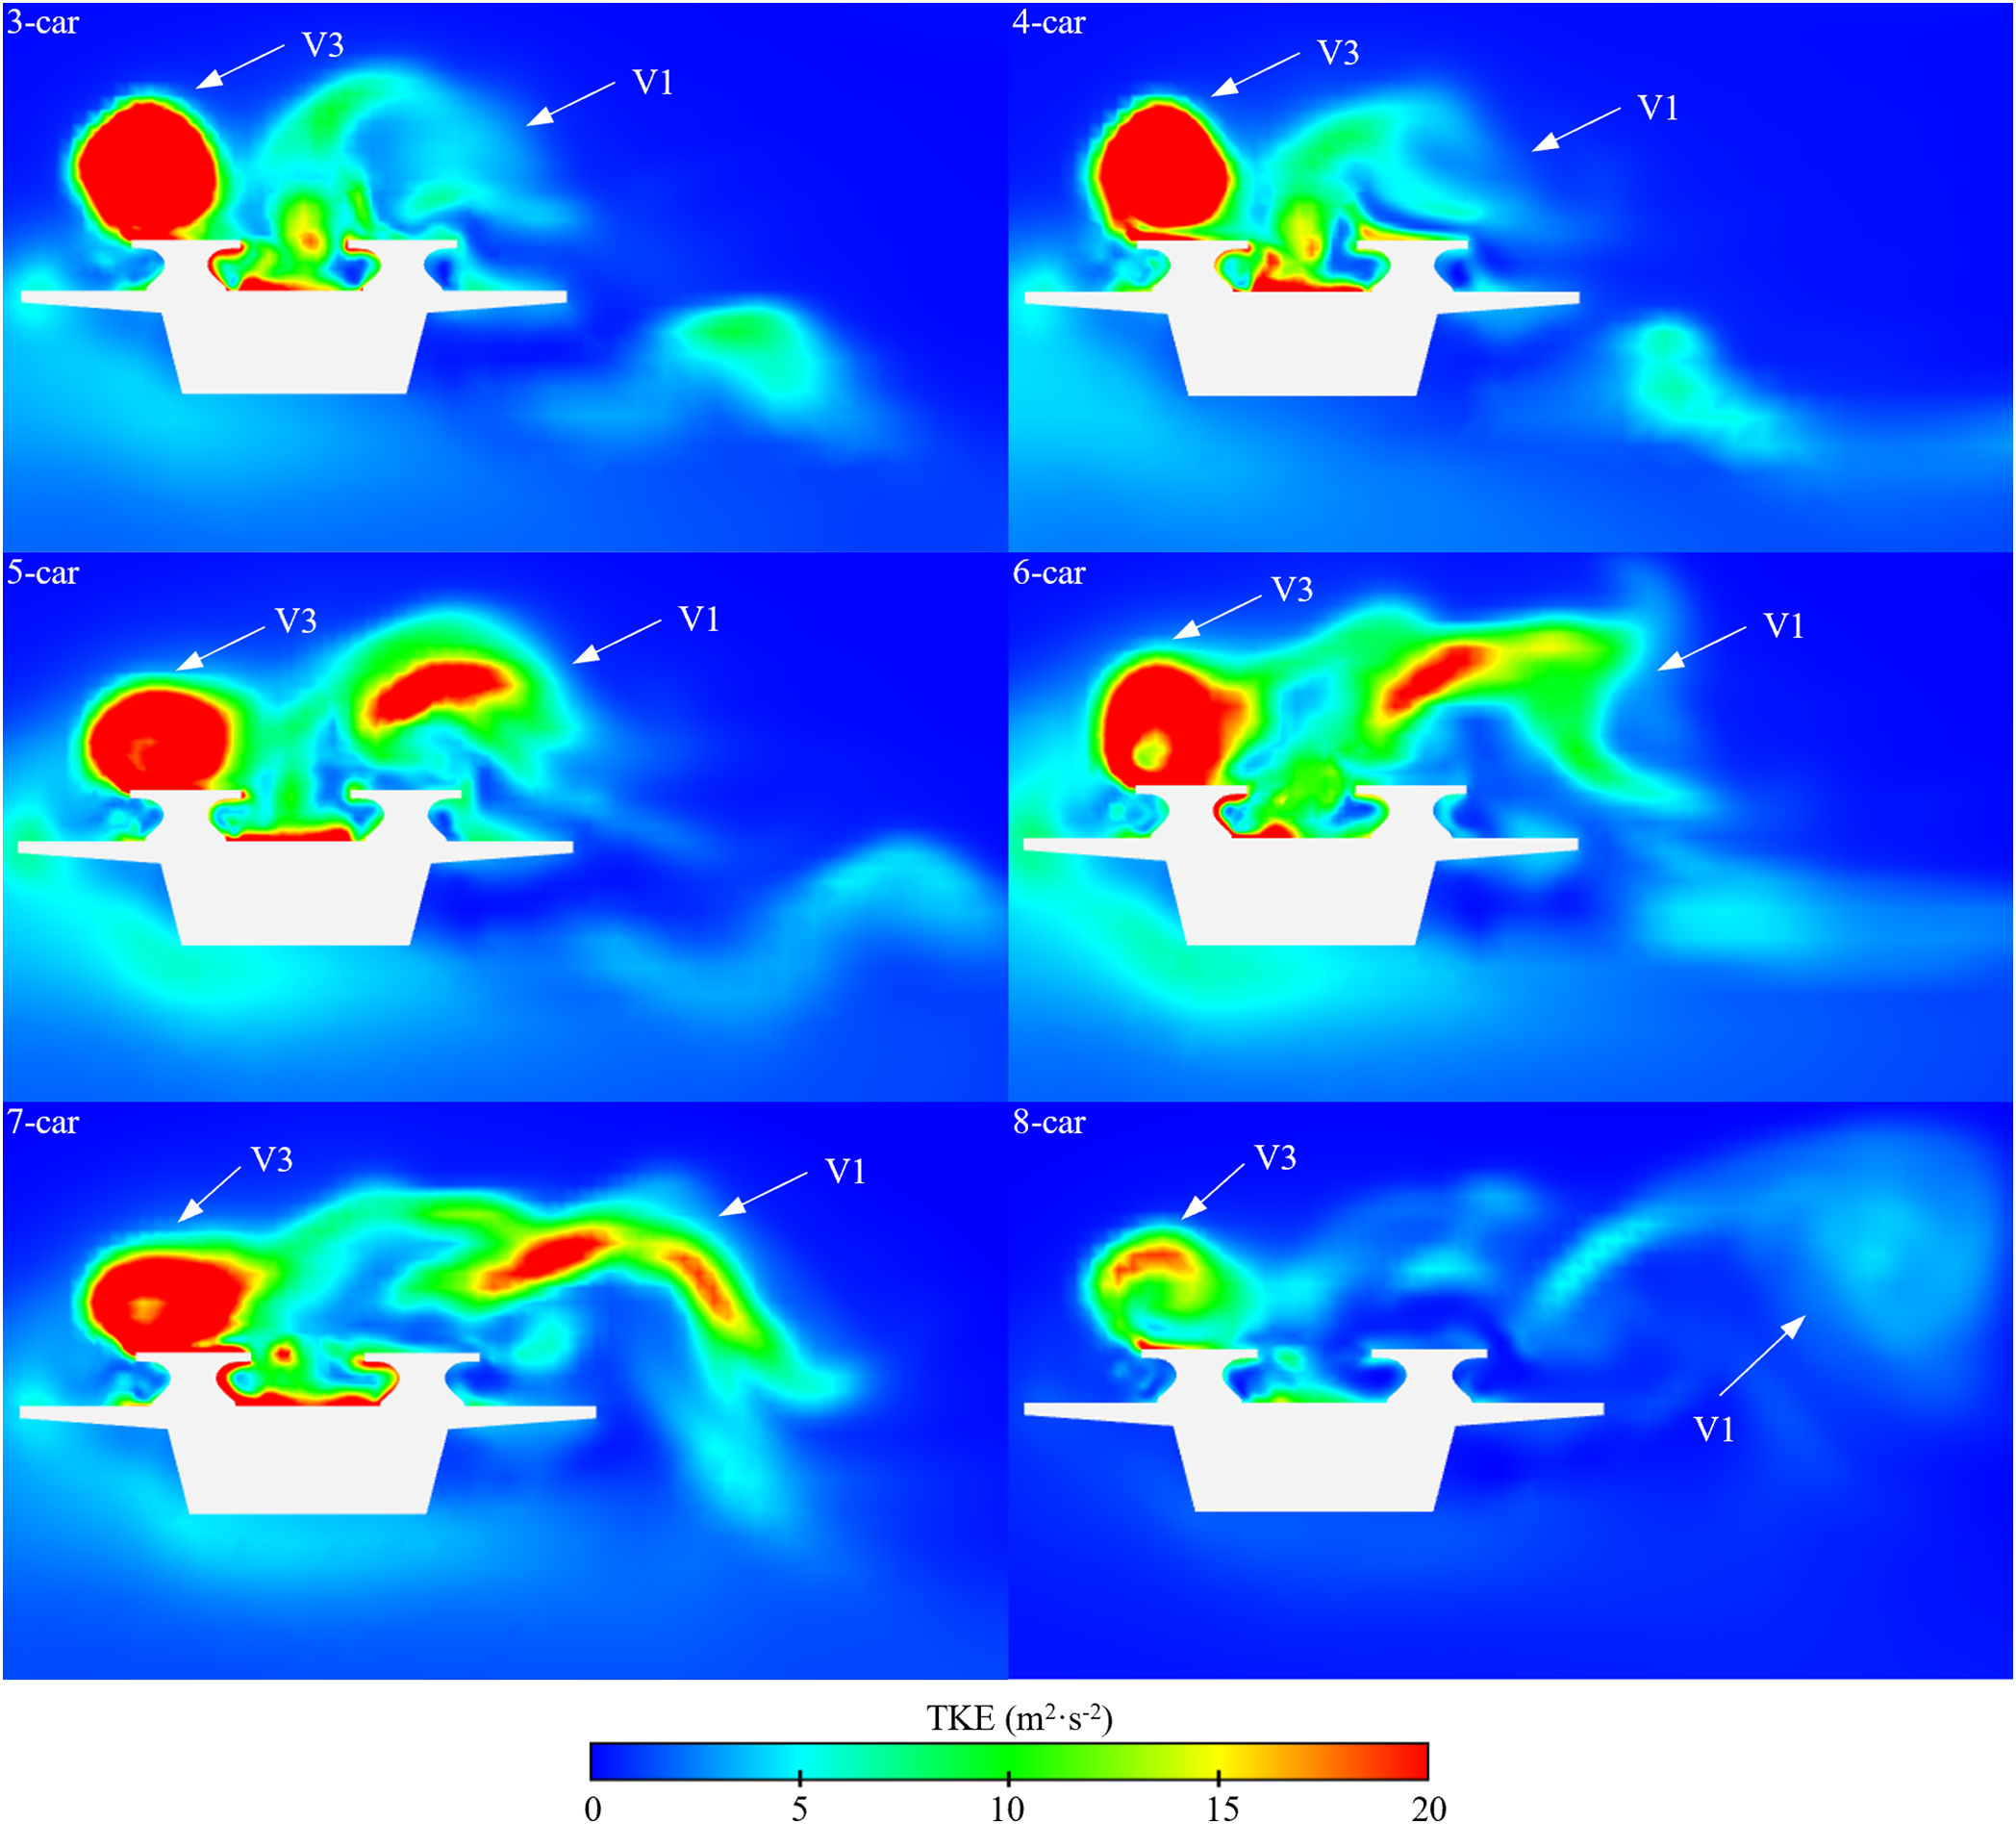
Figure 15: TKE contour at cross-section X9 of difference train lengths
A 1/10th-scale high-speed (600 km/h) maglev train was used in this study to analyze the aerodynamic features in a crosswind of 30 m/s. The train had a marshaling length ranging from 3-car groups to 8-car groups and ran on a viaduct. In order to simulate the aerodynamics, pressure, flow field structure, and turbulent kinetic energy around the train, an IDDES approach was used, constructed on the
1. Regardless of the increase in the marshaling length, there was no change in the average
2. The time average
3. The scale of vortex V1 on the LWS of the tail car enlarged with the marshaling lengths, but its velocity gradually dropped. As the train length increased, there was also an increase in the TKE of vortex V1 on the LWS of the tail car. In contrast, the TKE of wake structure V3 gradually shrank with the increase in marshaling lengths.
4. The wake structures V3 and V4, with their obvious asymmetry feature, appeared behind the tail car in the crosswind. Additionally, both the scale and intensity of the wake vortex on the WWS were larger than those on the LWS.
Future studies should aim to conduct wind tunnel tests on maglev trains to investigate variations in aerodynamic force and surface pressure across different yaw angles. The goal is to compile a comprehensive database of fundamental aerodynamic load spectra, serving as essential data for validating numerical simulations. Additionally, the aerodynamic features of maglev trains when subjected to crosswinds of varying angles, wind speeds, and train speeds should be analyzed. This research endeavor aims to offer theoretical guidance and technical assistance, enhancing the safety protocols for maglev trains in crosswinds and thus improving their operational reliability.
Acknowledgement: The authors acknowledge the computing resources provided by the National Rail Transit Electrification and Automation Engineering Technology Research Center of the Hong Kong Polytechnic University. The authors also acknowledge the help of Prof. Yi-Qing Ni and Miss Yan-Yan Yi.
Funding Statement: This study was supported by Wuyi University Hong Kong and Macao Joint Research and Development Fund (Grants Nos. 2021WGALH15, 2019WGALH17, 2019WGALH15), the National Natural Science Foundation of China-Guangdong Joint Fund (Grants No. 2019A1515111052), the National Natural Science Foundation of China (Grant No. 52202426), a grant from the Research Grants Council (RGC) of the Hong Kong Special Administrative Region (SAR), China (Grants No. 15205723) and a grant from the Hong Kong Polytechnic University (Grant No. P0045325).
Author Contributions: The authors confirm contribution to the paper as follows: study conception and design: Zun-Di Huang, Ning Chang, Zheng-Wei Chen and Su-Mei Wang; data collection: Zhen-Bin Zhou; analysis and interpretation of results: Zhen-Bin Zhou; draft manuscript preparation: Zun-Di Huang and Zhen-Bin Zhou. All authors reviewed the results and approved the final version of the manuscript.
Availability of Data and Materials: The data that support the findings of this study are available from the corresponding author upon reasonable request.
Conflicts of Interest: The authors declare that they have no conflicts of interest to report regarding the present study.
References
1. Huang, S., Li, Z., Yang, M. (2019). Aerodynamics of high-speed maglev trains passing each other in open air. Journal of Wind Engineering and Industrial Aerodynamics, 188, 151–160. [Google Scholar]
2. Tan, C., Zhou, D., Chen, G., Sheridan, J., Krajnovic, S. (2020). Influences of marshalling length on the flow structure of a maglev train. International Journal of Heat and Fluid Flow, 85, 108604. [Google Scholar]
3. Palmer, C. (2021). Engineered to go fast, maglev trains inch forward. Engineering, 7(7), 891–893. [Google Scholar]
4. Zhang, J., Wang, Y., Han, S., Wang, F., Gao, G. (2023). A novel arch lattice-shell of enlarged cross-section hoods for micro-pressure wave mitigation at exit of maglev tunnels. Tunnelling and Underground Space Technology, 132, 104859. [Google Scholar]
5. Gao, D., Ni, F., Lin, G., Luo, S., Ji, W. (2019). Aerodynamic analysis of pressure wave of high-speed maglev vehicle crossing: Modeling and calculation. Energies, 12(19), 3770. [Google Scholar]
6. Zhou, P., Li, T., Zhao, C. F., Zhang, J. Y. (2020). Numerical study on the flow field characteristics of the new high-speed maglev train in open air. Journal of Zhejiang University-Science A, 21(5), 366–381. [Google Scholar]
7. Meng, S., Chen, G., Zhou, D., Meng, S. (2022). Unsteady aerodynamic performance of a maglev train: The effect of the ground condition. Transportation Safety and Environment, 4(4), tdac023. [Google Scholar]
8. Che, Z. X., Huang, S., Li, Z. W., Chen, Z. W. (2023). Aerodynamic drag reduction of high-speed maglev train based on air blowing/suction. Journal of Wind Engineering and Industrial Aerodynamics, 233, 105321. [Google Scholar]
9. Kim, I. K., Chung, H. K., Yoo, M. H. (1995). Status of the Maglev development in Korea. The 15th International Conference on Magnetically Levitated Systems and Linear Drives, Mt. Fuji, Japan. [Google Scholar]
10. Ishimoto, S., Kato, M. (2004). The first urban maglev transport application in Japan. 18th International Conference on Magnetically Levitated Systems and Linear Drives. [Google Scholar]
11. Baohua, M., Huang, R., Shunping, J. (2008). Potential applications of maglev railway technology in China. Journal of Transportation Systems Engineering and Information Technology, 8(1), 29–39. [Google Scholar]
12. Khier, W., Breuer, M., Durst, F. (2000). Flow structure around trains under side wind conditions: A numerical study. Computers & Fluids, 29(2), 179–195. [Google Scholar]
13. Ricco, P., Baron, A., Molteni, P. (2007). Nature of pressure waves induced by a high-speed train travelling through a tunnel. Journal of Wind Engineering and Industrial Aerodynamics, 95(8), 781–808. [Google Scholar]
14. Muld, T. W., Efraimsson, G., Henningson, D. S. (2014). Wake characteristics of high-speed trains with different lengths. Proceedings of the Institution of Mechanical Engineers, Part F: Journal of Rail and Rapid Transit, 228(4), 333–342. [Google Scholar]
15. García, J., Muñoz-Paniagua, J., Crespo, A. (2017). Numerical study of the aerodynamics of a full scale train under turbulent wind conditions, including surface roughness effects. Journal of Fluids and Structures, 74, 1–18. [Google Scholar]
16. Gallagher, M., Morden, J., Baker, C., Soper, D., Quinn, A. et al. (2018). Trains in crosswinds-comparison of full-scale on-train measurements, physical model tests and CFD calculations. Journal of Wind Engineering and Industrial Aerodynamics, 175, 428–444. [Google Scholar]
17. Niu, J., Zhou, D., Liang, X. (2018). Numerical investigation of the aerodynamic characteristics of high-speed trains of different lengths under crosswind with or without windbreaks. Engineering Applications of Computational Fluid Mechanics, 12(1), 195–215. [Google Scholar]
18. Liang, H., Sun, Y., Li, T., Zhang, J. (2023). Influence of marshalling length on aerodynamic characteristics of urban EMUs under crosswind. Journal of Applied Fluid Mechanics, 16(1), 9–20. [Google Scholar]
19. Howell, J. (1986). Aerodynamic response of maglev train models to a crosswind gust. Journal of Wind Engineering and Industrial Aerodynamics, 22(2–3), 205–213. [Google Scholar]
20. Ding, S., Shuanbao, Y. A. O., Dawei, C. (2020). Aerodynamic lift force of high-speed maglev train. Journal of Mechanical Engineering, 56(8), 228–234. [Google Scholar]
21. Li, X., Krajnovic, S., Zhou, D. (2021). Numerical study of the unsteady aerodynamic performance of two maglev trains passing each other in open air using different turbulence models. Applied Sciences, 11(24), 11894. [Google Scholar]
22. Luo, C., Zhou, D., Chen, G., Krajnovic, S., Sheridan, J. (2020). Aerodynamic effects as a maglev train passes through a noise barrier. Flow Turbulence and Combustion, 105, 761–785. [Google Scholar]
23. Yao, S., Chen, D., Ding, S. (2022). Multi-objective aerodynamic optimization design of high-speed maglev train nose. Railway Sciences, 1(2), 273–288. [Google Scholar]
24. Liang, X., Shen, X. (2007). Lateral aerodynamic performances of maglev train when two trains meet with wind blowing. Journal of Central South University (Science and Technology), 38(4), 751–757. [Google Scholar]
25. Meng, S., Zhou, D., Meng, S. (2020). Effect of rail gap on aerodynamic performance of maglev train. Journal of Central South University (Science and Technology), 51(12), 3537–3545. [Google Scholar]
26. En, B. S. (2018). Railway Applications-Aerodynamics Part 6: Requirements and Test Procedures for Crosswind Assessment. CEN European Standard. [Google Scholar]
27. Zeng, G. Z., Li, Z. W., Huang, S., Chen, Z. W. (2023). Aerodynamic characteristics of intercity train running on bridge under wind and rain environment. Alexandria Engineering Journal, 66, 873–889. [Google Scholar]
28. Chen, Z. W., Zeng, G. Z., Ni, Y. Q., Liu, T. H., Niu, J. Q. et al. (2023). Reducing the aerodynamic drag of high-speed trains by air blowing from the nose part: Effect of blowing speed. Journal of Wind Engineering and Industrial Aerodynamics, 238, 105429. [Google Scholar]
29. Chen, Z. W., Ni, Y. Q., Wang, Y. W., Wang, S. M., Liu, T. H. (2022). Mitigating crosswind effect on high-speed trains by active blowing method: A comparative study. Engineering Applications of Computational Fluid Mechanics, 16(1), 1064–1081. [Google Scholar]
30. Shur, M. L., Spalart, P. R., Strelets, M. K., Travin, A. K. (2008). A hybrid RANS-LES approach with delayed-DES and wall-modelled LES capabilities. International Journal of Heat and Fluid Flow, 29(6), 1638–1649. [Google Scholar]
31. Marsh, H. (1983). Modern compressible flow: J. D. Anderson. International Journal of Heat and Fluid Flow, 4(1), 59–60. [Google Scholar]
32. Zhang, D., Guo, Z. H., Ni, Y. Q., Chen, Z. W., Ao, W. K. et al. (2023). Correlation between cargo properties and train overturning safety for a high-speed freight train under strong winds. Engineering Applications of Computational Fluid Mechanics, 17(1), 2221308. [Google Scholar]
33. Chen, Z. W., Guo, Z. H., Ni, Y. Q., Liu, T. H., Zhang, J. (2023). A suction method to mitigate pressure waves induced by high-speed maglev trains passing through tunnels. Sustainable Cities and Society, 96, 104682. [Google Scholar]
34. Chen, Z. W., Rui, E. Z., Liu, T. H., Ni, Y. Q., Huo, X. S. et al. (2022). Unsteady aerodynamic characteristics of a high-speed train induced by the sudden change of windbreak wall structure: A case study of the Xinjiang railway. Applied Sciences, 12(14), 7217. [Google Scholar]
35. Zhang, J., Guo, Z., Han, S., Krajnović, S., Sheridan, J. et al. (2022). An IDDES study of the near-wake flow topology of a simplified heavy vehicle. Transportation Safety and Environment, 4(2), tdac015. [Google Scholar]
36. Chen, Z. W., Zeng, G. Z., Hashmi, S. A., Liu, T. H., Zhou, L. et al. (2023). Impact of the windbreak transition on flow structures of the high-speed railway and mitigation using oblique structure and circular curve structure transition. International Journal of Numerical Methods for Heat & Fluid Flow, 33(4), 1354–1378. [Google Scholar]
37. Liang, Z., Zhang, J., Tian, L. (2016). Unsteady aerodynamic characteristics and safety of high-speed trains under crosswinds. Journal of Mechanical Engineering, 52(6), 124–135. [Google Scholar]
38. Wang, X., Hu, X., Wang, J., Wang, L., Li, H. et al. (2023). Safety analysis of high temperature superconducting maglev train considering the aerodynamic loads under crosswinds. Proceedings of the Institution of Mechanical Engineers, Part C: Journal of Mechanical Engineering Science, 237(10), 2279–2290. [Google Scholar]
39. Wang, F., Guo, Z., Shi, Z., Han, S., Wang, Y. et al. (2023). A study of crosswind characteristics on aerodynamic performance of high-speed trains on embankment. Iranian Journal of Science and Technology, Transactions of Mechanical Engineering, 47(2), 417–431. [Google Scholar]
40. Guo, D., Shang, K., Zhang, Y., Yang, G., Sun, Z. (2016). Influences of affiliated components and train length on the train wind. Acta Mechanica Sinica, 32, 191–205. [Google Scholar]
41. Cheli, F., Ripamonti, F., Rocchi, D., Tomasini, G. (2010). Aerodynamic behaviour investigation of the new EMUV250 train to cross wind. Journal of Wind Engineering and Industrial Aerodynamics, 98(4–5), 189–201. [Google Scholar]
42. Zhou, D., Xia, C., Wu, L., Meng, S. (2023). Effect of the wind speed on aerodynamic behaviours during the acceleration of a high-speed train under crosswinds. Journal of Wind Engineering and Industrial Aerodynamics, 232, 105287. [Google Scholar]
43. Guo, Z., Liu, T., Liu, Z., Chen, X., Li, W. (2021). An IDDES study on a train suffering a crosswind with angles of attack on a bridge. Journal of Wind Engineering and Industrial Aerodynamics, 217, 104735. [Google Scholar]
44. Huo, X., Liu, T., Chen, Z., Li, W., Gao, H. et al. (2021). Comparative analysis of the aerodynamic characteristics on double-unit trains formed by different types of high-speed train. Journal of Wind Engineering and Industrial Aerodynamics, 217, 104757. [Google Scholar]
45. Qin, D., Li, T., Dai, Z., Zhang, J. (2022). Study on prediction in far-field aerodynamic noise of long-marshalling high-speed train. Environmental Science and Pollution Research, 29(57), 86580–86594 [Google Scholar] [PubMed]
46. Ishak, I. A., Mat Ali, M. S., Mohd Yakub, M. F., Shaikh Salim, S. A. Z. (2019). Effect of crosswinds on aerodynamic characteristics around a generic train model. International Journal of Rail Transportation, 7(1), 23–54. [Google Scholar]
47. Li, T., Qin, D., Zhang, J. (2019). Effect of RANS turbulence model on aerodynamic behavior of trains in crosswind. Chinese Journal of Mechanical Engineering, 32, 1–12. [Google Scholar]
48. Sun, Z., Wang, M., Wei, L., Kong, F., Yang, G. (2021). Aerodynamic shape optimization of an urban maglev train. Acta Mechanica Sinica, 37(6), 954–969. [Google Scholar]
49. Zhou, D., Wu, L., Tan, C., Hu, T. E. (2021). Study on the effect of dimple position on drag reduction of high-speed maglev train. Transportation Safety and Environment, 3(4), tdab027. [Google Scholar]
Cite This Article
 Copyright © 2024 The Author(s). Published by Tech Science Press.
This work is licensed under a Creative Commons Attribution 4.0 International License , which permits unrestricted use, distribution, and reproduction in any medium, provided the original work is properly cited.
 Downloads
 Citation Tools