
 Submit a Paper
 Propose a Special lssue
 Open Access
ARTICLE

Parametric Analysis and Designing Maps for Powder Spreading in Metal Additive Manufacturing
Department of Aerospace Engineering, Embry-Riddle Aeronautical University, Daytona Beach, FL 32114, USA
* Corresponding Author: Sirish Namilae. Email:
Computer Modeling in Engineering & Sciences 2025, 142(2), 2067-2090. https://doi.org/10.32604/cmes.2024.059091
Received 27 September 2024; Accepted 27 November 2024; Issue published 27 January 2025
 View Full Text
 Download PDF
Abstract
Powder bed fusion (PBF) in metallic additive manufacturing offers the ability to produce intricate geometries, high-strength components, and reliable products. However, powder processing before energy-based binding significantly impacts the final product’s integrity. Processing maps guide efficient process design to minimize defects, but creating them through experimentation alone is challenging due to the wide range of parameters, necessitating a comprehensive computational parametric analysis. In this study, we used the discrete element method to parametrically analyze the powder processing design space in PBF of stainless steel 316L powders. Uniform lattice parameter sweeps are often used for parametric analysis, but are computationally intensive. We find that non-uniform parameter sweep based on the low discrepancy sequence (LDS) algorithm is ten times more efficient at exploring the design space while accurately capturing the relationship between powder flow dynamics and bed packing density. We introduce a multi-layer perceptron (MLP) model to interpolate parametric causalities within the LDS parameter space. With over 99% accuracy, it effectively captures these causalities while requiring fewer simulations. Finally, we generate processing design maps for machine setups and powder selections for efficient process design. We find that recoating speed has the highest impact on powder processing quality, followed by recoating layer thickness, particle size, and inter-particle friction.Keywords
Powder bed fusion (PBF) additive manufacturing, such as selective laser melting (SLM), direct laser sintering (DLS), and electron beam melting (EBM), enables the production of parts with intricate geometries while minimizing material waste compared to conventional subtractive manufacturing [1]. Recent development of PBF techniques enables novel rapid fabrication of products built from novel materials such as high strength alloys and high entropy alloys [2]. Simultaneously, the advancement of the powder processing in PBF additive manufacturing allows multi-material fusion through advanced processing approaches [3]. There is strong evidence that final product integrity is highly dependent on the quality of powder processing. Inefficient powder processing due to improperly selected processing parameters is identified as a major source of product imperfections [4]. Advancing powder-based metal additive manufacturing is hinged on achieving optimal parameter selection and effectively mitigating defects in the production process.
Processing design maps are powerful predictive tools for visualizing the impact of powder processing variables, including machining setups and powder properties, to optimize part quality and minimize defects [5]. Such maps could be developed through controlled experimentation or modeling. For instance, Imani et al. developed in-situ characterization of layer-wise pore sizes and shapes, and generated processing maps related to laser scanning parameters [6]. Yuasa et al. investigated the effect of recoating speed on the powder bed surface morphologies and generated recoating speed processing maps [7]. However, creating these maps based solely on experimentation can be challenging due to the extensive range of parameters involved and the multitude of experiments required. Comparatively, computational modeling of powder processing and its parametric analysis offers effective means to generate processing maps.
There are numerous techniques employed for PBF computational modeling. For instance, the finite element method and finite volume method are often applied for the mechanical modeling in laser-based PBF techniques [8]. Lattice Boltzmann method based on computational fluid dynamics has been successfully utilized for modeling electron beam melting manufacturing [9]. Despite the ability to integrate mechanics with heat transfer, these simulations often treat the powder bed as a continuum, with powder flow dynamics rarely accounted for. In contrast, discrete modeling methods such as raindrop packing [10] and discrete element method (DEM), targeting the dynamics of granular particles, can effectively analyze the particle interactions during spreading. Specifically, DEM simulates discrete particles constrained by active field forces, offering significantly high resolution in modeling interparticle interactions with relatively low computational effort [11]. DEM has been utilized in analysis of powder spreading involving various parameters such as particle morphology [12], recoating layer thickness [13,14], and recoating speed [15].
While DEM offers high modeling resolution, conducting multi-dimensional fine-scale parametric analyses with this approach can still pose computational challenges due to the vast parameter space involved in PBF processes. For example, varying five parameters across ten values can add up to 105 simulations. One approach to address these computational demands is through the use of innovative parameter sweep algorithms to explore the recoating parameter design space to reveal the parametric causalities.
Parameter sweep is an established algorithmic technique that has been utilized in various engineering applications especially for the process control of PBF additive manufacturing [16–18]. The primary purpose of parameter sweep analysis is to strategically explore the design space and observe system behavior to extract causal relationships, providing a comprehensive understanding of the design space. Conventionally, parameter sweeps are conducted by uniformly varying parameters on a lattice grid, known as using lattice sweep. While easy to implement, this algorithm sometimes leaves significant portions of the parameter space unexplored, resulting in incomplete interpretations. A further partition of parameter space using a finer lattice grid can improve such issues, but can be computationally expensive, especially when dealing with high dimensional parameter space. Non-uniform parameter sweeps address these issues by partitioning the design space through iterative generation of parametric combinations, either randomly or using mathematical sequences, enabling more efficient coverage of the parameter space. Specifically, low discrepancy sequences (LDS) sweep algorithms explore the parameter space following the mathematical sequences that were originally developed for efficiently solving high dimensional integrals [19]. The efficient production of parametric combinations enables their application for large-scale parametric analysis in diverse domains [20,21].
Machine learning (ML) based regression models can effectively further enhance parameter sweeps by providing both interpolations and extrapolations for parametric combinations that are not explicitly modeled. ML models have been used recently as efficient data-driven modeling techniques for PBF manufacturing [22–24]. Recent advancements in machine learning have significantly enhanced its application in additive manufacturing processes, supporting various objectives like process optimization and design [25], product quality assurance [26], and real-time defect detection [27–29]. Advanced ML models, such as explainable artificial intelligence models, have been emerging as a promising interpretative tool to capture the intricate and complex parametric correlations involved in PBF processes as these models often possess higher transparencies on model constructions compared to conventional ML models [30]. In the current context, ML models can bridge the gaps between simulated parametric combinations without requiring additional simulations. This enhances parametric analysis and improves the efficiency of generating the process design maps. A converged parameter sweep is required to effectively use the ML interpolation models.
In this study, we employed DEM models in conjunction with LDS parameter sweeps and a multi-layer perceptron (MLP) regression model to analyze the stainless steel SS-316L powder spreading and generate recoating design maps. We first created DEM simulations of powder spreading with various combinations of spreading parameters using a conventional lattice sweep and a novel LDS sweep algorithm. Statistical convergence analysis revealed that the LDS sweep is ten times more efficient than the lattice sweep. We then interpolated the parameter design space using the LDS sweep in conjunction with the MLP regression model. The MLP model was capable of interpolating the parameter design space with an accuracy of over 99%. We used this approach to generate recoating process design maps for 3D printing setups and powder selection, which can be used for powder spreading improvement. While the recoating design maps can improve PBF additive manufacturing, the computational methodology of combining LDS parameter sweeps with MLP regression can be used in many applications for efficient process design.
2.1 DEM Powder Processing Simulations
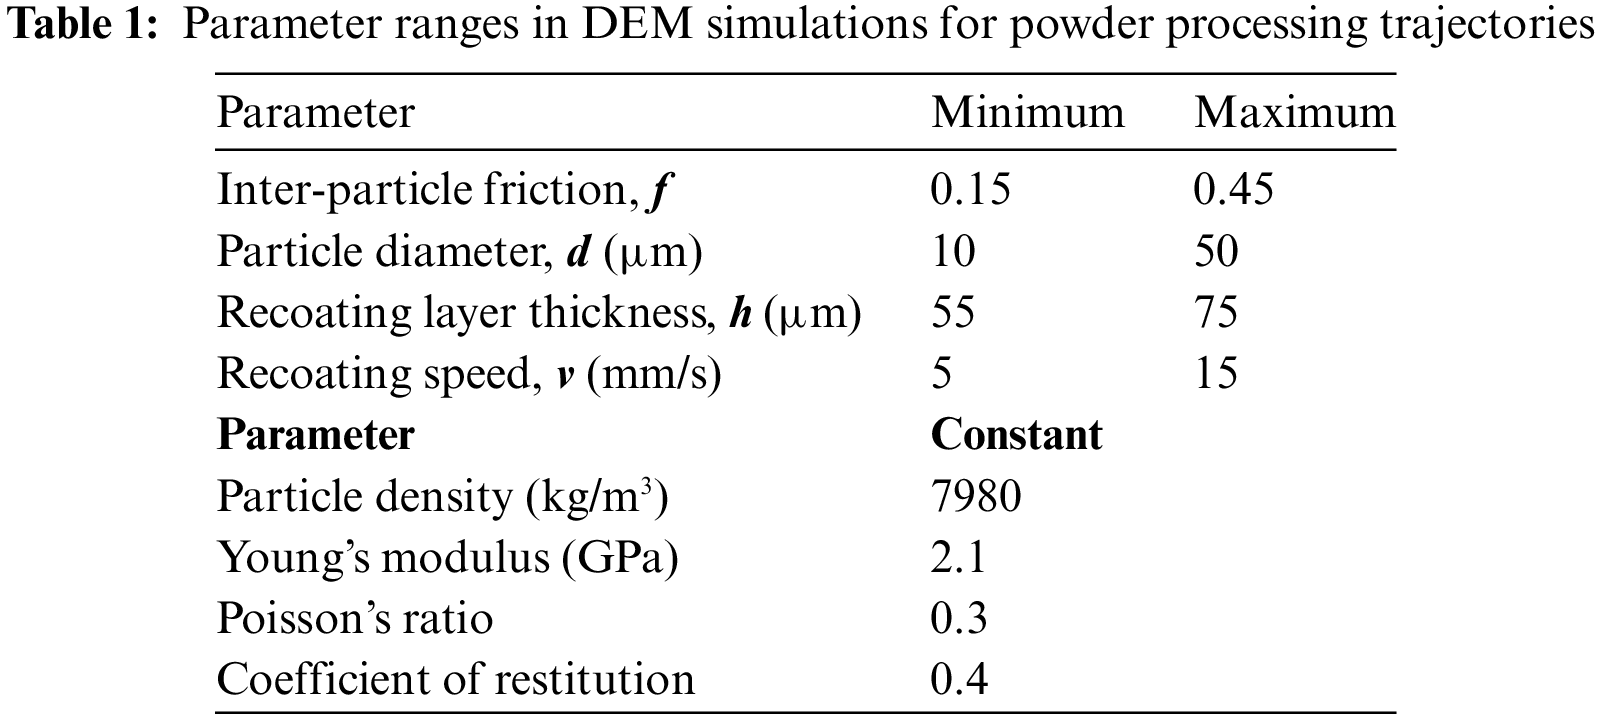
The quality of powder processing can be affected by the selection of powders and the corresponding machine setup. Despite the numerous parameters involved in powder processing, this study focuses on four primary variables: interparticle friction, recoating layer thickness, recoating speed, and particle size. These parameters have been proven to independently or synergistically affect the quality of powder processing. For instance, the spreadability of metallic powders is highly dependent the interparticle friction and particle size [31,32]. The recoating parameters including recoating speed and recoating layer thickness have various impacts on the powder flowing mechanisms and resulting behaviors [33,34]. Therefore, the 4-dimensional parameter design space based on these parameters is used to demonstrate the parameter sweep approaches. Note that PBF metallic powder usually contains a distribution of particles with various sizes and shapes [35] described by particle size distribution (PSD). The multi-sphere method (MSM) in DEM modeling can address the various shapes of particles with additionally defined particle templating parameters [36]. However, to simplify the models and focus on the primary cause-effect relationships related to particle size, we define particles as spheres with a uniform diameter (D). Parameter ranges used in DEM simulations are determined based on previous studies [14,35] and are listed in Table 1.
One critical step in setting up DEM simulations is the selection of an appropriate contact model for an accurate description of contacting particle interactions [37]. While there have been many particle-particle contact models, such as the viscoelastic model [38], JKR cohesive model [15,39], and linear elastic model [40] employed for powder processing studies, the large-scale parametric analysis in the current study requires high computational efficiency. We employ the Hertz-Mindlin contact model without considering plastic deformation. This model has been demonstrated to provide an accurate description of particle interactions and is computationally efficient, making it an ideal choice for this study [41–43]. The interaction between two contacting particles is schematically depicted in Fig. 1. The nonlinear interaction between two contacting particles,
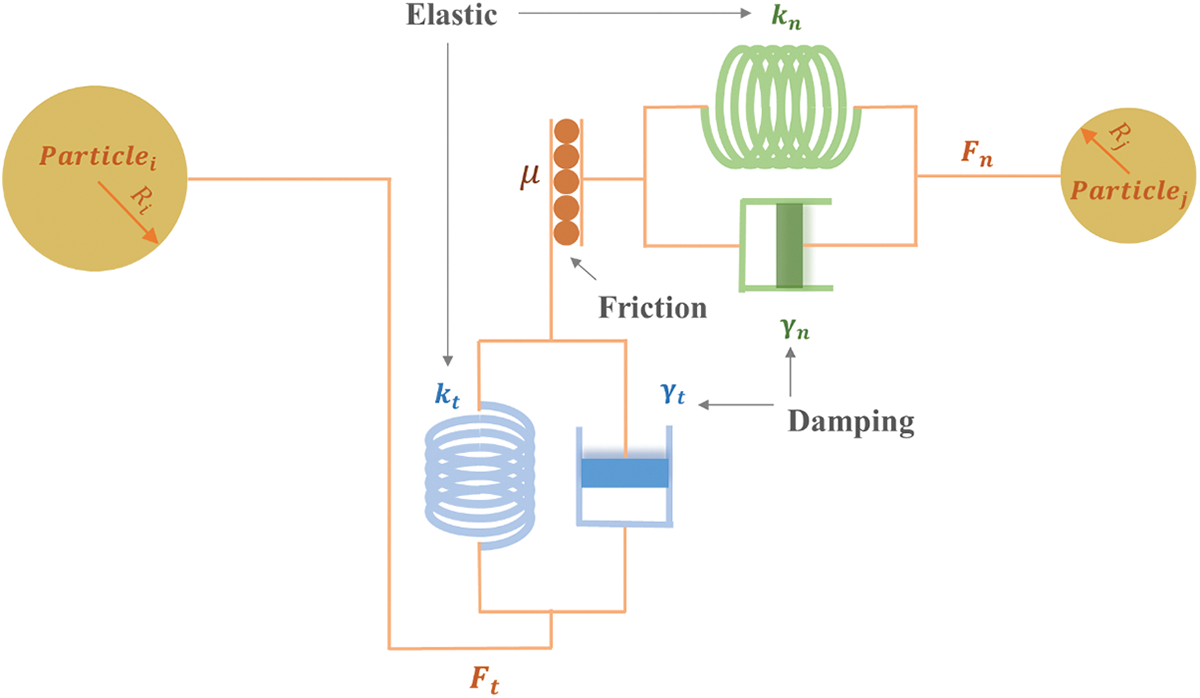
Figure 1: Schematic diagram of Hertz-Mindlin contact model
The powder processing trajectories are generated using an open-source DEM software, LIGGGHTS, due to its high-performance-computing friendly compilation for a large number of simulations [44]. A simulation field of 12 cm by 3 cm with a height of 24 cm is first defined. A timestep of
For high quality powder processing, a smooth powder flow extrusion underneath the recoater resulting in a densely packed powder bed is desired. We use the metric, mass flow rate (MFR), to investigate the powder spreadability. MFR is the rate of particle flow across the gap between the recoater and the simulation floor. A higher value of MFR indicates a higher spreadability of powder, which results in a uniform powder layer before binding and subsequently a higher quality final product. Generally, increasing the recoating speed causes particles to move faster transversely, often resulting in particles moving with the recoater rather than passing through the extrusion gap, the dimension of which is set as identical to the recoating layer thickness, for proper deposition. In such scenarios, a smaller number of particles would pass through the gap at a decreased flow rate [45,46]. MFR is calculated as the ratio between the mass of extruded powder and the maximum allowable flow mass through a sampling zone defined with the recoater thickness, w, and recoating layer thickness, h, as depicted in Fig. 2.
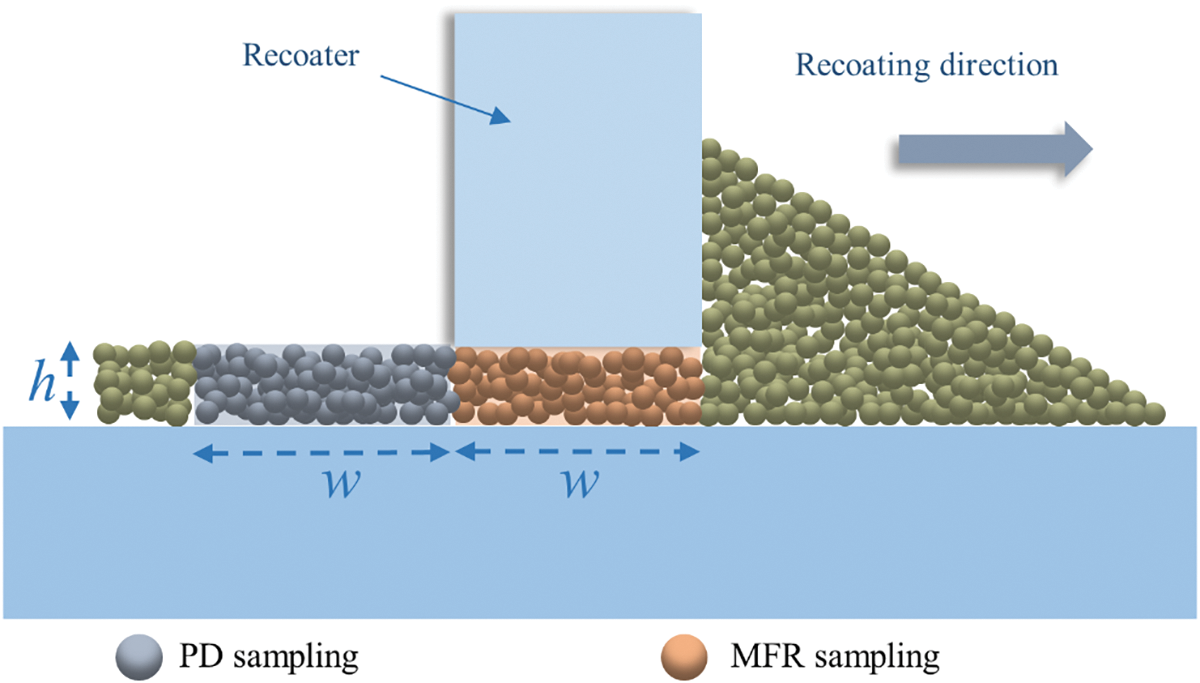
Figure 2: Two-dimensional schematic depiction of sampling zone for mass flow rate and packing density
In addition to the powder spreadability, the packing structure of the deposited layers significantly affects the subsequent energy-based powder fusion. Analyzing the packing structure is crucial to gaining useful insights into process design, such as selecting an appropriate recoating layer thickness for a given particle size. The quality of the resulting powder bed can be evaluated by computing the packing density (PD). Apparent packing density is used to calculate the ratio between the total volume occupied by particles over the entire simulation space. This is more suitable for particle insertion with PSDs and is not necessary for the post-processing of uniform particles. Alternatively, the voxel packing density can be utilized as a localized packing structure metric during the powder processing. In this method, a theoretical packing density is calculated as the ratio of computed volume of the spherical particles to the total voxel volume. This quantification can lead to a higher packing density than the apparent density, however, it is adequate to analyze the parametric causalities between the packing structures and processing parameters [47]. The dimensions the PD sampling zone are defined to be the same width and length as the recoater, w. To address the variation of the number of particles going through the gap resulting from various particle sizes and recoating layer thickness, the height of the sampling zone is set as the recoating layer thickness, h, as shown in Fig. 2. A higher PD indicates a tightly packed powder bed with minimal voids and is desired.
2.2 Parameter Sweep Algorithms
A conventional parameter sweep approach uniformly partitions the parameter space. For example, consider a d-dimensional parameter space. If each dimension is equally partitioned into N points, the total number of simulations with unique parameter combinations is
The LDS parameter sweep, on the other hand, generates non-uniform grids using mathematical sequences that provide more efficient parameter space coverage [48–50]. Considering the high dimension of current parameter space, we choose the scrambled Halton sequence as the basis for the LDS sweep. The scrambled Halton sequence generates parameters based on the Halton sequence [51]. Firstly, considering a D-dimensional parameter space with all dimensions established in [0, 1], a prime number
The developed LDS sweep algorithm has two major advantages. Firstly, compared to other common LDS algorithms from the perspective of computational resources utilization, the scrambled Halton sequence and its parent formulation, the Halton sequence, allow adding new grids to the existing discretization without shifting the previously generated grids. Thus the simulations corresponding to a given set of grid points or parameter combinations remain useful when the new partitions are added to the design space. This is a distinct advantage compared to lattice sweeps [20]. Secondly, as a high-dimension parameter space constrained by many potential parameters, it is crucial to make sure that the parameter space can be expanded, and that the grid distribution remains numerically efficient instead of linearly correlated in higher dimensions. This is resolved by numerical permutations in higher dimensions in the scrambled Halton sequence and thus is superior to the Halton sequence [20,49,51].
In this work, lattice parameter sweep is used as a baseline for comparing the performance and efficiency of the low discrepancy sequence (LDS) parameter sweep. We compared the lattice and LDS sweep algorithms to generate parameter grids covering the entire design space. By increasing the number of simulations and refining parametric grids, the parameter design space is systematically explored, revealing more parametric causal relationships. When the partition is fine enough for an accurate description of parametric causalities, the parameter sweep is no longer dependent on the parameter space partitions and is considered to be converged. Following the conventional convergence analysis method, we use five statistical metrics, mean, standard deviation, median, kurtosis, and skewness to comprehensively measure the simulation outcomes from each partition. The algorithmic protocols followed for the convergence analysis of the lattice sweep and LDS sweep are shown in Fig. 3a. Input files for DEM simulation are generated according to parameter combinations and are allocated to computing processors in a high-performance-computing cluster. The computing tasks are assigned through a GNU parallel computing tool to manage the overall computation in parallel to shorten the total simulation time. The resulting simulation trajectories are post-processed for MFR and PD to capture the powder flow mechanics and evaluate the resulting powder bed. Subsequently, statistical metrics are applied to evaluate the simulation outcomes from a given parameter space partition and compared with a finer partition with more simulations. This process is repeated till convergence is obtained. Fig. 3b shows a representative 3-dimensional parameter space partition between [0, 1] generated by the lattice sweep. It can be observed that in such a partition, a large portion of parameter space remains unexplored.
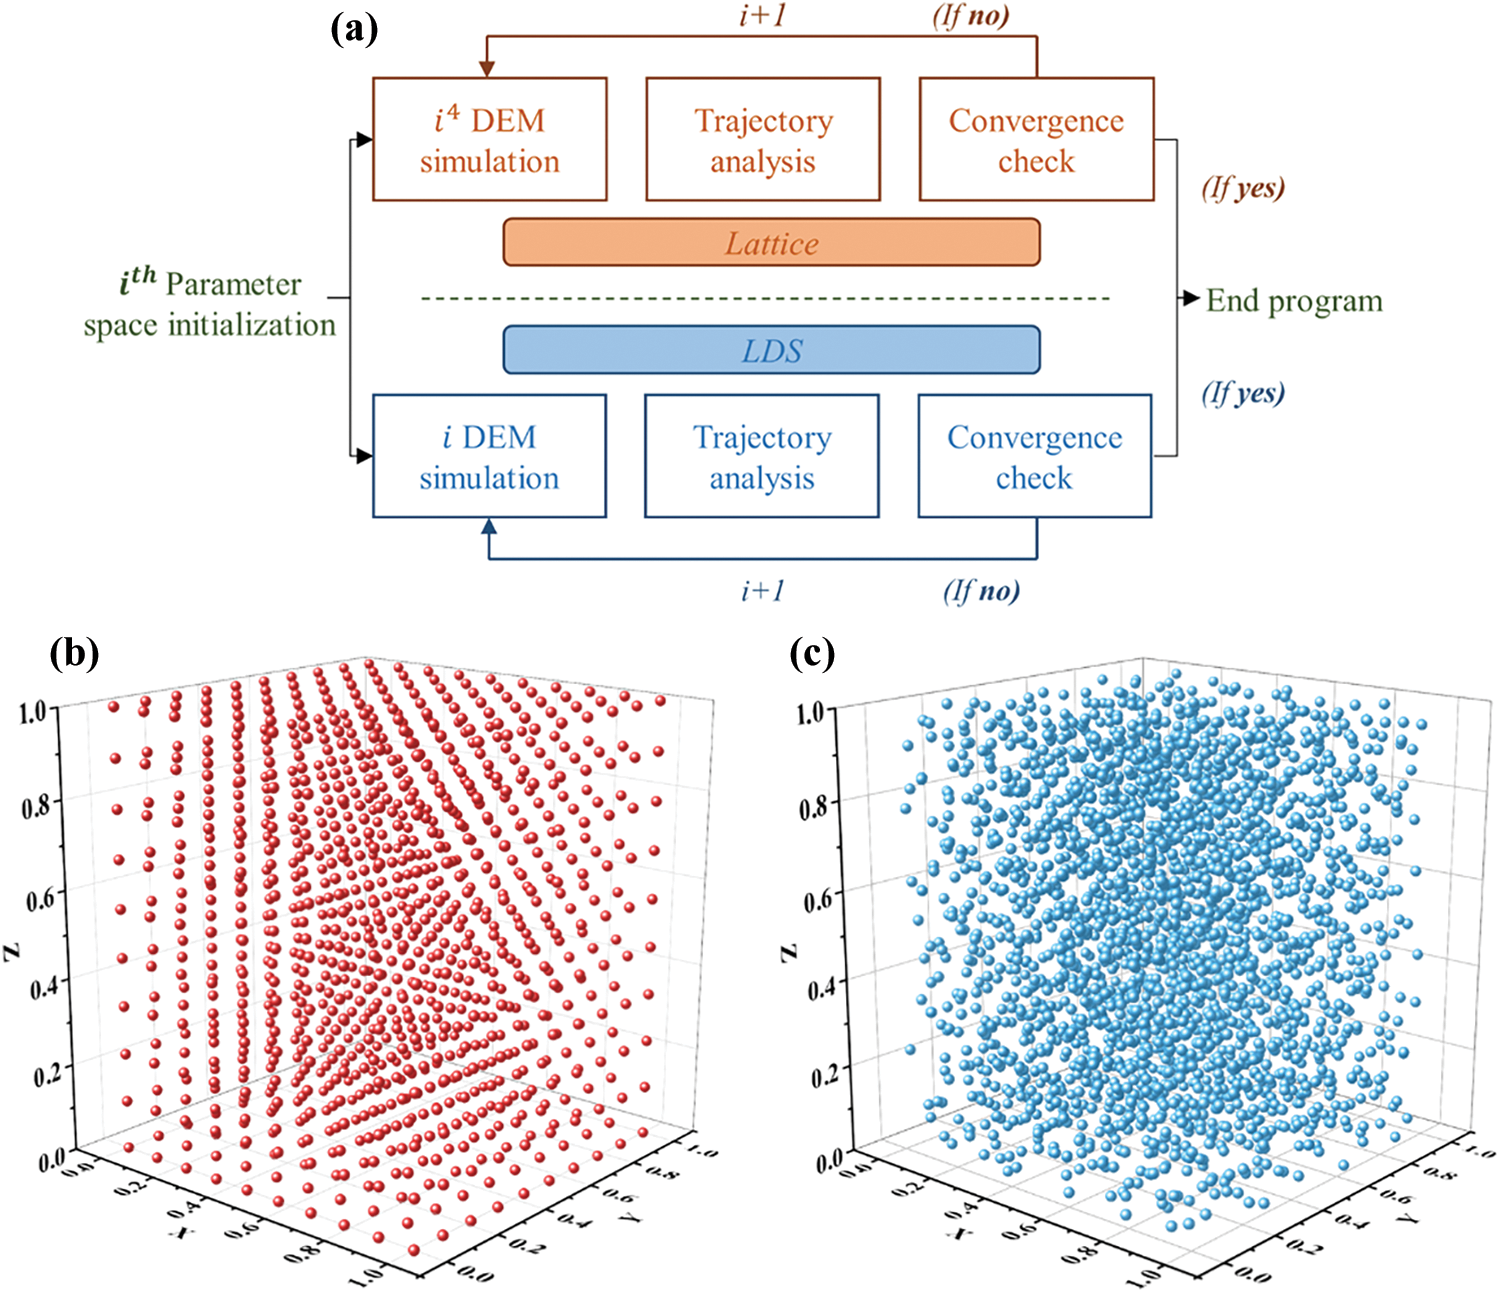
Figure 3: Parameter sweep algorithms. (a) Algorithmic convergence analysis of the lattice and LDS parameter sweep. (b) Representative 3-dimensional parameter space partition generated by the lattice sweep. (c) Representative 3-dimensional parameter space partition generated by the LDS sweep
The convergence analysis for the LDS sweep is shown in Fig. 3a. The major difference is that instead of checking the convergence on the level of consecutive partitions, the LDS sweep allows an automated convergence check on the level of individual simulation since the newly-generated partition contains identical parametric combination from the existing partition. While lattice convergence check needs comparison between Nd and (N + 1)d, simulations, LDS convergence check can be performed between N and N + 1 simulations, leading to a much more efficient process. A representative 3-dimensional parameter space partition between [0, 1] generated by the LDS sweep is shown in Fig. 3c, showcasing the efficient coverage of the parameter space.
Incorporating machine learning into parameter sweeps offers two main benefits: it enhances the understanding of causality and improves parametric interpolation. ML model development generally follows common steps: a subset of data is randomly selected to build and train the model with adjustments to the hyperparameters. The remaining dataset is used to test the model’s performance. The optimized model is then used for regression analysis, predictions and further interpretations. ML based regression models are well-suited for parametric analysis, especially in a high-dimensional design space. Once a parameter sweep algorithm converges, the resulting partition fully describes the causal relationships within the design space. Using machine learning (ML) models, we can verify the parametric interpretations identified in a random subset of modeling trajectories apply universally to trajectories with different parameter combinations. Once parametric features are globally understood, the ML model reliably applies these insights to effectively interpolate the entire design space.
The multi-layer perceptron (MLP) model is considered as one of the foundational types of artificial neural networks, prized for its ease of implementation, straightforward hyperparameter tuning, and high regression accuracy [52]. Each MLP contains a feed-forward back-propagation training mechanism between MLP components as demonstrated in Fig. 4. A complete MLP contains an input layer, which specifies the independent variables of the dataset, an output layer, which generates the prediction of the MLP, and certain hidden layers, which contains a series of hidden neurons with built-in activation functions. The feed-forward mechanism refers to the training direction, in which the input information from the input layer is fed towards the output layer. The activation functions inside of hidden layers receive and process the information from the last layer and generate new outputs, which are passed to the next layer. Iteratively layer by layer, a prediction is produced at the output layer which is compared with the actual desired test data for a deviation. The back-propagation mechanism refers to propagating the deviation back to the beginning of the hidden layers so that the weight and bias of each hidden neuron are adjusted correspondingly to minimize the new deviation. Such a process is repeated recursively until the deviation falls within a predefined tolerance. In the current context of PBF parameter analysis, four processing parameters are assigned to four independent input neurons whereas the output neuron contains MFR and PD.
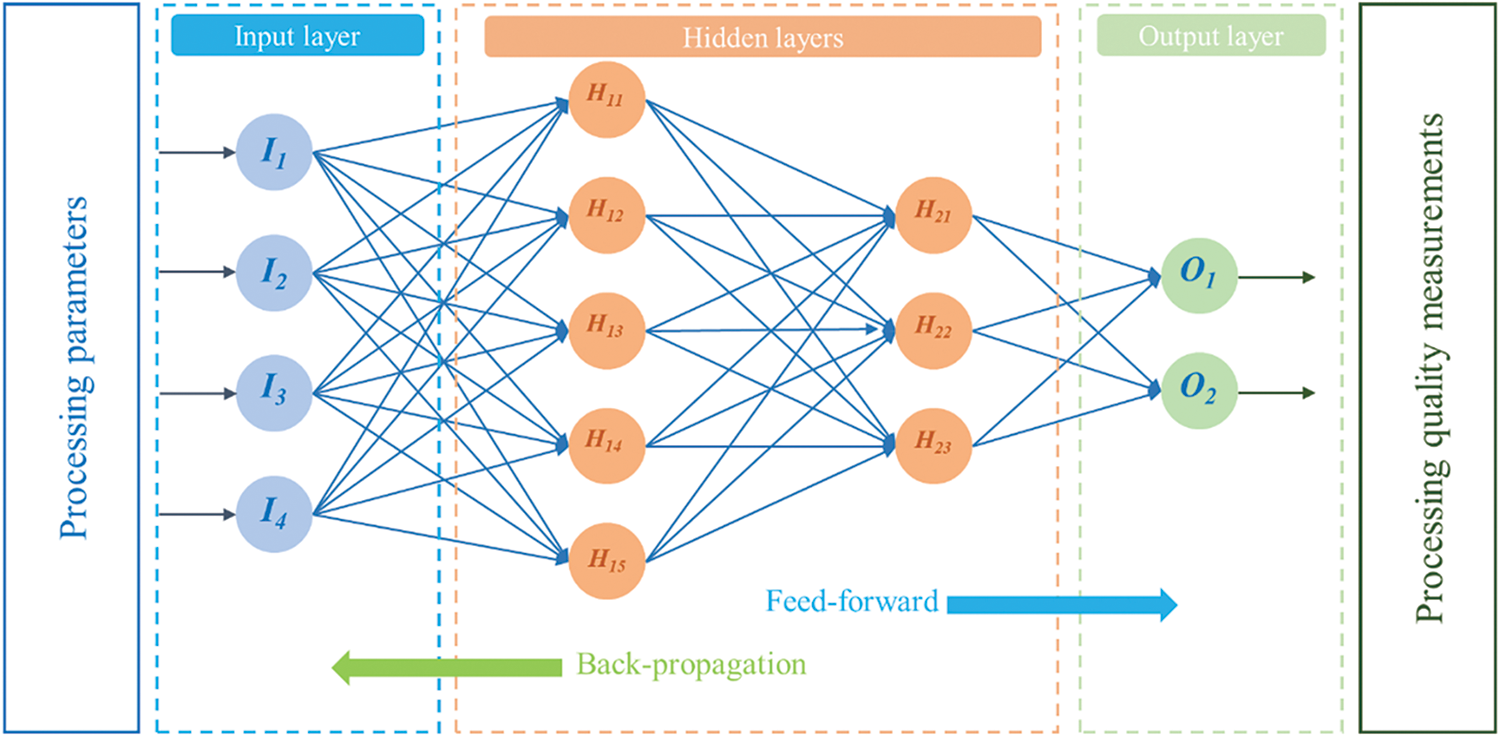
Figure 4: Schematic depiction of a two-layer MLP artificial neural network with eight hidden neurons
When an MLP is used for interpolation of parametric causalities, there are certain inherent variables to consider, such as the number of hidden neurons, and the split method of training and test data. We investigate the MLP interpolation accuracy concerning a varied number of neurons to avoid uncertainties from the MLP complexity. Furthermore, we repeat each training three times and report the average interpolation accuracy. We adopt the conventional 80%–20% training/test data split for each examined parametric partition and define a consistent random state of split throughout repetitions to reduce the effect of data feeding, ensuring the comparability between parameter space partitions. The squared coefficient of the determinant
3.1 Representative DEM Model Results
We first examine the DEM results for powder processing with various combinations of parameters. Fig. 5 contains representative trajectories with both normal and abnormal extrusions. The size of particle in the visualization is increased for clearer imaging. The scaling (3X) is based on the dimensions of the recoater and the extrusion gap. Fig. 5a shows a representative powder recoating with 1000 particles with a diameter of 29 µm deposited by a 57 µm extrusion gap at three different time steps during the recoating process. At the start of the recoating (step = 0), a pile of particles is formed on the simulation floor. As the recoating proceeds, a portion of particles is accumulated in front of the recoater, and some particles are deposited into a uniform layer of particles behind the recoater. The MFR and PD are calculated when the recoater reaches the center of the simulation floor, which indicate a steady state. A powder processing trajectory such as this is preferred due to the smooth powder flow extruded through the gap, producing a densely packed layer of powder with relatively uniform thickness.
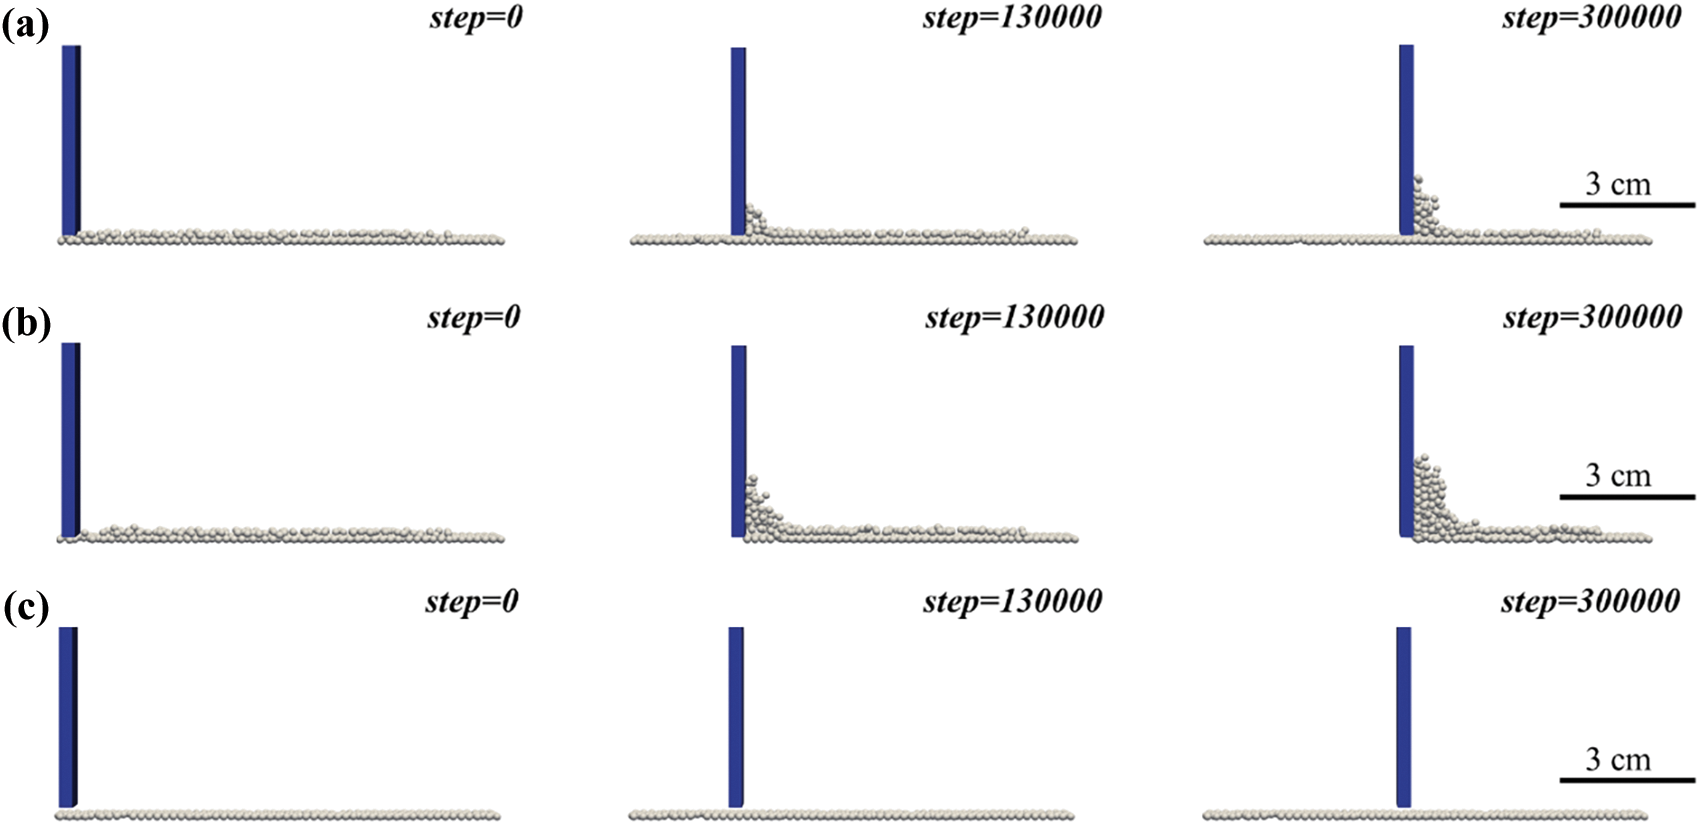
Figure 5: Representative visualizations of DEM powder processing simulations. (a) Desired trajectory with normal extrusion for 29 µm particles deposited by a 57 µm extrusion gap (friction = 0.3, recoating speed = 10 mm/s). (b) Undesired trajectory with abnormal extrusion for 29 µm particles deposited by a 64 µm extrusion gap (friction = 0.3, recoating speed = 10 mm/s). (c) Undesired trajectory with abnormal extrusion for 26 µm particles deposited by a 71 µm extrusion gap (friction = 0.3, recoating speed = 10 mm/s)
We identify the abnormal powder extrusion resulting in low quality powder processing in Fig. 5b,c. In general, these trajectories are created due to the poor selection of one or more processing parameters. For instance, it is crucial to match the powder sizes with an appropriate recoating layer thickness. In a scenario where a small recoating thickness is used, large particles tend to cluster up and move with the recoater instead of going through the extrusion gap. Fig. 5b shows one such jamming trajectory containing particles with 29 µm diameter deposited with a 64 µm extrusion gap. Conversely, Fig. 5c shows a short feed trajectory containing 26 µm particles deposited with a 71 µm extrusion gap. In this scenario, where the recoating layer thickness is too large for the powder size, the motion of the recoater does not alter the overall particle kinematics on the simulation floor as shown if Fig. 5c. These phenomena of jamming and shortfeed are generally to be avoided during physical experimentation. However, for parametric analysis, the undesired trajectories contribute to the understanding of parametric causalities and subsequent interpolations. Therefore, in a comprehensive parametric analysis for generating processing maps, it is essential to also cover the parameter space corresponding to low quality deposition and abnormal powder extrusions. Through this approach, we identify the high quality powder processing trajectories and parametrically explain the low quality ones as discussed later in Section 3.3. We use these DEM simulations to both explore the parameter space and to analyze the efficiency of parameter sweep algorithms.
3.2 Convergence Analysis of Parameter Sweeps
We first briefly examine the MFR evolution as a function of frequency distribution probability in DEM simulation outcomes produced by lattice and LDS parameter space partitions. We use the parameter sweep algorithm (lattice or LDS) followed by the number of simulations to identify a parameter sweep partition. For example, lattice 10,000, would imply 10 sets of values varying on an even grid for the 4 parameters resulting in
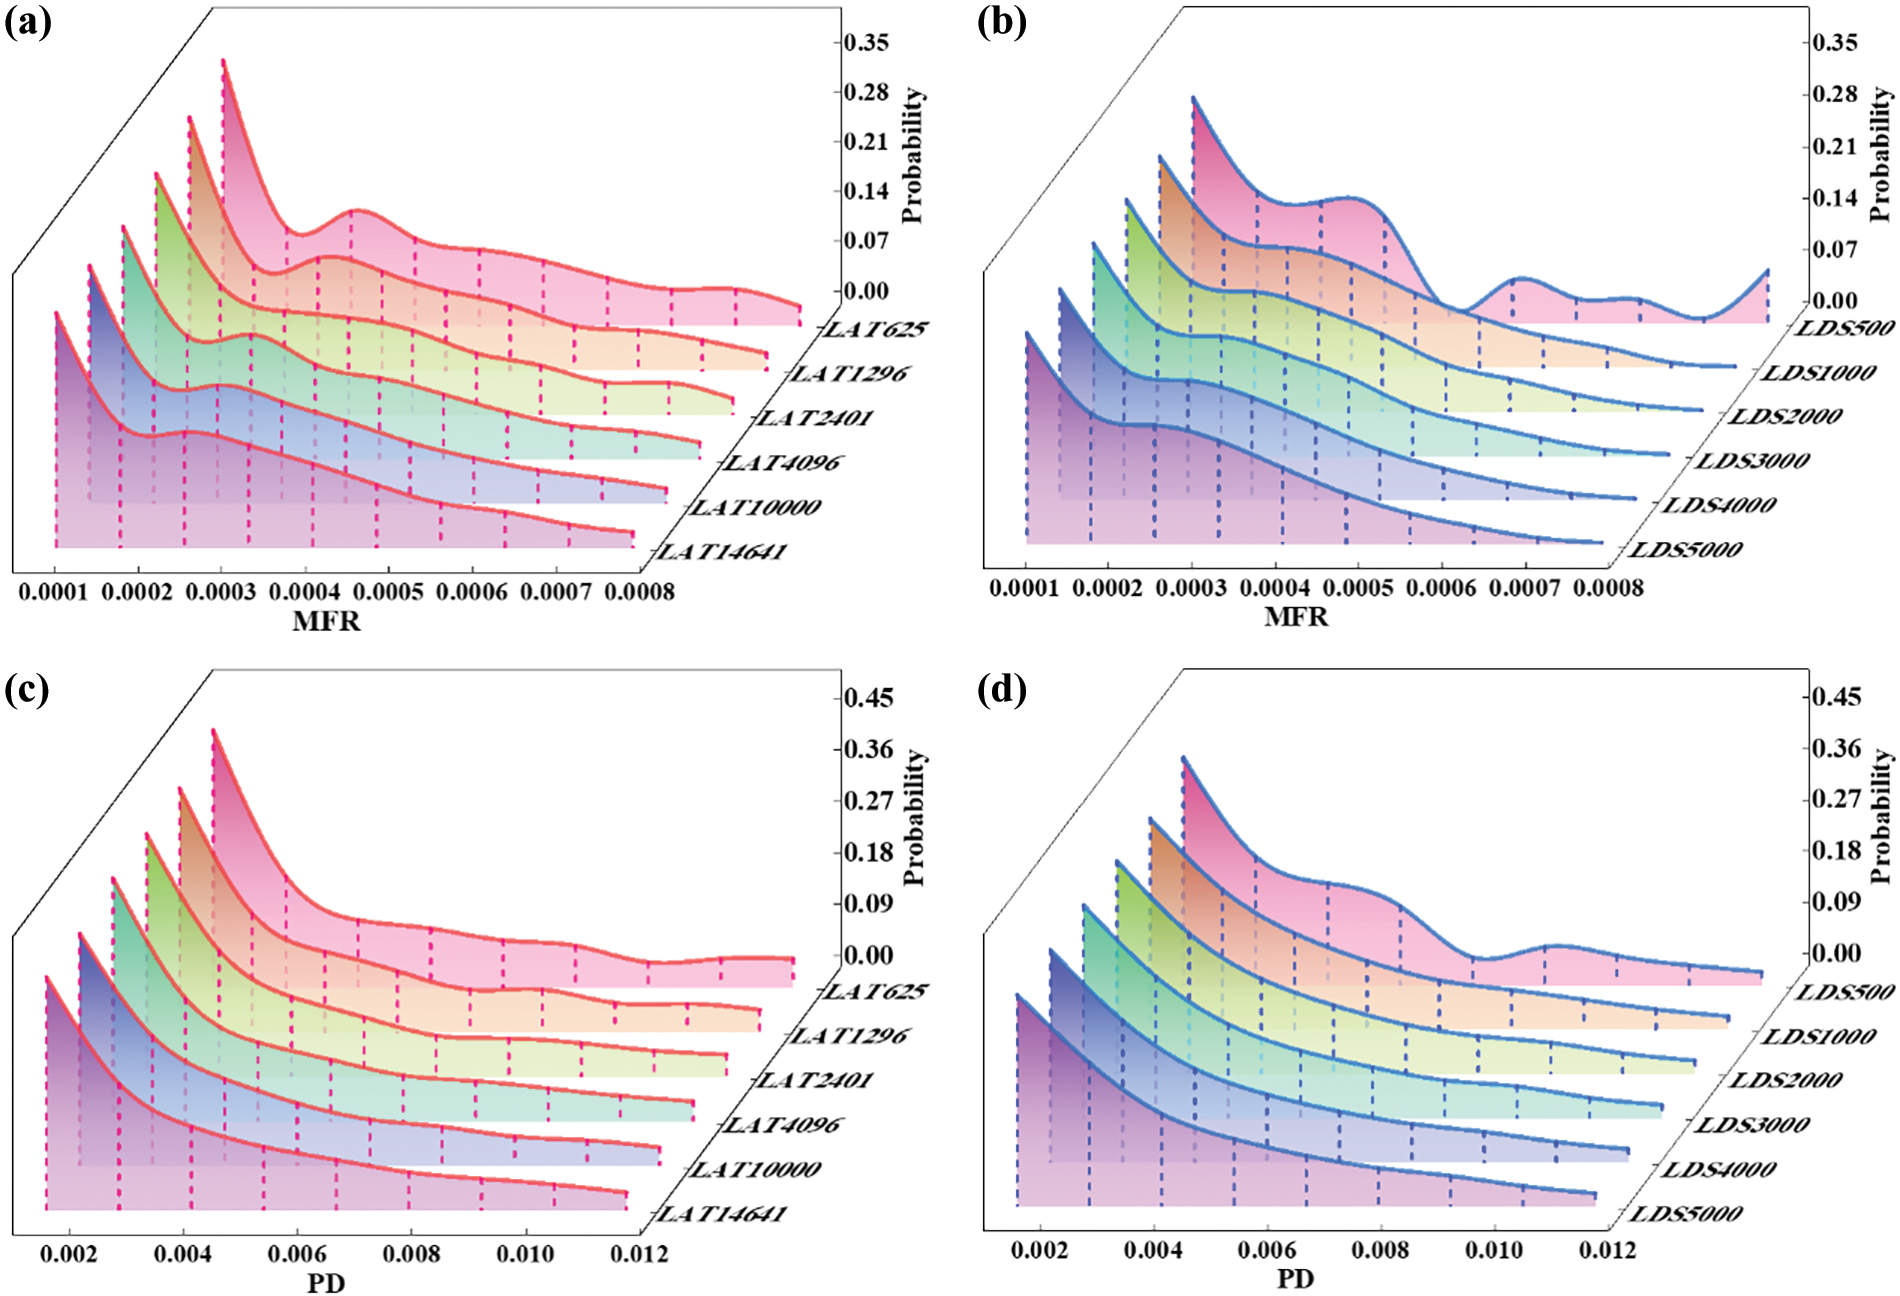
Figure 6: Frequency distributions of DEM simulation outcomes. (a) MFR distribution probabilities from lattice (LAT) partitions. (b) MFR distribution probabilities from LDS partitions. (c) PD distribution probabilities from lattice (LAT) partitions. (d) PD distribution probabilities from LDS partitions
A similar parameter sweep regarding the PD from the DEM simulation outcomes is investigated within the corresponding parameter space, as shown in Figs. 6c,d. The trend for lattice sweep convergence is evident by examining the tails of the distributions produced by each partition shown in Fig. 6c. However, compared to the MFR, the PD frequency distribution, particularly the tail distribution, shows only minor variation from lattice partitions of 4096 through 10,000. This suggests a potential convergence between these two partitions. In contrast, the PD variation resulting from the LDS sweep, as shown in Fig. 6d, mirrors the earlier MFR variation, where significant differences are only observed only between LDS partitions of 500 and 1000. This indicates that the LDS parameter sweep approaches convergence more rapidly within the parameter design space.
Above observations warrant a more precise statistical convergence check using conventional statistical metrics. These include mean, median, standard deviation, kurtosis and skewness. The statistical convergence analysis involves observing the evolution of these statistical metrics as the number of simulations is increased through parameter space partitioning. Fig. 7 illustrates the convergence metrics for the MFR and PD obtained through both lattice and LDS sweeps as a function of the number of simulations in each partition. In the case of the lattice parameter sweep, shown in Fig. 7a, all five statistical measures describing the MFR evolve as the number of simulations increases, with the standard deviation being notably affected. Convergence is achieved at 10,000 simulations, where the relative difference of all five metrics falls within the 0.5% tolerance threshold. Compared to the lattice sweep, the LDS sweep requires fewer simulations for convergence. Notably, the mean is more influenced by the number of simulations compared to the other measures. The relative difference falls within the 0.5% tolerance between LDS 1000 and LDS 2000 partitions, suggesting convergence at the LDS 1000 parameter space partition. Despite that minor variations between metrics can be observed after the LDS 2000 partition, such as the dropped standard deviation from the LDS 5000 to LDS 6000 partitions. All these variations fall within the 0.5% tolerance. This suggests that the further addition of simulations to the converged LDS 1000 partition only contributes minor changes in parametric causality descriptions to the design space and are not needed. Furthermore, the proximity of converged statistical measures resulting from the lattice and LDS sweep suggests that trajectories generated by both lattice and LDS sweeps are informatively equivalent for capturing parametric variations of powder flow behaviors.
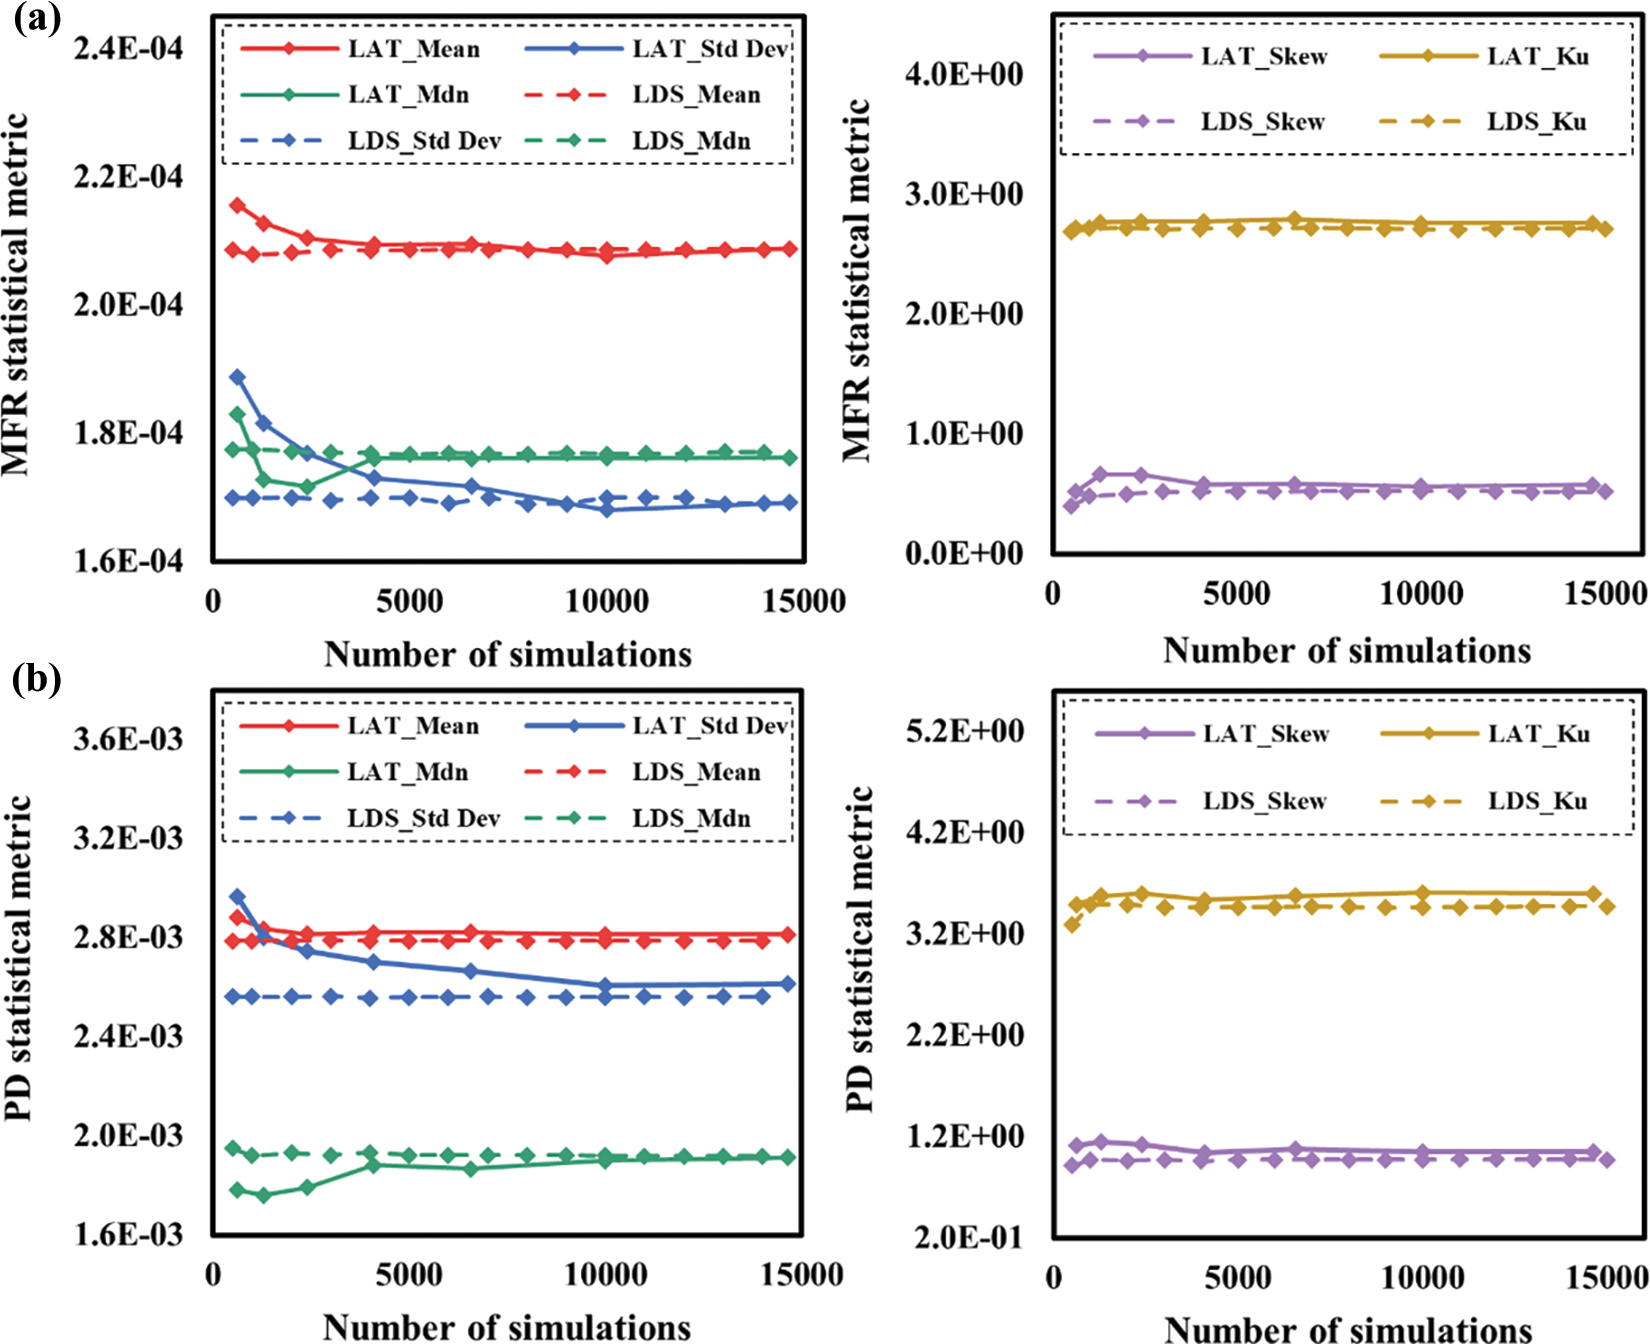
Figure 7: Statistic metrics of (a) MFR and (b) PD using the lattice and LDS sweep algorithms
The statistical metrics for PD are shown in Fig. 7b. Similar to the MFR observations, all five metrics evolve significantly throughout parameter space with fewer simulations and gradually approach a steady state as the number of simulations increased. For the lattice sweep, the standard deviation plays a critical role in determining convergence, with the relative difference falling within the tolerance criteria at 10,000 simulations. In contrast, the LDS sweep demonstrates a much faster approach to convergence, achieving stability at the LDS 1000 partition. For both powder flow dynamics measurement of MFR and powder bed quality measurement of PD, the LDS parameter sweep proves to be ten times more efficient, requiring only 1000 simulations compared to the 10,000 simulations needed for the lattice sweep. Consequently, the converged partitions of LDS 1000 is used for further regression analysis and generation of processing maps.
The investigated design space is further illustrated in the parallel plots in Fig. 8. Here, the MFR and PD values are normalized for comparability among parametric distributions. Fig. 8a,b illustrates the causal distribution of MFR from the converged lattice 10,000 partition and LDS 1000 partition, respectively. It can be observed that lattice parametric distribution resulted in a relatively large uninvestigated parameter space compared to LDS algorithm. LDS 1000 partition exhibits a more comprehensive coverage over the parameter space with ten times fewer simulations. This further indicates the high efficiency of the LDS parameter sweep. Fig. 8c,d shows similar parallel plot for the distribution of PD for the converged lattice 10,000 partition and LDS 1000 partitions. Here again, LDS 1000 suggested a superior coverage of parameter space compared to lattice 10,000 partition. Example optimum processing parameters are highlighted in Fig. 8b,d. The highest values of MFR and PD are obtained with 45 µm particles extruded using a layer thickness of 61 µm, where the recoating layer thickness is approximately 1.4 times the particle diameter. This ratio is close to the criteria of 1.5 identified for the occurrence of particle jamming events with 45 µm particles from a prior study [14]. Moreover, low PD values are generally associated with a higher ratio of the recoating layer thickness and particle diameter, i.e., h/d. This suggests that the inappropriate selection of layer thickness for a given particle diameter tends to produce abnormal powder extrusion flows, which gets worse in trajectories with higher recoating speed.
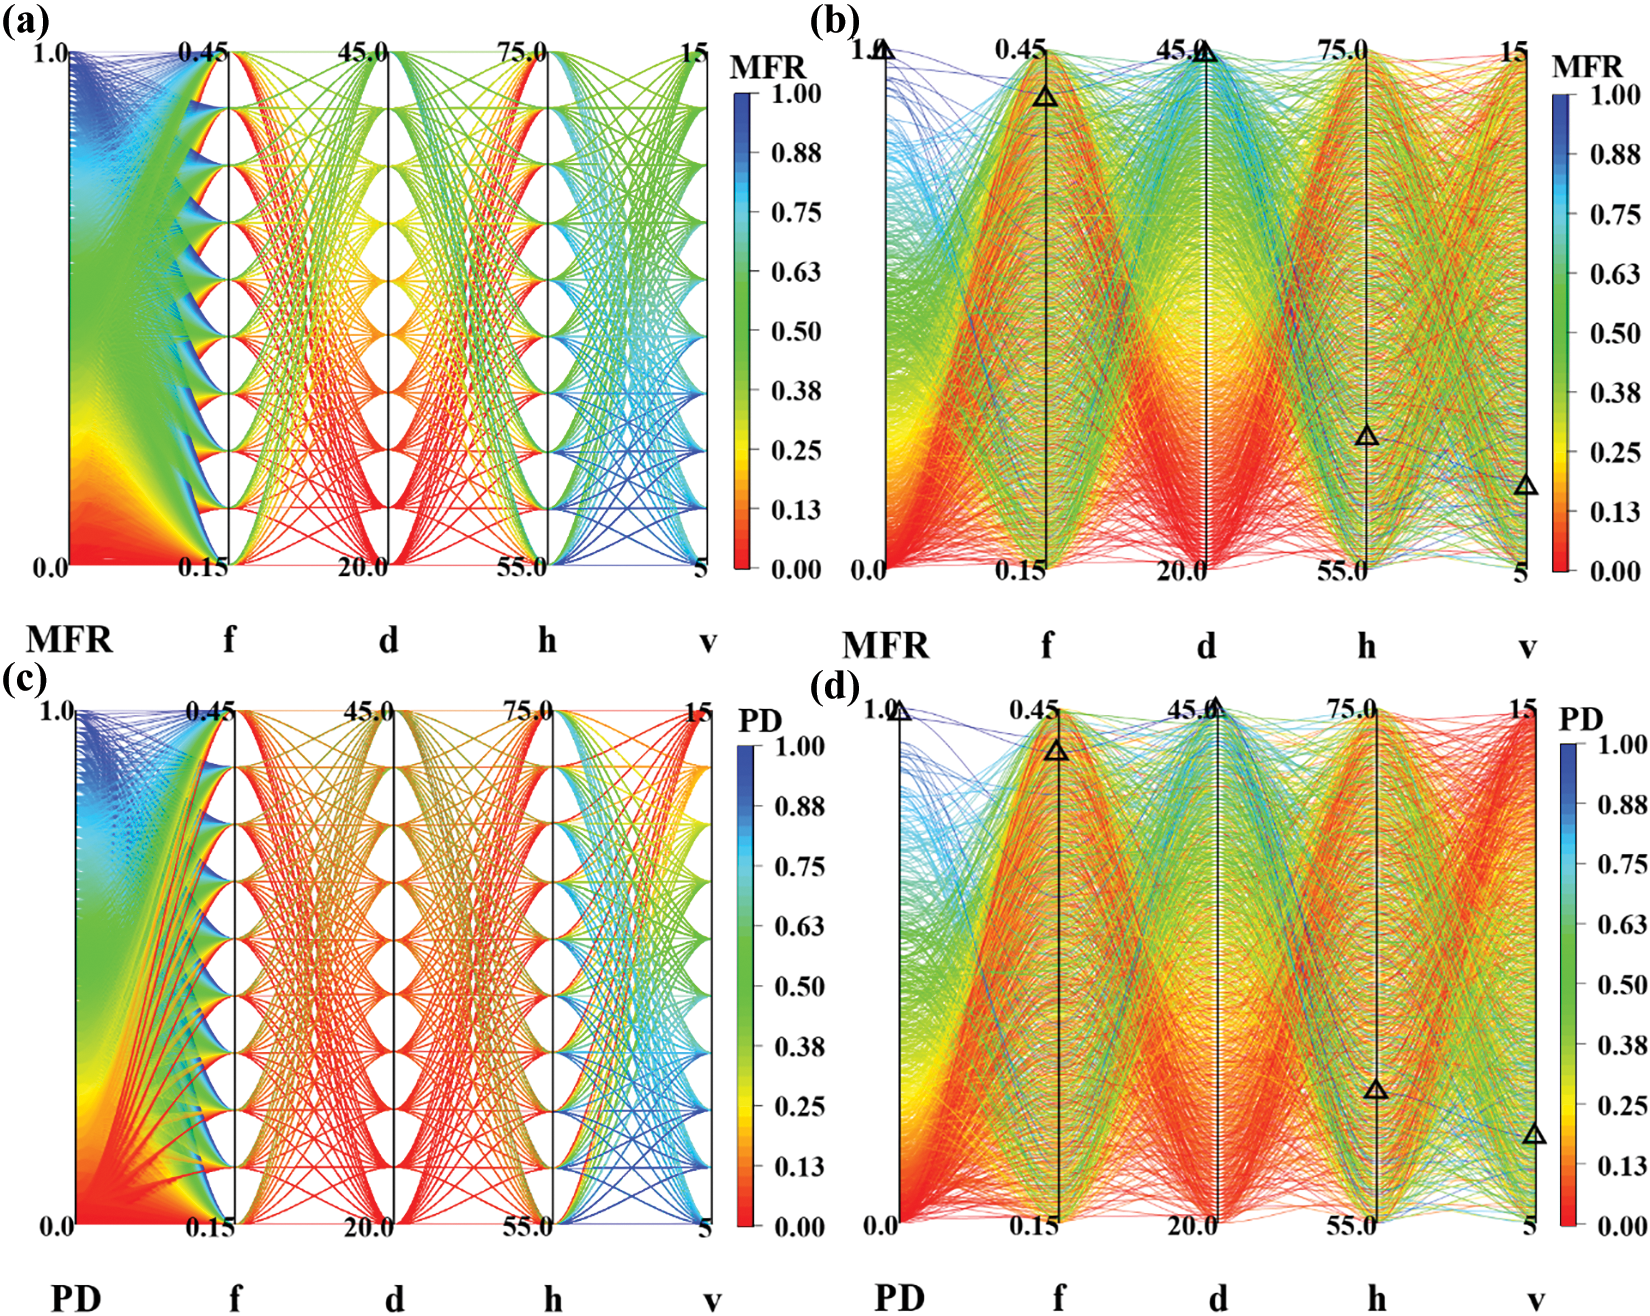
Figure 8: Parametric distributions in the converged parameter space partitions. (a) MFR distribution in the lattice 10,000 partition. (b) MFR distribution in the LDS 1000 partition (Optimum MFR of 0.672 corresponding to the 100% of normalized MFR) (c) PD distribution in the lattice 10,000 partition. (d) PD distribution in the LDS 1000 partition (Optimum PD of 0.744 corresponding to the 100% of normalized PD)
3.3 Multilayer Perceptron Parametric Interpolation
It is evident that the converged LDS 1000 partition can adequately explain the parametric causalities in the design space with a significantly reduced number of simulations. However, applications like processing maps need parameter combinations which are not among the 1000 combinations. Therefore, we use the DEM simulation outcomes obtained from the LDS 1000 in combination with a MLP regression model to interpolate for the desired combinations. This approach is more efficient than simulating all needed combinations for the processing maps.
The generic structure of the MLP model used in the study is described in Section 2.3. The same approach is used for both MFR and PD with different number of hidden neurons. We first examine the MLP accuracy for interpolating the MFR values by varying the hyperparameters. Fig. 9a shows the accuracy as a function of the number of hidden neurons. As the number of applied hidden neurons increased, the MLP interpolation performance was improved with accuracies converging at 25 neurons. Fig. 9b offers a close look at the distribution of values of MFR from DEM simulations compared to values obtained from MLP-interpolation. In the theoretical case of interpolation with 100% accuracy, the data point containing the actual value and the interpolated value would fall on the 45° quadrant splitting line. The narrow width of the distribution band suggests small deviation between the simulations and corresponding interpolated values. Furthermore, the slope of 0.9987 and the small intercept from linear regression analysis confirm high interpolation performance. The proximity between each pair of actual MFR and corresponding interpolated MFR values is shown in Fig. 10a.
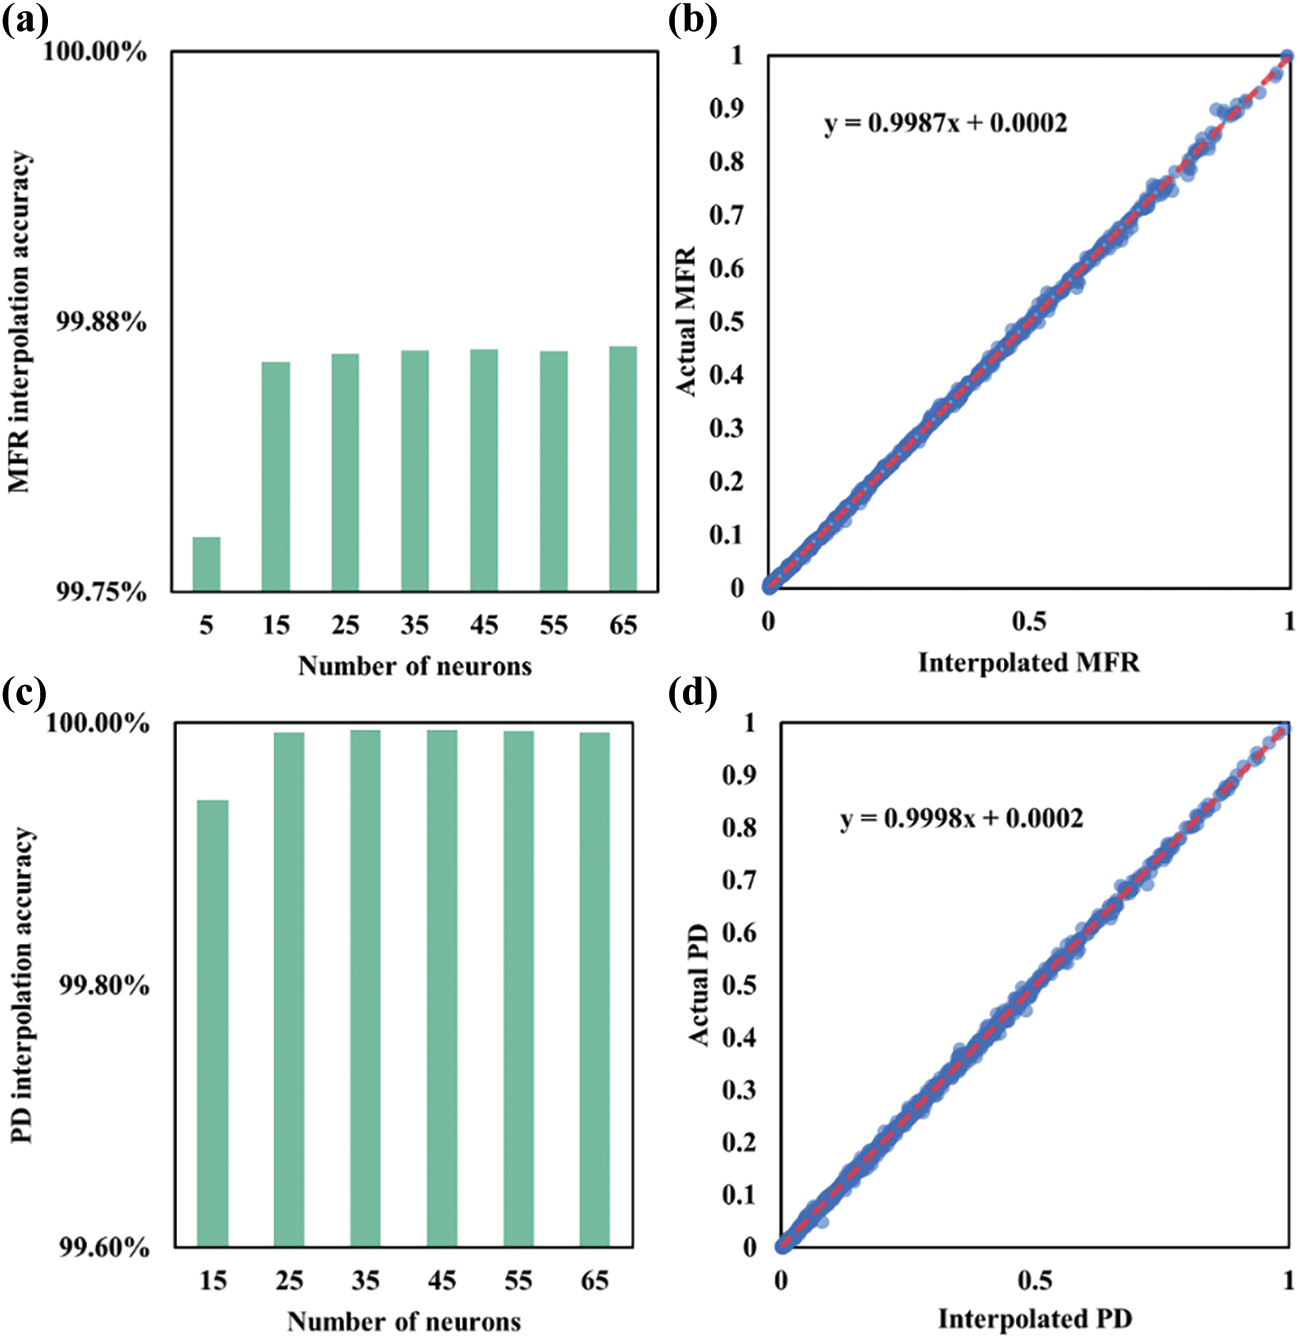
Figure 9: MLP interpolation using converged LDS 1000 partition. (a) MLP interpolation accuracies with varied numbers of hidden neurons. (b) Regression analysis of the MFR values from DEM models to the MFR values from MLP interpolation. (c) PD interpolation accuracies with varied numbers of hidden neurons. (d) Regression analysis of the PD values from DEM models to the PD values from MLP interpolation
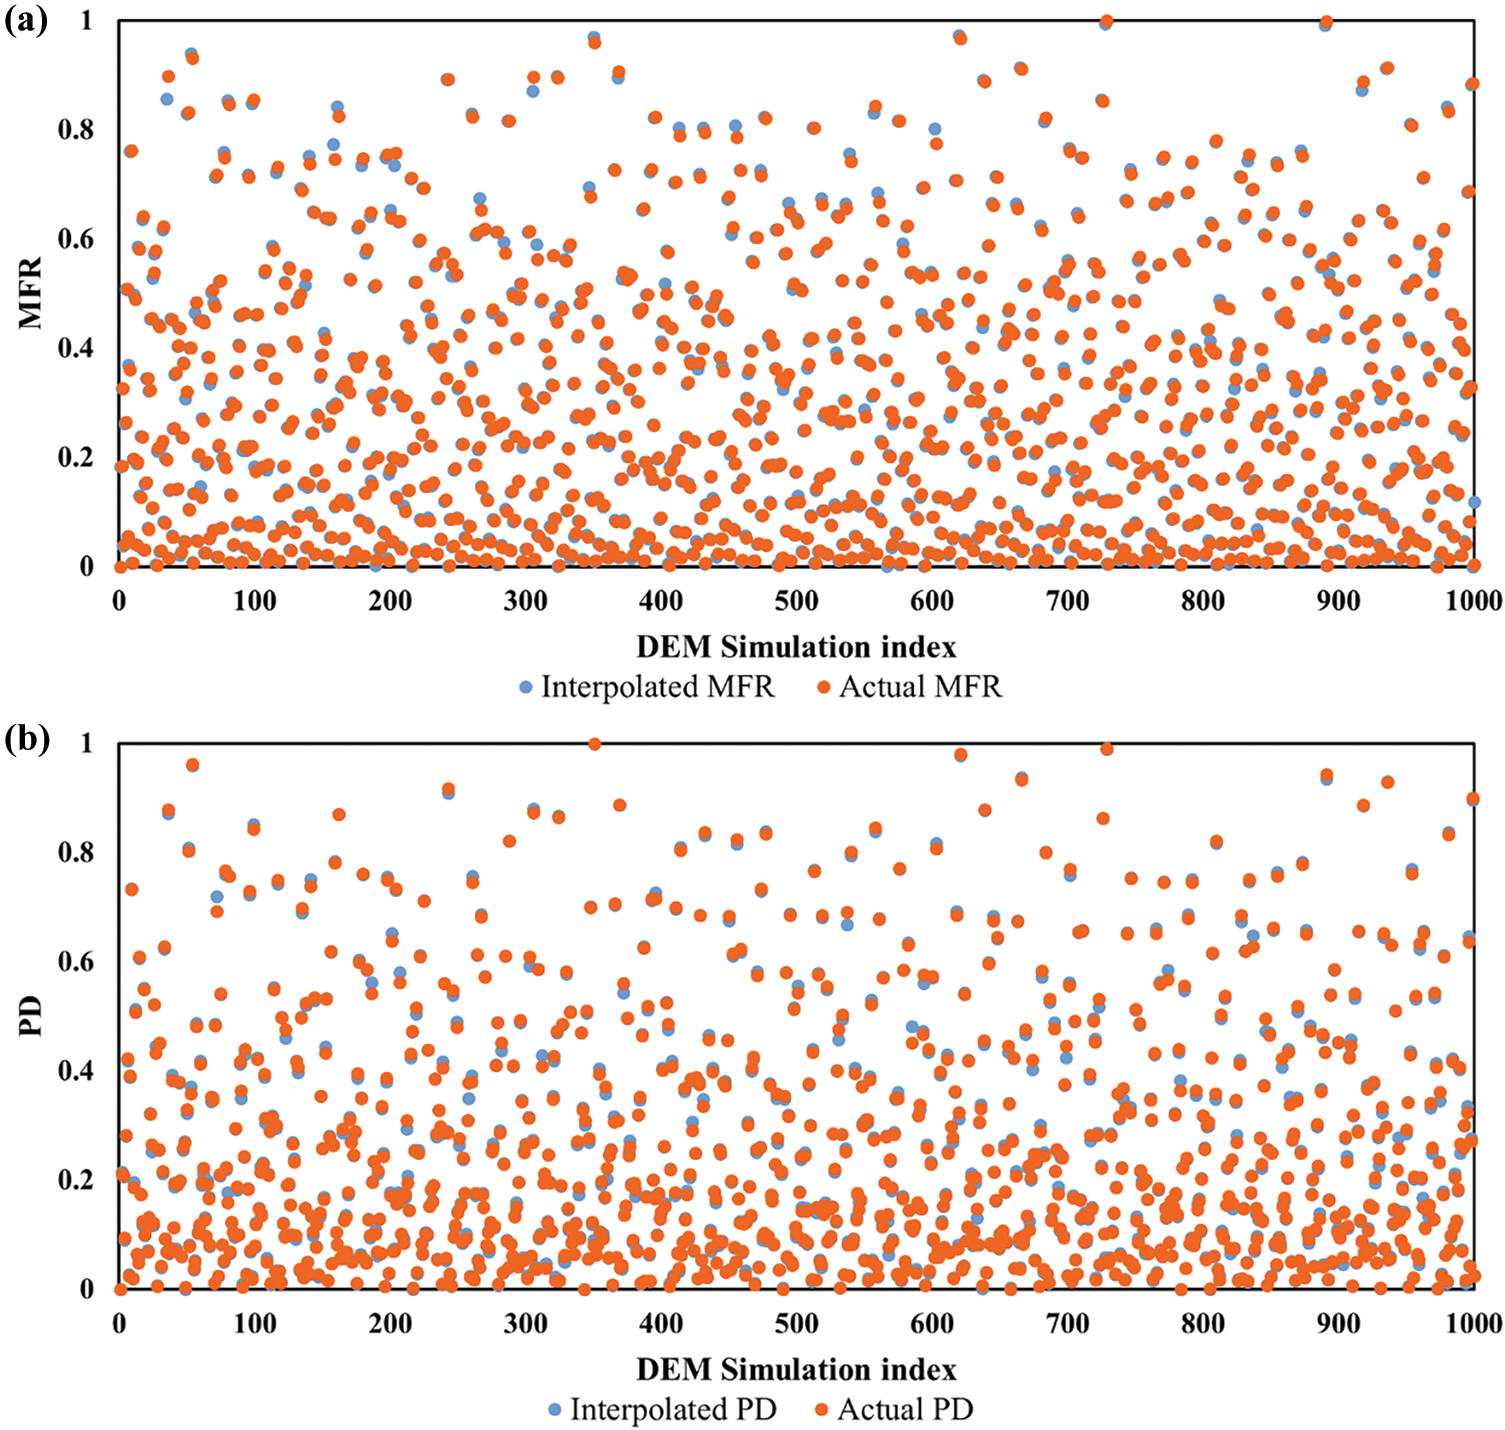
Figure 10: MLP interpolation result distribution. (a) Proximate distribution between the MFR values from DEM simulations and MFR values from MLP interpolation. (b) Proximate distribution between the PD values from DEM simulations and PD values from MLP interpolation
Similar trend is observed for PD. The MLP interpolation accuracies with varied numbers of hidden neurons towards PD are shown in Fig. 9c. Overall, all examined MLPs produce high interpolation accuracies of over 99%. Fig. 9d shows the distribution of the actual PD and the corresponding interpolated PD resulting from the LDS 1000 partition. It can be observed that the interpolated values are close to the actual values resulting in the distribution close to the quadrant splitting line, with a slope of 0.9998 and intercept of 0.0002. Fig. 10b compares the MLP interpolation with actual values. We now use the MLP model with the interpolated causalities to generate the processing maps.
3.4 Processing Design Map and Parametric Sensitivity
In the 4-dimensional design space, two parameters, inter-particle friction are related to powder properties primarily associated with powder quality. In contrast, the relocating speed and layer thickness are machine parameters that can be easily adjusted for specific building tasks. Therefore, to visualize the four-dimensional parameter map in detail, we first reduce the dimensionality of the parameter space by constraining the optimum parameters related to powder properties and produce the processing map for recoating parameters. These constraint values are selected based on the optimum values from the LDS parallel plots allowing the highest quality powder processing, referring to the highlighted lines in Fig. 8b,d. The processing map in Fig. 11 illustrates MFR and PD variations across different recoating speeds and layer thicknesses, considering an inter-particle friction of 0.45 and a particle diameter of 45 µm. Each recoating speed band contains trajectories simulated with varied recoating layer thicknesses, and vice versa. Higher recoating speeds generally reduce MFR. This is due to the recoater altering the powder bed’s kinematics, forming a force arch ahead of it and increasing particle movement during brief interaction with the recoater [53]. This leads to a fewer number of particles passing through the gap in a given time frame, consequently decreasing the MFR. A similar observation was experimentally noted by Chen et al. [46]. Furthermore, the increase in layer thickness causes the trajectories to shift towards the lower range of MFR.
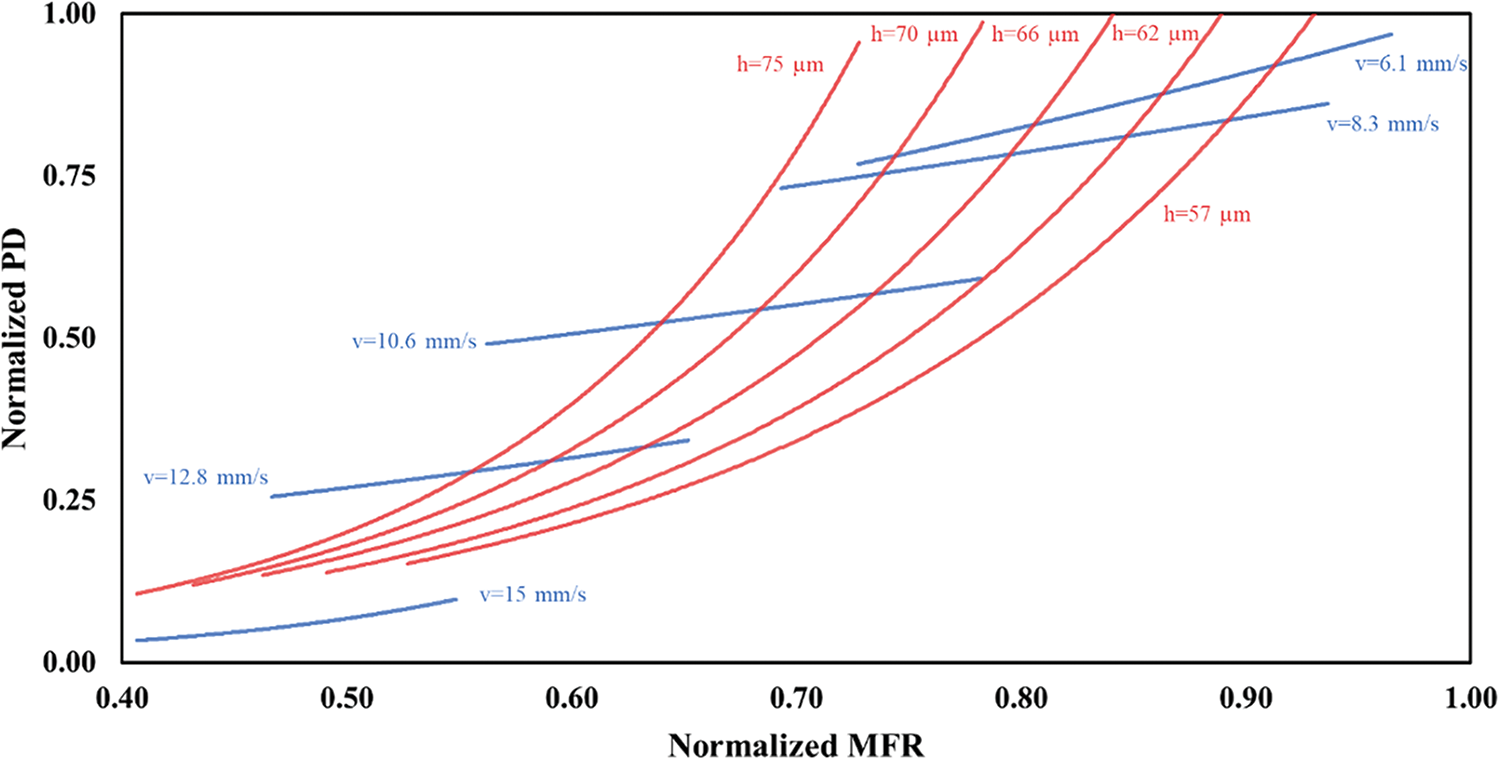
Figure 11: Process design map with varied recoating speeds and layer thicknesses for powder with interparticle friction of 0.45 and diameter of 45 µm
It can also be observed from Fig. 11 that increasing the recoating speed shifts bands towards the lower range of PD along with the lower MFR values. This suggests the correlation between MFR and PD where a trajectory with higher spreadability tends to produce a higher quality powder bed. Such observation is consistent with the existing knowledge from previous studies [45]. Therefore, the upper region of the map, which contain high MFR and PD values, and the corresponding process variables are preferred for achieving high-quality builds. The combinations of 45 µm particles recoated with a layer thickness of 57 µm under 6.1 mm/s represents one such combination that leads to improved spreadability and packing of powder. On the other hand, powder trajectories resulting from unfavorable recoating parameter combinations are deemed less desirable in process design, warranting caution. Some trajectories exhibit abnormal extrusion behavior, with PDs approaching zero, due to the poor selection of recoating parameters. In practical processing design, if a building task is constrained by machine capabilities and speed requirements, preventing the use of optimal powder processing parameters for high quality, designers can navigate the processing map along the recoating bands to find feasible parameters that meet the building requirements. For example, when time is a concern and higher printing speed is desired, one can adjust the recoating thickness to an acceptable value, considering all estimated potential losses in processing quality based on the h-v processing map, without the need for physical trials.
Next, we examine the processing map for powder selections. Compared to the machine parameters, the powder properties impact the processing quality to a lesser extent. Specifically, the contour lines for trajectories varied by interparticle frictions fall near each other within a narrow band. To illustrate clearly, we choose the maximum and minimum interparticle friction to represent the upper and lower boundaries of this band, depicted in Fig. 12a. It can be observed that powders with higher friction coefficient can produce higher quality processing trajectories. This is potentially caused by the increased particle interlocking [54], which is further translated into a higher quality powder processing. This map provides insights for powder selections among different categories of powders with various surface morphologies. Subsequently, we produce the powder selection map with various particle diameters, as shown in Fig. 12b. The increase in particle diameters significantly improves the powder processing quality. Due to the minor influence of the interparticle friction, trajectories with the same diameter but varied interparticle frictions fall into small clusters, as demonstrated by the clusters of 36 and 42 µm particles. The distinct cluster shapes suggests the minor influence from the interparticle friction. Furthermore, it can be noted that the location of each cluster is highly dependent on the particle diameter. This indicates that the particle size is more dominant in determining the global shape of the powder selection map and the powder processing quality while the interparticle friction is less vital. This helps prioritize of powder selection for machine parameter constrained building tasks. One can select an appropriate powder size first and then navigate through the processing map locally for a coupled interparticle friction for a desired build quality.
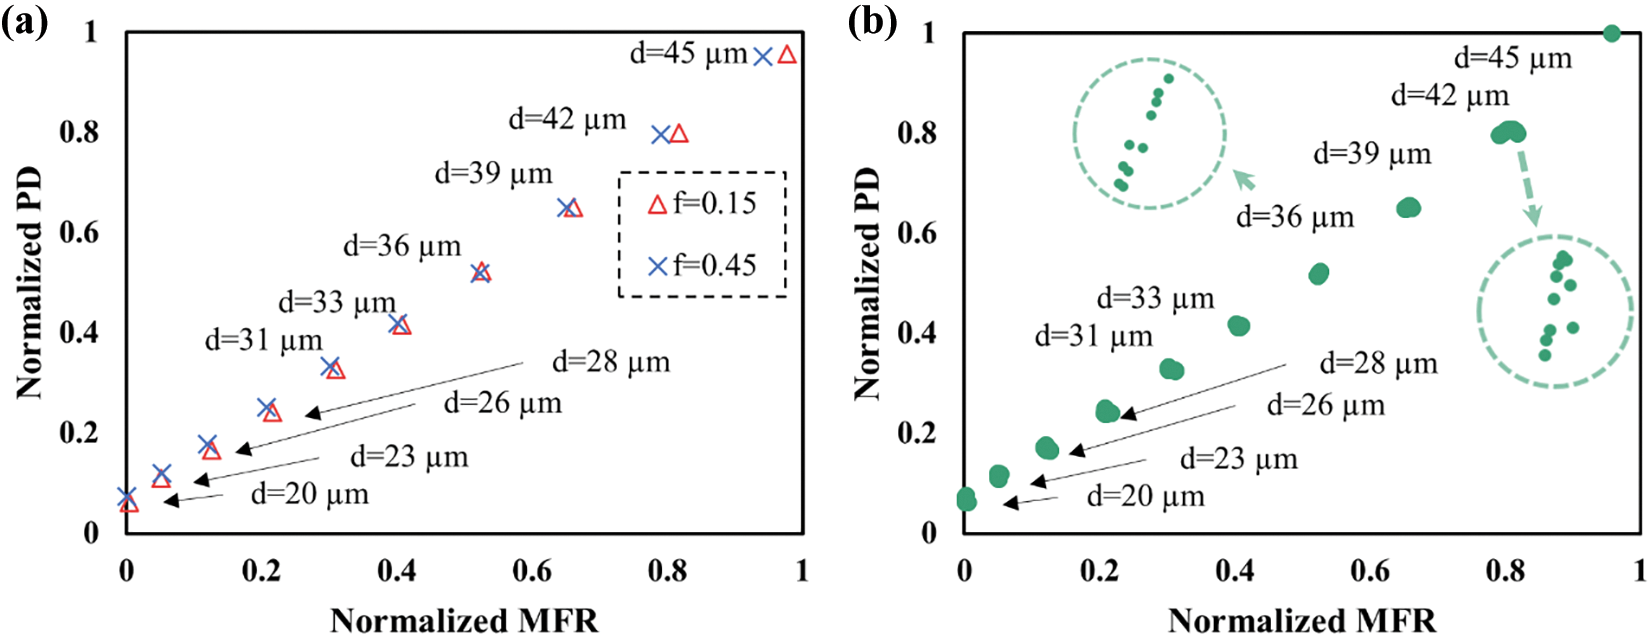
Figure 12: Process design maps. (a) Process map with interparticle friction of 0.15 and 0.45 with varied particle diameters for 57 µm layer thickness under 6.1 mm/s speed. (b) Powder selection map with varied interparticle frictions for 57 µm layer thickness under 6.1 mm/s speed
By comparing the overall width of band shifts induced by independent parametric variations, the sensitivity of each parameter on powder processing is revealed. The largest shift for the recoating speed suggests its highest parametric influence, followed by the recoating layer thickness, particle size, and interparticle friction. This ranking allows a designer to navigate the high-dimensional parameter space efficiently for a reliable process design.
Overall, the results suggest that using DEM computational modeling combined with the LDS parameter sweep and MLP interpolation models is an effective strategy for analyzing parametric relationships in PBF processes and creating informative process design maps. Typical parametric analysis studies use lattice sweep method, where the dimension and the scope of parameter design space are often constrained [55,56]. Due to the high computational cost, large-scale parametric analysis, as presented in this work, has been underutilized. By employing LDS parameter sweeps, we can significantly reduce the number of parametric combinations required to comprehensively explore the parameter space. This approach effectively mitigates the computational burden associated with such analyses. While experimental validation has not been conducted as a part of this study, our observations are consistent with prior experimental and modeling studies. The decrease of MFR with increased recoating speed, closely aligns with findings from other studies on powder bed fusion (PBF) that have been validated experimentally [46]. Despite simplifying assumptions regarding particle shape and cohesion, our results are consist with other simulation studies which incorporate some of these features [14]. For instance, we observed a threshold ratio of 1.4 between the gap size and the particle diameters for powder jamming phenomenon, this is in close proximity with the identified threshold of 1.5 in [14]. This suggests that our simplifying model assumptions introduce minimal loss of accuracy, while enabling the exploration of a large parameter space with high granularity.
Additionally, we use MLP models in combination with parameter sweeps to obtain a highly refined parameter coverage necessary for process design maps. MLP models have following advantages compared to other regression models. Firstly, MLP models, with their reduced complexity and straightforward learning mechanisms, offer ease of implementation and require minimal hyperparameter tuning. This is advantageous in the current application, where minimizing computational costs associated with generating process design maps is desired. Secondly, MLP models with appropriate activation functions within hidden neurons are capable of capturing both linearly-correlated and nonlinearly-correlated parametric causalities [57]. This is vital because nonlinear correlations among PBF process design parameters have been observed in previous studies [58,59]. Previous studies primarily select parametric combinations from a design space using the lattice sweep method to extract the correlations among processing parameters and subsequently apply them in design maps [60,61]. Using LDS based parameter sweeps could significantly improve this process.
In the PBF process, PD is associated with the manufacturing quality whereas MFR reflects the manufacturing speed. Despite their intrinsic correlations, incorporating both metrics in creating the process design maps enables evaluating tradeoffs between speed and quality. For instance, Fig. 11 suggests that increasing the recoating speed from 6.1 to 8.3 m/s results in 3%–4% loss in MFR (horizontal drift) whereas 1%–10% loss in PD (vertical drift), with a consistent setups of recoating lager thickness. This is more apparent for higher recoating velocities. When time is a concern and higher printing speed is desired, one can adjust the recoating thickness to an acceptable value based on the h-v processing map. Therefore, creating 2D process design maps that incorporate manufacturing quality and speed offers process designers a more comprehensive view, compared to focusing on either quality or speed alone.
In this study, we propose a highly efficient parametric analysis approach for powder processing in PBF additive manufacturing. Using DEM models, we simulated powder processing by parametrically varying inter-particle friction, particle size, recoating layer thickness, and recoating speed. We examined two parameter sweep algorithms: lattice sweep and LDS parameter sweep. Our results show that the LDS sweep is ten times more efficient than the lattice sweep, offering better exploration and coverage of the process design space. We then analyzed the causal relationships between processing parameters and the resulting powder flow and packing behaviors during extrusion. Furthermore, we used MLP as an interpolation tool to establish these parametric causalities from the converged LDS parameter partition. All interpolations achieved over 99% accuracy, demonstrating their high quality. Finally, using the MLP constructed from the LDS partition, we produced processing maps which reveal parametric causalities and sensitivities. We found that recoating speed has the highest impact on powder processing quality, followed by recoating layer thickness, particle size, and inter-particle friction. The process design maps can be used for machine parameter and powder selections to improve the process quality. This approach of combining efficient parameter sweep algorithms with machine learning-based regression models can be extended to other applications. To handle the extensive parameter space in the DEM model, simplifying assumptions about particle shape and cohesion were made to reduce computational costs. While these assumptions are expected to minimally impact broader trends, including additional features in future DEM simulations could further enhance the precision of our parametric analysis. Furthermore, the process design maps are configured based on the parametric causalities disclosed only by computational modeling. Future studies incorporating experimental parametric analysis will further validate and impart practical value to the process design maps.
Acknowledgement: We acknowledge Ashok Srinivasan for useful discussions on the parameter sweep algorithms.
Funding Statement: This study was partially supported by the funding provided by Boeing Center for Aviation and Aerospace Safety.
Author Contributions: The authors confirm contribution to the paper as follows: study conception and design: Yuxuan Wu, Sirish Namilae; data collection: Yuxuan Wu; analysis and interpretation of results: Yuxuan Wu, Sirish Namilae; draft manuscript preparation: Yuxuan Wu, Sirish Namilae. All authors reviewed the results and approved the final version of the manuscript.
Availability of Data and Materials: The datasets generated and/or analyzed during the current study are available from the corresponding author on reasonable request.
Ethics Approval: Not applicable.
Conflicts of Interest: The authors declare no conflicts of interest to report regarding the present study.
References
1. Vock S, Klöden B, Kirchner A, Weißgärber T, Kieback B. Powders for powder bed fusion: a review. Prog Addit Manuf. 2019;4(4):383–97. doi:10.1007/s40964-019-00078-6. [Google Scholar] [CrossRef]
2. Sing SL, Yeong WY. Laser powder bed fusion for metal additive manufacturing: perspectives on recent developments. Virtual Phys Prototyp. 2020;15(3):359–70. doi:10.1080/17452759.2020.1779999. [Google Scholar] [CrossRef]
3. Wei C, Li L. Recent progress and scientific challenges in multi-material additive manufacturing via laser-based powder bed fusion. Virtual Phys Prototyp. 2021;16(3):347–71. doi:10.1080/17452759.2021.1928520. [Google Scholar] [CrossRef]
4. Chowdhury S, Yadaiah N, Prakash C, Ramakrishna S, Dixit S, Gupta LR, et al. Laser powder bed fusion: a state-of-the-art review of the technology, materials, properties & defects, and numerical modelling. J Mater Res Technol. 2022;20:2109–72. doi:10.1016/j.jmrt.2022.07.121. [Google Scholar] [CrossRef]
5. Agrawal AK, Rankouhi B, Thoma DJ. Predictive process mapping for laser powder bed fusion: a review of existing analytical solutions. Curr Opin Solid State Mater Sci. 2022;26(6):101024. doi:10.1016/j.cossms.2022.101024. [Google Scholar] [CrossRef]
6. Imani F, Gaikwad A, Montazeri M, Rao P, Yang H, Reutzel E. Process mapping and in-process monitoring of porosity in laser powder bed fusion using layerwise optical imaging. J Manuf Sci Eng. 2018;140(10):101009. doi:10.1115/1.4040615. [Google Scholar] [CrossRef]
7. Yuasa K, Tagami M, Yonehara M, Ikeshoji TT, Takeshita K, Aoki H, et al. Influences of powder characteristics and recoating conditions on surface morphology of powder bed in metal additive manufacturing. Int J Adv Manuf Technol. 2021;115(11):3919–32. doi:10.1007/s00170-021-07359-x. [Google Scholar] [CrossRef]
8. Soundararajan B, Sofia D, Barletta D, Poletto M. Review on modeling techniques for powder bed fusion processes based on physical principles. Addit Manuf. 2021;47(1):102336. doi:10.1016/j.addma.2021.102336. [Google Scholar] [CrossRef]
9. Ammer R, Markl M, Ljungblad U, Körner C, Rüde U. Simulating fast electron beam melting with a parallel thermal free surface lattice Boltzmann method. Comput Math Appl. 2014;67(2):318–30. doi:10.1016/j.camwa.2013.10.001. [Google Scholar] [CrossRef]
10. Afazov S, Roberts A, Wright L, Jadhav P, Holloway A, Basoalto H, et al. Metal powder bed fusion process chains: an overview of modelling techniques. Prog Addit Manuf. 2022;7(2):289–314. doi:10.1007/s40964-021-00230-1. [Google Scholar] [CrossRef]
11. Wriggers P, Avci B. Discrete element methods: basics and applications in engineering. In: Modeling in engineering using innovative numerical methods for solids and fluids. Cham: Springer; 2020. p. 1–30. doi:10.1007/978-3-030-37518-8_1 [Google Scholar] [CrossRef]
12. Haeri S, Wang Y, Ghita O, Sun J. Discrete element simulation and experimental study of powder spreading process in additive manufacturing. Powder Technol. 2017;306(4):45–54. doi:10.1016/j.powtec.2016.11.002. [Google Scholar] [CrossRef]
13. Han Q, Gu H, Setchi R. Discrete element simulation of powder layer thickness in laser additive manufacturing. Powder Technol. 2019;352(2–4):91–102. doi:10.1016/j.powtec.2019.04.057. [Google Scholar] [CrossRef]
14. Nan W, Pasha M, Bonakdar T, Lopez A, Zafar U, Nadimi S, et al. Jamming during particle spreading in additive manufacturing. Powder Technol. 2018;338:253–62. doi:10.1016/j.powtec.2018.07.030. [Google Scholar] [CrossRef]
15. Parteli EJ, Pöschel T. Particle-based simulation of powder application in additive manufacturing. Powder Technol. 2016;288:96–102. doi:10.1016/j.powtec.2015.10.035. [Google Scholar] [CrossRef]
16. Fleming TG, Nestor SG, Allen TR, Boukhaled MA, Smith NJ, Fraser JM. Tracking and controlling the morphology evolution of 3D powder-bed fusion in situ using inline coherent imaging. Addit Manuf. 2020;32(3):100978. doi:10.1016/j.addma.2019.100978. [Google Scholar] [CrossRef]
17. Ogoke F, Liu Q, Ajenifujah O, Myers A, Quirarte G, Malen J, et al. Inexpensive high fidelity melt pool models in additive manufacturing using generative deep diffusion. Mater Des. 2024;245(4):113181. doi:10.1016/j.matdes.2024.113181. [Google Scholar] [CrossRef]
18. Liu N, Li X, Rajanna MR, Reutzel EW, Sawyer B, Rao P, et al. Deep neural operator enabled digital twin modeling for additive manufacturing. 2024. doi:10.3934/acse.2024010. [Google Scholar] [CrossRef]
19. Kocis L, Whiten WJ. Computational investigations of low-discrepancy sequences. ACM Trans Math Softw. 1997;23(2):266–94. doi:10.1145/264029.264064. [Google Scholar] [CrossRef]
20. Chunduri S, Ghaffari M, Lahijani MS, Srinivasan A, Namilae S. Parallel low discrepancy parameter sweep for public health policy. In: 2018 18th IEEE/ACM International Symposium on Cluster, Cloud and Grid Computing (CCGRID), 2018; Washington, DC, USA; p. 291–300. doi:10.1109/CCGRID.2018.00044. [Google Scholar] [CrossRef]
21. Derjany P, Namilae S, Srinivasan A. Parameter space exploration in pedestrian queue design to mitigate infectious disease spread. J Indian Inst Sci. 2021;101(3):329–39. doi:10.1007/s41745-021-00254-0. [Google Scholar] [PubMed] [CrossRef]
22. Li Z, Zhang Z, Shi J, Wu D. Prediction of surface roughness in extrusion-based additive manufacturing with machine learning. Robot Comput Integr Manuf. 2019;57(1):488–95. doi:10.1016/j.rcim.2019.01.004. [Google Scholar] [CrossRef]
23. Li R, Jin M, Paquit VC. Geometrical defect detection for additive manufacturing with machine learning models. Mater Des. 2021;206(9):109726. doi:10.1016/j.matdes.2021.109726. [Google Scholar] [CrossRef]
24. Wu Y, Namilae S. An artificial neural network for parametric analysis of metallic additive manufacturing using discrete element method. In: ASME International Mechanical Engineering Congress and Exposition, 2022; Columbus, OH, USA; V02BT02A003. doi:10.1115/IMECE2022-95117. [Google Scholar] [CrossRef]
25. Ng WL, Goh GL, Goh GD, Ten JS, Yeong WY. Progress and opportunities for machine learning in materials and processes of additive manufacturing. Adv Mater Deerfield. 2024;36(34):2310006. doi:10.1002/adma.202310006. [Google Scholar] [CrossRef]
26. Gunasegaram DR, Barnard AS, Matthews MJ, Jared BH, Andreaco AM, Bartsch K, et al. Machine learning-assisted in-situ adaptive strategies for the control of defects and anomalies in metal additive manufacturing. Addit Manuf. 2024;81(4):104013. doi:10.1016/j.addma.2024.104013. [Google Scholar] [CrossRef]
27. Taherkhani K, Ero O, Liravi F, Toorandaz S, Toyserkani E. On the application of in-situ monitoring systems and machine learning algorithms for developing quality assurance platforms in laser powder bed fusion: a review. J Manuf Process. 2023;99(1):848–97. doi:10.1016/j.jmapro.2023.05.048. [Google Scholar] [CrossRef]
28. Kumar D, Liu Y, Song H, Namilae S. Explainable deep neural network for in-plain defect detection during additive manufacturing. Rapid Prototyp J. 2024;30(1):49–59. doi:10.1108/RPJ-05-2023-0157. [Google Scholar] [CrossRef]
29. Kumar D, Agraharam PC, Liu Y, Namilae S. Anomaly detection for composite manufacturing using AI models. J Intell Manuf. 2024;11(19):30754. doi:10.1007/s10845-024-02522-z. [Google Scholar] [CrossRef]
30. Ukwaththa J, Herath S, Meddage DP. A review of machine learning (ML) and explainable artificial intelligence (XAI) methods in additive manufacturing (3D Printing). Mater Today Commun. 2024;41(9):110294. doi:10.1016/j.mtcomm.2024.110294. [Google Scholar] [CrossRef]
31. Sehhat MH, Sutton AT, Hung CH, Newkirk JW, Leu MC. Investigation of mechanical properties of parts fabricated with gas-and water-atomized 304L stainless steel powder in the laser powder bed fusion process. JOM. 2022;75(3):1088–95. doi:10.1007/s11837-021-05029-7. [Google Scholar] [CrossRef]
32. Balbaa MA, Ghasemi A, Fereiduni E, Elbestawi MA, Jadhav SD, Kruth JP. Role of powder particle size on laser powder bed fusion processability of AlSi10mg alloy. Addit Manuf. 2021;37(6):101630. doi:10.1016/j.addma.2020.101630. [Google Scholar] [CrossRef]
33. Phua A, Doblin C, Owen P, Davies CH, Delaney GW. The effect of recoater geometry and speed on granular convection and size segregation in powder bed fusion. Powder Technol. 2021;394(3):632–44. doi:10.1016/j.powtec.2021.08.058. [Google Scholar] [CrossRef]
34. Nath SD, Gupta G, Kearns M, Gulsoy O, Atre SV. Effects of layer thickness in laser-powder bed fusion of 420 stainless steel. Rapid Prototyp J. 2020;26(7):1197–208. doi:10.1108/RPJ-10-2019-0279. [Google Scholar] [CrossRef]
35. Nan W, Ghadiri M. Numerical simulation of powder flow during spreading in additive manufacturing. Powder Technol. 2019;342:801–7. doi:10.1016/j.powtec.2018.10.056. [Google Scholar] [CrossRef]
36. Gao X, Faria GA, Zhang W, Wheeler KR. Numerical analysis of non-spherical particle effect on molten pool dynamics in laser-powder bed fusion additive manufacturing. Comput Mater Sci. 2020;179:109648. doi:10.1016/j.commatsci.2020.109648. [Google Scholar] [CrossRef]
37. Malone KF, Xu BH. Determination of contact parameters for discrete element method simulations of granular systems. Particuology. 2008;6(6):521–8. doi:10.1016/j.partic.2008.07.012. [Google Scholar] [CrossRef]
38. Li S, Marshall JS, Liu G, Yao Q. Adhesive particulate flow: the discrete-element method and its application in energy and environmental engineering. Prog Energy Combust Sci. 2011;37(6):633–68. doi:10.1016/j.pecs.2011.02.001. [Google Scholar] [CrossRef]
39. Deng XL, Davé RN. Dynamic simulation of particle packing influenced by size, aspect ratio and surface energy. Granul Matter. 2013;15(4):401–15. doi:10.1007/s10035-013-0413-0. [Google Scholar] [CrossRef]
40. Horabik J, Molenda M. Parameters and contact models for DEM simulations of agricultural granular materials: a review. Biosyst Eng. 2016;147(2):206–25. doi:10.1016/j.biosystemseng.2016.02.017. [Google Scholar] [CrossRef]
41. Zhao Y, Koizumi Y, Aoyagi K, Yamanaka K, Chiba A. Characterization of powder bed generation in electron beam additive manufacturing by discrete element method (DEM). Mater Today: Proc. 2017;4(11):11437–40. doi:10.1016/j.matpr.2017.09.023. [Google Scholar] [CrossRef]
42. Zhang J, Tan Y, Bao T, Xu Y, Xiao X, Jiang S. Discrete element simulation of the effect of roller-spreading parameters on powder-bed density in additive manufacturing. Materials. 2020;13(10):2285. doi:10.3390/ma13102285. [Google Scholar] [PubMed] [CrossRef]
43. Zhao Y, Koizumi Y, Aoyagi K, Yamanaka K, Chiba A. Thermal properties of powder beds in energy absorption and heat transfer during additive manufacturing with electron beam. Powder Technol. 2021;381:44–54. doi:10.1016/j.powtec.2020.11.082. [Google Scholar] [CrossRef]
44. Kloss C, Goniva C, Hager A, Amberger S, Pirker S. Models, algorithms and validation for opensource DEM and CFD-DEM. Progress Computat Fluid Dyn, Int J. 2012;12(2–3):140–52. doi:10.1504/PCFD.2012.047457. [Google Scholar] [CrossRef]
45. Arévalo R, Maza D, Pugnaloni LA. Identification of arches in two-dimensional granular packings. Phys Rev. 2006;74(2):021303. doi:10.1103/PhysRevE.74.021303. [Google Scholar] [CrossRef]
46. Chen H, Wei Q, Wen S, Li Z, Shi Y. Flow behavior of powder particles in layering process of selective laser melting: numerical modeling and experimental verification based on discrete element method. Int J Mach Tools Manuf. 2017;123(1):146–59. doi:10.1016/j.ijmachtools.2017.08.004. [Google Scholar] [CrossRef]
47. Lee YS, Nandwana P, Zhang W. Dynamic simulation of powder packing structure for powder bed additive manufacturing. Int J Adv Manuf Technol. 2018;96(1–4):1507–20. doi:10.1007/s00170-018-1697-3. [Google Scholar] [CrossRef]
48. Schmid WC, Uhl A. Techniques for parallel quasi-Monte Carlo integration with digital sequences and associated problems. Math Comput Simul. 2001;55(1–3):249–57. doi:10.1016/S0378-4754(00)00268-8. [Google Scholar] [CrossRef]
49. Kolenikov S. Scrambled halton sequences in mata. Stata J. 2012;12(1):29–44. doi:10.1177/1536867X1201200103. [Google Scholar] [CrossRef]
50. Morokoff WJ, Caflisch RE. Quasi-random sequences and their discrepancies. SIAM J Sci Comput. 1994;15(6):1251–79. doi:10.1137/0915077. [Google Scholar] [CrossRef]
51. Braaten E, Weller G. An improved low-discrepancy sequence for multidimensional quasi-Monte Carlo integration. J Comput Phys. 1979;33(2):249–58. doi:10.1016/0021-9991(79)90019-6. [Google Scholar] [CrossRef]
52. Park YS, Lek S. Artificial neural networks: multilayer perceptron for ecological modeling. Develop Environ Modelling. 2016;28:123–40. doi:10.1016/B978-0-444-63623-2.00007-4. [Google Scholar] [CrossRef]
53. Sehhat MH, Mahdianikhotbesara A. Powder spreading in laser-powder bed fusion process. Granul Matter. 2021;23(4):89. doi:10.1007/s10035-021-01162-x. [Google Scholar] [CrossRef]
54. Yim S, Bian H, Aoyagi K, Yamanaka K, Chiba A. Effect of powder morphology on flowability and spreading behavior in powder bed fusion additive manufacturing process: a particle-scale modeling study. Addit Manuf. 2023;72:103612. doi:10.1016/j.addma.2023.103612. [Google Scholar] [CrossRef]
55. Ahmed N, Barsoum I, Haidemenopoulos G, Al-Rub RA. Process parameter selection and optimization of laser powder bed fusion for 316L stainless steel: a review. J Manuf Process. 2022;75(3):415–34. doi:10.1016/j.jmapro.2021.12.064. [Google Scholar] [CrossRef]
56. de Leon Nope GV, Perez-Andrade LI, Corona-Castuera J, Espinosa-Arbelaez DG, Muñoz-Saldaña J, Alvarado-Orozco JM. Study of volumetric energy density limitations on the IN718 mesostructure and microstructure in laser powder bed fusion process. J Manuf Process. 2021;64(625):1261–72. doi:10.1016/j.jmapro.2021.02.043. [Google Scholar] [CrossRef]
57. Kruse R, Mostaghim S, Borgelt C, Braune C, Steinbrecher M. Multi-layer perceptrons. In: Computational intelligence: a methodological introduction. Cham: Springer International Publishing; 2022. p. 53–124. doi:10.1007/978-3-030-42227-1_5. [Google Scholar] [CrossRef]
58. Khorasani AM, Gibson I, Ghasemi A, Ghaderi A. Modelling of laser powder bed fusion process and analysing the effective parameters on surface characteristics of Ti-6Al-4V. Int J Mech Sci. 2020;168(11):105299. doi:10.1016/j.ijmecsci.2019.105299. [Google Scholar] [CrossRef]
59. Wang P, Yang Y, Moghaddam NS. Process modeling in laser powder bed fusion towards defect detection and quality control via machine learning: the state-of-the-art and research challenges. J Manuf Process. 2022;73:961–84. doi:10.1016/j.jmapro.2021.11.037. [Google Scholar] [CrossRef]
60. Liu J, Ye J, Silva Izquierdo D, Vinel A, Shamsaei N, Shao S. A review of machine learning techniques for process and performance optimization in laser beam powder bed fusion additive manufacturing. J Intell Manuf. 2023;34(8):3249–75. doi:10.1007/s10845-022-02012-0. [Google Scholar] [CrossRef]
61. Meng L, Zhang J. Process design of laser powder bed fusion of stainless steel using a Gaussian process-based machine learning model. JOM. 2020;72(1):420–8. doi:10.1007/s11837-019-03792-2. [Google Scholar] [CrossRef]
Cite This Article
 Copyright © 2025 The Author(s). Published by Tech Science Press.
This work is licensed under a Creative Commons Attribution 4.0 International License , which permits unrestricted use, distribution, and reproduction in any medium, provided the original work is properly cited.
 Downloads
 Citation Tools