
 Submit a Paper
 Propose a Special lssue
 Open Access
ARTICLE
MLRT-UNet: An Efficient Multi-Level Relation Transformer Based U-Net for Thyroid Nodule Segmentation
1 Department of Computer Science and Engineering, RMK College of Engineering and Technology, Tiruvallur, 601206, India
2 School of Computer Science and Engineering, Vellore Institute of Technology, Chennai, 600127, India
* Corresponding Author: Kaku Haribabu. Email:
Computer Modeling in Engineering & Sciences 2025, 143(1), 413-448. https://doi.org/10.32604/cmes.2025.059406
Received 07 October 2024; Accepted 07 February 2025; Issue published 11 April 2025
 View Full Text
 Download PDF
Abstract
Thyroid nodules, a common disorder in the endocrine system, require accurate segmentation in ultrasound images for effective diagnosis and treatment. However, achieving precise segmentation remains a challenge due to various factors, including scattering noise, low contrast, and limited resolution in ultrasound images. Although existing segmentation models have made progress, they still suffer from several limitations, such as high error rates, low generalizability, overfitting, limited feature learning capability, etc. To address these challenges, this paper proposes a Multi-level Relation Transformer-based U-Net (MLRT-UNet) to improve thyroid nodule segmentation. The MLRT-UNet leverages a novel Relation Transformer, which processes images at multiple scales, overcoming the limitations of traditional encoding methods. This transformer integrates both local and global features effectively through self-attention and cross-attention units, capturing intricate relationships within the data. The approach also introduces a Co-operative Transformer Fusion (CTF) module to combine multi-scale features from different encoding layers, enhancing the model’s ability to capture complex patterns in the data. Furthermore, the Relation Transformer block enhances long-distance dependencies during the decoding process, improving segmentation accuracy. Experimental results show that the MLRT-UNet achieves high segmentation accuracy, reaching 98.2% on the Digital Database Thyroid Image (DDT) dataset, 97.8% on the Thyroid Nodule 3493 (TG3K) dataset, and 98.2% on the Thyroid Nodule3K (TN3K) dataset. These findings demonstrate that the proposed method significantly enhances the accuracy of thyroid nodule segmentation, addressing the limitations of existing models.Keywords
A thyroid gland produces hormones that help control the body’s metabolism. The thyroid gland is a little butterfly-shaped organ found in the front of the neck. The gland consists of two lobes on either side of the trachea that connect the midline tissues. Thyroid syndrome has three types: hyperthyroidism, hypothyroidism, and thyroid nodules. Hyperthyroidism occurs when the thyroid gland produces an excessive amount of hormones. A thyroid nodule is the abnormal growth of tissues in the thyroid gland that results in a lump [1–3]. Some thyroid nodules have a regular shape, whereas others are irregular. They can also be solid, cystic, or a combination of both types of nodules. Studies have shown that thyroid nodules occur in 4%–7% of the population and are classed as hypoechoic, isoechoic, or hyperechoic. Hypoechoic nodules are malignant and have irregular boundaries; they occur in 0.1% to 0.2% of the population. The imaging methods used to diagnose this condition include computed tomography (CT), magnetic resonance imaging (MRI), ultrasound imaging (USG), and radionuclide imaging (RNI) [4]. The USG is the most widely used imaging technique due to its inexpensiveness, real-time, non-invasive and non-radioactivity [5]. The presence of noises and low quality of USG images makes the tissues appear inhomogeneous and fuzzy [6]. The most essential parameters for thyroid nodule diagnosis are classified into five categories: composition, echogenicity, shape, margin, and echogenic foci. Shapes and borders of thyroid nodules are assumed to be crucial features for differentiating between benign and malignant nodules [7]. Thus, segmentation plays an important role in detecting the nodules. Inaccurate segmentation can result in an incorrect diagnosis; also, segmentation is required for estimating thyroid volume [8]. The thyroid hormone secretion rate and thyroid anomalies are assessed while calculating thyroid volume. However, it is difficult for clinicians to assess these traits without the assistance of computers [9]. As a result, thyroid gland segmentation and thyroid nodule segmentation methods are necessary to promote the study of thyroid disease diagnoses. It provides valuable information for clinicians to make the best possible diagnostic decisions [10].
Moreover, modern methods are available for the examination of ultrasound images on thyroid cancer analysis. A CAD system was designed to use only direction-independent structures [11]. Also, machine learning models (ML) such as Support Vector Machine (SVM) and Random Forest (RF) classifiers were applied to differentiate nodules within malignant as well as benign classes [12]. Also, feature extraction, pre-processing, and segmentation are employed to improve the categorization accuracy of the nodules and get accurate analysis [13]. The CA approaches for diagnosing thyroid cancer have advanced, allowing radiologists to investigate crucial aspects of Ultra Sound Sonography (USG) images. It depends on digital image-producing techniques such as image improvement, segmentation, and feature extraction [14]. The survey was conducted by categorizing each characteristic using multi-layer perception Multi-Layer Perceptron (MLP) and Support Vector Machine (SVM) however, identifying some risk of malignancy in USG thyroid images is crucial [15].
Thus, the Thyroid Imaging Reporting Based Data System (TI-RADS) is recommended for stratifying the predictable risk of cancer in thyroid nodes. The understanding of USG imaging is still exciting and depends wholly on the knowledge of radiologists [16,17]. Finally, CAD schemes are essential to diagnosis. The most widely used ML method is deep learning (DL) models. DL has seen success within the area of image prediction through the development of varied neural networks. DL models made important advances in interpretation, segmentation, localization and classification, including thyroid nodules [18,19]. DL approaches affect developments in graphics processing components’ calculating capacity, allowing for the development of larger and composite neural networks capable of segmenting ultrasound images over many anatomies. Recently, convolutional neural network (CNN) [20], graph neural network (GNN) [21], transformer networks [22], multi-view deep learning [23] and UNet [24] models are widely used for thyroid nodule segmentation and detection. Real-time application is possible with DL approaches since they do not require a kernel model for extrapolation time in the range of milliseconds [25]. The DL approaches are not only suitable for thyroid nodule segmentation, which can also be utilized for lung and liver nodule segmentation [26–29]. The Deep dual-patch attention mechanism (D2PAM) for classifying the pre-ictal signal of people with Epilepsy based on the brain signals which was developed for Epileptic seizure prediction. An innovative multi-modal fusion-based approach named Dual-3DM3-AD was developed for classifying the early multi-class Alzheimer’s diagnosis These are the deep learning used from other domain for efficient classification process.
Thyroid cancer is currently considered the wildest rising malignancy in the world. Ultrasound is the main tool for evaluating thyroid nodules. However, due to the overlapping features of malignant and benign thyroid nodules, the ultrasound images are complex and vary. Many CAD systems have recently been introduced to assist clinicians in diagnosing conditions, particularly preliminary cutting and nodule discernment. Furthermore, advanced methods for determining whether a thyroid nodule is benign or malignant have been enabled by precise medical instruments. However, because of its low cost and high sensitivity, ultrasonography has been widely employed in biomedical imaging for a variety of applications such as diagnosis, nodule detection, post-operative evaluation, and so on. This paper presents a novel multi-scale vision transformer-based approach, MLRT-UNet that introduces significant advancements in feature extraction, multi-scale fusion, and context modeling for image segmentation tasks. The key contributions of this work are as follows:
• This paper introduces a new Relation transformer to replace the traditional encoder structures in U-Net. It captures both local and global features at multiple scales using self and cross attention mechanisms, overcoming the limitations of conventional methods that struggle with long-range dependencies.
• The model uses a multi-scale patching strategy. The input image is pre-processed with a Fast Bilateral Filter (FBF) to preserve details, then split into patches at both large and small scales. These patches are processed simultaneously by the Relation transformer, allowing the model to handle both fine local details and broader global context, improving performance on tasks with varied object sizes.
• The paper introduces Co-operative Transformer Fusion (CTF), a new method to combine features from different scales. The Co-operative Transformer Fusion (CTF) module allows these multi-scale features to interact and merge effectively, helping the model learn strong, context-rich features that improve segmentation performance, especially in complex scenarios.
• The Relation transformer is also used in the decoder to preserve global context during upsampling. This ensures that the long-range dependencies learned in the encoder are maintained, leading to better pixel-level predictions and higher-quality segmentation, even in complex areas.
• To evaluate the performance of the proposed model in terms of different evaluation metrics and determine the superiority against existing methods.
The remainder of the paper is organized as follows: Section 2 includes of existing approaches. Section 3 contains the proposed methods used in this study. Section 4 contains performance measures and evaluation metrics used in this proposed work are mentioned in this part. Section 5 provides the conclusion and future study.
Gong et al. [30] presented Thyroid Region prior guided Feature Enhancement network (TRFE) or the segmentation of thyroid nodules. A multi-task learning-based network segments the regions of the thyroid gland and nodules. A prediction task was performed using an encoder to avoid over-fitting and thus be aware of nodule size. Feature enhancement was done to build a relation between nodule and gland feature maps. After that, the normalization of features to alleviate variations in training and testing data collected from different sources. Finally, the performances in terms of accuracy, precision, recall, F-score, etc.
Abdolali et al. [31] adopted deep convolutional neural network-based thyroid nodule detection from ultrasound imaging. This model was used to regularize the loss functions and hyperparameters in order to address the issues of detecting nodules from USG scans. Training and testing on datasets with high variability. Thus, the created model regularizes the loss function and prioritizes detection over-segmentation. The different types of thyroid nodules are predicted using the model, and the performances in terms of accuracy, precision, and recall are evaluated, respectively.
Shahroudnejad et al. [32] introduced rule-based and Deep Convolutional Neural Network (DCNN)-based methods to segment and categorize thyroid nodules. Thyroid node ordering necessitated an exact description of the node border, which was both difficult and time-consuming. Thus, involuntary nodule boundary subdivision was required, which was intriguing given the wide range of nodule arrivals, shapes, and sizes. This method uses a residual dilated UNet algorithm to separate nodules. The model’s output is sent into a rule-based categorizer, which classifies the composition and echogenicity of the segmented nodes.
Nie et al. [33] utilized an N-Net model for the segmentation of thyroid glands. The model N-shaped dense, fully convolutional neural network is made up of three mechanisms: a multi-scale inner block that constructs the image pyramid, an attention-based management component for filtering the features, and a stackable dilated convolution block that serves as the backbone network to capture deep semantic features. The model was evaluated using the TNUI-2021 dataset as well as the Digital Database Thyroid Image (DDTI) database, and performance was measured in terms of accuracy, precision, and recall.
Abbasian Ardakani et al. [34] presented a hybrid multi-layer filtering approach for thyroid nodule segmentation using ultrasound images. The speckle noise was the main component that affected the USG image contrast. The use of appropriate filters reduces noise and improves performance. Twelve filters were selected from the best filter utilized for accurately segmenting the nodules. The Receiver Operating Characteristic Curve (RoC) properties were examined, and ten morphological parameters were measured from the segmented regions to assess the performance.
Xiang et al. [35] developed a multi-attention guided UNet (MAUNet) for thyroid nodule segmentation to overcome the issues of varying sizes and position of nodules. In this technique, a multi-scale cross attention (MSCA) module for the initial image for feature extraction. The impact of thyroid nodule size and shape on segmentation was obtained by integrating the interaction between features at various sizes. Finally, a dual attention (DA) module incorporated into the skip-connection step of UNet network, which enhance the fusion between encoder and decoder.
Yan et al. [36] developed the Cold SegDiffusion for general medical image segmentation based on the diffusion-model. In this technique, the contrast enhancement module was used to translate feature into frequency domain and the conditional cross-attention module utilized the conditional encoder. The cross attentional weights were used to enhance the essential features of segmentation encoder output. This technique achieves higher IoU for Thyroid Nodule as 75.35%.
Liu et al. [37] developed a shape-margin knowledge augmented network (SkaNet) for thyroid nodule segmentation and diagnosis. This technique shared visual features in feature extraction stage due to the similarity in visual features between segmentation and diagnosis. Then, a dual branch architecture was used to perform thyroid nodule segmentation and diagnosis tasks. An exponential mixture module was devised to enhance the effective discriminative features. A knowledge-augmented multi-task loss function with a constraint penalty term was used to optimize the SkaNet model by integrating the shape and margin features through numerical computation.
In recent years, deep learning methods have made remarkable breakthroughs and achievements in the field of computer vision. Inspired by the widely used deep learning techniques, many scholars applied deep learning to segment the thyroid nodules. For example, Lin proposed a new two-stage framework based on super-resolution reconstruction to suppress noise and improve image quality, and added a new parallel atrous convolutional module to the proposed N-shape network to extract multi-scale semantic feature maps to improve the segmentation accuracy of thyroid nodules [38].
Ma et al. [39] presented TNSeg, a novel framework created especially for the segmentation of thyroid nodules. A segmentation block and a discriminative block are two essential parts of TNSeg, which also makes use of adversarial training. Specifically, a fully convolutional decoder with skip connections is used by the discriminator to effectively distinguish between simulated and genuine data. Additionally, a new multi-scale joint loss function was presented for adversarial training using a balanced sampling approach, which successfully addresses the challenges of computational redundancy and foreground-background distinction. The segmentation performance of TNSeg is impacted by the use of adversarial training, which can be challenging to stable and result in mode collapse or disappearing gradients.
Lin et al. [40] designed a new Dual Swin Transformer U-Net (DS-TransUNet) model for performing image segmentation process using medical images. The developed model involved the benefits of hierarchical swin transformer with U-Net structure in which semantic segmentation is performed. Because of adopting dual-scale encoder sub-networks, the utilized model fetched fine-grained feature information with multiple semantic scales. Also, the global dependencies among features with multiple scales are attained with the aid of a self-attention layer. Finally, the long range contextual information are obtained in the up-sampling stage. Thus, the utilized model effectively segments the given medical images. The experimental results show the strength of developed model however computational complexity is the major issue faced by this study.
The automatic segmentation of thyroid nodules [41] developed a STU3Net model. The model employs a modified swin transformer combined CNN with an encoder and three-layer U-Net network. The STU3Net performance evaluation using two datasets such as N3K and BUSI datasets achieved higher Dice scores of 0.8368 and 0.7416, respectively. However, the limitation of STU3Net model was reliance on high-quality annotated datasets for training and validation. Table 1 shows the comparison of existing approaches.
Numerous neural networks based on ultrasound images are constantly emerging and have made great advances in the field of thyroid nodule segmentation as a result of the rapid expansion of DL. However, the structure of malignant thyroid nodes is inherently complicated, posing extra challenges for existing networks. By surveying several existing methods like DCNN, ResDUnet, DSRUNet and STU3Net, it clear that segmenting thyroid nodule is becoming more critical because of the requirement of large annotated dataset, higher resource demands, reduced generalizability, overfitting issues, etc. Furthermore, the inherent limits of CNN-based networks prevent the creation of relationships between distant pixels. Because of issues like inherent complex structures or confusion with surrounding tissues, malignant thyroid nodule segmentation remains a challenging task even though significant progress in recent years. Thus, it is important to design a novel technique by adopting attention mechanism along with deep learning for handling complex features and reducing memory overhead. Thereby, the proposed work focuses on a novel deep learning-based transformed technique to help clinicians for diagnosing thyroid diseases without any complexities.
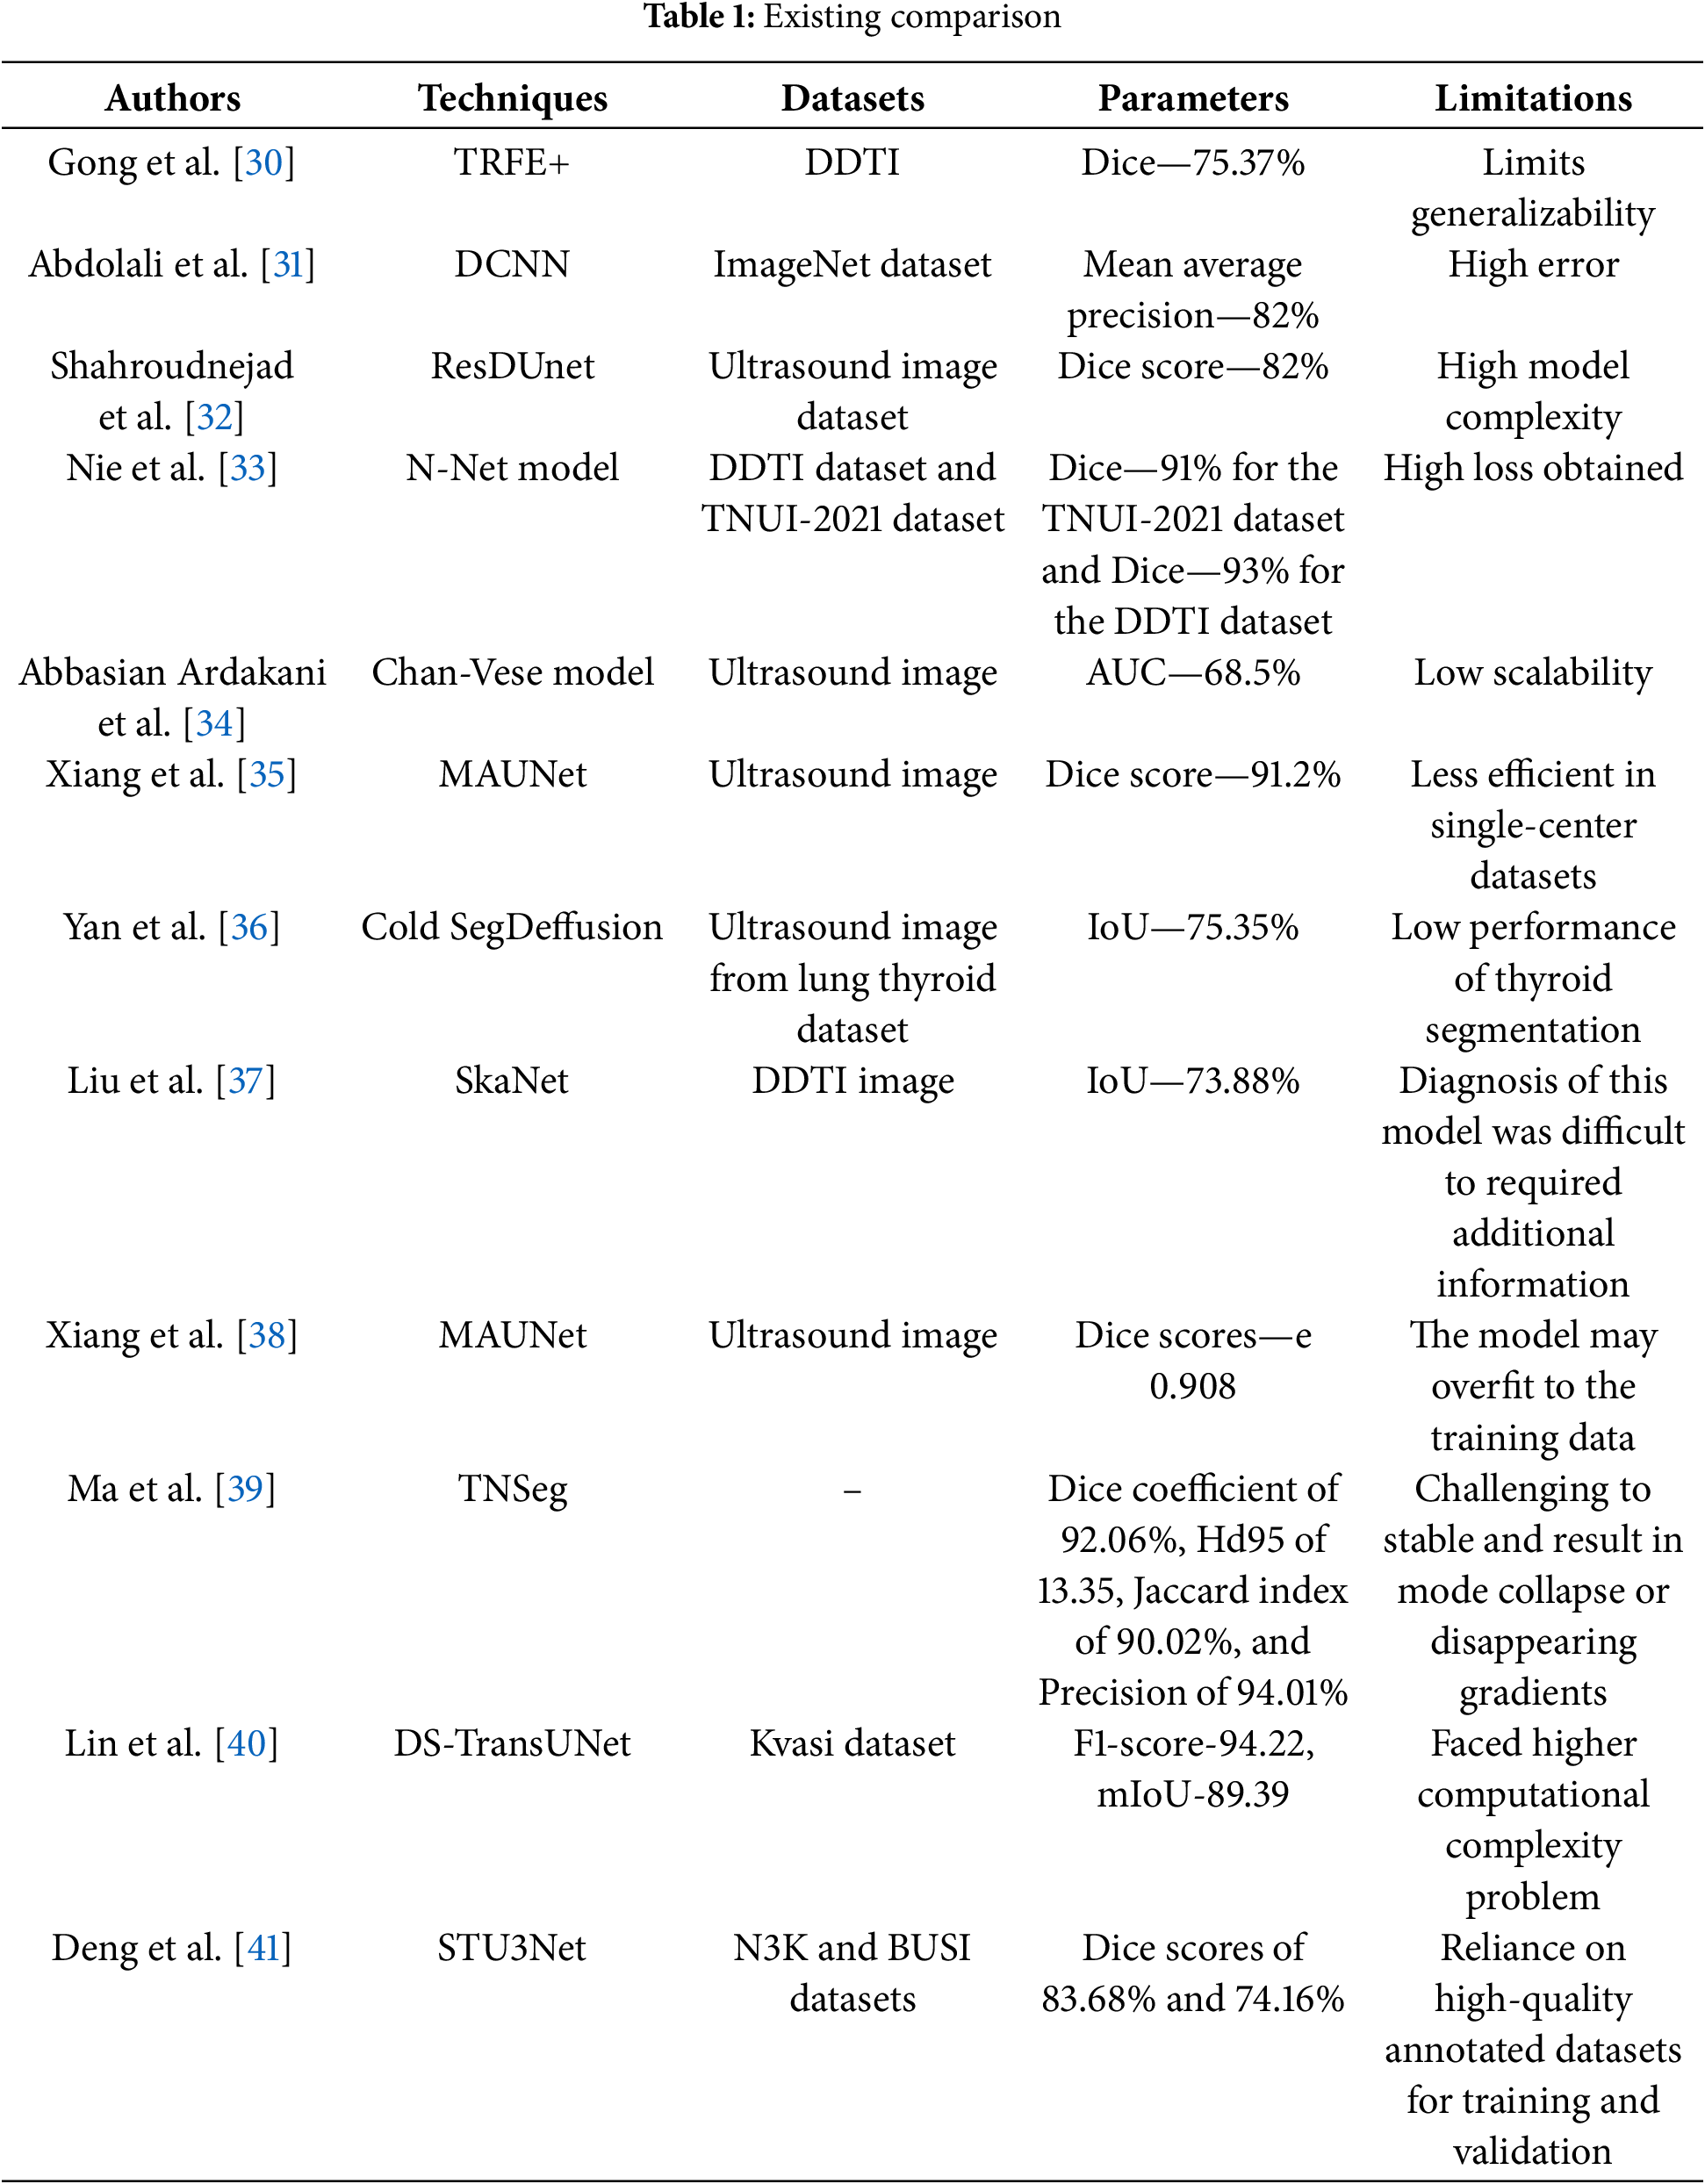
Convolutional Neural Networks (CNNs) have expanded their popularity within a number of applications related to medical image subdivision during the past few decades. Convolution layer stacking and down sampling increase local interaction and enhance the receptive field, but they also complicate the model and increase its vulnerability to overfitting, making it a suboptimal choice. Although CNN-based algorithms have significantly improved the effectiveness of thyroid nodule segmentation, they are not as better at uncovering the long-range contextual information concealed in ultrasound images that is required to fully recognize thyroid nodules. Later on, a number of efficient transformer-based models were proposed to determine the contextual relationships of local information. Fig. 1 shows the architecture of the proposed method.
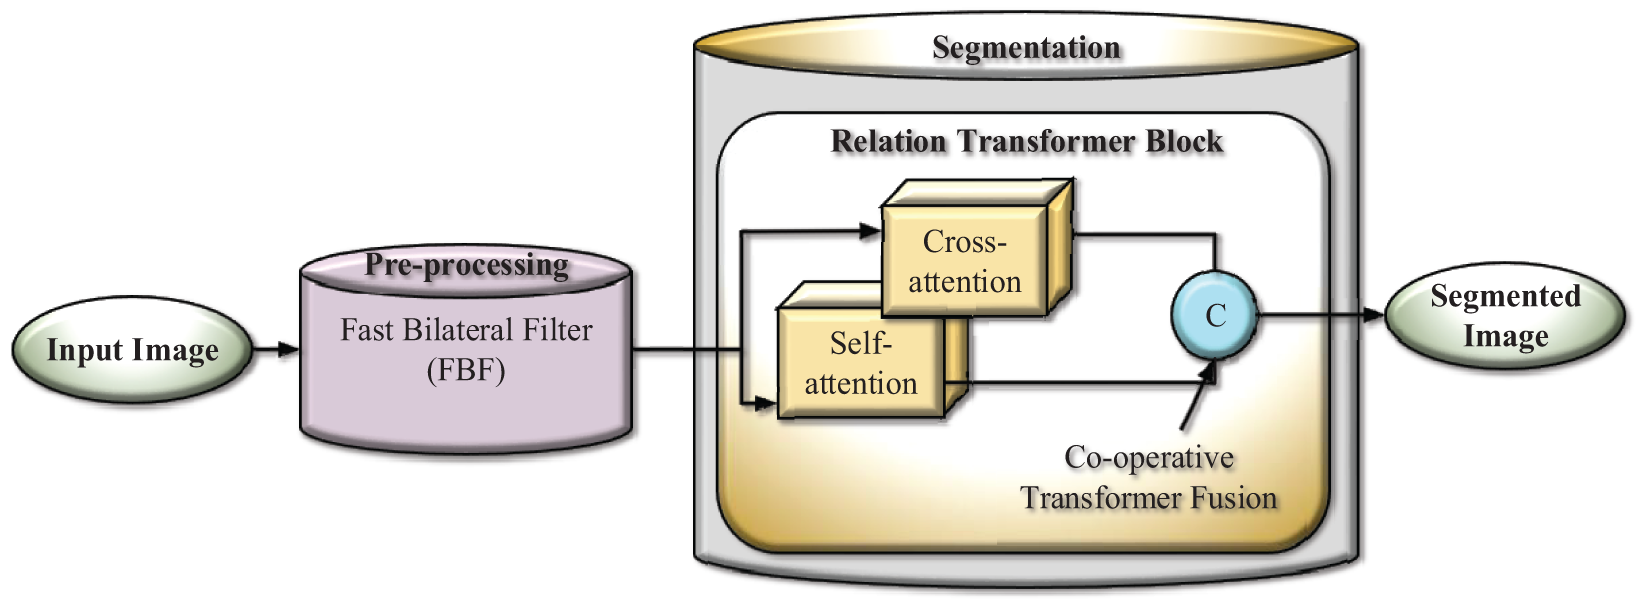
Figure 1: Block diagram of the proposed method
Normally, the multi-scale feature performances could improve the presentation of vision modifiers; however, they were infrequently employed within image segmentation tasks. In this work, pre-processing is done using an adaptive filter, and it will split into large and small overlapping patches. After pre-processing, features are segmented using a Relation transformer. Relation transformers contain self and cross-attention modules for segmentation. The segmented images are then supplied into the concatenation component, which fuses self and cross-attention and produces the segmented image.
3.1 Pre-processing Using Fast Bilateral Filter
Unlike Gaussian filtering, which smoothens uniformly, FBF respects edges in the image by weighting the influence of neighboring pixels based on both spatial and intensity similarity. This property is crucial in segmentation tasks where preserving boundary details is essential. On the other hand, anisotropic filtering reduces noise while preserving edges by iteratively diffusing the image guided by local gradients. However, this filter is computationally intensive and requires careful tuning of parameters to avoid over-smoothing or under-smoothing. But, the utilized FBF is well-suited for real-time or large-scale segmentation tasks with complex textures. FBF effectively reduces noise in homogeneous regions while keeping important structural details intact, leading to cleaner segmentation results. FBF preserves image edges while smoothing them, which is useful for pre-processing tasks such as texture retention and noise reduction. The conventional bilateral filter [42] uses a Gaussian kernel for range and domain filtering and is represented in generalized form as follows:
In order to reduce the computing complexity, numerous academics have proposed improving bilateral filters, as the above equation takes
After removing the higher-order terms and expanding the exponential terms with a Taylor series, the preceding statement can be broadly expressed as follows:
The fast bilateral filter performs better than the bilateral filter, which concerns performance metrics and the computing complexity of the aforementioned formula is
3.2 Segmentation Using Relation Transformer
The proposed network is built on the well-established U-Net architecture, which is widely used for medical image segmentation tasks. To improve the feature representation capabilities beyond the original U-Net, the model integrates a Relation Transformer block and a novel combination of Co-operative Transformer Fusion (CTF) within the system. The Relation Transformer block is incorporated into the decoder to enhance feature extraction and allow the model to capture both local and global features. To better bridge the semantic gap between the encoder and decoder, a gated attention module is introduced in the skip connections. This module helps the model efficiently use feature representations from various levels of the network. After upsampling in the decoder, another CTF module is applied to further refine and fuse feature maps, improving the quality of the segmentation output. The core building block of the decoder is the MLRT-UNet, which serves to increase the receptive field and generate more precise, dense predictions. Specifically, for thyroid nodule segmentation, the proposed model employs a multi-level relation transformer-based U-Net, which combines the Relation Transformer module with the CTF mechanism to enhance the feature learning process and optimize the segmentation performance.
When compared to traditional models like TransUNet and other transformer-based U-Net models, the proposed multi-level relation transformer-based U-Net (MLRT-UNet) demonstrates higher efficiency and performance. The two attention blocks within the Relation Transformer module allow the model to effectively capture both local and global features, thus reducing the overall complexity of the network while improving feature representation. In contrast, the TransUNet struggles to learn rich, meaningful features due to its complex architecture, making it less suitable for handling the variability present in thyroid nodule images. Additionally, the multi-level relation transformer-based U-Net can better learn and integrate relationships between features at various levels in the network. Previous transformer-based U-Net models often fail to bridge feature gaps effectively due to their inherent complexity and the inability to integrate multi-level features seamlessly. The CTF mechanism in the proposed model not only helps in aggregating multi-level features but also mitigates computational complexity issues, all while maintaining the ability to model global relationships efficiently.
3.2.1 Relation Transformer Block
The Relation Transformer Block (RTB), which is used to capture intra-class addictions between lesions as well as inter-class interactions between lesions and blood vessels, is designed with both a cross-attention head and a self-attention head. RTB effectively combines local and global attention to detect objects of varying sizes across scales. Hierarchical self-and cross attention allows detailed refinement of image regions while maintaining global coherence. Three trainable linear embeddings are used as the query, key, and value generators
where the self-attention as well as external-attention heads are indicated by the subscripts
The term
here,
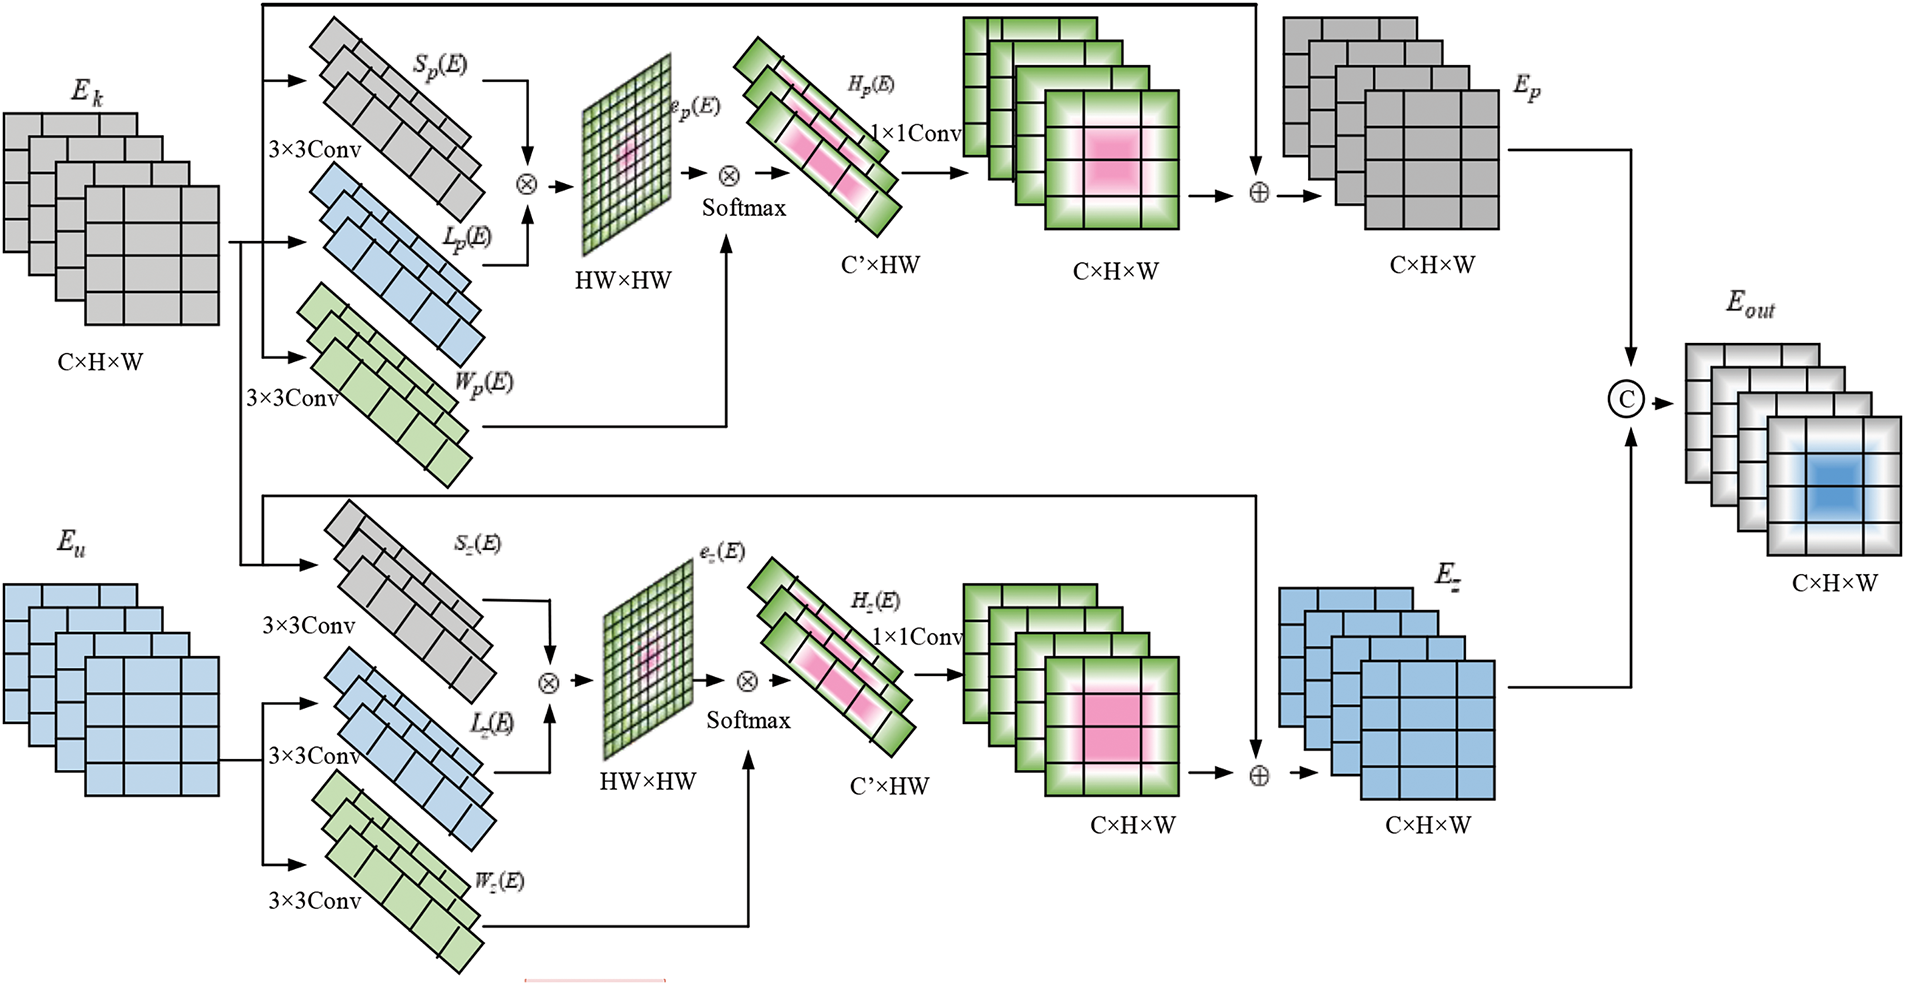
Figure 2: Block diagram of relation transformer
3.3 Fusion Using Co-Operative Transformer Fusion (CTF) Module
To combine both self and cross-attention output features by combining the co-operative Transformer Fusion technique.
The Transformer Co-operative Fusion (TCF) module aims to enhance communication between multi-scale features, significantly improving segmentation performance. Fig. 3 shows the block diagram of the Transformer Co-operative Fusion module.
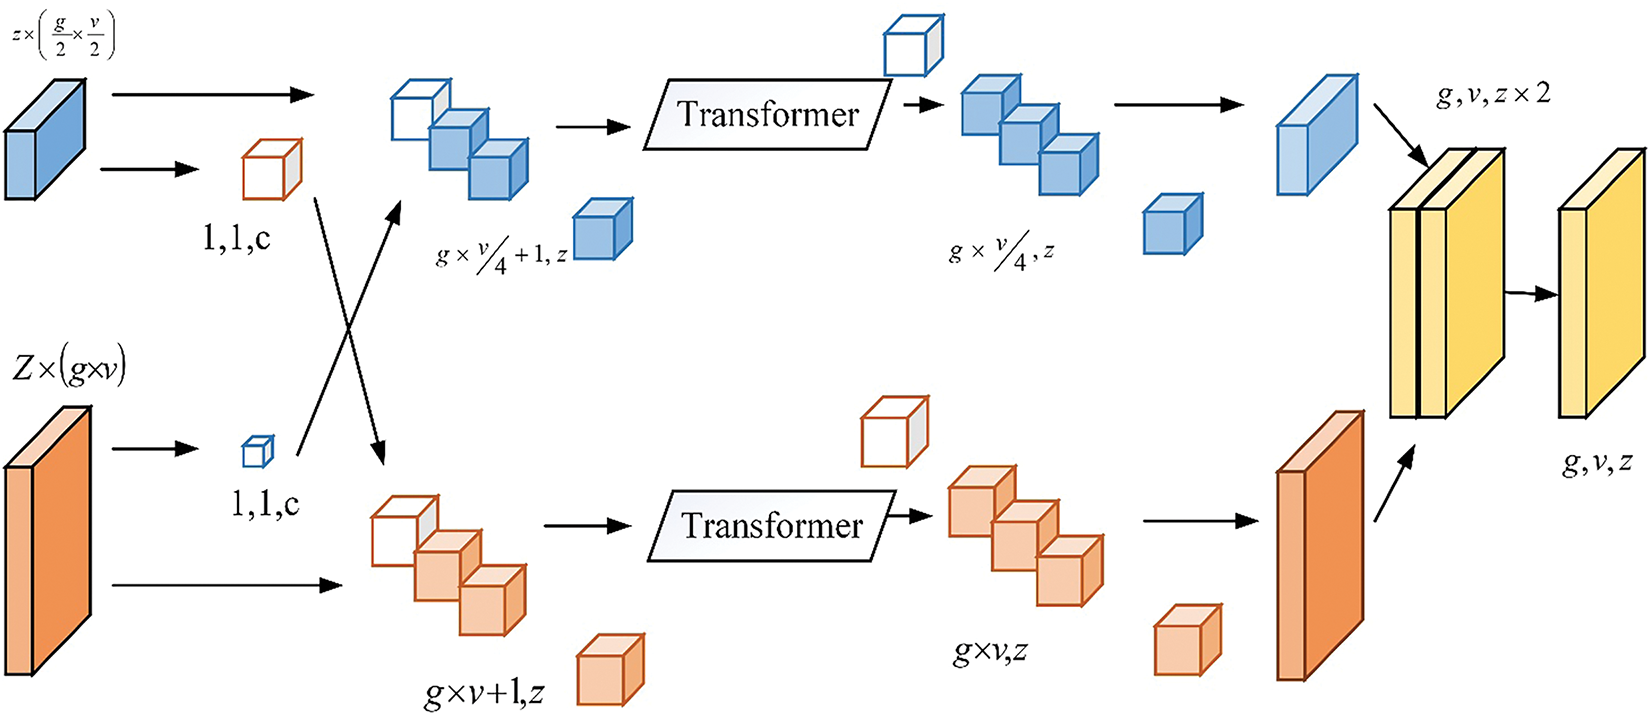
Figure 3: Transformer co-operative fusion
The suggested TCF can incorporate features from self-affection and cross-attention features. The procedure is the same for both self and cross-attention features; choose the CFT for the proposed study in the section below. More specifically,
where
where
here,
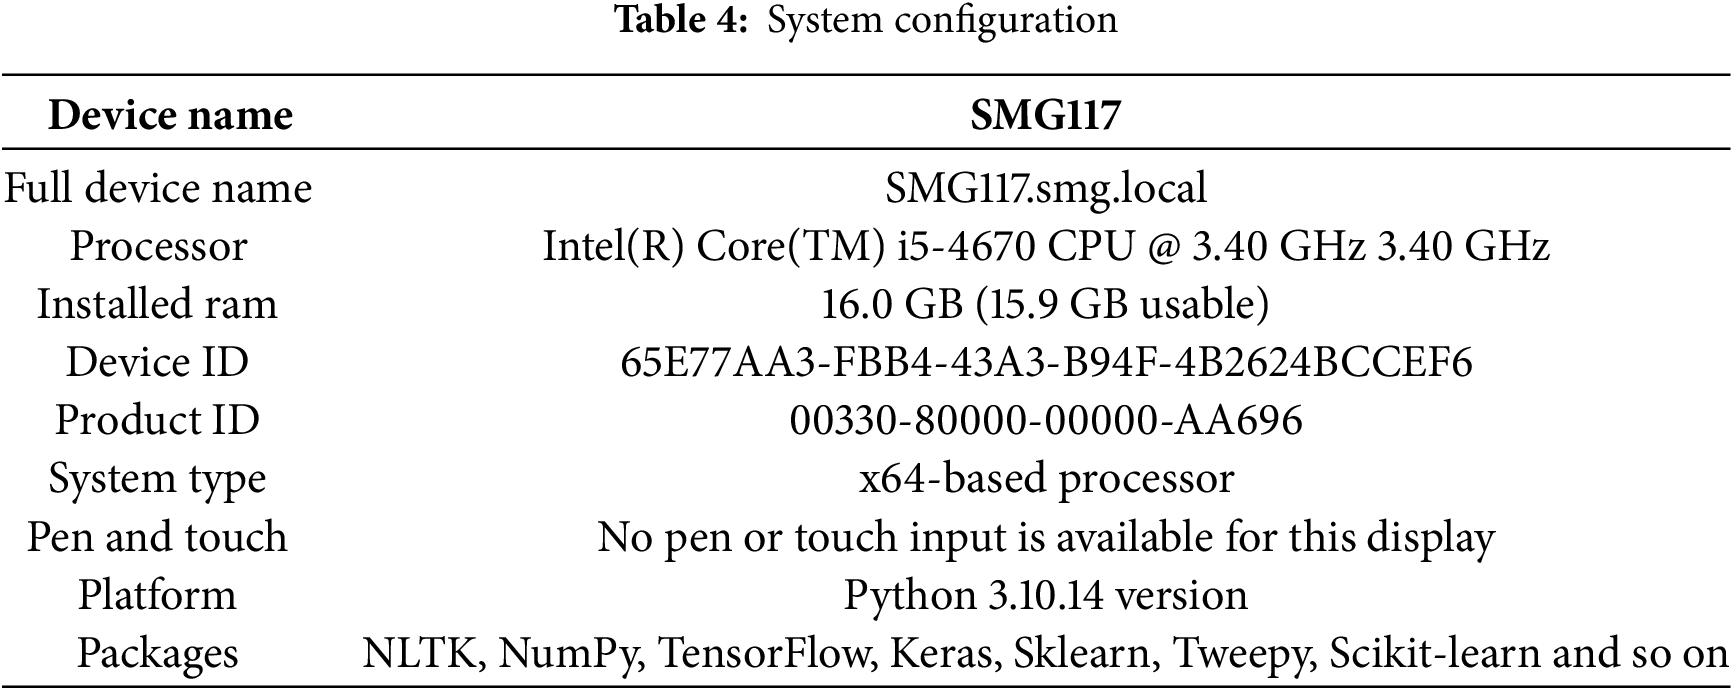
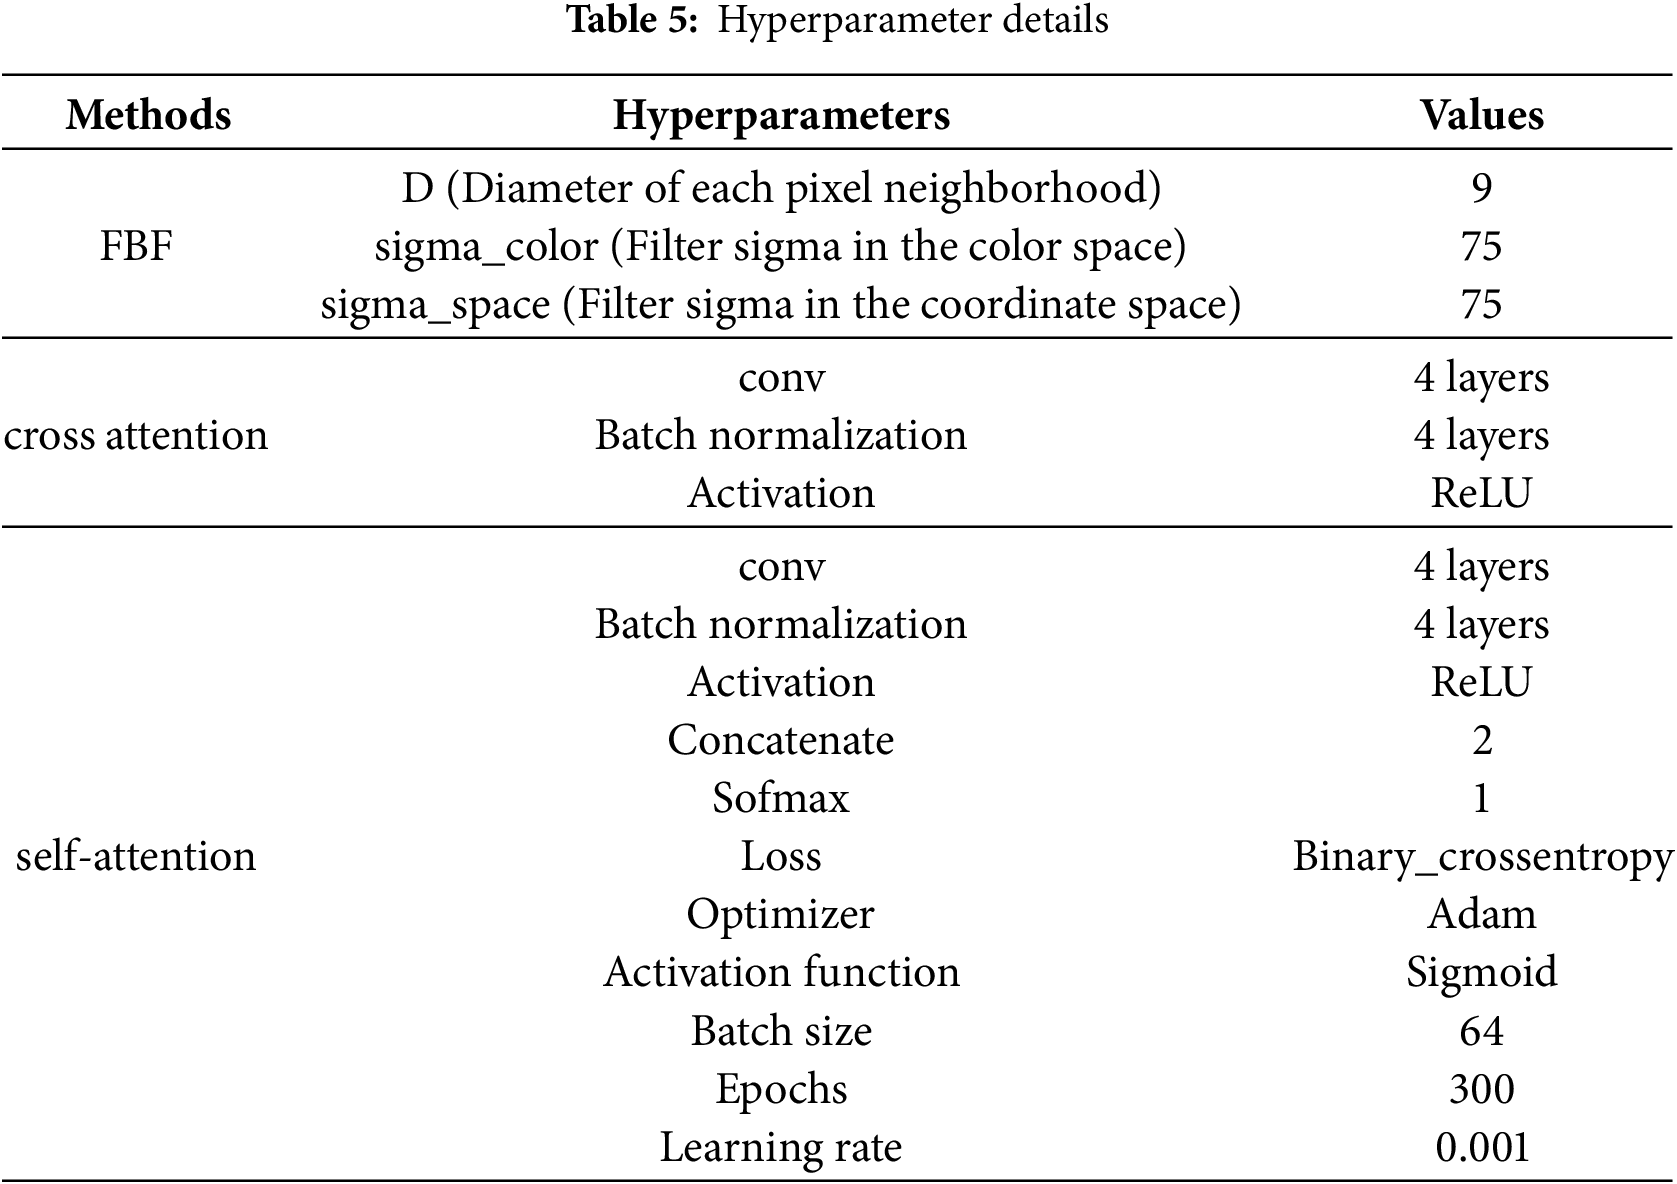
The performance evaluation of the proposed study is mentioned in the result and discussion part. The proposed technique was performed in the Python platform and 16.0 GB memory. Here the proposed technique utilized 1 GB of memory to perform the proposed technique across three datasets. Usually, the dataset is split into training and testing an 80:20 ratio. Here, 80% of the data from three datasets was used to train the model and 20% data was used for the testing process. Table 4 shows the system configuration and Table 5 represents hyperparameters details.
The proposed dataset have utilized three datasets like DDT1, TG3K and TN3K, which are collected from same source https://github.com/xianlin7/SAMUS (accessed on 6 February 2025). These dataset includes two classes, here class 0 represents as benign and class 1 represents malignant.
DDTI—The thyroid nodule dataset includes 637 ultrasound images that have been annotated pixel by pixel. Here, 573 samples are obtained for training and 64 for testing.
TG3K—The database collection contains 3585 ultrasound images from Zhujiang Hospital, South Medical University, that have been carefully annotated for thyroid nodules. The technique divides the TG3K dataset into subsets of 3226 and 359 images for training and testing, respectively.
TN3K—The dataset contains 2879 original images; from that, 2591 were taken for training, and 288 were taken for testing.
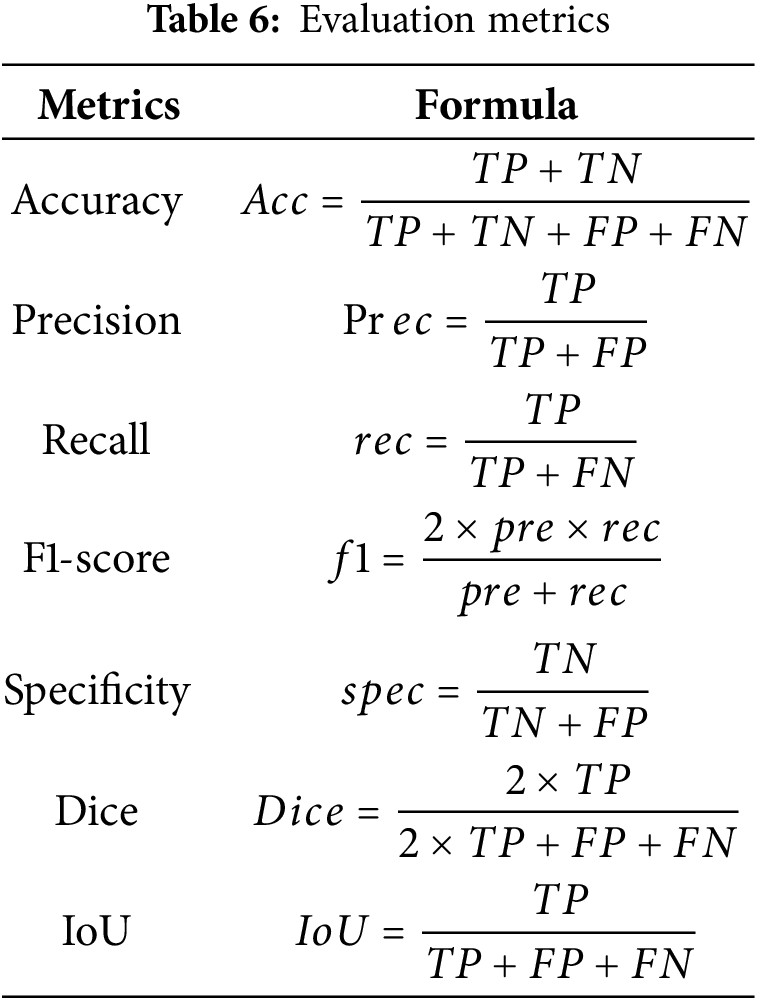
Some of the evaluation criteria employed for the proposed method include accuracy, precision, recall, Dice score, intersection over union (IoU), specificity, and so on. Table 6 shows the evaluation metrics. Where in Table 5, TP is denoted as the true positive, TN is denoted as the true negative, FP is denoted as the false negative, and FN is denoted as the false negative.
4.3 Performance Evaluation and Comparison Analysis
The performance evaluation and comparison analysis of the proposed technique with other current techniques like U-Net, TransU-Net, Transfuse and Self fuseU-Net are used in this section. Fig. 4 shows the comparison graph of the proposed along with the existing technique.
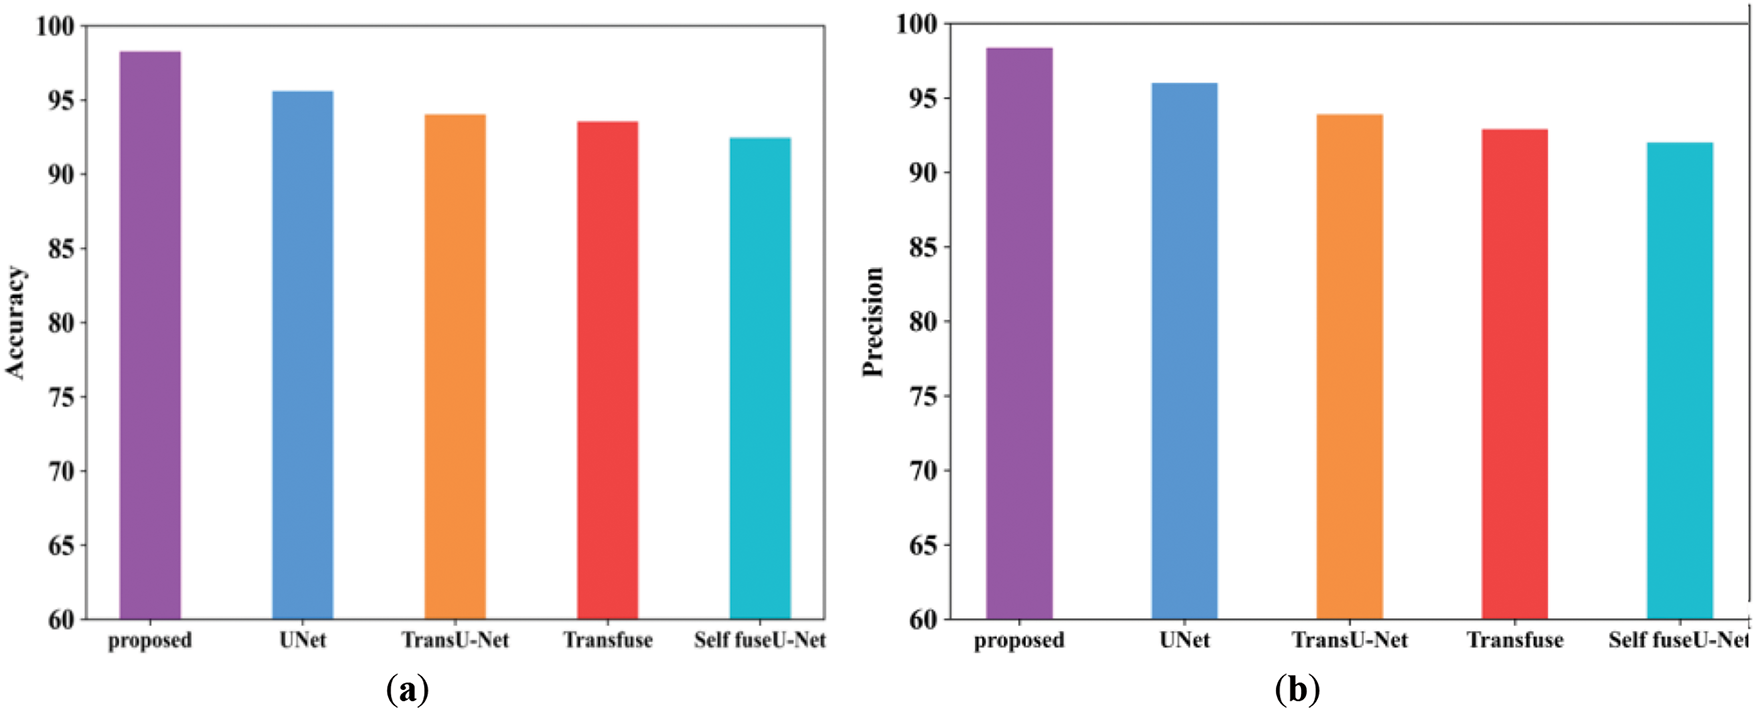
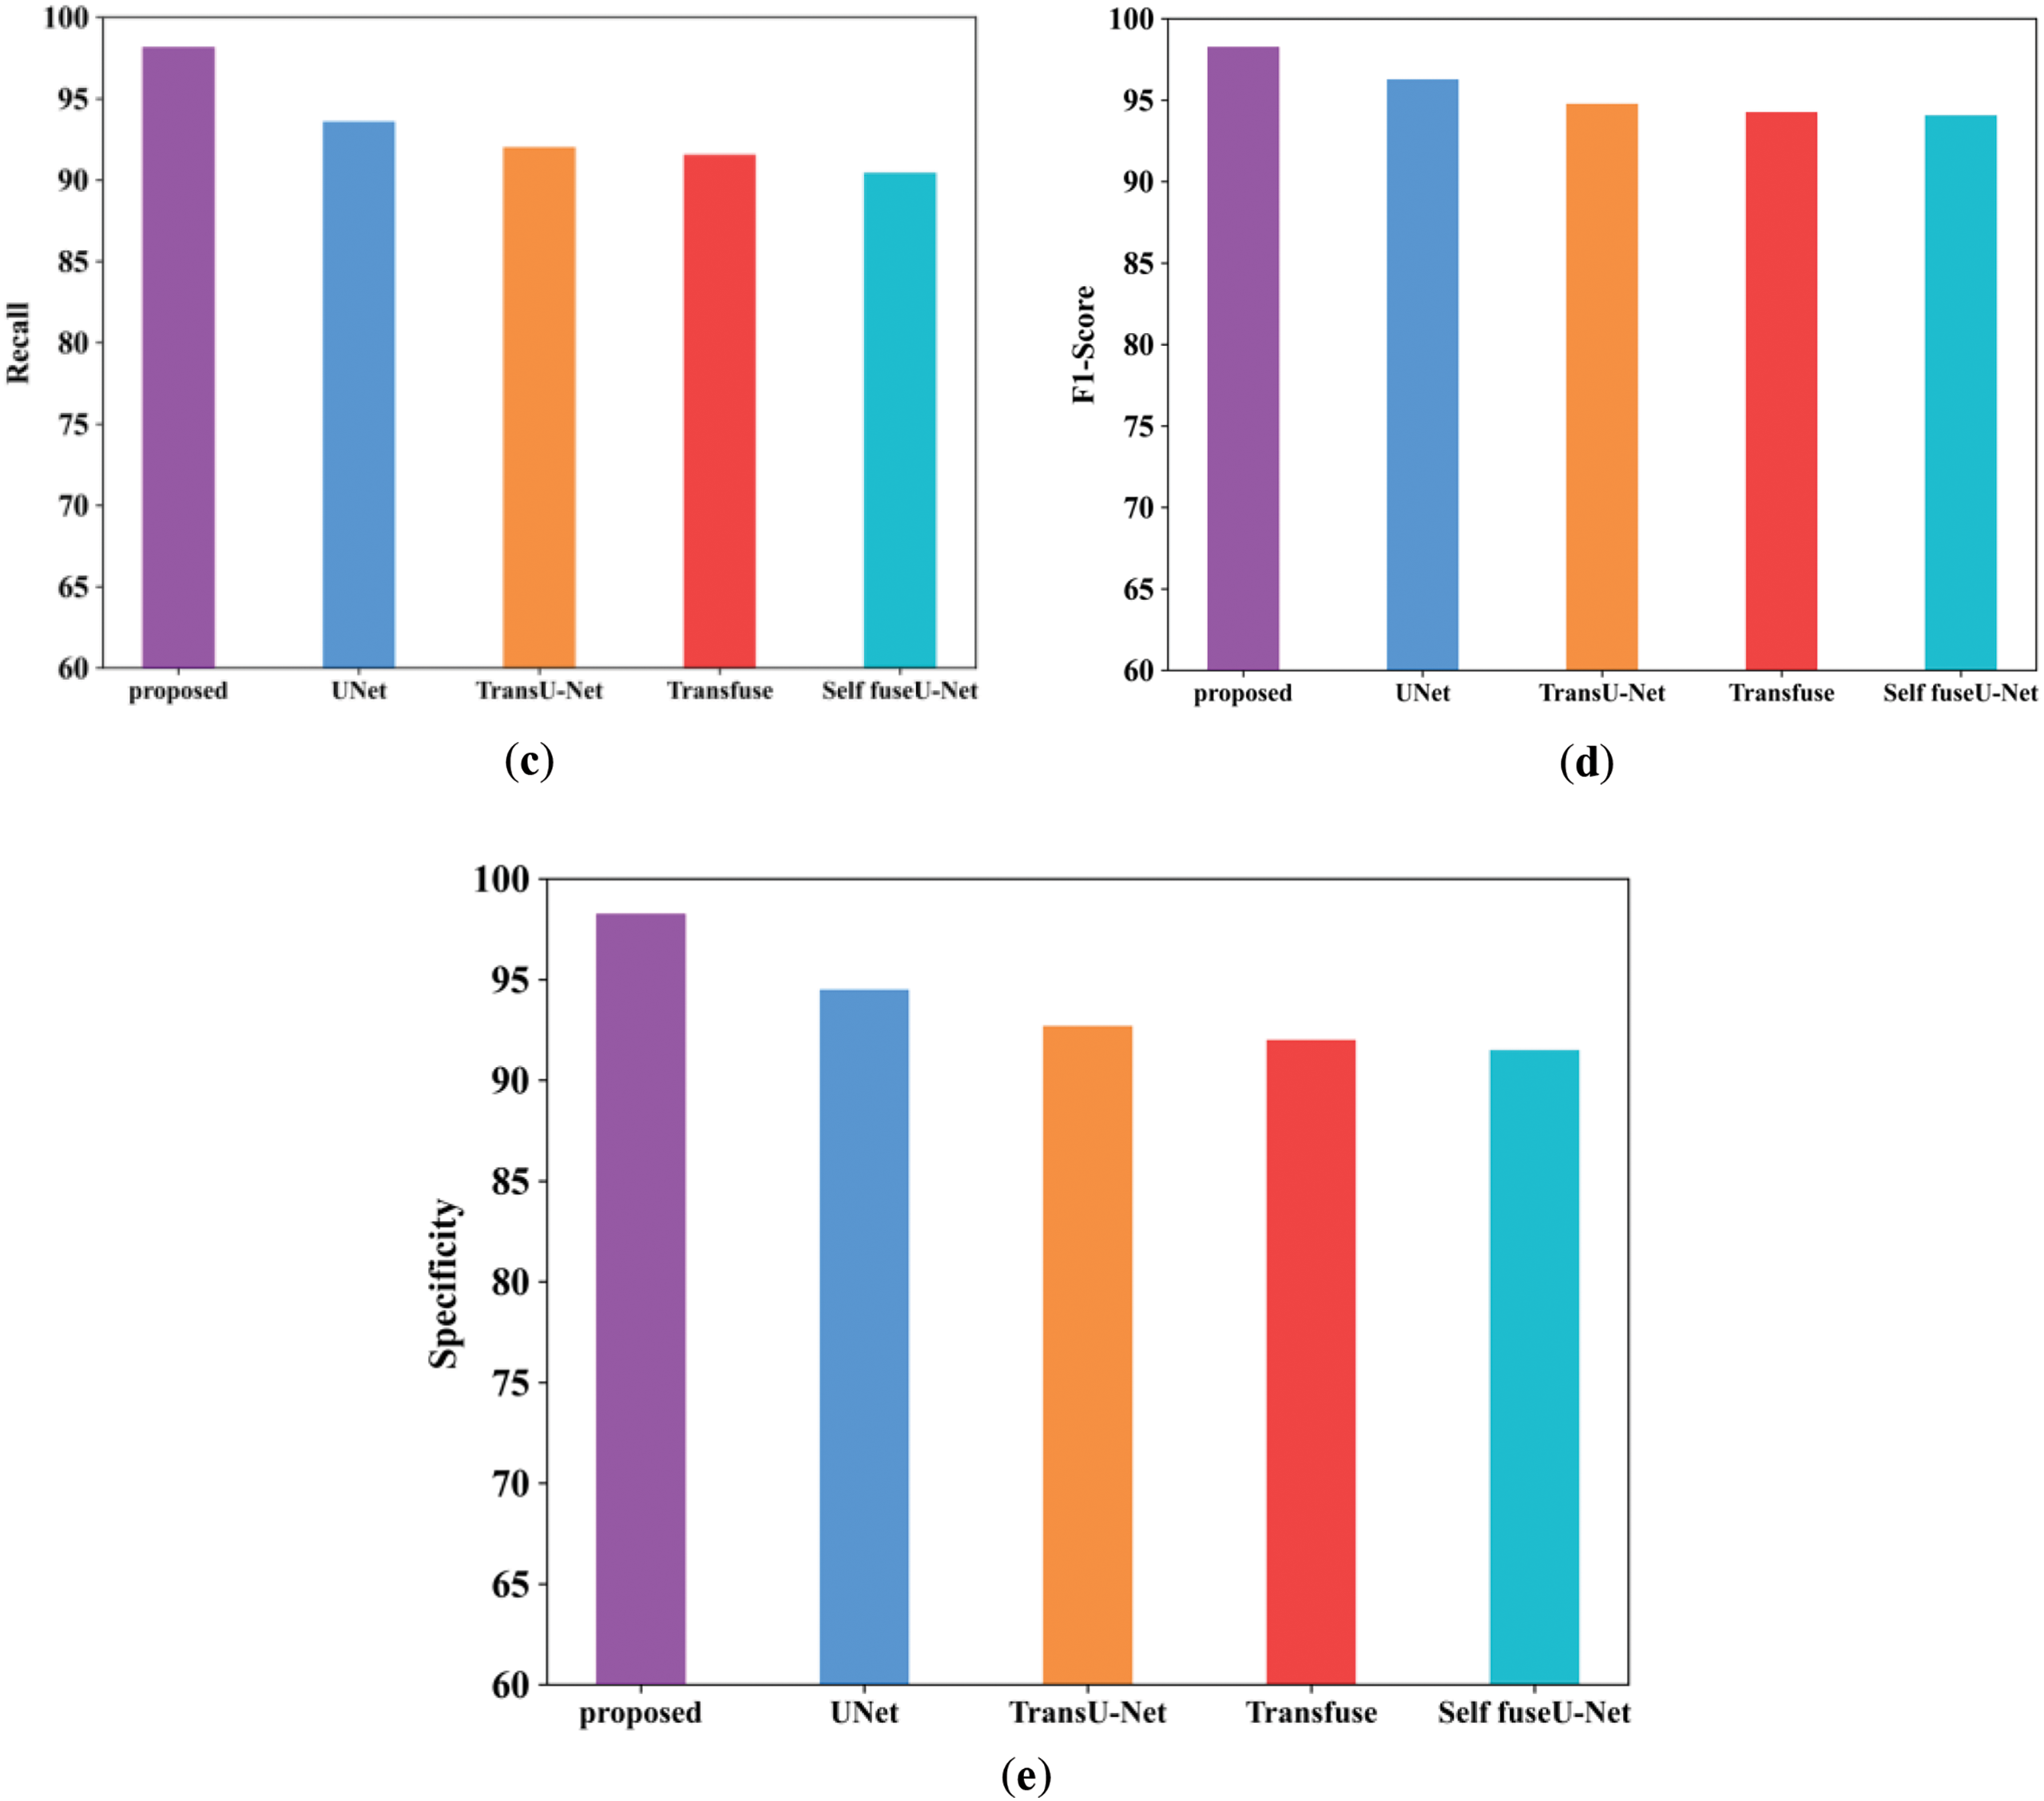
Figure 4: Comparison examination of existing with the proposed approach. (a) Accuracy; (b) Precision; (c) Recall; (d) F1-score; (e) Specificity
Fig. 4a shows the accuracy performance comparison of proposed and varied existing methods like UNet, TransU-Net, Transfuse and Self fuseU-Net. Accuracy is used to assess the effectiveness of deep learning fundamental applications. As compared with other existing methods, the accuracy range attained by the proposed technique is increased as 98.2%. Similarly, the proposed technique has attained a precision range of 98.3% and is shown in Fig. 4b. Because of the reduced efficiency of existing models, the precision performance is get reduced. On the other hand, the recall performance comparison is illustrated in Fig. 4c. By comparing with other existing methods, the proposed model have attained an improved recall of 98.1%. The recall performance attained by other existing methods are reduced and clearly shows the inability of existing methods. Fig. 4d shows the F1-score comparison, which clearly shows that the proposed F1-score is increased as compared with other existing methods. The proposed model have obtained an increased F1-score value of 98.2%. However, the existing methods have achieved reduced F1-score values. Similarly, the specificity value attained by the proposed and existing models are displayed in Fig. 4e. As compared with other existing methods, the proposed model attained an improved specificity of 98.2%. Thus, this result analysis proves the strength of proposed study. Table 7 shows the comparison analysis of existing with the proposed method. Fig. 5 shows the Dice and IoU comparison analysis.
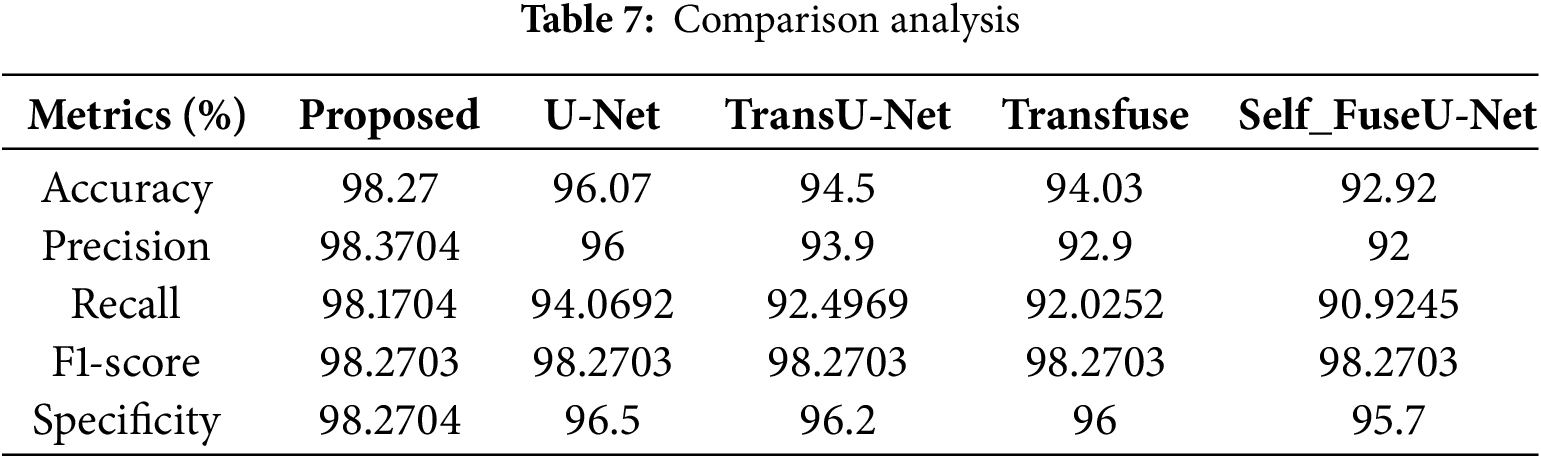
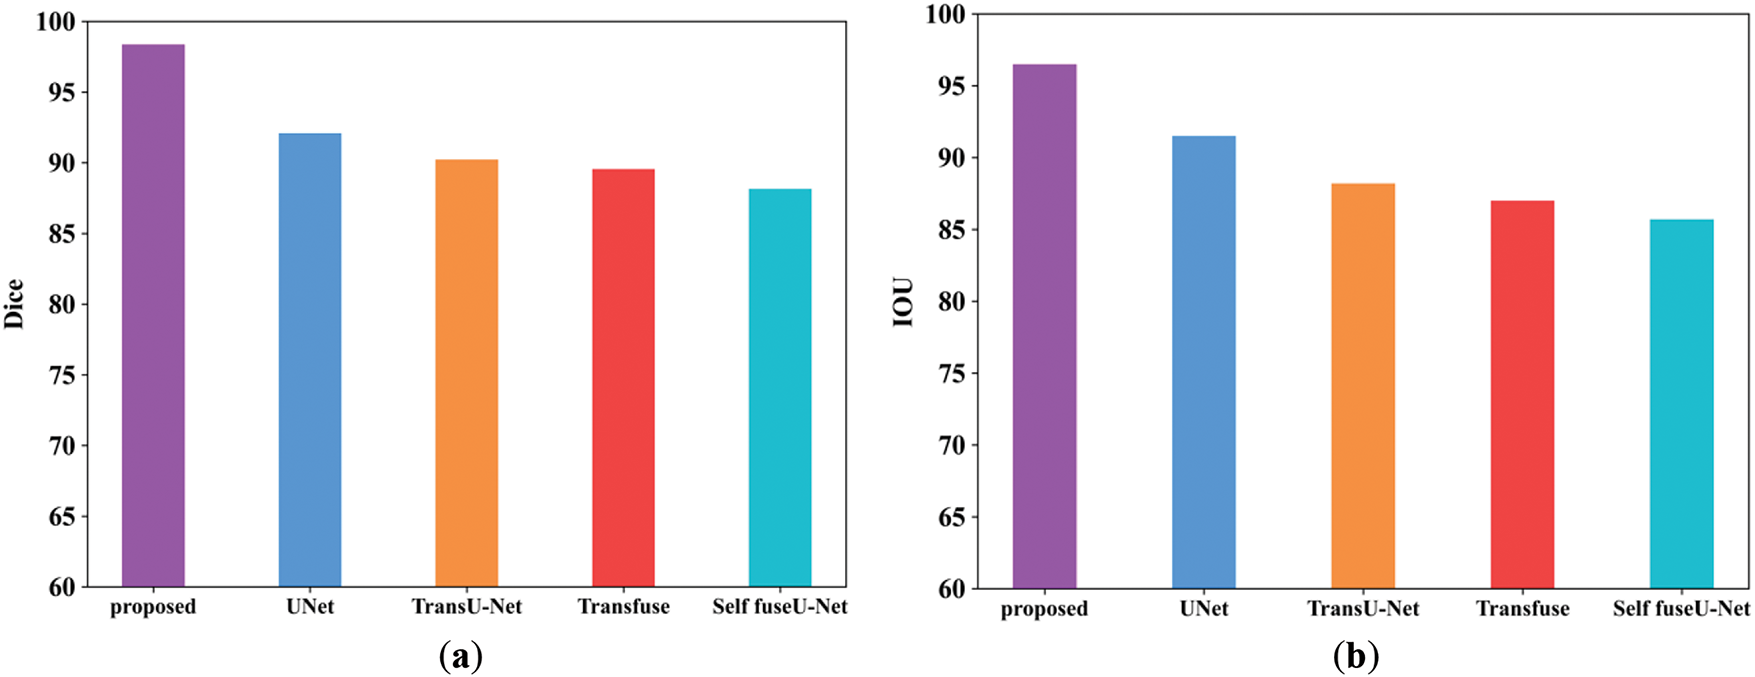
Figure 5: Comparison analysis of Dice and IoU. (a) Dice; (b) IoU
Fig. 5a shows the Dice score comparison of proposed and existing models. The Dice score can be used to compare the similarity of a predicted segmentation mask to the ground truth segmentation mask. The Dice score attained by the proposed model is enhanced as 98.3% but the existing methods have attained reduced Dice score due to higher complexities. Similarly, the IoU comparison of proposed and existing methods are shown in Fig. 5b. IoU metric shows the quality of segmentation in each methods. The range of IoU in the proposed technique is 96.5%. Table 8 shows the comparison value of Dice and IoU. Fig. 6 shows the training and testing accuracy.
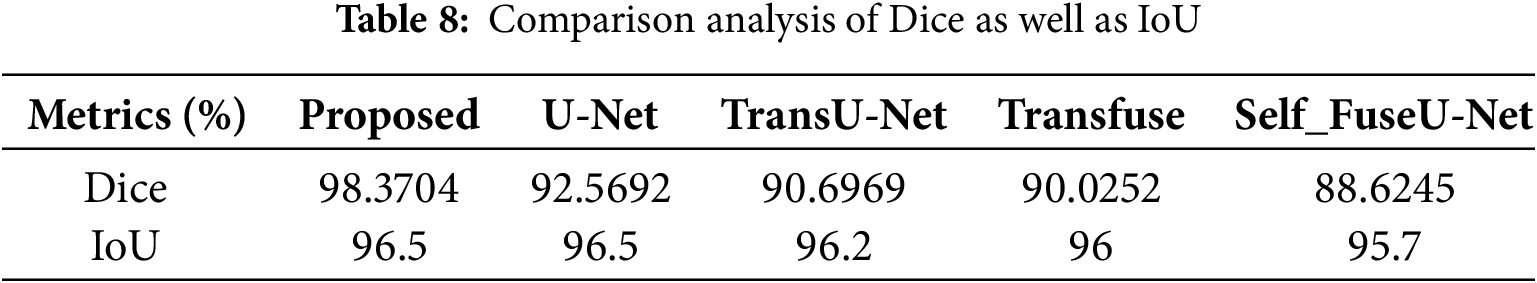
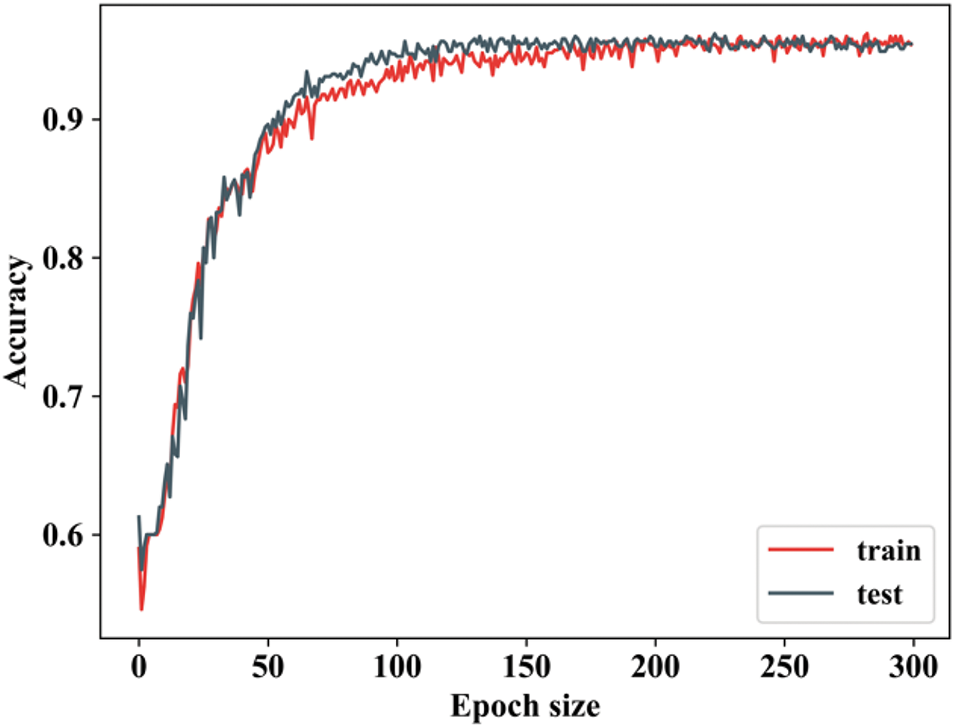
Figure 6: Training and testing accuracy
From Fig. 7, the ability of proposed study is revealed by attaining improved accuracy during training and testing. When the number of epochs is 0, the training accuracy begins to rise, and when it reaches 50, it rapidly increases and remains constant for the remaining epochs. In testing, when the epoch value is 0, the accuracy begins to rise and then remains constant. Both training and testing accuracy start relatively low (~60%) and increase rapidly, indicating that the model is learning effectively. There will be some differences in training and texting accuracy values. Fig. 7 shows the training and testing loss.
Figure 7: Training and testing loss
Fig. 7 shows the training and testing loss of a model over 300 epochs, with the training loss represented in red and testing loss in blue. The loss is a measure of the error or difference between the model’s predictions and the true labels, and the trends in this graph provide insights into the model’s performance. When the epoch value in training loss is 0, the loss reduces and remains constant until 50. In testing loss, when the epoch value is 0 to 50 the testing loss falls down and remains stable for all further epoch values. Fig. 8 indicates the batch size of the proposed along with the existing approach.
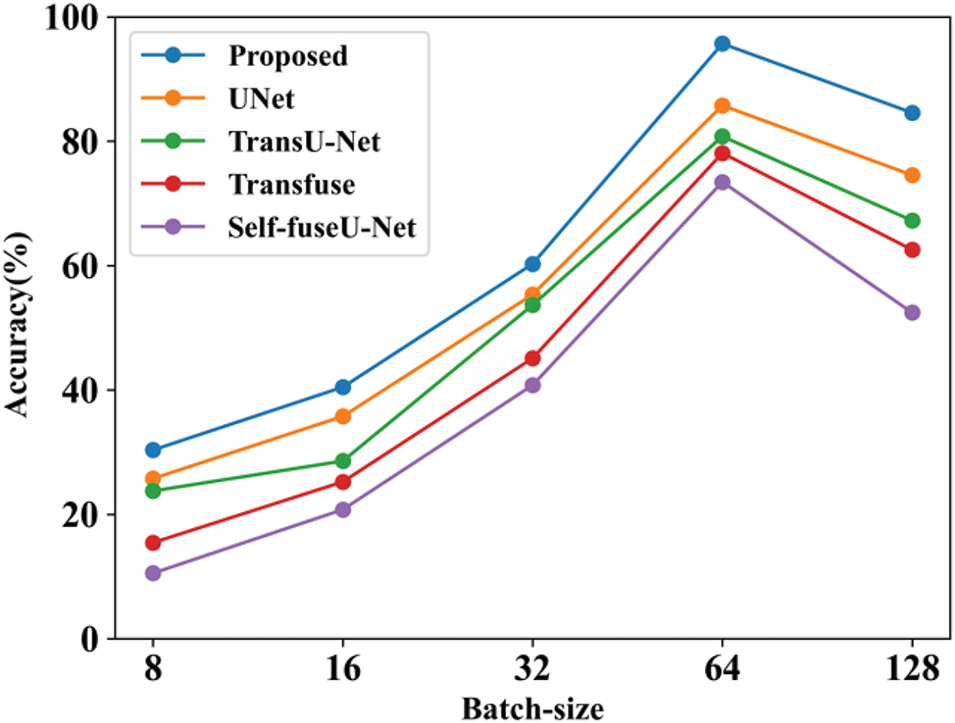
Figure 8: Batch-size
Fig. 8 shows the accuracy performance comparison by varying batch sizes. The batch size refers to the total number of data samples handled during each training cycle. Here, the batch size is varied into 8 to 128 and accuracy value is calculated for each models. Table 9 shows the comparison analysis of batch size. Fig. 9 shows the learning rate of both proposed and existing approaches.
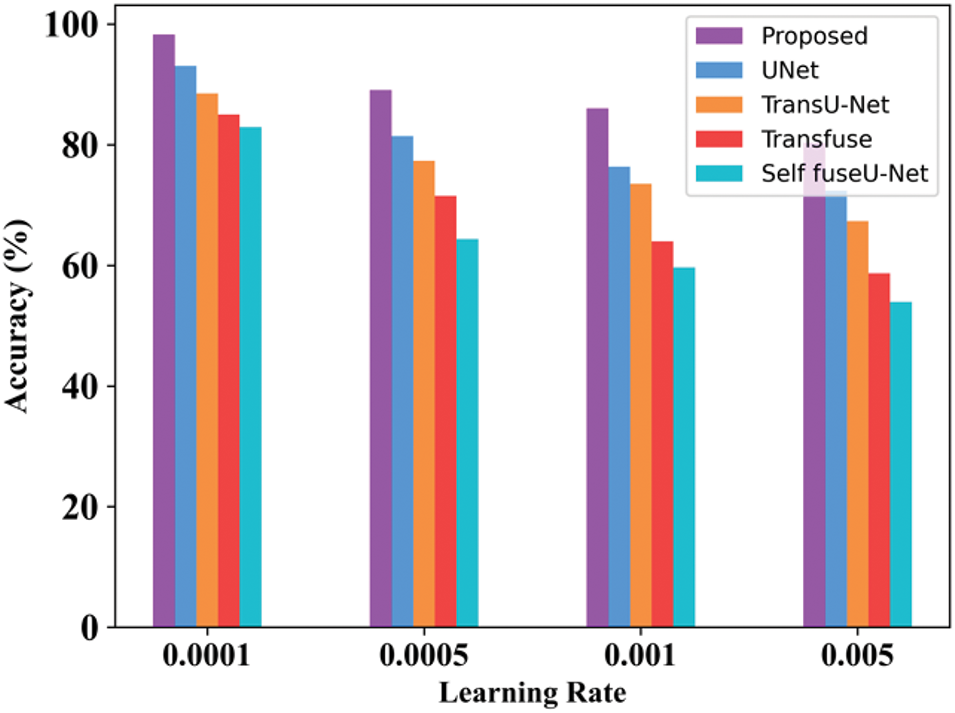
Figure 9: Learning rate
The accuracy rate in varied learning rates of the proposed technique will always be high as compared with other techniques. By varying the learning rate, accuracy is determined. Here, the learning rate is varied from 0.0001 to 0.005. Table 10 indicates the value of the learning rate achieved. Fig. 10 shows the processing time of the existing and proposed technique.
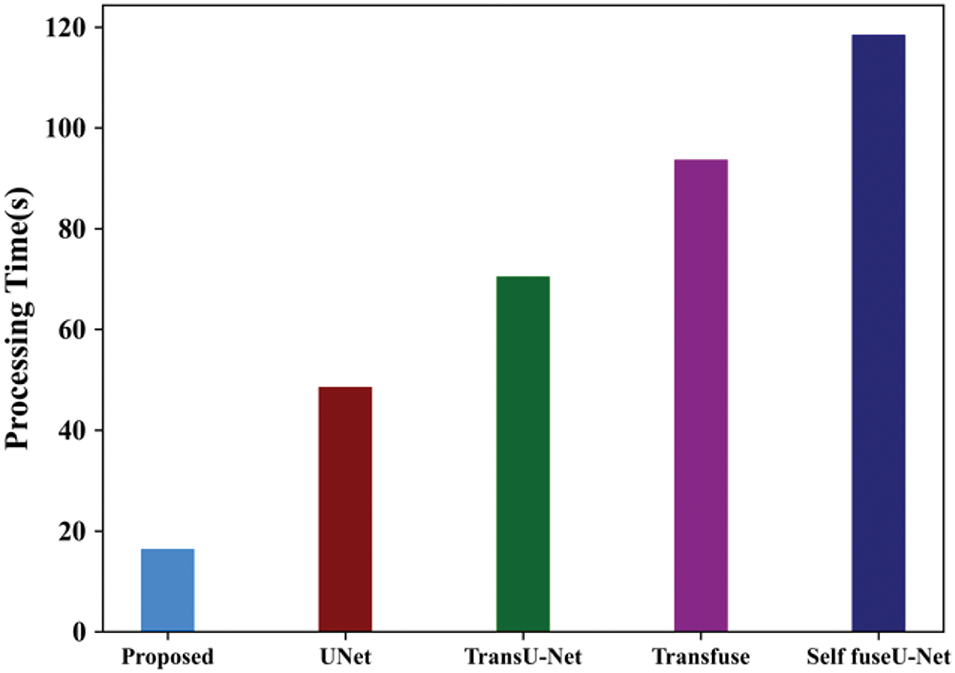
Figure 10: Processing time
The amount of time it takes a computer to complete an operation or execute a set of instructions is known as processing time. The processing time for the proposed method is 16.45 s. Table 11 shows the processing time comparison. Fig. 11 shows the ROC curve of the proposed and existing technique.
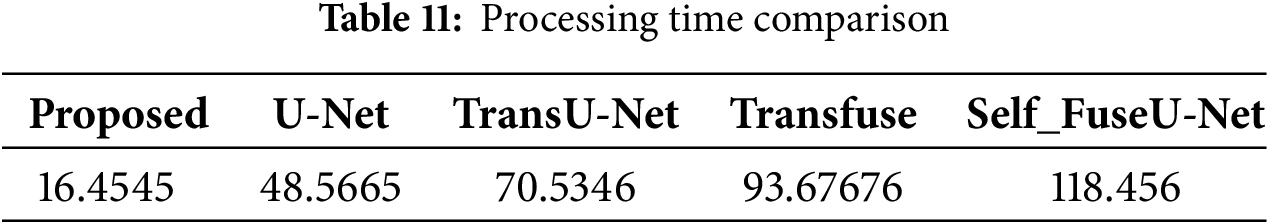
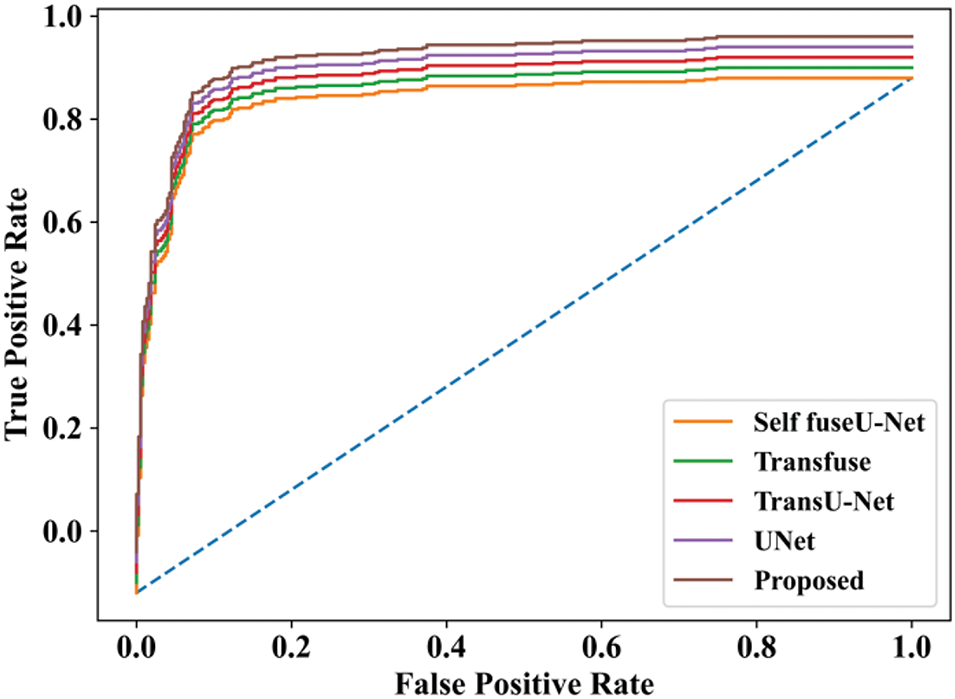
Figure 11: ROC curve
The ROC curve describes the performance of a classification technique as a function of threshold value. The ROC curve for the proposed technique is extremely high, while other techniques have low values. Fig. 12 shows the comparison analysis training as well as testing accuracy of the TG3K dataset.
Figure 12: Training and testing accuracy
The accuracy of training is calculated by varying epoch values. When the epoch value is 0 to 50, the training accuracy starts rising and remains stable for other epochs. The slight oscillations suggest some variability in performance due to updates during training, which is common in the early stages of optimization. In testing accuracy, if the epoch value is 0 to 50, the accuracy starts to rise and remains constant for other epoch values. Fig. 13 indicates the training as well as testing loss.
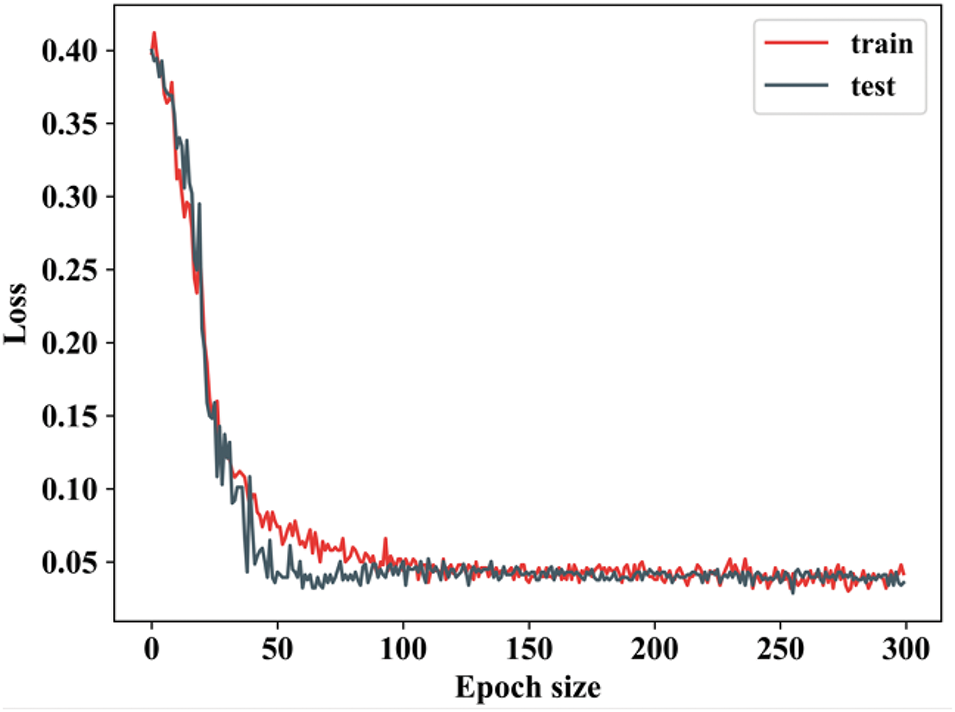
Figure 13: Training as well as testing loss
When the epoch value ranges from 0 to 50, the training loss decreases significantly. During testing loss, the epoch value is lowered and remains constant for other epochs. The loss continues to decrease for both training and testing datasets, although at a slower rate compared to the early epochs. Fig. 14 shows the comparison analysis of the TG3K dataset for proposed and existing models.
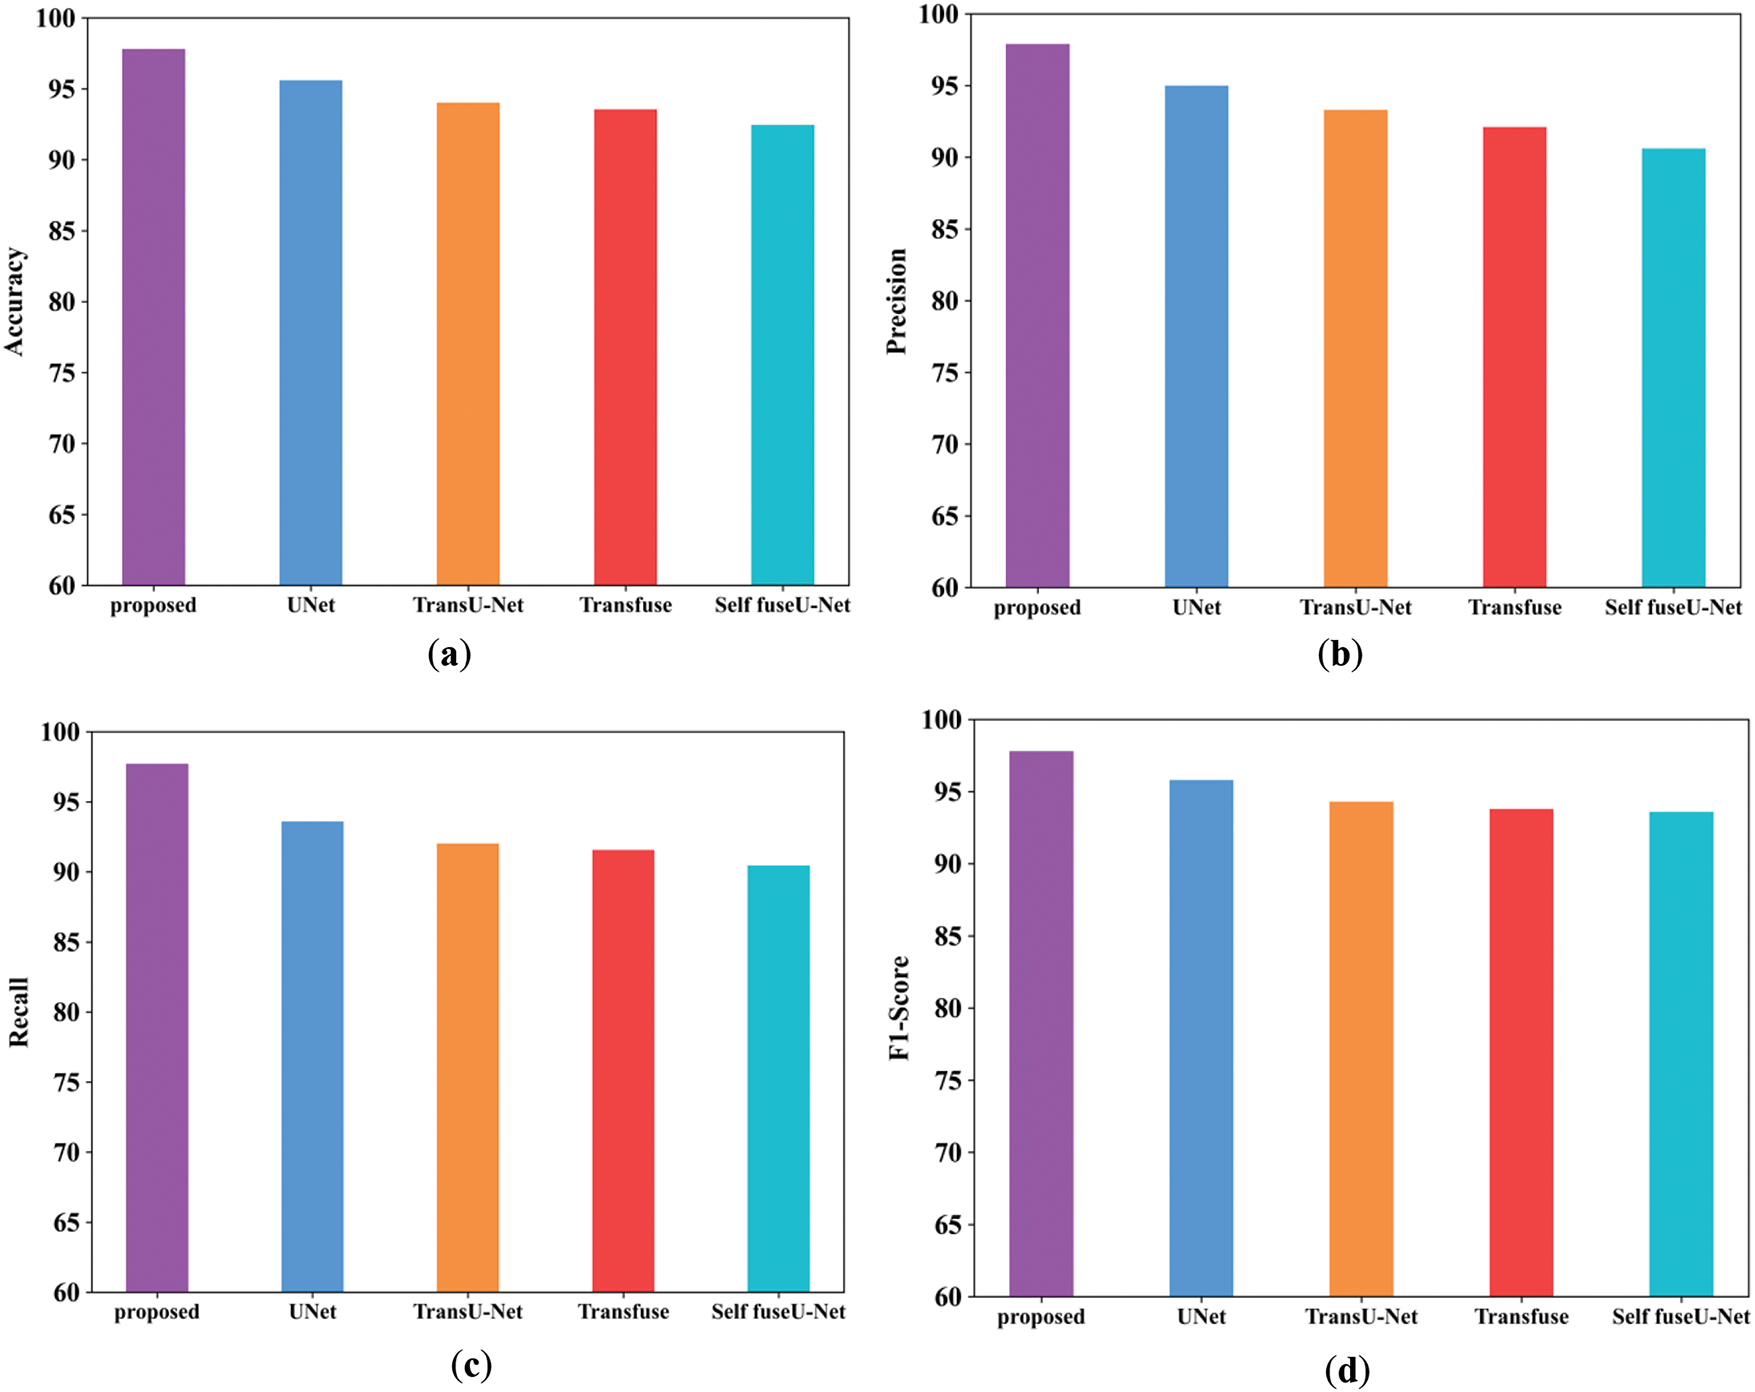
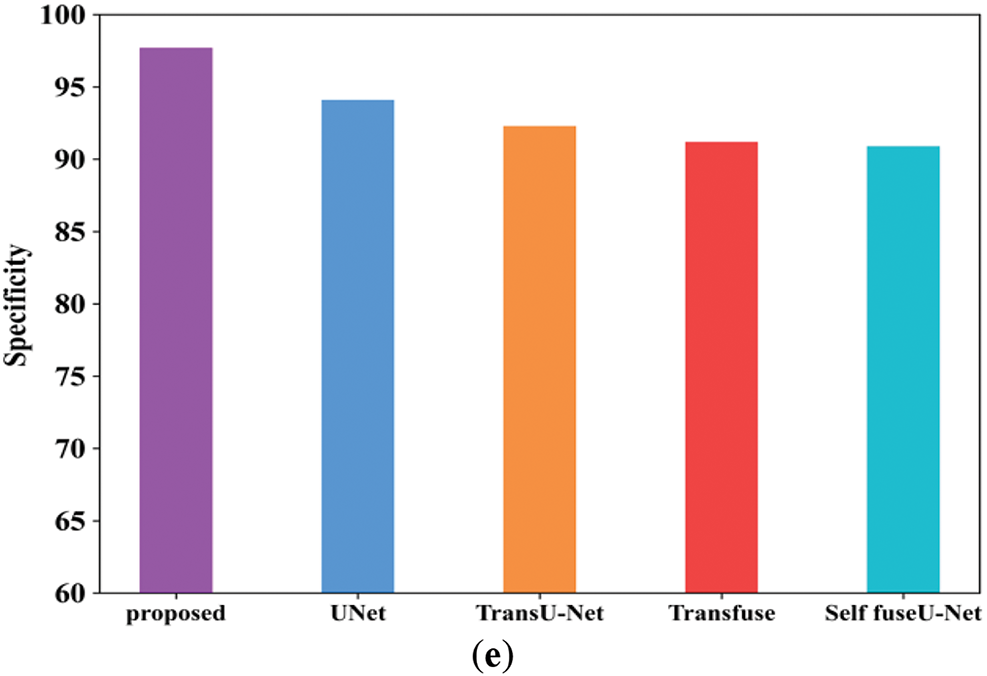
Figure 14: Comparison analysis of the proposed and existing model for the TGK dataset
Fig. 14a mentions the accuracy performance comparison of different models. The accuracy range of the proposed technique is 97.8%, and existing techniques are 95.6%, 94.03%, 93.5%, and 92.4%, respectively. Fig. 14b shows the precision performance comparison in which the proposed model have attained the precision of 97.8%. Fig. 14c shows the recall performance comparison. The proposed model obtained the recall value of 97.69% but the existing methods have attained reduced recall performance. Fig. 14d shows the F1-score comparison analysis, where the proposed model have attained 97.79% of performance. Fig. 14e represents the specificity comparison of proposed and existing methods. The proposed model attained the specificity comparison of different methods and the proposed model attained the specificity of 97.69%. Table 12 indicates the comparison values of the TG3K dataset. Fig. 15 shows the comparison of Dice and IoU ranges.
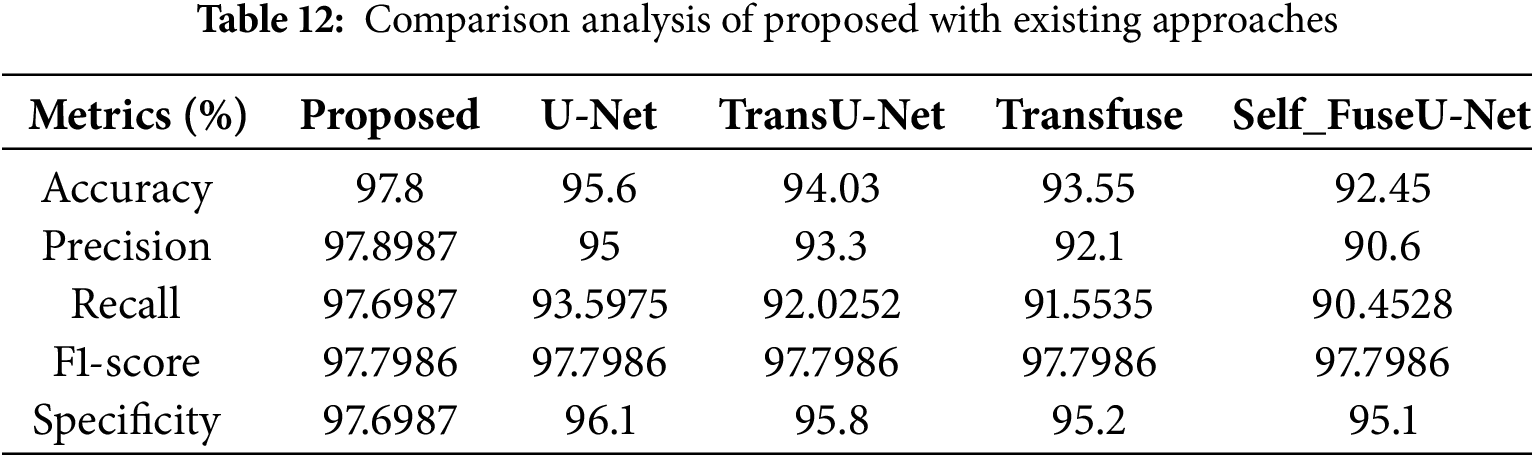
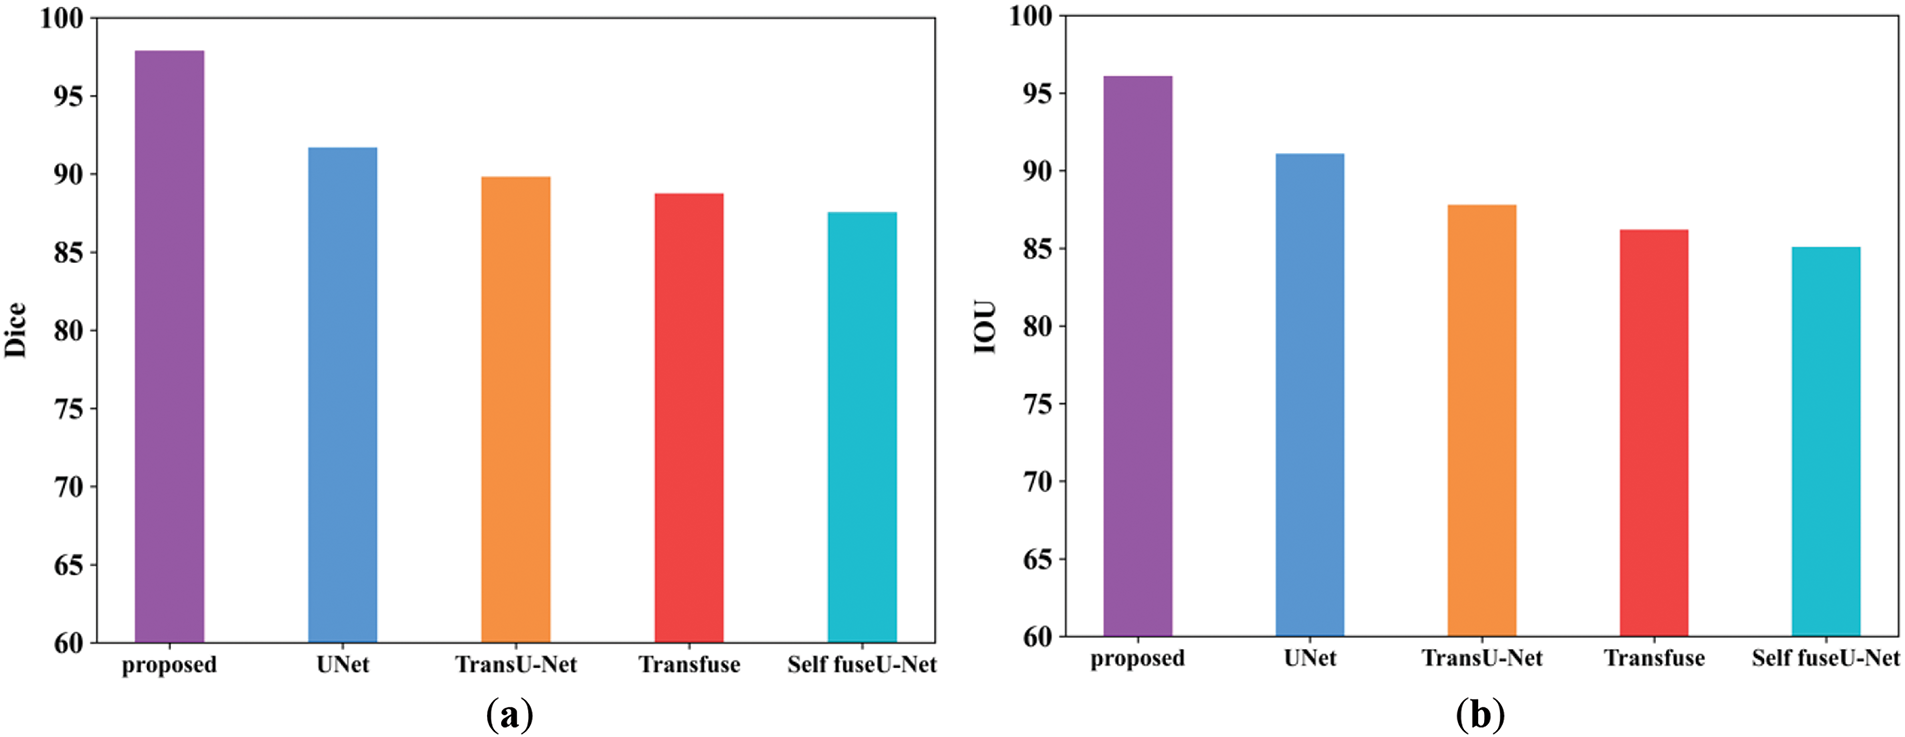
Figure 15: (a, b) Dice and IoU comparison of TG3K database. (a) Dice; (b) IoU
The dice score of the proposed method is 97.89%, and other existing techniques are 91.6%, 89.8%, 88.7%, and 87.5%. Then, the IoU score of the proposed approach is 96.1%, and the values of other existing techniques are lower than those of the proposed method. Table 13 indicates the comparison values of Dice and IoU. Fig. 16 shows the batch size comparison of both proposed and existing models.
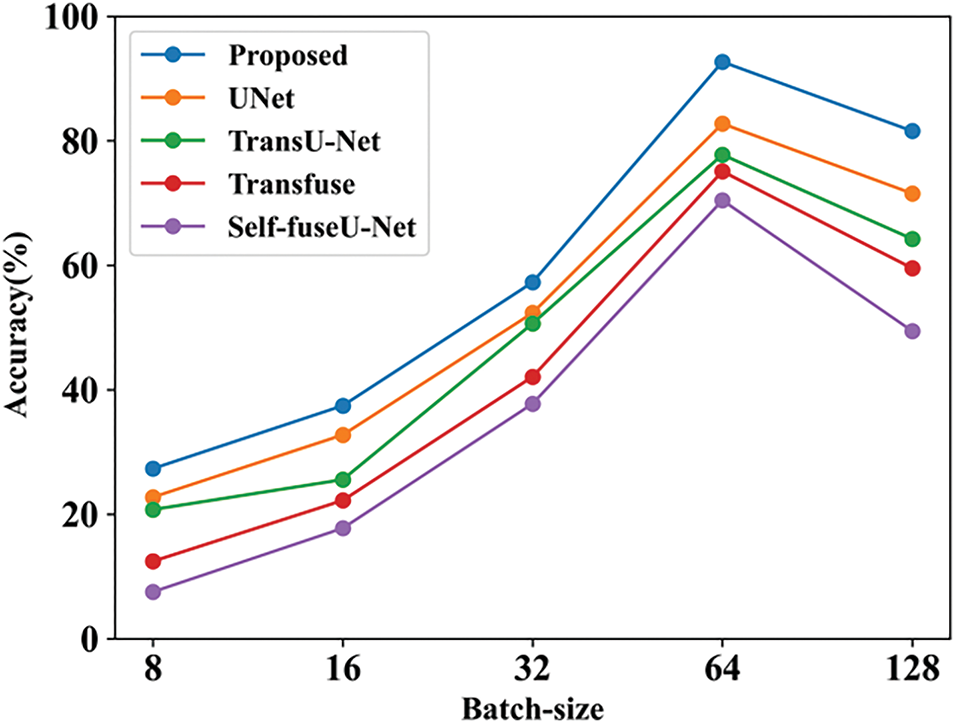
Figure 16: Batch-size
Here, the accuracy value is measured by varying batch size. The value obtained for the proposed technique is 81.56%, and existing studies contain lower values. Table 14 indicates the batch-size comparison. Fig. 17 shows the learning rate comparison.
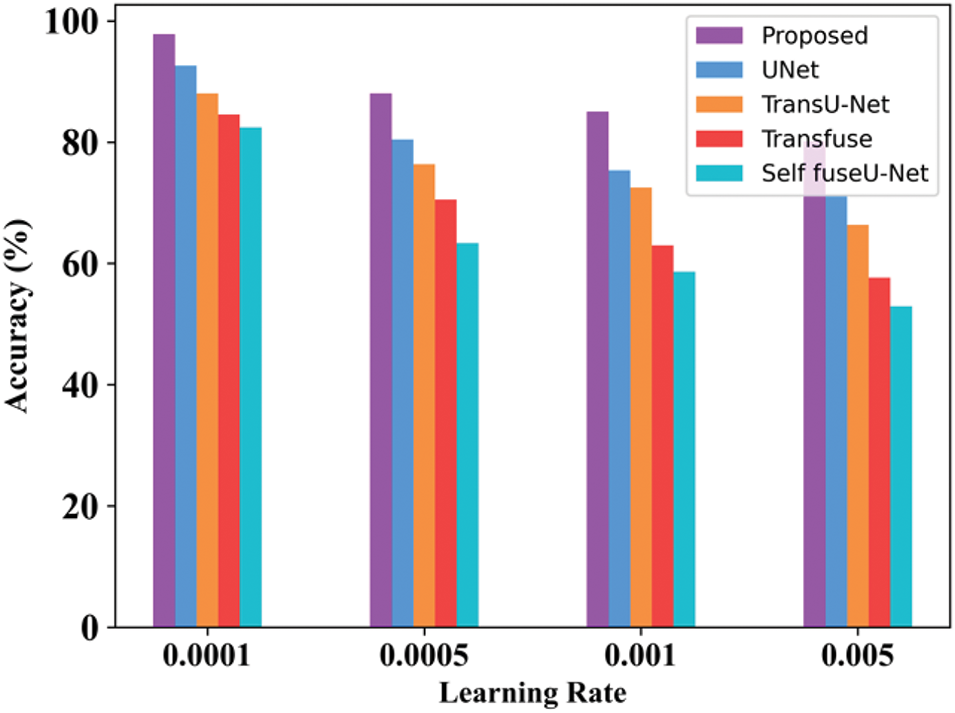
Figure 17: Learning rate
By varying the learning rate, accuracy is determined. The accuracy obtained for the proposed approach in 0.001 learning rate is 97.8%. When the learning rate is 0.005, then the accuracy is 80.34%. Table 15 indicates the learning rate comparison of the proposed and the existing approaches. Fig. 18 shows the processing time of the TG3K dataset.
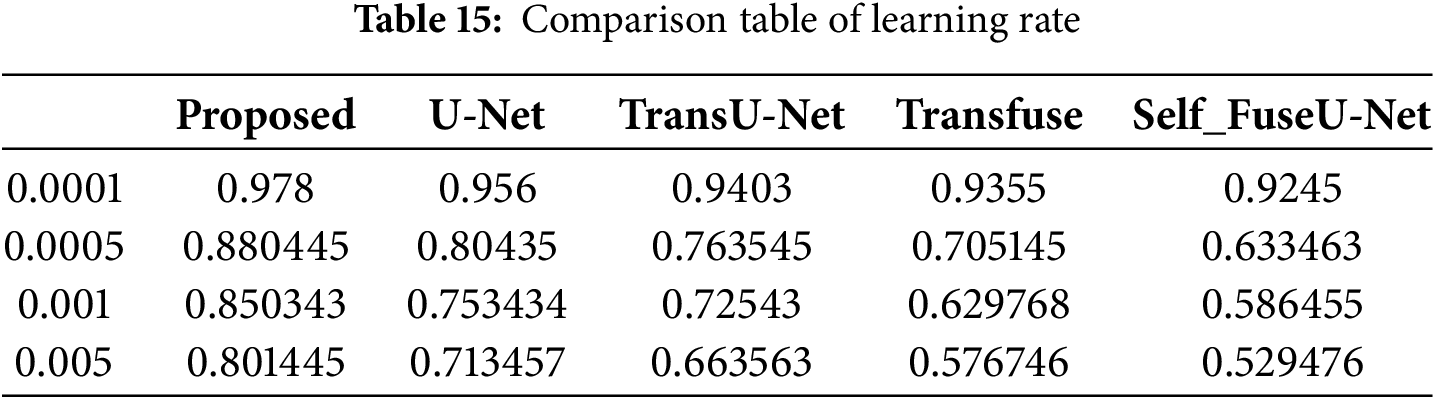
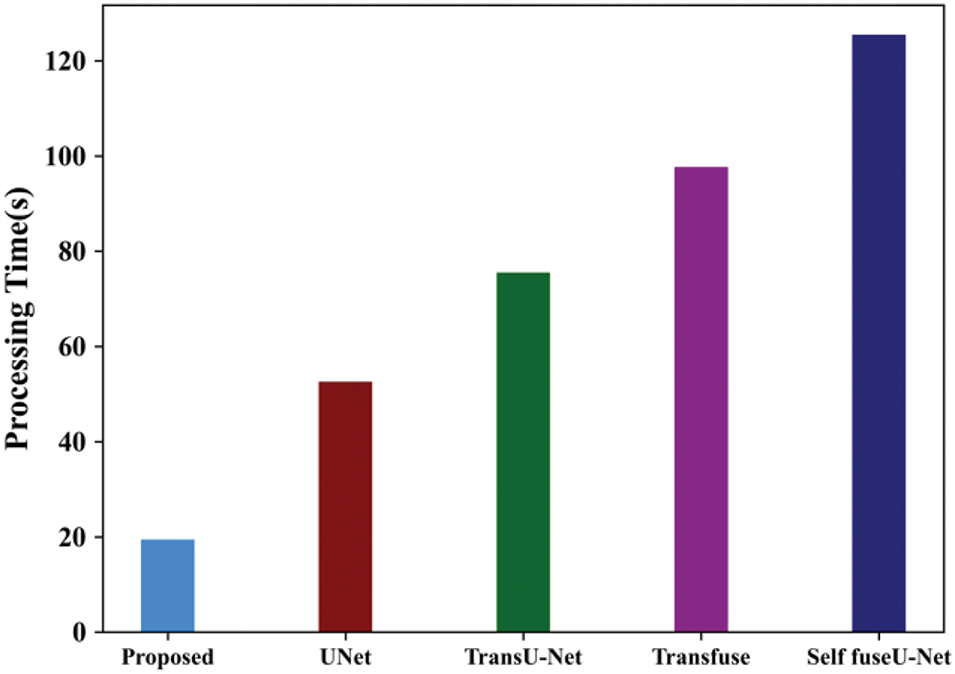
Figure 18: Processing time of TG3K database
The processing time evaluated for the proposed technique is 19.45 s and for existing approaches, 52.56, 75.53, 97.67 and 125.45 s. When the number of input images increases, the processing time also increases. Fig. 19 shows the ROC curve of the TG3K dataset.
Figure 19: ROC curve
The final ROC curve shows the overall performance of the proposed approach. So, the value obtained for the proposed work was high, as compared with other studies. Fig. 20 indicates the training and testing accuracy of the proposed model.
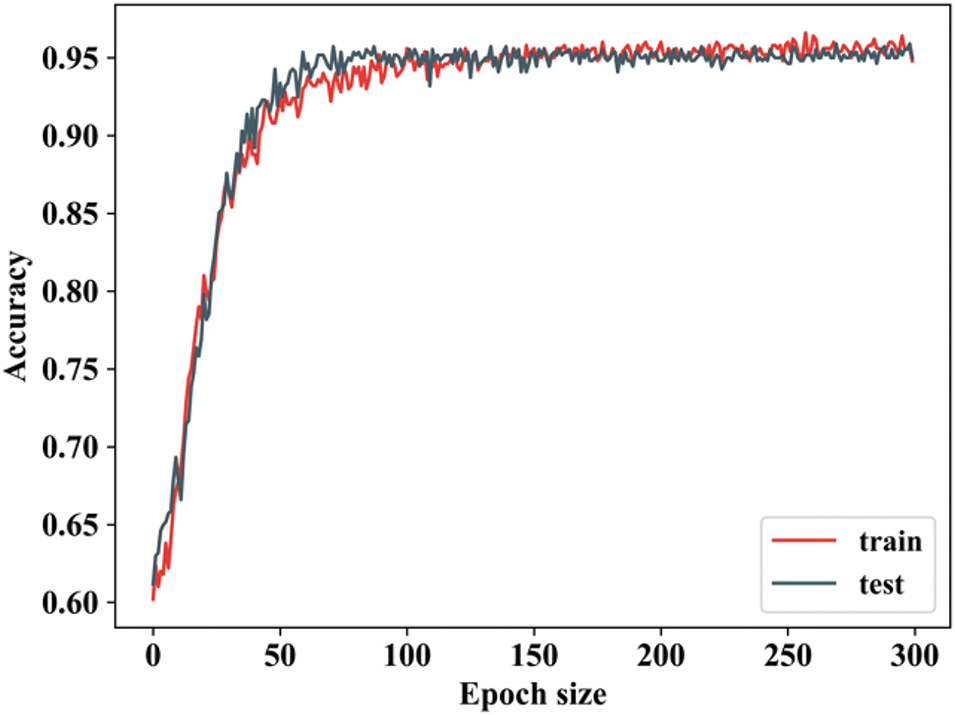
Figure 20: Training as well as testing accuracy
By changing the epoch value, the training accuracy is determined. When the epoch value is 0 to 50, then the training accuracy is increased and remains stable. Testing accuracy is also the same as that of training, but there will be slight changes in epoch values. Testing accuracy follows closely, indicating good generalization. This suggests that the model is not overfitting at this stage, as the training and testing accuracies are closely aligned. Fig. 21 shows the training and testing loss.
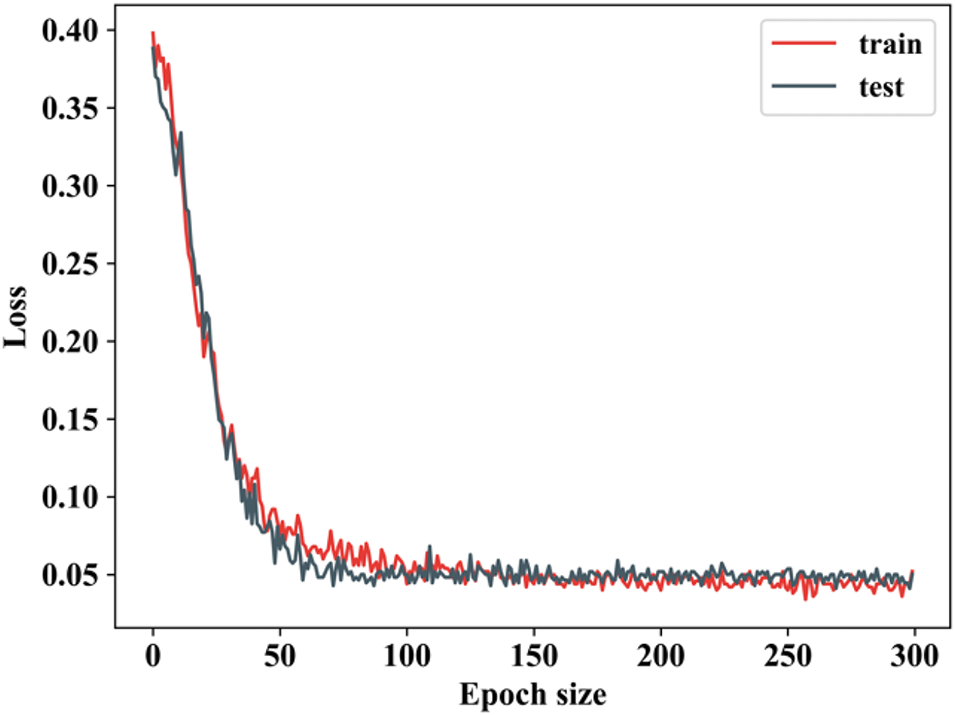
Figure 21: Training as well as testing loss
When the epoch value is 0 to 50, then the training loss decreases and remains constant for other epoch values. Testing loss is also the same as that of training, but there will be slight changes in epoch values. The losses decrease significantly as the model learns, showing that it is effectively optimizing its parameters during training. The fluctuations in loss during this stage are expected as the model updates its weights and adjusts its predictions. Fig. 22 shows the comparison examination of the TN3K database.
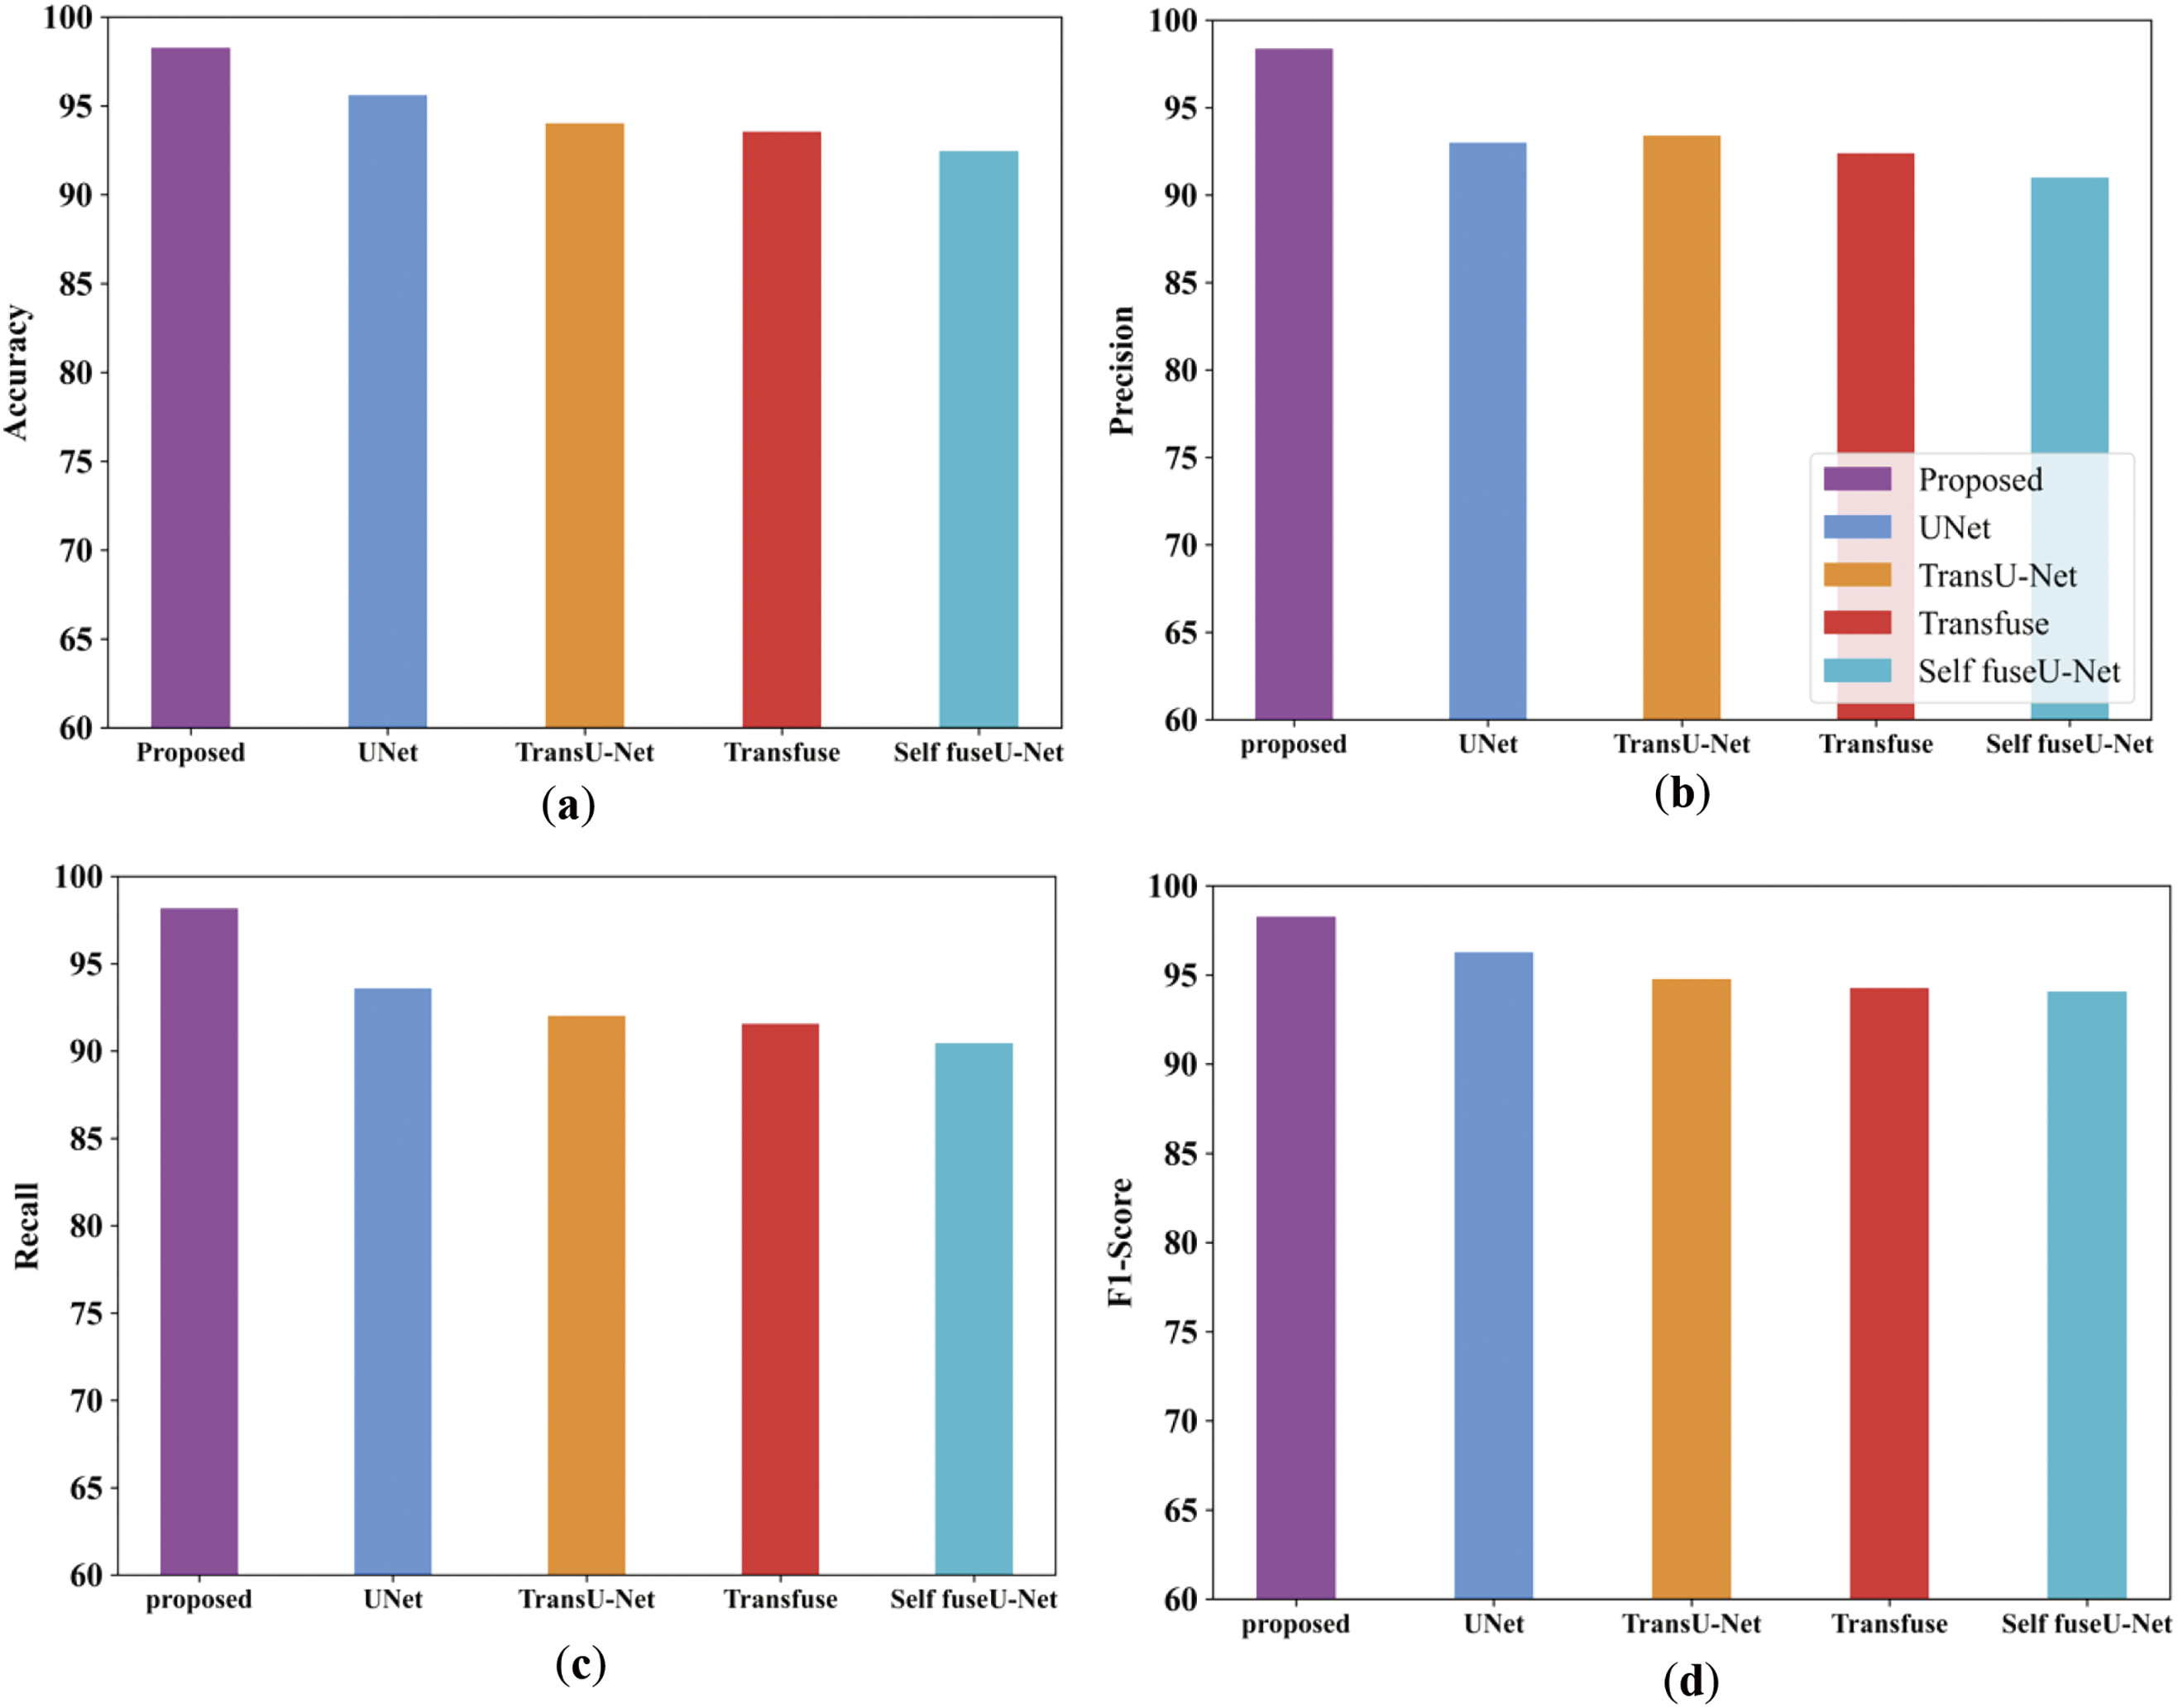
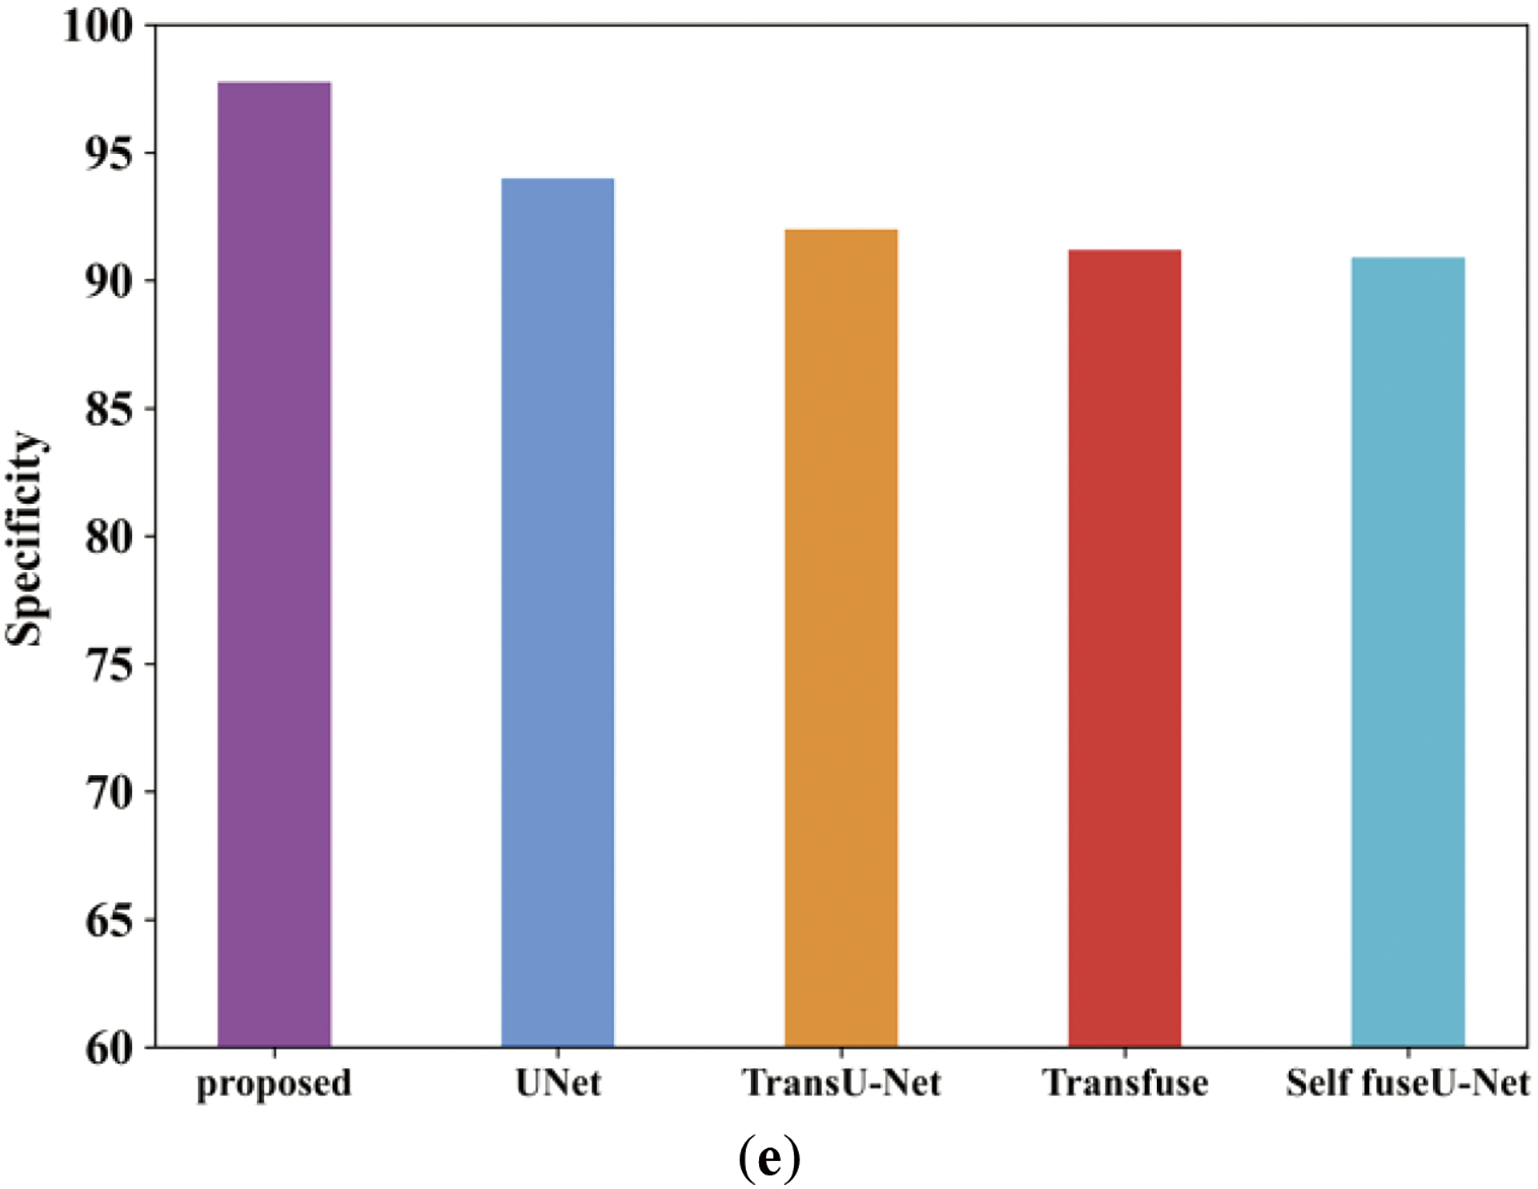
Figure 22: Comparison analysis of the proposed along with the existing approach (a–e)
Fig. 22a illustrates the accuracy comparison analysis of proposed and varied existing methods like UNet, TransU-Net, Transfuse and Self fuseU-Net. As compared with other existing methods, the proposed study obtained an enhanced accuracy range of 98.26%. On the other hand, the existing models have attained reduced accuracy because of several limitations. Fig. 22b shows the precision metric comparison in which the proposed model have achieved an increased precision of 98.3%. But the existing models have attained reduced precision value. The recall performance comparison of proposed and existing models are illustrated in Fig. 22c. By comparing with other existing methods, the proposed model produced 98.17% of recall value. The recall performance obtained by other existing methods are limited due to the inefficiencies of existing methods. Fig. 22d shows the F1-score comparison, where the proposed model has obtained an increased F1-score value of 98.2%. Similarly, the specificity value of proposed and existing models is displayed in Fig. 22e. The graphical representation clearly shows that the proposed model attained an improved specificity of 92.4%. Thus, the analysis proves the robustness of proposed study. Table 16 shows the comparison table of existing and proposed techniques for the TN3K dataset. Fig. 23 shows the comparison of Dice and IoU ranges.
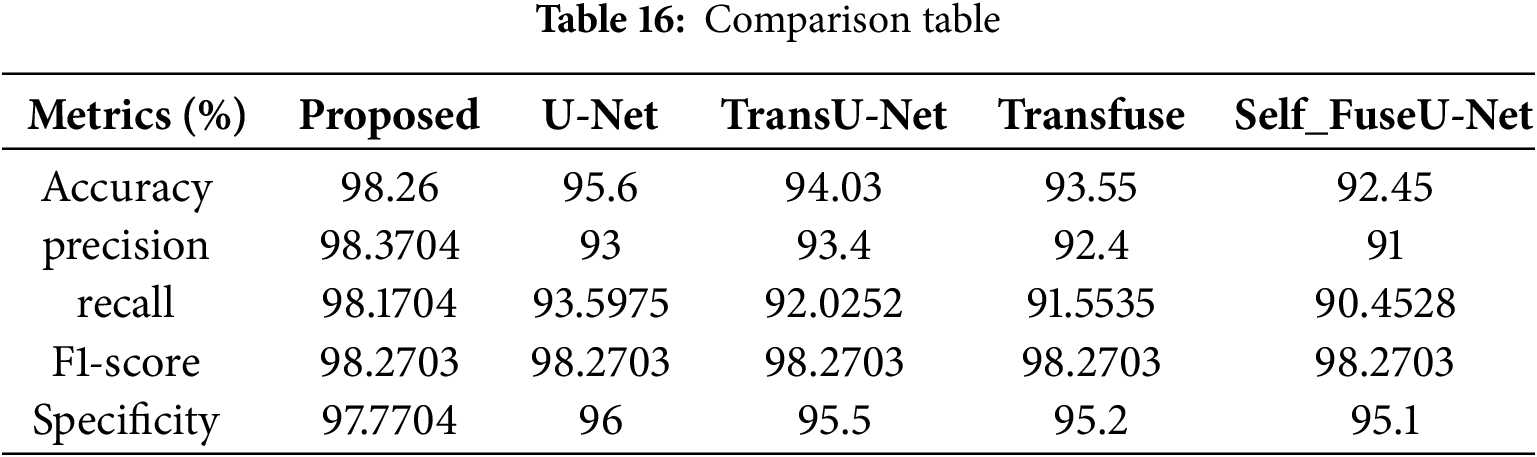
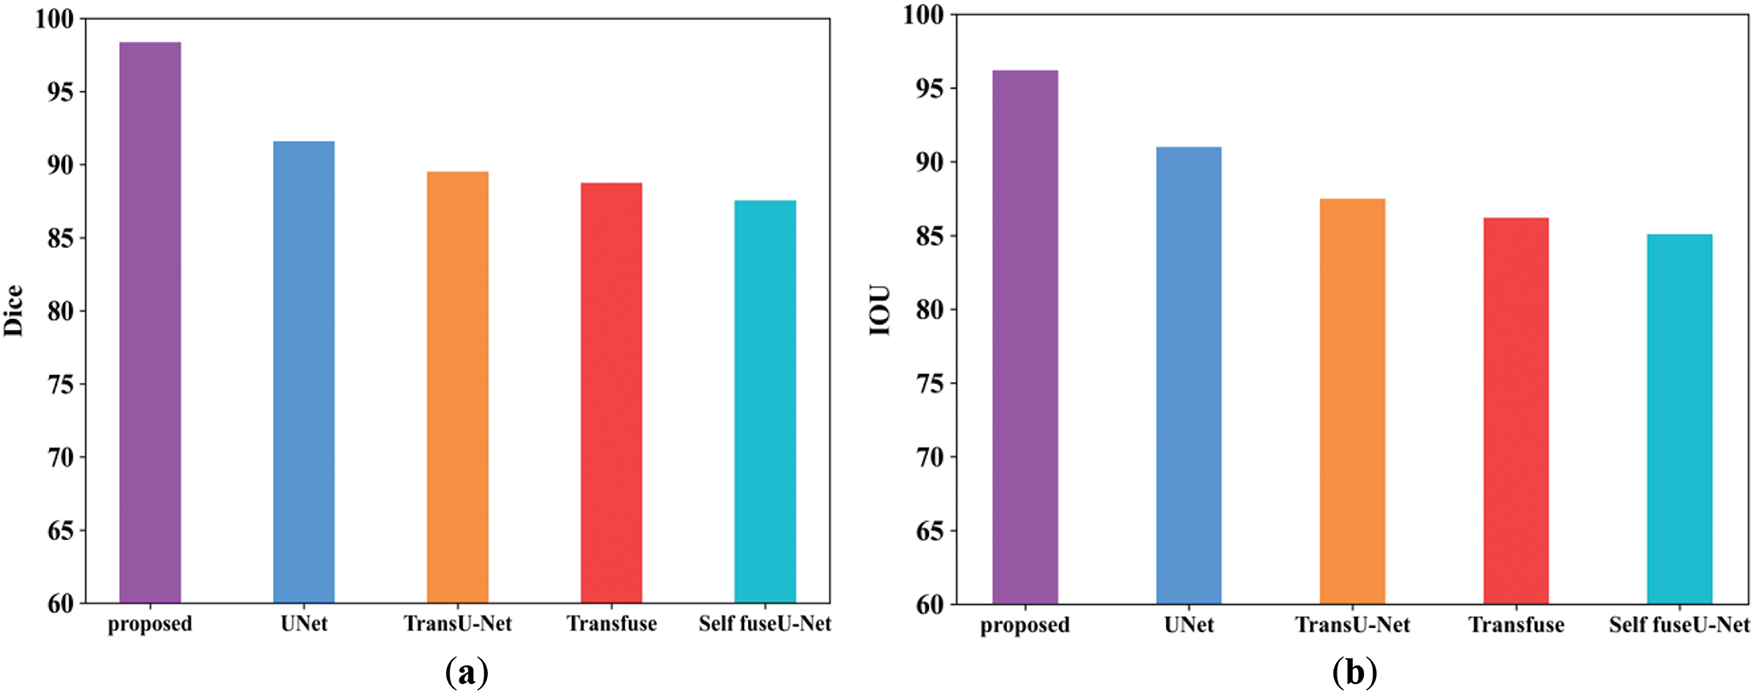
Figure 23: Comparison analysis of Dice as well as IoU. (a) Dice; (b) IoU
The Dice score obtained for the proposed work is 98.3%, and for existing approaches, it is 91.5%, 89.5%, 88.7%, and 87.5%. The IoU value obtained for the proposed model is 96.2%, and other existing techniques are 96%, 95.5%, 95.2%, and 95.1%. Table 17 shows the comparison table of Dice as well as IoU. Fig. 24 indicates the comparison of accuracy by varying batch size.
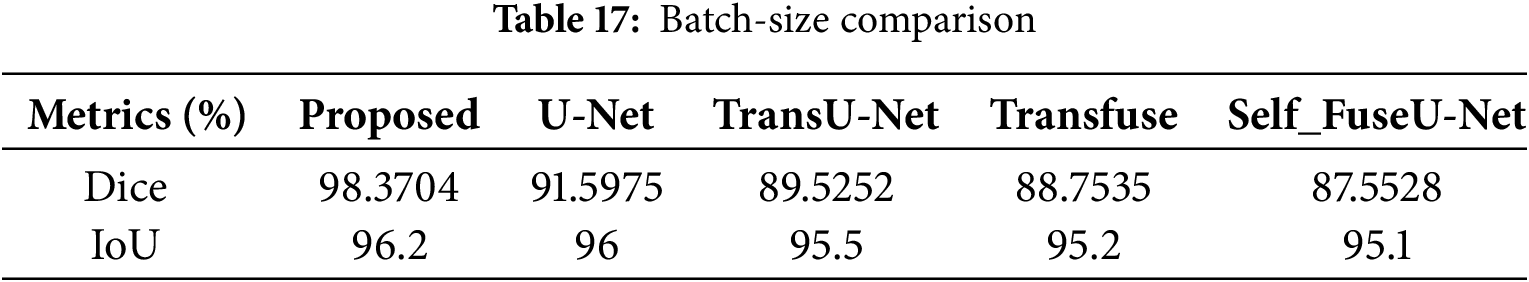
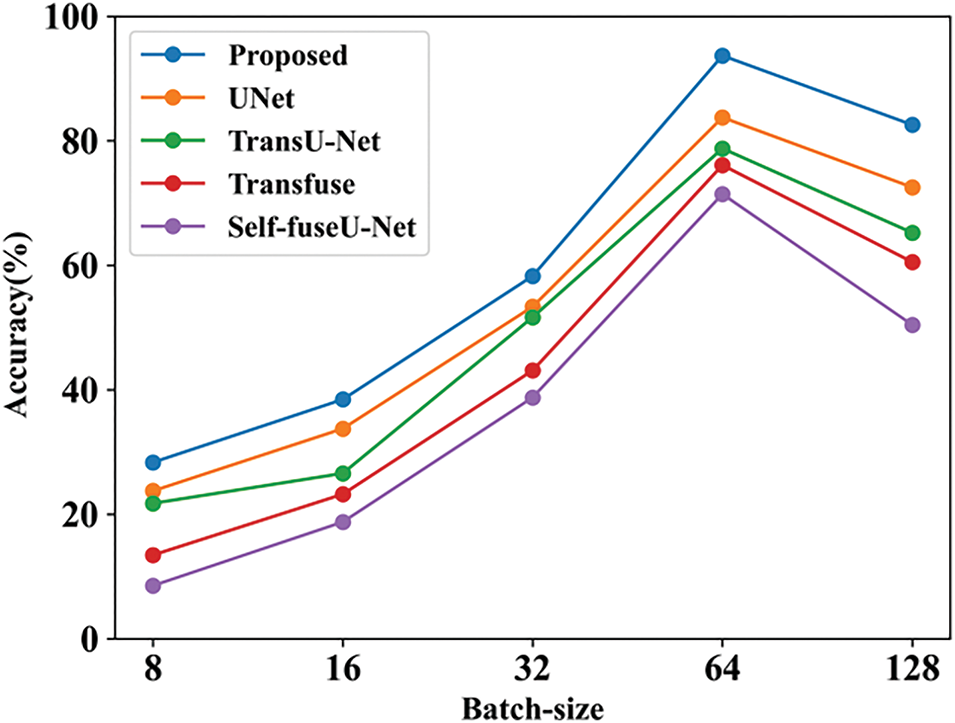
Figure 24: Accuracy with batch-size
Accuracy can be calculated by varying the batch size. When the batch size was 8, the suggested technique had an accuracy of 28.3%, whereas when the batch size was 128, the accuracy was 82.56%. When compared with other existing works, the proposed achieves good results. Table 18 indicates the comparison of batch size with accuracy. Fig. 25 shows the accuracy with varying learning rates.
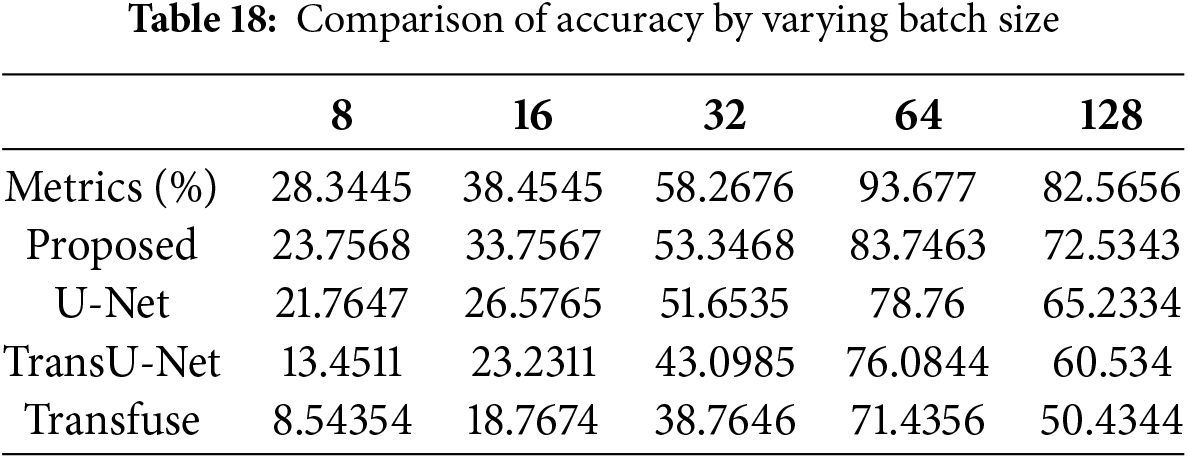
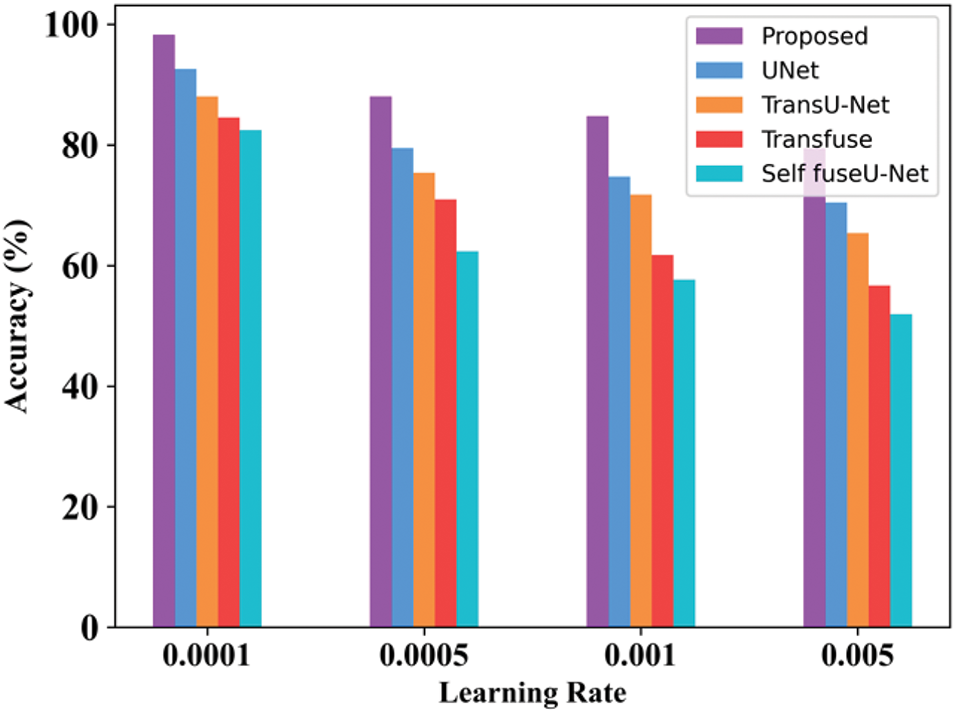
Figure 25: Learning rate
When the learning rate is 0.0001, then the accuracy range of the proposed approach is 98.27%. When the learning rate is 0.005, then the accuracy of the proposed technique is 79.45%. Table 19 clearly mentions the values obtained for the learning rate. Fig. 26 mentions the processing time of the proposed and existing technique for the TN3K database.
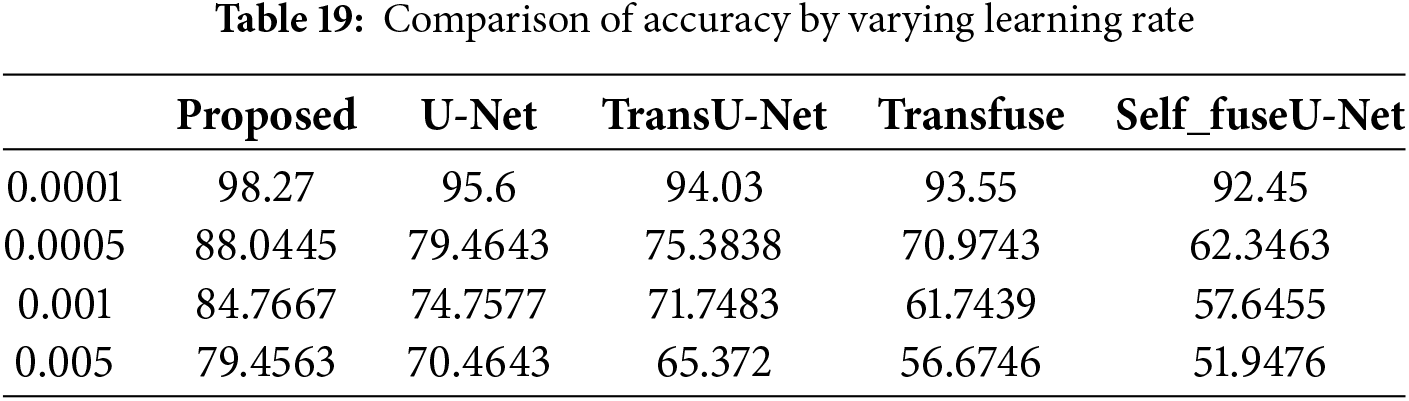
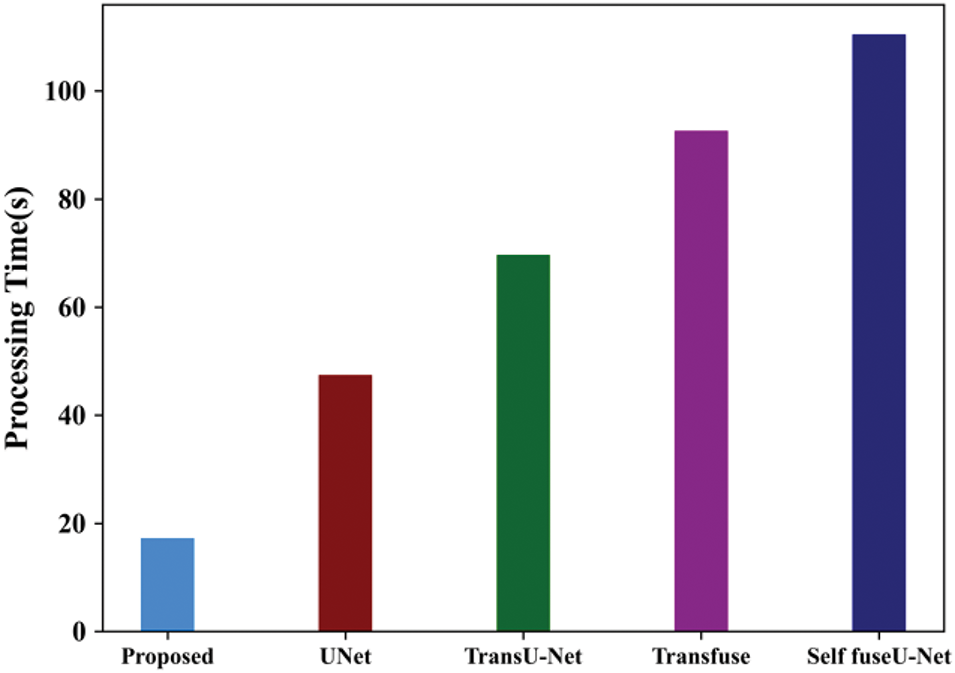
Figure 26: Processing time
In the TN3K dataset, the processing time of the proposed model is 17.24 s and for existing approaches are 47.44, 69.66, 92.6, and 110.4 s. Here, the processing time of the proposed model performs better than other techniques. Fig. 27 indicates the ROC curve of the TN3K database.
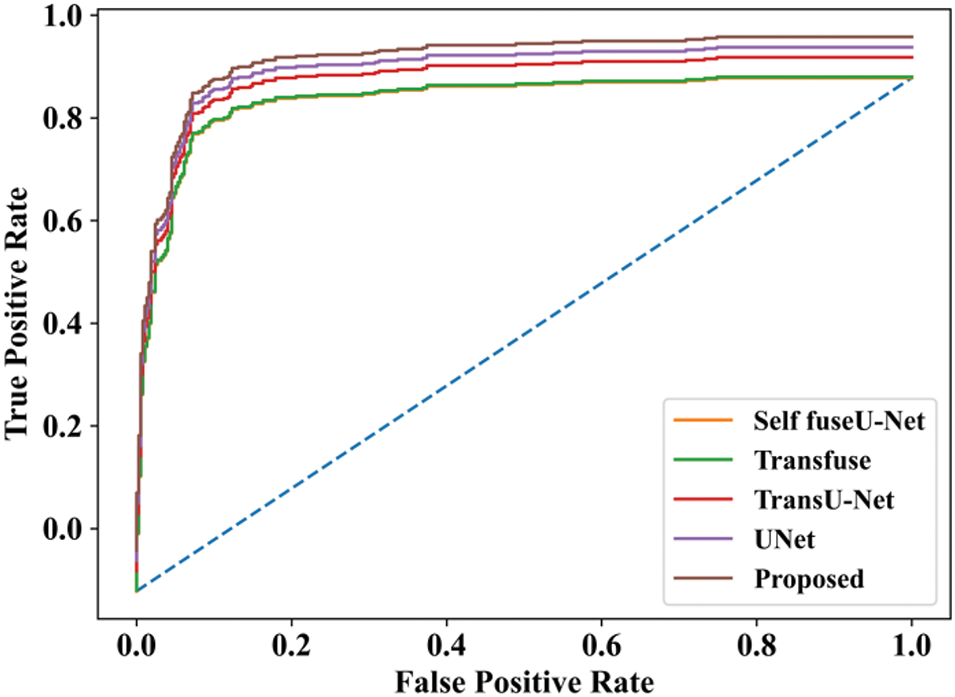
Figure 27: ROC curve
In the ROC curve, the x-axis represents the false positive rate, and the y-axis represents the true positive rate. Here, the proposed method achieves the highest accuracy rate when compared with other techniques.
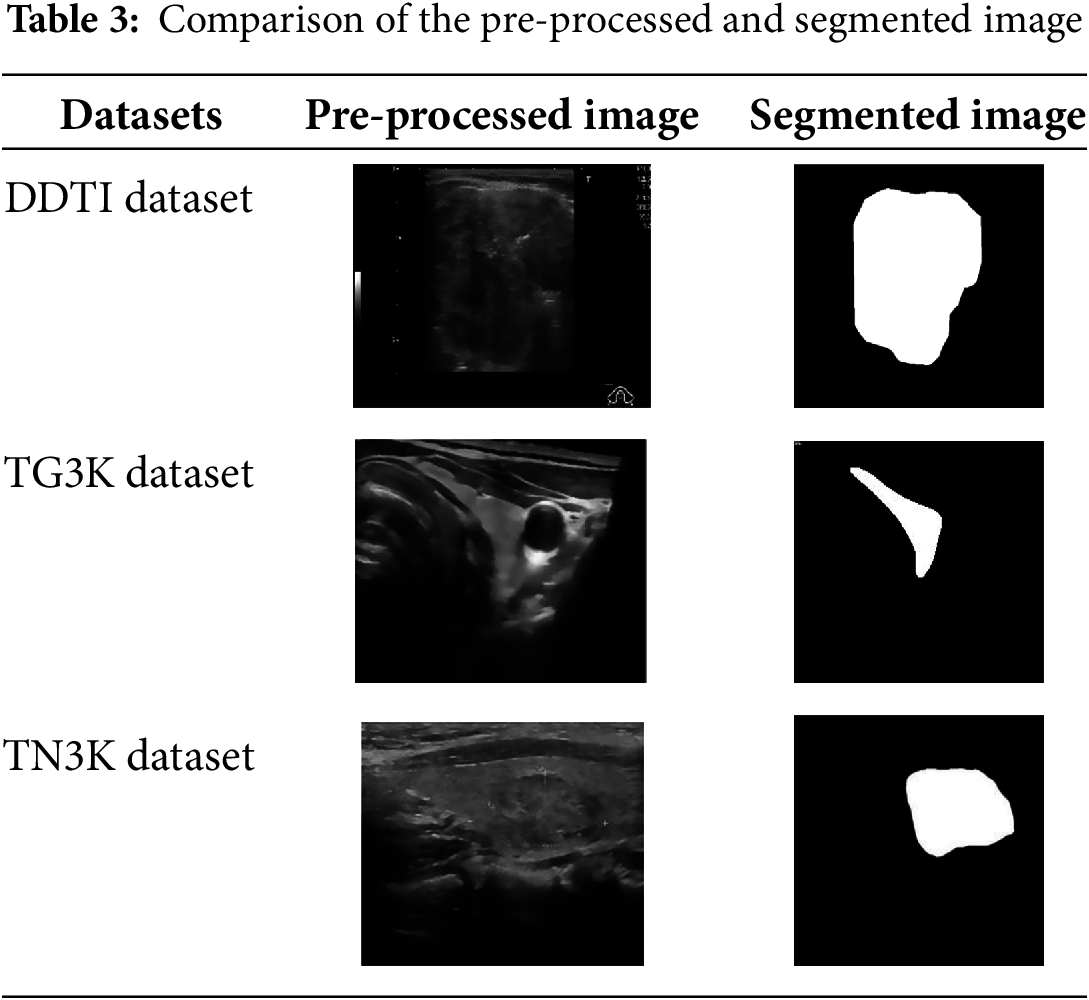
4.4 Visualization of Sample Output
The sample input and output of original image, pre-processed image, segmentation image and Heatmap image are represented in Table 20.
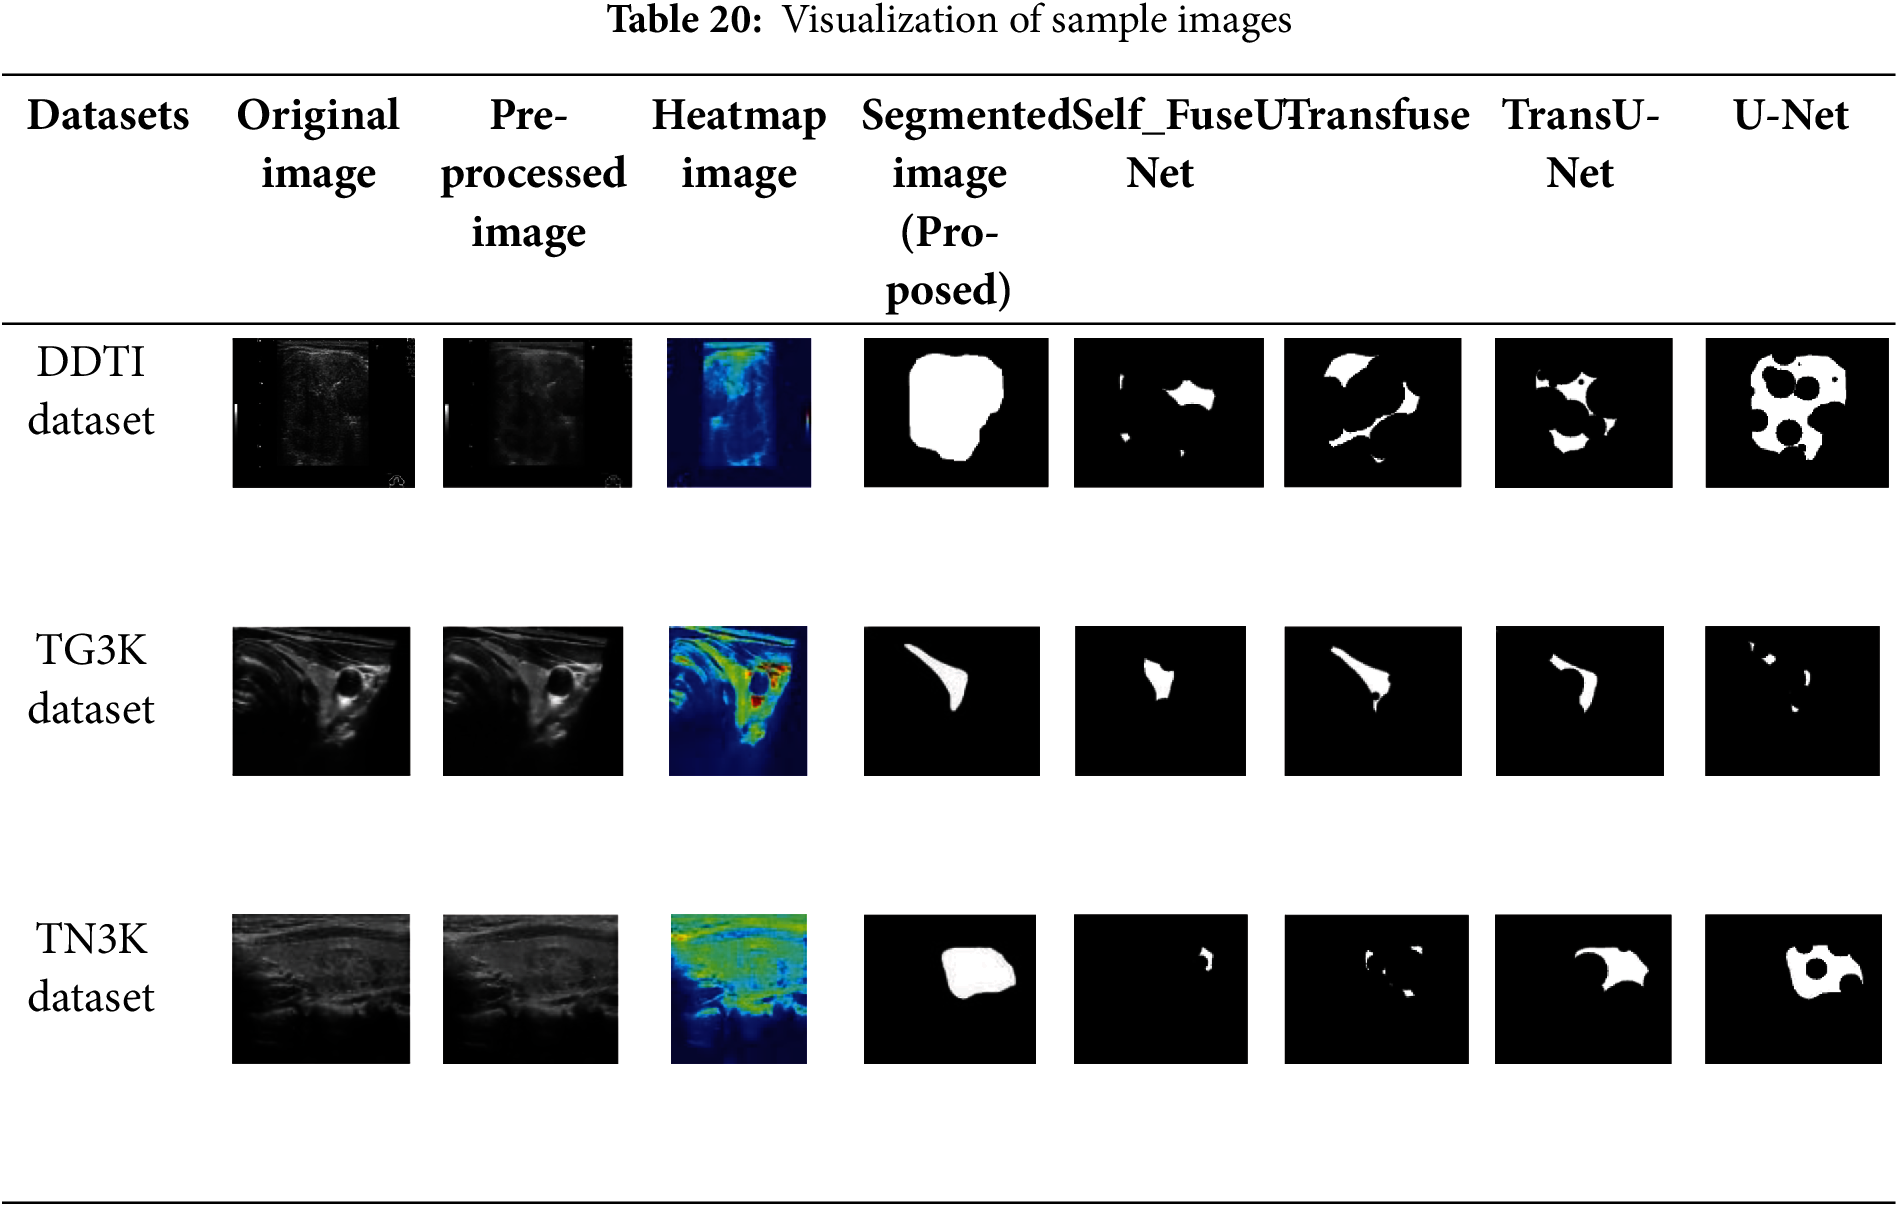
The sample images of input image, pre-processed image, Heatmap image and output segmented image for three datasets are represented in Table 20. It clearly determines the efficient of proposed techniques by obtaining clear result. As compared with other existing techniques like Self fuse U-Net, Transfuse, TransU-Net and UNet, the proposed model effectively segments the thyroid nodules which is clearly exhibited in Table 20. Thus, it shows the superiority of proposed work as compared with other existing methods.
Segmenting thyroid nodules from ultrasound images is a crucial first step in the early detection of thyroid disorders. In this study, a novel MLRT-UNet that mainly integrates the benefits of various multi-scale vision transformers. Here, pre-processing is carried out using FBF. Fast bilateral filters aim to accomplish similar results to the regular filter at a computationally significantly lower cost. They provide crisper images by effectively removing noise while keeping edges. After pre-processing, a Relation transformer is used for extracting the relevant features in the image. Relation transformers are an effective tool for feature extraction from data, especially in situations where relationships between entities are involved. Relation transformers are capable of detecting long-range relationships and interactions between data points, in contrast to conventional approaches. Then, the relation transformer is divided into two steps: self and external attention.
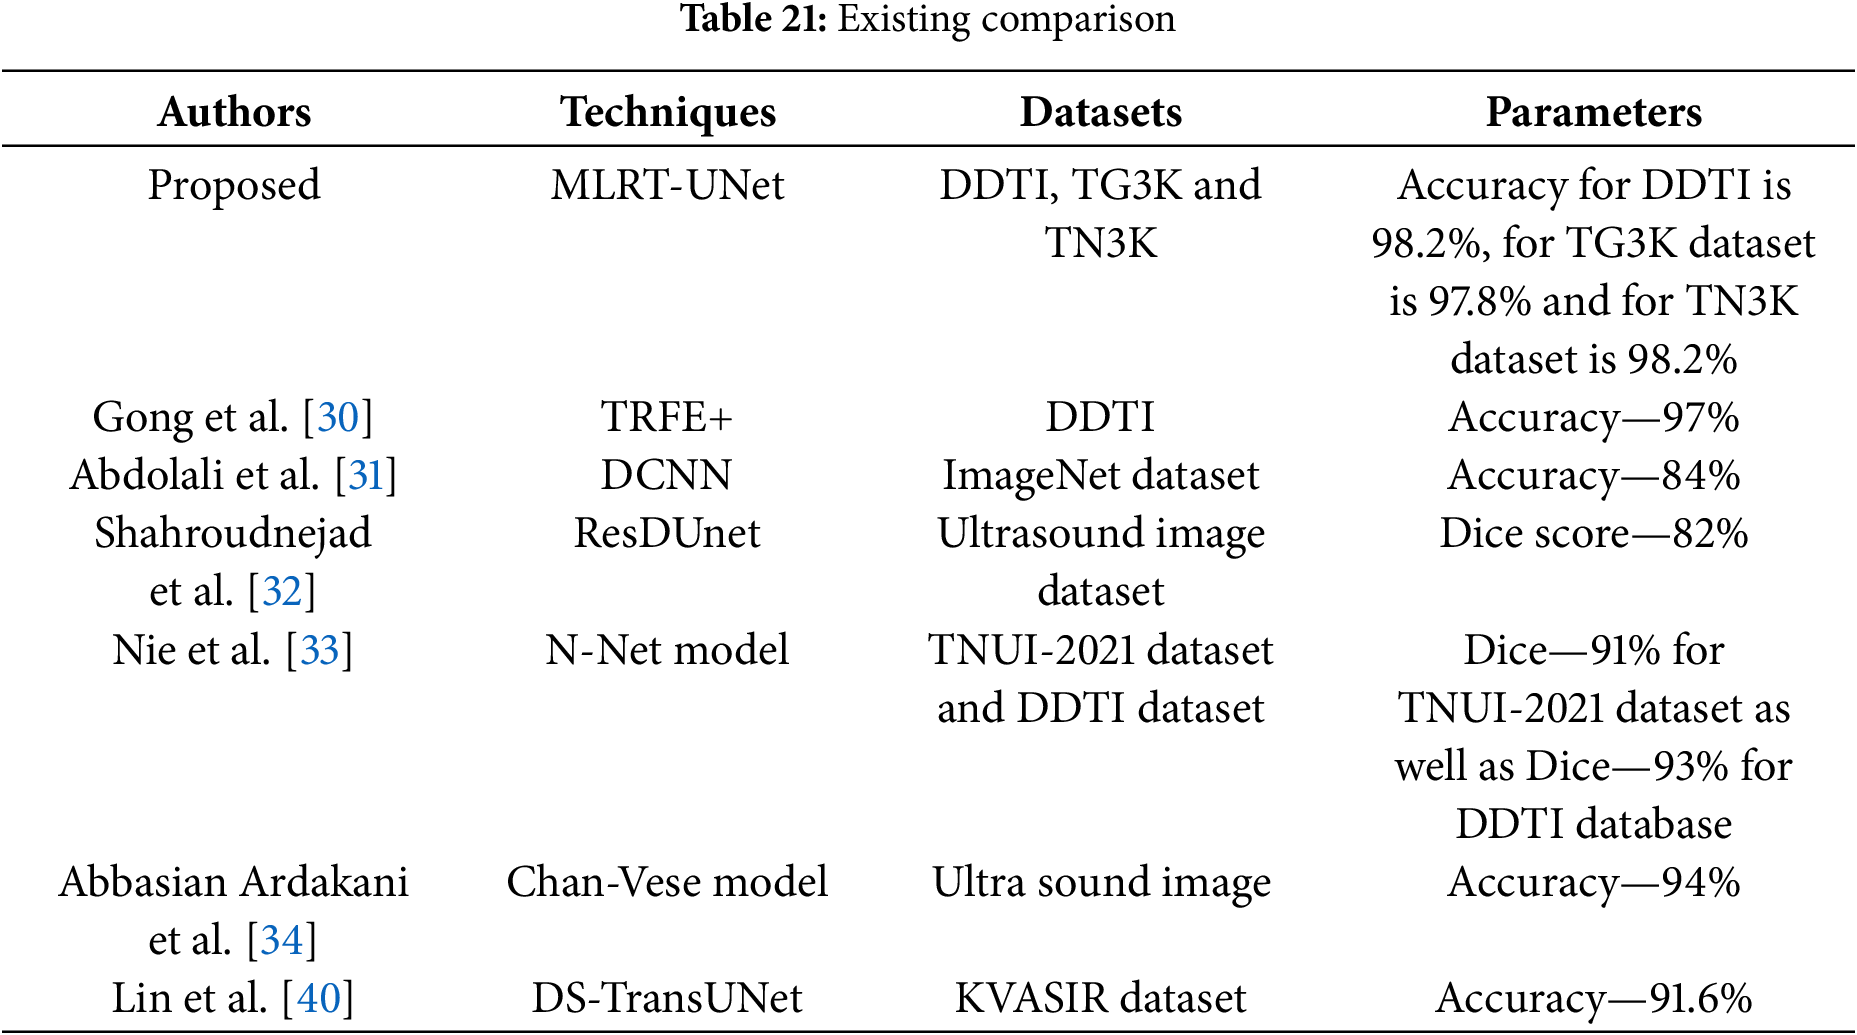
Both self and external attention are effective methods for extracting features, each having its own advantages and uses. Self-attention will capture long-range dependencies, identify significant local characteristics, and enhance interpretability by emphasizing important connections. External focus provides relevant extra knowledge and enhances performance on tasks requiring a larger perspective. Then, Co-operative Transformer Fusion will concatenate the multi-scale features in relation to the transformer. Research on transformer-based self-supervised feature fusion for text, audio, and video-based emotion recognition may be referred to as a co-operative transformer. Table 21 indicates the comparison of base paper, proposed and existing techniques.
In this Section, the statistical analysis is performed to evaluate the efficiency of proposed methodology. Here, the P-test, t-test and Friedman test are conducted to evaluate the segmentation performance of proposed technique
• P-test
The accuracy of the acquired results from a hypothesis test is examined in the proposed study using the P-test. The p-value measures the probability of finding evidence against the null hypothesis which should be less than 0.05. The proposed model assists the robustness of the obtained results by achieving a p-value of 0.038 for DDTI dataset, 0.046 for TG3K dataset, and 0.027 for TN3K dataset.
• t-test
The mean values of two groups are compared using the t-test. To evaluate the relevance of two different hypotheses, the proposed study used a t-test on the dataset that was used. The initial assumption that the true mean and the obtained results are comparable is known as the null hypothesis. The second assumption is an alternate hypothesis, which speculates that differences between the actual mean and the obtained values are exhibited. In this study, Welch’s t-test is the preferred method used mainly for t-test analysis. A different variance will result in a different number. The method used in the dataset yielded a p-value of 0.0213 for DDTI dataset, 0.0332 for TG3K dataset and 0.0201 for TN3K dataset. Although the obtained p-value is less than 0.05, the Welch t-test analysis demonstrates the robustness of the proposed model.
• Friedman test
The Friedman test analysis is conducted for three datasets which are described in Table 22.
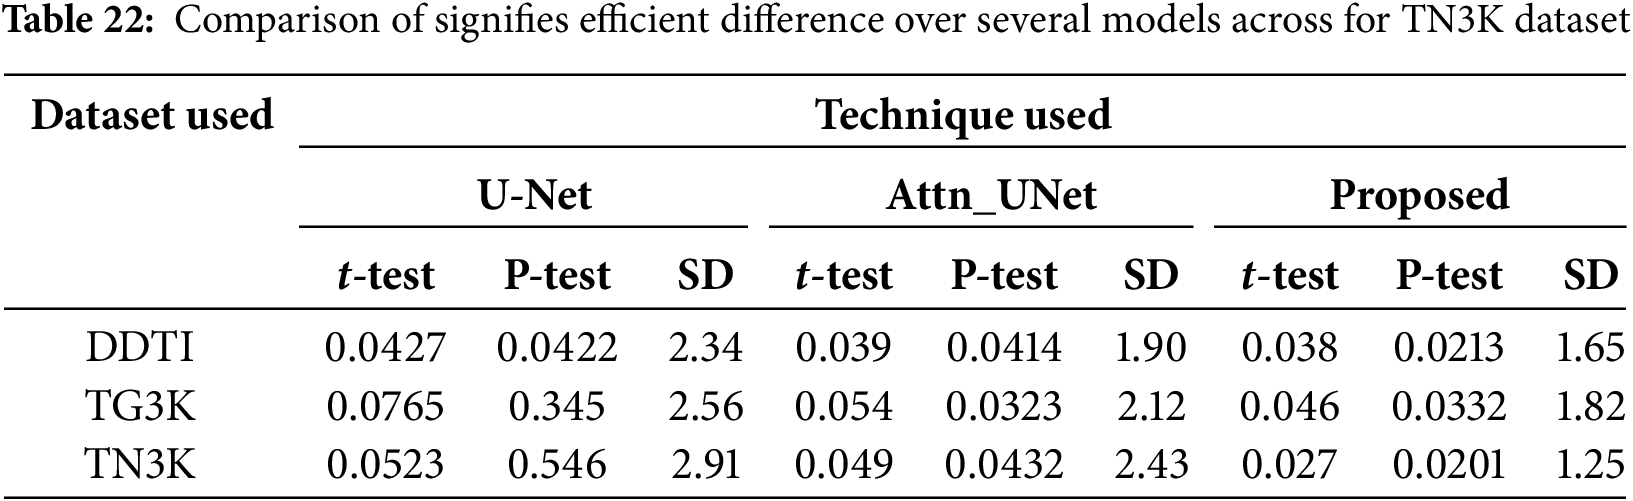
Table 22 illustrate that the p-value is less than 0.05 signifies efficient difference over several models across the dataset. Here, the proposed technique for TN3K dataset has a lower standard deviation which determines the consistent performance of the proposed technique across datasets.
In this section, ablation study is conducted to evaluate the performance of proposed and existing techniques for three datasets which is described in Table 23. Here, module 1 performs the model without using the pre-processing technique and module 2 performed both pre-processing and segmentation process.
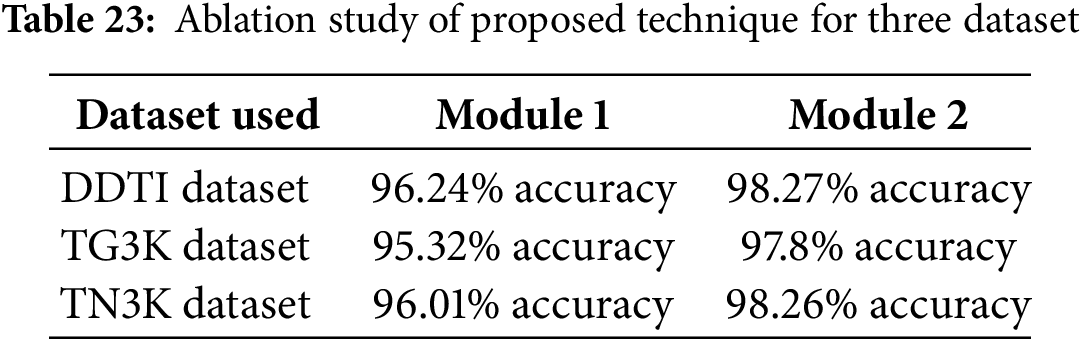
Table 22 illustrate the proposed segmentation technique by performing the pre-processing and with performing the pre-processing technique across three datasets. By comparing to module 1, the module 2 attains efficient results.
4.8 Analysis of Cross-Data Validation, Error Metrics and Complexity
The performance of cross data validation is performed by analyzing the K-fold data analysis which is described in Table 24.
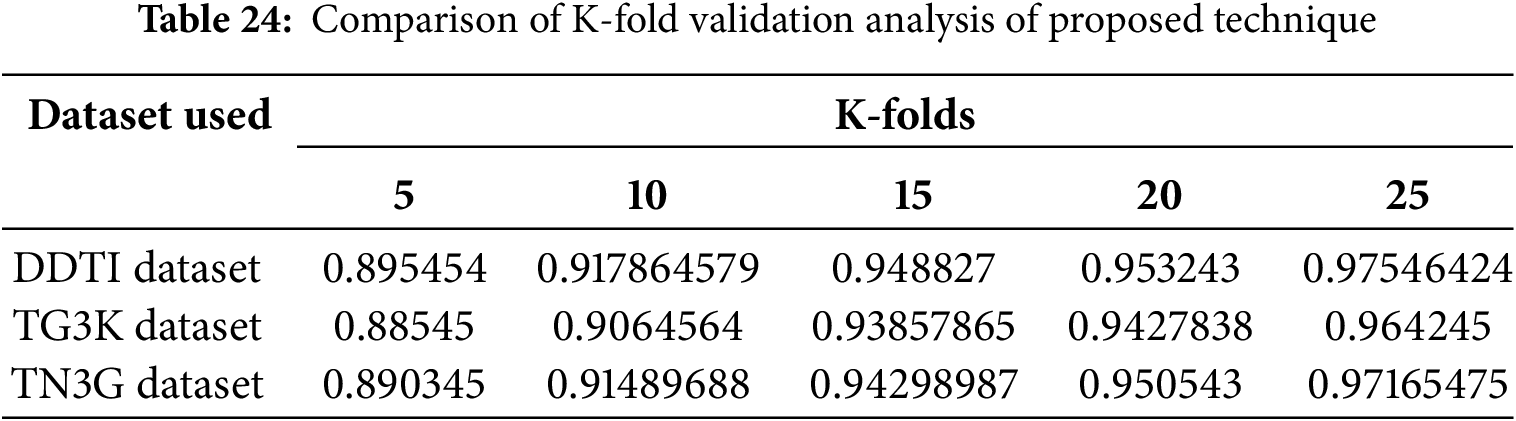
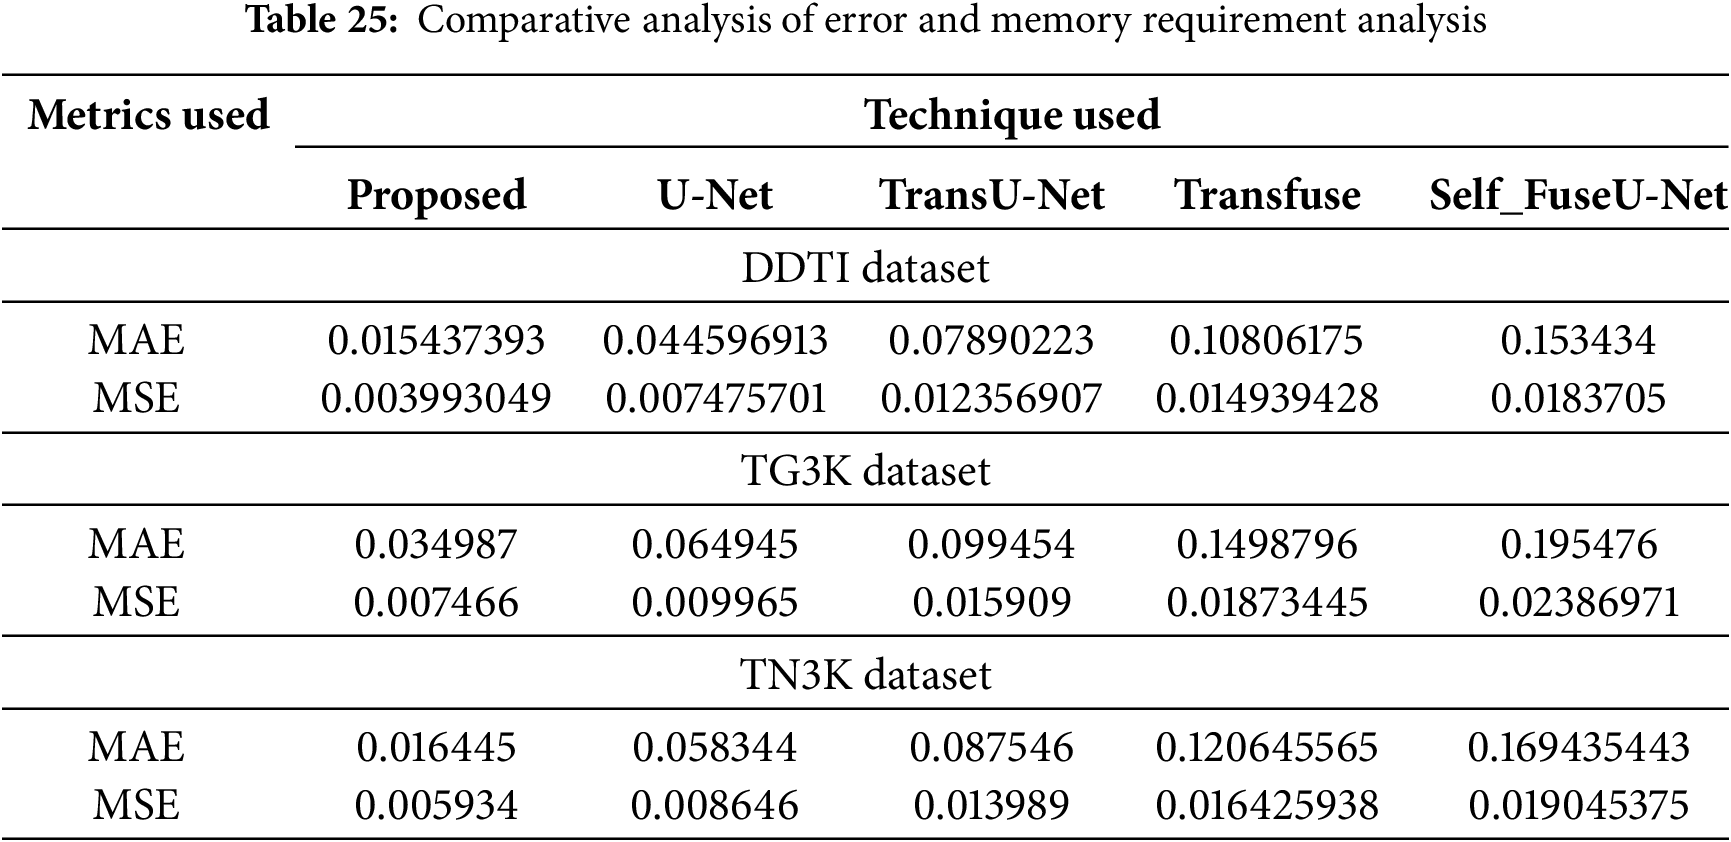
Table 24 illustrates the accuracy of proposed technique for varying numbers of folds across three datasets for thyroid segmentation process. The K-fold analysis is conducted for 5 folds, 10 folds, 15 folds, 20 folds and 25 folds to determine the efficient performance of proposed technique for three datasets. The error metrics and complexity analysis for the proposed technique are described Table 25.
This study presented an efficient thyroid nodule segmentation using a novel transformer-based U-Net mechanism. Initially, each input image is pre-processed using the FBF method. Then, these pre-processed images are separated into large and small overlapping patch scales. After nodule segmentation, the relation transformer plays an important role in feature extraction. This relation transformer model involves two attention phases, such as self and cross-attention. The Co-operative Transformer Fusion module is used to aggregate multi-scale characteristics from two encoders. Finally, fused features are reconstructed using the input images to perform pixel-level calculations, and segmentation is effectively performed. The higher accuracy of 98.2% in the DDTI dataset, 97.8% in the TG3K dataset, and 98.2% in the TN3K dataset established the experimental analysis’s outstanding efficiency for thyroid nodule segmentation. However, the experimentation is limited because only thyroid nodule images were used for lung nodule analysis. It will be considered in the future by using varied images like lung nodules, liver nodules, etc. Future research will concentrate on reducing processing time without compromising the accuracy of segmentation. In the future, a more thorough examination of the model’s generalization abilities with various datasets will be conducted.
Acknowledgement: All the authors would like to acknowledge Bynaboina Uma for supporting them in getting thyroid patients information from different hospitals.
Funding Statement: The authors received no specific funding for this study.
Author Contributions: The authors confirm contribution to the paper as follows: study conception and design: Kaku Haribabu, Prasath R and Praveen Joe IR; data collection: Kaku Haribabu, Prasath R and Praveen Joe IR; analysis and interpretation of results: Kaku Haribabu, Prasath R and Praveen Joe IR; draft manuscript preparation: Kaku Haribabu, Prasath R and Praveen Joe IR. All authors reviewed the results and approved the final version of the manuscript.
Availability of Data and Materials: Data sharing not applicable to this article.
Ethics Approval: Not applicable.
Conflicts of Interest: The authors declare no conflicts of interest to report regarding the present study.
References
1. Adebisi OA, Ojo JA. A review of various segmentation methods for ultrasound thyroid images. Int J Adv Res Sci Eng Technol. 2020;7(8):14577–82. [Google Scholar]
2. Ajilisa OA, Jagathy Raj VP, Sabu MK. A deep learning framework for the characterization of thyroid nodules from ultrasound images using improved inception network and multi-level transfer learning. Diagnostics. 2023;13(14):2463. doi:10.3390/diagnostics13142463. [Google Scholar] [PubMed] [CrossRef]
3. Abdolali F, Shahroudnejad A, Rakkunedeth Hareendranathan A, Jaremko JL, Noga M, Punithakumar K. A systematic review on the role of artificial intelligence in sonographic diagnosis of thyroid cancer: past, present and future. IET Res J. 2020;1:1–9. [Google Scholar]
4. Bini F, Pica A, Azzimonti L, Giusti A, Ruinelli L, Marinozzi F, et al. Artificial intelligence in thyroid field—a comprehensive review. Cancers. 2021;13(19):4740. doi:10.3390/cancers13194740. [Google Scholar] [PubMed] [CrossRef]
5. Chi J, Li Z, Sun Z, Yu X, Wang H. Hybrid transformer UNet for thyroid segmentation from ultrasound scans. Comput Biol Med. 2023;153(12):106453. doi:10.1016/j.compbiomed.2022.106453. [Google Scholar] [PubMed] [CrossRef]
6. Nugroho A, Hidayat R, Nugroho HA. Thyroid ultrasound image segmentation: a review. In: 2019 5th International Conference on Science and Technology (ICST); 2019 Jul 30–31; Yogyakarta, Indonesia. p. 1–6. [Google Scholar]
7. Buda M, Wildman-Tobriner B, Castor K, Hoang JK, Mazurowski MA. Deep learning-based segmentation of nodules in thyroid ultrasound: improving performance by utilizing markers present in the images. Ultrasound Med Biol. 2020;46(2):415–21. doi:10.1016/j.ultrasmedbio.2019.10.003. [Google Scholar] [PubMed] [CrossRef]
8. Gulame MB, Dixit VV, Suresh M. Thyroid nodules segmentation methods in clinical ultrasound images: a review. Mater Today Proc. 2021;45(5):2270–6. doi:10.1016/j.matpr.2020.10.259. [Google Scholar] [CrossRef]
9. Kang Q, Lao Q, Li Y, Jiang Z, Qiu Y, Zhang S, et al. Thyroid nodule segmentation and classification in ultrasound images through intra- and inter-task consistent learning. Med Image Anal. 2022;79(12):102443. doi:10.1016/j.media.2022.102443. [Google Scholar] [PubMed] [CrossRef]
10. Tessler FN, Thomas J. Artificial intelligence for evaluation of thyroid nodules: a primer. Thyroid. 2023;33(2):150–8. doi:10.1089/thy.2022.0560. [Google Scholar] [PubMed] [CrossRef]
11. Zhao WJ, Fu LR, Huang ZM, Zhu JQ, Ma BY. Effectiveness evaluation of computer-aided diagnosis system for the diagnosis of thyroid nodules on ultrasound: a systematic review and meta-analysis. Medicine. 2019;98(32):e16379. doi:10.1097/MD.0000000000016379. [Google Scholar] [PubMed] [CrossRef]
12. Liang J, Pang T, Liu W, Li X, Huang L, Gong X, et al. Comparison of six machine learning methods for differentiating benign and malignant thyroid nodules using ultrasonographic characteristics. BMC Med Imaging. 2023;23(1):154. doi:10.1186/s12880-023-01117-z. [Google Scholar] [PubMed] [CrossRef]
13. Baldota S, Malathy C. Classification of ultrasound thyroid nodule images by computer-aided diagnosis: a technical review. In: Computational vision and bio-inspired computing: ICCVBIC 2020. Berlin/Heidelberg, Germany: Springer; 2021. p. 353–68. [Google Scholar]
14. Pan H, Zhou Q, Latecki LJ. SGUNET: semantic guided UNET for thyroid nodule segmentation. In: IEEE 18th International Symposium on Biomedical Imaging (ISBI); 2021 Apr 13–16; Nice, France. p. 630–4. [Google Scholar]
15. Liu M, Yuan X, Zhang Y, Chang K, Deng Z, Xue J. An end to end thyroid nodule segmentation model based on optimized U-Net convolutional neural network. In: Proceedings of the 1st International Symposium on Artificial Intelligence in Medical Sciences; 2020 Sep 11–13; Beijing, China. p. 74–78. [Google Scholar]
16. Cao Y, Zhong X, Diao W, Mu J, Cheng Y, Jia Z. Radiomics in differentiated thyroid cancer and nodules: explorations, application, and limitations. Cancers. 2021;13(10):2436. doi:10.3390/cancers13102436. [Google Scholar] [PubMed] [CrossRef]
17. Lin X, Zhou X, Tong T, Nie X, Wang L, Zheng H, et al. A super-resolution guided network for improving automated thyroid nodule segmentation. Comput Methods Programs Biomed. 2022;227(4):107186. doi:10.1016/j.cmpb.2022.107186. [Google Scholar] [PubMed] [CrossRef]
18. Nguyen DT, Choi J, Park KR. Thyroid nodule segmentation in ultrasound image based on information fusion of suggestion and enhancement networks. Mathematics. 2022;10(19):3484. doi:10.3390/math10193484. [Google Scholar] [CrossRef]
19. Wang Y, Jiang C, Luo S, Dai Y, Zhang J. Graph neural network enhanced dual-branch network for lesion segmentation in ultrasound images. Expert Syst Appl. 2024;256(1):124835. doi:10.1016/j.eswa.2024.124835. [Google Scholar] [CrossRef]
20. Zhou YT, Yang TY, Han XH, Piao JC. Thyroid-DETR: thyroid nodule detection model with transformer in ultrasound images. Biomed Signal Process Contr. 2024;98(4):106762. doi:10.1016/j.bspc.2024.106762. [Google Scholar] [CrossRef]
21. Chen G, Tan G, Duan M, Pu B, Luo H, Li S, et al. MLMSeg: a multi-view learning model for ultrasound thyroid nodule segmentation. Comput Biol Med. 2024;169(10061):107898. doi:10.1016/j.compbiomed.2023.107898. [Google Scholar] [PubMed] [CrossRef]
22. Bi H, Cai C, Sun J, Jiang Y, Lu G, Shu H, et al. BPAT-UNet: boundary preserving assembled transformer UNet for ultrasound thyroid nodule segmentation. Comput Methods Programs Biomed. 2023;238(4):107614. doi:10.1016/j.cmpb.2023.107614. [Google Scholar] [PubMed] [CrossRef]
23. Vahdati S, Khosravi B, Robinson KA, Rouzrokh P, Moassefi M, Akkus Z, et al. A multi-view deep learning model for thyroid nodules detection and characterization in ultrasound imaging. Bioengineering. 2024;11(7):648. doi:10.3390/bioengineering11070648. [Google Scholar] [PubMed] [CrossRef]
24. Agustin S, Sruthy S, James A, Simon P. Residual U-Net approach for thyroid nodule detection and classification from thyroid ultrasound images. Autom : Časopis Za Autom Mjer Elektron Računarstvo I Komun. 2024;65(3):726–37. doi:10.1080/00051144.2024.2316503. [Google Scholar] [CrossRef]
25. Luo H, Ma L, Wu X, Tan G, Zhu H, Wu S, et al. Deep learning-based ultrasonic dynamic video detection and segmentation of thyroid gland and its surrounding cervical soft tissues. Med Phys. 2022;49(1):382–92. doi:10.1002/mp.15332. [Google Scholar] [PubMed] [CrossRef]
26. Cao CL, Li QL, Tong J, Shi LN, Li WX, Xu Y, et al. Artificial intelligence in thyroid ultrasound. Front Oncol. 2023;13:1060702. doi:10.3389/fonc.2023.1060702. [Google Scholar] [PubMed] [CrossRef]
27. Yadav N, Dass R, Virmani J. Objective assessment of segmentation models for thyroid ultrasound images. J Ultrasound. 2023;26(3):673–85. doi:10.1007/s40477-022-00726-8. [Google Scholar] [PubMed] [CrossRef]
28. Arepalli L, Rao KV, Dabbiru M. Deep learning approach for analyzing and predicting thyroid cancer in computed tomography images. SN Comput Sci. 2023;4(5):622. doi:10.1007/s42979-023-02010-w. [Google Scholar] [CrossRef]
29. Sharifi Y, Bakhshali MA, Dehghani T, DanaiAshgzari M, Sargolzaei M, Eslami S. Deep learning on ultrasound images of thyroid nodules. Biocybern Biomed Eng. 2021;41(2):636–55. doi:10.1016/j.bbe.2021.02.008. [Google Scholar] [CrossRef]
30. Gong H, Chen J, Chen G, Li H, Li G, Chen F. Thyroid region prior guided attention for ultrasound segmentation of thyroid nodules. Comput Biol Med. 2023;155:106389. [Google Scholar] [PubMed]
31. Abdolali F, Kapur J, Jaremko JL, Noga M, Hareendranathan AR, Punithakumar K. Automated thyroid nodule detection from ultrasound imaging using deep convolutional neural networks. Comput Biol Med. 2020;122:103871. [Google Scholar] [PubMed]
32. Shahroudnejad A, Vega R, Forouzandeh A, Balachandran S, Jaremko J, Noga M, et al. Thyroid nodule segmentation and classification using deep convolutional neural network and rule-based classifiers. In: 2021 43rd Annual International Conference of the IEEE Engineering in Medicine & Biology Society (EMBC); 2021 Nov 1–5. p. 3118–21. [Google Scholar]
33. Nie X, Zhou X, Tong T, Lin X, Wang L, Zheng H, et al. N-Net: a novel dense fully convolutional neural network for thyroid nodule segmentation. Front Neurosci. 2022;16:872601. [Google Scholar] [PubMed]
34. Abbasian Ardakani A, Bitarafan-Rajabi A, Mohammadzadeh A, Mohammadi A, Riazi R, Abolghasemi J, et al. A hybrid multilayer filtering approach for thyroid nodule segmentation on ultrasound images. J Ultrasound Med. 2019;38(3):629–40. [Google Scholar] [PubMed]
35. Xiang Z, Tian X, Liu Y, Chen M, Zhao C, Tang LN, et al. Federated learning via multi-attention guided UNet for thyroid nodule segmentation of ultrasound images. Neural Netw. 2025;181:106754. [Google Scholar] [PubMed]
36. Yan P, Li M, Zhang J, Li G, Jiang Y, Luo H. Cold SegDiffusion: a novel diffusion model for medical image segmentation. Knowl Based Syst. 2024;301:112350. [Google Scholar]
37. Liu W, Lin C, Chen D, Niu L, Zhang R, Pi Z. Shape-margin knowledge augmented network for thyroid nodule segmentation and diagnosis. Comput Methods Programs Biomed. 2024;244:107999. [Google Scholar] [PubMed]
38. Deng P, Han X, Wei X, Chang L. Automatic classification of thyroid nodules in ultrasound images using a multi-task attention network guided by clinical knowledge. Comput Biol Med. 2022;150:106172. [Google Scholar] [PubMed]
39. Ma X, Sun B, Liu W, Sui D, Shan S, Chen J, et al. Tnseg: adversarial networks with multi-scale joint loss for thyroid nodule segmentation. J Supercomput. 2024;80(5):6093–118. [Google Scholar]
40. Lin A, Chen B, Xu J, Zhang Z, Lu G, Zhang D. DS-TransUNet: dual swin transformer U-Net for medical image segmentation. IEEE Trans Instrum Meas. 2022;71:4005615. [Google Scholar]
41. Deng X, Dang Z, Pan L. STU3Net: an improved U-Net with swin transformer fusion for thyroid nodule segmentation. Int J Imaging Syst Tech. 2024;34(5):e23160. [Google Scholar]
42. Fan L, Zhang F, Fan H, Zhang C. Brief review of image denoising techniques. Vis Comput Ind Biomed Art. 2019;2:7. [Google Scholar] [PubMed]
Cite This Article
 Copyright © 2025 The Author(s). Published by Tech Science Press.
This work is licensed under a Creative Commons Attribution 4.0 International License , which permits unrestricted use, distribution, and reproduction in any medium, provided the original work is properly cited.
 Downloads
 Citation Tools