
 Submit a Paper
 Propose a Special lssue
 Open Access
ARTICLE
Advanced Computational Modeling for Brain Tumor Detection: Enhancing Segmentation Accuracy Using ICA-I and ICA-II Techniques
1 Radiological Sciences Department, College of Applied Medical Sciences, Najran University, Najran, 61441, Saudi Arabia
2 Artificial Intelligence and Cyber Futures Institute, Charles University, Bathurst, NSW 2795, Australia
3 Department of Electronic Engineering, The University of Larkano, Larkana, 75660, Pakistan
4 Electrical Engineering Department, Sukkur IBA University, Sukkur, 65200, Pakistan
5 Computer Science Department, Sukkur IBA University, Sukkur, 65200, Pakistan
6 Electrical Engineering Department, College of Engineering, Najran University, Najran, 61441, Saudi Arabia
7 Anatomy Department, Medicine College, Najran University, Najran, 61441, Saudi Arabia
8 Department of Radiological Sciences, College of Applied Medical Science, King Khalid University, Guraiger, Abha, 62521, Saudi Arabia
9 Radiology and Medical Imaging Department, College of Applied Medical Sciences, Prince Sattam bin Abdulaziz University, Kharj, 11942, Saudi Arabia
10 Radiological Sciences Department, College of Applied Medical Sciences, Taif University, Taif, 21944, Saudi Arabia
* Corresponding Authors: Toufique A. Soomro. Email: ; Muhammad Irfan. Email:
Computer Modeling in Engineering & Sciences 2025, 143(1), 255-287. https://doi.org/10.32604/cmes.2025.061683
Received 30 November 2024; Accepted 07 March 2025; Issue published 11 April 2025
 View Full Text
 Download PDF
Abstract
Global mortality rates are greatly impacted by malignancies of the brain and nervous system. Although, Magnetic Resonance Imaging (MRI) plays a pivotal role in detecting brain tumors; however, manual assessment is time-consuming and susceptible to human error. To address this, we introduce ICA2-SVM, an advanced computational framework integrating Independent Component Analysis Architecture-2 (ICA2) and Support Vector Machine (SVM) for automated tumor segmentation and classification. ICA2 is utilized for image preprocessing and optimization, enhancing MRI consistency and contrast. The Fast-Marching Method (FMM) is employed to delineate tumor regions, followed by SVM for precise classification. Validation on the Contrast-Enhanced Magnetic Resonance Imaging (CE-MRI) dataset demonstrates the superior performance of ICA2-SVM, achieving a Dice Similarity Coefficient (DSC) of 0.974, accuracy of 0.992, specificity of 0.99, and sensitivity of 0.99. Additionally, the model surpasses existing approaches in computational efficiency, completing analysis within 0.41 s. By integrating state-of-the-art computational techniques, ICA2-SVM advances biomedical imaging, offering a highly accurate and efficient solution for brain tumor detection. Future research aims to incorporate multi-physics modeling and diverse classifiers to further enhance the adaptability and applicability of brain tumor diagnostic systems.Keywords
In medical science, tumors are a major concern and are classified as either malignant or benign neoplasms. These growths span over 200 distinct types, each with the potential to affect the human body in various ways [1]. Among them, brain tumors are particularly critical, as they involve the abnormal proliferation of brain tissue, leading to disruptions in essential brain functions. Alarmingly, the mortality rate from brain tumors has seen a dramatic increase of 300% over the past three decades, as reported by the National Brain Tumor Foundation (NBTF) [2]. If left untreated, brain tumors pose a severe threat to life [3]. The complexity of these tumors presents significant challenges for healthcare professionals in their efforts to accurately diagnose and treat affected patients.
The survival of individuals with brain tumors heavily relies on early detection and timely treatment [4]. However, diagnosing brain tumors through biopsy is a challenging process, requiring surgical intervention that carries inherent risks. This highlights the critical need for non-invasive diagnostic methods. MRI has emerged as the most reliable technique for identifying brain tumors, providing detailed insights into the brain’s internal structures. Utilizing magnetic fields and radio waves, MRI offers a non-invasive approach to detecting and analyzing brain tissue abnormalities [5].
Brain MRI plays a critical role in diagnosing and classifying brain tumors, providing essential insights into brain abnormalities. By employing advanced imaging techniques, MRI generates input vectors that assist radiologists in distinguishing between normal brain structures and various tumor types. These images are invaluable for detecting structural changes caused by surgeries or neurological conditions such as epilepsy [6,7]. MRI also serves as a vital tool for predicting abnormalities and differentiating between tumor types, offering precise, high-resolution views of the brain intricate tissues [8,9]. Diagnosing tumors from medical images is error-prone and relies heavily on radiologists’ expertise. The diversity of pathologies and specialist fatigue underscore the need for computer-assisted interventions, which have shown promise in aiding brain tumor identification and classification [10,11].
This research introduces a novel enhancement method to improve contrast in brain MRI images, refining image clarity and enabling more accurate tumor detection and diagnosis. By providing sharper and higher-quality images, this approach enhances diagnostic precision and aids healthcare professionals in making informed treatment decisions. The work focuses on an in-depth analysis of FAST Independent Component Analysis (ICA) architectures I and II, evaluating their performance and comparing them to existing techniques. Statistical and visual analyses were conducted to identify the architecture with superior image enhancement capabilities, simplifying the detection of brain tumors in MRI scans. By advancing medical imaging quality, this research contributes to more precise diagnoses, facilitating timely and effective treatment and offering valuable insights to improve patient care and outcomes.
Furthermore, ICA and Fast ICA techniques have been widely applied in biomedical imaging, demonstrating their effectiveness in contrast enhancement. In retinal imaging, these methods have been utilized to enhance vessel visibility and detect abnormalities such as diabetic retinopathy and contributing to improved diagnostic accuracy [12,13]. Similarly, in ultrasound imaging, Fast ICA has been employed to reduce speckle noise, thereby improving the clarity of cardiac and vascular structures [14]. These applications underscore the adaptability of ICA-based techniques, showcasing their value in addressing diverse imaging challenges across various medical domains.
In this research work, the FAST Independent Component Analysis (FAST ICA) algorithm [15] was utilized due to its proven effectiveness in various fields, including medical imaging, image segmentation, digital image fraud detection, and facial recognition. The primary objective was to enhance brain MRI images by mitigating noise generated during the image acquisition process. Two commonly used ICA architectures, ICA1 and ICA2, were evaluated to determine the optimal design for brain MRI images. Through a detailed comparison, ICA2 was identified as the superior architecture, excelling in contrast enhancement and image clarity.
This study introduces a comprehensive processing pipeline for brain MRI enhancement and classification, integrating multiple techniques to optimize image quality and diagnostic accuracy. The dual-phase enhancement technique, centered on ICA2, plays a key role in improving contrast and reducing noise. The first phase focuses on noise suppression, while the second phase enhances contrast and overall image clarity. However, the novelty of this work extends beyond ICA-based enhancement, incorporating filtering, segmentation, and classification to ensure an effective end-to-end solution. The key contributions of this study are as follows:
1. Developed a complete image processing framework that integrates noise reduction, ICA-based contrast enhancement, filtering, segmentation, and classification for improved brain MRI analysis.
2. Conducted a comparative assessment of ICA1 and ICA2, demonstrating ICA2’s effectiveness in isolating independent components and reducing noise more efficiently.
3. Implemented a dual-phase enhancement method, significantly improving image clarity, which enhances segmentation precision.
4. Applied segmentation using the Fast Marching Method (FMM) and classification with a Support Vector Machine (SVM) to ensure accurate tumor detection and differentiation.
By integrating image enhancement, segmentation, and classification, this pipeline provides a structured and efficient approach to brain MRI analysis, ensuring higher accuracy and performance compared to traditional single-step methods. The effectiveness of this approach was validated through brain tumor segmentation and classification, where the enhanced images significantly improved detection accuracy. Utilizing Support Vector Machine (SVM) for classification, the refined images demonstrated better precision in identifying tumor regions. The application of ICA2 within a dual-phase framework enhanced brain structure visualization, leading to more accurate segmentation and classification. This comprehensive methodology strengthens diagnostic accuracy, offering a reliable solution for automated brain tumor analysis.
The novelty of this research lies in its tailored enhancement approach for brain MRI scans, which improves the accuracy and reliability of brain tumor detection. While MRI is a widely used diagnostic tool, achieving high-quality images is essential for detecting abnormalities. This study uniquely evaluates ICA1 and ICA2, establishing ICA2 as the optimal architecture for contrast enhancement and noise reduction. Furthermore, the integration of computational intelligence techniques highlights the value of computer-assisted methods in brain tumor diagnosis. This innovative approach supports healthcare professionals in minimizing diagnostic errors and optimizing treatment planning.
Additionally, the study validates the enhancement technique by applying it to real-world segmentation and classification tasks. Through rigorous testing with classifiers, including SVM, the method demonstrated its capability to improve brain structure visualization and enhance the accuracy of tumor detection. The practical application of this approach underscores its functionality and reliability in clinical scenarios. This research encompasses critical stages, including evaluating ICA architectures, implementing the enhancement process, and analyzing its impact. The computer-aided diagnosis (CAD) system developed is specifically designed for brain tumor detection, offering valuable insights for enhancing brain MRI images. This system represents a significant advancement in medical imaging, paving the way for improved diagnostic and treatment outcomes.
The article is organized as follows: Section 2 reviews prior studies, Section 3 describes the proposed model, Section 4 outlines the datasets and experimental setup, Section 5 discusses the results, and Section 6 concludes the research.
The classification of various forms of brain disorders using MRI scans has been the subject of several efficient and detailed investigations over the last couple of years. The majority of these studies performed more effective on a small brain MRI dataset. On bigger testing datasets, however, their assessments decreased proportionately. As a consequence, it is necessary to develop a reliable and accurate framework that produces successful classiffication assessment based on a vast brain database for MRI.
Jia et al. [16] reported a completely autonomous brain tumor segmentation approach based on CNN and support vector machines. Additionally, segmentation was carried out in depth using a number of approaches, including structural, morphological, and relaxometry. However, Yamanakkanavar et al. [17] noted that the approaches used in this framework were somewhat less significant when a greater number of MRI images were used. Since it is difficult for these techniques to correctly identify anomalies in the brain MRI images [17]. Additionally, Nayak et al. [18] reported a modified CNN-based model for the analysis of brain cancers. Forensic-based investigation algorithms (FBIA), material generation algorithms (MGA), and sunflower optimization techniques were used by the authors in addition to CNN. They reported that they had the MRI dataset greatest classification accuracy. However, initializing and early convergence might have a significant negative impact on Sunflower Optimization Algorithm (SFOA). Additionally, Single-slice inputs are used to establish MGA calculations, which theoretically limits the amount of data that the algorithm can access.
Likewise, developed an advanced technique for the classification of different brain conditions using an MRI database [19]. In order to improve classification performance on the MRI dataset, the author employed dense EfficientNet, a convolutional neural network-based method, together with mix-min normalization. The model computational speed is slowed down by the large number of operations used in this method [20]. The same integrated approach was developed by [21] who used MRI and CT images to classify brain tumors based on CNN and a semantic segmentation model connected to GoogleNet.
For classifying brain tumors, Veeramuthu et al. [22] developed an integrated strategy in which they combined an image-based classifier with a feature-based classifier. Additionally, their reported strategy was built on deep CNN. The authors obtained a similar rate of classification. However, this method needs a substantial amount of training data and correctly designed deep networks [23]. Similar to this, Wahlang et al. [24] introduced an advanced approach for the classification of age, gender, and brain MRI data. To accurately distinguish between abnormal and normal MRIs, authors used deep CNN, SVM, ResNet, AlexNet, and LeNet. The majority of the trials were conducted in a static context, however, the method performed better on a tiny dataset. Similar to this, Shenbagarajan et al [25] suggested an effective MRI dataset-based brain classification system. When features were retrieved using textual and shape methods, including active contour depending on region, their system performed well. However, the region-based approach basic flaw, is its sensitivity to initialization, which results in improper segmentation of the area of interest [26].
Gab Allah et al. [27] reported a progressive growing generative adversarial network (PGGAN) architecture and an integrated system based on the Visual Geometry Group 19-layer CNN (VGG19) feature extractor aimed at brain tumor classification using an MRI dataset. The authors successfully classified data from an MRI dataset that was made accessible to the public.
The PGGAN model, however, is unable to produce images of high resolution using this method [28]. Additionally, this method could fail to provide new examples of objects in the right condition [29]. Mahalakshmi et al. [30], put up another cutting-edge technique that included procedures including preprocessing, classification, feature extraction, and segmentation. After applying a Wiener filter, edge detection helped to enhance the image. A mean-shift clustering method was employed for the segmentation of the tumor. The gray levels co-occurrence matrix (GLCM) was used to derive the feature from the segmented tumor, and SVM was used for the classification. The resulting features are determined by comparing the differences of related pixels. However, the sizes of these differences were not taken into consideration [31].
Aaraji et al. [32] reported a cutting-edge system for classifying Alzheimer’s disease based on MRI scans [32]. In this architecture, the preprocessing stage included enhancing the associated MRI image, and the postprocessing step involved segmenting the brain tissues. In addition, several deep learning (DL) methods (such as CNN) were used for the classification of relevant illnesses. Over fitting is a challenge for the convolutional neural network [33]. Additionally, a small dataset has been used to test and verify this technique. Similarly, on a large brain MRI database. However, SWLDA is a linear technique that can only be applied to a limited subset of binary classification problems [34].
Zahid Rasheed et al. [35] present a new method that integrates image improvement methods, including adaptive histogram equalization and Gaussian blur-based sharpening through Contrast Limited Adaptive Histogram Equalization (CLAHE), along with a proposed model for classifying tumor kinds such as pituitary, meningioma glioma tumor and non-tumor cases. The algorithm underwent testing with benchmark data and was evaluated against pre-established models like MobileNetV2, InceptionV3, VGG19, ResNet50, and VGG16, achieving impressive outcomes, including an F1-score of 97.90%, a sensitivity of 97.85%, a precision of 97.85%, and overall accuracy of 97.84%. However, limitations include reliance on the quality and variety of training data, potential challenges with generalization to new datasets, and significant computational resources required for training and deployment. Further validation of various datasets is necessary to ensure robustness and generalizability. Abdusalomov et al. used a large image dataset to address brain tumor detection in MRI scans. Applying transfer learning to refine the YOLOv7 model significantly improved its ability to detect pituitary, gliomas, and meningiomas, tumors. The DL model reached an outstanding 99.5% accuracy, successfully identifying and localizing brain tumors in MRI scans. However, further research is needed to ensure the model’s effectiveness in detecting smaller tumors, highlighting the need to improve detection systems continually. This study aims to improve diagnostic tools to benefit both healthcare providers and patients in combating brain cancer.
Aamir et al. [36] proposed an automated technique to detect brain tumors using MRI. The method involves preprocessing MRI images, extracting features with two pre-trained deep learning models, and combining these features through the PLS (the partial least squares) method. Tumor regions are pinpointed via agglomerative clustering, standardized, and classified by the core network. This technique achieved a classification accuracy of 98.95%, outperforming existing methods. However, further validation of various datasets is needed to ensure their robustness and generalizability. Several studies on the classification of brain disorders using MRI have shown limitations when applied to larger datasets.
1. Approaches based on CNN and support vector machines have faced difficulties maintaining their significance with increasing dataset sizes. They also encountered problems such as early convergence and limited data access due to single-slice inputs.
2. Integrating image- and feature-based classifiers has shown promise but requires substantial training data and well-designed deep networks for optimal performance. Advanced techniques such as PGGAN architecture and statistical methods have demonstrated their potential but face challenges such as limited resolution and sensitivity to pixel differences.
3. Methods combining image enhancement and classification have achieved notable results but have faced challenges regarding training data quality, generalization, and computational resources.
In response to these limitations, this research seeks to create a comprehensive system for brain disease classification using MRI data. Using a symlet-wavelet technique, the proposed framework extracts the important characteristics from brain MRI images. In addition, LDAI was used to reduce the features space size, and logistic regression is used for classification. When compared to previous papers, the proposed method produced excellent classification outcomes.
ICA is a robust computational technique utilized for the linear transformation of images and signals. Its primary objective is to decompose a mixture of statistically dependent signals or images into their independent components, with each component being statistically distinct. This is achieved by identifying a set of mixing coefficients that reconstruct the original signals or images as a linear combination of the independent components. This concept is modeled mathematically, as demonstrated by Eq. (1) in the research study. Using this model, ICA estimates the independent components by solving for both the mixing matrix and the source signals based on the observed mixed signals.
Eq. (1) presents the core ICA framework, which consists of two primary vectors: the mixed signal vector X and the independent component vector S. These vectors are stochastic, having zero mean and unit variance. The mixing matrix A is a square, unidentified matrix that combines the independent components. Importantly, the components in vector S are assumed to follow a non-Gaussian distribution, a fundamental requirement for ICA. Accurately estimating non-Gaussianity is critical for extracting the independent components. Without it, effectively identifying the original separate components becomes challenging.
The ICA process relies on observations from the mixed signal vector X, aiming to approximate the unknown elements, namely the mixing matrix A and the independent component vector S. Once the mixing matrix A is estimated, its inverse, represented by W, can be computed. The independent components S can then be reconstructed from the mixed signals X using Eq. (2). This reconstruction facilitates the isolation and identification of the original independent sources, revealing their underlying structure and characteristics.
The approximation of matrix W is typically performed using the FASTICA algorithm [15], which employs a fixed-point iteration method to extract individual independent components. To extract multiple components, FASTICA must be executed iteratively
In this study, two distinct ICA architectures, referred to as ICA1 and ICA2, are employed to extract feature vectors from Brain MRI images. These architectures are designed to evaluate ICA’s effectiveness in improving image contrast and extracting meaningful independent components from complex signal combinations.
2.1 ICA Architecture 1 (ICA1) for Brain MRI Images
The ICA1 framework, brain MRI images are organized into a data matrix where each row represents an individual MRI scan, treated as an independent component. Fig. 1 illustrates this structure, with MRI images modeled as stochastic variables and their individual pixels regarded as observations or data points. This arrangement allows the ICA algorithm to identify statistical dependencies among pixels and derive the underlying independent components.
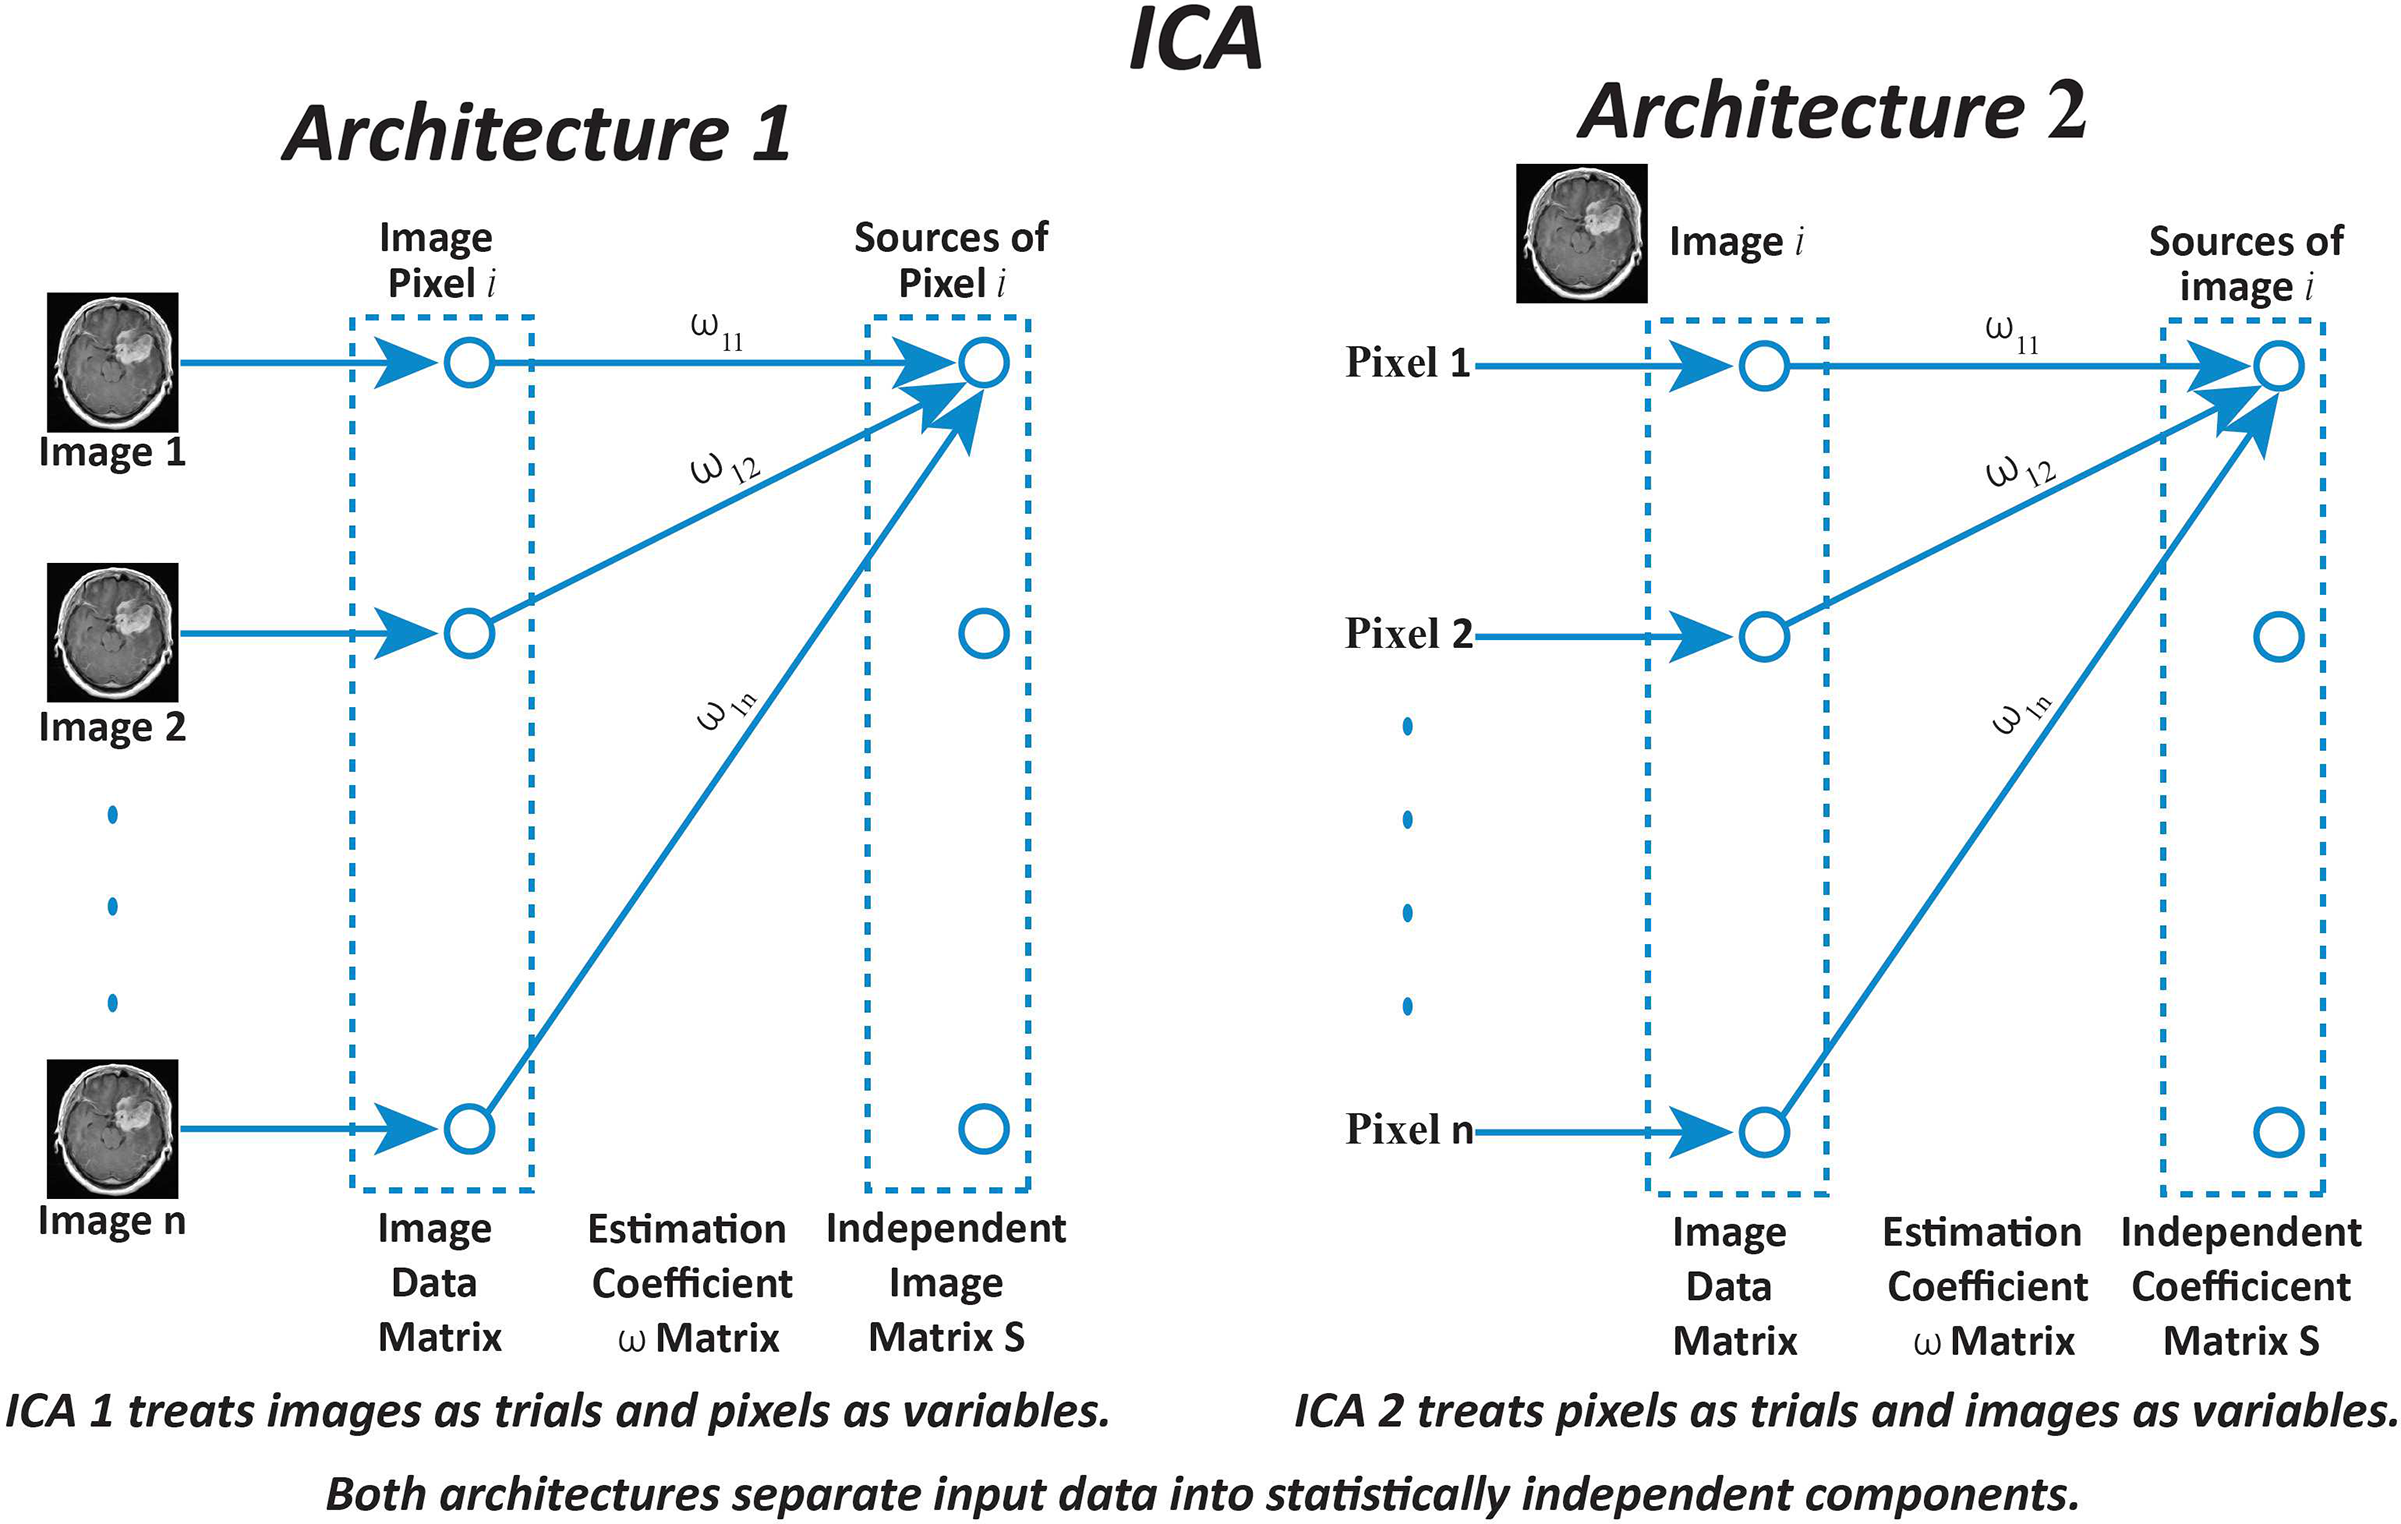
Figure 1: Diagrammatic representation of Independent Component Analysis (ICA) architectures applied to brain MRI image enhancement. ICA Architecture 1 (ICA1) processes entire images as separate trials, with individual pixels treated as variables. In contrast, ICA Architecture 2 (ICA2) considers each pixel as a trial and treats entire images as variables. The estimation coefficient matrix W is utilized in both architectures to extract statistically independent components from the input data. This distinction enables ICA1 and ICA2 to enhance image contrast and suppress noise differently, contributing to improved brain MRI analysis
The data matrix X is constructed by combining
In ICA1, training samples are represented as column vectors of images, forming a data matrix X with dimensions
The implementation of ICA1 involves the following steps:
1. Centering Phase: The mean vector
2. Whitening Phase: The centered matrix is whitened using Principal Component Analysis (PCA). The covariance matrix
where
3. Transformation Phase: The centered matrix
where
4. The whitened matrix
The matrix
These components represent distinct features in the brain, such as structural variations or functional activity. By isolating these features, ICA aids in tasks like image enhancement, noise reduction, and anomaly detection. These insights are particularly valuable for diagnosing neurological conditions and advancing medical imaging research.
The ICA2 framework organizes the data matrixX into column vectors, with each column representing an individual image. A significant distinction from ICA1 is that the data matrix in ICA2 is transposed. This transformation reconfigures the data, treating images as trials and pixels as variables, which is essential for ICA2’s analysis. The transposed structure ensures compatibility with the ICA2 methodology and facilitates the accurate extraction of independent components by analyzing pixel-level variations. Fig. 1 depicts the ICA2 model, highlighting the rearranged roles of variables and trials. Assuming the data matrix
1. Centering of ICA2: In the centering stage, the mean vector
This mean is subtracted from each column of X, resulting in a centered matrix
2. Whitening OF ICA2: The next step is whitening, which eliminates linear correlations between variables. This involves calculating the covariance matrix, deriving eigenvectors and eigenvalues, and transforming the data such that its components are uncorrelated and standardized. Whitening prepares the data for independent component extraction by ICA.
3. Independent Component Extraction: Following preprocessing, ICA2 computes the independent coefficients, represented as:
Here,
This projection isolates statistically independent components, providing meaningful insights into the data.
The extracted components reveal distinct patterns and structures within the image dataset, corresponding to features such as anatomical or functional variations. By leveraging pixel-level independence, ICA2 enhances the analysis of complex image datasets and supports tasks like feature extraction, denoising, and structural pattern identification.
3 Materials and Proposed Method
3.1 Material: Contrast-Enhanced MRI Database
The term “Contrast-Enhanced MRI database” commonly refers to a collection of images obtained via contrast-enhanced MRI (CE-MRI) methods, which play a vital role in analyzing biological structures. In CE-MRI procedures, contrast agents are introduced during scans to enhance the visibility of specific tissues or pathological conditions within MRI brain images. Key points regarding CE-MRI datasets (the database can be accessed from Brain Tumor CE-MRI Dataset) and their applications:
1. Various imaging methods, such as contrast-enhanced T1-weighted sequences, are employed to capture CE-MRI datasets. These enhanced T1-weighted sequences enable the visualization and measurement of the distribution of contrast agents in tissues over time.
2. CE-MRI datasets are often assembled for research purposes during clinical studies. Notably, public repositories and research institutions such as ADNI (The Alzheimer’s Disease Neuroimaging Initiative) (ADNI) and the TCIA (The Cancer Imaging Archive) host MRI databases, including CE-MRI data together with various imaging techniques.
3. CE-MRI data collections largely consist of three-dimensional image sets collected over various intervals following the contrast agent injection. These datasets may include reference anatomical sequences, as well as additional pre-contrast images and dynamic post-contrast series.
4. CE-MRI is frequently employed for the evaluation of brain tumors and delineation of tumor boundaries in brain tumor imaging. Contrast-enhanced sequences help identify regions bearing tumors within brain MRI images, supporting the processes of diagnosis, therapeutic planning, as well as therapy efficacy assessment.
5. This dataset includes 3064 T1-weighted images with contrast enhancement, collected from 233 subjects, encompassing three specific brain tumor categories: pituitary (930 images), gliomas (1426 images), meningiomas tumors (708 images) [38].
6. The CE-MRI dataset we use is source from the CE-MRI Image Database, compiled by Nanfang Hospital in Guangzhou, China, and the General Hospital at Tianjin Medical University, China, spanning the years 2005 to 2010. This collection contains 3064 images from 233 subjects, featuring 930 pituitary tumors, 708 meningiomas, and 1426 gliomas. The images are at a resolution of
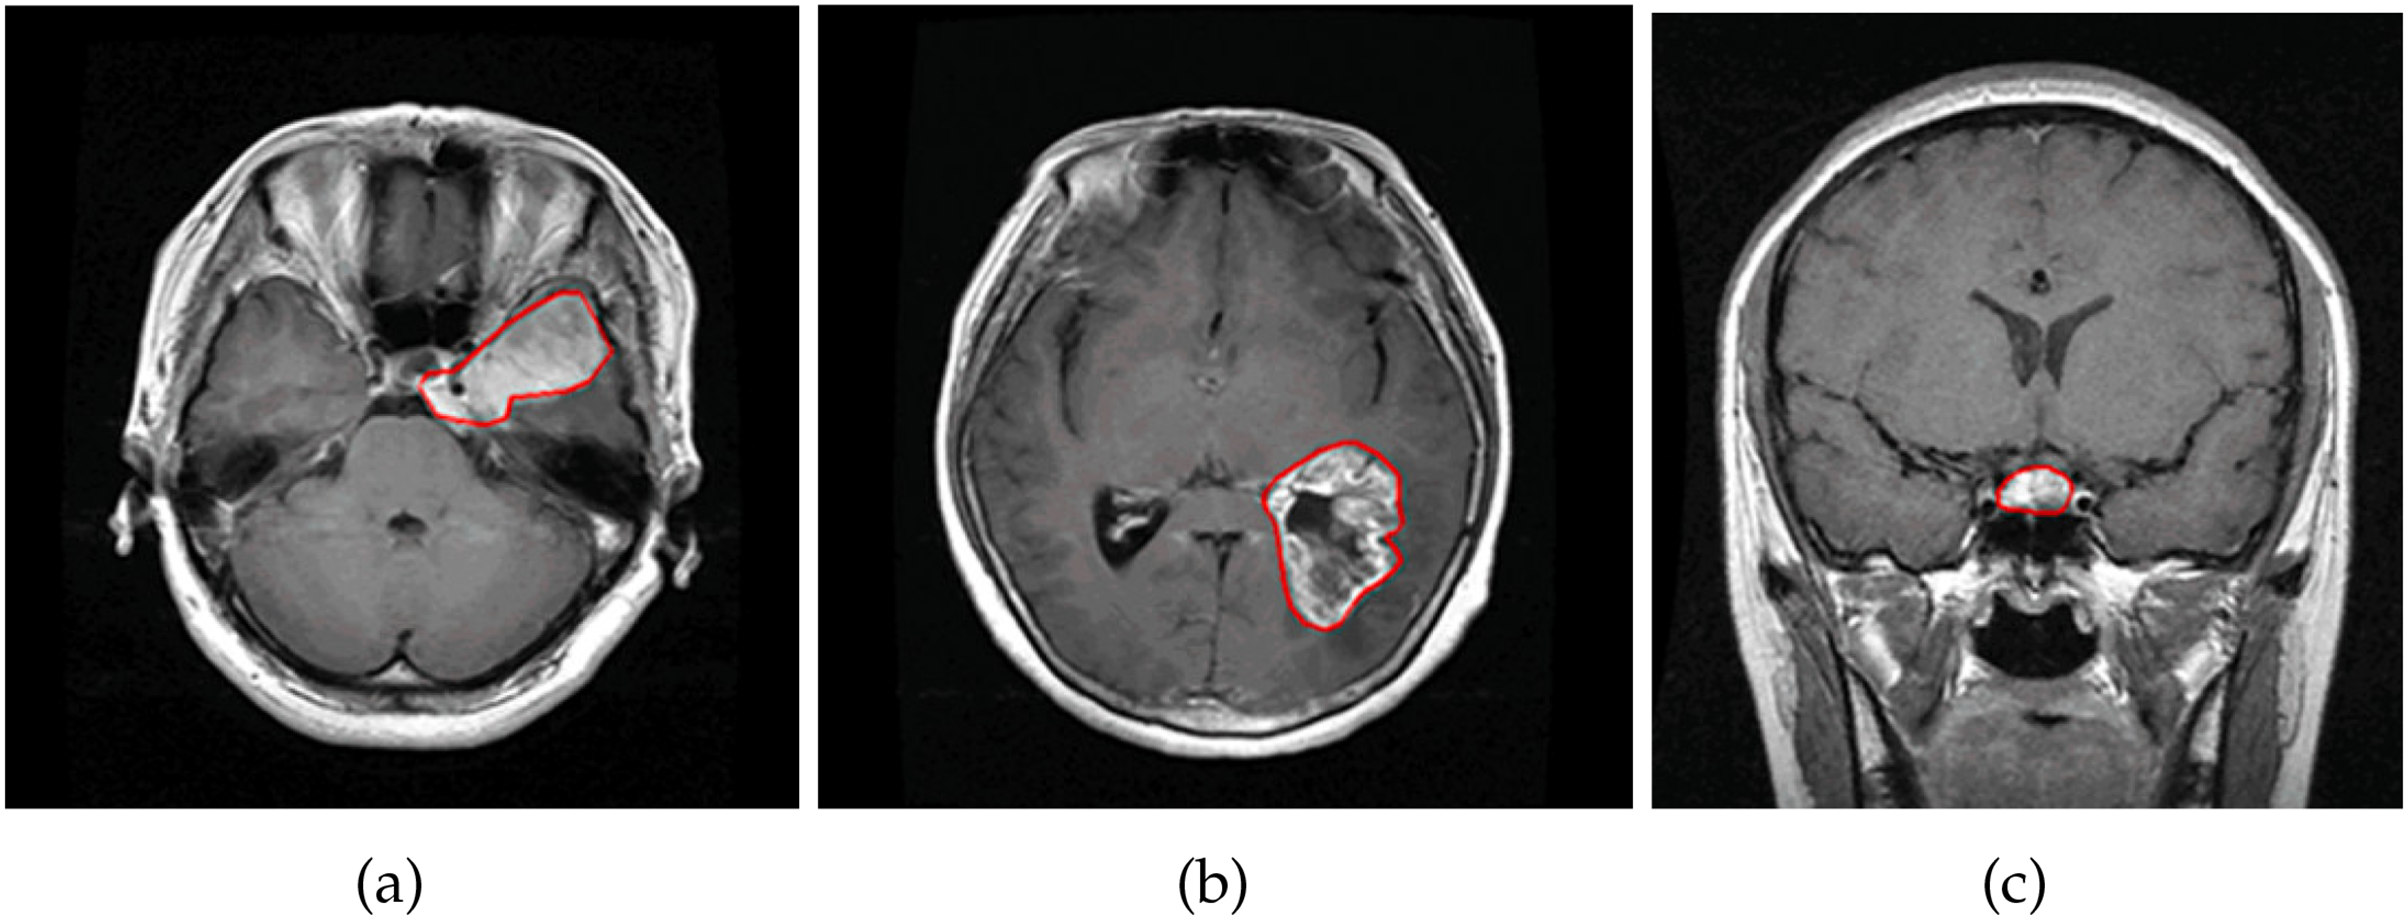
Figure 2: Illustration of brain types in CE-MRI images: (a) shows a meningioma brain tumor. (b) shows a glioma brain tumor. (c) shows a pituitary brain tumor
This research introduces a structured approach to brain MRI analysis, aimed at improving image quality, enhancing segmentation accuracy, and optimizing classification performance. The methodology is organized into three key stages: pre-processing, main processing, and post-processing, each contributing to the overall workflow.
The pre-processing stage focuses on refining MRI images by reducing noise, enhancing contrast, and preserving essential features. Independent Component Analysis (ICA) is applied using ICA1 and ICA2, where statistical and visual evaluations determine the most effective approach for improving image clarity. Additionally, Anisotropic Oriented Diffusion filtering is employed to suppress noise while maintaining critical anatomical structures, ensuring high-quality images for subsequent analysis.
The main processing stage involves tumor segmentation using the Fast Marching Method (FMM), which precisely identifies tumor boundaries based on intensity variations in the enhanced images. This step is essential for accurate tumor localization, forming the basis for classification.
The post-processing stage refines the segmented output and classifies tumor regions using a Support Vector Machine (SVM), effectively distinguishing between normal and abnormal brain tissue. The integration of enhancement, segmentation, and classification within this pipeline ensures a systematic and efficient approach to brain tumor detection, significantly improving diagnostic precision. The complete process is visually represented in Fig. 3, illustrating the logical transition from image enhancement to segmentation and classification.
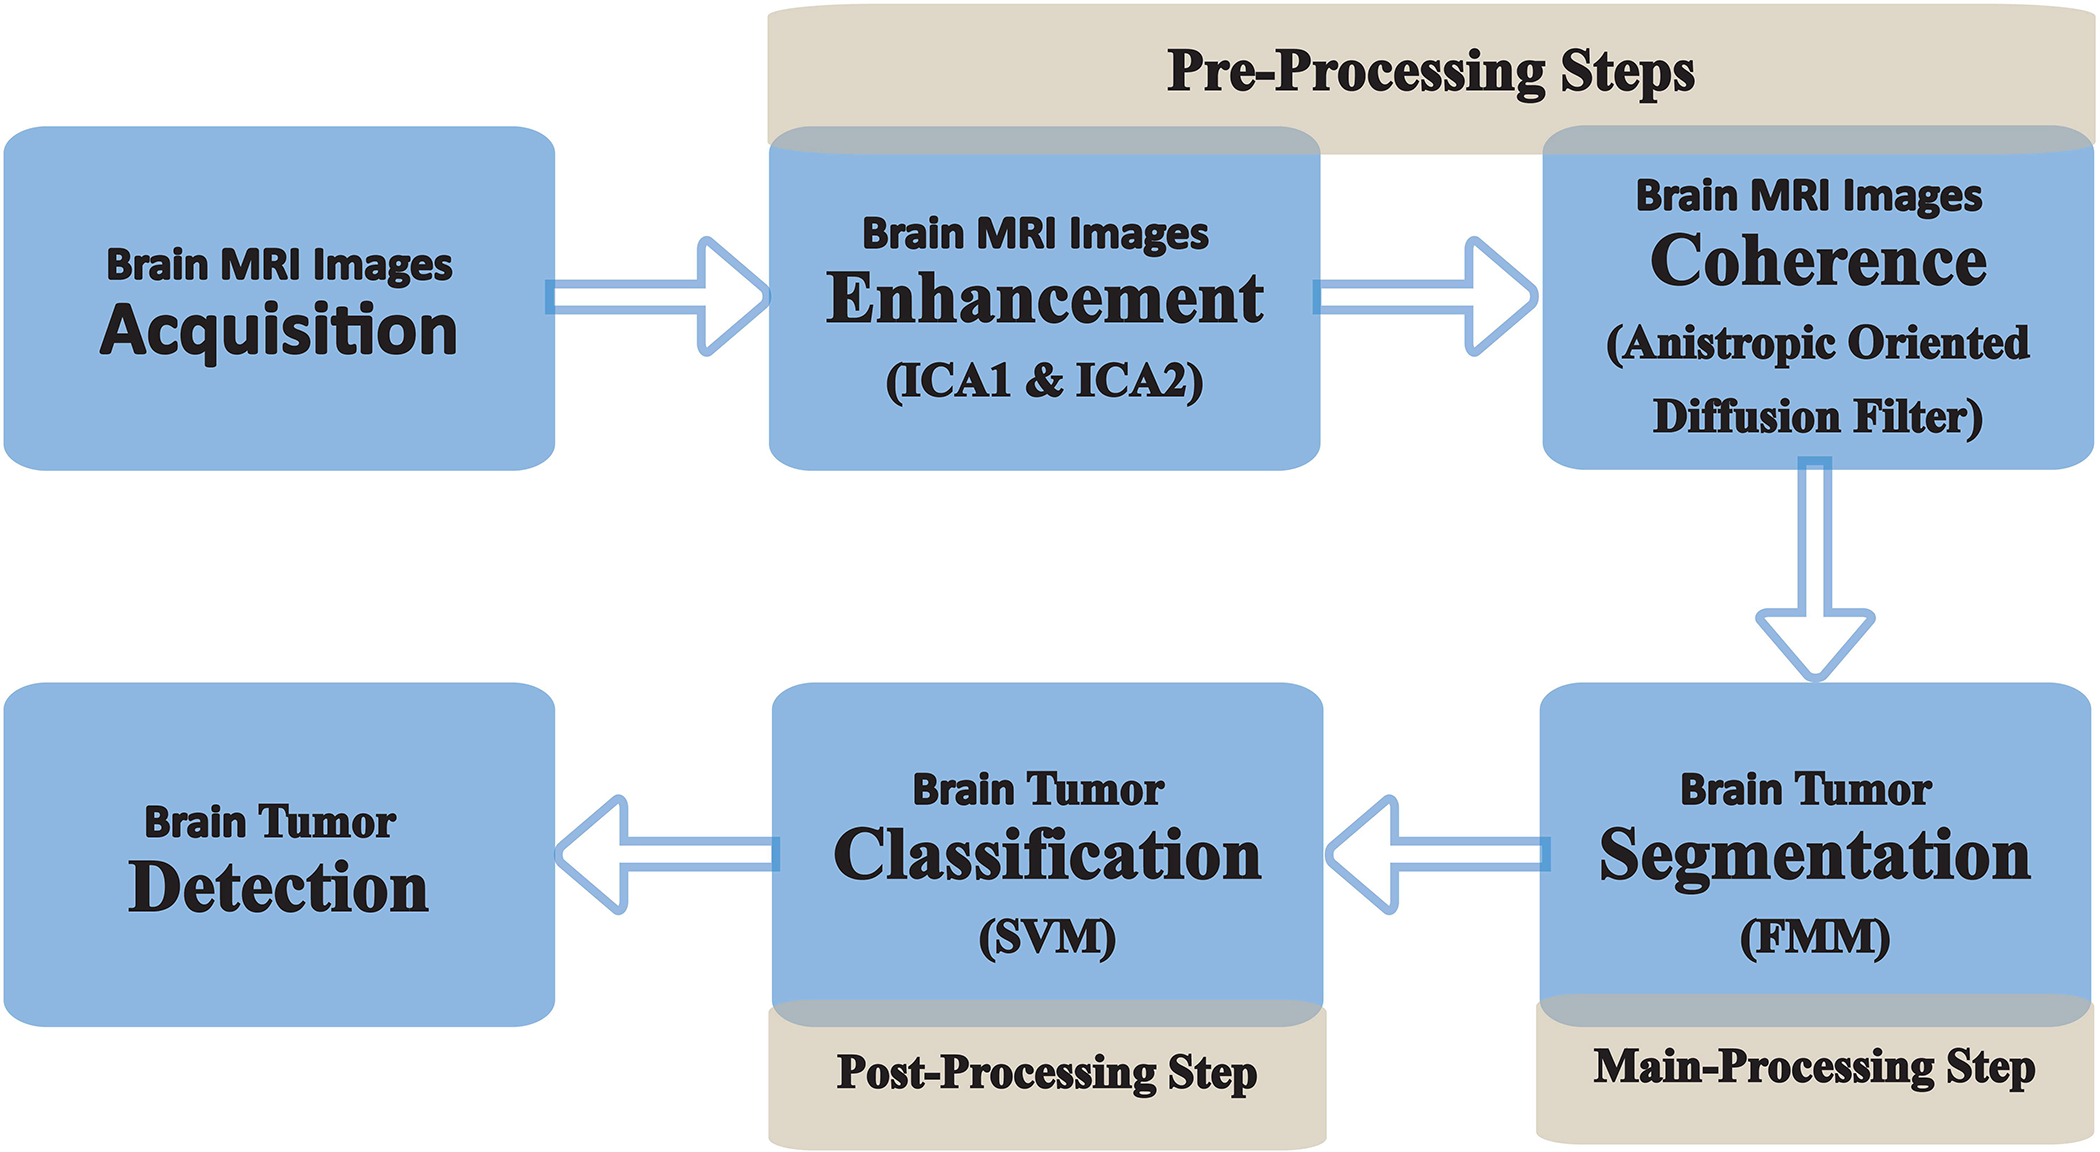
Figure 3: Flowchart illustrating the proposed methodology for brain MRI processing. The pre-processing phase involves image acquisition, enhancement through ICA1 and ICA2 to improve contrast, and coherence enhancement using the Anisotropic Oriented Diffusion Filter for structural refinement. The main processing phase focuses on tumor segmentation utilizing the Fast Marching Method (FMM) to accurately delineate tumor boundaries. The post-processing phase incorporates classification using a Support Vector Machine (SVM) to identify and categorize tumors. This integrated framework ensures a systematic approach to brain MRI analysis, facilitating improved visualization, segmentation, and classification
Throughout this research work, our primary goal is to demonstrate the performance of the proposed methodology in enhancing brain MRI scans and detecting brain tumors. By achieving improved image quality and accurate tumor detection, we aim to significantly contribute to medical imaging, benefiting both patients and healthcare professionals. The results of this study hold immense promise for enhancing brain tumor diagnosis and treatment, ultimately leading to improved patient outcomes and overall quality of life. Each step of our approach is meticulously elaborated with scientific evidence in the subsequent sections, providing a robust foundation for our research findings.
3.2.1 Pre-Processing: Image Refinement and Enhancement
Enhancing Contrast through ICA
ICA was employed to enhance contrast and improve the visibility of brain tumors in MRI scans. The process commenced with meticulous preprocessing of the data to ensure high-quality inputs for analysis. This included removing noise and artifacts to minimize distortions, followed by intensity normalization to standardize brightness and contrast levels across the dataset. Regions of interest (ROIs) were identified based on areas exhibiting abnormal contrast uptake or structural irregularities indicative of tumors. These ROIs were then structured into a data matrix, providing a robust foundation for the subsequent ICA-based analysis. The ICA algorithm was applied to this matrix to decompose the data into independent components, each representing distinct sources within the brain. Components displaying unusual intensity distributions or spatial patterns consistent with tumor-related anomalies were prioritized. These components played a pivotal role in reconstructing enhanced images, offering improved clarity and contrast that made tumors more distinguishable from surrounding brain tissues.
Two ICA configurations were evaluated in this study. The first, ICA1, employed a standard ICA algorithm to extract independent components. While ICA1 demonstrated baseline improvements in contrast, its general approach did not fully leverage tumor-specific features. In contrast, ICA2 incorporated additional constraints and prior knowledge regarding the intensity patterns and spatial distributions typically associated with tumors. This tailored methodology allowed for a more precise separation of tumor signals from normal brain structures, resulting in superior enhancement of tumor visibility. The outcomes of both configurations were compared, with the results presented in Fig. 4. The visual and quantitative evaluations reveal that ICA2 significantly outperformed ICA1, achieving approximately 50% greater contrast enhancement. Furthermore, the application of an anisotropic-oriented diffusion filter further improved the contrast to an average level of 82.45, ensuring a coherent representation of various regions in the brain MRI images.
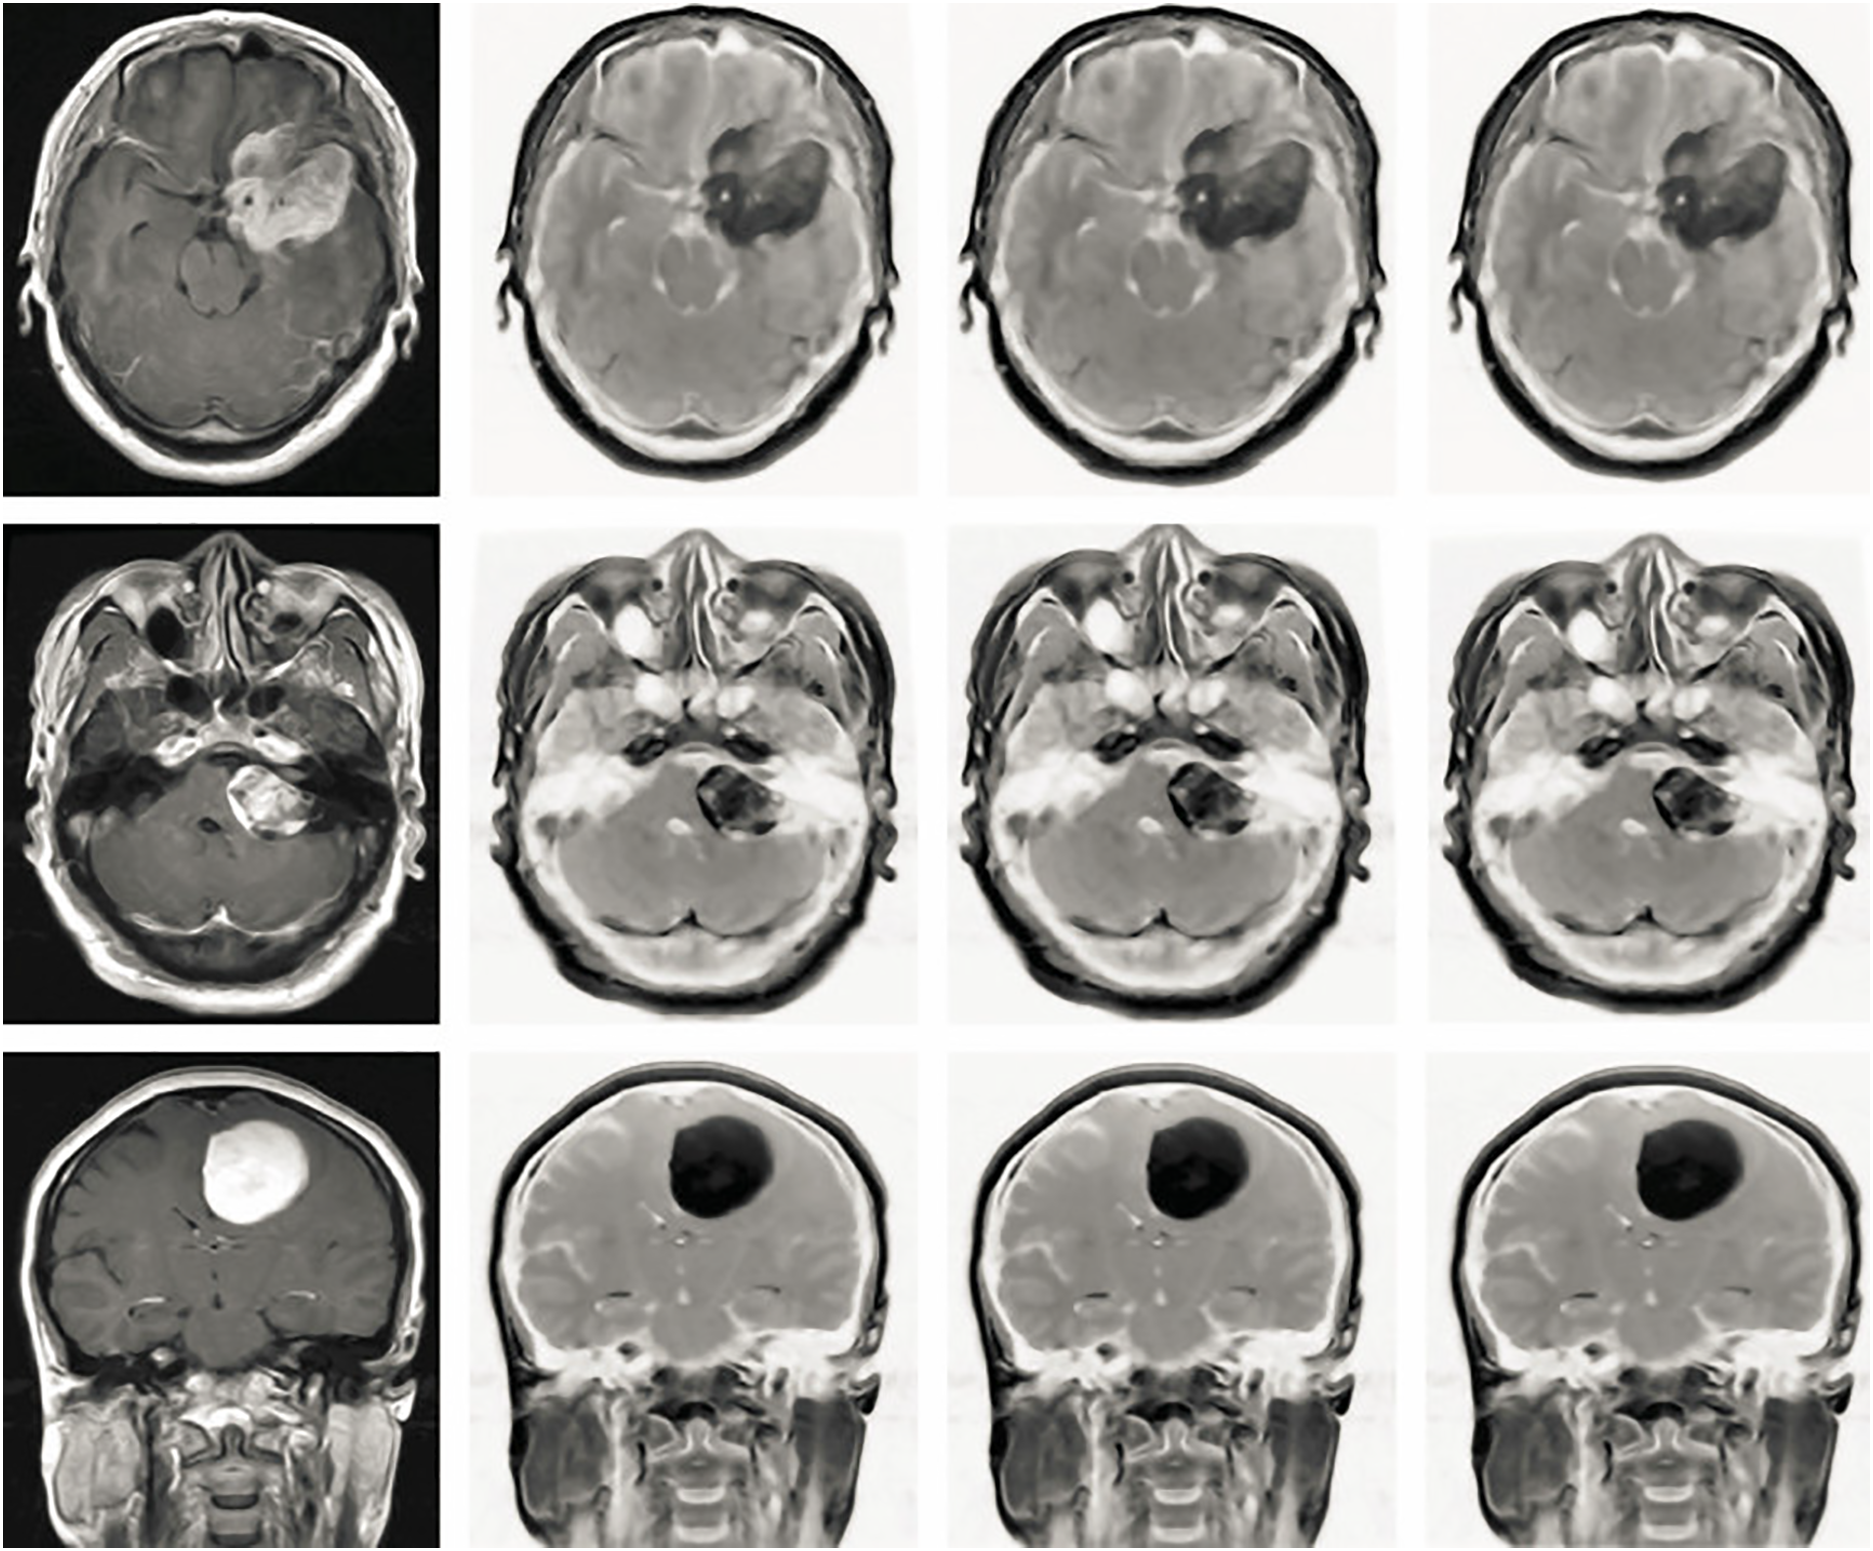
Figure 4: The effectiveness of the proposed pre-processing procedures was evaluated across distinct Independent Component Analysis (ICA) architectures using Brain MRI images acquired from the Axial, Coronal, and Sagittal planes. The initial column illustrates the unprocessed original images, demonstrating an average contrast level of 50.54. Shifting to the subsequent column, the outcome of applying ICA1 to the images displays an improved average contrast, registering at 65.32. Progressing to the third column, the images resulting from the application of ICA2 exhibit a more pronounced enhancement in contrast, yielding an average contrast of 76.45. Lastly, the fourth column showcases the outputs of utilizing an anisotropic Oriented Diffusion filter, which not only achieves an average contrast of 82.45 but also contributes to coherent representation among various regions within the Brain MRI images
These findings underscore the significant advantages of ICA2 in enhancing contrast and tumor visibility. The enhanced images not only facilitate accurate tumor detection but also improve segmentation and classification tasks, essential for clinical diagnosis and treatment planning. The ability of ICA2 to highlight diverse intensity levels and provide a broader histogram distribution further demonstrates its effectiveness in analyzing brain MRI data. The experimental results indicate that ICA2 offers a marked improvement over ICA1 in terms of contrast enhancement and the visualization of brain tumors. Its ability to integrate tumor-specific features and produce highly detailed outputs makes ICA2 a valuable tool for advanced brain MRI analysis, supporting more accurate and reliable clinical decision-making.
Coherence of Brain MR Images: Anisotropic Oriented Diffusion Filter
Within the scope of enhancing Brain MRI scans, we introduce an Anisotropic Oriented Diffusion Filter, a technique aimed at diminishing noise and augmenting the quality of all regions within these images. This advanced filtering methodology, inspired by [39], consists of a systematic sequence of steps, the results of which can be observed in the fourth column of Fig. 4. The comprehensive process unfolds in the following phases:
1. Second Moment Matrix Computation: For every individual pixel within the MRI image, a second-moment matrix is calculated. This matrix encapsulates statistical information about the pixel’s immediate neighborhood, allowing for a more localized understanding of image features.
2. Diffusion Matrix Construction: A diffusion matrix is formed for every pixel, encoding information about the neighboring pixel intensities. This matrix contributes to controlling the diffusion process and maintaining structural integrity during noise reduction
3. Intensity Variation Assessment: Using the expression
4. Iterative Image Updating: The heart of the process lies in an iterative image updating procedure, described by a differential equation:
Here,
This application of the Anisotropic Oriented Diffusion Filter leads to a refined portrayal of Brain MRI scans. By enhancing coherence and structure within various image regions, this technique contributes to a more comprehensive evaluation of intricate brain structures. The output of this filter is vividly depicted in the fourth column of Fig. 4, showcasing its positive impact on the visual quality and coherence of Brain MRI images.
3.2.2 Main Processing: Tumor Segmentation
The Fast-Marching Method (FMM), originally introduced by James Sethian, offers a powerful approach to analyze image and signal boundary conditions. Based on numerical analysis, FMM finds application in various fields, much like the level-set algorithm in image processing [40]. In our context, we exploited the capabilities of the FMM algorithm for brain tumor segmentation, leveraging its mathematical framework and tailor-made procedure to improve brain image analysis.
At the heart of this technique is the mathematical representation of FMM, which serves as the basis for its application. The FMM algorithm involves a complex interplay of numerical methods to efficiently calculate arrival times or distances in a given domain, helping to identify boundaries and shapes. This allows the adaptability of FMM to tasks such as segmentation, where determining the boundary of a region of interest is crucial. The mathematical representation encapsulates the complex relationships between the various components of the FMM algorithm, ensuring its accuracy and efficiency in practical scenarios.
In the specific context of brain tumor segmentation, the FMM algorithm procedure includes several steps suitable for brain images. This involves iteratively calculating distances or times of arrival between starting points and various image locations, effectively delineating the tumor region. By leveraging the principles of FMM, we can achieve accurate and automated segmentation, which is fundamental for effective diagnosis and treatment planning in neuroimaging. Essentially, the mathematical representation of FMM underpins its versatility and efficiency in image analysis. At the same time, its tailor-made procedure for brain tumor segmentation attests to its practical importance in medical imaging.
The Eikonal Eq. (10), encapsulates a fundamental relationship crucial to FMM’s functionality. It states that the magnitude of the gradient of a function, denoted by
This equation’s significance in the FMM context is profound. It governs how information spreads and influences neighboring points in the computational process, effectively guiding the “marching” of the method. As FMM involves calculating distances or arrival times from specific starting points to other points in the domain, the Eikonal Equation influences how these distances are computed and propagated through the domain. This dynamic interplay between the gradient magnitude and the factor
To comprehend FMM’s functioning comprehensively, understanding the Eikonal Equation’s role is pivotal. It forms the mathematical basis through which FMM navigates and computes distances, enabling its robust and adaptable behavior across diverse image analysis scenarios.
The basic principle of the FMM algorithm revolves around the expansion of a closed surface, operating as a function dependent on both velocity and time, specifically oriented perpendicular to the surface point
In the context of brain tumor segmentation, the FMM and level set methods are based on an evolutionary curve characterized by a constant level set with a defined function. This function is represented by Eq. (12), which embodies the dynamics of the segmentation process. This is the time evolution of
The provided equation encompasses three fundamental components crucial for brain tumor segmentation.
1. The initial contour’s speed is determined by evaluating the image gradient. The initial contour’s strength
This function calculates the contour’s speed, considering the image gradient’s impact and modifying it based on the location of the moving curve’s cessation.
2. The smoother version of the image is generated by convolving the image with a Gaussian filter, influenced by the curve’s stopping positions. In this context,
3. The third function comprises two distinct stages of segmenting the brain tumor. The initial stage involves employing the Fast-Marching Method (FMM) to resolve the contour’s movement, as characterized by
3.2.3 Post-Processing: Brain Tumor Classification
The concluding stage of our suggested method focuses on identifying brain tumors through SVM. SVM represents a supervised learning model rooted in statistical theory, primarily employed for data classification [41]. This process begins with data labeling, a prerequisite for building the labeled training set, symbolized as
Central to SVM’s functionality is calculating functions indicated as
The Eq. (14) above represents the
The formation of the feature vector is achieved by merging relevant elements within a structured array, facilitating vector processing within the dataset for classifying objects. In brain tumor MRI scans, the procedure involves binary image transformation, as shown in Fig. 5a, followed by image skeletonization, as shown in Fig. 5b. Further segmentation into adjoining areas and regions yields an image matrix. The resulting feature is anchored in Euler numbers and related parameters, including pixel distributions on the x and y planes. Approximately 100 characteristic vectors are generated from the image to aid in the classification of tumor regions. For our work on brain tumor classification, 310 images were processed. SVM training consolidates the feature vector as a matrix to classify tumor regions.
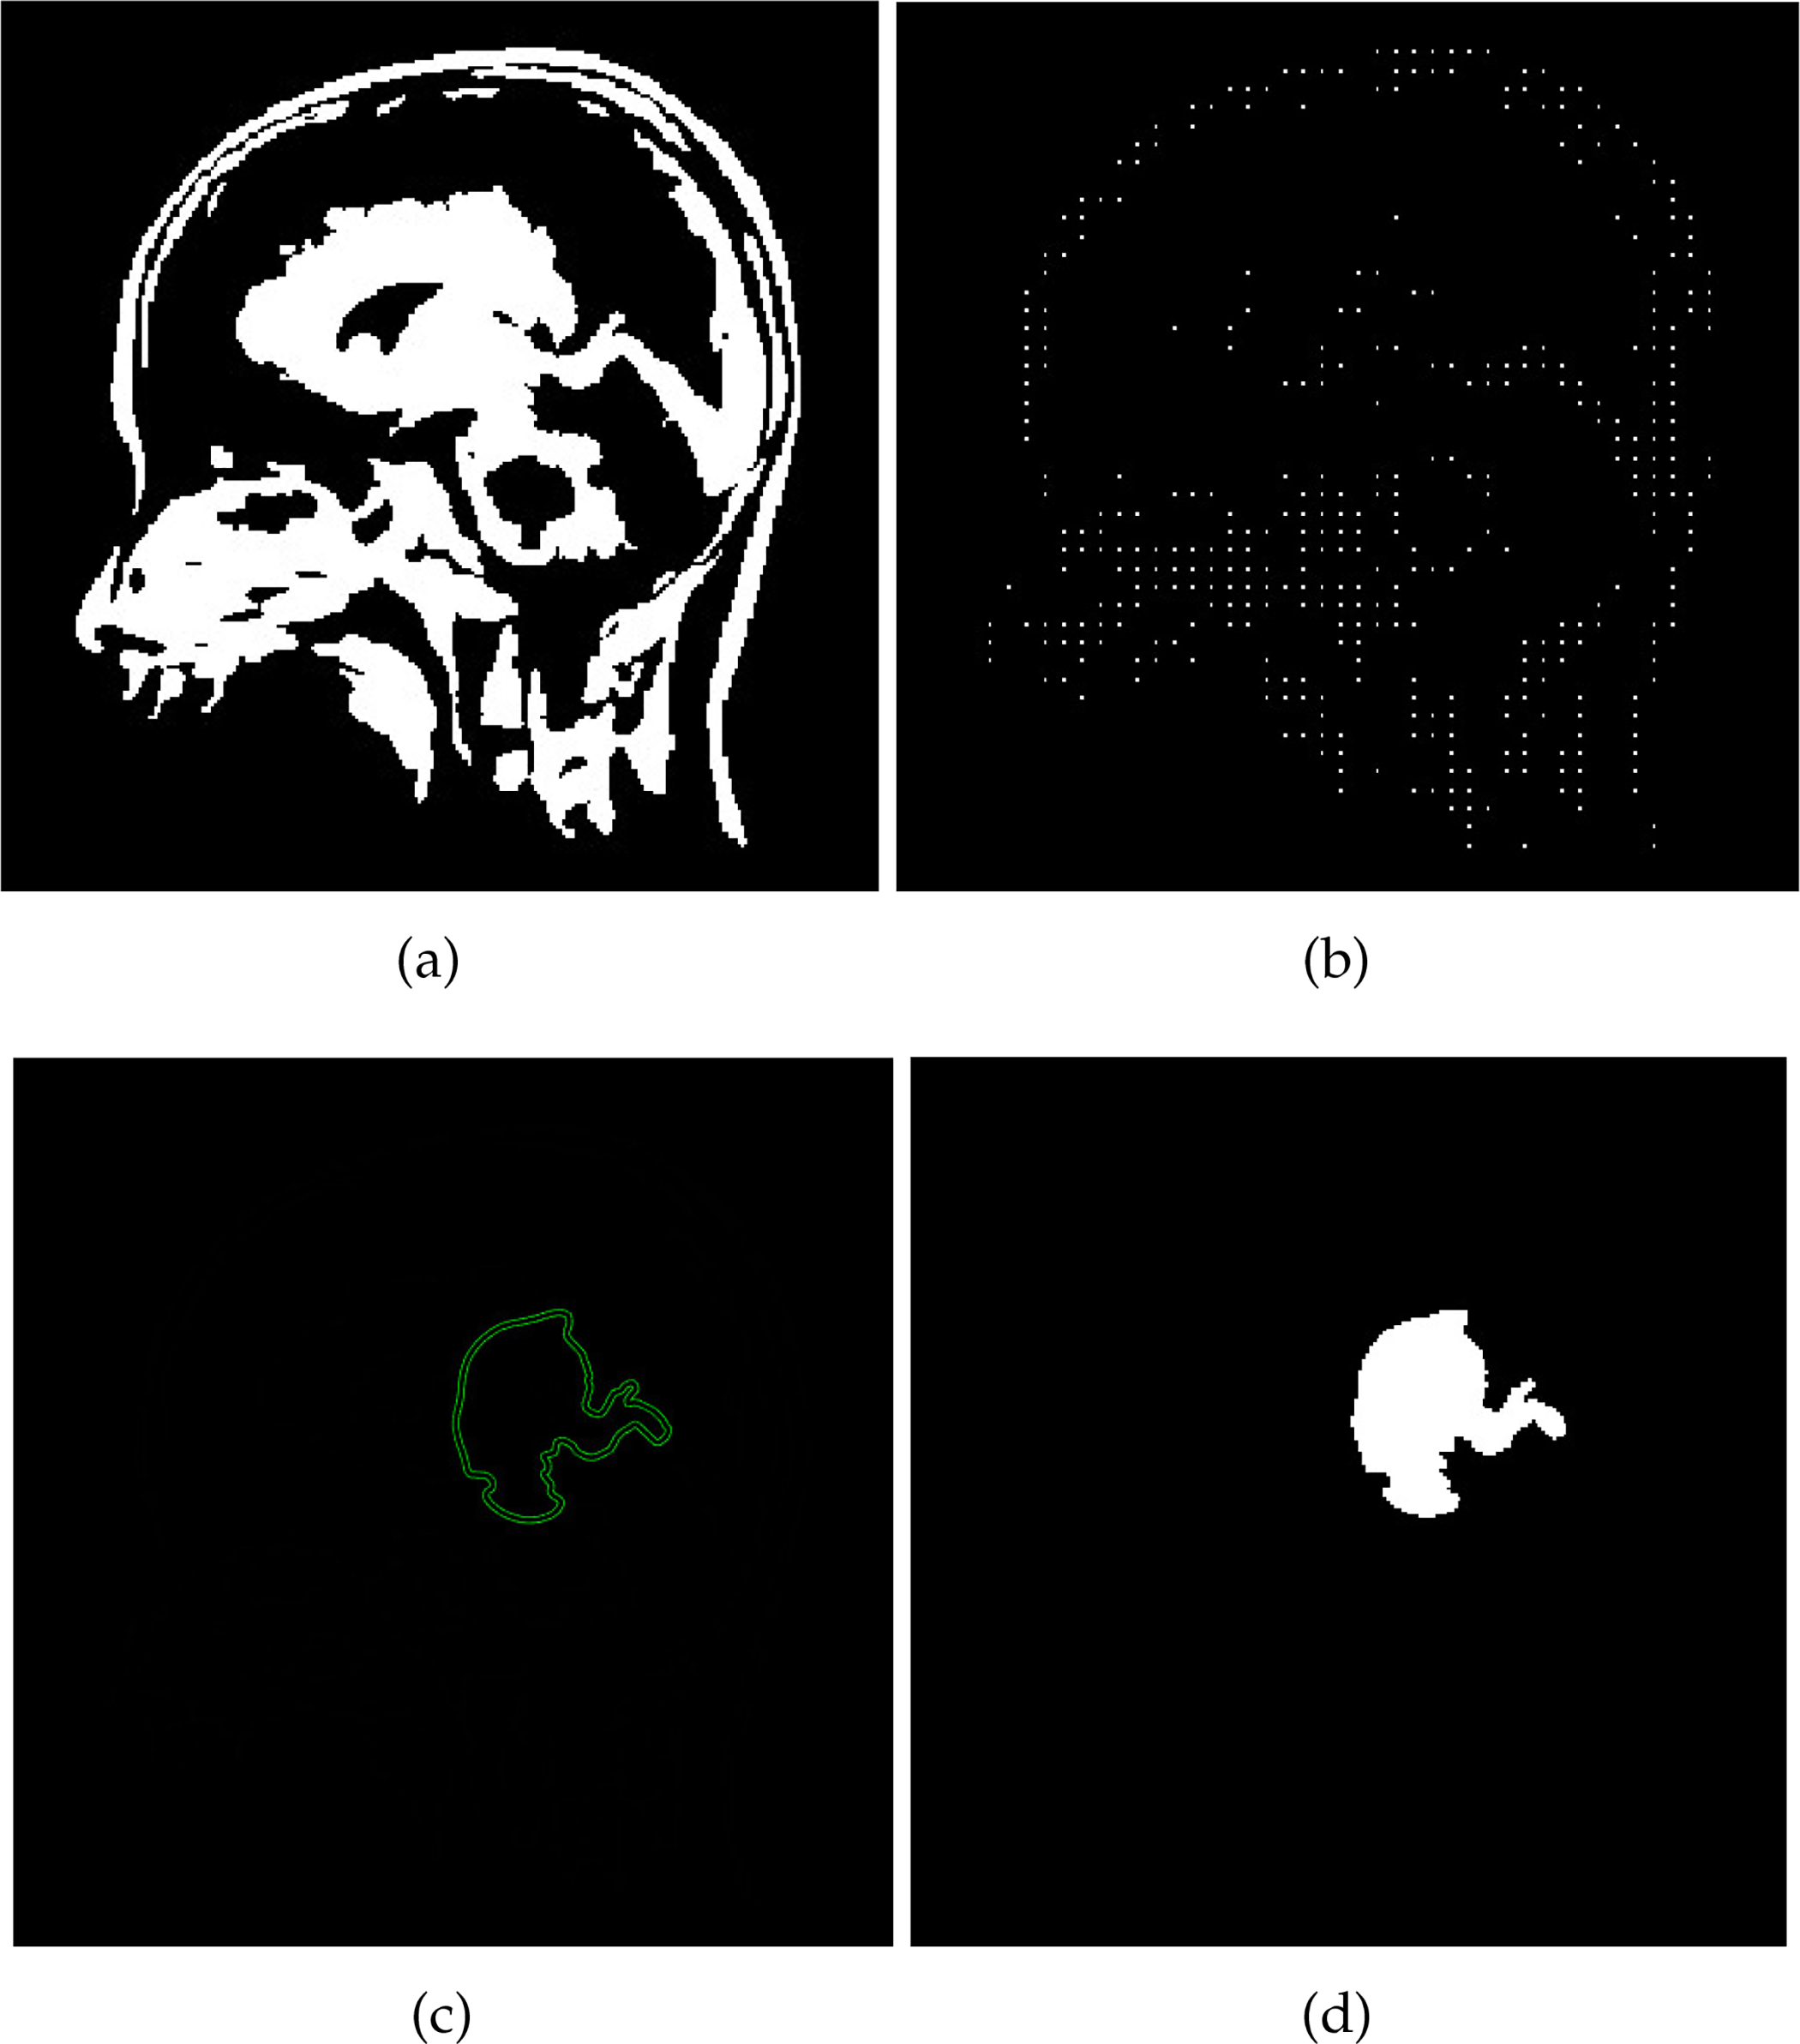
Figure 5: The process of utilizing the SVM classifier for brain tumor detection is depicted in the figures. In (a), a Binary Image of the Brain is showcased, capturing the initial representation. Moving to (b), the image is then subjected to skeletonization, resulting in the Skeletonized Image shown. (c) portrays the culmination of the SVM Classifier’s role in brain image analysis, reflecting the classification process. Finally, (d) highlights the successful detection of the brain tumor, providing a visual depiction of the tumor’s identification
The central role of support vectors in the SVM method is essential. These vectors indicate the collection of data points closest to the decision surface, contributing significantly to brain tumor classification. However, classification presents challenges because of the complexity of identifying brain tumors. The positions of these points depend on an optimization process that helps determine the location of the decision surface relative to anomalous regions. The SVM approach strives to enhance the boundary gap surrounding the hyperplane while building the classification function utilizing a selected training subset to identify tumor regions accurately. The outcome of the SVM process output is displayed in Fig. 5.
The efficacy of the proposed method is evaluated based on three distinct criteria: enhancement of brain images, segmentation of the tumor area, and classification, as described below.
4.1 Measuring Parameters: Enhancement of the Brain Image
The enhancement results are assessed for performance by quantifying key parameters: Peak Signal-to-Noise Ratio (PSNR) and Image Contrast (IC). These parameters are further explained below.
The Peak Signal-to-Noise Ratio (PSNR) serves as a metric to evaluate the clarity of a brain image in comparison to a noisy image. It calculates the ratio between the maximum possible signal level and the noise level present in the MRI image. The PSNR formula, as introduced by L. Jong and Sen in 1980, is represented by Eq. (15).
In this equation:
•
• R is the maximum image value, typically ranging from 0 to 255 for an 8-bit grayscale image (where 0 represents black and 255 represents white).
In the context of brain MRI images, Image Contrast (IC) refers to the intensity difference between a particular pixel and its neighboring pixels. Mathematically, the image contrast is represented as:
4.2 Measuring Parameters: Segmentation of Brain Tumor
The evaluation of segmentation results involves the use of several metrics: skewness, kurtosis, entropy, mean, and standard deviation. These metrics are explained below.
The average parameter is calculated by multiplying the pixel values of the image by the overall count of pixels within the image. The calculation of the average is represented by the following equation:
where ‘m’ and ‘n’ represent he total pixel count related to the image dimensions.
The standard deviation (STD) measures the distribution of pixel intensities relative to the mean. It quantifies the degree of non-uniformity in the image. The standard deviation is computed as:
Entropy quantifies the randomness or unpredictability of an image’s texture. A higher entropy indicates a more complex texture, while lower entropy suggests a more uniform texture. Mathematically, entropy is given by:
Kurtosis measures the “tailedness” or sharpness of the intensity distribution. It provides insights into the probability distribution of pixel values and helps identify outliers. The formula for kurtosis is:
Skewness indicates the asymmetry of the pixel intensity distribution. Positive skewness indicates a distribution biased toward lower intensity values, while negative skewness indicates a bias toward higher intensity values. The skewness is calculated as:
4.3 Measuring Parameters: Classification of Brain Tumor
To evaluate the classification model, we employ cross-validation, a widely used method for assessing the effectiveness of models. The following parameters are essential for classification model evaluation.
A confusion matrix is a tabular representation used to evaluate the performance of a classification model. It categorizes predictions into four distinct groups: True Positives (TP), True Negatives (TN), False Positives (FP), and False Negatives (FN). This matrix provides a clear assessment of the model’s prediction accuracy, enabling a better understanding of its effectiveness in distinguishing between different classes.
Sensitivity, or True Positive Rate (TPR), measures a model ability to correctly identify positive cases. For brain MRI images, sensitivity is computed as:
Specificity measures a model ability to correctly identify negative cases. It is computed as:
Accuracy represents the overall proportion of correct predictions (both positive and negative). It is calculated as:
The Dice Score (DSC) quantifies the overlap between predicted and actual tumor regions. It is computed as:
The Hausdorff Distance (HD) measures the spatial difference between two sets of points, such as the segmented brain tumor and the ground truth. A lower HD value indicates a better alignment between the segmented area and the ground truth. The Hausdorff distance is defined mathematically as:
where A and B are sets representing the segmented tumor and ground truth areas, respectively. The symmetric Hausdorff distance between sets A and B is the maximum of the one-way Hausdorff distances:
4.3.7 Jaccard Similarity Index (JSI)
The Jaccard Similarity Index (JSI) evaluates the overlap between two sets. For brain MRI scans, it is used to measure the similarity between two segmented regions, such as tumor areas. The formula for JSI is:
A higher JSI value indicates a greater similarity between the segmented regions, which is crucial for assessing the accuracy of segmentation algorithms.
5 Results Analysis and Discussion
The Results Analysis and Discussion section provides a structured evaluation of the proposed ICA1 and ICA2 image enhancement and segmentation techniques based on PSNR, contrast analysis, and classification performance using the CE-MRI dataset. The section begins by comparing different scenarios—without ICA, with ICA1, and with ICA2—to examine their effects on image clarity, segmentation, and classification. The segmentation assessment includes Dice’s Coefficient (DC) and accuracy metrics, offering insights into the role of ICA-based enhancement in improving segmentation results. The classification evaluation involves multiple classifiers, including SVM, Kernel-Based SVM, GCNN, GA, KNN, and SOM, analyzing their effectiveness in classifying brain MRI images. Also, a comparative analysis is presented, contrasting the proposed enhancement technique with BBHE, CLAHE, and HE, focusing on PSNR and contrast levels. The section is structured to systematically explore the contributions of each phase of the methodology. Detailed discussions in the subsequent sections outline the results and their implications for brain MRI enhancement, segmentation, and classification.
Note: The reported results are derived from the average performance metrics across all pixels and images in the CE-MRI dataset, ensuring a consistent and objective evaluation of the proposed method.
5.1 Evaluation of Image Enhancement Method on Brain MRI Images
The Results and Discussion section of this research paper presents an analysis of PSNR and contrast in brain MRI images to evaluate the effectiveness of the image enhancement technique, particularly ICA1 and ICA2. This section provides a comprehensive review of PSNR values and contrast analysis derived from the CE-MRI dataset, followed by a detailed discussion of the findings.
5.1.1 Examine the Impact of ICA1 and ICA2
To evaluate the effectiveness of distinct, independent component analysis (ICA) architectures, namely ICA1 and ICA2, within the framework of the proposed methodology, the performance evaluation of the MRI image enhancement and segmentation model brain is performed in various scenarios: with and without ICA, using ICA1, and employing ICA2. The segmentation model incorporating ICA aligns precisely with the description provided in the proposed method. Conversely, the segmentation framework excluding ICA follows the identical procedural stages described withing the composite method, excluding the integration of ICA during the second step.
The analysis results performed on our proposed method using the CE-MRI image database, with the application of ICA1 and ICA2 in the enhancement techniques, are presented in Table 1. The table showcases the outcomes achieved through our approach across distinct types of brain MRI scans from the CE-MRI database, focusing specifically on tumor scans of pituitary, gliomas, and meningiomas and tumors. Through careful review, our method has been found to significantly increase the contrast of each brain MRI image type in the CE-MRI image database when using ICA2. This improvement manifests as a 40-point increase, indicating a substantial improvement in the clarity and differentiation of various structures or regions in the images, ultimately leading to accurately segmenting and classifying brain tumors. Additionally, the analysis reveals a 3 dB improvement in the PSNR metric, highlighting the increased clarity and accuracy within the processed images.
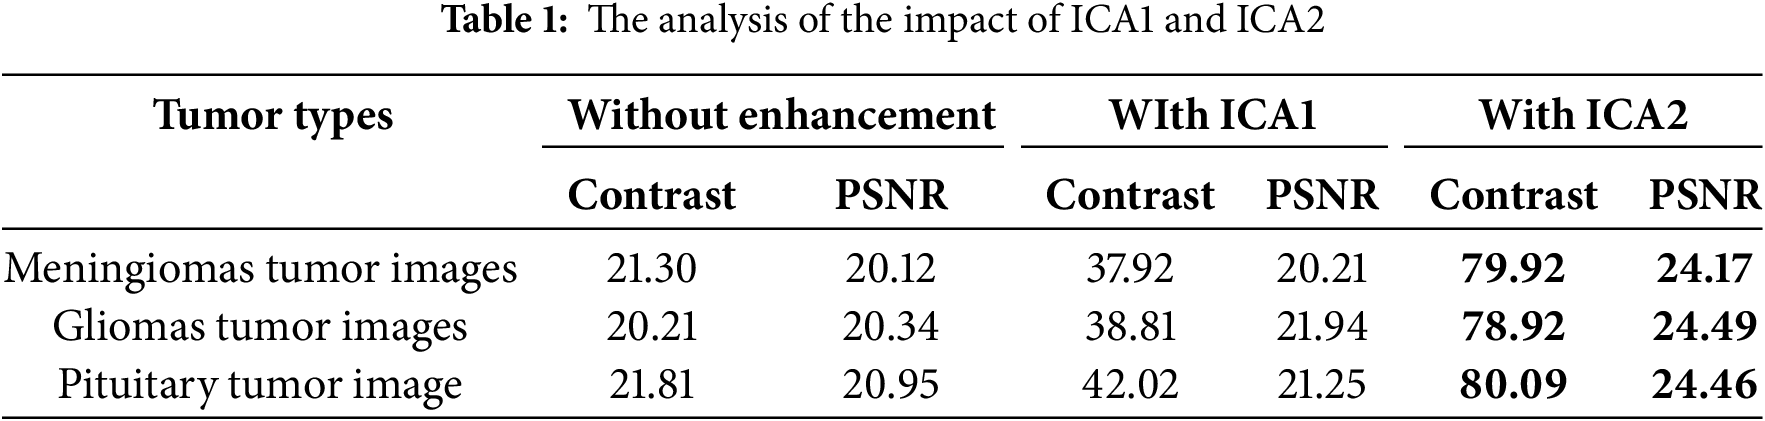
Furthermore, the influence of ICA1 and ICA2, which can be interpreted as the effect of image enhancement methods on the segmentation procedure, is examined in depth. The proposed method demonstrates an accuracy rate of nearly 99.9% and an increase in Dice’s coefficient (DC) of up to 0.981% when incorporating ICA as shown in Table 2. In contrast, the absence of ICA results in lower accuracy and DC values. This observation highlights the positive influence of ICA2 on the segmentation pattern, resulting in improved classification due to improved vessel enhancement at the initial stage, subsequently facilitating post-processing for more accurate detection of vessels. Brain tumors. This challenge is met by experimenting with the ICA designs: ICA Model 1 and ICA Model 2, in which it has been demonstrated that ICA2 gives superior results, demonstrated visually in the attached Figure and statistically.

5.1.2 Comparative Study of Image Enhancement Using Existing Enhancement Methods
A comparative analysis was performed on different image enhancement techniques, including BBHE (Brightness Bi-Histogram Equalization), CLAHE (Contrast Limiting Adaptive Histogram Equalization), and HE (Histogram Equalization), along with our innovative method utilizing ICA2. Our assessment of these techniques’ (as shown in the Table 3). per-performance reveals that our proposed method consistently surpasses the others in terms of both PSNR and contrast. Across different types of Brain MR images, our method consistently achieves the highest PSNR and contrast values. This indicates its exceptional capability in enhancing Brain MRI images, rendering structures more visible. The comprehensive analysis highlights the performance of the proposed technique in enhancing image quality, particularly with respect to PSNR and contrast. These findings suggest that our approach holds significant potential for advancing the analysis of medical images, particularly those related to brain abnormalities in the CE-MRI image database.

5.2 Evaluation of the Performance of the Segmentation Module
Assessing the effectiveness of the brain tumor segmentation method based on CE-MRI data involves a comprehensive analysis of a range of critical parameters. These parameters are systematically studied to meticulously assess the competence of the method to identify and delineate brain tumors precisely. To assess the effectiveness of the proposed approach, a rigorous examination of statistical indicators is carried out, and the results are summarized in Table 4. These statistical measures are essential for objectively assessing the effectiveness of the method. They shed light on the quality of the segmentation by highlighting two crucial aspects: on the one hand, the improvement of the contrast obtained in the brain region, and on the other hand, the normalization of the image intensities. These two factors collectively contribute to the method’s ability to achieve high accuracy in tumor segmentation.

The insightful results presented in Table 4 clearly show the prowess of the proposed approach. The data unequivocally demonstrates that the method efficiently segments brain tumors, yielding highly accurate results. These results are clearly illustrated in Fig. 6, which visually captures the essence of the method’s success in a graphical format. Additionally, the visualization of tumor detections in Fig. 6 provides a clear and compelling demonstration of the module’s remarkable skill in accurately identifying and locating brain tumors. The visual representations testify to the method’s robustness and reliability in real-world scenarios.
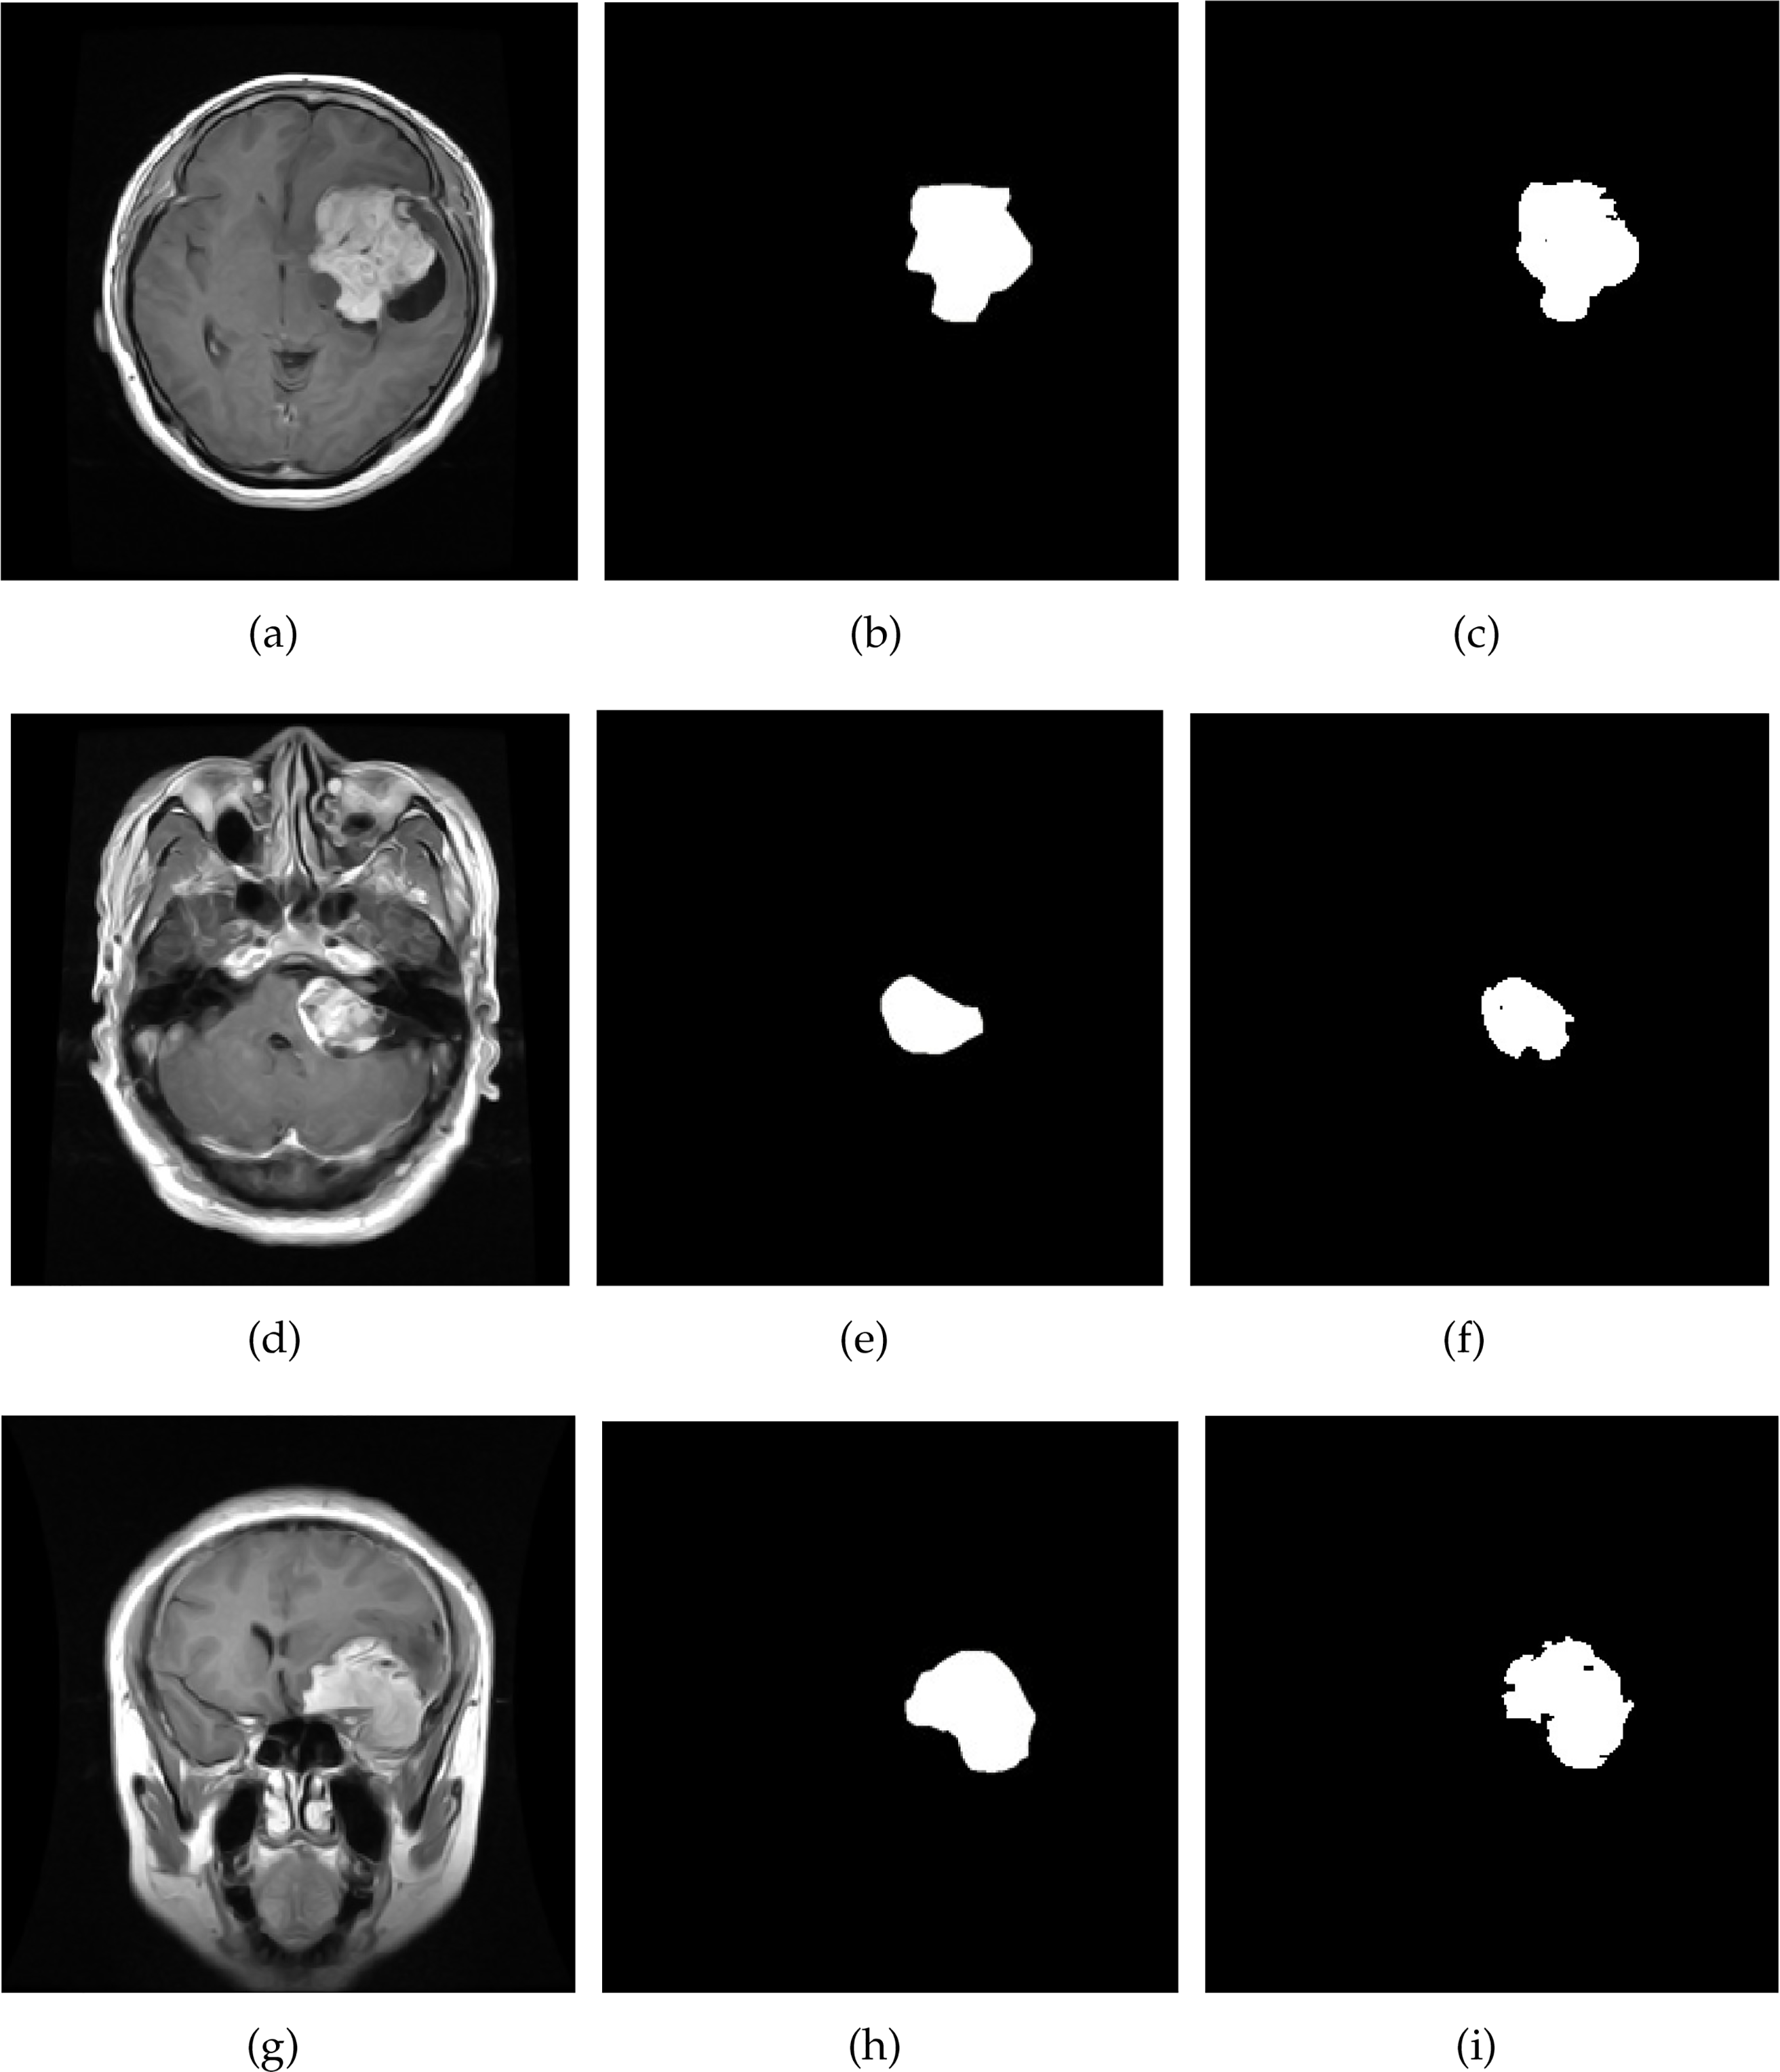
Figure 6: Result of brain tumor segmentation using the proposed technique on brain MRI images. The initial column illustrates the images derived from the original dataset, the second column describes the ground truth, and the third column presents the image result
These tangible results collectively underscore the exceptional competence of the module and its promising potential within the domain of brain tumor identification. The results farm the module’s significant contribution to medical image analysis and brain tumor diagnosis by offering substantial and compelling evidence of its capabilities.
Evaluation of Segmentation Module Effectiveness across Varied Classifiers
Many researchers in the scientific landscape have embarked on the complex task of brain tumor segmentation using a wide range of classifiers. This effort is followed by an exhaustive analysis of the resulting images, applying statistical methods to explore the subtle complexities of brain tumors in brain MRI imaging. A meticulous and thorough investigation assesses these various classifiers’ comparative effectiveness com-prehensively. This analysis included a rigorous evaluation of well-established models, including kernel-based SVM, Graph CNN (GCNN), Genetic Algorithm (GA), K-Nearest Neighbor (KNN), Self-Organizing Map (SOM), as well as proposed pioneering ICA2-SVM method. The results of this extensive evaluation, carefully documented in Table 5, not only underline the superiority of our proposed method over traditional techniques but also shed light on its remarkable ability to meticulously detect brain tumors and classify distinct tumor regions in a complex manner with a high level of accuracy. Moreover, a central aspect of our research lies in validating the classification performances presented by the proposed method. This validation process will be discussed in more detail in the next section of this research article. In doing so, we aim to provide a comprehensive and detailed exposition of our innovative approach’s robustness, reliability, and real-world applicability in the domain of brain tumor diagnostics.

5.3 Analysis of Classification Module Performance
A comprehensive evaluation of the performance of the brain tumor classification module on the CE-MRI database involves a complex analysis of various parameters. These parameters serve as crucial measures to assess the model’s effectiveness in accurately categorizing brain tumors. The extensive evaluation of the brain tumor classification model is presented in the Table 6, encompassing a wide range of tumor image types, including pituitary, gliomas, and meningiomas tumors.
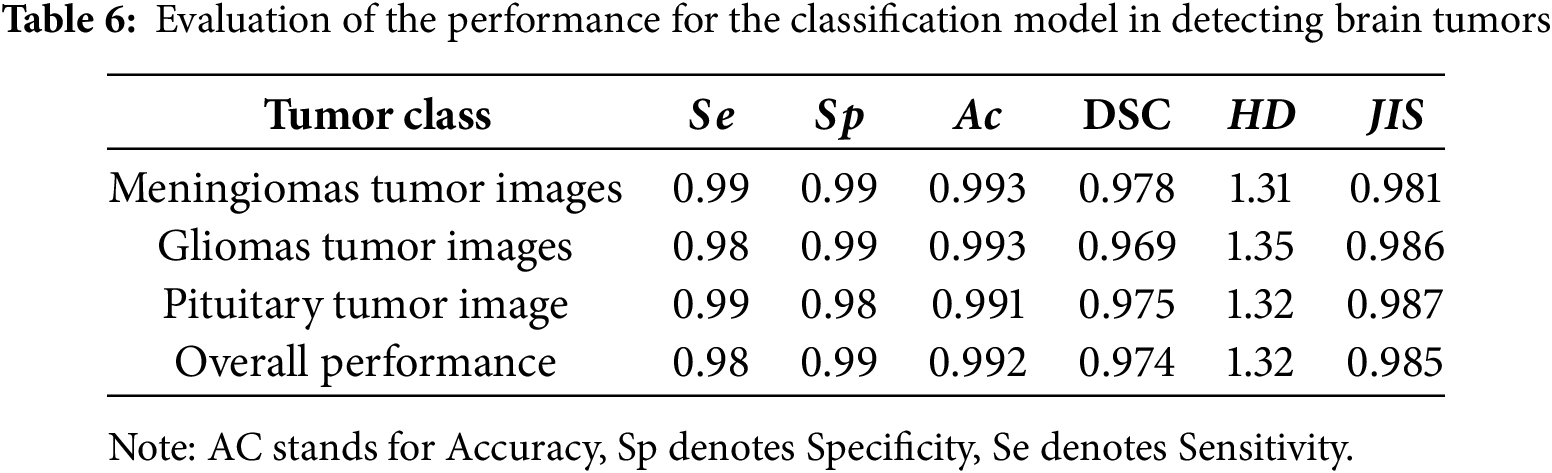
One of the remarkable strengths of the proposed method lies in its robust predictive capabilities. This claim is supported by the consistently high values of sensitivity and specificity observed across all image categories. These values indicate the model’s capability to accurately detect positive instances and distinguish between negative cases accurately, a fundamental requirement for accurate medical diagnosis. Additionally, the reported accuracy values, which signify the model’s overall accuracy in making predictions, reflect a commendable level of performance.
However, it is important to explore deeper to understand the potential imbalances between the different classes and delve into the clinical implications of these findings. Next, examining the DSC values reveals a remarkable overlap between the predicted and actual tumor regions. This overlap means a precise segmentation process. Yet, it is crucial to consider the clinical significance of these overlaps, especially in scenarios where even subtle differences could have important consequences. Moreover, the lower values of the HD and the higher values of the JIS collectively emphasize the model’s accuracy in segmenting tumor regions. These metrics highlight the spatial accuracy of the model’s segmentations and the extent to which the segmented regions align with the ground truth regions.
A compelling case is made for accurately classifying abnormal tumor regions using the ICA2-SVM classifier through meticulous analysis of these parameters. This sophisticated evaluation not only underlines the effectiveness of the proposed method but also establishes its potential as a valuable tool classification of brain tumor abnormalities.
To further validate the proposed enhancement method, we analyzed its impact on brain tumor classification using the ICA2 enhancement technique. As observed in Table 7, the classification performance improved compared to the process without image enhancement. This validation demonstrates the potential of the method for clinical applications in the analysis of brain tumors from MRI images.

5.3.1 Comparison of Classification Module Effectiveness across Various Classifiers
Many researchers have explored various classification techniques to address the challenging task of categorizing distinct brain tumor regions. These approaches are evaluated based on statistical measures such as Sensitivity, Specificity, Precision, and DSC, which provide critical insights into classifier performance. A comparative analysis was conducted on several established methods, including Kernel-Based SVM, GCNN, GA, SOM, KNN, and the proposed ICA2-SVM approach. The findings, presented in Table 8, reveal the superiority of the ICA2-SVM method in terms of accuracy, computational efficiency, and overall robustness.
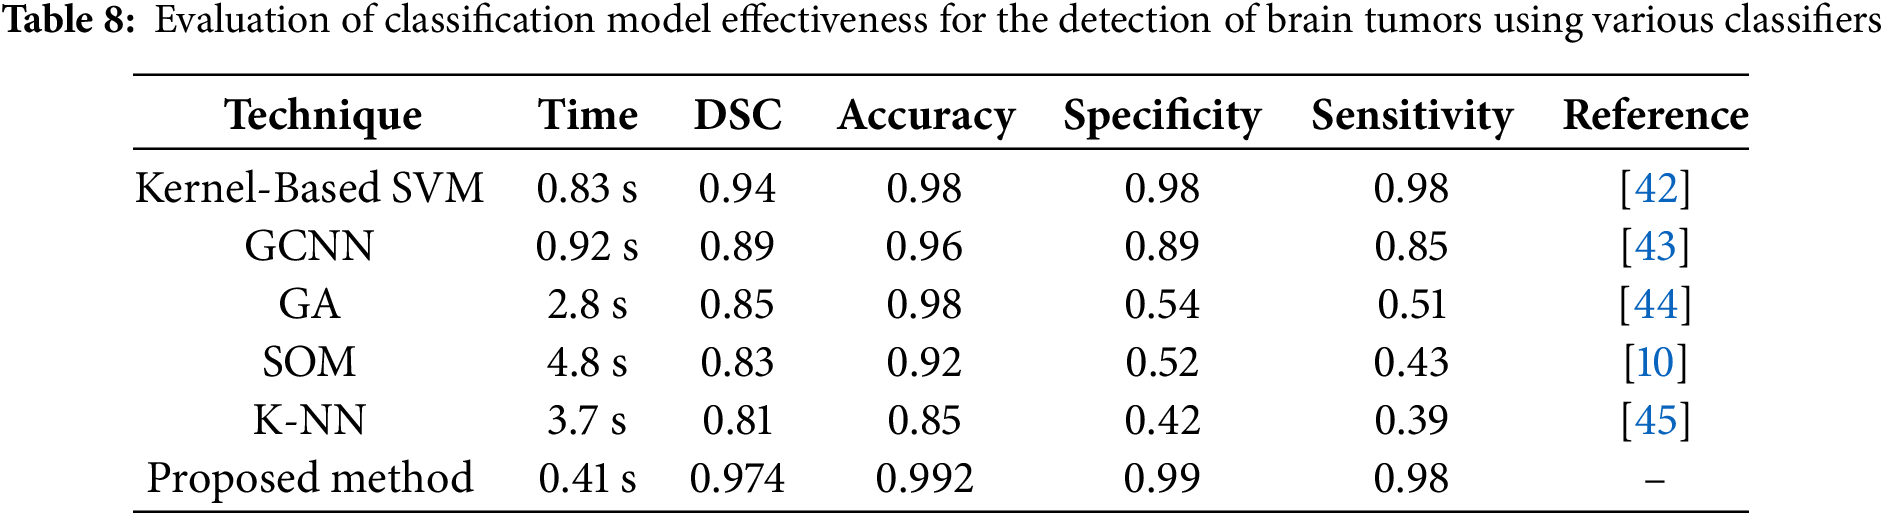
The proposed ICA2-SVM method achieves the highest accuracy of 99.2% with a DSC of 0.974, significantly outperforming other classifiers such as Kernel-Based SVM (accuracy of 98%, DSC of 0.94) and GCNN (accuracy of 96%, DSC of 0.89). Furthermore, the processing time for ICA2-SVM is only 0.41 s, which is considerably lower compared to methods like SOM and KNN, which require 4.8 and 3.7 s, respectively, for classification. This demonstrates that the proposed method is not only more accurate but also highly efficient, making it suitable for clinical applications where time and precision are critical.
Figs. 7 and 8 visually depict the performance metrics and trade-offs of the classifiers. In Fig. 7, the ICA2-SVM method demonstrates the highest accuracy, along with significant contrast improvement and reduced processing time. This establishes the method suitability for real-world scenarios, where efficiency and reliability are paramount.
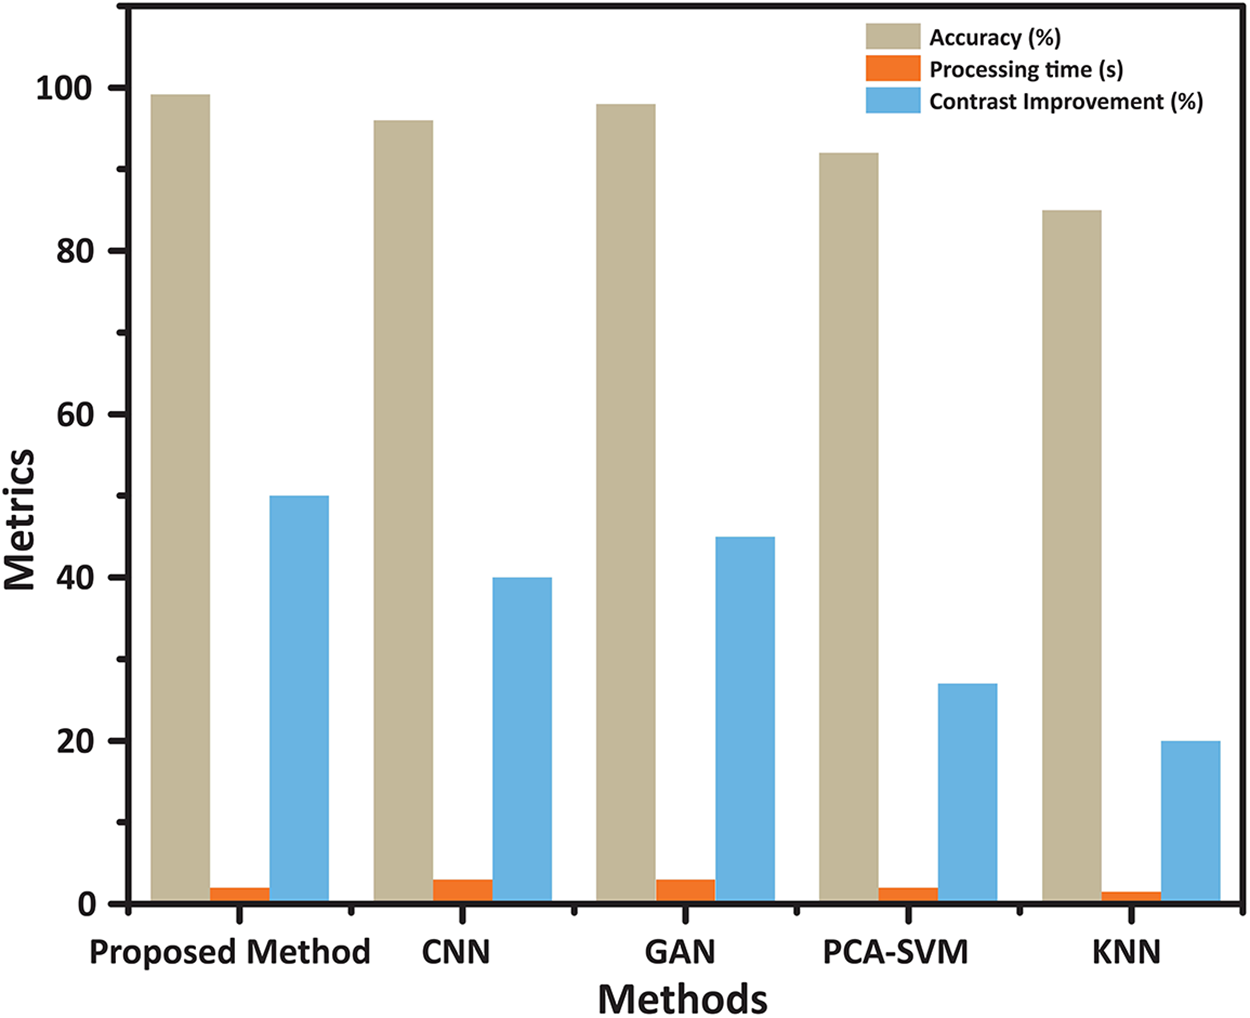
Figure 7: Performance comparison of classification methods: Accuracy, Processing Time, and Contrast Enhancement. The chart presents the evaluation of various classification techniques, including the proposed ICA2-SVM, CNN, GAN, PCA-SVM, and KNN. The proposed method demonstrates the highest accuracy (99.2%) with significant contrast improvement and reduced processing time, showcasing its superior balance between efficiency and effectiveness compared to other classifiers
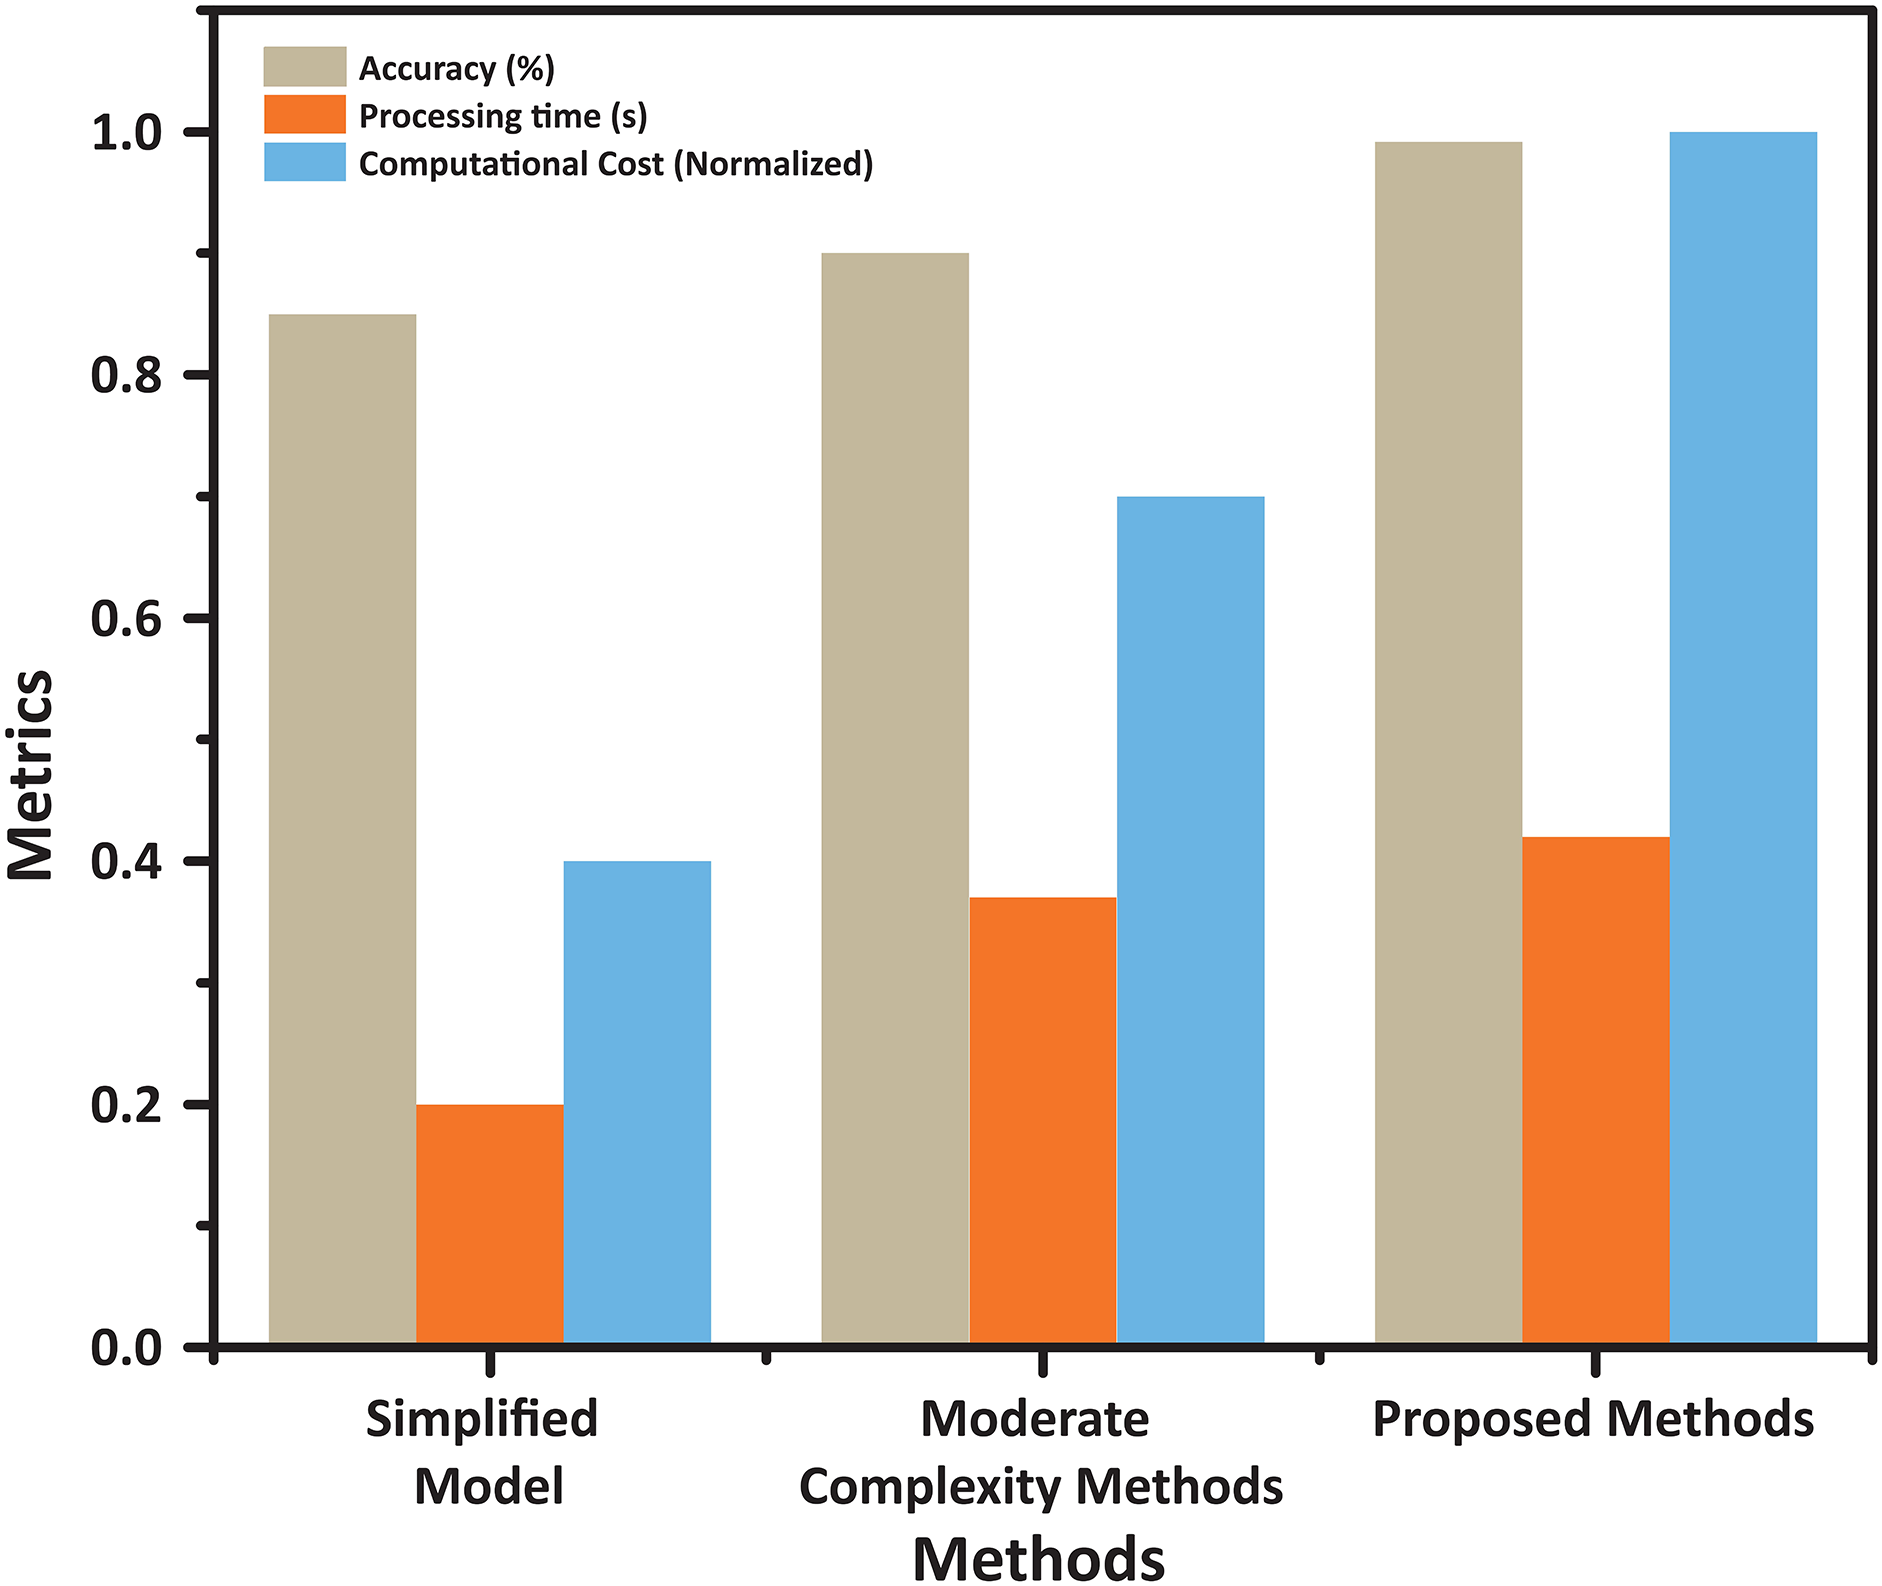
Figure 8: Trade-offs between accuracy, processing time, and computational cost for different methods. This figure compares three approaches—Simplified Model, Moderate Complexity, and the Proposed Method—across accuracy, processing time, and normalized computational cost. The proposed method achieves the highest accuracy while maintaining competitive processing time and computational efficiency, demonstrating an optimal balance suitable for practical applications
In Fig. 8, the trade-offs between accuracy, computational cost, and processing time are highlighted. The proposed ICA2-SVM approach achieves an optimal balance, outperforming other classifiers by maintaining high accuracy while requiring minimal computational resources. This unique combination of attributes positions it as a highly efficient solution for brain tumor classification tasks.
The proposed approach comes with certain limitations and potential risks that must be acknowledged. The dual-phase ICA employed for contrast enhancement and the SVM classifier can result in increased computational requirements, particularly when processing high-resolution images or large datasets. Additionally, the segmentation process may face difficulties in accurately handling irregular tumor shapes or regions with low contrast and noise, potentially impacting overall performance. Moreover, there is a balance between achieving high accuracy (99.2%) and managing computational efficiency, as the higher accuracy comes with a slightly elevated computational cost compared to simpler methods. These limitations underscore the need for further optimization to enhance the method applicability and efficiency in practical clinical settings.
5.3.2 Comparative Assessment with Prior Research
To validate the performance of the proposed ICA2-SVM technique, a comprehensive analysis was conducted by comparing it against various state-of-the-art methods developed from 2019 onward. This comparative study, detailed in Table 9, highlights the advancements and strengths of the proposed method over existing classifiers. The findings underscore the consistent superiority of the ICA2-SVM approach, both in terms of accuracy and computational efficiency, when applied to brain MRI segmentation tasks.
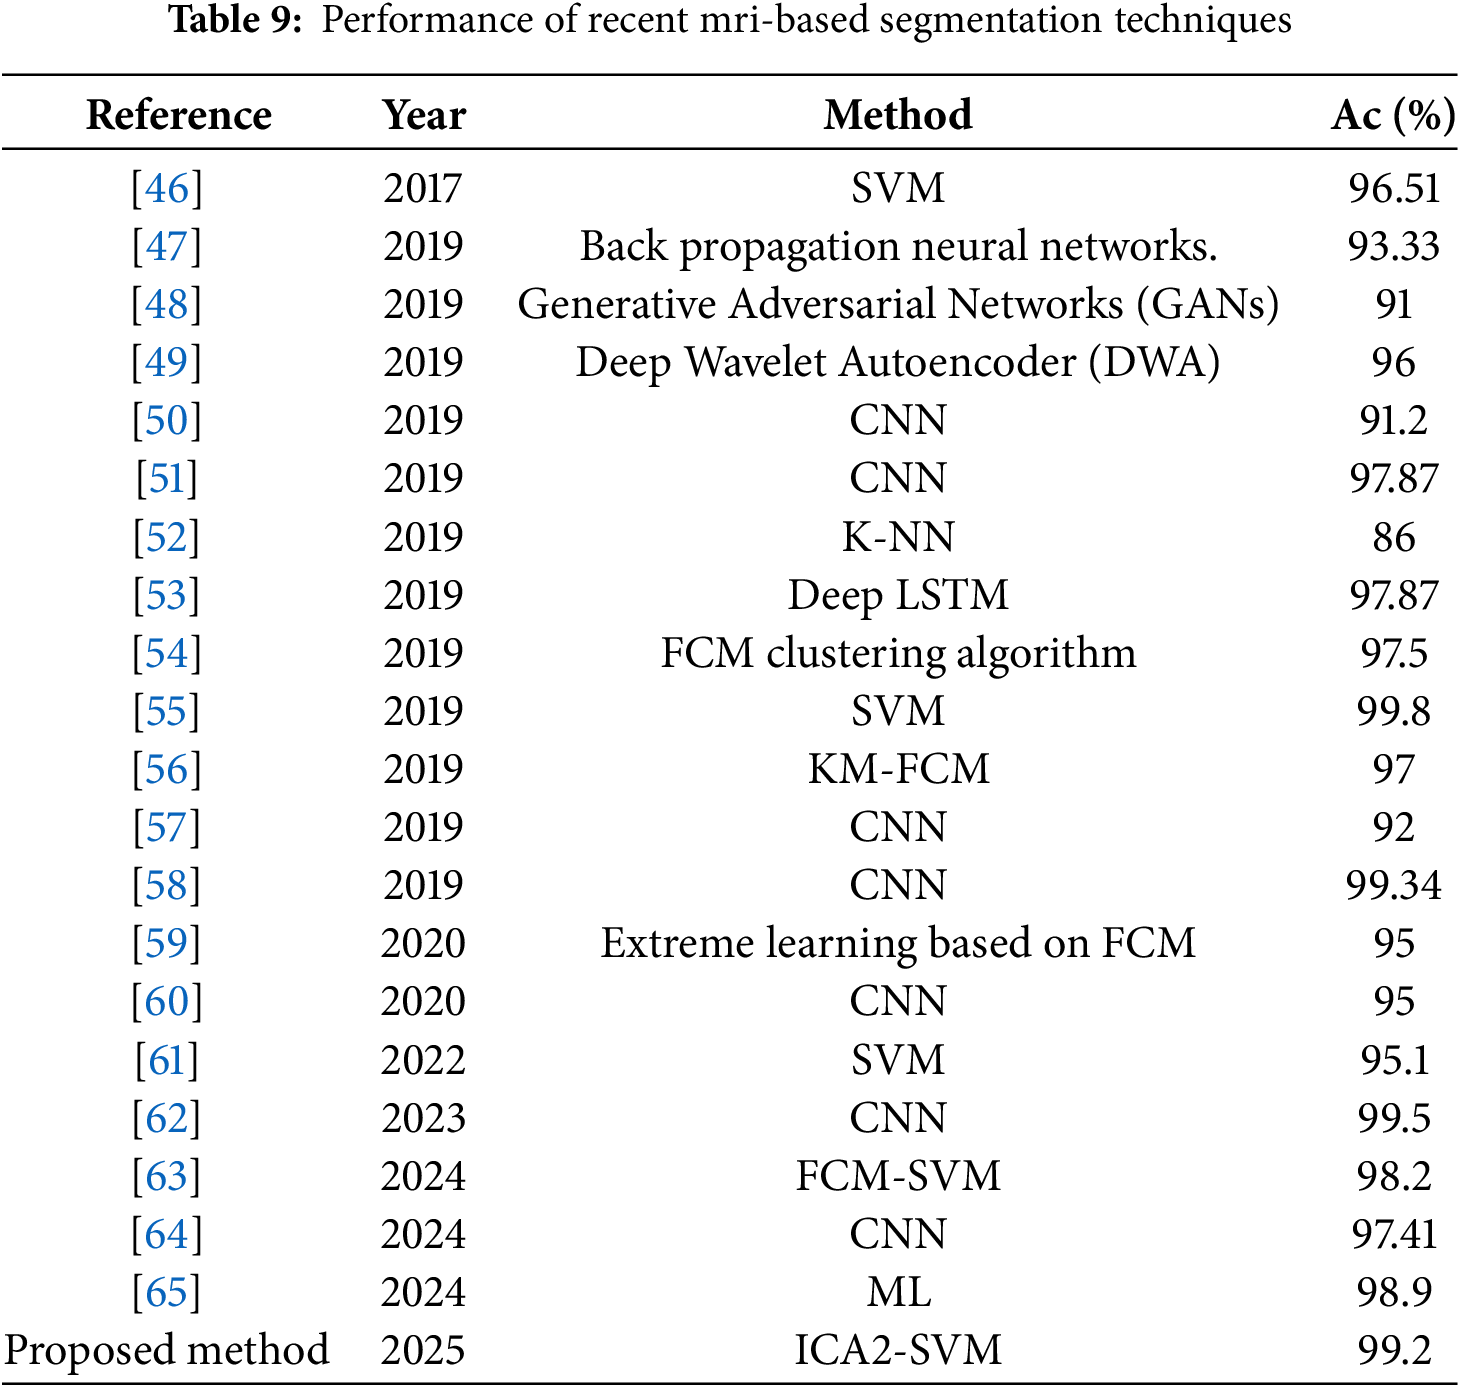
The analysis reveals that, despite the proliferation of deep learning-based techniques such as CNNs and GANs in recent years, their performance has been constrained by limitations in data preprocessing and the computational burden of training complex models. For instance, while CNN-based methods such as those proposed by [62] achieved competitive accuracy (99.5%), their reliance on large datasets and intensive computational resources makes them less practical for real-time applications. Similarly, GAN-based approaches ([48]) demonstrate potential but often face challenges related to data imbalance and training instability, limiting their robustness.
The proposed ICA2-SVM method addresses these challenges through its innovative integration of Independent Component Analysis (ICA2) for contrast enhancement and Support Vector Machines (SVM) for classification. This synergy significantly improves both accuracy and computational efficiency, as evidenced by its performance metrics: an accuracy of 99.2% with minimal processing time of 0.41 s. Compared to traditional SVM approaches ([61], 95.1%) and other DL-based methods, the proposed framework achieves better predictive performance while maintaining a lower computational cost, making it suitable for deployment in clinical settings where timely and reliable results are critical.
Recent advancements in hybrid methodologies, such as FCM-SVM ([63]), have shown promise with an accuracy of 98.2%. However, these techniques still fall short in terms of processing speed and scalability when compared to ICA2-SVM. The proposed method’s ability to leverage the synergistic relationship between image regions in MRI data enhances the classifier predictive capability, making it particularly effective for complex tumor segmentation tasks. Additionally, the deep wavelet autoencoder ([49]), while achieving reasonable performance (96%), lacks the computational efficiency and robustness inherent to the ICA2-SVM framework.
Figs. 7 and 8 further illustrate the performance impact of the proposed method. Fig. 7 highlights the significant accuracy advantage of ICA2-SVM over other classifiers while maintaining competitive processing times and notable improvements in image contrast. Fig. 8 demonstrates the optimal balance achieved by ICA2-SVM between accuracy, processing speed, and computational cost. The method’s ability to maintain high accuracy with minimal resource requirements underscores its suitability for practical applications.
The proposed ICA2-SVM approach serves as a foundation for further innovations in brain MRI analysis. Enhancing the training dataset with advanced machine learning techniques, such as transfer learning and data augmentation, offers opportunities to improve model generalizability and robustness further. These enhancements aim to set new benchmarks in accuracy and efficiency, paving the way for the integration of this method into routine clinical diagnostics. Through continued innovation, the ICA2-SVM framework has the potential to revolutionize brain tumor segmentation and classification, ultimately improving patient outcomes and diagnostic accuracy.
6 Conclusion and Future Directions
This study introduces a novel framework for the automated segmentation and classification of brain tumors. The approach integrates multiple steps, including pre-processing using ICA1 and ICA2 for enhanced image quality, selection of the optimal ICA architecture, precise identification of brain regions, segmentation of tumors, and their subsequent classification. Initially, MRI brain images are improved using ICA1 and ICA2, along with diffusion filtering, to enhance coherence. ICA2 was determined to be the superior architecture for image enhancement following extensive analysis. The Fast-Marching Method (FMM) is then applied for tumor segmentation, with classification performed using an SVM classifier.
Utilizing the CE-MRI dataset, this framework has been tested on various tumor types, including pituitary and meningioma tumors. The proposed ICA2-SVM method significantly enhances contrast and achieves high efficiency in classifying tumor types. The method demonstrates exceptional performance, achieving an average Dice Similarity Coefficient (DSC) of 0.974, accuracy of 0.992, specificity of 0.99, and sensitivity of 0.99. Additionally, it offers competitive processing speed, completing tasks in just 0.41 s, which surpasses many existing approaches. These results highlight the effectiveness of ICA2-SVM in improving MRI image quality and accurately classifying brain tumors, showcasing its potential for clinical use in diagnosis and treatment planning. Despite its promising results, the methodology has the following limitations:
1. The CE-MRI dataset used in the study, while extensive, does not fully represent the variability of brain tumor characteristics observed in clinical settings. Expanding the dataset with more diverse cases could enhance the model’s generalizability.
2. The segmentation process encounters challenges in handling complex or irregular tumor shapes, particularly in low-contrast or noisy images. Improving the method’s adaptability to these scenarios would further enhance its reliability.
3. The model relies on manually annotated ground truth data, which is subject to variability due to differences in radiologists’ interpretations. Addressing this issue could improve the consistency of training and evaluation.
The exceptional performance of this approach demonstrates its superiority over many current methods, evident in its high DSC, accuracy, specificity, and sensitivity. There is significant potential for improving this framework through several avenues for future research, as outlined below:
1. Incorporate data from multiple imaging modalities, such as MRI, PET, and CT, to strengthen tumor segmentation and classification. Combining complementary imaging data can provide a more comprehensive understanding of tumor characteristics.
2. Apply deep learning techniques, including convolutional and recurrent neural networks, to enhance segmentation and classification. These approaches have shown strong potential in medical imaging tasks.
3. Utilize data augmentation techniques to address limited dataset availability by artificially expanding the dataset, which can improve generalization and performance in varied scenarios.
4. Explore transfer learning by fine-tuning pre-trained models on large datasets for specific tumor classifications, thereby expediting training and improving results.
5. Conduct real-world validations by collaborating with medical experts to test the framework on diverse clinical cases, ensuring its effectiveness in practical applications.
6. Improve segmentation accuracy for tumors with complex shapes or low contrast by incorporating advanced segmentation techniques and anatomical priors.
7. Investigate ensemble methods that combine outputs from multiple classifiers or models to enhance robustness and reliability in tumor classification.
8. Develop methods to provide transparency and insights into the decision-making process of classifiers, helping to build trust with clinicians and integrate AI into medical workflows.
9. Expand and diversify datasets to further train and validate the model, improving its generalization and applicability to broader clinical settings.
10. Implement adaptive techniques that allow the model to evolve as new data becomes available, ensuring it keeps pace with changing tumor characteristics.
11. Optimize the framework for real-time applications, enabling rapid and accurate decision-making in clinical procedures.
12. Address ethical and regulatory considerations to ensure patient privacy, data security, and responsible AI deployment in medical practices.
13. Create user-friendly software platforms that allow healthcare professionals to interact with and validate AI-generated results effectively.
14. Foster collaborations among AI researchers, radiologists, oncologists, and other healthcare professionals to develop holistic solutions tailored to clinical needs.
By pursuing these directions, this framework can be refined further, contributing to advancements in automated brain tumor segmentation and classification, ultimately improving patient outcomes and medical diagnostics.
Acknowledgement: The research team thanks the Deanship of Graduate Studies and Scientific Research at Najran University for supporting the research project through the Nama'a program, with the project code NU/GP/MRC/13 /771-1.
Funding Statement: This work was supported by the Deanship of Graduate Studies and Scientific Research at Najran University through funding code NU/GP/MRC/13/771-1.
Author Contributions: Study conception and design: Abdullah A. Asiri, Toufique A. Soomro and Muhammad Irfan; data collection: Toufique A. Soomro, Faisal Bin Ubaid and Ahmed Ali; analysis and interpretation of results: Abdullah A. Asiri, Toufique A. Soomro, Faisal Bin Ubaid, Ahmed Ali, Muhammad Irfan, Khlood M. Mehdar, Magbool Alelyani, Mohammed Alshuhri, Ahmad Joman Alghamdi and Sultan Alamri; draft manuscript preparation: Abdullah A. Asiri and Toufique A. Soomro. All authors reviewed the results and approved the final version of the manuscript.
Availability of Data and Materials: The database is openly available in a public repository and can be accessed at the following link: Brain Tumor CE-MRI Dataset (accessed on 06 March 2025).
Ethics Approval: Not applicable.
Conflicts of Interest: The authors declare no conflicts of interest to report regarding the present study.
References
1. Patel A. Benign vs malignant tumors. JAMA Oncol. 2020;6(9):1488. doi:10.1001/jamaoncol.2020.2592. [Google Scholar] [PubMed] [CrossRef]
2. Soomro TA, Zheng L, Afifi AJ, Ali A, Soomro S, Yin M. Image segmentation for MR brain tumor detection using machine learning: a review. IEEE Rev Biomed Eng. 2023;16:70–90. doi:10.1109/RBME.2022.3185292. [Google Scholar] [PubMed] [CrossRef]
3. Liu R, Page M, Solheim K, Fox S, Chang SM. Quality of life in adults with brain tumors: current knowledge and future directions. Neuro Oncol. 2009;11(3):330–9. doi:10.1215/15228517-2008-093. [Google Scholar] [PubMed] [CrossRef]
4. Armstrong TS, Cohen MZ, Weinberg J, Gilbert MR. Imaging techniques in neuro-oncology. Semin Oncol Nurs. 2004;20(4):231–9. doi:10.1016/S0749-2081(04)00087-7. [Google Scholar] [CrossRef]
5. Deng W, Shi Q, Luo K, Yang Y, Ning N. Brain tumor segmentation based on improved convolutional neural network in combination with non-quantifiable local texture feature. J Med Syst. 2019;43(6):152. doi:10.1007/s10916-019-1289-2. [Google Scholar] [PubMed] [CrossRef]
6. Lundervold A, Lundervold A. An overview of deep learning in medical imaging focusing on MRI. J Med Phys. 2019;29(2):102–27. doi:10.1016/j.zemedi.2018.11.002. [Google Scholar] [PubMed] [CrossRef]
7. Jiang Y, Hou J, Xiao X, Deng H. A brain tumor segmentation new method based on statistical thresholding and multiscale CNN. Int Conf Intell Comput. 2018:235–45. doi:10.1007/978-3-319-95957-3. [Google Scholar] [CrossRef]
8. Hssayeni MD, Croock MS, Salman AD, Al-Khafaji HF, Yahya ZA, Ghoraani B. Intracranial hemorrhage segmentation using a deep convolutional model. Data. 2020;5(1):14. doi:10.3390/data5010014. [Google Scholar] [CrossRef]
9. Soomro TA, Gao J. Neural network-based denoised methods for retinal fundus images and MRI brain images. Int Joint Conf Neural Netw. 2016:1151–7. doi:10.1109/IJCNN.2016.7727327. [Google Scholar] [CrossRef]
10. Logeswari T, Karnan M. An improved implementation of brain tumor detection using segmentation based on hierarchical self-organizing map. Int J Comput Theory Eng. 2010;2(4):591. doi:10.7763/IJCTE.2010.V2.207. [Google Scholar] [CrossRef]
11. Díaz-Pernas FJ, Martínez-Zarzuela M, Antón-Rodríguez M, González-Ortega D. A deep learning approach for brain tumor classification and segmentation using a multiscale convolutional neural network. Healthcare. 2021;9(2):153. doi:10.3390/healthcare9020153. [Google Scholar] [PubMed] [CrossRef]
12. Soomro TA, Khan TM, Khan MAU, Gao J, Paul M, Zheng L. Impact of ICA-based image enhancement technique on retinal blood vessels segmentation. IEEE Access. 2018;6:3524–38. doi:10.1109/ACCESS.2018.2794463. [Google Scholar] [CrossRef]
13. Hani AFM, Soomro TA, Nugroho H, Nugroho HA. Enhancement of colour fundus image and FFA image using RETICA. IEEE-EMBS Conf Biomed Eng Sci. 2012:831–6. doi:10.1109/IECBES.2012.6498205. [Google Scholar] [CrossRef]
14. Goudarzi S, Asif A, Rivaz H. Plane-wave ultrasound beamforming through independent component analysis. Comput Methods Programs Biomed. 2021;203:106036. doi:10.1016/j.cmpb.2021.106036. [Google Scholar] [PubMed] [CrossRef]
15. Hyvarinen A. Fast and robust fixed-point algorithms for independent component analysis. IEEE Trans Neural Netw. 1999;10(3):626–34. doi:10.1109/72.761722. [Google Scholar] [PubMed] [CrossRef]
16. Jia Z, Chen D. Brain tumor identification and classification of MRI images using deep learning techniques is incomplete. IEEE Access. 2020. doi:10.1109/ACCESS.2020.3016319. [Google Scholar] [CrossRef]
17. Yamanakkanavar N, Choi JY, Lee B. MRI segmentation and classification of human brain using deep learning for diagnosis of Alzheimer’s disease: a survey. Sensors. 2020;20(11):3243. doi:10.3390/s20113243. [Google Scholar] [PubMed] [CrossRef]
18. Nayak DR, Padhy N, Mallick PK, Bagal DK, Kumar S. Brain tumour classification using noble deep learning approach with parametric optimization through metaheuristics approaches. Computers. 2022;11(1):10. doi:10.3390/computers11010010. [Google Scholar] [CrossRef]
19. Nayak DR, Padhy N, Mallick PK, Zymbler M, Kumar S. Brain tumor classification using dense efficient-net. Axioms. 2022;11(1):34. doi:10.3390/axioms11010034. [Google Scholar] [CrossRef]
20. Hazarika RA, Kandar D, Maji AK. An experimental analysis of different deep learning-based models for Alzheimer’s disease classification using brain magnetic resonance images. J King Saud Univ Comput Inf Sci. 2022;10:8576–98. doi:10.1016/j.jksuci.2021.09.003. [Google Scholar] [CrossRef]
21. Ruba T, Tamilselvi R, Beham MP, Aparna N. Accurate classification and detection of brain cancer cells in MRI and CT images using nano contrast agents. Biomed Pharmacol J. 2020;13(3):1227–37. doi:10.13005/bpj/1991. [Google Scholar] [CrossRef]
22. Veeramuthu A, Meenakshi S, Mathivanan G, Kotecha K, Saini JR, Vijayakumar V, et al. MRI brain tumor image classification using a combined feature and image-based classifier. Front Psychol. 2022;13:848784. doi:10.3389/fpsyg.2022.848784. [Google Scholar] [PubMed] [CrossRef]
23. Tambe P, Saigaonkar R, Devadiga N, Chitte PH. Deep learning techniques for effective diagnosis of Alzheimer’s disease using MRI images. ITM Web Conf. 2021;40:03021. doi:10.1051/itmconf/20214003021. [Google Scholar] [CrossRef]
24. Wahlang I, Maji AK, Saha G, Chakrabarti P, Jasinski M, Leonowicz Z, et al. Brain magnetic resonance imaging classification using deep learning architectures with gender and age. Sensors. 2022;22(5):1766. doi:10.3390/s22051766. [Google Scholar] [PubMed] [CrossRef]
25. Shenbagarajan A, Ramalingam V, Balasubramanian C, Palanivel S. Tumor diagnosis in MRI brain image using ACM segmentation and ANN-LM classification techniques. Indian J Sci Technol. 2016;9(1):1–12. doi:10.17485/ijst/2016/v9i1/78766. [Google Scholar] [CrossRef]
26. Despotović I, Goossens B, Philips W. MRI segmentation of the human brain: challenges, methods, and applications. Comput Math Methods Med. 2015;2015:450341. doi:10.1155/2015/450341. [Google Scholar] [PubMed] [CrossRef]
27. Gab Allah AM, Sarhan AM, Elshennawy NM. Classification of brain MRI tumor images based on deep learning PGGAN augmentation. Diagnostics. 2021;11(12):2343. doi:10.3390/diagnostics11122343. [Google Scholar] [PubMed] [CrossRef]
28. Koshino K, Werner RA, Pomper MG, Bundschuh RA, Toriumi F, Higuchi T, et al. Narrative review of generative adversarial networks in medical and molecular imaging. Ann Transl Med. 2021;9(9):821. doi:10.21037/atm-20-6325. [Google Scholar] [PubMed] [CrossRef]
29. You A, Kim JK, Ryu IH, Yoo TK. Application of generative adversarial networks (GAN) for ophthalmology image domains: a survey. Eye Vis. 2022;9(1):6. doi:10.1186/s40662-022-00277-3. [Google Scholar] [PubMed] [CrossRef]
30. Mahalakshmi D, Sumathi S. Performance analysis of SVM and deep learning with CNN for brain tumor detection and classification. ICTACT J Image Video Process. 2020;10(3):2145–52. [Google Scholar]
31. Barburiceanu S, Terebes R, Meza S. 3D texture feature extraction and classification using GLCM and LBP-based descriptors. Appl Sci. 2021;11(5):2332. doi:10.3390/app11052332. [Google Scholar] [CrossRef]
32. Aaraji ZS, Abbas HH. Automatic classification of Alzheimer’s disease using brain MRI data and deep Convolutional Neural Networks. arXiv:2204.00068. 2022. [Google Scholar]
33. Yamashita R, Nishio M, Do RKG, Togashi K. Convolutional neural networks: an overview and application in radiology. Insights Imaging. 2018;9(4):611–29. doi:10.1007/s13244-018-0639-9. [Google Scholar] [PubMed] [CrossRef]
34. Mowla MR, Gonzalez-Morales JD, Rico-Martinez J, Ulichnie DA, Thompson DE. A comparison of classification techniques to predict brain-computer interfaces accuracy using classifier-based latency estimation. Brain Sci. 2020;10(10):734. doi:10.3390/brainsci10100734. [Google Scholar] [PubMed] [CrossRef]
35. Rasheed Z, Ma YK, Ullah I, Ghadi YY, Khan MZ, Khan MA, et al. Brain tumor classification from MRI using image enhancement and convolutional neural network techniques. Brain Sci. 2023;13(9):1320. doi:10.3390/brainsci13091320. [Google Scholar] [PubMed] [CrossRef]
36. Aamir M, Rahman Z, Dayo ZA, Abro WA, Uddin MI, Khan I, et al. A deep learning approach for brain tumor classification using MRI images. Comput Electr Eng. 2022;101:108105. doi:10.1016/j.compeleceng.2022.108105. [Google Scholar] [CrossRef]
37. Matsuda Y, Yamaguchi K. Gram-Schmidt orthonormalization to the adaptive ICA function for fixing the permutation ambiguity. In: Hirose A, Ozawa S, Doya K, Ikeda K, Lee M, Liu D, editors. Neural information processing. ICONIP 2016. Vol. 9948. Cham: Lecture Notes in Computer Science, Springer; 2016. [Google Scholar]
38. Cheng J. Brain tumor dataset. Figshare. Dataset. 2017. doi:10.6084/m9.figshare.1512427.v5. [Google Scholar] [CrossRef]
39. Fehrenbach J, Mirebeau JM. Sparse non-negative stencils for anisotropic diffusion. J Math Imaging Vis. 2014;49:123–47. doi:10.1007/s10851-013-0446-3. [Google Scholar] [CrossRef]
40. Sethian JA. Fast marching methods. SIAM Rev. 1999;41(2):199–235. doi:10.1137/S0036144598347059. [Google Scholar] [CrossRef]
41. Vankdothu R, Hameed MA. Brain tumor segmentation of MR images using SVM and fuzzy classifier in machine learning. Meas Sens. 2022;24:100440. doi:10.1016/j.measen.2022.100440. [Google Scholar] [CrossRef]
42. Mandle AK, Sahu SP, Gupta G. Brain tumor segmentation and classification in MRI using clustering and kernel-based SVM. Biomed Pharmacol J. 2022;15(2). doi:10.13005/bpj. [Google Scholar] [CrossRef]
43. Mittal M, Goyal LM, Kaur S, Kaur I, Verma A, Hemanth DJ. Deep learning based enhanced tumor segmentation approach for MR brain images. Appl Soft Comput. 2019;78:346–54. doi:10.1016/j.asoc.2019.02.036. [Google Scholar] [CrossRef]
44. Kharrat A, Gasmi K, Ben Messaoud M, Benamrane N, Abid M. A hybrid approach for automatic classification of brain MRI using genetic algorithm and support vector machine. Leonardo J Sci. 2010;17:71–82. [Google Scholar]
45. Vrooman HA, Cocosco CA, Van der Lijn F, Stokking R, Ikram MA, Vernooij MW, et al. Multi-spectral brain tissue segmentation using automatically trained k-Nearest-Neighbor classification. NeuroImage. 2007;37(1):71–81. doi:10.1016/j.neuroimage.2007.05.018. [Google Scholar] [PubMed] [CrossRef]
46. Bahadure NB, Ray AK, Thethi HP. Image analysis for MRI based brain tumor detection and feature extraction using biologically inspired BWT and SVM. Int J Biomed Imaging. 2017;2017:9749108. doi:10.1155/2017/9749108. [Google Scholar] [PubMed] [CrossRef]
47. Shakeel PM, Tobely TEE, Al-Feel H, Manogaran G, Baskar S. Neural network based brain tumor detection using wireless infrared imaging sensor. IEEE Access. 2019;7:5577–88. doi:10.1109/ACCESS.2018.2883957. [Google Scholar] [CrossRef]
48. Han C, Rundo L, Araki R, Nagano Y, Furukawa Y, Mauri G, et al. Combining Noise-to-Image and Image-to-Image GANs: Brain MR Image Augmentation for Tumor Detection. arXiv:1905.13456. 2019. [Google Scholar]
49. Mallick PK, Ryu SH, Satapathy SK, Mishra S, Nguyen GN, Tiwari P. Brain MRI image classification for cancer detection using deep wavelet autoencoder-based deep neural network. IEEE Access. 2019;7:46278–87. doi:10.1109/ACCESS.2019.2902252. [Google Scholar] [CrossRef]
50. Li M, Kuang L, Xu S, Sha Z. Brain tumor detection based on multimodal information fusion and convolutional neural network. IEEE Access. 2019;7:180134–46. doi:10.1109/ACCESS.2019.2958370. [Google Scholar] [CrossRef]
51. Hossain T, Shishir FS, Ashraf M, Al Nasim MA, Shah FM. Brain tumor detection using convolutional neural network. In: 2019 1st International Conference on Advances in Science, Engineering and Robotics Technology (ICASERT); Dhaka, Bangladesh; 2019. p. 1–6. doi:10.1109/ICASERT.2019.8934561. [Google Scholar] [CrossRef]
52. Noman Qasem S, Nazar A, Qamar A, Shamshirband S, Karim A. A learning based brain tumor detection system. Comput Mater Contin. 2019;59(3):713–27. doi:10.32604/cmc.2019.05617. [Google Scholar] [CrossRef]
53. Amin J, Sharif M, Raza M, Saba T, Sial R, Shad SA. Brain tumor detection: a long short-term memory (LSTM)-based learning model. Neural Comput Applic. 2020;32:15965–73. doi:10.1007/s00521-019-04650-7. [Google Scholar] [CrossRef]
54. Alam MS, Rahman MM, Hossain MA, Islam MK, Ahmed KM, Ahmed KT, et al. Automatic human brain tumor detection in MRI image using template-based K means and improved fuzzy C means clustering algorithm. Big Data Cogn Comput. 2019;3(2):27. doi:10.3390/bdcc3020027. [Google Scholar] [CrossRef]
55. Janardhanaprabhu S, Malathi V. Brain tumor detection using depth-first search tree segmentation. J Med Syst. 2019;43(8):254. doi:10.1007/s10916-019-1366-6. [Google Scholar] [PubMed] [CrossRef]
56. Rajan PG, Sundar C. Brain tumor detection and segmentation by intensity adjustment. J Med Syst. 2019;43(8):282. doi:10.1007/s10916-019-1368-4. [Google Scholar] [PubMed] [CrossRef]
57. Thaha MM, Kumar KPM, Murugan BS, Dhanasekeran S, Vijayakarthick P, Selvi AS. Brain tumor segmentation using convolutional neural networks in MRI images. J Med Syst. 2019;43(9):294. doi:10.1007/s10916-019-1416-0. [Google Scholar] [PubMed] [CrossRef]
58. Noreen N, Palaniappan S, Qayyum A, Ahmad I, Imran M, Shoaib M. A deep learning model based on concatenation approach for the diagnosis of brain tumor. IEEE Access. 2020;8:55135–44. doi:10.1109/ACCESS.2020.2978629. [Google Scholar] [CrossRef]
59. Sharif M, Amin J, Raza M, Anjum MA, Afzal H, Shad SA. Brain tumor detection based on extreme learning. Neural Comput Appl. 2020;32:15975–87. doi:10.1007/s00521-019-04679-8. [Google Scholar] [CrossRef]
60. Saxena P, Maheshwari A, Maheshwari S. Predictive modeling of brain tumor: a deep learning approach. In: Innovations in computational intelligence and computer vision. Singapore: Springer; 2020. p. 275–85. [Google Scholar]
61. Senan EM, Jadhav ME, Rassem TH, Aljaloud AS, Mohammed BA, Al-Mekhlafi ZG. Early diagnosis of brain tumour MRI images using hybrid techniques between deep and machine learning. Comput Math Methods Med. 2022;2022:8330833. doi:10.1155/2022/8330833. [Google Scholar] [PubMed] [CrossRef]
62. Abdusalomov AB, Mukhiddinov M, Whangbo TK. Brain tumor detection based on deep learning approaches and magnetic resonance imaging. Cancers. 2023;15(16):4172. doi:10.3390/cancers15164172. [Google Scholar] [PubMed] [CrossRef]
63. Alqhtani SM, Soomro TA, Shah AA, Memon AA, Irfan M, Rahman S, et al. Improved brain tumor segmentation and classification in brain MRI with FCM-SVM: a diagnostic approach. IEEE Access. 2024;12:61312–35. doi:10.1109/ACCESS.2024.3394541. [Google Scholar] [CrossRef]
64. Ranjbarzadeh R, Zarbakhsh P, Caputo A, Babaee Tirkolaee E, Bendechache M. Brain tumor segmentation based on optimized convolutional neural network and improved chimp optimization algorithm. Comput Biol Med. 2024;168:107723. doi:10.1016/j.compbiomed.2023.107723. [Google Scholar] [PubMed] [CrossRef]
65. Asiri AA, Soomro TA, Shah AA, Pogrebna G, Irfan M, Alqahtani S. Optimized brain tumor detection: a dual-module approach for MRI image enhancement and tumor classification. IEEE Access. 2024;12:42868–87. doi:10.1109/ACCESS.2024.3379136. [Google Scholar] [CrossRef]
Cite This Article
 Copyright © 2025 The Author(s). Published by Tech Science Press.
This work is licensed under a Creative Commons Attribution 4.0 International License , which permits unrestricted use, distribution, and reproduction in any medium, provided the original work is properly cited.
 Downloads
 Citation Tools