
 Submit a Paper
 Propose a Special lssue
 Open Access
ARTICLE
Multi-Objective Approaches for Optimizing 37-Bus Power Distribution Systems with Reconfiguration Technique: From Unbalance Current & Voltage Factor to Reliability Indices
Adana Organize Industrial Region of Vocational School Technical Sciences, Cukurova University, Adana, 01410, Türkiye
* Corresponding Author: Murat Cikan. Email:
(This article belongs to the Special Issue: Computational Intelligent Systems for Solving Complex Engineering Problems: Principles and Applications-II)
Computer Modeling in Engineering & Sciences 2025, 143(1), 673-721. https://doi.org/10.32604/cmes.2025.061699
Received 01 December 2024; Accepted 20 February 2025; Issue published 11 April 2025
 View Full Text
 Download PDF
Abstract
This study examines various issues arising in three-phase unbalanced power distribution networks (PDNs) using a comprehensive optimization approach. With the integration of renewable energy sources, increasing energy demands, and the adoption of smart grid technologies, power systems are undergoing a rapid transformation, making the need for efficient, reliable, and sustainable distribution networks increasingly critical. In this paper, the reconfiguration problem in a 37-bus unbalanced PDN test system is solved using five different popular metaheuristic algorithms. Among these advanced search algorithms, the Bonobo Optimizer (BO) has demonstrated superior performance in handling the complexities of unbalanced power distribution network optimization. The study is structured around four distinct scenarios: (I) improving mean voltage profile and minimizing active power loss, (II) minimizing Voltage Unbalance Index (VUI) and Current Unbalance Index (CUI), (III) optimizing key reliability indices using both Line Oriented Reliability Index (LORI) and Customer Oriented Reliability Index (CORI) approaches, and (IV) employing multi-objective optimization using the Pareto front technique to simultaneously minimize active power loss, average CUI, and System Average Interruption Duration Index (SAIDI). The study aims to contribute to the development of more efficient, reliable, and sustainable energy systems by addressing voltage profiles, power losses, reduction of imbalance, and the enhancement of reliability together.Keywords
Power distribution networks (PDN), which have a complex structure, require careful planning and management to operate reliably and efficiently. The increasing electricity demand, driven by the growth of new technologies such as electric vehicles, is causing PDNs to face various challenges [1]. One of the most important challenges in ensuring reliable and efficient operation is minimizing power losses while also improving the network’s voltage profile [2–4]. When electricity is transmitted through a network, a portion of the active power is lost due to the resistance in the wires and other components. Through reconfiguration, the positions of sectional (SS) and tie switches (TS) can be optimally changed to minimize the distance that the electric current travels along the transmission line, thereby reducing the amount of active power lost [2,3]. This helps to increase the efficiency of the PDN while reducing costs for utilities and customers. Additionally, reconfiguration balances the load among different parts of the network, improving the quality of power distribution; this helps reduce voltage fluctuations and other issues that could affect the reliability of the power supply, and it can also help improve the resilience of the network [2]. Establishing multiple paths in the transmission line to facilitate the flow of electric current can help reduce the impact of potential faults or other issues in the network, minimizing the risk of power outages and other disruptions that could have serious consequences for customers. In summary, reconfiguration in PDN is of critical importance for reducing power losses, improving power quality and reliability, and increasing the resilience of the network.
The reconfiguration problem in power distribution networks (PDNs) is approached through four main methods in the literature: classical methods, heuristic methods, the metaheuristic methods, and modern methods [5]. Classical methods rely on linear and non-linear mathematical models to solve the problem. Heuristic methods offer faster and more practical solutions, utilizing approaches based on the fundamental characteristics of the problem. Metaheuristic methods, inspired by nature, efficiently explore large solution spaces to find optimized results, with techniques such as genetic algorithms and particle swarm optimization. Modern methods, on the other hand, leverage advanced technologies like artificial intelligence, machine learning, and IoT to provide more dynamic and innovative solutions. Each of these four methods offers unique advantages and plays a vital role in addressing reconfiguration challenges. One of the most studied methods in recent times is metaheuristic approach [5]. These methods, inspired by nature, effectively explore large solution spaces and demonstrate superior performance in achieving critical goals such as reducing energy losses, improving voltage profiles, and balancing loads. Metaheuristic methods provide robust and optimized solutions to complex problems, particularly those involving unbalanced or highly complex solution spaces, due to their ability to conduct comprehensive and efficient searches and their effectiveness in handling large and dynamic solution spaces. On the other hand, modern methods, leveraging artificial intelligence, machine learning, and IoT-based approaches, hold significant potential for making reconfiguration processes more dynamic and real-time. However, metaheuristic methods currently stand out as a more reliable and effective tool for obtaining optimized solutions to reconfiguration problems. Table 1 shows the summary of the literature review of reconfiguration methods in PDNs.

In the literature, in many studies addressing the reconfiguration problem in PDN, distribution networks are often modeled as balanced power systems [3,4]. In this approach, unbalanced systems are often simplified as positive sequence systems or represented as three independent single-phase networks [6]. The balanced modeling method is widely used to solve the reconfiguration problem because of its simple structure and simplifies the solution process. However, real distribution networks are inherently unbalanced and therefore the analysis and optimization of unbalanced systems becomes a more complex and challenging process. Due to the unique characteristics of unbalanced systems, such as increased losses in power distribution and adverse effects on power quality, more sophisticated algorithms and methods are required for effective reconfiguration. Consequently, in solving the reconfiguration problem in PDN, researchers typically employ metaheuristic or deterministic methods, regardless of whether the system model is considered balanced or unbalanced. Deterministic methods for solving the reconfiguration problem usually apply complex linear or nonlinear programming techniques. However, such approaches are more favored for solving non-convex or nonlinear problems and may fail to reach a global optimum and run the risk of getting stuck in local optima [7–9]. In this context, heuristics and metaheuristics have been used as effective alternatives to traditional techniques. The different techniques and methods used in the literature for solving the reconfiguration problem in PDN have been extensively presented in references [10] and [11]. Recently, a comprehensive reconfiguration study conducted by considering the PDN as balanced has been presented in [2]. In this study, many popular metaheuristic algorithms from the literature are applied to four different test systems, and the best-performing algorithm is selected with the help of various statistical methods. Additionally, a new reliability index calculation method is presented, contributing to the literature. In addition to many previous studies conducted on reconfiguration considering the PDN as balanced, some articles published in recent years are presented as follows. In [12], a hybrid metaheuristic algorithm is applied to reduce power loss. One popular algorithm is used for distributed generation (DG) allocation, while the other is applied to the reconfiguration problem, aiming to improve performance in the 33-bus and 69-bus test systems. In [13], an iterative bi-level scheduling method is applied with multi-step reconfiguration on 33-bus and 118-bus test systems. With this method, power loss is decreased, and the voltage profile is improved.
Since real distribution lines are unbalanced three-phase systems, they have a complex structure and are difficult to analyze. Therefore, compared to studies considering PDN as balanced, there are significantly fewer studies in the literature focusing on the reconfiguration of unbalanced test systems. In unbalanced distribution networks, factors such as phase angle imbalances, uneven load distribution, asymmetric line impedances, and system faults affect current and voltage unbalanced indexes, thereby reducing power quality. Increases in current and voltage indexes lead to issues such as overheating and equipment failures, thereby reducing system efficiency. Therefore, it is essential to carefully analyze the current unbalance index (CUI) and voltage unbalance index (VUI) values [3,4]. Furthermore, photovoltaic (PV) systems, a renewable energy source increasingly integrated into power distribution networks, are among the factors that affect power quality [14]. Fluctuations in the output of PV systems can lead to issues such as harmonics generation, reverse power flow, and voltage imbalance. These effects also can adversely impact power quality [14].
Reliability in PDNs is another critical factor that directly affects utility performance and customer satisfaction. In studies conducted on unbalanced PDNs, it has been observed that there are limited analyses on reliability indices. In this study, however, reliability analysis is comprehensively addressed. The study presents detailed analysis results for reliability indices such as Average Energy Not Supplied (AENS), Customer Average Interruption Duration Index (CAIDI), Average Service Availability Index (ASAI), System Average Interruption Frequency Index (SAIFI), and System Average Interruption Duration Index (SAIDI). Some studies on unbalanced PDNs in the literature are as follows. Reference [3] uses the SMA to address the reconfiguration problem in a 123-bus unbalanced power distribution network, aiming to minimize power loss, CUI, and VUI. The method is validated through simulations in MATLAB and OpenDSS, and the results show the SMA’s effectiveness in minimizing losses, reducing unbalanced indices, and improving voltage profiles, compared to other algorithms like EO and DE.
Reference [24] presents a dynamic reconfiguration approach for a three-phase unbalanced distribution network, optimizing the network topology to adapt to time-varying load demand and distributed generation output while minimizing power loss costs. Reference [25] presents a method to optimize unbalanced distribution networks by maintaining the voltage profile through multi-objective reconfiguration using the Firefly algorithm in a fuzzy domain, incorporating a load flow method, and comparing the results with other algorithms such as GA, ABC, PSO, and GA-PSO. Reference [27] formulates the distribution network reconfiguration problem as a Markov Decision Process, using reinforcement learning (RL) to learn the optimal control policy, with the power distribution network modelled as a graph, and the approach validated on modified IEEE 13 and 34 bus test networks. Reference [28] proposes a network reconfiguration methodology for three-phase unbalanced distribution systems under both normal operating and post-fault conditions, focusing on real power loss minimization and faulty line isolation while ensuring maximum service restoration and power demand fulfilment, validated on IEEE 34-bus and IEEE 123-bus systems. Reference [29] presents a modified backward/forward sweep-based power flow method (BF-PF) for three-phase unbalanced radial distribution networks, capable of adapting the system topology during reconfiguration and avoiding errors caused by continuous topology changes, validated through tests on the IEEE 13-node and 123-node test feeders. Reference [30] proposes a static reconfiguration (SR) model for unbalanced systems with variable demand, comparing it with dynamic reconfiguration (DR) by employing a selective bat algorithm to solve the distribution network reconfiguration (DNR) problem. Tests are conducted on both balanced and unbalanced systems, and the results of SR using SBAT are compared with selective PSO and selective HS. Reference [31] introduces a distributionally robust chance-constrained dynamic reconfiguration approach for a three-phase unbalanced distribution network, optimizing switching costs and expected power supply costs while ensuring chance constraints hold under the worst-case distribution. The proposed model is formulated as a mixed-integer linear programming problem and tested on IEEE 34-bus and 123-bus systems to demonstrate its effectiveness and efficiency. Reference [32] proposes a teaching learning-based optimization approach for the simultaneous reduction of real power loss and net reactive power flow, enhancement of VSI, and minimization of aggregated voltage deviation index in a three-phase unbalanced distribution system with DGs and shunt capacitor units. The method is applied to an IEEE 33-bus and 123-bus system, demonstrating significant improvements in voltage stability and reductions in active power losses.
The research gap can be listed as follows. Previous studies in the literature have predominantly applied the reconfiguration technique to balanced PDNs to enhance system performance. However, real-world power distribution networks are typically unbalanced in nature. In this study, the reconfiguration problem is addressed on the IEEE 37-bus UPDN, which represents real-world conditions. Accordingly, solutions are derived by considering the challenges of real-world conditions. In addition, in some studies on unbalanced PDNs, analyses have been conducted without including components such as voltage regulators and capacitor banks. While these analyses simplify the calculations, they do not fully capture the complexities of real distribution networks. Although studies have been conducted on indices such as VUI and CUI that affect power quality in UPDNs, no comprehensive research has been carried out in this area. In particular, this study provides a comprehensive analysis and demonstrates the tradeoff between these indices and power loss. A comprehensive study involving the calculation of all reliability indices in UPDNs, such as AENS, CAIDI, ASAI, SAIFI, and SAIDI, in UPDNs has not been conducted in detail in the literature. In this study, all reliability index calculations are performed on the 37-bus UPDN using LORI and CORI approaches. Moreover, a multi-objective study has been performed for the first time (to the best of our knowledge) by considering power loss, CUI and SAIDI. Thus, power loss, unbalanced index, and reliability indices are addressed in a multi-objective manner, and the optimization process is carried out.
In this study, a comprehensive analysis is conducted on the 37-bus unbalanced PDN. The contributions of this study are listed as follows. The study is examined under four different scenarios.
• Scenario I focuses on enhancing the efficiency of the PDN by reducing active power losses and improving the voltage profile.
• In Scenario II, methods aimed at reducing the adverse effects of voltage and current imbalances are investigated, with a focus on minimizing VUI and CUI.
• In Scenario III, both the Line-Oriented Reliability Index (LORI) and the Customer-Oriented Reliability Index (CORI) approaches are used to optimize key reliability indices such as SAIFI, SAIDI, CAIDI, ASAI, and AENS. As a result, the reliability of the network is improved.
• In Scenario IV, active power loss, average CUI, and SAIDI values are addressed using a multi-objective optimization approach to minimize them simultaneously with the Pareto front approach.
• In this study, popular meta-heuristic optimization algorithms from the literature, including Bonobo Optimizer (BO) [33], Mountain Gazelle Optimizer (MGO) [34], Hippopotamus Optimization Algorithm (HO) [35], Weighted Mean Optimizer (INFO) [36], and Runge-Kutta Optimizer (RUN) [37], are employed to identify the best-performing algorithm for the reconfiguration of the 37-bus unbalanced test system.
The remainder of this study is organized as follows: Section 2 provides the mathematical expressions for the objective functions and constraints. Section 3 provides a detailed explanation of the mathematical formulations and operating principles of the Bonobo Optimizer (BO) algorithm. Section 4 explains the technical specifications of the IEEE 37-Bus Unbalanced Distribution Test System. Additionally, the current and voltage values obtained using the 3-phase unbalanced load flow algorithm are compared with the data provided by the IEEE 37-Bus Unbalanced Distribution Test System, and the error percentage is calculated. Finally, the last section presents the conclusion.
2 Problem Formulation and Constraints
This section focuses on the mathematical modelling and the key constraints that define the optimization problem for power distribution system. The goal is to provide a comprehensive framework for improving the efficiency, reliability and overall performance of the distribution network. The optimization problem considers various aspects critical to the operation and control of power distribution systems. This includes maintaining the system’s radial structure, which is essential for simplifying design, fault isolation and restoration processes. The objective functions employed in this study are carefully selected to address key performance metrics. These include minimizing active power losses, improving voltage and current balance indices, and enhancing reliability indices. By optimizing these objectives, significant improvements can be achieved in terms of system efficiency, power quality, and service continuity. The subsequent sections delve into the detailed mathematical formulations of the constraints and objective functions. This lays the foundation for the optimization process and the comprehensive analysis of the obtained results in improving the overall performance of the power distribution network.
In power distribution systems, a radial structure refers to a network configuration where each customer or load point is connected to the source (typically a substation) via a unique path without any closed loops. This means that power flows from the source to the loads through a tree-like hierarchy, ensuring simplicity in design and ease of fault isolation. The radial configuration is favored for its cost-effectiveness and straightforward operation and control. To determine whether a given power distribution network satisfies radiality, the rank method is employed. This approach leverages the properties of the network’s incidence matrix derived from graph theory.
Mathematically, the radiality of a power distribution system can be represented and analyzed using graph theory. The power distribution network is represented as a graph G = (V, E), where V denotes the set of nodes (buses), and E denotes the set of edges (branches). To verify the radiality condition, the graph G must satisfy the following conditions [38]:
• The number of edges |E| must be equal to |V| − 1.
• G must be a tree, meaning it should be connected and acyclic (no closed loops).
Given these conditions, the mathematical expression for ensuring radiality can be stated as shown in Eq. (1):
where |E| is the number of edges (distribution lines) in the network, and |V| is the number of vertices (nodes/buses) in the network. To apply the rank method, the incidence matrix B of the graph is constructed. For an undirected graph with m edges and n nodes, the incidence matrix B is a
The incidence matrix B is constructed by placing 1 and −1 in the positions corresponding to the nodes connected by each edge, and zeros elsewhere. The rank of the incidence matrix B is computed to assess the network’s structure. Mathematically, a graph G is considered a tree, and thus radial, if it is both connected and acyclic. This condition can be verified using the rank of the incidence matrix as follows:
where n represents the number of nodes in the network. The rationale behind this condition is that a tree with n nodes must have exactly n−1 edges, which implies that the rank of the incidence matrix, which corresponds to the number of linearly independent rows or columns, should be n−1. This is due to the fact that for a tree, the incidence matrix has one less rank than the number of nodes, indicating no cycles and maintaining connectivity.
To maintain the radial structure during network reconfiguration, optimization algorithms often incorporate constraints that check for the conditions above. The objective is to reconfigure the network (by opening or closing switches) in such a way that the system remains a tree, ensuring that each load point remains connected to the source through a unique path, thereby maintaining radiality. The radial structure simplifies the protection and operation of distribution systems. It allows for straightforward fault detection and isolation, reducing the complexity of protective relays and control schemes. Moreover, it minimizes the number of switching operations needed to restore service in the event of a fault, enhancing the reliability and maintainability of the distribution system. By optimizing the configuration of a power distribution system while maintaining its radial structure, significant improvements can be achieved in terms of power loss reduction, voltage profile enhancement, and load balancing, ultimately leading to a more efficient and reliable power distribution network.
The following constraints, presented in Eqs. (3)–(8), are crucial for the optimization of a 3-phase unbalanced power distribution system [4]. These constraints ensure efficient, safe, and reliable system operation while accounting for the complexities introduced by transformers, voltage regulators, and the inherent unbalanced nature of the network:
• Voltage constraints
where n denotes the set of all nodes (buses) in the power distribution network, and φ represents the phases, which can be A, B, or C. This constraint ensures that for every node i in the set n, and for every phase φ, the voltage
• Current constraints
where
• Power balance constraint
The power balance constraint ensures that the total power generated and supplied equals the total power consumed and the losses in the system.
where
• Transformer constraints
Transformers must operate within their voltage and current limits for each phase to ensure proper operation and avoid damage.
• Voltage regulator constraints
Voltage regulators are used to maintain voltage levels within desired limits, ensuring stable and reliable voltage supply throughout the distribution network.
• Radiality constraint
where
This study focuses on the optimization of power distribution systems through a multi-objective approach, addressing three critical aspects of system performance. The objective functions considered in this research encompass the minimization of active power losses, the improvement of voltage and current unbalance indices, and the enhancement of reliability indices. These objectives are carefully selected to provide a comprehensive assessment of the distribution system’s efficiency, quality, and reliability.
The first objective function aims to minimize active power losses, which directly impacts the system’s overall efficiency and operational costs. The second objective function targets the improvement of voltage and current unbalance indices, crucial for maintaining power quality and reducing stress on system components. The third objective function focuses on enhancing reliability indices, including SAIFI, SAIDI, CAIDI, ASAI, and, AENS, which are vital metrics for evaluating the system’s ability to provide continuous and quality service to consumers.
The following subsections present a detailed formulation and analysis of each objective function, elucidating their significance in the context of power distribution system optimization. This multi-objective approach allows for a holistic evaluation of potential system improvements and trade-offs between different performance criteria.
2.3.1 Power Loss as an Objective Functions
In three-phase unbalanced power distribution systems, active power losses refer to the energy lost due to resistance during the transmission and distribution of electrical energy. These losses occur across transmission lines, transformers, and distribution lines. In three-phase systems, imbalances arise from differences in voltage and current between phases. These imbalances can be caused by different power consumption per phase, unequal distribution of loads, or asymmetries in system components. Imbalanced loads and phase shifts decrease system efficiency and lead to additional losses. Minimizing these losses is crucial for enhancing energy efficiency and reducing operational costs, significantly impacting the overall performance of the distribution system. Active power losses in three-phase unbalanced power distribution systems can be calculated using the following mathematical expression, as shown in Eq. (9).
where
• Power Losses in Distribution Lines:
• Power Losses in Transformers:
Active power losses in transformers can be divided into two main components: core losses (no-load losses) and copper losses (load losses). Core losses occur due to magnetic hysteresis in the transformer core and are independent of the load. Copper losses occur due to resistance in the windings and increase with the load, as shown in Eq. (11).
where
2.3.2 Unbalance Indexes as an Objective Functions
Unbalanced power distribution in electrical distribution networks poses a significant challenge for Distribution Service Operators (DSOs). This imbalance leads to increased power losses, reduced system efficiency, and shortened equipment lifespan. Two important metrics used to evaluate the performance of unbalanced systems are the Voltage Unbalance Index (VUI) and Current Unbalance Index (CUI). A detailed analysis of this topic is available in references [26,39]. According to IEEE Std 1159–2009 [40], the voltage unbalance index is calculated using the following formula:
where
where
The IEEE has not established a definition for the CUI. However, some studies in the literature have proposed a formulation for CUI that is analogous to the VUI [3]. Similarly, the current unbalance index is expressed by the formula given in Eq. (15).
These indices quantitatively determine the degree of imbalance in the network and help DSOs develop strategies to improve system performance.
2.3.3 Reliability Indexes as an Objective Function
In this study, various reliability indices are employed as objective functions to comprehensively evaluate the performance and reliability of the power distribution system. These indices, adapted from IEEE standards [41], are presented in Eqs. (16)–(21) and serve as quantitative measures of system reliability.
• The System Average Interruption Frequency Index (SAIFI) quantifies the mean number of interruptions experienced by a customer over a designated period, typically annually. SAIFI is utilized to assess the frequency of interruptions experienced by each customer.
• Concurrently, the System Average Interruption Duration Index (SAIDI) assesses the average cumulative duration of interruptions per customer within the specified timeframe. SAIDI serves as a metric for determining the total duration of interruptions per customer.
• The Customer Average Interruption Duration Index (CAIDI), derived by dividing SAIDI by SAIFI, provides insight into the mean time required for service restoration following an interruption. CAIDI provides insight into the average duration of interruptions for customers affected by outages.
• The Average Service Availability Index (ASAI) expresses the proportion of time during which customers receive uninterrupted power supply within the defined reporting period. ASAI is employed to evaluate the overall availability time of the system.
• The Average Energy Not Supplied (AENS) index calculates the mean energy deficit per customer served. These metrics collectively facilitate a comprehensive evaluation of the distribution system’s reliability performance. AENS is used to gauge the impact of interruptions on the energy supply per customer.
• Lastly, the ENS (Energy Not Supplied) is the total amount of energy not delivered due to interruptions. ENS is calculated as:
where
2.4 Pareto Front Approach: Mathematical Formulation and Explanation
The Pareto front approach for multi-objective optimization can be mathematically formulated as follows, as shown in Eq. (22).
where:
• x is the decision variable vector
• F(x) is the vector of objective functions
• f₁(x), f₂(x), f3(x) are the individual objective functions
• g(x) and h(x) represent inequality and equality constraints, respectively
• X is the feasible solution space.
In the context of this study:
A solution x* is said to dominate another solution x if:
The Pareto front is the set of all non-dominated solutions. Mathematically, it can be defined as:
To quantify the quality of the Pareto front, several metrics can be used [42], as given in Eqs. (23)–(25).
1. Hypervolume Indicator (HV): HV measures the volume of the objective space dominated by the Pareto front.
where r is a reference point.
2. Generational Distance (GD): GD measures how far the obtained Pareto front is from the true Pareto front.
where dᵢ is the Euclidean distance between each point and the nearest member of the true Pareto front, and n is the number of points in the obtained Pareto front.
3. Spread (Δ): Δ measures the distribution of solutions along the Pareto front.
where
The optimization process aims to find a set of solutions that minimize all objective functions simultaneously while satisfying the constraints. The resulting Pareto front provides a range of optimal trade-offs between the competing objectives, allowing decision-makers to choose the most suitable solution based on their specific requirements and priorities.
3 Bonobo Optimizer (BO) Algorithm
The Bonobo Optimizer (BO) is a metaheuristic search algorithm [33,43] inspired by the social behavior and reproductive strategies of bonobos. Bonobos exhibit a fission-fusion social strategy, where they form temporary subgroups of varying sizes within their community, and later reunite. Additionally, bonobos display four main reproductive strategies: promiscuous, restrictive, consort ship, and extra-group mating. The proposed BO algorithm artificially models these natural behaviors of bonobos to solve real-parameter optimization problems. The primary innovation of BO resides in the updating strategies for the search agents and their parameters, along with the approach used for selecting mating partners. The BO algorithm initializes a population of solutions (called bonobos) and their associated parameters. The algorithm then iteratively updates the bonobos using different mating strategies depending on the current phase of the optimization (positive or negative phase). The fission-fusion social strategy is used to select a bonobo for mating, and the mating process is guided by the four reproductive strategies observed in bonobos. The adaptive nature of the BO algorithm’s parameters, such as the phase probability, extra-group mating probability, and temporary subgroup size factor, allows for a balanced exploration and exploitation of the search space. The BO algorithm mathematically models the social behavior and reproductive strategies observed in bonobos. The fundamental mathematical components of the model are divided into three sections, which are detailed in the following parts.
3.1 Positive Phase (PP) and Negative Phase (NP)
The positive phase count (cpp) and negative phase count (ncp) variables are used to track the current phase of the algorithm. If there is an improvement in the best solution, the phase is considered as PP, and cpp is incremented. Otherwise, the phase is NP, and ncp is incremented.
3.2 Fission-Fusion Social Strategy
The maximum temporary subgroup size (
If (
For the promiscuous and restrictive mating strategies, the creation of a new bonobo is performed using the following equation:
Here,
where
Optimization Algorithm: The BO algorithm is a population-based optimization technique that follows these steps:
I. Initialization: A random initial population of solutions (bonobos) is created, and the associated parameters are initialized.
II. Mate Selection: Using the fission-fusion social strategy, the best-fit bonobo is selected from a temporary subgroup.
III. New Bonobo Generation: The selected bonobo generates a new bonobo offspring using the reproductive strategies corresponding to the current phase (PP or NP).
IV. Acceptance Criterion: The newly generated bonobo is accepted and added to the population if it has a better fitness than the current best bonobo.
V. Parameter Update: Certain parameters (e.g., phase probability, extra-group mating probability, temporary subgroup size) are updated to enhance the algorithm’s performance.
VI. Iteration: Steps II–V are repeated until the termination criteria are met.
This mathematical model and optimization process enable the BO algorithm to effectively simulate the natural behaviors of bonobos and exhibit superior performance in solving optimization problems.
4 IEEE 37-Bus Unbalanced Electrical Power Distribution Network (UPDN)
The 37-bus multi-phase UPDN includes various components such as a voltage regulator, unbalanced spot loads (ZIP load) and multi-phase underground line segments. This system is described in detail in reference [44,45]. The test system’s total active power, reactive power, and nominal voltage are 2457 kW, 1201 kVAr, and 4.80 kV, respectively. In the initial case, the power loss is reported to be 60.563 kW + j46.455 kVAr. The network comprises three-phase underground line segments with delta-connected (Δ) unbalanced loads (Fig. 1). The IEEE 37-node test feeder, based on an actual feeder in California, is characterized by

Figure 1: IEEE-PES 37-bus UPDN test system
• Nominal voltage: Operates at 4.8
• Underground line segments: All segments are buried.
• Substation voltage regulator: Consists of two single-phase units connected in an open delta configuration.
• Load types: All loads are spot loads consisting of constant impedance (Z), current (I) and power (PQ). The spot loads are significantly unbalanced.
The system includes several transformers, each with specific characteristics [44]:
• The substation transformer, located at bus 799, is rated at 2500
• The motor transformer, located at bus 775, is rated at 500
The single-line diagram of the IEEE 37-bus unbalanced power distribution system is shown in Fig. 1. The 37-bus test system initially operates in a radial configuration. To allow reconfiguration process and to create alternative paths, six tie switches (TSs) have been added to the system (added by the author). As illustrated in Fig. 1, shutting all open TSs broadens the search space and heightens the complexity of the system.
In practical power systems, three-wire delta configurations are infrequently employed, necessitating rigorous software validation to ensure compatibility with this feeder type [45]. To address this challenge, the backward/forward sweep load flow algorithm is implemented, a robust and efficient technique particularly well-suited for radial and weakly meshed distribution systems. This iterative method consists of two main steps: a backward sweep, which updates branch currents based on nodal power injections, and a forward sweep, which updates node voltages using the calculated branch currents. The process repeats until convergence is achieved, offering superior performance in terms of computational efficiency and convergence characteristics for distribution networks [46–48]. Figs. 2 and 3 illustrate the comparative results between the MATLAB Script Code (MSc) implementation of the backward/forward sweep algorithm and the IEEE-PES reference data [49], focusing on the relative errors (RE) in bus current and voltage magnitudes.

Figure 2: Current relative error of IEEE-PES and MSc

Figure 3: Voltage relative error of IEEE-PES and MSc
The analysis reveals highly satisfactory agreement, with maximum relative current and voltage errors for each phase calculated as

Figure 4: Voltage profile of 37-bus UPDN
4.2 Comparison of Outcomes across Multiple Platforms
Table 2 compares the maximum and minimum bus voltage magnitudes and power losses of the MATLAB Script Code (MSc) MATLAB/Simulink and IEEE-PES datasets. The results from these three platforms are highly similar. In the 37-bus test system, the maximum voltage of 1.04368 is observed at the Voltage Regulator output between nodes 799 and 701, which is omitted from Table 2 due to its nature as a regulator output rather than a bus voltage. The highest bus voltage of 1.0317 is recorded at bus 701, adjacent to the regulator output.

This study aims to comprehensively evaluate and optimize the performance of an unbalanced 37-bus power distribution system through four distinct scenarios. The primary objective is to investigate different optimization approaches and their impacts on system performance metrics. These metrics include power loss reduction, voltage profile enhancement, current and voltage unbalance mitigation, and reliability improvement. The research employs various optimization strategies, ranging from single-objective to multi-objective approaches using meta-heuristic methods, to achieve these goals. The analysis is structured into four interconnected scenarios, with additional case studies conducted under Scenarios II and III. Each scenario employs different objective functions and metrics to improve and evaluate power distribution system performance:
• In Scenario I, the focus is on enhancing the mean voltage profile and minimizing active power loss. This approach aims to improve overall system efficiency and reduce energy losses.
• In Scenario II, the goal is to minimize the CUI and VUI, which are essential indicators of power distribution system performance. This minimization is achieved by considering various cases.
• Scenario III concentrates on optimizing reliability index values in the 37-bus power distribution system. SAIFI, SAIDI, CAIDI, ASAI and AENS values are optimized using meta-heuristic methods.
• Finally, in Scenario IV, a multi-objective optimization approach is adopted. This scenario aims to simultaneously minimize active power loss, the average CUI, and the SAIDI value. The multi-objective optimization is achieved using the Pareto-Front approach.
Each of these scenarios addresses different aspects of the power distribution system and aims to improve system performance from various perspectives. The obtained results and their detailed analyses are presented in the subsequent sections of this study.
5.1 Scenario I: Active Power Loss Minimization
The primary objectives of this scenario are: (1) to minimize the active power losses in the 37-bus UPDN through network reconfiguration, and (2) to enhance the mean voltage profile of the system. This scenario investigates the impact of strategic integration of six additional TSs on system performance. The analysis specifically aims to evaluate the algorithms’ capabilities in a more complex system configuration while maintaining radial operation and creating alternative paths for power flow optimization. Since IEEE-PES data has not provided any information about switches (TSs and SSs) for 37-bus UPDN, this study assumes the ubiquitous placement of switches across all network branches. The system undergoes a structural modification through the strategic integration of six additional TSs, as detailed in Table 3. This modification serves multiple purposes:

• To facilitate a more comprehensive assessment of the algorithms’ capabilities, the system’s complexity is intentionally augmented,
• The 37-bus is initially in radial operation, and to make the system suitable for reconfiguration process and create alternative paths,
• Minimizing the active power loss,
• Mitigating the number of customers affected in the event of a fault.
The complexity of the PDN has been significantly enhanced through the integration of six additional tie-switches, yielding 111,129 potential radial configurations as computed using the Laplacian methodology. Within this enhanced scenario, the primary objective function is oriented towards the minimization of power dissipation within the 37-bus Unbalanced Power Distribution Network (UPDN). The results obtained from the computational analysis of this optimization process are presented in Table 4. Post-reconfiguration analysis reveals a significant reduction in active power loss, with levels decreasing to 51.82 kW. Concurrently, the minimum voltage magnitude is ascertained to be 0.9868 per unit, localized at bus-740/phase C. When juxtaposed with the initial configuration, this optimized topology demonstrates a noteworthy 14.42% diminution in power loss.

Fig. 5 shows the recreated line topology resulting from the reconfiguration process, with minimum power loss considered as the fitness function.

Figure 5: 37-bus test system network topology after reconfiguration process
The voltage values for the buses and phases following the reconfiguration process are given in Fig. 6. The bus voltage differences before and after the reconfiguration of the power distribution network are presented in Fig. 7. As illustrated in the figure, voltage magnitude improvements are evident at all buses, with the exception of buses numbered 706 (A and C phases), 720 (A and C phases), and 725 (A, B and C phases).

Figure 6: Voltage profile of 37-bus UPDN after reconfiguration

Figure 7: Voltage differences for each bus before and after reconfiguration
5.2 Scenario II: Mitigating Current and Voltage Unbalance Indices
This scenario focuses on comprehensive analysis of system unbalance through three specific objectives: (1) to reduce both CUI and VUI below industry-standard thresholds (30% for CUI and 3% for VUI), (2) to evaluate the effectiveness of network reconfiguration in mitigating unbalance indices, and (3) to analyze the impact of different optimization cases on system balance. To achieve these objectives, the unbalance indices are integrated into the objective function, as defined in Eqs. (12) and (15). The investigation utilizes the same network configuration as Scenario I, incorporating six TSs to ensure reproducibility and maintain computational complexity. Within this framework, three distinct cases of network reconfiguration are systematically analyzed, each targeting different aspects of system imbalance in the 37-bus UPDN:
• The primary case focuses on minimizing the mean values of both the CUI and VUI across the power system.
• The subsequent case aims to reduce the peak values of CUI and VUI.
• The final case specifically targets the minimization of the CUI at the feeder point.
In accordance with industry standards, the VUI is constrained to a maximum of 3%. While no definitive standard exists for the CUI, a recommended upper limit of 30% is generally accepted. For instance, in the original configuration of the 37-bus test system, the maximum CUI value, observed at bus-742, reaches 86.98%, significantly exceeding the advised 30% threshold. The implementation of the reconfiguration approach in this study yields notable improvements. Specifically, the mean CUI value exhibits a substantial reduction from 40.373% in the initial configuration to 26.595% post-reconfiguration, demonstrating the effectiveness of the proposed methodology in mitigating current imbalances.
5.2.1 Comprehensive Analysis and Optimization of Current Unbalance Index (CUI) in 37-Bus Power Distribution Systems
This section presents an in-depth analysis of three distinct cases, each designed to minimize the CUI. The mathematical formulation for CUI calculation is explicitly defined in Eq. (15). It is imperative to note that the computation of the CUI for any given bus necessitates non-zero current values across all three phases (A, B, and C). The index becomes indeterminate if any of these phase currents approach zero. In alignment with established methodologies, this study adopts the IEEE Power and Energy Society (IEEE-PES) approach as a reference framework for CUI calculations. This approach, notably, disregards currents at the milli-ampere (mA) or micro-ampere (
Initial Configuration Analysis for Current Unbalance Index
The initial configuration analysis of the 37-bus test system reveals significant current unbalance characteristics throughout the network. Fig. 8 presents a visualization of the CUI distribution across the 37-bus power distribution network in its initial configuration. As demonstrated in Fig. 8, the system exhibits varying degrees of current unbalance across different buses, with several nodes showing concerning levels of imbalance. The comprehensive analysis indicates that 14 buses in the system exceed the Current Unbalance Index (CUI) threshold of 30%, suggesting substantial unbalance issues in the network’s current distribution.
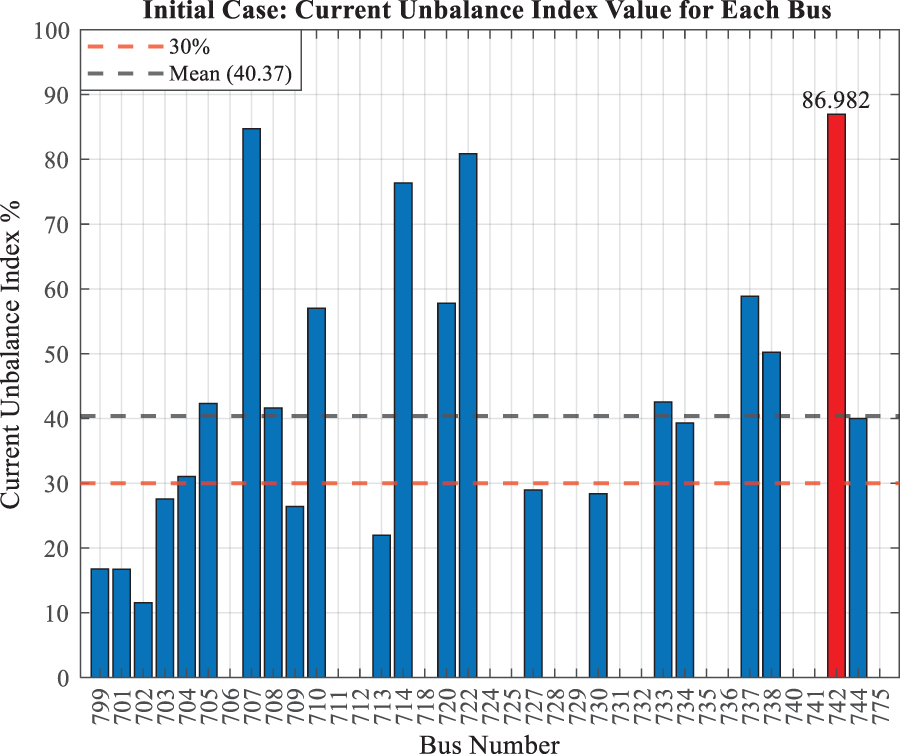
Figure 8: CUI results for the initial case
The severity of the current unbalance is particularly evident at bus 742, where the maximum CUI value reaches 86.982% (Table 5). This extreme value indicates a significant deviation from balanced current conditions at this location. The system-wide impact of current unbalance is further reflected in the average CUI value of 40.373%, demonstrating that the unbalance issue is not isolated but rather a systemic concern. Critical buses exhibiting severe unbalance include bus 707 with 84.742%, bus 714 with 76.341%, and bus 722 with 80.882%, among others. The system’s voltage profile maintains a range between 0.98466 at Phase C of Bus 740 and 1.03167 at Phase A of Bus 701, indicating moderate voltage variation despite significant current unbalance.

Impact of Active Power Loss Minimization on Current Unbalance Index
When the system configuration is optimized for minimum power loss, notable changes in current unbalance characteristics are observed throughout the network. Fig. 9 illustrates the distribution of Current Unbalance Index (CUI) values across the 37-bus power distribution network following network reconfiguration with power loss minimization as the objective function. As illustrated in Fig. 9, the optimization process leads to a redistribution of current unbalance across the system, resulting in some interesting modifications to the CUI profile.
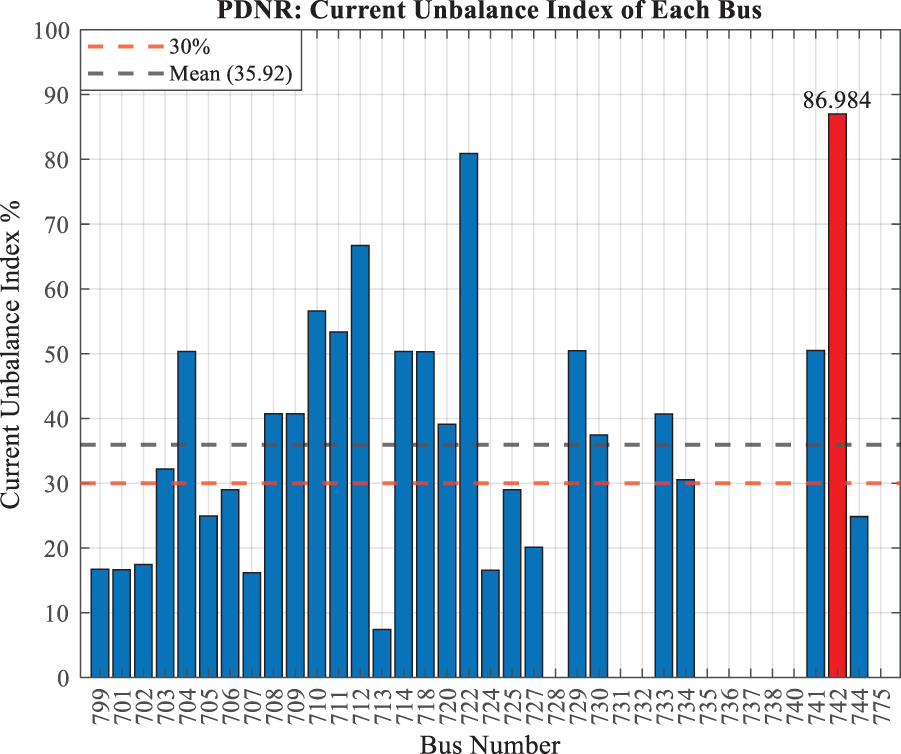
Figure 9: CUI results when the minimum power loss is considered as a fitness function
The most significant finding is the increase in the number of buses exceeding the 30% CUI threshold, rising from 14 in the initial case to 17 under power loss minimization. Despite this increase in the number of affected buses, the optimization achieves a reduction in the average CUI value to 35.924%. However, the maximum CUI value remains virtually unchanged, showing a marginal increase to 86.984% at bus 742. The analysis reveals that buses 712 (66.686%), 722 (80.906%), and 742 (86.984%) demonstrate particularly high unbalance levels under this configuration. The voltage profile shows a slight improvement, with the minimum voltage increasing to 0.98679 at Phase C of Bus 740. This comparative analysis between the initial and optimized configurations reveals an interesting trade-off: while power loss minimization succeeds in reducing the average current unbalance across the system, it simultaneously increases the number of buses experiencing significant unbalance. This observation suggests that optimization strategies focused solely on power loss reduction may not necessarily lead to comprehensive improvements in current balance conditions. The findings emphasize the need for multi-objective optimization approaches that can address both power loss and current unbalance concerns simultaneously.
Case-1: Mean Current Index Minimization
In this part of the study, the objective function is configured to minimize the mean CUI value, taking into account the current flow across all branches of the PDN. Post-reconfiguration analysis yields the following results: The network’s radiality is maintained through the strategic opening of switches between buses 702–713, 703–727, 709–731, 701–724, 732–737, and 729–732. This reconfiguration results in a significant reduction of the mean CUI from its initial value of 40.373% to 26.595%. Concurrently, the minimum bus voltage magnitude is observed at Bus 731/phase C, registering 0.934 p.u., which falls within the predefined voltage limit parameters. However, it is noteworthy that the active power loss exhibits an inverse trend, escalating from an initial 60.555 to 109.068 kW post-reconfiguration. This outcome underscores a salient conflict between the optimization of mean CUI and active power loss, a trade-off that warrants careful consideration by decision-makers in the context of Power Distribution Network (PDN) operational requirements. Further analysis reveals that in the initial configuration, 14 buses exceeded the 30% CUI threshold. Comparatively, across the five cases in Table 5 examined in Scenario II, the mean case demonstrates the most favorable outcome, with only 8 buses surpassing this limit. The remaining buses maintain CUI values below the 30% benchmark. Comprehensive visualization of these results is presented in Figs. 10 and 11, where Fig. 10 illustrates the post-reconfiguration voltage profile distribution, and Fig. 11 demonstrates the resulting CUI values and their distribution across the network. Detailed quantitative results for this case are documented in the case-1 column of Table 5, providing quantitative validation of the optimization outcomes.

Figure 10: Voltage profile after reconfiguration in the case of mean CUI as an objective function

Figure 11: CUI results when the mean CUI is considered as a fitness function
Case-2: Maximum Current Unbalance Index Minimization
The primary objective of this analysis is to minimize the maximum value of the CUI within the UPDN. During the reconfiguration, switches between buses 702–705, 704–720, 708–733, 730–709, 744–729, and 732–737 are opened, ensuring the preservation of the network’s radial topology. Initially, the maximum CUI is observed to be 86.981 at bus 742, which subsequently reduces to 86.952 at bus 705 after reconfiguration. The lowest bus voltage magnitude is recorded as 0.9513 at bus 735 on phase C. Notably, the active power loss increases from 60.555 kW to 88.412 kW. Thirteen buses exceed the 30% CUI threshold, with values ranging from 33.785% to 86.953%. The average CUI across the network decreases from 40.373 to 30.780. Conversely, the CUI at the feeder bus (bus 799) shows a slight increase from 16.759 to 16.974. These outcomes are detailed in the Case-2 column of Table 5. Fig. 12 demonstrates voltage profile after reconfiguration when minimizing the maximum CUI as the objective function, while Fig. 13 shows the corresponding CUI results for this optimization criterion.

Figure 12: Voltage profile after reconfiguration in the case of minimization of the maximum CUI as an objective function

Figure 13: CUI results when the minimization of the maximum CUI is considered as a fitness function
Case-3: Feeder Point Current Unbalance Index Minimization
In the context of this case study, the objective function has been meticulously formulated with the explicit purpose of minimizing the CUI at the feeder bus. The post-reconfiguration analysis yields the following results: Network radiality is maintained through the strategic opening of switches between buses 702–703, 704–720, 708–732, 709–731, 738–711, and 744–729. This reconfiguration strategy successfully reduces the CUI at the feeder bus from an initial value of 16.759% to 16.309%, achieving the primary objective of this case study. However, this optimization comes at a significant cost to other network parameters:
• Active Power Loss: A substantial increase is observed, with losses escalating to 126.751 kW, which represents more than a twofold increase from the initial power loss. This dramatic rise in power dissipation highlights a critical trade-off in the optimization process.
• Maximum CUI: Contrary to the reduction at the feeder bus, the highest CUI value in the network experiences an increase. Initially observed at 86.981% at bus-742, it rises to 87.031% post-reconfiguration, albeit at a different network location.
These results underscore the complex interrelationships within power distribution networks and the challenges inherent in optimizing a single parameter without adversely affecting others. The marginal improvement in feeder bus CUI is achieved at the expense of overall network efficiency and balance. This case study exemplifies the need for a holistic approach to network optimization, where improvements in localized parameters must be weighed against their system-wide implications. It also emphasizes the importance of multi-objective optimization strategies in power distribution network reconfiguration to achieve a more balanced improvement across various performance metrics. Fig. 14 demonstrates voltage profile after reconfiguration in the case of minimization of CUI at feeder bus as an objective function and Fig. 15 shows CUI results when the minimization of CUI at feeder bus is considered as a fitness function.

Figure 14: Voltage profile after reconfiguration in the case of minimization of CUI at feeder bus as an objective function

Figure 15: CUI results when the minimization of CUI at feeder bus is considered as a fitness function
Further analysis of the reconfiguration outcomes reveals additional insights into the network’s performance: The mean CUI across the network exhibits a decrease from 40.373% to 39.648%. This minimal reduction in average imbalance suggests that the localized improvement at the feeder bus does not significantly propagate throughout the entire system. Voltage profile analysis indicates that the minimum bus voltage magnitude is observed at bus-728/phase C, registering 0.918 p.u. This value, while within typical operational limits, may warrant attention in future optimization efforts to ensure robust voltage stability across the network. A comprehensive examination of CUI distribution reveals that 20 buses exceed the 30% CUI threshold, with values spanning from 31.267% to 87.031%. This represents a substantial increase in the number of buses experiencing significant current imbalance compared to previous cases. The remaining buses maintain CUI values below the 30% benchmark, indicating a polarized distribution of current imbalances across the network. For comparative purposes, the CUI values obtained when TSs are open and active power loss is considered as the objective function are presented in the fourth column from the end in Table 5. This provides a baseline for assessing the trade-offs between different optimization strategies. These results are meticulously documented in the case-3 column of Table 5, facilitating a comprehensive comparison with other optimization scenarios. This comprehensive analysis underscores the complex interplay between localized improvements and system-wide performance in power distribution networks. It highlights the necessity for multi-objective optimization approaches that can balance conflicting parameters such as feeder bus CUI, mean network CUI, voltage profiles, and active power losses. Such holistic strategies are crucial for achieving optimal network configurations that satisfy diverse operational requirements and constraints.
Summary and Discussion for CUI Optimization Results
The summary based on the obtained CUI results are listed as follows:
• In a reconfiguration study where the fitness function is to reduce active power losses, after optimization process the buses that exceed the 30% CUI limit have increase from 14 to 17 buses. This result indicates an increase in current imbalance in some buses.
• The literature review reveals that reconfiguration studies are predominantly conducted on balanced test systems. However, if the system is considered balanced, the changes and effects of some parameters cannot be examined. As shown in this study, working on unbalanced test systems is quite important to see the effects of parameters such as VUI and CUI on the system.
• In the case of the average of CUI in PDN is considered as an objective function, the lowest number of busbar (8 buses in total) is obtained which exceed the 30% CUI limit.
• In all 3 cases, the active power loss values increase after the optimization process for the reduction of CUI. Thus, it shows that both CUI and active power losses cannot be reduced at the same time and there is a conflict between them. This indicates that further research is needed to find a solution that addresses both issues.
5.2.2 Comprehensive Analysis and Optimization of Voltage Unbalance Index (VUI) in 37-Bus Power Distribution Systems
This subsection presents an in-depth analysis of two distinct cases, focusing on the minimization of the Voltage Unbalance Index (VUI). The mathematical formulation for VUI calculation is explicitly defined in Eq. (12). Voltage unbalance in power distribution networks is evaluated through different standards and calculation methods. Three primary standards have established distinct approaches for quantifying voltage unbalance. The American National Standards Institute (ANSI C84.1-1995) specifies a maximum voltage unbalance threshold of 3% under no-load conditions. The International Electrotechnical Commission (IEC) mandates a more stringent limit of 2%, while NEMA MG1-1993 recommends derating induction motors when voltage unbalance exceeds 1%. Additionally, IEEE standards (Std. 141-1993 and Std. 241-1990) suggest that electronic equipment may experience operational issues with voltage unbalance exceeding 2%–2.5% [39,50]. The calculation methodologies also differ among these standards. NEMA defines voltage unbalance using line-to-line voltage measurements, expressed as the ratio of maximum deviation from average to the average of three-line voltages. IEEE employs a similar formula but utilizes phase voltages instead. The IEC standard adopts a distinct approach based on symmetrical components, defining voltage unbalance as the ratio of negative sequence component to positive sequence component of voltage, expressed as a percentage. It is noteworthy that while NEMA and IEEE formulations appear similar, their use of different voltage measurements (line vs. phase voltages) can yield varying results, particularly considering that line voltages exclude zero-sequence components while phase voltages include them. This distinction becomes especially relevant for three-phase loads without neutral connections, such as asynchronous motors, where zero-sequence components have minimal impact on performance [50]. These divergent standards underscore the importance of voltage balance in power systems and provide critical benchmarks for assessing the efficacy of the proposed reconfiguration strategies. The implementation of these standards in our analysis serves dual purposes:
• It provides a framework for evaluating the performance of the reconfigured network against established industry norms.
• It highlights the potential challenges in meeting different regulatory requirements simultaneously, which is a crucial consideration in practical power system operations.
Initial Configuration Analysis for Voltage Unbalance Index
The initial configuration analysis provides a comprehensive assessment of the Voltage Unbalance Index (VUI) in the 37-bus distribution system under its default operational settings. In this scenario, tie-switches are configured at positions 701–724, 718–731, 725–741, 732–737, 729–732, and 712–729. The analysis revealed significant variability in VUI values across different buses, highlighting critical voltage imbalance issues. As shown in Table 6, the mean VUI value in the initial configuration is recorded as 0.9383, with a maximum value of 1.3755 observed at Bus 724. Furthermore, a total of 14 buses exceeded the VUI threshold of 1%, indicating widespread voltage imbalance across the network. The minimum voltage magnitude is observed as 0.9847 at Phase C of Bus 740, while the maximum voltage remained consistent at 1.0317 at Phase A of Bus 701. Fig. 16 presents a visualization of the VUI distribution across the 37-bus power distribution network in its initial configuration. The results underscore the presence of significant voltage imbalance at critical locations, particularly at buses with the highest VUI values. This analysis establishes a baseline for further optimization efforts, offering insights into areas of improvement to enhance voltage stability and reduce power losses.


Figure 16: VUI results for initial case
Impact of Active Power Loss Minimization on Voltage Unbalance Index
This section examines the effects of active power loss minimization on the Voltage Unbalance Index (VUI) through a reconfiguration of the distribution network. In this optimized configuration, tie-switches are reconfigured to positions 704–720, 708–732, 709–731, 737–738, 744–729, and 732–737. The optimization achieves a significant reduction in active power loss, as shown in Table 6, decreasing it from 60.5553 kW to 51.8204 kW. The voltage profile shows a marginal improvement, with the minimum voltage magnitude increasing from 0.9847 to 0.9868 at Phase C of Bus 740, while the maximum voltage remains constant at 1.0317 at Phase A of Bus 701. The mean VUI value decreases from 0.9383 to 0.9246, and the maximum VUI value drops from 1.3755 (at Bus 724) to 1.2017 (at Bus 720). However, as shown in Table 6, the number of buses exceeding the 1% VUI threshold increases from 14 to 16, reflecting a complex trade-off between power loss reduction and voltage balance. Fig. 17 illustrates the post-reconfiguration VUI distribution when active power loss minimization is employed as the objective function. The results indicate an overall improvement in voltage balance, as evidenced by the reduction in mean and maximum VUI values. Nonetheless, the increase in the number of buses surpassing the VUI threshold highlights the challenge of achieving uniform voltage balance while minimizing power losses. This analysis underscores the multifaceted nature of system optimization, where improvements in one metric may have unintended consequences for another.

Figure 17: VUI results when the minimum Power Loss is considered as a fitness function
The examination of two cases (Case-1 and Case-2) within this context aims to elucidate the effectiveness of various reconfiguration approaches in minimizing voltage unbalance. This analysis also takes into account the practical implications of adhering to these industry standards.
Case-1: Mean Voltage Index Minimization
In the present investigation, the objective function has been meticulously formulated to minimize the mean VUI, with comprehensive consideration given to voltage magnitudes across the entirety of the branches within the test system’s topology. Post-reconfiguration results indicate that switches 708–732, 713–704, 727–744, 730–709, 737–738, and 732–737 are opened, maintaining network radiality. The mean VUI value decreased from an initial 0.9383 to 0.6973. After the reconfiguration, the number of buses exceeding the 1% VUI threshold is 10, namely buses 701, 702, 703, 705, 712, 713, 724, 727, 730, and 742. Among them, Bus 730 recorded the highest VUI value, calculated at 1.054558%. Conversely, active power loss increased to 87.3425 kW. The minimum magnitude of the bus voltage is determined to be 0.961 at bus-735, phase C. These findings are presented in the case-1 column of Table 6. Figs. 18 and 19 illustrate the comprehensive results of network reconfiguration with mean VUI minimization as the objective function. Specifically, Fig. 18 depicts the voltage profile following reconfiguration, while Fig. 19 presents the corresponding VUI values obtained under optimization criterion.

Figure 18: Voltage profile after reconfiguration in the case of mean VUI as an objective function

Figure 19: VUI results when the mean VUI considered as a fitness function
Case-2: Maximum Voltage Unbalance Index Minimization
In this particular scenario, the objective function has been strategically formulated to minimize the apex value of the VUI within the confines of the test system. Post-reconfiguration analysis reveals the following outcomes: Switches 708–733, 713–704, 727–744, 701–724, 718–731, and 729–732 are opened. The maximum VUI value decreased from an initial 1.3755 at bus-724 to 1.0256 at bus-701. Conversely, active power loss increased to 117.28060 kW. The minimum bus voltage magnitude is determined to be 0.9299 per unit, occurring at bus-724/phase C. Eleven buses (701, 702, 703, 705, 713, 722, 724, 727, 730, 731, and 742) exceeded the 1% VUI threshold, while the remaining buses maintained VUI values below 1%. The mean VUI value reduced from 0.9383 to 0.9103. Notably, the VUI at the feeder bus (bus-799) remained constant throughout the reconfiguration process. Table 6, case-2 column, presents the post-reconfiguration VUI results. Fig. 20 demonstrates the voltage profile obtained after network reconfiguration, where the minimization of the maximum VUI is adopted as the objective function. Similarly, Fig. 21 presents the corresponding VUI results when this minimization criterion is employed as the fitness function in the optimization process.

Figure 20: Voltage profile after reconfiguration in the case of minimization of highest VUI as an objective function

Figure 21: VUI results when the minimization of highest VUI value considered as a fitness function
Summary and Discussion for VUI Optimization Results
The Voltage Unbalance Index (VUI) optimization results reveal several important insights into the reconfiguration of the unbalanced power distribution network. Initially, 14 buses exceeded the 1% VUI limit set by NEMA standards. After reconfiguration aimed at minimizing the mean VUI (Case-1), this number decreased to 10 buses, indicating a significant improvement in voltage balance across the network.
• In the initial scenario (Case-1), where the objective function is formulated to minimize the mean VUI, a significant amelioration in voltage equilibrium is observed. The average VUI undergoes a substantial reduction, diminishing from an initial value of 0.9383 to a markedly improved 0.6973, thus indicating a notable enhancement in overall system voltage balance. This substantial reduction demonstrates the effectiveness of the reconfiguration approach in addressing voltage imbalances. However, it is noteworthy that this improvement came at the cost of increased active power loss, which rose from 60.55 to 87.34 kW. This trade-off highlights the complex relationship between voltage balance and power efficiency in distribution networks.
• Case-2, which focused on minimizing the maximum VUI value, yielded different results. The highest VUI value is reduced from 1.3755 at bus-724 to 1.0256 at bus-701. While this alteration signifies a notable enhancement in voltage equilibrium, the system nonetheless exhibits persistent areas of concern. Post-reconfiguration analysis reveals that 11 buses continue to surpass the stipulated 1% VUI threshold, indicating residual voltage asymmetry within the network topology despite the overall amelioration. Notably, the active power loss in this case increased significantly to 117.28 kW, further emphasizing the conflict between VUI minimization and power loss reduction.
• Comparing the voltage profiles and VUI distributions before and after reconfiguration (as shown in Figs. 16–21) reveals the spatial impact of the optimization process. The reconfiguration altered the voltage balance across different buses, generally improving the overall network balance but with localized variations. It is important to note that in both optimization cases, the VUI at the feeder bus (bus-799) remained unchanged. This suggests that the reconfiguration process primarily affects the downstream network, with limited impact on the main feeder point.
These results underscore the complexity of optimizing unbalanced distribution networks. While VUI can be significantly improved through reconfiguration, this often comes at the expense of increased power losses. Future research could explore multi-objective optimization techniques to find a better balance between voltage unbalance mitigation and power loss minimization. Additionally, the impact of VUI optimization on other network parameters, such as reliability and power quality, warrants further investigation.
5.3 Scenario III: Reliability Enhancement in Power Distribution Systems
Reliability is a critical factor in electrical distribution systems, playing a pivotal role in customer satisfaction and overall system performance. It represents the system’s ability to provide uninterrupted, high-quality power supply and is quantified through various indices. Building on this foundation, this scenario focuses on the optimization of reliability indices in a 37-bus unbalanced power distribution network with three primary objectives: (1) to optimize five crucial reliability indices (AENS, ASAI, CAIDI, SAIDI, and SAIFI) using meta-heuristic methods, (2) to implement and validate the Intelligent Matrix (IM) method for rapid reliability assessment, and (3) to evaluate the effectiveness of network reconfiguration in improving system reliability.
The reliability analysis employs an innovative approach based on the Intelligent Matrix (IM) [51] method, which utilizes a matrix representation of the system topology. This method incorporates the failure rates and repair times of various components such as busbars, cables, switches, and fuses. The IM approach facilitates expeditious computation of reliability indices, demonstrating particular efficacy in intricate network topologies characterized by multiple power sources. This methodology’s robustness in handling complex configurations underscores its utility in comprehensive system reliability assessments, enabling rapid evaluation of diverse network architectures without compromising analytical rigor. The study addresses five fundamental reliability indices:
• AENS (Average Energy Not Supplied)
• ASAI (Average Service Availability Index)
• CAIDI (Customer Average Interruption Duration Index)
• SAIDI (System Average Interruption Duration Index)
• SAIFI (System Average Interruption Frequency Index)
These indices have been calculated separately for each phase (A, B, and C) of the system, providing a more nuanced understanding of the unbalanced network’s performance. The calculations are performed using two distinct approaches:
• Line Oriented Reliability Index (LORI) Calculation Results: This approach evaluates the impact of network lines on reliability, considering the topology and characteristics of the distribution lines.
• Customer Oriented Reliability Index (CORI) Calculation Results: This approach considers reliability indices from the customer’s perspective, focusing on the end-user experience of power supply reliability.
The IM method allows for the calculation of failure rates (λ) and unavailability (U) for each bus and load point in the system. These values are then used to compute the reliability indices. The method’s flexibility enables easy recalculation of indices when network topology changes, such as in reconfiguration scenarios. The optimization of these reliability indices has been conducted using meta-heuristic methods. The optimization process aims to improve the index values, thereby enhancing the overall system reliability. The results obtained underscore the significance of reliability optimization in unbalanced power distribution networks and provide valuable insights for future studies.
This section will delve into the detailed methodology of the IM approach, present the results obtained, and discuss their implications on system performance. The analysis will provide a comprehensive understanding of how reliability optimization can be achieved in unbalanced distribution systems, considering both line-oriented and customer-oriented perspectives. Furthermore, this study’s approach of calculating reliability indices for each phase separately offers a nuanced view of system performance, allowing for targeted improvements in specific areas of the network. This granular analysis is particularly valuable in unbalanced systems, where phase-specific issues may significantly impact overall reliability. The subsequent subsections will elaborate on the optimization techniques used, present detailed results, and provide a critical analysis of the findings. This comprehensive examination will contribute to the broader understanding of reliability optimization in unbalanced power distribution networks and its potential applications in real-world scenarios.
5.3.1 Mathematical Approaches of Reliability Indices in Power Distribution Network
This study uses an innovative approach for calculating reliability indices in power distribution networks using an Intelligent Matrix (IM) method [2,51]. To elucidate the proposed methodology, a 5-bus radial power distribution network is presented in Fig. 22.

Figure 22: 5-Bus radial power distribution network scheme [21]
The IM method employs a matrix representation of the system topology, incorporating failure rates
The failure rate matrix
These matrices are then used to calculate bus-specific λ and U values, which form the basis for computing system-wide reliability indices such as AENS, ASAI, CAIDI, SAIFI, and SAIDI. The method’s flexibility allows for easy re-calculation when network topology changes, as demonstrated in the case of network reconfiguration. This approach enables a more nuanced analysis of reliability in unbalanced systems, as it can be applied to each phase separately, providing a comprehensive view of system performance and facilitating targeted improvements in specific areas of the network. To account for the exclusion of the slack-bus failure rate
The
5.3.2 Reliability Indices Calculation Data in Power Distribution Network
The reliability of a power distribution network is a critical measure of its performance, directly impacting both operational efficiency and customer satisfaction. Accurate calculation of reliability indices requires comprehensive data on the failure rates and repair times of various network components. In this study, the reliability indices for the 37-bus power distribution network are calculated using detailed failure rates and repair times for key components, as outlined in Tables 7 and 8. The failure rates (λ) and repair times (r) for components such as fuses, switches, busbars, circuit breakers, slack buses, distribution lines, and loads form the foundation for reliability analysis. For example, fuses have a failure rate of 0.250 failures per year and a repair time of 3 h, while switches have a failure rate of 0.150 failures per year and a repair time of 40 h. These values are critical as they provide the basis for determining the reliability of each component and, consequently, the entire network. Table 7 presents a comprehensive list of these values, which are essential for the reliability calculations:


The failure rates of distribution lines vary depending on their length, exposure to environmental conditions, and other factors. These rates range from 0.01 to 0.40 failures per year, with a repair time typically around 5 h. The detailed failure rates for each distribution line segment are provided in Table 8, which helps in identifying the most vulnerable parts of the network and planning maintenance and reliability improvement strategies. To calculate reliability indices such as SAIFI, SAIDI, and so on, the number of customers connected to each bus is crucial.
This data is used to determine the impact of outages on the end-users. Fig. 23 illustrates the distribution of customers connected to each bus for phases A, B, and C, providing a visual representation of customer load distribution across the network. This information is crucial for understanding the potential impact of outages on different parts of the network and is essential for calculating customer-oriented reliability indices. The load failure rate is another critical factor in reliability analysis. It represents the likelihood of a load experiencing a failure within a given time frame. Fig. 24 illustrates the load failure rates for different buses, providing critical insights into the network’s vulnerability to failures and identifying which parts are more prone to outages. This information is essential for prioritizing maintenance and implementing reliability improvement efforts, ensuring a more robust and resilient power distribution system.

Figure 23: Number of customers for each bus

Figure 24: Load failure rate for each bus
The calculation of reliability indices is performed using the Intelligent Matrix (IM) method. This method leverages the failure rates, repair times, and customer data to provide a precise assessment of the network’s reliability. By analyzing this data, the IM method can identify the most critical components that contribute to system unreliability and recommend targeted improvements.
5.3.3 Line Oriented Reliability Index (LORI) Optimization Results for Each Phase
This section presents the optimization results of a 37-bus distribution system using the Line Oriented Reliability Index (LORI) [2] method. The analysis is conducted separately for each phase (A, B, and C) to account for potential phase imbalances and their impacts on system reliability. Tables 9–11 illustrate the LORI calculation results for phases A, B, and C, respectively. These tables provide crucial information about tie-switch configurations, minimum voltage levels, power losses, and various reliability indices such as SAIFI, SAIDI, CAIDI, AENS, and ASAI. As shown in Table 9, the optimal tie-switch configuration for Phase A includes switches 708–732, 709–731, 734–737, 738–711, 744–729, and 701–724. Table 10 reveals a different configuration for Phase B, while Table 11 presents yet another distinct arrangement for Phase C. This variation in optimal tie-switch configurations across phases indicates that phase-specific optimization can lead to different network topologies.


The minimum voltage levels, as reported in Tables 9–11, remain above 0.96 p.u. for all phases, ensuring acceptable voltage profiles throughout the system. Specifically, Table 9 shows a minimum voltage of 0.97549 p.u. for Phase A, Table 10 reports 0.96962 p.u. for Phase B, and Table 11 indicates 0.97163 p.u. for Phase C.
Power losses exhibit significant variations among phases. As evident from Table 10, Phase B demonstrates the highest losses (72.2751 kW) compared to Phase A (66.7283 kW, Table 9) and Phase C (61.57339 kW, Table 11). This disparity highlights the importance of phase-balancing in distribution systems. Reliability indices also demonstrate phase-dependent improvements. For instance, SAIDI values for Phases A, B, and C are 35.7825, 28.9355, and 30.2262 hours/customer/year, respectively, as shown in Tables 9–11. These results suggest that Phase B experiences the lowest average outage duration, while Phase A has the highest.
The LORI method’s effectiveness is evident in the improved ASAI values across all phases. Tables 9–11 indicate that each phase achieves an availability of over 0.995, demonstrating high system reliability. Specifically, Phase A achieves an ASAI of 0.995915 (Table 9), Phase B reaches 0.996697 (Table 10), and Phase C attains 0.996550 (Table 11).
5.3.4 Customer Oriented Reliability Index (CORI) Optimization Results for Each Phase
The Customer Oriented Reliability Index (CORI) calculation [52] results, presented in Tables 12–14 for Phases A, B, and C, respectively, offer a complementary perspective to the LORI analysis by focusing on customer-centric reliability metrics. Similar to the LORI results, the CORI analysis reveals phase-specific optimal tie-switch configurations, emphasizing the importance of considering phase imbalances in distribution system optimization. As shown in Table 12, the optimal configuration for Phase A under CORI includes switches 708–732, 709–731, 734–737, 738–711, 744–729, and 701–724, which is identical to the LORI result for Phase A. However, Tables 13 and 14 reveal different configurations for Phases B and C, respectively. The CORI method yields slightly different reliability index values compared to LORI, reflecting its customer-focused approach. For example, SAIFI values for Phases A, B, and C are 19.66409, 19.70010, and 19.74711 failures/customer/year, respectively, as reported in Tables 12–14.


These values show a more consistent pattern across phases than in the LORI results. SAIDI values in the CORI analysis follow a similar trend to the LORI results, with Phase B showing the lowest average outage duration. Table 12 reports a SAIDI of 36.7064 hours/customer/year for Phase A, Table 13 shows 29.7900 for Phase B, and Table 14 indicates 31.1383 for Phase C. The CORI method also demonstrates improvements in ASAI, with all phases achieving values above 0.995, consistent with the LORI results and indicating high system reliability from a customer perspective.
Specifically, Tables 12–14 report ASAI values of 0.995810, 0.996599, and 0.996445 for Phases A, B, and C, respectively. An interesting observation is the variation in power losses between LORI and CORI methods, particularly for Phase B. Table 13 shows that CORI yields higher losses (74.2651 kW) for Phase B compared to the LORI result (72.2751 kW) in Table 10. This difference underscores the trade-offs between line-oriented and customer-oriented optimization approaches.
An examination of the tables between Table 9 and Table 14 reveals that the SAIFI value remains unchanged even after optimization. This outcome is primarily due to the fact that the failure rate used in SAIFI calculations is directly proportional to the length of the line. Shorter branches exhibit lower failure rates, while longer branches are associated with higher failure rates. Given that the six new tie switches added to the distribution network are longer than the longest branches in the 37-bus system, this result is anticipated.
In conclusion, the phase-specific LORI and CORI analyses provide valuable insights into the complex interplay between network topology, power losses, and reliability indices in the 37-bus distribution system. The results presented in Tables 9 and Table 14 highlight the importance of considering both line-oriented and customer-oriented perspectives in distribution system optimization, as well as the potential benefits of phase-specific optimization strategies. Future research could explore the integration of these approaches to develop more comprehensive optimization methodologies for distribution systems.
5.4 Scenario IV: Pareto-Front Optimization for Power Distribution: A Multi-Objective Approach
This scenario implements a multi-objective optimization framework using the Pareto-Front approach to simultaneously optimize three critical performance indices in power distribution systems: Active Power Loss
• Minimization of active power loss
• Reduction of mean current unbalance index
• Improvement of SAIDI
The Pareto front approach provides decision-makers with a comprehensive view of the solution space, enabling them to select the most appropriate configuration based on specific system requirements and priorities. The Pareto front approach acknowledges the inherent complexity of power systems, where enhancements in one aspect may come at the expense of another, and offers a robust framework for identifying the optimal operating points that achieve the best compromise among the multiple, often conflicting, objectives. The optimization algorithm iteratively generates and evaluates potential solutions, progressively constructing the Pareto front.
Each point on the Pareto front represents a unique system configuration with its corresponding values for active power loss, mean current unbalance index, and SAIDI. This approach allows for a nuanced understanding of the system’s behavior and the identification of optimal operating points that balance efficiency, power quality, and reliability. The 3D Pareto front graph obtained in this study provides a visual representation of the relationship between these three performance parameters and the optimal solution set, as shown in Fig. 25. This graphical illustration depicts the balance between the system’s efficiency, power quality, and reliability, enabling decision-makers to select the most appropriate configuration based on the specific requirements and priorities of the power distribution network. This holistic perspective provided by the Pareto front visualization allows for a deeper understanding of the system’s behavior and facilitates the decision-making process for distribution system operators.

Figure 25: Pareto front result
5.5 Analysis of Meta-Heuristic Algorithms for Distribution Network Reconfiguration
This study evaluates the performance of five meta-heuristic algorithms in solving the distribution network reconfiguration problem, focusing on minimizing power loss. The algorithms under consideration are bonobo optimizer (BO) [33], mountain gazelle optimizer (MGO) [34], hippopotamus optimization algorithm (HO) [35], weighted mean optimizer (INFO) [36], and Runge-Kutta optimizer (RUN) [37]. Table 15 provides a comprehensive overview of the algorithms’ performance. The global optimum for this problem is established at 51.82044 kW. Notably, BO, MGO, INFO, and RUN all achieve this optimum in their best-case scenarios, demonstrating their capability to find the optimal solution. However, BO outperforms the others in terms of consistency, reaching the global optimum in 15% of the runs, followed by INFO at 11%. This observation indicates that BO achieves a more efficacious equilibrium between exploration and exploitation within the solution space. The worst-case scenarios are also crucial in assessing algorithm robustness. BO and INFO show the least deviation from the optimum in their worst cases (57.7455 and 56.7846 kW, respectively), indicating better worst-case performance compared to the other algorithms.

Table 16 offers insight into the convergence behavior of the algorithms. Although this information is supplementary, it uncovers notable patterns that warrant attention. BO, RUN and MGO consistently use the maximum allowed iterations (200) to find their best solutions, suggesting they might benefit from extended run times. In contrast, HO and INFO show more variable iteration counts, with minimums of 1 and 2 respectively, indicating they sometimes converge very quickly but may also get stuck in local optima.

The statistical indicators in Table 17 provide a deeper understanding of algorithm consistency and accuracy. This table provides a comprehensive statistical analysis of the algorithms, including mean absolute error (MAE), mean squared error (MSE), median, mode, relative error percentage (RE %), standard deviation (STD), standard error, and variance. BO demonstrates the best overall statistical performance with the lowest standard deviation (1.2193), standard error (0.1219), and percentage relative error (2.5980%). This is followed closely by INFO, which shows similar, though slightly inferior, statistics. These results suggest that BO and INFO are the most consistent and accurate among the tested algorithms.

The mean absolute error and mean squared error further corroborate this finding, with BO and INFO showing significantly lower error rates compared to the other algorithms. This indicates their solutions are, on average, closer to the global optimum. Table 18 elucidates the computational efficiency of the algorithms. Notably, although the BO algorithm demonstrates superior performance in terms of solution quality and consistency, it does not exhibit the highest computational speed. MGO demonstrates the lowest average runtime (30.84 s), followed by INFO (42.33 s). BO has the highest average runtime (105.48 s), which might be a consideration in time-sensitive applications. However, it’s important to note that BO’s longer runtime is offset by its superior solution quality and consistency. In many optimization scenarios, especially in power systems where the cost implications of suboptimal solutions can be significant, the additional computational time may be justified by the improved results.

Fig. 26 depicts the computational efficiency comparison of the five meta-heuristic algorithms investigated in the distribution network reconfiguration problem. The graph shows the elapsed time in seconds required for each algorithm to complete its optimization process. The box plots provide a visual representation of the statistical distribution of the execution times for each algorithm. The central line within each box represents the median value, while the bottom and top of the boxes indicate the 25th and 75th percentiles, respectively. The whiskers extend to the minimum and maximum values, excluding any outliers, which are plotted as individual points.

Figure 26: Elapsed time comparison of meta-heuristic algorithms
The figure clearly demonstrates that the MGO algorithm has the lowest average execution time, with a median value of around 28.66 s. This is followed by the INFO algorithm, which has a median runtime of approximately 42.09 s. In contrast, the BO algorithm exhibits the highest average execution time, with a median value of 110.10 s. The presence of outliers in the BO, MGO, and HO algorithms suggests that, under certain conditions, these methods may require significantly more time to converge compared to their typical performance. The absence of outliers in the INFO and RUN algorithms indicates more consistent computational efficiency across the tested instances. The trade-off between solution quality and computational speed is an important consideration when selecting the most appropriate algorithm for a given distribution network reconfiguration problem. The insights provided by Fig. 26 can help researchers and practitioners make informed decisions based on their specific requirements and constraints.
Based on this comprehensive analysis, the BO algorithm emerges as the most promising approach for this distribution network reconfiguration problem. It consistently achieves the global optimum, demonstrates the highest success rate, and shows the best statistical performance in terms of consistency and accuracy. While it does require more computational time, the quality of its solutions justifies this trade-off in most practical scenarios. The INFO algorithm also shows promise, often performing second-best to BO across various metrics. In situtions where computational speed is a critical factor, INFO might be considered as an alternative, offering a balance between solution quality and runtime efficiency. Future work could focus on hybrid approaches that combine the strengths of BO and INFO, potentially leading to even more robust and efficient optimization techniques for distribution network reconfiguration.
In conclusion, this study provides a comprehensive analysis of reconfiguration in unbalanced three-phase PDNs by focusing on the 37-bus test system under multiple scenarios. Through a multi-objective optimization approach, the research effectively addresses key challenges in unbalanced PDNs, including active power loss reduction, voltage and current imbalance minimization, voltage profile improvement and enhancement of network reliability. This study presents practical strategies for developing more reliable, efficient, and sustainable energy systems, taking into account the unbalanced structure of PDNs. It is based on four different scenarios.
In Scenario I, it is demonstrated that significant improvements in grid efficiency can be achieved by minimizing active power losses and optimizing average voltage profiles. The post-reconfiguration analysis reveals a substantial reduction in active power loss from 60.56 to 51.82 kW, representing a 14.4% improvement in system efficiency.
In Scenario II, current and voltage imbalance index values are minimized to reduce the negative impacts of unbalanced loads, which is a critical problem in modern distribution systems. The implementation achieved remarkable results, reducing the mean CUI from 40.37% to 26.60%, with the number of buses exceeding the 30% CUI threshold decreasing from 14 to 8. Similarly, the mean VUI showed significant improvement, decreasing from 0.938 to 0.697, while the maximum VUI was reduced from 1.376 at bus-724 to 1.026 at bus-701, demonstrating enhanced voltage stability across the network.
In Scenario III, a comprehensive reliability index calculation is conducted for 3-phase unbalanced PDNs using Line-Oriented Reliability Index (LORI) and Customer-Oriented Reliability Index (CORI) approaches. The LORI analysis reveals significant phase-dependent improvements in reliability indices, particularly in SAIDI values, which improved from 42.49 to 35.78 hours/customer/year for Phase A, 35.17 to 28.94 hours/customer/year for Phase B, and 33.65 to 30.23 hours/customer/year for Phase C.
In Scenario IV, a multi-objective optimization approach is applied to simultaneously address power loss, current instability, and reliability (SAIDI), and balanced improvements are achieved between these conflicting criteria.
Advanced meta-heuristic algorithms such as the Bonobo Optimizer, Mountain Gazelle Optimizer, Hippopotamus Optimization Algorithm, Weighted Mean Optimizer, and Runge-Kutta Optimizer have been applied to solve the reconfiguration problem in three-phase unbalanced 37-bus PDNs, and their performances have been compared. The algorithm that emerged as the most effective in providing solutions to the problems discussed in this paper is the BO. As a result, in this study, considering the complexity of the three-phase 37-bus unbalanced PDN system, optimization has been performed using different meta-heuristic algorithms and an important contribution has been made for more efficient, reliable and sustainable energy systems.
Acknowledgement: During the preparation of this work, the author used ChatGPT 4.0-mini in order to refine the English wording of certain phrases. After using this tool/service, the author reviewed and edited the content as needed and takes full responsibility for the content of the publication.
Funding Statement: This work was supported by the Scientific and Technological Research Council of Turkey (TÜBİTAK) under Grant No. 124E002 (1001-Project).
Availability of Data and Materials: The data that support the findings of this study are available from the corresponding author, Murat Cikan, upon reasonable request.
Ethics Approval: Not applicable.
Conflicts of Interest: The author declares no conflicts of interest to report regarding the present study.
Abbreviations
| AENS | Average Energy Not Supplied |
| ASAI | Average Service Availability Index |
| B/F LF | Backward/forward load flow |
| BO | Bonobo optimizer |
| BPSO | Binary particle swarm optimization |
| CAIDI | Customer average interruption duration index |
| CORI | Customer oriented reliability index |
| CSFSA | Chaotic stochastic fractal search algorithm |
| CSGA | Chaotic search group algorithm |
| CUI | Current unbalance index |
| EMA | Exchange market algorithm |
| EO | Equilibrium optimizer |
| GD | Generational distance |
| GWO | Grey wolf optimizer |
| HO | Hippopotamus optimization algorithm |
| IHSA | Improved harmony search algorithm |
| INFO | Weighted mean optimizer |
| LLF | Linear load flow |
| LORI | Line oriented reliability index |
| MFO | Moth flame optimizer |
| MGO | Mountain gazelle optimizer |
| MILP | Mix integer linear programming |
| NA | Not applicable |
| NP | Negative phase |
| N-R LF | Newton-Raphson load flow |
| Open-DSS | Open distribution system simulator |
| PDN | Power distribution networks |
| PP | Positive phase |
| RL | Reinforcement learning |
| RUN | Runge-Kutta optimizer |
| SAIDI | System average interruption duration index |
| SAIFI | System average interruption frequency index |
| SILS | Smart iterated local search |
| SMA | Slime mould algorithm |
| SSs | Sectional switches |
| TSs | Tie-switches |
| UPDN | Unbalanced power distribution networks |
| VSI | Voltage stability index |
| VUI | Voltage unbalance index |
| WGA | Wild goats’ algorithm |
References
1. Çıkan M, Nacar Çıkan N. Elektrikli araç şarj istasyonlarının enerji dağıtım hatlarına optimum şekilde konumlandırılması. Kahramanmaraş Sütçü İmam Üniversitesi Mühendislik Bilimleri Dergisi. 2024;27(2):340–63. doi:10.17780/ksujes.1365209. [Google Scholar] [CrossRef]
2. Cikan M, Kekezoglu B. Comparison of metaheuristic optimization techniques including Equilibrium optimizer algorithm in power distribution network reconfiguration. Alex Eng J. 2022;61(2):991–1031. doi:10.1016/j.aej.2021.06.079. [Google Scholar] [CrossRef]
3. Nacar Cikan N, Cikan M. Reconfiguration of 123-bus unbalanced power distribution network analysis by considering minimization of current & voltage unbalanced indexes and power loss. Int J Electr Power Energy Syst. 2024;157(1):109796. doi:10.1016/j.ijepes.2024.109796. [Google Scholar] [CrossRef]
4. Cikan M, Cikan NN. Optimum allocation of multiple type and number of DG units based on IEEE 123-bus unbalanced multi-phase power distribution system. Int J Electr Power Energy Syst. 2023;144(10):108564. doi:10.1016/j.ijepes.2022.108564. [Google Scholar] [CrossRef]
5. Lotfi H, Hajiabadi ME, Parsadust H. Power distribution network reconfiguration techniques: a thorough review. Sustainability. 2024;16(23):10307. doi:10.3390/su162310307. [Google Scholar] [CrossRef]
6. Yang F, Li Z. Effects of balanced and unbalanced distribution system modeling on power flow analysis. In: 2016 IEEE Power & Energy Society Innovative Smart Grid Technologies Conference (ISGT); 2016 Sep 6–9; Minneapolis, MN, USA: IEEE; 2016. p. 1–5. doi:10.1109/ISGT.2016.7781195 [Google Scholar] [CrossRef]
7. Radosavljević J. Metaheuristic optimization in power engineering. London, UK: The Institution of Engineering and Technology (IET); 2018. doi:10.1049/PBPO131E. [Google Scholar] [CrossRef]
8. Çıkan M. Çita optimizasyon algoritması kullanarak kısmi gölgelenme altındaki fotovoltaik sistemlerde maksimum güç noktası izleyicisinin tasarlanması. Gazi Üniversitesi Mühendislik Mimarlık Fakültesi Dergisi. 2024;40(1):555–72. doi:10.17341/gazimmfd.1183267. [Google Scholar] [CrossRef]
9. Cikan M, Dogansahin K. A comprehensive evaluation of up-to-date optimization algorithms on MPPT application for photovoltaic systems. Energy Sources Part A Recovery Util Environ Eff. 2023;45(4):10381–407. doi:10.1080/15567036.2023.2245771. [Google Scholar] [CrossRef]
10. Sultana B, Mustafa MW, Sultana U, Bhatti AR. Review on reliability improvement and power loss reduction in distribution system via network reconfiguration. Renew Sustain Energy Rev. 2016;66(7):297–310. doi:10.1016/j.rser.2016.08.011. [Google Scholar] [CrossRef]
11. Mishra S, Das D, Paul S. A comprehensive review on power distribution network reconfiguration. Energy Syst. 2017;8(2):227–84. doi:10.1007/s12667-016-0195-7. [Google Scholar] [CrossRef]
12. Parihar SS, Malik N. Network reconfiguration in the presence of optimally integrated multiple distributed generation units in a radial distribution network. Eng Optim. 2024;56(5):679–99. doi:10.1080/0305215X.2023.2187790. [Google Scholar] [CrossRef]
13. Li JY, Chen JJ, Wang YX, Chen WG. Combining multi-step reconfiguration with many-objective reduction as iterative bi-level scheduling for stochastic distribution network. Energy. 2024;290:130198. doi:10.1016/j.energy.2023.130198. [Google Scholar] [CrossRef]
14. Gallo D, Langella R, Testa A, Hernández JC, Papič I, Blažič B, et al. Case studies on large PV plants: harmonic distortion, unbalance and their effects. In: 2013 IEEE Power & Energy Society General Meeting; 2013 Jul 21–25; Vancouver, BC, Canada: IEEE; 2013. p. 1–5. doi:10.1109/PESMG.2013.6672271. [Google Scholar] [CrossRef]
15. Dias Santos J, Marques F, Garcés Negrete LP, Andrêa Brigatto GA, López-Lezama JM, Muñoz-Galeano N. A novel solution method for the distribution network reconfiguration problem based on a search mechanism enhancement of the improved harmony search algorithm. Energies. 2022;15(6):2083. doi:10.3390/en15062083. [Google Scholar] [CrossRef]
16. Jafari A, Ganjeh Ganjehlou H, Baghal Darbandi F, Mohammadi-Ivatloo B, Abapour M. Dynamic and multi-objective reconfiguration of distribution network using a novel hybrid algorithm with parallel processing capability. Appl Soft Comput. 2020;90:106146. doi:10.1016/j.asoc.2020.106146. [Google Scholar] [CrossRef]
17. Hizarci H, Demirel O, Turkay BE. Distribution network reconfiguration using time-varying acceleration coefficient assisted binary particle swarm optimization. Eng Sci Technol Int J. 2022;35(3):101230. doi:10.1016/j.jestch.2022.101230. [Google Scholar] [CrossRef]
18. Huy THB, Van Tran T, Ngoc Vo D, Nguyen HTT. An improved metaheuristic method for simultaneous network reconfiguration and distributed generation allocation. Alex Eng J. 2022;61(10):8069–88. doi:10.1016/j.aej.2022.01.056. [Google Scholar] [CrossRef]
19. Tran The T, Vo Ngoc D, Tran Anh N. Distribution network reconfiguration for power loss reduction and voltage profile improvement using chaotic stochastic fractal search algorithm. Complexity. 2020;2020(4):2353901. doi:10.1155/2020/2353901. [Google Scholar] [CrossRef]
20. Azizivahed A, Narimani H, Fathi M, Naderi E, Safarpour HR, Narimani MR. Multi-objective dynamic distribution feeder reconfiguration in automated distribution systems. Energy. 2018;147(2):896–914. doi:10.1016/j.energy.2018.01.111. [Google Scholar] [CrossRef]
21. Cikan M, Cikan NN, Kekezoglu B. Determination of optimal island regions with simultaneous DG allocation and reconfiguration in power distribution networks. IET Renew Power Gener. 2025;19(1):e12942. doi:10.1049/rpg2.12942. [Google Scholar] [CrossRef]
22. Olabode EO, Ajewole TO, KOI, Ade-Ikuesan OO. Optimal sitting and sizing of shunt capacitor for real power loss reduction on radial distribution system using firefly algorithm: a case study of Nigerian system. Energy Sources Part A Recovery Util Environ Eff. 2023;45(2):5776–88. doi:10.1080/15567036.2019.1673507. [Google Scholar] [CrossRef]
23. Qu Y, Liu CC, Xu J, Sun Y, Liao S, Ke D. A global optimum flow pattern for feeder reconfiguration to minimize power losses of unbalanced distribution systems. Int J Electr Power Energy Syst. 2021;131(2):107071. doi:10.1016/j.ijepes.2021.107071. [Google Scholar] [CrossRef]
24. Zhai HF, Yang M, Chen B, Kang N. Dynamic reconfiguration of three-phase unbalanced distribution networks. Int J Electr Power Energy Syst. 2018;99(3):1–10. doi:10.1016/j.ijepes.2017.12.027. [Google Scholar] [CrossRef]
25. Kaur M, Ghosh S. Network reconfiguration of unbalanced distribution networks using fuzzy-firefly algorithm. Appl Soft Comput. 2016;49(2):868–86. doi:10.1016/j.asoc.2016.09.019. [Google Scholar] [CrossRef]
26. Beneteli TAP, Cota LP, Euzébio TAM. Limiting current and voltage unbalances in distribution systems: a metaheuristic-based decision support system. Int J Electr Power Energy Syst. 2022;135:107538. doi:10.1016/j.ijepes.2021.107538. [Google Scholar] [CrossRef]
27. Jacob RA, Paul S, Li W, Chowdhury S, Gel YR, Zhang J. Reconfiguring unbalanced distribution networks using reinforcement learning over graphs. In: 2022 IEEE Texas Power and Energy Conference (TPEC); 2022 Feb 28–Mar 1; College Station, TX, USA: IEEE; 2022. p. 1–6. doi:10.1109/TPEC54980.2022.9750805 [Google Scholar] [CrossRef]
28. Gangwar P, Singh SN, Chakrabarti S. Network reconfiguration for unbalanced distribution systems. In: TENCON 2017-2017 IEEE Region 10 Conference; 2017 Nov 5–8; Penang, Malaysia: IEEE; 2017. p. 3028–32. doi:10.1109/TENCON.2017.8228381 [Google Scholar] [CrossRef]
29. Duran-Quintero M, Candelo JE, Soto-Ortiz J. A modified backward/forward sweep-based method for reconfiguration of unbalanced distribution networks. Int J Electr Comput Eng. 2019;9(1):85–101. doi:10.11591/ijece.v9i1. [Google Scholar] [CrossRef]
30. Gerez C, Costa ECM, Sguarezi Filho AJ. Static reconfiguration of unbalanced distribution systems with variable power using selective bat algorithm. J Contr Autom Electr Syst. 2021;32(3):656–71. doi:10.1007/s40313-021-00695-z. [Google Scholar] [CrossRef]
31. Zhou A, Zhai H, Yang M, Lin Y. Three-phase unbalanced distribution network dynamic reconfiguration: a distributionally robust approach. IEEE Trans Smart Grid. 2022;13(3):2063–74. doi:10.1109/TSG.2021.3139763. [Google Scholar] [CrossRef]
32. Mehroliya S, Arya A. Distributed generator and capacitor-embedded reconfiguration in three-phase unbalanced distribution systems using teaching learning-based optimization. Comp Applic Eng. 2024;32(1):e22689. doi:10.1002/cae.22689. [Google Scholar] [CrossRef]
33. Das AK, Pratihar DK. Bonobo optimizer (BOan intelligent heuristic with self-adjusting parameters over continuous spaces and its applications to engineering problems. Appl Intell. 2022;52(3):2942–74. doi:10.1007/s10489-021-02444-w. [Google Scholar] [CrossRef]
34. Abdollahzadeh B, Gharehchopogh FS, Khodadadi N, Mirjalili S. Mountain gazelle optimizer: a new nature-inspired metaheuristic algorithm for global optimization problems. Adv Eng Softw. 2022;174(3):103282. doi:10.1016/j.advengsoft.2022.103282. [Google Scholar] [CrossRef]
35. Amiri MH, Mehrabi Hashjin N, Montazeri M, Mirjalili S, Khodadadi N. Hippopotamus optimization algorithm: a novel nature-inspired optimization algorithm. Sci Rep. 2024;14(1):5032. doi:10.1038/s41598-024-54910-3. [Google Scholar] [PubMed] [CrossRef]
36. Ahmadianfar I, Heidari AA, Noshadian S, Chen H, Gandomi AH. INFO: an efficient optimization algorithm based on weighted mean of vectors. Expert Syst Appl. 2022;195(12):116516. doi:10.1016/j.eswa.2022.116516. [Google Scholar] [CrossRef]
37. Ahmadianfar I, Heidari AA, Gandomi AH, Chu X, Chen H. RUN beyond the metaphor: an efficient optimization algorithm based on Runge Kutta method. Expert Syst Appl. 2021;181(21):115079. doi:10.1016/j.eswa.2021.115079. [Google Scholar] [CrossRef]
38. Bapat RB. Graphs and matrices. 2nd ed. London, UK: Springer; 2014. doi:10.1007/978-1-4471-6569-9. [Google Scholar] [CrossRef]
39. El-Hawary E. Definitions of voltage unbalance. IEEE Power Eng Rev. 2001;21(5):49–51. doi:10.1109/MPER.2001.4311362. [Google Scholar] [CrossRef]
40. IEEE Recommended Practice For Monitoring Electric Power Quality. IEEE Std 1159–2009 (Revision of IEEE Std 1159–1995). 2009. p. 1–94. doi:10.1109/IEEESTD.2009.5154067. [Google Scholar] [CrossRef]
41. IEEE Guide For Electric Power Distribution Reliability Indices. IEEE Std 1366–2012 (Revision of IEEE Std 1366–2003). 2012. p. 1–43. doi:10.1109/IEEESTD.2012.6209381. [Google Scholar] [CrossRef]
42. Zhao W, Zhang Z, Mirjalili S, Wang L, Khodadadi N, Mirjalili SM. An effective multi-objective artificial hummingbird algorithm with dynamic elimination-based crowding distance for solving engineering design problems. Comput Meth Appl Mech Eng. 2022;398(1):115223. doi:10.1016/j.cma.2022.115223. [Google Scholar] [CrossRef]
43. Das AK, Pratihar DK. A new bonobo optimizer (BO) for real-parameter optimization. In: 2019 IEEE Region 10 Symposium (TENSYMP); 2019 Jun 7–9; Kolkata, India: IEEE; 2019. p. 108–13. doi:10.1109/tensymp46218.2019.8971108 [Google Scholar] [CrossRef]
44. Kersting WH. Radial distribution test feeders. IEEE Trans Power Syst. 1991;6(3):975–85. doi:10.1109/59.119237. [Google Scholar] [CrossRef]
45. Kersting WH. Radial distribution test feeders. In: 2001 IEEE Power Engineering Society Winter Meeting. Conference Proceedings; 2001 Jan 28–Feb 1; Columbus, OH, USA: IEEE; 2001. p. 908–12. doi:10.1109/PESW.2001.916993. [Google Scholar] [CrossRef]
46. Garces A. A linear three-phase load flow for power distribution systems. IEEE Trans Power Syst. 2016;31(1):827–8. doi:10.1109/TPWRS.2015.2394296. [Google Scholar] [CrossRef]
47. Montoya OD, Garcés-Ruiz A, Gil-González W. Three-phase power flow tool for electric distribution grids: a Julia implementation for electrical engineering students. Ingeniería. 2023;28(3):e21419. doi:10.14483/23448393.21419. [Google Scholar] [CrossRef]
48. Garcés-Ruiz A. Flujo de potencia en redes de distribución eléctrica trifásicas no equilibradas utilizando Matlab: Teoría, análisis y simulación cuasi-dinámica. Ingeniería. 2022;27(3):e19252. doi:10.14483/23448393.19252. [Google Scholar] [CrossRef]
49. IEEE Power and Energy Society (PES) Distribution System Analysis Subcommittee. IEEE 37 Node Test Feeder [Internet]. Piscataway (NJIEEE. [cited 2024 Aug 09]. Available from: https://cmte.ieee.org/pes-testfeeders/resources/. [Google Scholar]
50. Cetin A, Ozen C, Kaya K, Bayatmakoo A. Comparison of international voltage unbalance standards results for different power quality measurement points: a study on MV grid in Turkey. In: 2022 11th International Conference on Power Science and Engineering (ICPSE); 2022 Sep 23–25; Eskisehir, Turkey: IEEE; 2022. p. 15–20. doi:10.1109/ICPSE56329.2022.9935457. [Google Scholar] [CrossRef]
51. López EA. Microgenetic multiobjective reconfiguration algorithm considering power losses and reliability indices for medium voltage distribution network. IET Generat, Trans Distribut. 2009;3(9):825–40. [Google Scholar]
52. Billinton R, Allan RN. Reliability evaluation of power systems. Boston, MA, USA: Springer; 1996. [Google Scholar]
Cite This Article
 Copyright © 2025 The Author(s). Published by Tech Science Press.
This work is licensed under a Creative Commons Attribution 4.0 International License , which permits unrestricted use, distribution, and reproduction in any medium, provided the original work is properly cited.
 Downloads
 Citation Tools