
 Submit a Paper
 Propose a Special lssue
 Open Access
ARTICLE

Ensemble Encoder-Based Attack Traffic Classification for Secure 5G Slicing Networks
1 Department of Financial Information Security, Kookmin University, Seoul, 02707, Republic of Korea
2 Department of Information Security Cryptography Mathematics, Kookmin University, Seoul, 02707, Republic of Korea
* Corresponding Author: Hwankuk Kim. Email:
(This article belongs to the Special Issue: Cutting-Edge Security and Privacy Solutions for Next-Generation Intelligent Mobile Internet Technologies and Applications)
Computer Modeling in Engineering & Sciences 2025, 143(2), 2391-2415. https://doi.org/10.32604/cmes.2025.063558
Received 17 January 2025; Accepted 06 May 2025; Issue published 30 May 2025
 View Full Text
 Download PDF
Abstract
This study proposes an efficient traffic classification model to address the growing threat of distributed denial-of-service (DDoS) attacks in 5th generation technology standard (5G) slicing networks. The proposed method utilizes an ensemble of encoder components from multiple autoencoders to compress and extract latent representations from high-dimensional traffic data. These representations are then used as input for a support vector machine (SVM)-based metadata classifier, enabling precise detection of attack traffic. This architecture is designed to achieve both high detection accuracy and training efficiency, while adapting flexibly to the diverse service requirements and complexity of 5G network slicing. The model was evaluated using the DDoS Datasets 2022, collected in a simulated 5G slicing environment. Experiments were conducted under both class-balanced and class-imbalanced conditions. In the balanced setting, the model achieved an accuracy of 89.33%, an F1-score of 88.23%, and an Area Under the Curve (AUC) of 89.45%. In the imbalanced setting (attack:normal = 7:3), the model maintained strong robustness, achieving a recall of 100% and an F1-score of 90.91%, demonstrating its effectiveness in diverse real-world scenarios. Compared to existing AI-based detection methods, the proposed model showed higher precision, better handling of class imbalance, and strong generalization performance. Moreover, its modular structure is well-suited for deployment in containerized network function (NF) environments, making it a practical solution for real-world 5G infrastructure. These results highlight the potential of the proposed approach to enhance both the security and operational resilience of 5G slicing networks.Keywords
The advent of 5th generation technology standard (5G) technology represents a groundbreaking advancement compared to previous generations of wireless communication technologies. Key features such as ultrahigh data transmission speeds, low latency, and massive device connectivity highlight the potential of 5G in transforming various industries. These advancements have facilitated the development of innovative services and applications, including autonomous vehicles, telemedicine, smart cities, augmented reality (AR), and virtual reality (VR) technologies. However, along with these advancements, significant security challenges have emerged [1].
Furthermore, the 5G ecosystem, characterized by massive device connectivity and diverse communication environments, poses heightened risks to data privacy. In response, various studies have explored advanced data encryption algorithms [2] and developed countermeasures against false base stations attempting to collect terminal information. In addition to addressing security concerns, supporting such diverse services requires more flexible and efficient network architecture.
Network-slicing technology was introduced to maximize the flexibility and efficiency of 5G networks. Previous network generations adopted a model for sharing the same network resources, making it difficult to effectively satisfy diverse service requirements. While 4th generation technology standard (4G) networks focus mainly on voice calls and data transmission, 5G networks support a far wider range of services and applications. Consequently, network slicing technology provides the following benefits:
• Diversification of Services: 5G is designed to support a variety of services, such as autonomous vehicles, telemedicine, smart cities, AR, and VR, that go beyond fast data transmission. These services have unique network requirements that make their effective operation difficult within a unified network environment.
• Resource Efficiency: Efficient resource allocation is required when using a single network infrastructure for diverse purposes. Network slicing allows the optimization of network resources according to the specific needs and characteristics of each service, which helps reduce unnecessary resource wastage and maximizes the overall capacity of the network.
• Network Management and Operation: Existing network structures require complex management and operations to satisfy the demands of various services. Network slicing enables independent management of each slice, which reduces the complexity of network operations and enhances management efficiency.
Network slicing is a critical component of 5G networks. This technology enables the division of a single physical network infrastructure into multiple virtual networks, with each slice functioning as an independent network. Through network slicing, mobile network operators can partition and optimize a single network infrastructure to cater to diverse services and customer demands. This approach plays a vital role in maximizing efficiency and enhancing service quality. For instance, ultralow-latency slice networks can be tailored for autonomous vehicles, whereas high-density slice networks can support large-scale IoT devices.
However, network slicing introduces both existing and novel security vulnerabilities. Each slice possesses unique traffic characteristics and security requirements, making it challenging to effectively address these issues using traditional unified network security approaches. If the isolation between slices is incomplete, security threats originating in one slice may propagate to others, posing significant risks [3]. Moreover, detecting and mitigating security threats that occur simultaneously across multiple slices is a highly complex and challenging task.
Examples of potential attacks on network slices include the following:
• Inter-slice Information Leakage Attack: 3GPP has made information about 5G network resources accessible through Application Programming Interfaces (APIs) via the Network Exposure Function (NEF). Such open APIs can lead to information leaks within slices [4].
• DoS/DDoS Attacks: Denial of Service (DoS) and Distributed Denial of Service (DDoS) attacks generate intensive traffic that targets a specific slice, thereby degrading service availability. Consequently, services that rely on the affected slice may fail to function properly.
• Resource Exhaustion Attack: Excessive resource consumption by one slice can prevent other slices from acquiring the necessary resources, which negatively impacts overall network performance.
• Slice Configuration Tampering Attack: Threats can occur through attack points that exist at each stage of the slice life cycle. Attacks can occur through slice settings defined during slice creation in the slice preparation phase. Attackers can exploit poorly designed slice settings as attack points for various attacks, including malware and traffic injection [5].
Machine learning (ML) and deep learning (DL) technologies are also being studied extensively for network traffic management and resource management [6,7]. In addition, the use of ML and DL technologies for distributed denial-of-service (DDoS) traffic detection offers several significant advantages over traditional signature-based detection methods. First, artificial intelligence (AI) models can analyze large-scale data and learn diverse patterns, thereby enabling flexible responses to novel types of attacks. Second, AI models can analyze traffic data in real-time, allowing immediate response while accurately distinguishing between normal and abnormal traffic. Finally, AI models can continuously improve their detection performance over time through ongoing learning and refinement.
The application of AI-based DDoS traffic detection in 5G slicing networks offers several advantages. First, it provides tailored security solutions customized to the characteristics and requirements of each slice. This strengthens the security isolation between slices and facilitates effective detection and mitigation of security threats by targeting specific slices. Second, real-time traffic monitoring and analysis using AI models allow rapid responses to simultaneous security threats occurring across multiple slices. Third, AI-based security solutions reduce the burden on network administrators by automating detection and response to security threats, thereby enhancing operational efficiency.
The aim of this study is to propose a data-processing procedure and model design for detecting DDoS attack traffic in 5G slicing networks using AI-based techniques. This study provides an in-depth analysis of the concept and structure of network slicing and introduces methods that leverage machine and deep learning algorithms to effectively detect cyberattacks. In addition, the performance of the proposed AI-based techniques was evaluated and compared with existing attack detection methods in slicing environments, to demonstrate their superiority. The findings of this study are expected to enhance the security of 5G slicing networks and contribute to the safe and widespread adoption of 5G technology in the future.
The main contributions of this study are as follows:
1. Original Model Design: A model that utilizes the encoder of an autoencoder (AE) in an ensemble format is proposed, to enable efficient processing of high-dimensional data and effective feature extraction in 5G slicing networks.
2. Class Balance Analysis: A systematic analysis of the impact of the dataset class balance on model performance was conducted by comparing and evaluating the results in both balanced and imbalanced data scenarios.
3. Enhanced Detection Performance: Compared with existing methods, superior performance in attack traffic detection was obtained, achieving higher accuracy and F1 scores.
4. Increased Practicality: A flexible and scalable solution for various 5G slicing applications is provided through a modular learning process and ensemble structure.
2.1 Security Threats in 5G Networks
5G networks have added new technologies to support ultra-high-speed data transmission, ultra-low latency, and consistent connections. 4G is structured as an independent multimedia structure, allowing slicing and open APIs, and has functions such as processing. However, as new technologies are patched, there are still some areas that continue to be a nuisance. The main security issues are as follows:
1. Security issues in OpenAPI and edge computing environments: 5G is designed to operate Network Functions (NF) by adopting OpenAPI. This may be vulnerable to attacks that exploit OpenAPI, such as API misuse, data tampering, and authentication bypass. In addition, edge computing environments are easier to process real-time data than existing 4G, but they can attempt to bypass authentication through replay attacks and man-in-the-middle attacks and inject forged data into specific connected nodes.
2. Security issues related to network slicing: 5G can operate by logically separating the network through network slicing technology to manage it according to specific service requirements. In this case, isolation between slice networks becomes the most important security element. If the isolation between slices is incomplete, a security threat that occurred in one slice can spread to another slice or have a direct or indirect impact. In addition, if the management of slice settings (security policy, permission, etc.) is insufficient, there may be vulnerabilities such as exposure of important data or allowing unnecessary slice access.
3. RAN security issues: As the 5G network’ changes the structure of the radio access network (RAN) to open RAN and virtualization, new security threats are emerging. In particular, research on fake base station attacks is representative. Attackers can collect the International Mobile Subscriber Identity (IMSI) of connected devices by disguising fake base stations as legitimate networks. This can lead to attacks such as user location tracking, data leakage, and man-in-the-middle attacks. Fake base station attacks can also occur in 4G, but the attack range can be expanded in 5G due to the introduction of network slicing and edge computing.
This study focuses on security issues related to network slicing among the three security issues. Open5GS is a representative 5G core open source project that supports network slicing. Open5GS is a representative open source for building a private 5G network, and supports network slicing functions in compliance with the 3GPP Release 17 standard. However, Open5GS also has various Common Vulnerabilities and Exposures (CVEs) reported due to numerous function updates [8]. A total of 59 CVEs were reported from 2021 to 2025, of which 44 vulnerabilities lead to DoS attacks. Among them, CVE-2024-51179 [9], an example of a CVE related to network slicing, uses a method of flooding User Plane Function (UPF) with malicious Packet Forwarding Control Protocol (PFCP) packets using the Protocol Data Unit (PDU) session information of an existing connected UE. As a result, the UPF PDU session setup error and the core function of Session Management Function (SMF) are interrupted, causing new PDU session allocation to fail.
In order to detect DoS/DDoS attacks caused by vulnerabilities in such slicing network environments, efforts are being made to apply artificial intelligence in 5G core-related research and open source. However, it has not yet been developed to the extent that it can be applied to the real world.
5G is developing in the direction of applying various structural changes and new technologies such as virtualization of NF and implemented functions of OpenAPI compared to 4G, network slicing, and performing detection and response using AI.
Therefore, research on anomaly detection in an environment that considers virtualization environment and sliced network is necessary in accordance with these changes. However, since the amount of attack traffic in 5G network is very small compared to normal traffic, this study aims to utilize Autoencoder that can detect attacks through normal-based learning.
Prior to 5G, networks required the physical separation of equipment to differentiate between services based on their purpose. However, this process incurs significant costs, and the introduction of 5G network slicing technology effectively resolved this problem.
Network Slicing. This technology divides a single physical network into logical virtual networks, allowing independent quality of service (QoS) policies to be applied and operated based on the purpose of the service. According to the standard [10], the establishment of user-plane data network connections through a network slice instance consists of two procedures:
1. Performing registration management (RM), which involves selecting an access and mobility management function (AMF) that supports the required network slice.
2. Establishing connections to one or more data networks, which requires packet data unit (PDU) sessions through the network slice instance.
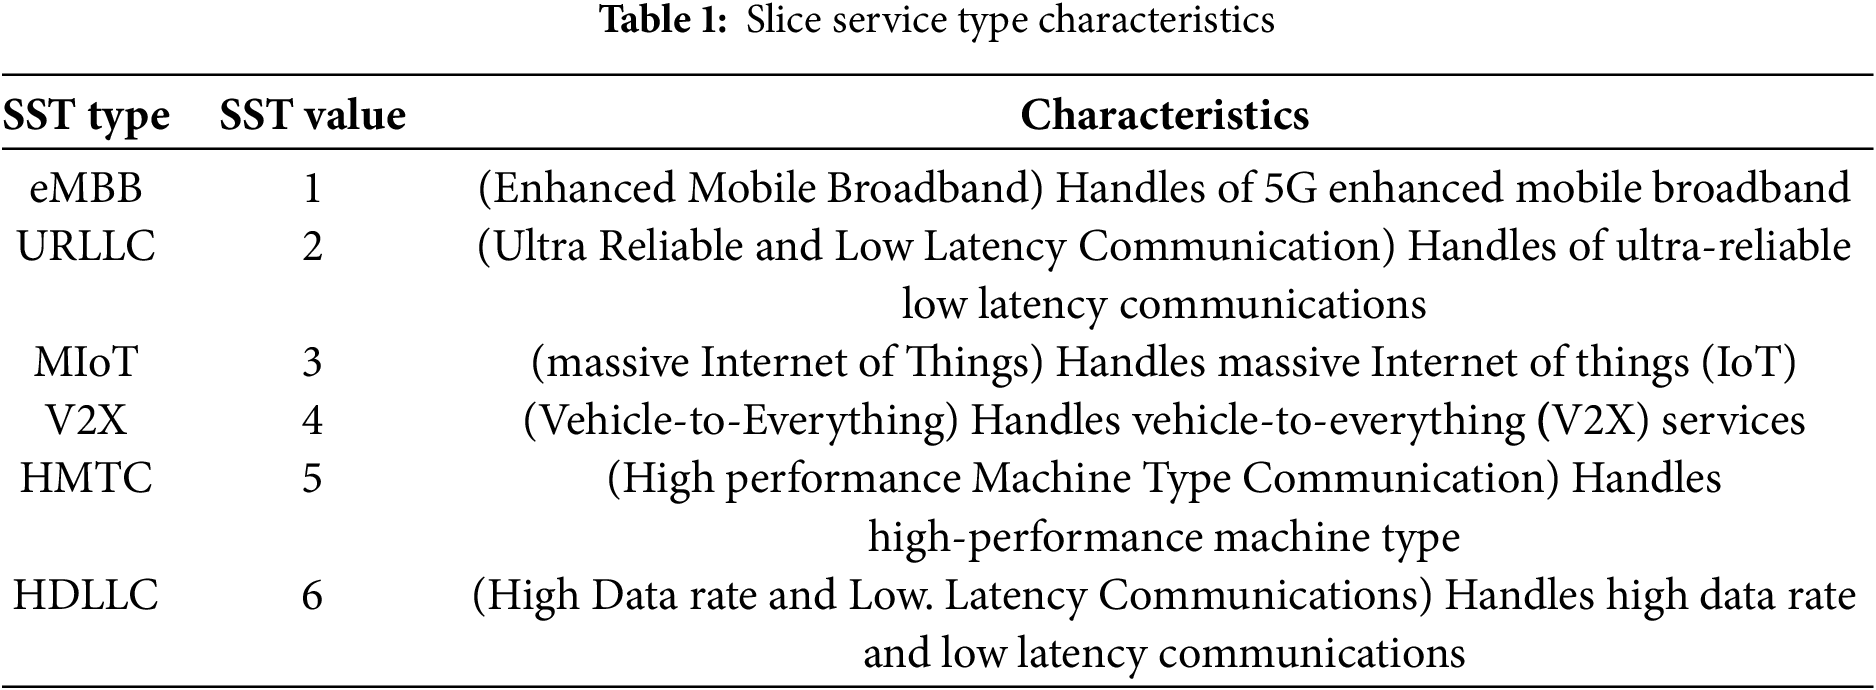
Network Slice/Service Types. Network slices are distinguished using a single-network slice selection assistance information (S-NSSAI) identifier. The S-NSSAI consists of two components: slice/service type (SST) and slice differentiator (SD). The six types of SSTs are listed in Table 1. SD serves as a sub-identifier that differentiates between network slices using the same SST.
An example of a user equipment (UE) connection through a network-slice instance is shown in Fig. 1. In this example, the UE establishes a PDU session via a specific SMF to connect to either Slice A, which provides the ultra-reliable low-latency communication (URLLC) service type, or Slice B, which offers the enhanced mobile broadband (eMBB) service type through the AMF.
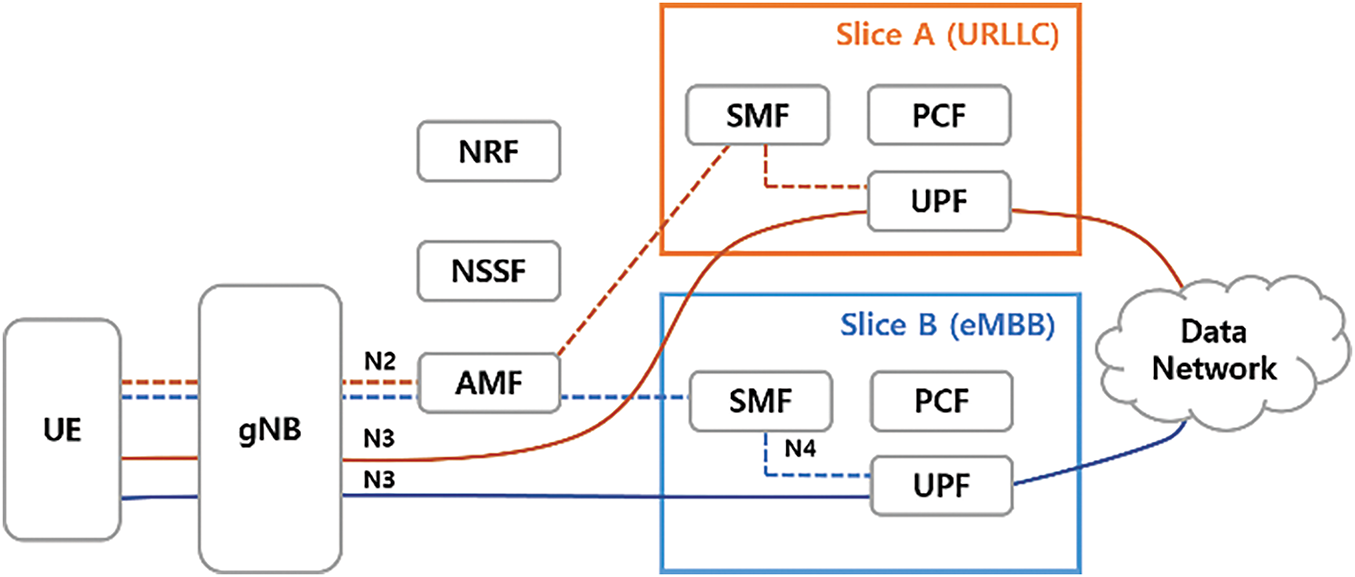
Figure 1: An example of network slice deployments in 5G
The autoencoder is a deep learning algorithm designed to learn by encoding input data in compressed form and then decoding it back to reconstruct data similar to the original input. Fig. 2 illustrates the basic structure of an AE, which primarily consists of three components: encoder, decoder, and latent space (z).
• The encoder compresses the input data into a compact representation z through multiple layers of neural networks.
• Subsequently, the decoder reconstructs the original input data format from the compressed representation z using multiple layers of neural networks.
• The latent space z is iteratively optimized during training to capture the essential features of the input data, enabling the AE to effectively reconstruct the data.
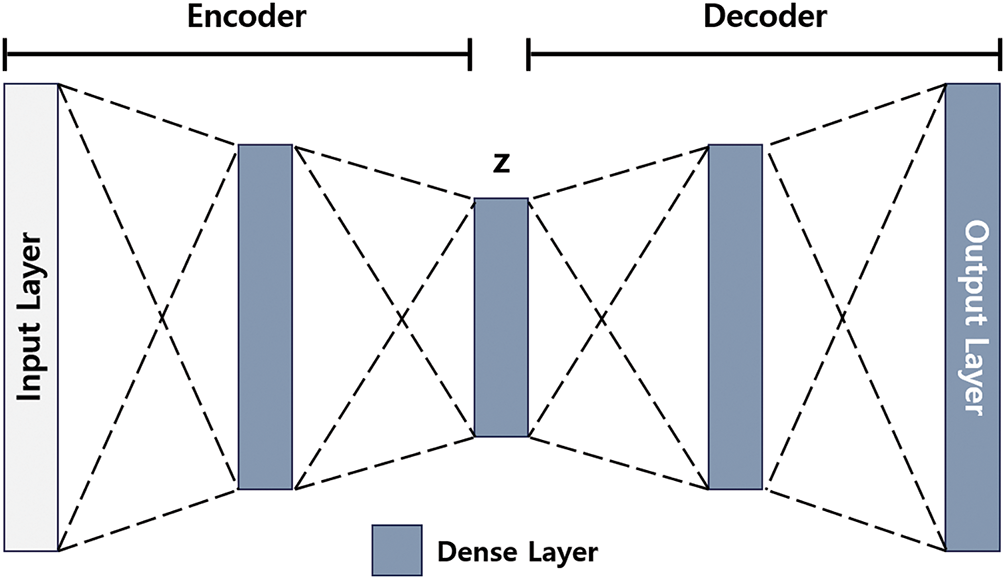
Figure 2: Autoencoder architecture
Consequently, the encoder of a well-trained AE is highly effective in extracting key features from the input data while simultaneously reducing the dimensionality.
The AE utilizes the mean squared error (MSE) as its loss function, which calculates the difference between the reconstructed output and input data. The AE extracts critical information from the input data more effectively by minimizing this loss, which ultimately improves reconstruction accuracy.
The MSE loss function is defined in Eq. (1), where n denotes the number of data points;
3.1 Traffic Classificationin 5G Network
This subsection introduces the studies that focused on classifying either service or attack traffic in 5G networks, summarizing them in Table 2.
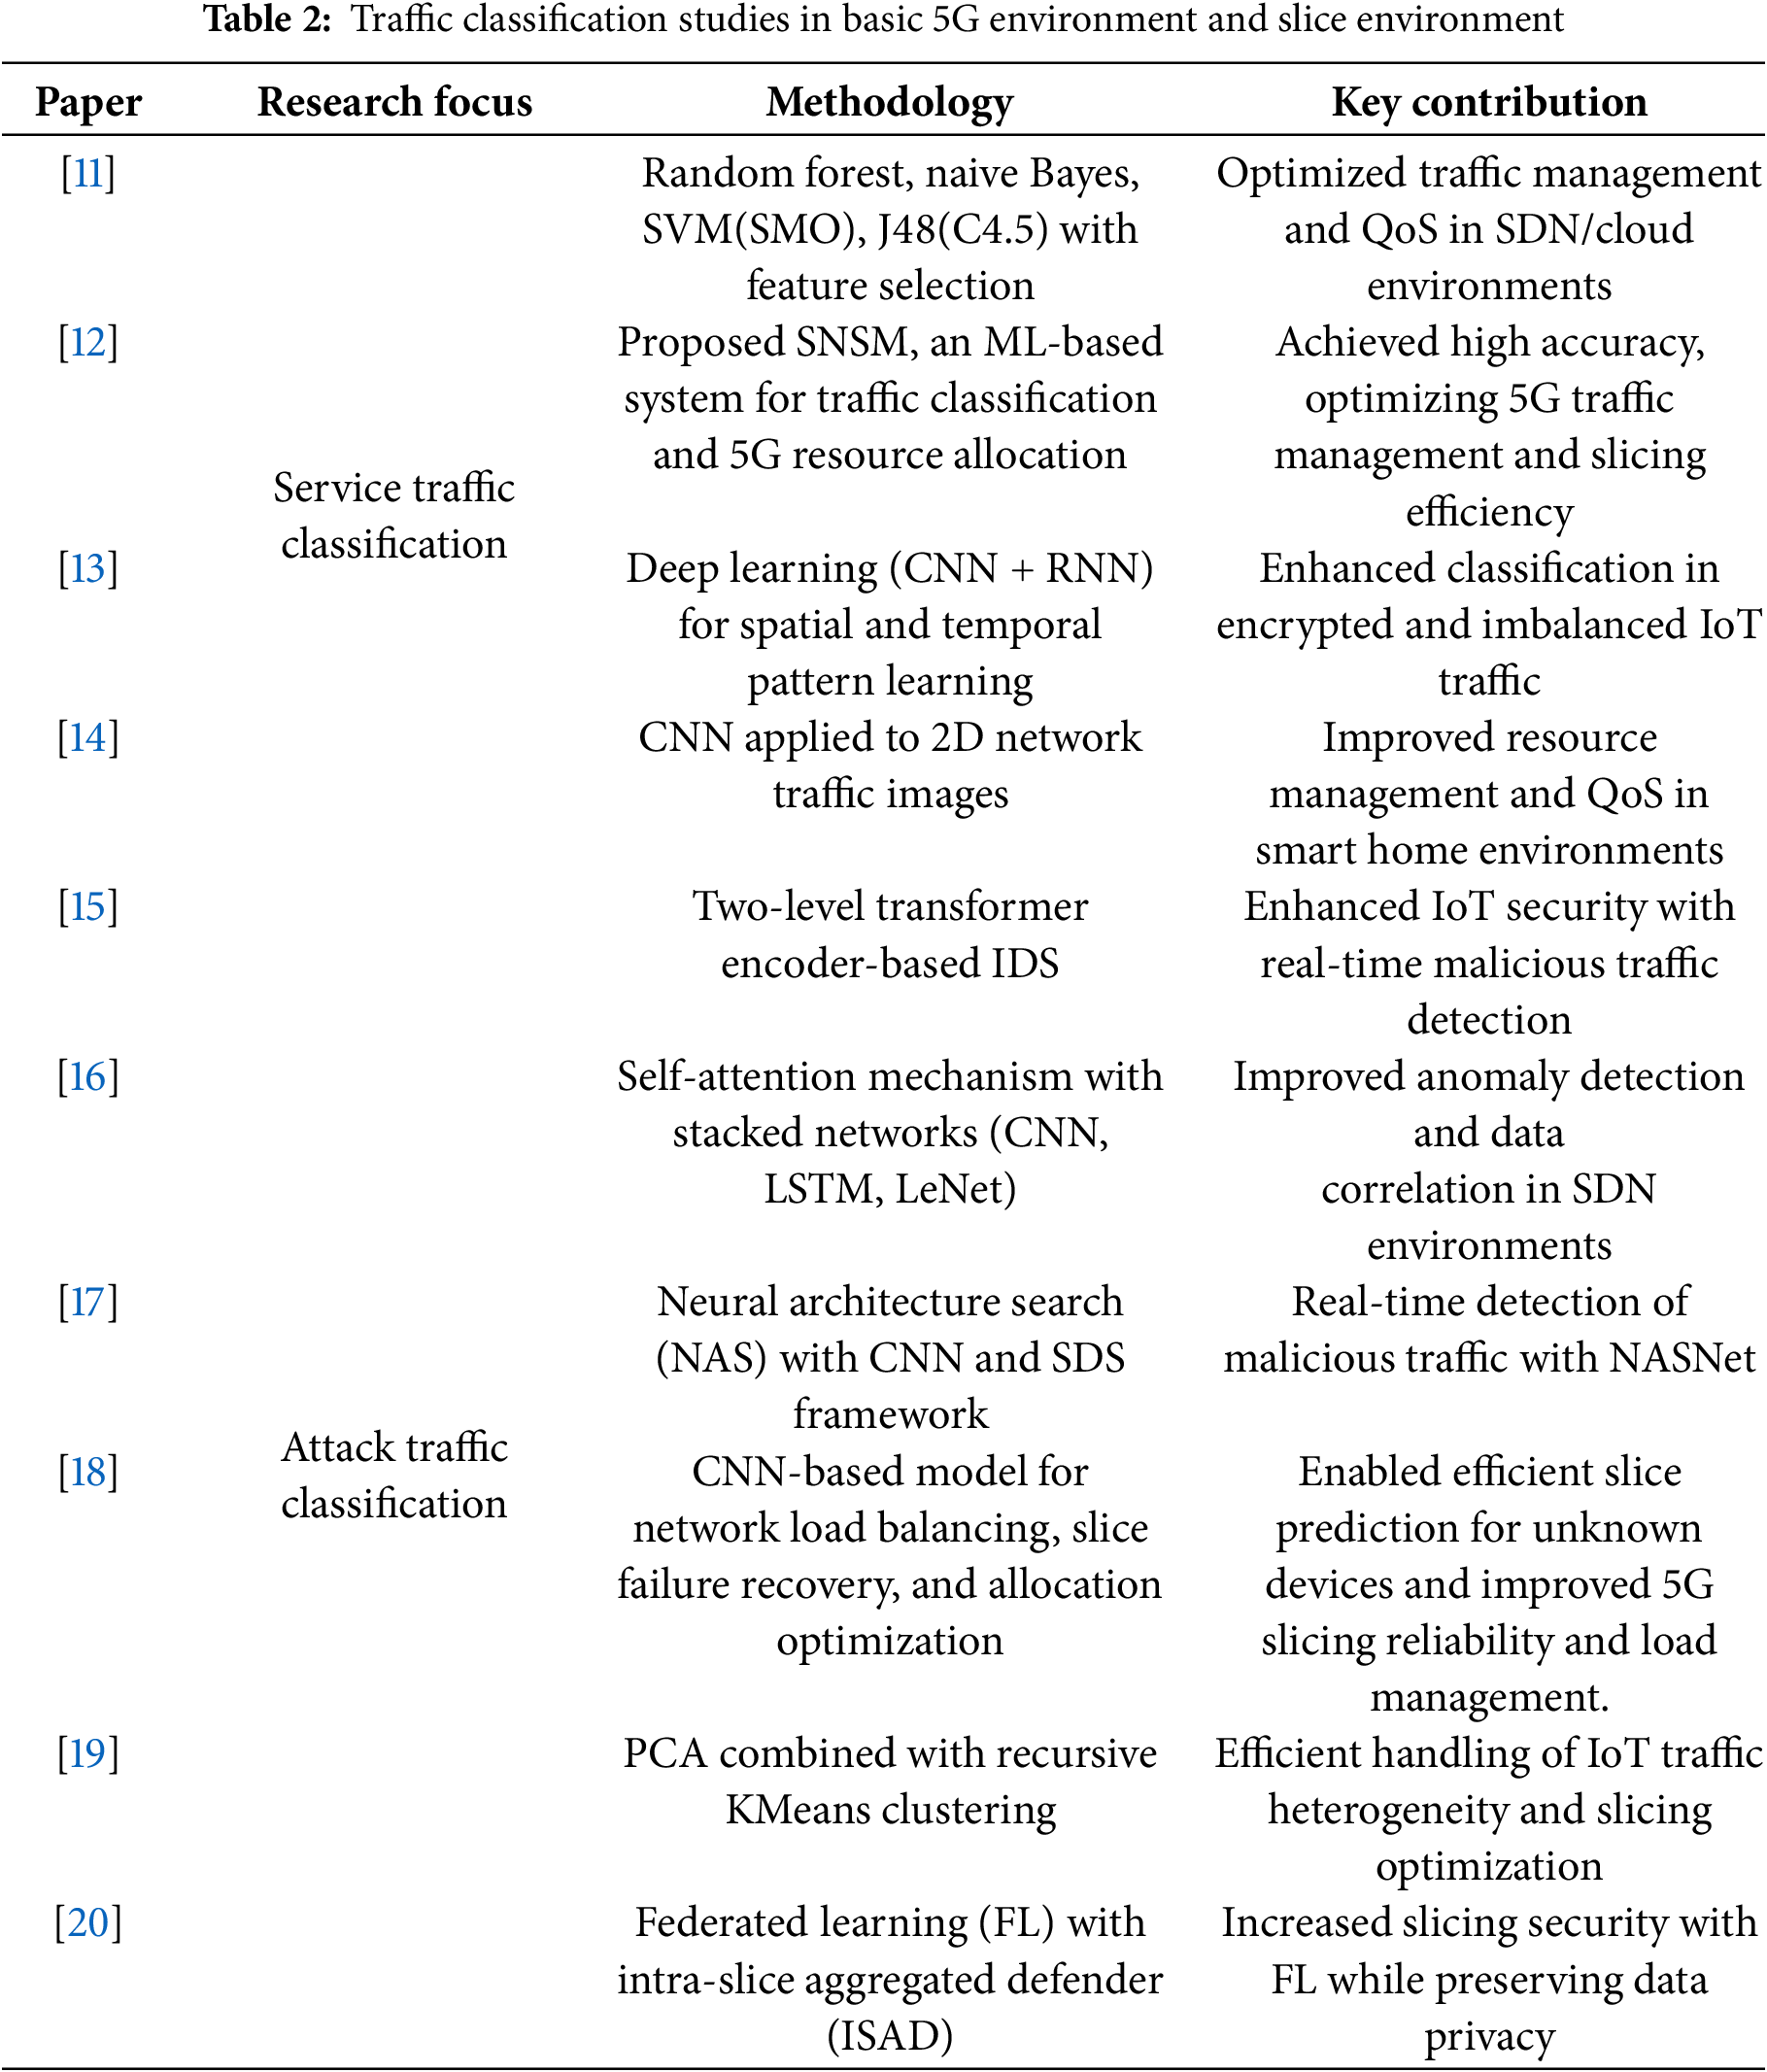
Service Traffic Classification. In software-defined networking (SDN) and cloud environments, reference [11] proposed a model that employs machine learning algorithms, such as random forest, naive Bayes, support vector machine (SVM), sequential minimal optimization (SMO), and J48 (C4.5) to manage network traffic and improve QoS. Among these, random forest achieved the highest accuracy of approximately 97% by optimizing model performance through network feature selection. This approach enables efficient traffic analysis and network performance optimization in SDN/cloud environments.
According to [12], as 5G network traffic becomes increasingly diverse and complex, the authors proposed a machine learning-based classification and prediction system (SNSM) that uses statistical network flow characteristics to overcome the limitations of traditional port number and payload-based classification methods. The Random Forest model achieved the best performance, with an accuracy of 98.69%, an F1 score of 98.69%, and an Area Under the Curve (AUC) score of 99.99%. This performance is superior to that of decision trees and K-Nearest Neighbor (KNN) and far exceeds that of logistic regression and SVM. Through this approach, Internet Protocol (IP) traffic patterns can be analyzed more precisely, enabling efficient resource management and traffic allocation in 5G network slicing.
In internet of things (IoT) settings, reference [13] presented a model that classifies encrypted and diverse device traffic using deep learning techniques. By combining the convolutional neural network (CNN) and recurrent neural network (RNN) architectures to learn both spatial and temporal patterns, the model outperformed standalone CNNs, RNNs, and existing ML algorithms, achieving an accuracy of 96.32% and an F1 score of 95.74%. Notably, it maintained stable performance even in imbalanced data scenarios, significantly improving the efficiency of IoT network services and application classification.
In the smart home context, reference [14] proposed a model that converts network traffic into 2D images and applies a CNN for classification. This model achieved 98.5% accuracy, outperforming conventional machine learning algorithms. Through this approach, resource management and QoS among smart home devices in 5G networks can be optimized, greatly enhancing network stability.
Attack Traffic Classification. To detect intrusions at the control-plane level, reference [15] proposed an intrusion detection system (IDS) that analyzes both internet protocol (IP) and non-IP traffic in real time. This model duplicates and analyzes the control plane data using a transformer encoder. This two-level transformer encoder-based deep learning approach achieved an accuracy of 89.0%, surpassing RNN and long short-term memory (LSTM) models. This effectively reinforces malicious traffic detection and IoT security in 5G environments.
To address abnormal traffic detection in SDN-based networks, reference [16] proposed the stacking method and self-attention mechanism (TSMASAM), which is a model that integrates a self-attention mechanism with a stacked ensemble network (CNN, LSTM, LeNet). On the InSDN dataset, the model recorded a precision of 99.72%, recall of 99.96%, and F1 Score of 99.84%, surpassing existing algorithms. Its strong ability to learn long-term dependencies makes it highly effective in detecting abnormal traffic and analyzing data correlations in SDN environments.
To counter increasing security threats, reference [17] employed a neural architecture search (NAS) to convert traffic data into images and analyze them using a CNN model. Through a software-defined security (SDS) framework, security policies can be updated automatically. The Neural Architecture Search Network (NASNet)-based model achieved a precision of 97.6%, recall of 96.4%, and F1 Score of 98.5%. Although NASNet showed a higher accuracy than Mobile Neural Architecture Search Network (MNasNet), the latter offers advantages in terms of processing speed. This approach supports real-time malicious traffic detection for each network slice, thereby enhancing the stability and security of 5G networks.
These studies collectively improved both traffic classification and security in 5G network environments, significantly boosting network performance and stability through environment-specific optimization strategies.
3.2 Attack Traffic Classification in Slicing Network
This subsection addresses the research on classifying attack traffic in 5G environments where network slices are configured. In contrast to general traffic classification, slicing networks require specialized techniques to manage isolated resources and enhance security.
Reference [18] proposed a CNN-based ‘DeepSlice’ model to improve network load efficiency and reliability in a 5G network slicing environment. DeepSlice performs network load management, slice failure handling, and slice prediction for unknown devices, and achieved a prediction accuracy of over 90.62% in cross-validation and 95% for unknown device types. Unlike previous studies, it attempts an original approach including terminals handling multiple service requests, load balancing, and slice failure prediction. It was confirmed that this can significantly improve the efficiency and reliability of 5G network slicing.
Reference [19] introduced a novel framework that combined principal component analysis (PCA) and K-means clustering algorithm (KMeans) clustering to tackle issues stemming from the heterogeneity of IoT traffic and insufficient labels in 5G network slicing. By applying a recursive KMeans algorithm along with the Hellinger distance, the framework reduces the initial 25 clusters to three, thereby achieving high interpretability and efficiency. This approach effectively handles heterogeneous IoT traffic and contributes to resource allocation and performance optimization in 5G network slicing.
Reference [20] proposed a federated learning (FL)-based approach called the intraslice aggregated defender (ISAD) to address cyberattacks and data privacy concerns in 5G network slicing. The model trains local models within each slice and aggregates them on a central server, thereby improving overall learning performance while preserving data privacy through distributed training. This model achieved over 99% accuracy in both binary and multiclass classifications, outperforming existing FL-based models.
Such studies contribute to enhancing the stability and security of 5G networks by enabling real-time detection and management of various types of attack traffic in network-slicing environments. Table 2 summarizes the core contents of related studies.
4 Attack Traffic Classification in Slice Network
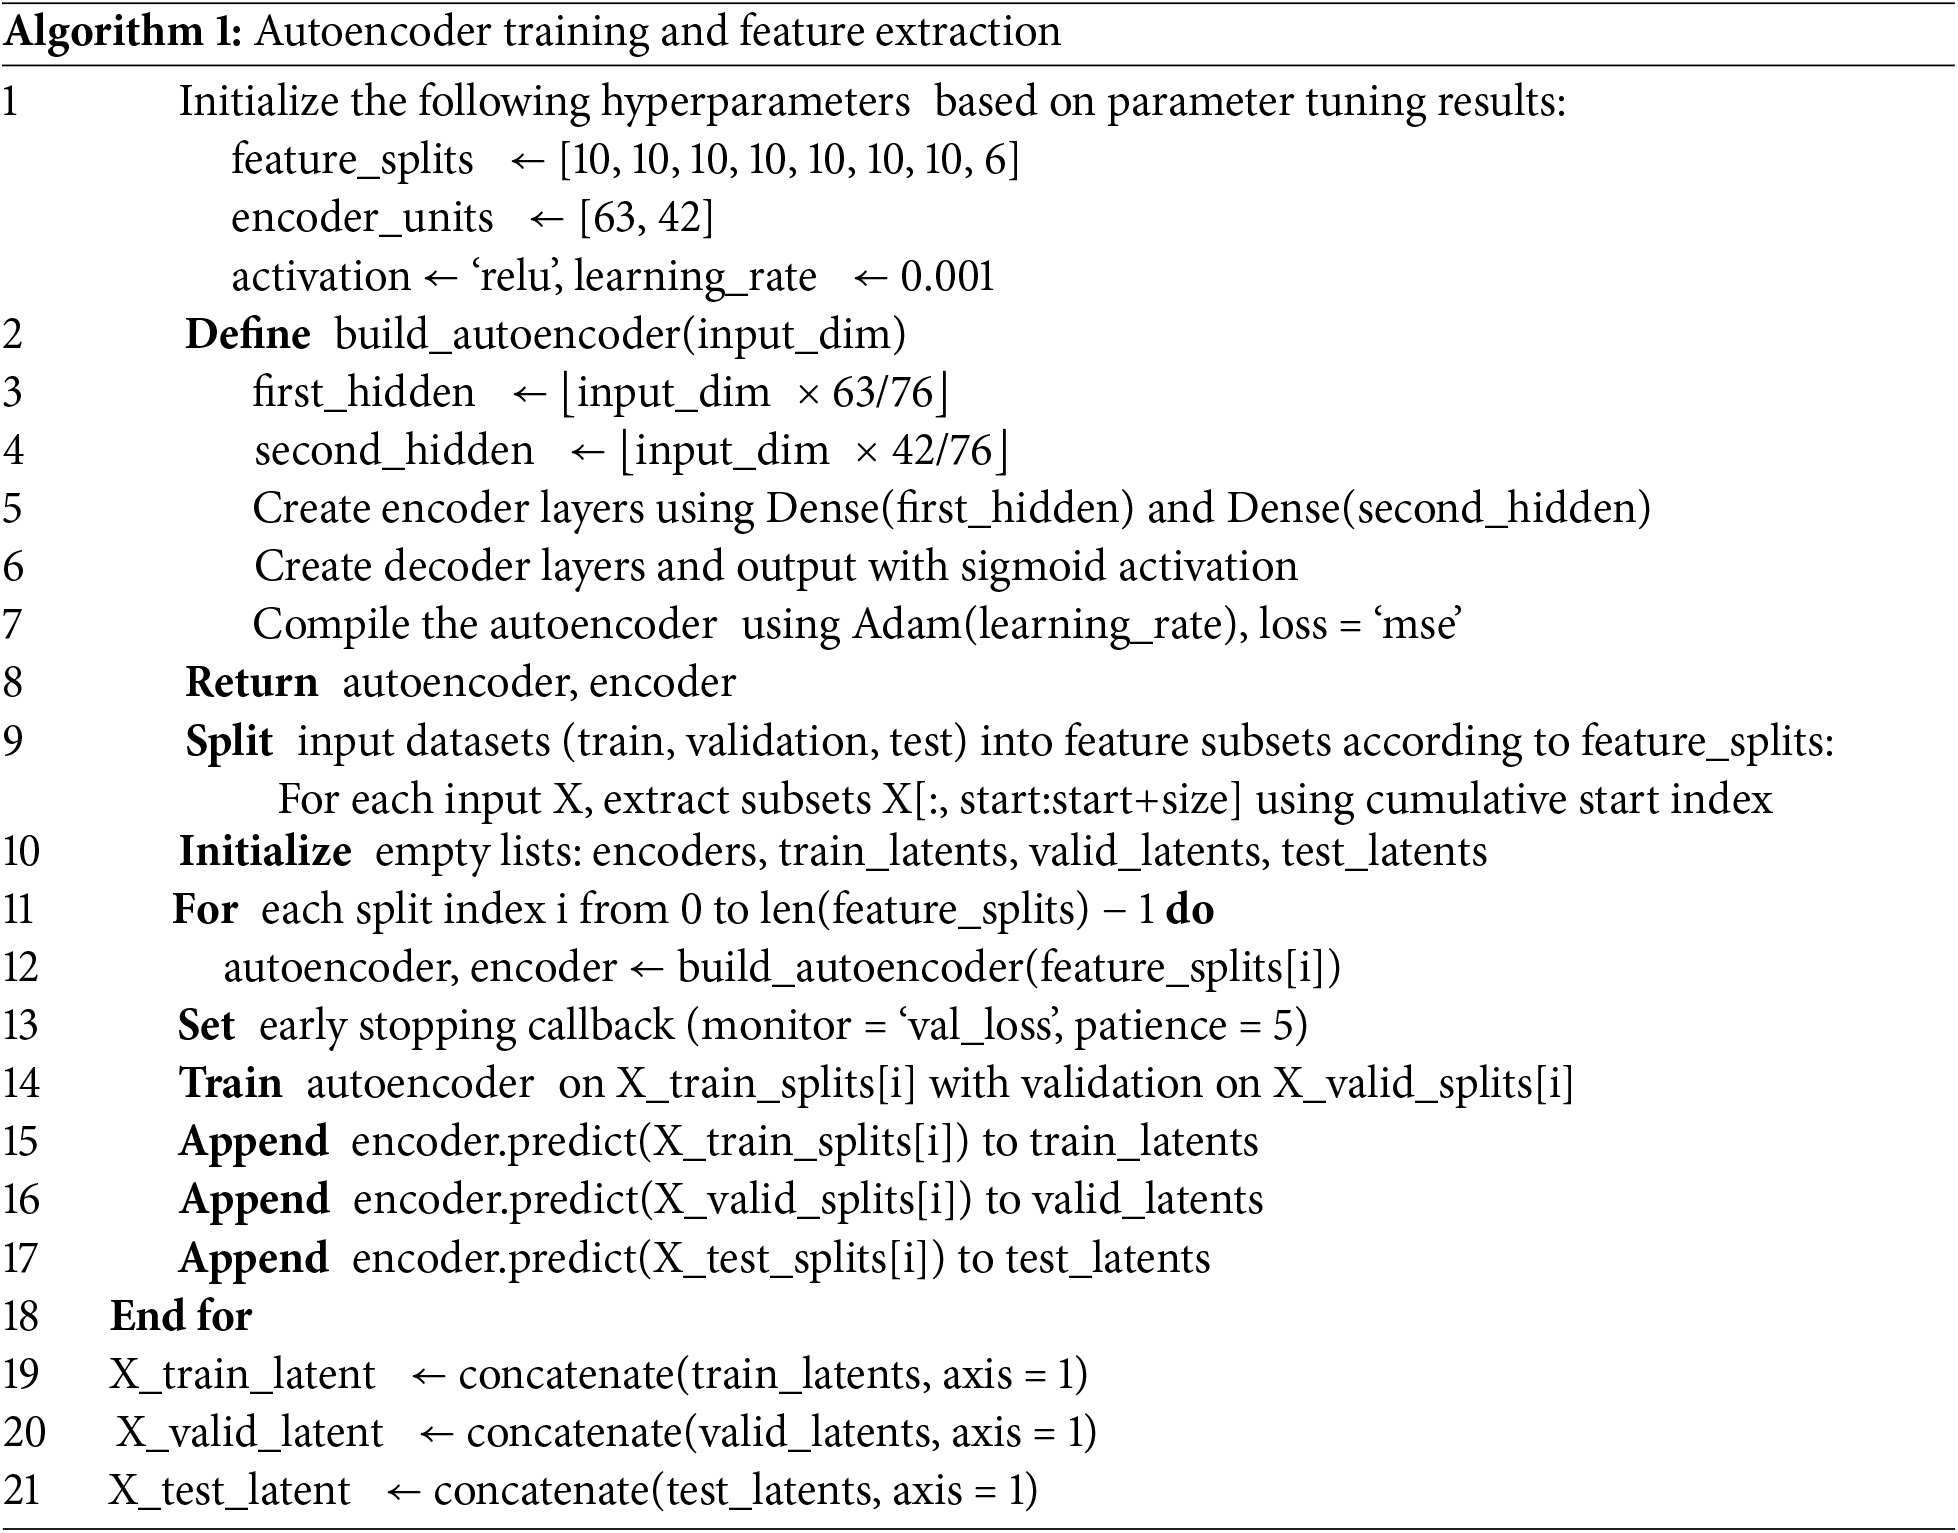
The structure of the proposed model is illustrated in Fig. 3. It comprises multiple decoders and a metadata classifier that employs the stacking ensemble technique. This model was designed to handle cases with a large number of features and operates in three main stages: AE training, feature extraction, and metadata prediction.
1. AE training: The data are divided into NNN columns, and an independent AE is trained for each segmented dataset.
2. Feature extraction: The segmented column data are compressed into lower-dimensional representations using the encoder of the trained AE for each segment.
3. Metadata prediction: The compressed data are stacked and input into the meta-data classifier for training and prediction.
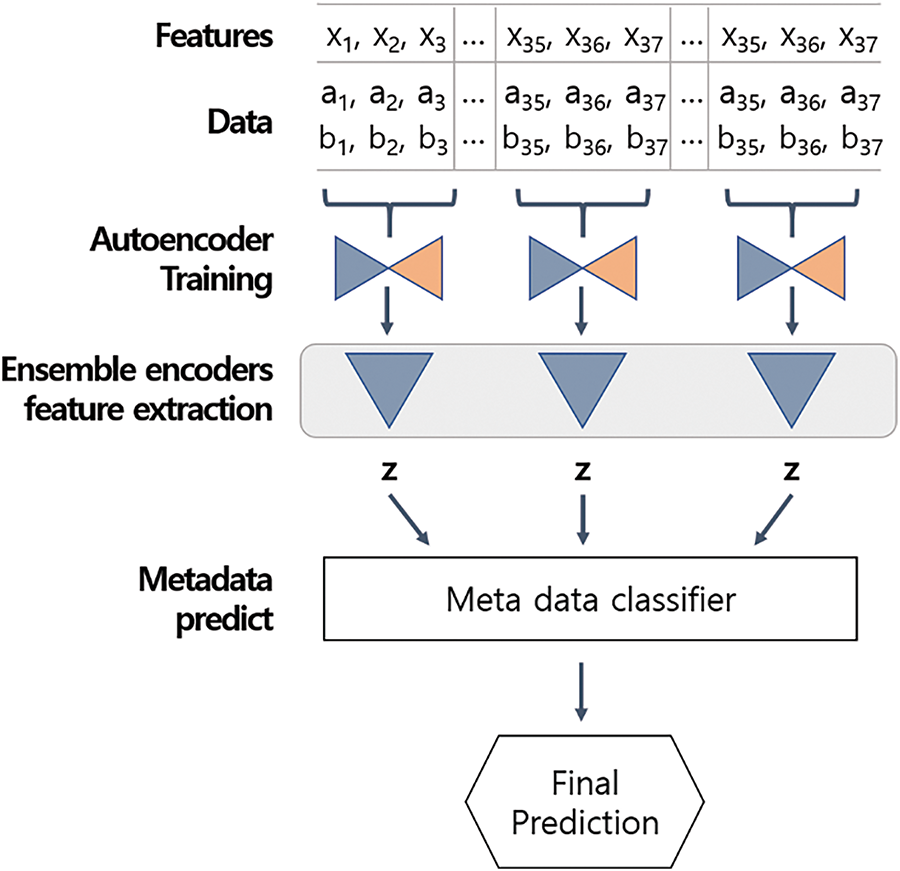
Figure 3: Proposed encoder ensemble based stacking model architecture
The process of feature extraction using multiple encoders and operation of the metadata classifier are elaborated on in Sections 4.2 and 4.3.
4.2 Feature Extraction with Simple Encoder Ensemble
The main concept of the proposed model is to perform feature extraction using an ensemble of autoencoders. Ensemble methods employ voting, bagging, boosting, or stacking. In this study, stacking was used to combine multiple AEs. The stacking method was selected because each AE encoder produces a latent vector that effectively captures the key information of the input data. By merging the latent vectors from several encoders, a newly processed dataset that highlights the main features of the original data is formed. As a result, the metamodel can leverage the training data formed by stacking the latent vectors from multiple encoders, which often results in better performance compared to directly feeding the original data to the metamodel. Fig. 4 shows the training and feature extraction of the ensemble model. Further details are provided in the following paragraphs.
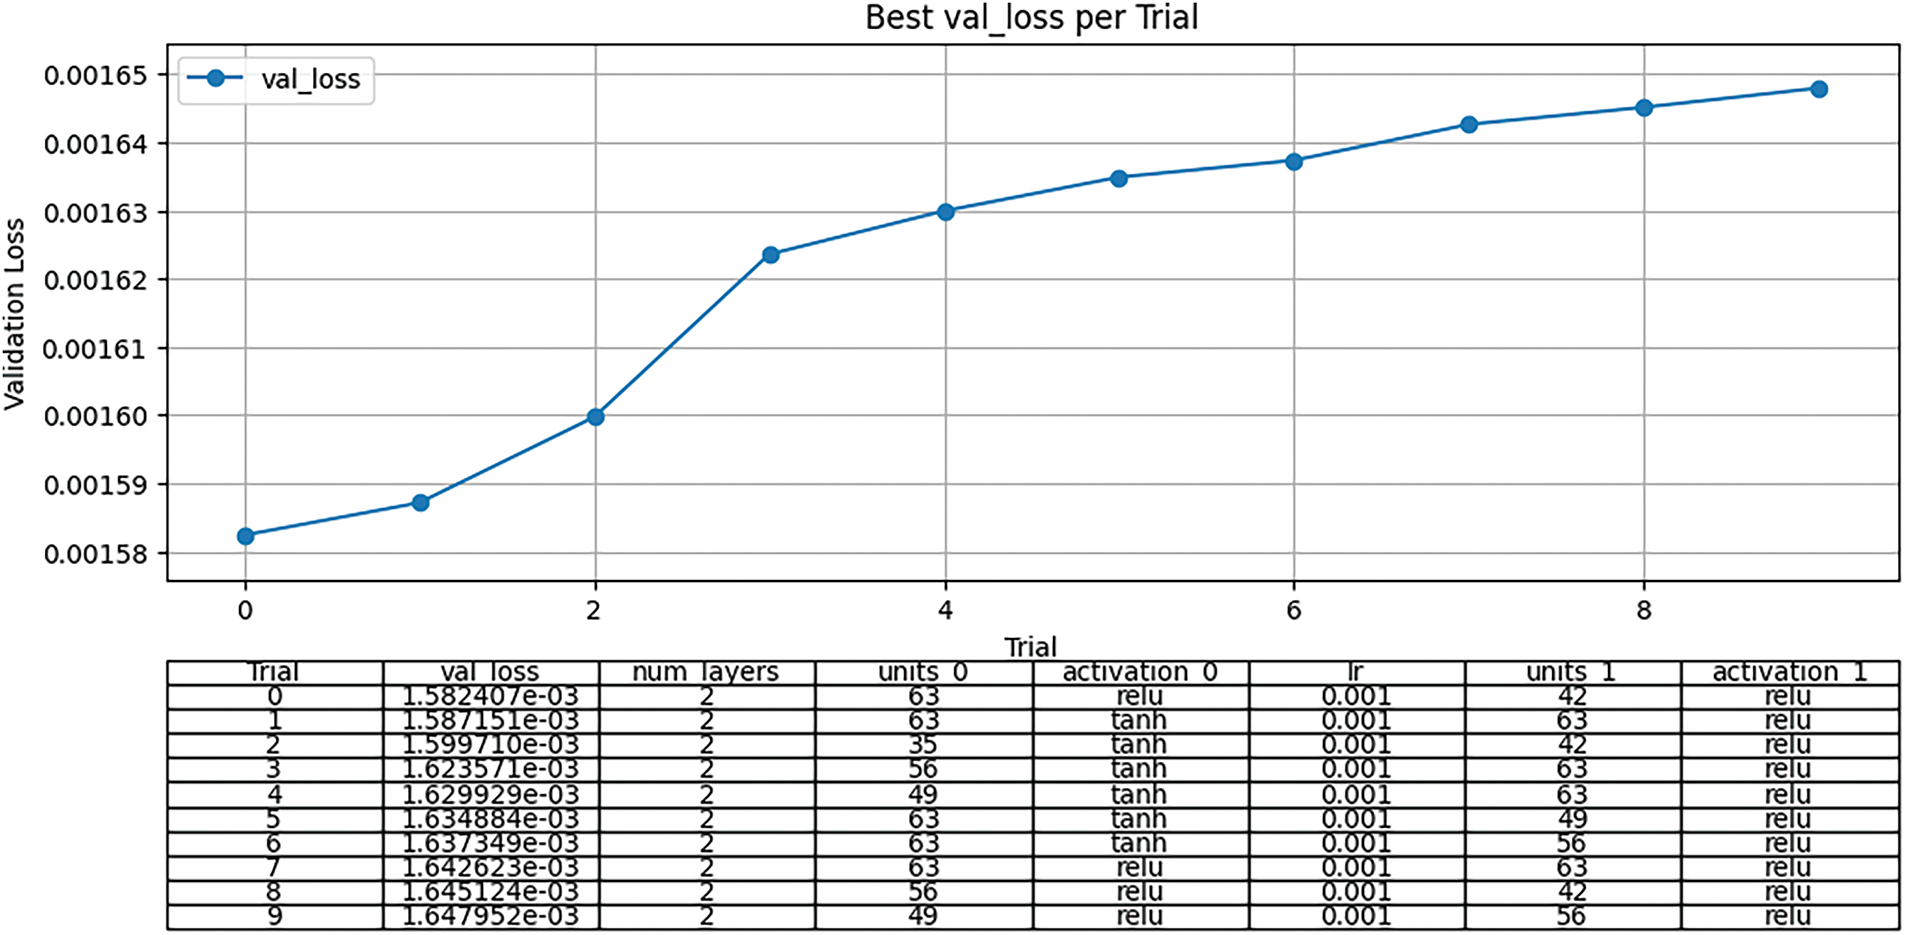
Figure 4: Autoencoder random search result
Autoencoder Design. The most important component of the proposed model is the encoder of the autoencoder. The encoder performs its role by compressing the input features. The latent vector generated through this compression process is a transformed representation of the input data into the most meaningful form.
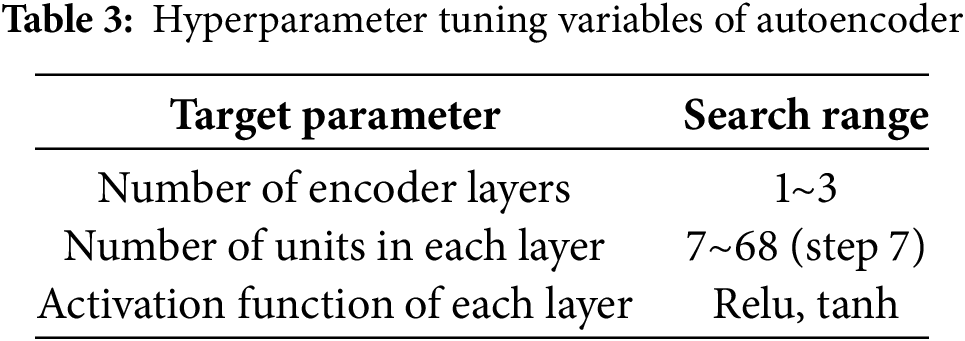
In this study, to design an encoder suitable for network data, hyperparameter tuning was conducted on various layer structures of autoencoders using the ‘Keras Tuner’ module.
The tuning was considered only for a single autoencoder prior to ensemble application and was performed under a class-balanced environment of the training data.
As shown in Table 3, the tuning considered variables such as the number of encoder layers, the number of units in each layer, and activation functions. Fixed parameters included the optimizer (Adam), learning rate (0.01), and the activation function of the output layer (sigmoid).
The total number of possible combinations for the tunable parameters was 6174. Considering the tuning time, this study performed 1543 random searches, which corresponds to one-fourth of the total combinations.
The Random Search was conducted to explore the optimal model configuration based on validation loss (reconstruction error). The top 10 configurations with the lowest validation loss were visualized in Fig. 4. The encoder architecture that resulted in the lowest validation loss—and was thus the most effective for extracting latent vectors was as follows:
• Number of encoder layers: 2
• Number of layer 1 units: 63
• activation function of layer 1: relu
• Number of layer 2 units: 42
• activation function of layer 2: relu
Finally, based on the above results, the layers of the autoencoders used in the ensemble were configured accordingly. However, since the input data dimension of each autoencoder in the ensemble is smaller than the input dimension (76) used during layer tuning, it is necessary to adjust the number of units in each layer to match the input dimension of the actual data.
During the ensemble process, the number of units in the first layer of the encoder is adjusted to the input dimension × (63/76), and the second layer is reduced to the input dimension × (42/76).
The autoencoder was trained using adaptive moment estimation (Adam) as the optimizer, and mean squared error (MSE) as the loss function, to minimize the difference between the input and reconstructed data. This design allows the autoencoder to learn the main features of the input data while removing unnecessary noise, thereby generating a compact representation.
Modular Learning Process. The input data were in table form and consisted of 76 columns. We split the data into eight subsets, such that each subset was learned by a separate autoencoder. The first seven subsets each had 10 columns, and the last subset comprised the remaining six columns. This approach helps reduce the complexity of individual autoencoders, making them lighter and more efficient to train. By limiting the number of features that each autoencoder must process, we minimize computational overhead and mitigate the risk of overfitting. This split also enables parallel learning, allowing multiple autoencoders to be trained simultaneously, improving overall training speed and scalability. This setup allowed each autoencoder to focus on a specific part of the data, thereby allowing it to learn the localized features more effectively. A separate autoencoder was created for each subset, and each subset was trained for 30 epochs with a batch size of 32. We used early stopping to prevent overfitting and monitored the training process using validation data. The early stopping settings were set to monitor = ‘val_loss’, patience = 5, and restore_best_weights = True. After training, the encoder part of each autoencoder was saved in the feature extraction stage. A record of the training history was maintained for performance analysis and comparison.
Feature Extraction. A process was designed to extract new features from the input data using the trained autoencoders, whereby each autoencoder’s encoder takes its assigned subset of input data and produces a hidden representation, which is a compressed feature vector that captures the local characteristics of that subset. This process is conducted independently for each subset, creating eight hidden representations. These hidden representations are then combined along their respective axes to form the final feature vector. This final vector maintains both the local features and overall patterns in the data, providing a compact representation that significantly reduces dimensionality while retaining essential information. This feature vector can then be used as the input for further analysis or prediction.
Advantages of the Model. The proposed model offers several important benefits, particularly for high-dimensional data. First, splitting data into separate parts enables parallel training, which accelerates the learning process. Second, by learning the local features within each subset and merging them, the entire data structure can be captured in an efficient way to represent information without losing important details. Third, because each autoencoder is trained independently, the model is flexible and can adapt when the data structure changes or dimensionality increases. Finally, by using early stopping and validation data, overfitting can be avoided, to maintain a strong generalization performance.
The model creation and learning process for modular learning and feature extraction is as shown in the pseudocode of Algorithm 1 below.
The metadata classifier, which is the final component of the proposed system, conducts training and prediction using as input the latent variables generated by the AE encoders. Various models can be employed as the classifier, including ML and DL algorithms.
In this study, we used SVM as the metadata classifier. In particular, SVM with kernel methods excel in identifying nonlinear decision boundaries, which is advantageous when dealing with high-dimensional data in classification tasks. In addition, SVM is relatively insensitive to outliers, which helps guard against the occasional anomalous traffic. These characteristics enable the SVM to achieve high classification performance. Furthermore, its strong generalization ability prevents overfitting and ensures minimal performance degradation when predicting new unseen data. However, the principal drawback of SVM is its computational cost, which increases significantly as the dimensionality of the feature space increases, necessitating control of the feature dimension through the encoder of the AE.
The dataset used for the experiments was “DDoS Datasets 2022,” which has been made publicly available on GitLab by the authors of [21]. This dataset was generated by configuring two 5G network slices using the open-source tools “Free5GC” and “UERANSIM.” As listed in Table 4, it consists of 5 attack traffics and 1 normal traffic. At this time, the normal traffic was collected by slice. The biggest reason for selecting this dataset was that data was collected in a 5G network slice environment. In addition, it was judged to be suitable for the research purpose because attack traffic was collected using various attack tools in a slice environment that was built directly.
Collection Environment. The 5G core was set up using the Free5GC open-source software, and six UEs were connected using the UERANSIM open-source tool. Among the six UEs, four conducted attacks on Slice 1, whereas the remaining two exhibited normal behavior in both Slices 1 and 2. The attack traffic was generated using the hping3 tool, and all traffic was captured using Wireshark.
File Format. The dataset is provided in both packet capture (PCAP) and CSV formats. It includes five files containing attack traffic collected from Slice 1 and two files containing normal traffic: one from Slice 1 and the other from Slice 2.
Features. The data were converted into 84 flow features applying CICFlowMeter [22] to the traffic information within the PCAP files.
In this study, only the data from Slice 1 were used. This dataset included five files on attack traffic and one file on normal traffic.
Two experiments were conducted using the same dataset. However, the method of splitting the dataset for training and evaluating the AI models differed between the two experiments. In both experiments, to prevent experimental bias, features that are prone to data bias during the model learning process, such as ‘Src IP’, ‘Src Port’, ‘Dst IP’, ‘Dst Port’, ‘Protocol’, and ‘Flow ID’, were excluded.
Because a class imbalance in the dataset can influence the training, evaluation, and results of the model, a comparison was conducted on the two different splitting conditions. The following sections provide a detailed explanation on the dataset splitting and experimental procedures for each experiment.
Environment. All experiments were conducted on a PC equipped with an Intel Core i9-10980XE CPU, 128 GB RAM, and an NVIDIA GeForce RTX 3090 24 GB GPU. Furthermore, for evaluating the performance of the anomaly detection model, we utilized metrics such as Confusion Metrics, precision-recall curve, and F1-score.
Experiment 1 setup. Experiment 1 was designed to evaluate the training and performance of the AI model on class balanced training data. Initially, the attack and normal data were subjected to preprocessing consisting of three main steps: shuffling, imputation, and scaling.
1. Shuffling: This step involves randomly shuffling the data before splitting it.
2. Imputation: If the data contained missing values or infinite numbers (e.g., np, inf), they were replaced with other values. None of the missing values (None) were imputed using the mean value of the corresponding column. Values such as np.inf were replaced with the maximum value of the column, and -np.inf indicates replacement with the minimum value.
3. Scaling: To make the data more suitable for AI model training, the value range of the data was scaled to between (0, 1) using the MinMaxScaler.
A total of 50,000 attack data points from five different attack types and 10,000 normal data points were split into training, validation, and test datasets in a 70:15:15 ratio to ensure class balance, as in Fig. 5.
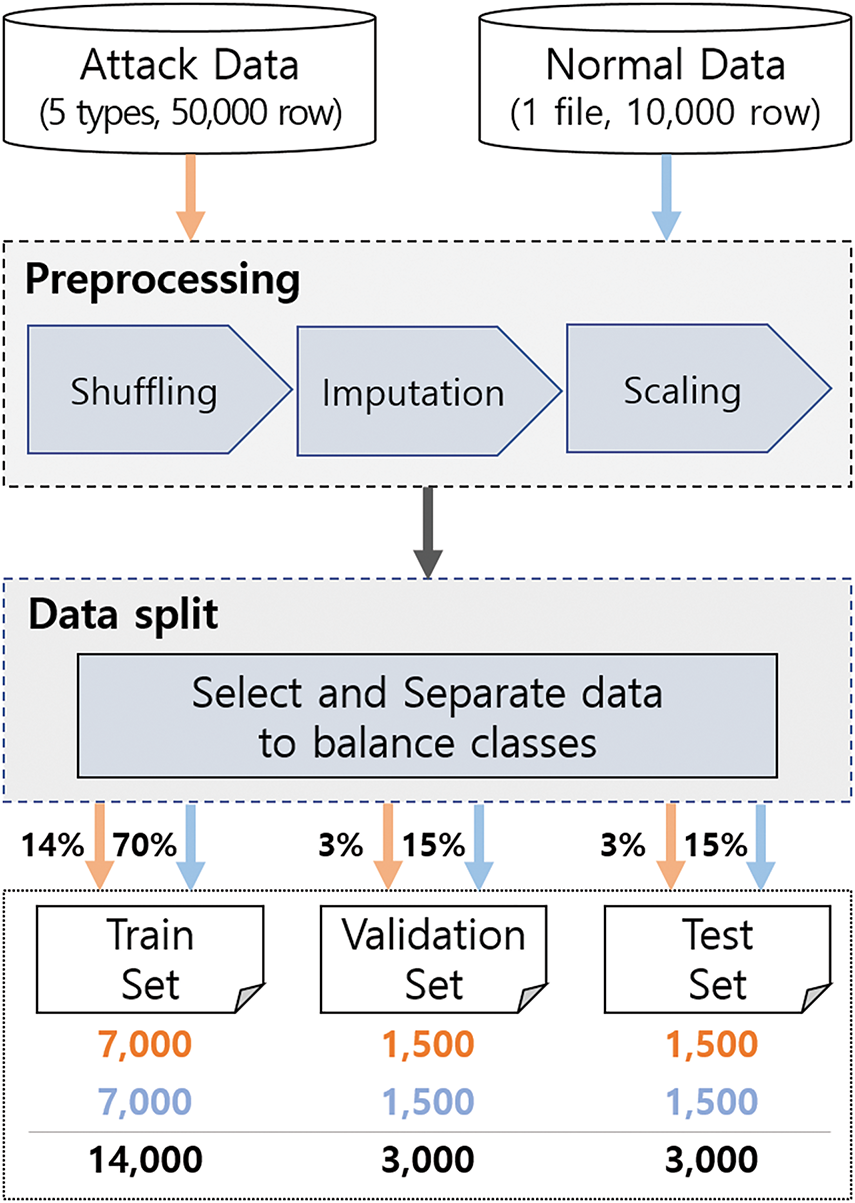
Figure 5: Experiment 1 setup on balanced data
In the training dataset, 7000 attack and 7000 normal data points were sampled, resulting in a total of 14,000 data points. The attack data were evenly distributed across five attack types, with 1400 samples for each type.
Similarly, the validation and test datasets were each composed of 1500 attack data points and 1500 normal data points, resulting in 3000 data points per dataset. The attack data in these datasets were evenly distributed, with 300 samples for each attack type.
Experiment 2 setup. Experiment 2 was designed to evaluate the training and performance of the AI model in scenarios with imbalanced training data, unlike Experiment 1. The pre-processing steps before data splitting, including shuffling, missing value imputation, and scaling, were the same as those in Experiment 1.
In this experiment, three datasets with different class imbalance ratios were constructed to investigate the model’s robustness under varying conditions. The datasets were organized as follows:
• A 60:40 dataset, consisting of 15,000 attack samples and 10,000 normal samples (total 25,000 samples).
• A 70:30 dataset, consisting of 23,333 attack samples and 10,000 normal samples (total 33,333 samples).
• An 80:20 dataset, consisting of 40,000 attack samples and 10,000 normal samples (total 50,000 samples).
Each dataset was further split into training, validation, and test sets at a 70:15:15 ratio, as illustrated in Fig. 6. Specifically, the 60:40 dataset was divided into 17,500 training samples, 3750 validation samples, and 3750 test samples. The 70:30 dataset was divided into 23,333 training samples, 5000 validation samples, and 5000 test samples. The 80:20 dataset was divided into 35,000 training samples, 7500 validation samples, and 7500 test samples.
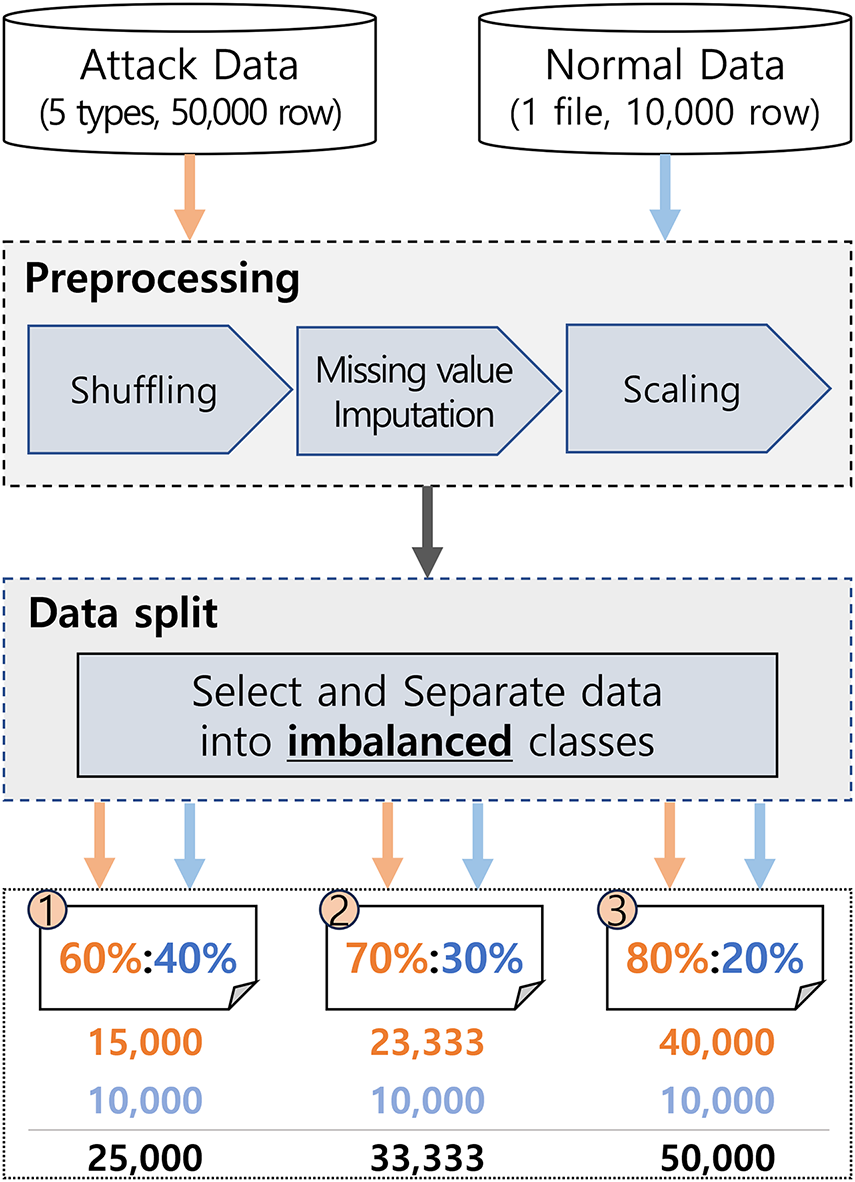
Figure 6: Experiment 2 setup on imbalanced data
In all datasets, attack samples were evenly distributed across five different attack types to ensure a balanced representation within the attack class.
The experimental results of the deep-learning model employed in the proposed approach can be represented using a confusion matrix, to distinguish between four categories: true positive (TP), false positive (FP), false negative (FN), and true negative (TN), which are used to evaluate accuracy, precision, recall, and F1 score.
Accuracy indicates the rate at which the model correctly classifies normal and attack traffic in the entire traffic, but it may be difficult to utilize it alone in security problems where class imbalance exists. Therefore, in this study, precision and recall were analyzed together.
Precision indicates the rate of actual attacks among detected attacks, which plays an important role in minimizing unnecessary blocking of normal users (false positives).
On the other hand, recall indicates the rate at which actual attacks were detected, and is essential in scenarios such as DDoS attack detection where reducing false negatives is important.
In this study, the F1-score was used to evaluate the actual security performance of the model to consider the balance between these two indicators. A high F1-score indicates that it can provide stable detection performance in a network operation environment, and it proves that the AI-based security model proposed in this study is effective in strengthening the security of 5G slicing networks. Accuracy, precision, recall, and F1-score used in this study are key indicators for evaluating the security performance of detecting malicious traffic in 5G slicing networks. In particular, an important factor in a security system is minimizing false negatives (FN) and false positives (FP).
5.4 Experiment 1. Binary Classification of Attack Traffic with Balanced Data
Experiment 1 involved binary classification for balanced class proportions (normal vs. attack) in the training, validation, and test datasets. The dataset contained 76 features and eight AEs, of which seven were trained on subsets of ten features each in sequential order, and the remaining AE was trained on the final six features.
Because the dataset was class-balanced, the decision threshold of the model was not adjusted, and a default value of 0.5 was used. Experiment 1 was conducted as follows.
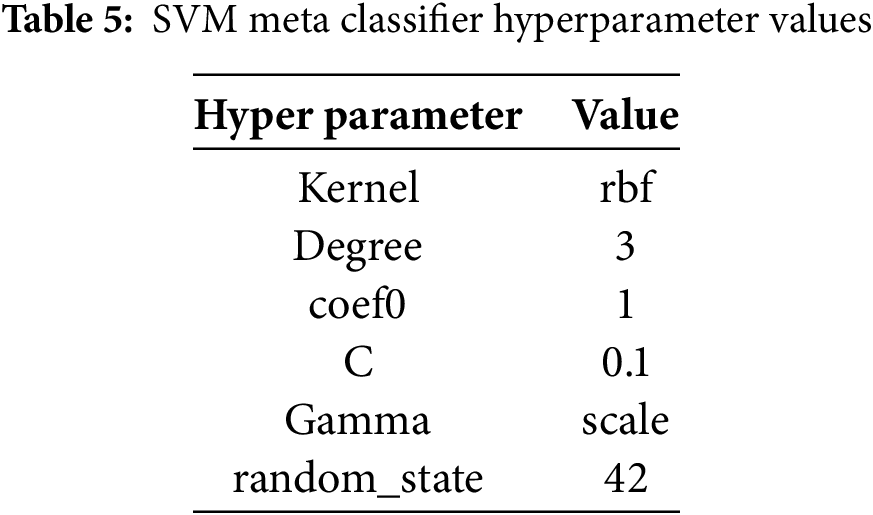
1. Training and Validation Phase: The dataset was split, as shown in Fig. 5, to obtain the training and validation sets. The training set included 7000 samples of malicious and 7000 samples of normal data. The validation set comprised 1500 samples of malicious and 1500 samples of normal data. The hyperparameters of the SVM metadata classifier are listed in Table 5. The hyperparameters of SVM were determined through grid search. For the kernel parameter, grid search selected ‘rbf’ among ‘linear’, ‘poly’, and ‘rbf’. For the C parameter, 0.1 was selected among ‘0.1, 1, 10’, and for the gamma parameter, ‘scale’ was selected among ‘scale’, 0.01, and 0.001. For the coef0 parameter, the default value of ‘0.0’ was used. In addition, the threshold that maximizes the F1-score is selected based on the precision-recall curve using the validation dataset.
2. Prediction Phase: The SVM meta-classifier performed binary classification predictions on the test set, using a default threshold of 0.5.
3. Performance Evaluation Phase: The SVM meta-classifier performed binary classification predictions on the test set using the best threshold determined during the validation phase.
In the validation dataset, the best threshold, which maximized the F1-score by minimizing the trade-off between precision and recall, was found to be −0.6814. This threshold was applied to the meta-classifier for performance evaluation.
The performance values obtained from the experimental results are listed in Table 6. In the validation set, the accuracy was approximately 0.8953; precision was 0.9893; recall was 0.7993; the F1-score was 0.8842; and AUC was 0.8899.
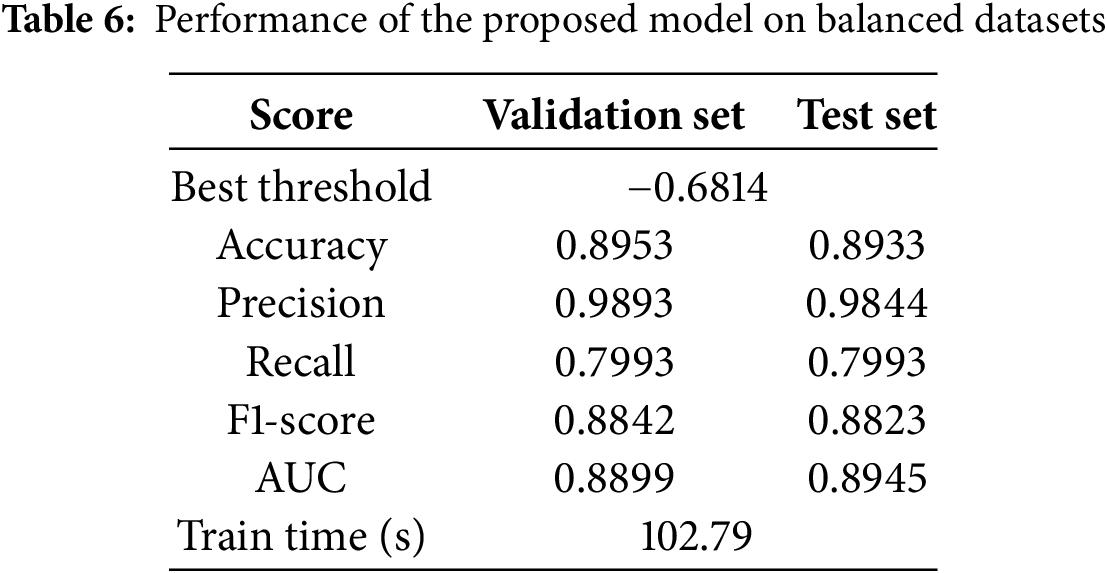
In the test set, the accuracy slightly decreased by 0.22% to approximately 0.8933, precision decreased by 0.5% to 0.9844, recall remained the same at 0.7993, and the F1-score decreased by 0.21% to 0.8823. In contrast, the AUC increased by 0.52% to 0.8945.
This pattern an increase in AUC while other performance metrics decrease—is a normal occurrence. AUC reflects the model’s overall classification capability, whereas the other metrics represent performance at a specific threshold. Therefore, even if AUC improves, other metrics may decline depending on the threshold used.
Additionally, the training time for the ensemble model (AE + SVM) was 102.79 s.
The area under the Receiver Operating Characteristic (ROC) curve was 0.8945 (Fig. 7). The closer AUC is to 1, the better is the classification performance of the model for these data.
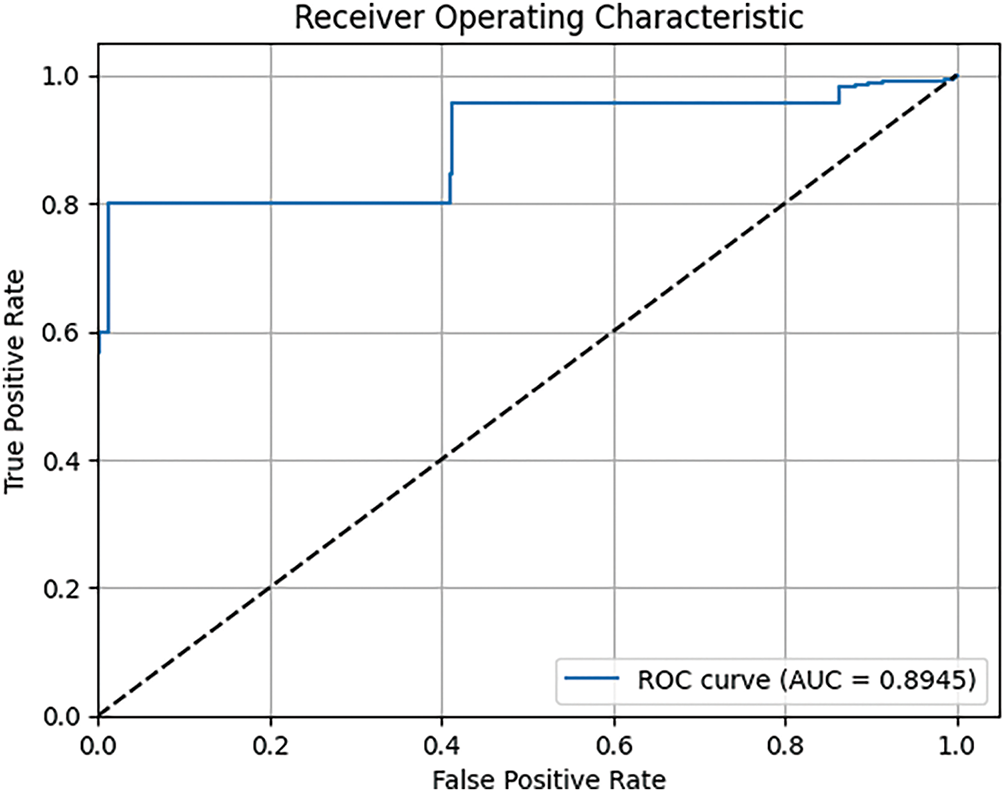
Figure 7: ROC curve of the proposed model on a balanced dataset
5.5 Experiment 2. Binary Classification of Attack Traffic with Imbalanced Data
Experiment 2 evaluated the classification performance of attack traffic under imbalanced conditions, using attack-to-normal data ratios of 6:4, 7:3, and 8:2. A total of three experiments were conducted on these imbalanced datasets. For each experiment, the hyperparameters of the meta-model (SVM) were determined using the same grid search method as in Experiment 1. As a result, the same set of hyperparameters was selected (Table 5).
Among the three imbalance ratios, the dataset with a 7:3 ratio between attack and normal data yielded the highest potential classification performance, with an AUC of 0.7408. Therefore, the model performance derived from this dataset is discussed in the main text as representative of imbalanced scenarios.
In the validation dataset, the best threshold that balanced precision and recall most effectively minimizing the trade-off between false negatives and false positives (i.e., maximizing the F1-score) was found to be 1.0000. This threshold was applied to the meta-classifier for performance evaluation.
The performance values obtained from the experimental results are listed in Table 7. In the validation set, the accuracy was approximately 0.7774, precision was 0.9207, recall was 0.7463, the F1-score was 0.8244, and AUC was 0.7348.
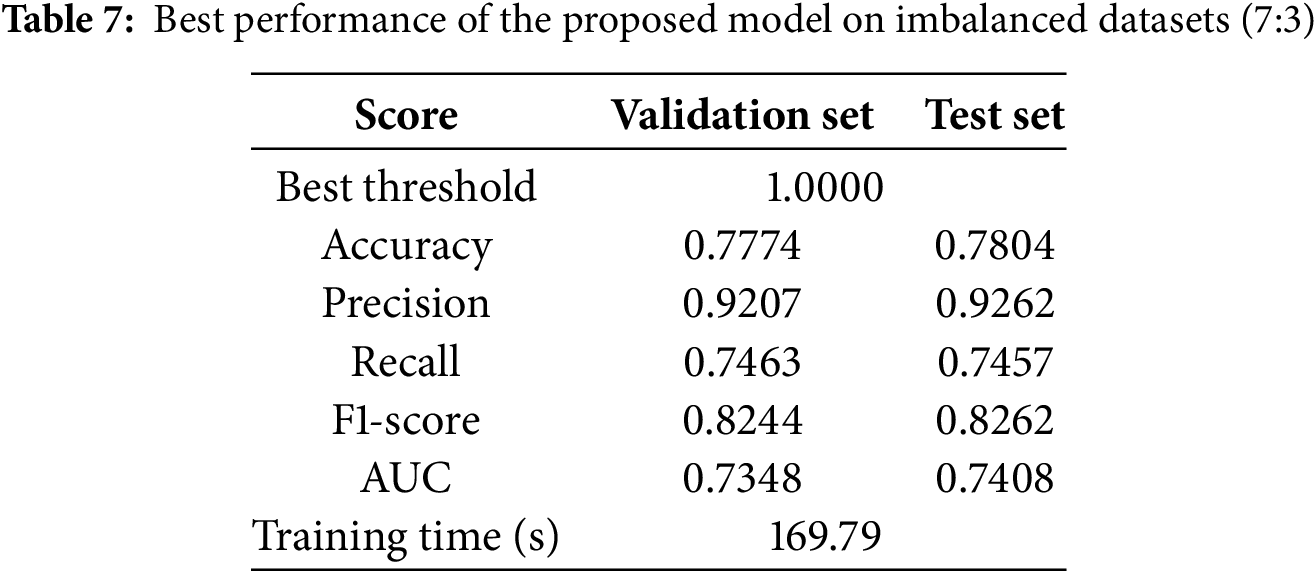
On the test set, accuracy increased by 0.39% to approximately 0.7804, precision decreased by 0.6% to 0.9262, recall increased by 0.08% to 0.7457, F1-score increased by 0.22% to 0.8262, and AUC increased by 0.82% to 0.7408. Additionally, the total training time for the ensemble model (AE + SVM) was 169.79 s.
As shown in Fig. 8, when various types (5 types) of attack data were uniformly increased in the training dataset at fixed proportions, the model’s classification performance declined compared to when the ratio of normal to attack data was balanced.
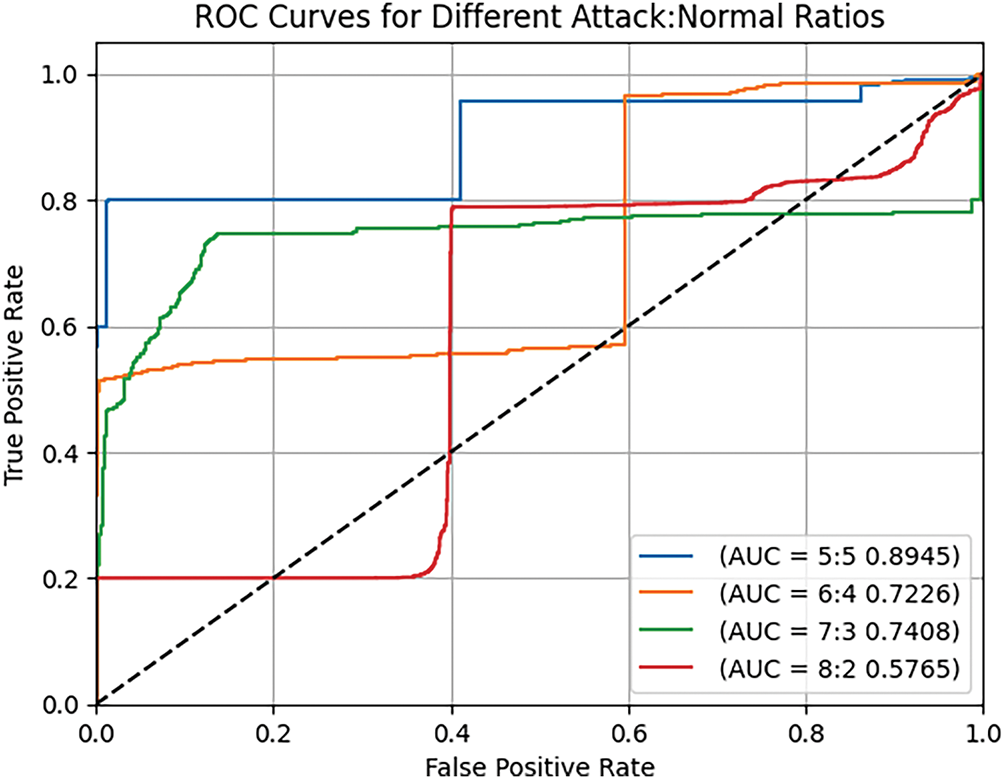
Figure 8: ROC curve of the proposed model on a imbalanced dataset (baseline 5:5)
6 Analysis of Experimental Results
A comparative analysis of the results on Experiments 1 and 2 was presented in Section 5 and is further discussed in this section. Fig. 9 presents a clustered bar chart showing the outcomes on the test sets for both experiments, with the blue bars representing the performance achieved with the class-balanced dataset (Experiment 1) and the red bars indicating the performance on the class-imbalanced dataset (Experiment 2).
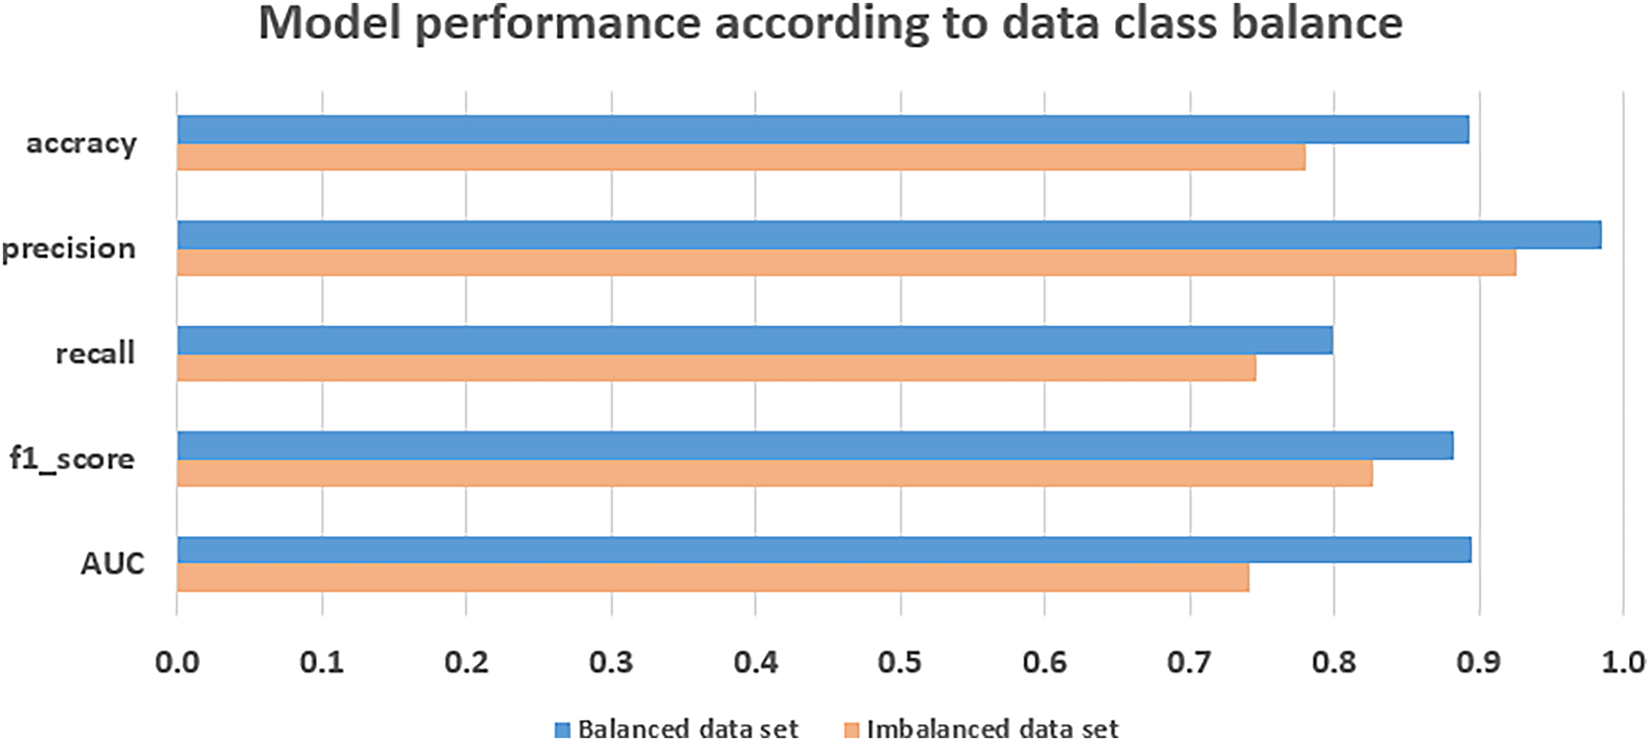
Figure 9: Comparision of model performance according to data class balance
Among the five-performance metrics, accuracy, precision, and AUC were higher for the class-balanced dataset. Specifically, the accuracy increased by 71% (from approximately 0.5003 to 0.8560); precision increased by 18% (from approximately 0.8334 to 0.9828); and AUC improved by 3% (from approximately 0.8334 to 0.8560). In contrast, the F1-score and recall were higher for the class-imbalanced conditions. The F1-score increased by 8% (from approximately 0.8342 to 0.9091) and recall increased by 28% (from approximately 0.7247 to 1.0). Comparing only the F1-score, the performance seems better when using a class-imbalanced dataset.
However, this is not the case for AUC. When a class-imbalanced dataset is used, the model predictions can be skewed toward one class, making precision and recall important metrics to pay close attention to. An 18% decrease in precision and 28% increase in recall were observed when using a class-imbalanced dataset compared to a class-balanced dataset, indicating that false positives increased and false negatives decreased. Furthermore, an AUC of 0.5 suggests that the model trained on the class-imbalanced dataset classifies the majority of samples as attack traffic. Experiment 2 aimed to sufficiently train various attack types, but it was confirmed that the model performed training biased toward attack traffic (bias toward attacks) due to the relative lack of information on normal traffic. As a result, the encoders used in the ensemble focused on attack data, which caused the data to be compressed, and normal data and attack data were not expressed in a balanced manner.
To solve this, it was found that a method of sampling attack data and adjusting the ratio with normal traffic, as in Experiment 1, is necessary. In Experiment 1, the model that adjusted the ratio of attack traffic recorded AUC 0.8560, showing better classification performance. This suggests that adjusting the data ratio so that attack and normal data are trained in harmony is an important factor in improving model performance.
Therefore, even if the total amount of data is not large, it is crucial to preprocess the dataset so that the classes are balanced, to achieve effective results with the proposed model.
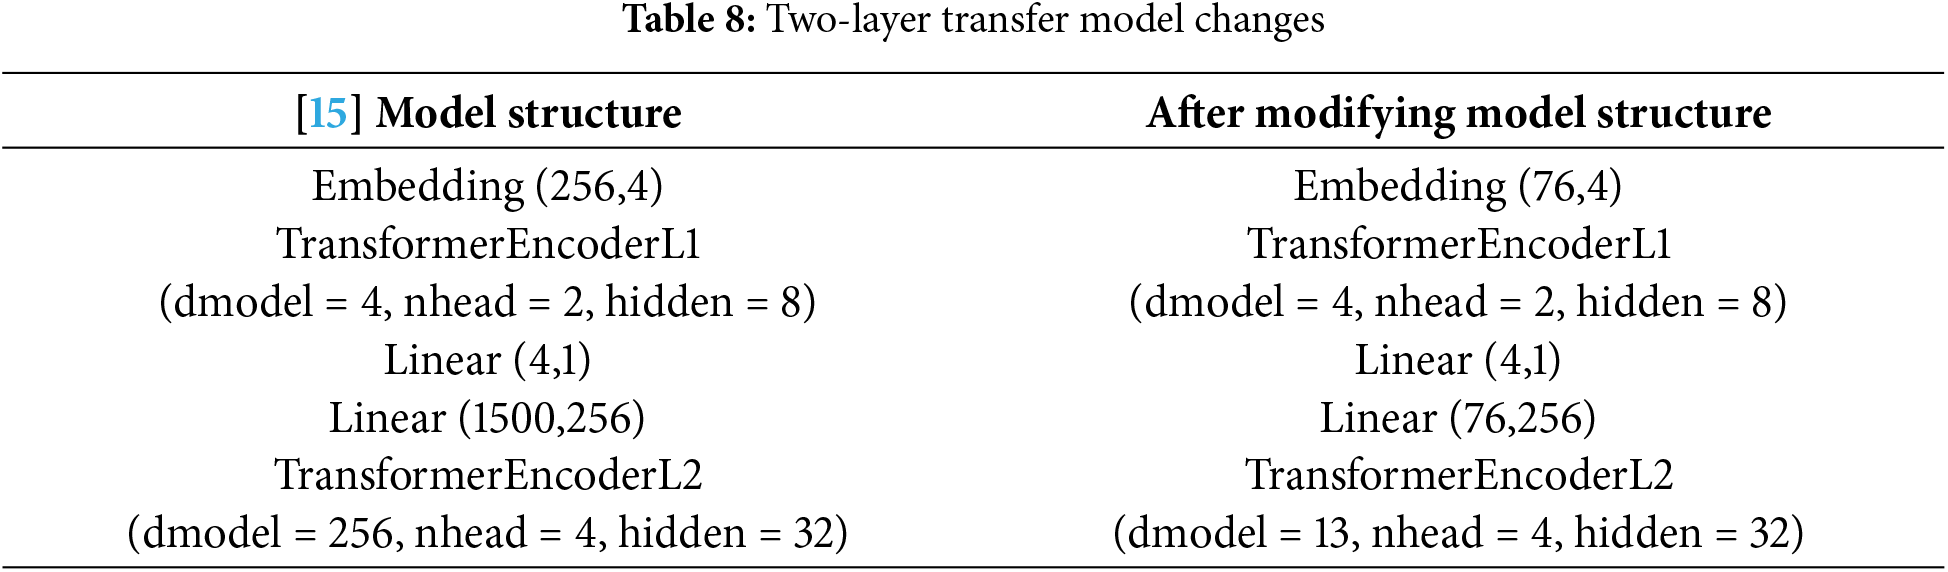
In this section, we compared the performance of the proposed model with those of competing approaches. Specifically, the two-layer transfer model proposed in [15] (referring to its pseudocode), was implemented. Note that the model in [15] was designed for multiclass classification and used 1500 features in the dataset.
However, the present study focuses on binary classification and only has 76 features in the dataset, necessitating modifications to the two-layer transfer model. Therefore, we scaled down the number of nodes of the two-layer transfer model to 0.0506 times the original and adjusted the output layer to perform binary classification. A scaling factor of 0.0506 was derived from the ratio of 76 features (in this study) to 1500 features (in [15]). Table 8 lists the details of these modifications.
The test-set prediction performance of the two-layer transfer model on the class-balanced dataset yielded an accuracy of approximately 0.5713, precision of approximately 0.5384, recall of 1.0, F1-score of 0.7, and AUC of approximately 0.6193. The AUC was calculated based on the ROC curve in Fig. 10.
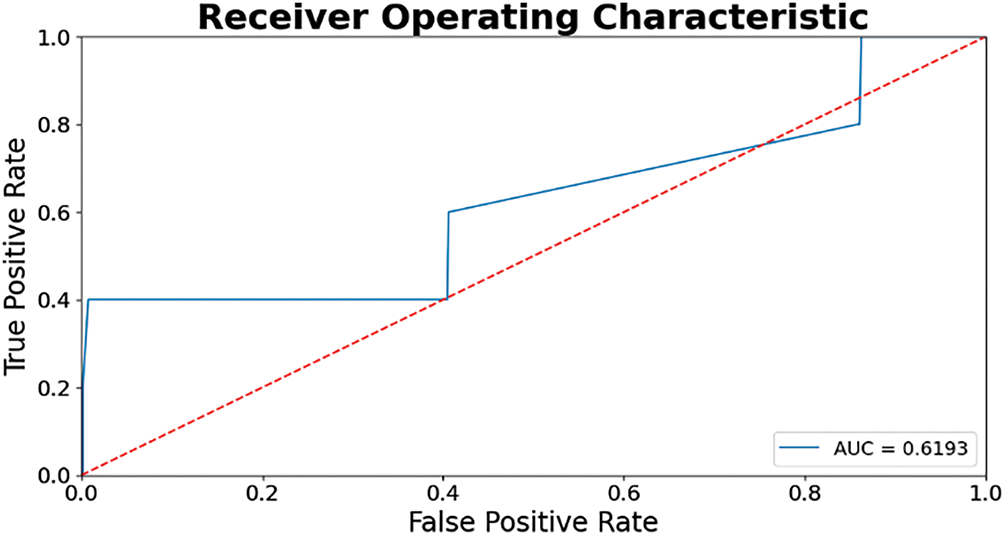
Figure 10: ROC curve of comparison model on class balanced data
When the performances of the two models are visualized in a bar chart, as shown in Fig. 11, the proposed model outperforms the comparison model in four out of five evaluation metrics: accuracy, precision, F1-score, and AUC. Specifically, the proposed model achieved approximately 1.5 times higher accuracy, 1.83 times higher precision, 1.19 times higher F1-score, and 1.38 times higher AUC than the comparison model. However, the recall value is approximately 0.72 times that of the comparison model, indicating lower recall performance. However, in terms of training time, the proposed model took approximately 102 s, whereas the comparison model required only about 10 s roughly one-tenth of the time. This difference is mainly due to the model complexity: the comparison model is a single model, while the proposed model is an ensemble model. Additionally, the SVM used as the meta-model in the proposed approach is a machine learning model rather than a deep learning model, and it does not utilize GPU acceleration. Instead, it relies on CPU-based computation, which does not benefit from fast parallel processing, likely contributing further to the increased training time.
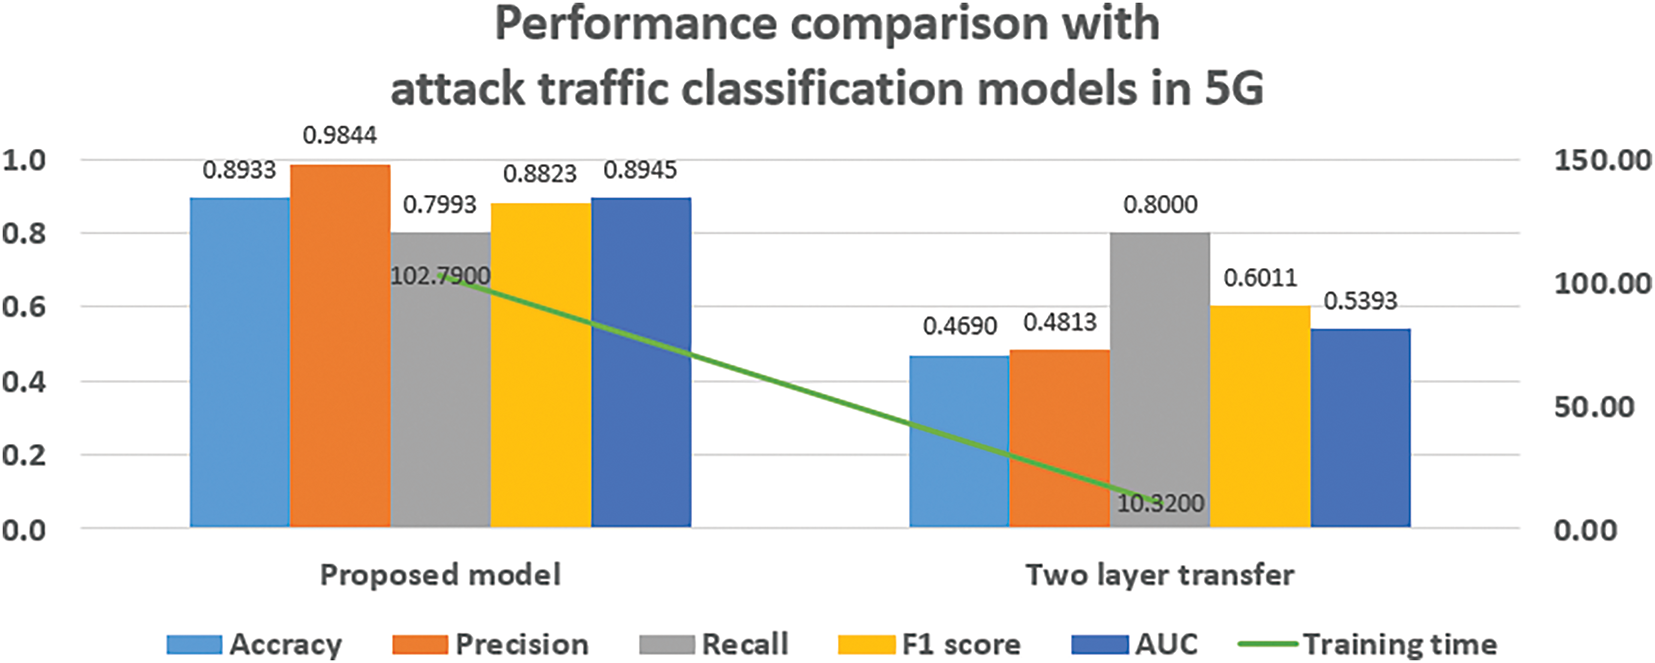
Figure 11: Model performance comparison
Based on the higher precision observed in the proposed model, the model more accurately identified traffic as malicious when it was actually malicious. However, the lower recall compared to that of the comparison model indicates that there are more missed detections of truly malicious traffic.
In contrast, the comparison model detected all malicious traffic but was prone to false positives, more frequently classifying normal traffic as malicious. When examining the balance of these errors using the F1-score, which is the harmonic mean of precision and recall, the proposed model demonstrated a more balanced performance in predicting both normal and malicious traffic than the comparison model.
The ratio of Precision and Recall is very important in terms of security and service. When an attack is detected, the process of determining whether it is a false positive is a part that requires a lot of human resources. Therefore, reducing false positives is also important, so the Precision value should be improved. However, attacks can be missed in order to reduce false positives. Recall is an indicator of how many actual attacks were detected, which is also an indicator of the false positive rate.
Considering this trade-off relationship, the author judged F1-Score to be the main indicator for comparison because it shows the harmony between the two, and I think it is the basis for showing better performance than the comparison model.
This study proposed an ensemble encoder-based model combined with an SVM metadata classifier for classifying attack traffic in 5G slicing networks. By leveraging autoencoders to compress high-dimensional network traffic data into latent representations and combining them through stacking, the model demonstrated strong classification performance while maintaining efficiency and scalability.
The experimental results on both class-balanced and class-imbalanced datasets confirmed the model’s robustness. In the class-balanced setting, the model achieved higher accuracy, precision, and AUC, while in the imbalanced scenario, it yielded higher recall and F1-score, indicating effective detection of rare attack patterns. These findings highlight the importance of appropriate class balancing during training to achieve optimal performance across metrics.
The model offers practical benefits for real-world 5G environments where diverse service types generate large amounts of metadata. By distributing data subsets to multiple shallow autoencoders, the system ensures lightweight computation, reduced overfitting, and ease of deployment in container-based or slice-specific network environments. Moreover, the modular design facilitates fine-tuning for each service slice, making it adaptable and scalable.
Despite these strengths, challenges remain. The high computational cost of the SVM metadata classifier may limit real-time deployment in large-scale environments, and improving recall is essential to minimize undetected attacks, especially under class-imbalanced conditions. Furthermore, the current evaluation was based on simulated datasets, which do not fully capture the dynamics and diversity of real-world traffic patterns where attacker behavior may change frequently.
To address these limitations, future work will focus on the following directions:
• Exploring lightweight classifier alternatives: To reduce inference latency in real-time scenarios, we plan to replace SVM with more efficient classifiers, such as ensemble decision trees or quantized neural networks.
• Validating on real-world 5G traffic: Future experiments will use traffic data collected from actual 5G environments, which exhibit dynamic 5-tuple changes (e.g., rotating IPs/ports, multiple sessions) to better simulate realistic attack vectors.
• Developing slice-aware anomaly detection: We plan to build a detection framework that dynamically adapts to the specific QoS and traffic behavior of each network slice, enabling fine-grained and service-specific protection.
• Aligning with AI standardization efforts: To ensure interoperability and scalability, we will explore integration with ongoing standardization activities such as 3GPP Network Data Analytics Function (NWDAF) and the OpenRAN AI/ML Framework.
By addressing these directions, we aim to evolve the proposed model into a practical, scalable solution for securing 5G slicing networks in real-world deployments.
Acknowledgement: This work was supported by an Institute of Information & Communications Technology Planning & Evaluation (IITP) grant funded by the Korean government (MSIT).
Funding Statement: This work was supported by an Institute of Information & Communications Technology Planning & Evaluation (IITP) grant funded by the Korean government (MSIT) (RS-2024-00438156, Development of Security Resilience Technology Based on Network Slicing Services in a 5G Specialized Network).
Author Contributions: The authors confirm contribution to the paper as follows: study conception and design: Min-Gyu Kim and Hwankuk Kim; data collection: Min-Gyu Kim; analysis and interpretation of results: Min-Gyu Kim and Hwankuk Kim; draft manuscript preparation: Min-Gyu Kim. All authors reviewed the results and approved the final version of the manuscript.
Availability of Data and Materials: The datasets generated and/or analyzed during the current study are available in the sajidkhan382067’s gitlab repository, https://gitlab.com/sajidkhan382067/ddos-data-sets-2022 (accessed on 17 January 2025).
Ethics Approval: Not applicable.
Conflicts of Interest: The authors declare no conflicts of interest to report regarding the present study.
References
1. Singh VP, Singh MP, Hegde S, Gupta M. Security in 5G network slices: concerns and opportunities. IEEE Access. 2024;12:52727–43. doi:10.1109/access.2024.3386632. [Google Scholar] [CrossRef]
2. Lin Y, Xie Z, Chen T, Cheng X, Wen H. Image privacy protection scheme based on high-quality reconstruction DCT compression and nonlinear dynamics. Expert Syst Appl. 2024;257(5):124891. doi:10.1016/j.eswa.2024.124891. [Google Scholar] [CrossRef]
3. Wong S, Han B, Schotten HD. 5G network slice isolation. Network. 2022;2(1):153. doi:10.3390/network2010011. [Google Scholar] [CrossRef]
4. Gao S, Lin R, Fu Y, Li H, Cao J. Security threats, requirements and recommendations on creating 5G network slicing system: a survey. Electronics. 2024;13(10):1860. doi:10.3390/electronics13101860. [Google Scholar] [CrossRef]
5. Sattar D, Matrawy A. Towards secure slicing: using slice isolation to mitigate DDoS attacks on 5G core network slices. In: IEEE Conference on Communications and Network Security (CNS); 2019 Jun 10–12; Washington, DC, USA. p. 82–90. [Google Scholar]
6. Aouedi O, Piamrat K, Parrein B. Intelligent traffic management in next-generation networks. Future Internet. 2022;14(2):44. doi:10.3390/fi14020044. [Google Scholar] [CrossRef]
7. Dubey M, Singh AK, Mishra R. AI based resource management for 5G network slicing: history, use cases, and research directions. Concurr Comput. 2024;37(2):e8327. doi:10.1002/cpe.8327. [Google Scholar] [CrossRef]
8. Open5gs: Products and vulnerabilities, CVEs [Internet]. [cited 2025 May 6]. Available from: https://www.cvedetails.com/vendor/22759/Open5gs.html. [Google Scholar]
9. Github-Lakshmirnr/CVE-2024-51179 [Internet]. [cited 2025 May 6]. Available from: https://github.com/Lakshmirnr/CVE-2024-51179?tab=readme-ov-file. [Google Scholar]
10. ETSI. TS.123.501 v18.8.0 2025 [Internet]. [cited 2025 Jan 13]. Available from: https://www.etsi.org/deliver/etsi_ts/123500_123599/123501/18.08.00_60/ts_123501v180800p.pdf. [Google Scholar]
11. Belkadi O, Vulpe A, Laaziz Y, Halunga S. ML-based traffic classification in an SDN-enabled cloud environment. Electronics. 2023;12(2):269. doi:10.3390/electronics12020269. [Google Scholar] [CrossRef]
12. Goiz G, De Farias CM, Delicato FC. Traffic classification for network slicing using machine learning techniques. In: Proceedings of the IEEE Conference on Pervasive and Intelligent Computing (PICom); 2024 Nov 5–8; Boracay Island, Philippines. p. 32–9. doi:10.1109/PICom64201.2024.00011. [Google Scholar] [CrossRef]
13. Lopez-Martin M, Carro B, Sanchez-Esguevillas A, Lloret J. Network traffic classifier with convolutional and recurrent neural networks for internet of things. IEEE Access. 2017;5:18042–50. doi:10.1109/access.2017.2747560. [Google Scholar] [CrossRef]
14. Jang H-C, Tsai T-Y. Using CNN to optimize traffic classification for smart homes in 5G era. In: Proceedings of 12th IEEE Annual Information Technology, Electronics and Mobile Communication Conference (IEMCON); 2021 Oct 27–30; Vancouver, BC, Canada. p. 27–30. doi:10.1109/IEMCON53756.2021.9623079. [Google Scholar] [CrossRef]
15. Le TNL, Salem BA, Appadoo D, Aitsaadi N, Du X. AI/ML-based IDS as 5G core network function in the control plane for IP/non-IP CIoT traffic. In: IEEE 49th Conference on Local Computer Networks (LCN); 2024 Sep 9; Normandy, France. p. 1–9. doi:10.1109/lcn60385.2024.10639697. [Google Scholar] [CrossRef]
16. Lei L, Kou L, Zhan X, Zhang J, Ren Y. An anomaly detection algorithm based on ensemble learning for 5G environment. Sensors. 2022;22(19):7436. doi:10.3390/s22197436. [Google Scholar] [PubMed] [CrossRef]
17. Lam J, Abbas R. Machine learning based anomaly detection for 5G networks. arXiv:2003.03474. 2020. [Google Scholar]
18. Thantharate A, Paropkari R, Walunj V, Beard C. DeepSlice: a deep learning approach towards an efficient and reliable network slicing in 5G networks. In: IEEE 10th Annual Ubiquitous Computing, Electronics & Mobile Communication Conference (UEMCON); 2019; New York, NY, USA. p. 762–7. doi:10.1109/UEMCON47517.2019.8993066. [Google Scholar] [CrossRef]
19. Min Z, Gokhale S, Shekhar S, Mahmoudi C, Kang Z, Barve Y, et al. Enhancing 5G network slicing for IoT traffic with a novel clustering framework. Pervasive Mob Comput. 2024;104:101974. doi:10.1016/j.pmcj.2024.101974. [Google Scholar] [CrossRef]
20. Baz N, Rahim R. Intra-slice aggregated defender—ISAD: federated learning based framework to enhance 5G intra-slicing security. In: 2024 Arab ICT Conference (AICTC); 2024; Manama, Bahrain. p. 126–33. doi:10.1109/aictc58357.2024.10735027. [Google Scholar] [CrossRef]
21. Khan MS, Farzaneh B, Shahriar N, Saha N, Boutaba R. SliceSecure: impact and detection of DoS/DDoS attacks on 5G network slices. In: 2022 IEEE Future Networks World Forum (FNWF); 2022; Montreal, QC, Canada. p. 639–42. doi:10.1109/fnwf55208.2022.00117. [Google Scholar] [CrossRef]
22. ahlashkari. CICFlowMeter [Internet]. [cited 2025 Jan 13]. Available from: https://github.com/ahlashkari/CICFlowMeter. [Google Scholar]
Cite This Article
 Copyright © 2025 The Author(s). Published by Tech Science Press.
This work is licensed under a Creative Commons Attribution 4.0 International License , which permits unrestricted use, distribution, and reproduction in any medium, provided the original work is properly cited.
 Downloads
 Citation Tools