
 Submit a Paper
 Propose a Special lssue
 Open Access
ARTICLE

Optimization of Reconfiguration and Resource Allocation for Distributed Generation and Capacitor Banks Using NSGA-II: A Multi-Scenario Approach
1 Department of Mathematics, Al Zaytoonah University of Jordan, Amman, 11733, Jordan
2 Department of Mathematics, Faculty of Science and Information Technology, Jadara University, Irbid, 21110, Jordan
3 Faculty of Mathematics, Otto-von-Guericke University, Magdeburg, 39016, Germany
4 Department of Electrical Engineering, Jo.C., Islamic Azad University, Jouybar, Iran
5 Department of Electrical and Electronics Engineering, Faculty of Engineering and Natural Science, Istinye University, Istanbul, Turkey
6 Department of Electrical and Computer Engineering, College of Engineering, Dhofar University, Salalah, Oman
* Corresponding Authors: Frank Werner. Email: ; Mehrdad Ahmadi Kamarposhti. Email:
,
Computer Modeling in Engineering & Sciences 2025, 143(2), 1519-1548. https://doi.org/10.32604/cmes.2025.063571
Received 18 January 2025; Accepted 30 April 2025; Issue published 30 May 2025
 View Full Text
 Download PDF
Abstract
Reconfiguration, as well as optimal utilization of distributed generation sources and capacitor banks, are highly effective methods for reducing losses and improving the voltage profile, or in other words, the power quality in the power distribution system. Researchers have considered the use of distributed generation resources in recent years. There are numerous advantages to utilizing these resources, the most significant of which are the reduction of network losses and enhancement of voltage stability. Non-dominated Sorting Genetic Algorithm II (NSGA-II), Multi-Objective Particle Swarm Optimization (MOPSO), and Intersect Mutation Differential Evolution (IMDE) algorithms are used in this paper to perform optimal reconfiguration, simultaneous location, and capacity determination of distributed generation resources and capacitor banks. Three scenarios were used to replicate the studies. The reconfiguration of the switches, as well as the location and determination of the capacitor bank’s optimal capacity, were investigated in this scenario. However, in the third scenario, reconfiguration, and determining the location and capacity of the Distributed Generation (DG) resources and capacitor banks have been carried out simultaneously. Finally, the simulation results of these three algorithms are compared. The results indicate that the proposed NSGAII algorithm outperformed the other two multi-objective algorithms and was capable of maintaining smaller objective functions in all scenarios. Specifically, the energy losses were reduced from 211 to 51.35 kW (a 75.66% reduction), 119.13 kW (a 43.54% reduction), and 23.13 kW (an 89.04% reduction), while the voltage stability index (VSI) decreased from 6.96 to 2.105, 1.239, and 1.257, respectively, demonstrating significant improvement in the voltage profile.Keywords
Each year, power grids experience significant energy losses, resulting in substantial financial burdens on utility companies. These losses not only reduce revenue but also incur costs related to new infrastructure, power outages, and environmental damage caused by energy generation. Among these, the majority of losses occur in distribution networks. In our country, over 15% of the net energy produced by power plants is lost solely within distribution networks. The increased energy losses in the electrical distribution system—comprising medium-voltage and low-voltage sections—stem from several factors. These include low voltage levels, high current magnitudes along feeders, and the radial structure of the network, phase current imbalances, harmonic distortions, equipment degradation, and unauthorized connections. To mitigate distribution system losses and enhance voltage stability, a variety of strategies can be implemented. These include installing capacitors, integrating distributed energy resources, employing peak load shaving through consumption management, replacing network conductors, optimizing voltage levels, and reconfiguring the network [1].
Distributed generation offers numerous advantages for power systems, such as enhanced power quality, improved voltage profiles, reduced energy losses, peak load shaving, increased system reliability, and decreased line congestion. It can be utilized for both active and reactive power generation. However, since capacitor banks provide reactive power generation at a much lower cost, distributed generation sources are often considered to generate only pure active power when operating at their optimal power factor per unit. By consistently supplying both active and reactive power directly to load sites, distributed generation reduces transmission losses and enhances voltage levels, thereby improving reliability and overall system performance. However, the placement of distributed generation units plays a crucial role. Selecting an unsuitable installation location can lead to higher costs and reduced operational efficiency.
Reconfiguration is one of the simplest and most cost-effective methods for reducing losses in distribution systems [2]. To achieve this, the optimal configuration of the distribution network must be identified, considering the various loads and the dispersed active and reactive power sources within the network. This process aims to minimize energy losses while enhancing voltage stability. Due to the vast number of potential configurations in a distribution network and the impracticality of analyzing each one individually, intelligent algorithms are essential for identifying the most effective configuration to minimize losses.
The types of distributed generation sources suitable for compensating active and reactive power to minimize power losses in distribution networks are analyzed in [3]. Furthermore, the article aims to optimize the voltage profile across all buses. The IEEE 33-bus and 69-bus standard systems are examined, and the results obtained using the proposed method in this study are compared with those derived from analytical approaches. The reference emphasizes that metaheuristic methods are more suitable for large-scale systems due to their faster convergence rates.
Ref. [4] addresses a multi-objective approach to determine the optimal location and sizing of capacitors in distribution networks. The study considers network losses and capacitor investment costs as two objective functions to be minimized. This method generates multiple optimal solutions, where a trade-off exists between reducing investment costs and achieving higher efficiency. The decision-maker can select the most appropriate solution based on their priorities.
Ref. [5] tackles the capacitor placement problem with three primary objectives: reducing energy losses, improving the power factor, and lowering substation voltage to decrease peak load consumption. Enhancing the power factor simultaneously contributes to improved voltage stability in the network. The problem is solved using the NSGA (Non-dominated Sorting Genetic Algorithm) optimization technique.
Ref. [6] explores the simultaneous placement of capacitors and distributed generation sources in a radial distribution network with varying load levels. The objectives of the study are to minimize active and reactive power losses, conserve energy, and enhance the voltage profile. Additionally, the impact of capacitors and distributed generation on voltage stability is analyzed. To determine the optimal solution, the study employs memetic or hybrid algorithms, which integrate local search techniques with genetic algorithms. The proposed method is tested and evaluated on a sample distribution network to verify its effectiveness.
Ref. [7] highlights the significance of reactive power alongside active power in power systems. The article underscores the critical role of controlling reactive current to maximize real power transmission. The primary objectives are to minimize active power losses and reduce the system’s reactive power. The study incorporates distributed generation sources and parallel capacitors into the sample system. The proposed method enhances system reliability and loading capacity by optimizing the location and sizing of distributed generation sources and capacitors. This is achieved using a decomposition-based multi-objective evolutionary algorithm (MOEA). The algorithm decomposes the multi-objective optimization problem into several sub-problems, which are solved simultaneously. The paper evaluates its approach on standard 119-bus, 69-bus, and 33-bus networks. The results demonstrate the superior performance of the proposed algorithm compared to other similar techniques.
Ref. [8] addresses the network reconfiguration problem using the Runner Root Algorithm (RRA). This algorithm is inspired by the performance of runners and the natural growth patterns of plant roots. The primary objectives of the study are to minimize active power losses, achieve load balance among branches, and ensure load balance across feeders. Additionally, the maximum-minimum method is employed to identify optimal switching operations and voltage deviation points. The study evaluates the proposed approach using standard 33-bus and 70-bus networks. The results indicate that the RRA algorithm is an effective tool for reconfiguring networks with one or multiple specific objectives.
Ref. [9] presents a method for the simultaneous placement of distributed generation resources and network reconfiguration using the new dedicated search teaching learning based optimization (DSTLBO) algorithm. This algorithm is designed to enhance the convergence, accuracy, and efficiency of the standard Teaching-Learning-Based Optimization (TLBO) method. The primary objectives of the optimization in this study are to minimize power losses and improve the voltage profile. The proposed method is validated on a standard 33-bus system, with results demonstrating the algorithm’s optimal performance and effectiveness.
Ref. [10] addresses the capacitor installation and network reconfiguration problems in two stages. The branch replacement method is employed for the reconfiguration process. Daily load curves are used to calculate the final losses, but they are not directly involved in solving the problem. Reliability assessments are conducted on the test networks, although they do not influence the optimization process and are only used for monitoring purposes.
In Ref. [11], the capacitor installation and reconfiguration problems are tackled simultaneously. In this approach, the capacitor is rearranged and adjusted to minimize losses. The configuration of switches is determined using the Simulated Annealing (SA) method, while the optimal capacitance is found using a discrete optimization algorithm.
Capacitor installation and network reconfiguration have been employed to minimize power losses in Ref. [12]. Both problems are solved using the Simulated Annealing (SA) method. The study offers four approaches: reconfiguration only, capacitor installation only, capacitor installation followed by reconfiguration, and simultaneous capacitor installation and reconfiguration. The results show that the concurrent approach yields the best outcomes in terms of loss reduction.
In Ref. [13], the simultaneous consideration of capacitor installation and network reconfiguration is used to minimize both losses and costs over time. The Intelligent Adaptive Genetic Algorithm (IAGA) is utilized as the main optimization technique for tuning capacitors, while a simplified branch switching algorithm is applied for reconfiguration. The study demonstrates that considering both capacitor installation and reconfiguration together results in the lowest losses and costs. One of the key advantages of the IAGA algorithm is its ability to perform a comprehensive search.
Ref. [14] employs capacitance tuning and network reconfiguration to minimize losses using the ACSA (Ant Colony Search Algorithm). In this study, reconfiguration is performed simultaneously with capacitor installation, and the results show that addressing both simultaneously yields better outcomes. ACSA is compared with the Simulated Annealing (SA) and Genetic Algorithm (GA), demonstrating its superiority over both methods.
Ref. [15] proposes a computationally efficient analytical solution for capacitor installation and network reconfiguration. The problem is simplified by linearizing and approximating it into smaller, static problems, thus reducing the computational burden. Network reconfiguration is carried out using the branch replacement method. Daily load curves are used for calculations, which are repeated over three hours, with each bus having its own specific load curve.
Ref. [16] utilizes the primal-dual interior-point method to solve the problems of capacitor installation and network reconfiguration. A continuous function is used to model discrete variables, and Lagrangian multipliers serve as sensitivity indices for reconfiguration. The proposed algorithm divides the reconfiguration and capacitor installation tasks into two distinct steps, allowing one to be completed before the other. The simulations consider two different types of daily load curves, assuming each busbar follows one of these load curves.
In Ref. [17], capacitor installation and reconfiguration problems are addressed using a modified Particle Swarm Optimization (PSO) algorithm. In addition to minimizing energy losses, the objective function also aims to reduce costs over time. The load is modeled as a piecewise linear function with three levels. PSO adjustments are made such that the inertia weight decreases linearly from 0.9 to 0.2 across iterations, which enhances the solution’s performance.
Ref. [18] explores the combined effects of the Harmony Search and Artificial Bee Colony algorithms. The study investigates network reconfiguration alongside the placement and sizing of capacitors and distributed generation sources. The proposed hybrid technique was tested on 69 and 118-bus networks to minimize active power losses and enhance the voltage profile. This hybrid approach exhibits faster convergence and a larger memory footprint compared to each individual method. The results indicate that the hybrid algorithm is highly effective in addressing the network reconfiguration problem, as well as in determining the optimal capacity and placement of capacitors and distributed generation sources.
Ref. [19] proposes a methodology for addressing the distribution network reconfiguration (DNR) challenge in the presence of distributed generation (DG) by utilizing the parallel slime mould algorithm (PSMA). In Ref. [20], an integrated approach is presented for the simultaneous optimization of photovoltaic (PV) panel and wind turbine (WT) placement alongside the reconfiguration of radial distribution networks. This strategy aims to minimize power loss costs while enhancing system reliability. The optimization framework leverages an improved salp swarm algorithm (ISSA), which incorporates differential evolutionary (DE) operators to refine the standard salp swarm algorithm (SSA). This hybridization effectively mitigates the risk of the algorithm being trapped in local optima and accelerates convergence towards the global optimal solution. Ref. [21] addresses the problem of distribution network reconfiguration combined with simultaneous capacitor switching, incorporating the integration of wind generators and solar panels. The study utilizes the Simulated Annealing and Minimum Spanning Tree algorithms, applied independently, to determine optimal solutions. The main objectives are to achieve power loss minimization and cost reduction. Ref. [22] proposed a Hybrid Archimedes Optimization Algorithm (HAOA) for optimal placement of distributed generation to minimize power loss and enhance voltage stability, focusing on improving the efficiency and reliability of distribution systems. Ref. [23] introduced a Hybrid Meta-Heuristic Algorithm (HMHA) for network reconfiguration, addressing multi-objective functions in distribution networks to achieve optimal performance in terms of loss reduction and system stability.
As mentioned earlier, most researchers have focused on the issues of reconfiguration, distributed generation source placement, and capacitor installation separately. Fewer studies have addressed all three aspects together. This paper discusses all three topics in an integrated manner. The objective of this paper is to optimize the switch reconfiguration of the distribution network, alongside the placement of distributed generation sources and parallel capacitors, to maximize voltage stability and minimize power losses. Table 1 summarizes several of the studies on the distribution network reconfiguration optimization and the DG placement optimization. Various algorithms and methodologies have been proposed in these works targeting bettering system performance in terms of loss minimization, voltage stability margin improvement, reliability, etc. The key works, their optimization approaches, and objectives addressed are summarized in the table.

There are various techniques for identifying capacitors, distributed generation sources, and network reconfiguration. However, due to the complexity of distribution system challenges—such as the diversity of equipment, model intricacy, and rising uncertainty—it becomes increasingly difficult to address these issues. Therefore, efforts are made to solve distribution system problems as close to the optimal solution as possible, in order to enhance the understanding of the system’s technical and economic challenges. Nonetheless, mathematical optimization methods often fail to deliver optimal solutions. As a result, this study aims to employ meta-heuristic techniques, which are intelligent approaches. In this paper, the NSGA-II algorithm is used to optimize the objective function, focusing on enhancing the voltage profile and minimizing losses. While the techniques employed in this study (NSGA-II, MOPSO, and IMDE) are widely used in optimization, their integration in the simultaneous optimization of network reconfiguration, DG placement, and capacitor bank sizing represents a novel approach in the literature. Most previous studies have addressed these issues separately, focusing on one or two parameters at a time. In contrast, this work provides a comprehensive, integrated solution that optimizes the power distribution system’s performance across all three dimensions, ensuring enhanced voltage stability and minimized power losses. This integrated optimization approach contributes significant novelty and practical value to the existing body of knowledge.
The second section outlines the reconfiguration process and its significance within the distribution system. The third section addresses the mathematical formulations and modeling of the problem. The fourth section focuses on the algorithm used to carry out the optimization process. In the fifth section, simulation results are presented for three different scenarios, followed by a comparison of the various modes examined. Finally, the sixth section summarizes the overall conclusions of the study.
2 The Importance of Distribution Network Reconfiguration
Due to their direct connection to consumers, electricity distribution networks must adapt to changing consumption situations. Changing consumption at irregular intervals, which is most noticeable during the changing seasons, can occasionally cause technical problems in the network, including network losses, overload on the above distribution substation, the voltage drop in distribution substations, and overcurrent in 20 kV feeders. On the other hand, with the addition of new customers to the network, any of these issues is feasible. Particularly when these additional subscribers impose a substantial load on the network. There are numerous ways to resolve such issues, including strengthening the feeder, constructing new feeders and capacitors, and constructing new medium-pressure substations. Additionally, because the distribution network’s load fluctuates, as is the nature of this network, the network’s losses are changeable and the voltage level fluctuates. On the other hand, as line flow distribution levels and line resistance increase, distribution network losses increase, resulting in a loss of investment in the energy business. Given that all of the above solutions require significant time and money, the most economical and expedient solution is one that allows for the resolution of problems in the majority of cases while also making maximum and optimal use of existing facilities, such as reconfiguring distribution networks to reduce hosting costs.
Distribution network reconfiguration is a typical way of decreasing losses and achieving optimal network functioning, in which losses are decreased and voltage profiles are improved by transferring the load from feeder to feeder and balancing the load going through the feeders [24–28].
Choosing the optimal configuration for a network from a large number of possible configurations is the solution to an optimization problem. There are numerous approaches for this, including linear and non-linear optimization, as well as methods based on artificial intelligence. Meta-heuristic and intelligent methods have advanced greatly in recent years. The NSGAII optimization technique is used in this article to determine the optimal configuration for the sample network.
It is vital to choose the proper objective function when reconfiguring and optimally locating distributed generation units and capacitor banks using meta-heuristic algorithms. In this paper, the objective function is a function of line losses and a voltage stability function. The objective is to reduce the size of this function [7].
where:
In the Eqs. (1) to (3),
Power Flow Constraints: To maintain load distribution, the following two equations must be satisfied at all buses (excluding the slack bus). The balance between energy generation and consumption should be always maintained.
In Eqs. (4) and (5), Pgi and Pdi represent the active power generated and consumed at the ith bus, respectively, while Qgi and Qdi denote the reactive power generated and consumed at the same bus. The terms
Maximum Current Constraint across Lines: The power transmission capacity of the lines is subject to thermal limitations. Therefore, the current (or power) flowing through the lines must not exceed the maximum thermal capacity of the network’s lines.
In Eq. (6),
DGs’ Active Power Generation Constraints: Distributed generation sources’ active power generation must be within the permissible range. These limits may also be a result of distributed generation’s technical or economic constraints.
In the above equation, PDGi represents the maximum active power output of the distributed generation (DG) unit.
Reactive Power Constraint for Capacitor Bank: The reactive power supplied by the capacitor banks must remain within the following range:
In Eq. (8), QCapi denotes the reactive power generated by the capacitor banks.
3.2 Power Flow Using the Forward-Backward Sweep (FBS) Method
This method’s two fundamental steps are forward and backward sweeping. These two steps can be described simply as follows [8]:
Forward Sweep:
This step involves traversing the entire network from the reference bus (typically the distribution substation) to the feeder’s endpoint. During this process, one of the network metrics, such as bus voltage, is typically updated. In simpler terms, bus voltages are recalculated using the branch currents from the previous iteration and the radial structure of the network. This step generally updates a parameter whose value varies along the feeder’s length, with bus voltage being the most common example.
Backward Sweep:
In this step, the feeder is traversed in the opposite direction, from its endpoint back to the reference bus. It updates parameters related to those calculated in the forward sweep, such as branch currents. For example, the branch currents at the feeder’s end are recalculated based on the bus voltages determined during the forward sweep.
Forward-Backward Sweeping Methods:
These iterative methods are widely used in distribution load flow analysis due to their speed, low computational memory requirements, and strong convergence characteristics. The process is repeated until convergence is achieved. These methods are categorized into three types:
• Current Summation Method
• Power Summation Method
• Impedance Summation Method
The steps involved in the forward-backward sweeping approach for a nonlinear network are as follows:
1. Determine the reference bus (slack bus) in the network.
2. Set the voltage magnitude and angle at each node, typically initialized as
3. Compute the currents at each node during the kth iteration using the appropriate equations as follows:
sch: schedule
4. Traverse from the beginning of the feeder (slack bus) to the end, calculating the voltage at each node during the kth iteration.
The power error at each node is then calculated. If the error is smaller than the allowable threshold, the process is complete. Otherwise, the algorithm returns to step 3. The power error is calculated using the following equation:
4 Non-Dominated Sorting Genetic Algorithm II (NSGA-II)
The Non-dominated Sorting Genetic Algorithm II (NSGA-II) is a widely utilized and robust metaheuristic algorithm designed for solving multi-objective optimization problems. Its effectiveness in addressing diverse optimization challenges has been extensively demonstrated. Originally introduced by Srinivas and Deb (1995), the NSGA optimization method offers a reliable approach for tackling multi-objective problems. Key features of this method include:
A higher score is given to the solution that is unquestionably superior to all other solutions. The solutions are prioritized based on the count of superior alternatives.
Solutions are assigned a fitness level based on their rank and non-dominance relative to other solutions. For closely clustered solutions, a fitness mechanism is applied to optimize their distribution, ensuring an even spread across the search space. Recognizing the sensitivity of the NSGA algorithm’s performance to fitness and other parameter settings, Deb et al. introduced an enhanced version in 2000, known as the NSGA-II metaheuristic algorithm. Beyond its demonstrated performance, the NSGA-II serves as a foundational template for developing numerous multi-objective optimization algorithms. Its innovative approach to addressing multi-objective optimization problems has been extensively employed by researchers to create newer algorithms. Undoubtedly, NSGA-II is a cornerstone of the evolutionary multi-objective optimization family, representing the second generation of such methodologies. The primary features of this algorithm include:
• Compression distance: Introduced as an alternative to traditional operations like fitness sharing.
• Binary tournament selection: Utilized as the selection operator.
• Elitism: Unsuccessful solutions from previous steps are retained and archived for future reference.
Assume that the NSGA-II algorithm is in generation t when describing the implementation steps. Using the parent population of Pt, a population of Qt offspring of size N is developed. Rt = Pt + Qt of size 2N is formed when the parent and offspring populations combine. Following that, all elements in the Rt population are classified called non-dominated fronts using non-dominated sorting. Given that all members of previous and current populations are classified as Rt, the above sorting enables an examination of the non-dominance between offspring and parent solutions.
4.1 Fast Non-Dominated Sorting Approach
In this algorithm, objective values (f) are utilized to sort solutions and subsequently form fronts. A new population of non-dominated solutions is generated following the sorting process. The procedure begins by selecting the best non-dominated front and continues iteratively until a population of size N is established. Since Rt = 2N, not all non-dominated fronts are included in the final population. Any fronts that do not contribute to the new population are excluded. This process is illustrated in Fig. 1.

Figure 1: Representation of NSGAII [25]
The number of members in the final non-dominated front may exceed the remaining gaps in the new population. Rather than randomly selecting solutions from this front to fill the gaps, the Niching strategy is employed to ensure diversity within the population. This strategy prioritizes solutions from sparsely populated areas of the non-dominated front. To implement this in the NSGA-II algorithm, the crowding distance is used, as detailed in the following sections.
An overview of the algorithm’s steps is outlined below. The process begins with the creation of a random parent population, P0.‘This population is divided into multiple non-dominated levels, and each solution is assigned a fitness value (or rank) based on its level—starting with the best level (rank 1), followed by the next best levels, and so forth. The fitness values are minimized throughout the process.
Winners of the binary tournament are determined using a crowding tournament operator. Subsequently, mutation and crossover operators are applied to generate an offspring population, Q0, of size N. A detailed step-by-step explanation of the NSGA-II algorithm follows.
1. Combining Populations: Merge the parent (Pt) and offspring (Qt) populations to form
2. Building the New Population: Initialize the new population,
3. Crowding Sort: Performing crowding sort and inserting
4. Generating Offspring: Use the crowding tournament selection, crossover, and mutation operators on
In step 3, crowding sorting of the non-dominated fronts i (the last non-dominated front its elements cannot be assigned to the new population) is performed using the crowding metric distance. The population elements are sorted in descending order.
4.2 Crowded Tournament Selection Operator
The crowded tournament selection operator is used to compare two solutions and determine the superior one within the tournament. Each solution is characterized by two key attributes:
1. Non-dominance rank (ri): The rank of the solution within the population based on non-dominance.
2. Local crowding distance (di): The extent of the search space surrounding solution i that remains unoccupied by other solutions in the population.
The crowding distance (di) represents a measure of the sparsity around solution i, ensuring diversity in the population. Using these two attributes, the crowded tournament selection operator is defined as follows:
Definition of the crowding tournament selection operator:
Solution i wins against solution j in the tournament, if any of the following conditions is met:
Definition of the Crowded Tournament Selection Operator:
Solution i is selected over solution j in the tournament if any of the following conditions are satisfied:
1. If the rank of solution i is better than solution j (
2. If the rank of solutions i and j is similar, but the crowding distance of solution I is better than solution j,
The first condition guarantees that the selected solution is optimal. The second condition addresses the issue when both solutions belong to the same non-dominated front by comparing their crowding distances. The solution with the larger crowding distance (di), indicating its position in a less crowded area, is declared the winner [29,30].
To assess the density of solutions around a given solution i within a population, the average distance between two neighboring solutions that satisfy each objective is used. The value of di, known as the crowding distance, approximates the perimeter of a cube formed by the vertices of the nearest neighbors of solution i (Fig. 2).

Figure 2: Calculation of the crowding distance [25]
The crowding distance of the ith solution at its corresponding front (shown by solid circles) is equal to the cube’s average lateral lengths (indicated by the dashed rectangle) [31–33].
Calculating the crowding distance, and crowding sorting:
1. Represent the number of solutions in F with l = |F|. For each solution i in the set F, di = 0.
2. For each objective function m = 1, 2, 3, … , M, sort the set based on the worst fm or obtain the sorted vector of the objective function values:
3. For m = 1, 2, 3, … , M, assign a large distance to limit solutions or
where
By utilizing the crowding comparison process employed in the tournament selection and population change, this algorithm ensures variation between the non-dominated solutions. On the other hand, as previously stated, in this algorithm, non-dominated sorting of solutions considers a mixed population of size

Figure 3: Flowchart of the NSGA-II algorithm
The NSGAII algorithm is employed to simultaneously optimize the distribution system reconfiguration, DG resource placement, and capacitor bank sizing. The procedure is outlined in the following steps:
Step 1. Enter NSGAII algorithm parameters: Begin by defining the key parameters of the NSGAII algorithm, including the number of particles, repetitions (Rep), crossover probability (Pc), mutation probability (Pm), and others.
Step 2. Enter the network parameters: Input the distribution system’s parameters, such as load parameters, line configurations, switch configurations, etc.
Step 3. Random initialization of particles: The particles (solutions) are randomly initialized, each representing a unique arrangement of DG source locations, capacitor bank locations, and their corresponding capacities. Each particle encodes a potential solution for the optimization problem.
Step 4. Evaluate objective functions: The values of each particle are substituted into the objective functions (e.g., loss minimization and voltage stability) to compute their fitness.
Step 5. Identify dominant particles: Based on the evaluated fitness values, identify the dominant particles (Rep) and the optimal solution (Gpop) in the population.
Step 6. Crossover operator: A crossover operator is executed to generate new particles by combining the characteristics of parent particles.
Step 7. Mutation of particles: The mutation operator is applied to introduce randomness and ensure diversity in the population of solutions.
Step 8. Evaluate new particles: The new particles (generated through crossover and mutation) are substituted into the objective functions, and their fitness values are recalculated.
Step 9. Repeat until termination: If the termination conditions (such as the maximum number of generations or convergence criteria) are not met, the algorithm returns to step 4 to continue evaluating and refining the particles.
Step 10. End: Once the termination conditions are satisfied, the algorithm ends, and the optimal solution is obtained.
The Fig. 4 is a flowchart of the NSGAII algorithm for reconfiguration of distributed generation sources and capacitor banks and determining their location and capacity. The flowchart in Fig. 4 shows the optimization procedure used for reconfiguration of the analyzed system. which starts by fetching the network’s initial information (buses, loads, lines, and switches). Now take population size and number of iterations and initialize the algorithm and again a random initial population is generated [40–45].
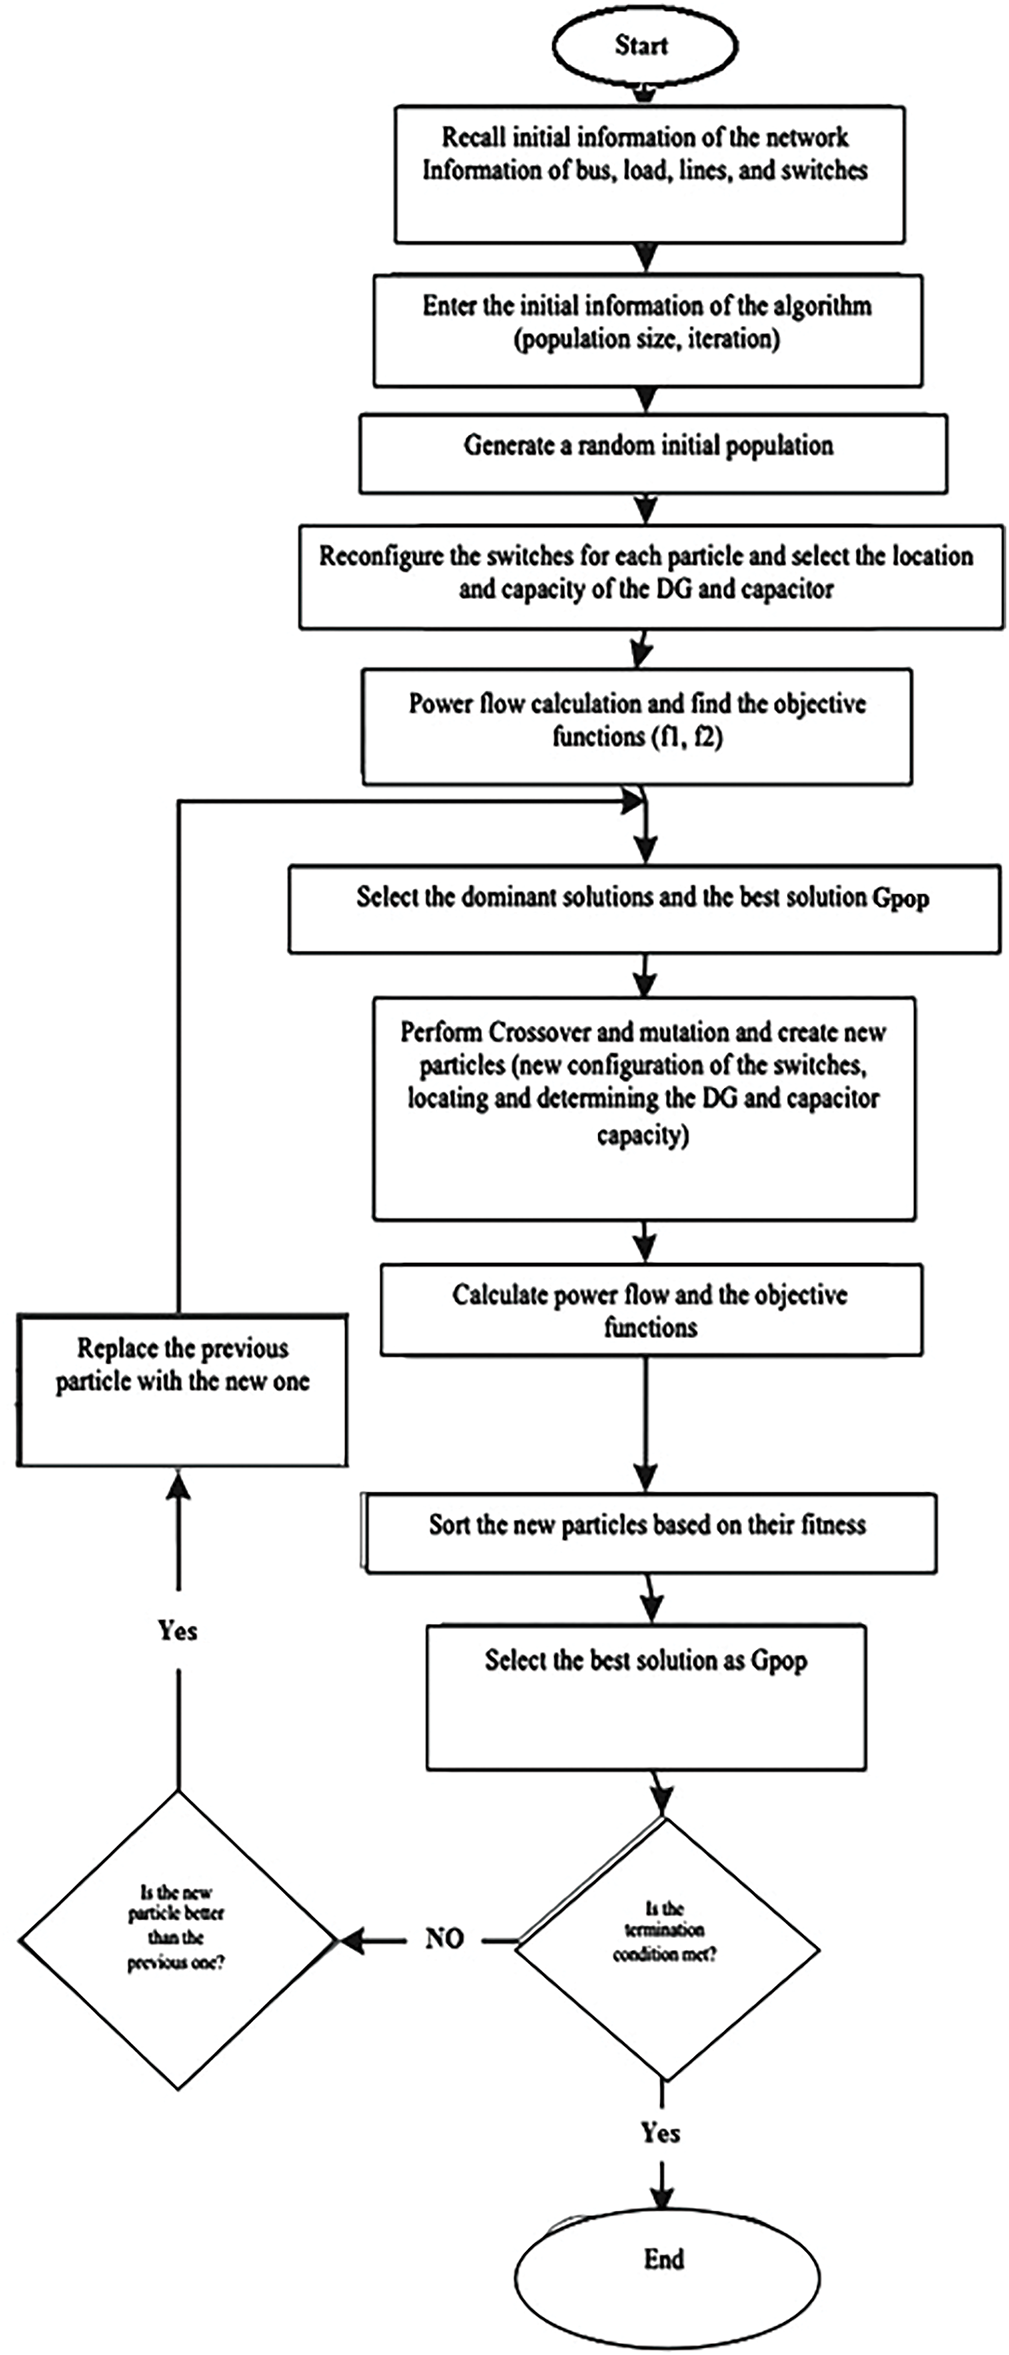
Figure 4: Flowchart depicting the process of reconfiguring the studied system
In this way, each particle is reconfigured by adjusting some switches and then determining the optimal location and capacity of DGs and capacitors. Objective functions evaluation: Power flow analysis is performed for certain objective functions, including power loss reduction and voltage profile improvement. An evolutionary selection (crossover and mutation) is adopted to generate new particles with novel configurations by selecting the dominant solutions. Another power flow analysis is then carried out for the new solutions, and their fitness is assessed. You pick the best solution and compare it against the last solution. If this yields a better solution, the new particle supplant the old one. This process is iterated until the stopping criteria are achieved, which ultimately leads to optimal reconfiguration of the distribution system [46,47].
5 Simulation and Results Analysis
The reconfiguration of the network, combined with the integration of distributed generation resources and capacitor banks, is extensively employed in this study to reduce power losses and enhance the voltage stability margin of the system. To achieve the stated objectives across different network topologies, it is essential to determine the optimal switch configuration within the distribution network, along with the placement and capacity allocation of active and reactive power resources. Three scenarios were investigated:
Scenario 1: Reconfiguring the switches and determining the locations and capacities of distributed generation resources within the distribution system.
Scenario 2: Reconfiguring the switches and determining the locations and capacities of capacitor banks in the distribution system.
Scenario 3: Reconfiguring the switches and determining the locations and capacities of both distributed generation resources and capacitor banks within the distribution system.
It is important to note that this article incorporates both distributed generation elements and capacitor banks, with the condition that these resources can be installed at all buses except the reference bus.
Given the vast number of potential switch configurations in a distribution network and the impracticality of evaluating all possible configurations, intelligent algorithms must be used to determine the most suitable configuration based on the objective functions. The objectives of this research are achieved through the application of the multi-objective genetic algorithm (NSGA-II).
Furthermore, to validate the simulation results, the performance of the proposed method is compared with the multi-objective particle swarm optimization algorithm (MOPSO) and the intersect mutation differential evolution (IMDE). The parameters for these algorithms are provided in Table 2.

The simulations are carried out in the MATLAB environment. The IEEE standard 33-bus system has been chosen as the sample system for this purpose. The system under consideration is a radial distribution network equipped with PQ loads and connected to the upstream network via a distribution transformer. The proposed 33-bus system is depicted in Fig. 5, along with the status of its switches.

Figure 5: Single-line diagram of the 33-bus network
The dashes in Fig. 5 represent the status of the switches that are initially open. The switches 33-34-35-36-37 are open in their basic configuration, whereas the remaining switches are closed.
When reconfiguring the switches in the power system, two constraints must be considered. The first constraint is the network’s radiality, and the second constraint is related to the network not forming an island. Before reconfiguring the switches and installing the compensators, the ohmic losses of the lines in the network depicted in Fig. 5 are equivalent to 211 kW. The ohmic losses of the lines are plotted in Fig. 6 as a bar graph.

Figure 6: Ohmic losses of the lines in the 33-bus network before reconfiguration
On this basis, it can be concluded that the maximum ohmic losses occur in the system’s beginning lines, which suffer from large losses due to their length and the passage of high currents through them. Additionally, Fig. 7 illustrates the voltage change curve for each of the above-mentioned bus networks. In initial conditions, the voltage stability function of this system equals 6.96.

Figure 7: Voltage profiles in the network under investigation
The next section discusses the results of different scenarios.
5.1 First Scenario (Reconfiguration of the Switches and Determining the Optimal Capacity of the DG Resources)
In this scenario, the research’s primary objectives (loss reduction and improving voltage stability) were accomplished by reconfiguring switches and identifying the optimal capacity of DG resources in the study distribution system using the IMDE, MOPSO, and NSGAII algorithms. It should be mentioned that in this situation, the switches are reconfigured and algorithms decide the location and capacity of DG resources simultaneously. The three algorithm’s dominant particles are depicted in Figs. 8–10.

Figure 8: The NSGAII algorithm’s dominant particles in the first scenario

Figure 9: The MOPSO algorithm’s dominant particles in the first scenario

Figure 10: The IMDE algorithm’s dominant particles in the first scenario
The dominant particles acquired using the NSGAII method are shown in Fig. 8, and the values of the dominant particles obtained using the MOPSO and IMDE algorithms are shown in Figs. 9 and 10. The selected response values are depicted in the preceding images alongside the dominating responses. Power loss and the voltage stability function for the NSGAII algorithm’s dominant values (Rep) are shown in Table 3. Three methods are used to generate the findings in Table 4 from the selected responses in the first scenario.


According to the results of the optimization process using the IMDE algorithm, bus 16 is offered for the installation of DG sources with a capacity of 841.8 kVA. In this situation, switches 12, 24, 32, 33, and 35 should be open, while the remaining network switches should be closed. As a result, the total ohmic losses across all distribution system lines fell by 89.76 percent to 57.45 kW in this scenario. The criterion for determining the system’s voltage stability (VSI) has also been increased to 1.1871. Bus 31 is proposed for the installation of DG sources with a capacity of 950.7 kVA after optimization using the MOPSO algorithm. Switches 9, 12, 17, 33, and 37 must be open in this situation, while the remaining network switches must be closed.
The overall ohmic losses of the lines under these conditions have been decreased to 82.46 kW, a reduction of approximately 60.91 percent in comparison to the system’s baseline losses. Additionally, the voltage stability index (VSI) value has been decreased to 1.37. However, if the NSGAII algorithm is applied, bus 13 with a capacity of 766.6 kV is chosen for DG installation. The proposed switch configuration leaves switches 7, 8, 14, 24, and 36 open, while the remaining switches remain closed. The losses in this situation have decreased by an average of 63.27 percent to 77.49 kW. The level of loss reduction achieved with the NSGAII algorithm is more than that achieved with the other two algorithms. The voltage stability index (VSI) is also calculated to be 1.1147, which is less than the value predicted by the other two techniques. The ohmic loss values for each line are presented in Figs. 8–10, respectively, when the IMDE, MOPSO, and NSGAII algorithms are applied.
As illustrated in Fig. 11, after reconfiguring and utilizing DG in the study distribution system, the losses on all lines decreased significantly compared to baseline conditions, except lines two and three, where their losses decreased significantly. The initial value has been decreased by more than 20%. Comparing the ohmic losses of lines when three algorithms are employed, it can be concluded that the ohmic losses of the majority of lines in the power system optimized using the NSGAII algorithm are smaller than those of the two other algorithms, IMDE and MOPSO, except a few lines. The following section calculates the SI criteria value for all buses and displays it as a bar graph in Fig. 12.

Figure 11: Lines’ losses after reconfiguration and determining the location and capacity of the DGs

Figure 12: Voltage Stability index of the buses after reconfiguration and determining the location and capacity of the DG resources
5.2 The Second Scenario (Reconfiguration of the Switches and Determining the Location and Optimal Capacity of the Capacitor Banks)
In the second scenario, the IMDE, MOPSO, and NSGAII algorithms are used to investigate how to reduce losses and enhance the voltage stability index of the 33-bus system by reconfiguring switches and identifying and establishing the ideal capacity of capacitor banks. The dominant particles are depicted in Figs. 13–15 after optimization by these three techniques. It should be mentioned that the selected particle is chosen from the dominating particles and the values of the particle’s objective functions are displayed in these figures.

Figure 13: The NSGAII algorithm’s dominant particles in the second scenario

Figure 14: The MOPSO algorithm’s dominant particles in the second scenario
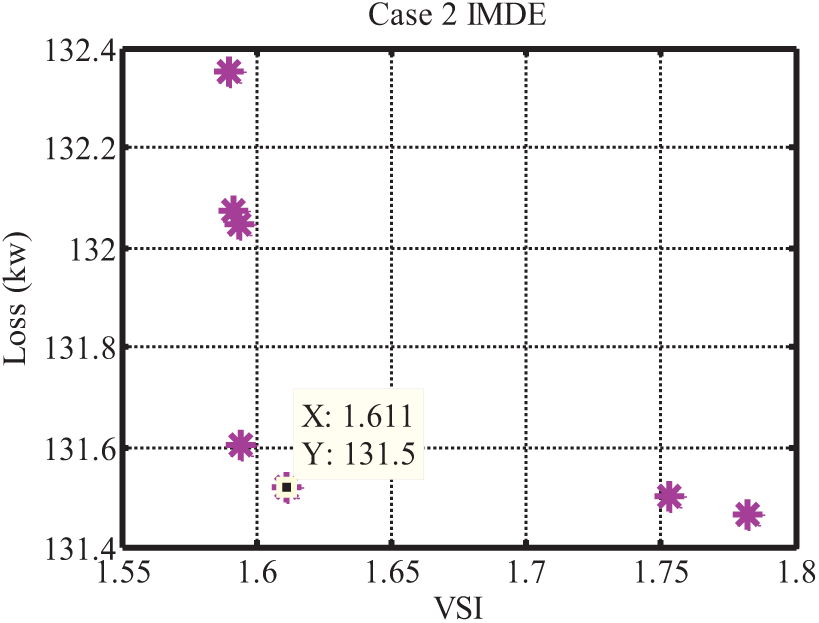
Figure 15: The IMDE algorithm’s dominant particles in the second scenario
The values of f1 and f2 functions for the selected particle in the dominant particles obtained by the NSGAII algorithm are 28.53 and 1.193, respectively, whereas the values of the f1 and f2 functions for the selected particle in the MOPSO algorithm are 164.6 and 1.106, respectively, and for the IMDE algorithm are 131.5 and 1.611. The location of the NSGAII algorithm’s dominant values (Rep) is summarized in Table 5. These particles have smaller losses and a lower voltage stability function value than other particles.

The fifth particle was chosen among the dominant particles (Rep). Then, in Table 6, the results for the three algorithms IMDE, MOPSO, and NSGAII are presented for the selected particle in the second scenario.

Bus 16 is proposed to install capacitor bank resources with a capacity of 1300 kW based on the results of the algorithm’s preferred particle. In this situation, the system must have switches 8, 14, 17, 24, and 33 open and all other network switches locked. The proposed distribution system lines have an ohmic loss of131.52 kW. In this instance, the losses have been reduced by around 37.66 percent. The voltage stability index (VSI) of this device is 1.611. In the case of MOPSO optimization, bus 31 was chosen for the installation of reactive power sources with a capacity of 1350 kW. In this situation, switches 7, 8, 28, 34, and 35 must be open, while the remaining network switches must be closed. The overall ohmic losses of the lines have been decreased by 164.59 kW, representing a 22% reduction in losses over the system’s baseline losses. This algorithm has a lower loss reduction than the IMDE algorithm. Additionally, the voltage stability function has a value of 1.106, which is higher than the values for the other two algorithms. If the NSGAII algorithm is used, bus 30 with a capacity of 1160 kW is chosen for capacitor bank installation. In the suggested switch layout, switches 8, 14, 17, 33, and 37 are in the open position, while the remaining switches remain closed. The losses for the algorithm’s selected particle have been lowered by roughly 86.47 percent to 28.53 kW in this scenario. The level of loss reduction achieved with the NSGAII algorithm is more than that achieved with the other two algorithms. Additionally, the voltage stability index (VSI) is calculated to be 1.193. The ohmic losses of each line are illustrated in Fig. 16 when the IMDE, MOPSO, and NSGAII algorithms are utilized.

Figure 16: Lines’ losses after reconfiguration and determining the location and capacity of the capacitor bank
In Fig. 16, the losses on the majority of lines are reduced compared to the baseline settings. By examining the figures, it is clear that the ohmic losses in the majority of the lines of the distribution system optimized by the NSGAII algorithm are fewer than those of the two other algorithms, IMDE and MOPSO. The SI standard value for each bus is calculated and displayed in Fig. 17 as a bar graph.

Figure 17: Measurement of bus voltage stability during reconfiguration and location, as well as determination of capacitor bank capacity
5.3 Third Scenario (Reconfiguration of the Switches and Determining the Location and Optimal Capacity of the DG Resources and the Capacitor Banks)
In the third scenario, switches are reconfigured and the location and capacity of DG resources and capacitor bank are determined optimally in the investigated 33-bus distribution system to lower losses and enhance the VSI voltage stability index.
The IMDE, MOPSO, and NSGAII multi-objective optimization techniques were used to accomplish this. The dominant particles in each of these three methods are depicted in Figs. 18 to 20. The value of dominant particles associated with the NSGAII algorithm is shown in Table 7. This time, the eighth particle was chosen as the preferred particle, with a loss of 23.13 kW and a voltage stability function value of 1.2574. The third scenario’s optimization results are summarized in Table 8 using three algorithms: IMDE, MOPSO, and NSGAII. According to the results in Table 8, bus 33 was chosen for the DG resource with a capacity of 1490 kVA, and bus 2 was chosen for the installation of a capacitor bank with a capacity of 1350 kV. According to the results of this simulation, switches 7, 11, 28, 29, and 35 should be in the open position, while the remaining switches should be in the closed position. The overall ohmic losses of the lines have been reduced by 75.57 percent to 51.35 kW in this scenario. Additionally, the voltage stability index (VSI) has reached a value of 2.105.

Figure 18: The NSGAII algorithm’s dominant particles in the second scenario
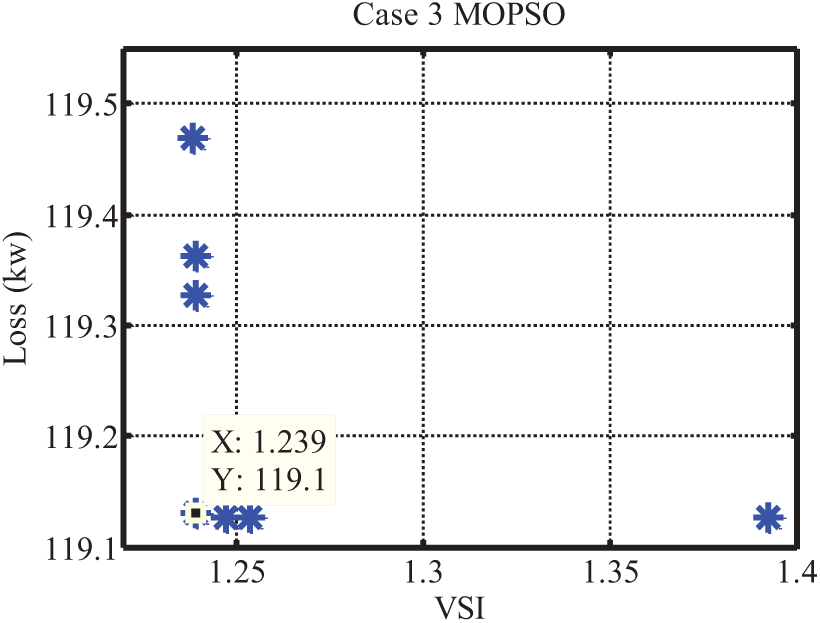
Figure 19: The NSGAII algorithm’s dominant particles in the second scenario

Figure 20: The NSGAII algorithm’s dominant particles in the second scenario


However, when the MOPSO algorithm is used for optimization, buses 2 and 31 are offered for the installation of a DG resource with a capacity of 1600 kVA and a capacitor bank with a capacity of 670 kV, respectively. In this situation, switches 7, 32, 34, 35, and 36 must all be closed, as well as the other network switches. In this scenario, the ohmic loss of the lines is 119.13 kW, and the loss reduction is nearly equal to 43.54 percent.
Additionally, the voltage stability function has been decreased to 1.2391. Now, if the NSGAII algorithm is utilized, a DG with an 880 kV capacity is offered for bus 12, and a capacitor bank with a 430 kV capacity is proposed for bus 30. In the suggested switch configuration, switches 7, 8, 12, 17, and 28 are open, while the remaining switches are closed. The losses have been reduced by 59% to 23.13 kW in this example. The losses associated with the NSGAII algorithm are fewer than those associated with the MOPSO and DE algorithms. Additionally, the voltage stability index (VSI) is calculated to be 1.2574. The ohmic loss values for each line are displayed in Fig. 21 when the IMDE, MOPSO, and NSGAII algorithms are applied.
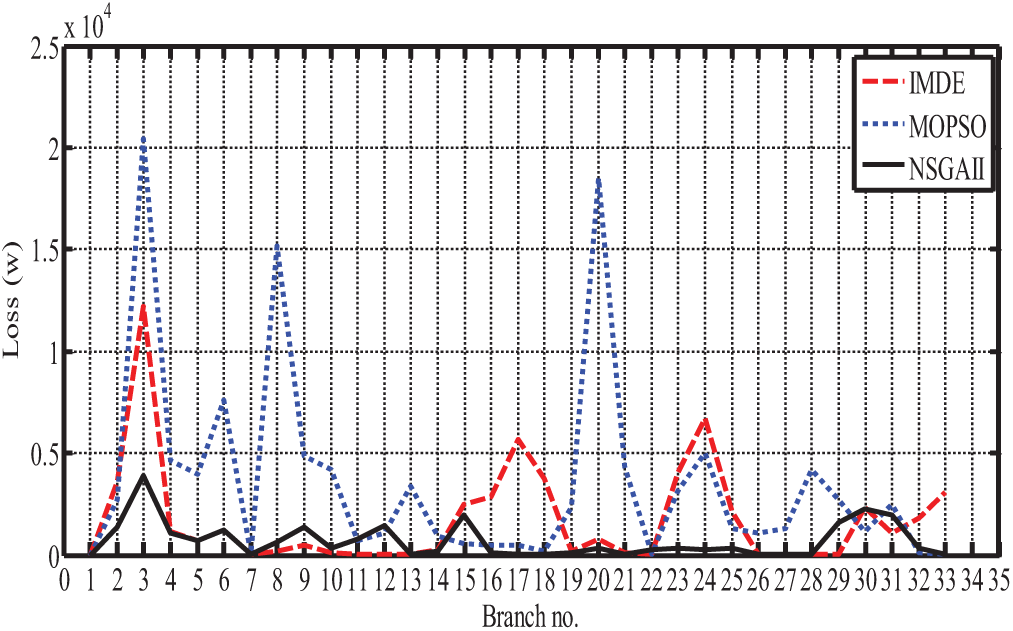
Figure 21: Line losses following reconfiguration and location, as well as the determination of DG capacity
As illustrated in Fig. 21, the ohmic losses of practically all lines in the study distribution system optimized using the NSGAII method are fewer than those obtained using the IMDE and MOPSO algorithms. The following section calculates the SI criteria value for all buses and displays it as a bar graph in Fig. 22.

Figure 22: Voltage stability measure after reconfiguration and location, as well as the determination of DG capacity
5.4 Comparison of the Algorithms
To analyze the simulation results in the three scenarios in detail, their metric distance criteria were compared. As previously stated, the population size and maximum iteration time for all algorithms are the same. Each algorithm was executed twenty times, and ten Pareto particles were stored. The ideal Pareto should have evenly distributed solutions. If the dominant particles are uniformly distributed, greater variation in selecting the best solution from the Pareto front is conceivable. To evaluate the performance of an equally distributed Pareto solution, the distance criteria can be defined as the variance of each solution’s distance to its nearest neighbor:
where di is the distance between the ith particle and its nearest neighbor and
A smaller metric distance value signifies that the solutions in the Pareto set are more evenly distributed, while a value of zero indicates that all solutions in the Pareto set are equally spaced (Fig. 23).
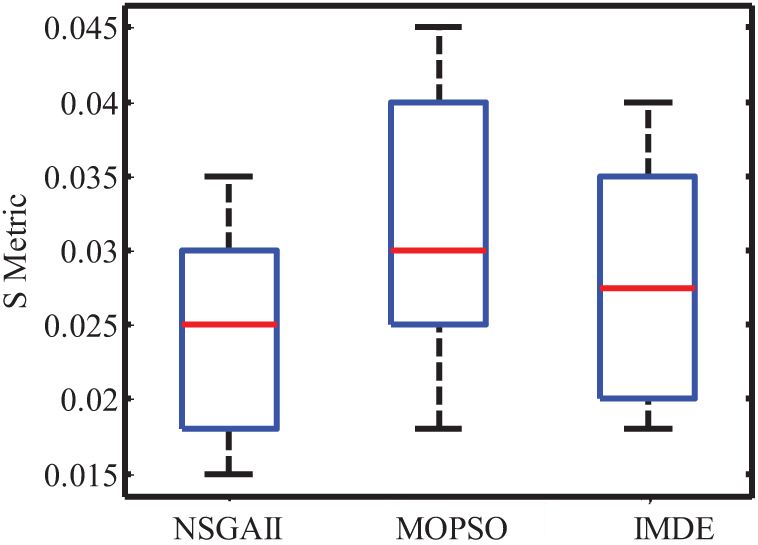
Figure 23: Metric distance
The horizontal lines at the top and bottom reflect the front values. The square box contains half of the metric distance data, whereas the red line displays the average metric distance values. In comparison to the other three algorithms, the suggested NSGAII approach produces the smallest mean value and metric distance. The NSGAII algorithm’s lower horizontal line is lower than that of other algorithms. Consequently, this method outperformed others in terms of identifying uniform distribution solutions and Pareto fronts.
This paper presented an optimization approach using the NSGA-II, MOPSO, and IMDE algorithms for the optimal reconfiguration of distribution systems, as well as for determining the location and capacity of distributed generation resources and capacitor banks. Three scenarios were analyzed: The first scenario focused on the optimal placement and sizing of distributed generation resources while reconfiguring switches in the conventional 33-bus distribution system. The losses in this scenario were 28.45 kW, and the voltage stability value was 0.963. The second scenario addressed the optimal placement and sizing of capacitor banks while reconfiguring switches in the same distribution system. The losses in this scenario were 26.39 kW, and the voltage stability value was 0.970. The third scenario involved the simultaneous reconfiguration of switches and the optimization of both distributed generation resources and capacitor banks. The losses in this scenario were 23.13 kW, and the voltage stability value was 0.977. Among the three algorithms, the NSGA-II method outperformed MOPSO and IMDE, achieving the lowest losses and best voltage stability across all scenarios.
Future research could explore the integration of renewable energy sources, the inclusion of dynamic load variations, and the use of stochastic optimization techniques for better handling uncertainties. Additionally, investigating the performance of other algorithms, such as Particle Swarm Optimization or Artificial Bee Colony, and addressing the impact of communication delays in smart grids could further improve system optimization and real-time applications. Finally, evaluating the environmental and economic feasibility of these solutions would provide a more comprehensive understanding of their long-term benefits.
Acknowledgement: Not applicable.
Funding Statement: The authors received no specific funding for this study.
Author Contributions: The authors confirm contribution to the paper as follows: Conceptualization, Tareq Hamadneh, Belal Batiha, Mehrdad Ahmadi Kamarposhti, Frank Werner, Ilhami Colak and El Manaa Barhoumi; methodology, Tareq Hamadneh, Belal Batiha, Mehrdad Ahmadi Kamarposhti, Frank Werner, Ilhami Colak and El Manaa Barhoumi; software, Tareq Hamadneh, Belal Batiha, Mehrdad Ahmadi Kamarposhti, Frank Werner, Ilhami Colak and El Manaa Barhoumi; validation, Tareq Hamadneh, Belal Batiha, Mehrdad Ahmadi Kamarposhti, Frank Werner, Ilhami Colak and El Manaa Barhoumi; formal analysis, Tareq Hamadneh, Belal Batiha, Mehrdad Ahmadi Kamarposhti, Frank Werner, Ilhami Colak and El Manaa Barhoumi; investigation, Tareq Hamadneh, Belal Batiha, Mehrdad Ahmadi Kamarposhti, Frank Werner, Ilhami Colak and El Manaa Barhoumi; resources, Mehrdad Ahmadi Kamarposhti, Frank Werner and El Manaa Barhoumi; data curation, Tareq Hamadneh, Belal Batiha, Mehrdad Ahmadi Kamarposhti, Frank Werner, Ilhami Colak and El Manaa Barhoumi; writing—original draft preparation, Mehrdad Ahmadi Kamarposhti, Frank Werner and El Manaa Barhoumi; writing—review and editing, Tareq Hamadneh, Belal Batiha, Mehrdad Ahmadi Kamarposhti, Frank Werner, Ilhami Colak and El Manaa Barhoumi; visualization, Tareq Hamadneh, Belal Batiha, Mehrdad Ahmadi Kamarposhti, Frank Werner, Ilhami Colak and El Manaa Barhoumi; supervision, Mehrdad Ahmadi Kamarposhti, Frank Werner and Ilhami Colak; project administration, Mehrdad Ahmadi Kamarposhti, Frank Werner, Ilhami Colak and El Manaa Barhoumi; funding acquisition, Tareq Hamadneh, Belal Batiha, Mehrdad Ahmadi Kamarposhti, Frank Werner, Ilhami Colak and El Manaa Barhoumi. All authors reviewed the results and approved the final version of the manuscript.
Availability of Data and Materials: Not applicable.
Ethics Approval: Not applicable.
Conflicts of Interest: The authors declare no conflicts of interest to report regarding the present study.
References
1. Duan DL, Ling XD, Wu XY, Zhong B. Reconfiguration of distribution network for loss reduction and reliability improvement based on enhanced genetic algorithm. Electr Power Syst Res. 2015;64(2):88–95. doi:10.1016/j.ijepes.2014.07.036. [Google Scholar] [CrossRef]
2. Teimourzadeh S, Zare K. Application of binary group search optimization to distribution network reconfiguration. Electr Power Syst Res. 2014;62:461–8. doi:10.1016/j.ijepes.2014.04.064. [Google Scholar] [CrossRef]
3. Kansal S, Kumar V, Tyagi B. Optimal placement of different type of DG sources in distribution networks. Int J Electr Power Energy Syst. 2013;53(1):752–60. doi:10.1016/j.ijepes.2013.05.040. [Google Scholar] [CrossRef]
4. Antunes CH, Pires DF, Barrico C, Gomes A, Martins AG. A multi-objective evolutionary algorithm for reactive power compensation in distribution networks. Electr Power Syst Res. 2009;86(7–8):977–84. doi:10.1016/j.apenergy.2008.09.008. [Google Scholar] [CrossRef]
5. Milosevic B, Begovic M. Capacitor placement for conservative voltage reduction on distribution feeders. IEEE Trans Power Delivery. 2004;19(3):1360–7. doi:10.1109/TPWRD.2004.824400. [Google Scholar] [CrossRef]
6. Sajjadi SM, Haghifam MR, Salehi J. Simultaneous placement of distributed generation and capacitors in distribution networks considering voltage stability index. Int J Electr Power Energy Syst. 2013;46:366–75. doi:10.1016/j.ijepes.2012.10.027. [Google Scholar] [CrossRef]
7. Biswas PP, Mallipeddi R, Suganthan PN, Amaratunga GAJ. A multiobjective approach for optimal placement and sizing of distributed generators and capacitors in distribution network. Appl Soft Comput. 2017;60(5):268–80. doi:10.1016/j.asoc.2017.07.004. [Google Scholar] [CrossRef]
8. Nguyen TT, Nguyen TT, Truong AV, Nguyen QT, Phung TA. Multi-objective electric distribution network reconfiguration solution using runner-root algorithm. Appl Soft Comput. 2017;52(1):93–108. doi:10.1016/j.asoc.2016.12.018. [Google Scholar] [CrossRef]
9. Kanwar N, Gupta N, Niazi KR, Swarnkar A. An integrated approach for distributed resource allocation and network reconfiguration considering load diversity among customers. Sustain Energy Grids Netw. 2016;7(3–4):37–46. doi:10.1016/j.segan.2016.05.002. [Google Scholar] [CrossRef]
10. Peponis GJ, Papadopulos MP, Hatziargyriou ND. Optimal operation of distribution networks. IEEE Trans Power Syst. 1996;11(1):59–67. doi:10.1109/59.485986. [Google Scholar] [CrossRef]
11. Dan J, Baldick R. Optimal electric distribution system switch reconfiguration and capacitor control. IEEE Trans Power Syst. 1996;11(2):890–7. doi:10.1109/59.496167. [Google Scholar] [CrossRef]
12. Su CT, Lee CS. Feeder reconfiguration and capacitor setting for loss reduction of distribution systems. Electr Power Syst Res. 2001;58(2):97–102. doi:10.1016/S0378-7796(01)00122-6. [Google Scholar] [CrossRef]
13. Zhang D, Fu Z, Zhang L. Joint optimization for power loss reduction in distribution systems. IEEE Trans Power Syst. 2008;23(1):161–9. doi:10.1109/TPWRS.2008.919318. [Google Scholar] [CrossRef]
14. Chang CF. Reconfiguration and capacitor placement for loss reduction of distribution systems by ant colony search algorithm. IEEE Trans Power Syst. 2008;23(4):1747–55. doi:10.1109/TPWRS.2008.2001365. [Google Scholar] [CrossRef]
15. Yang L, Guo Z. Comprehensive optimization for energy loss reduction in distribution networks. In: 2008 IEEE Power and Energy Society General Meeting-Conversion and Delivery of Electrical Energy in the 21st Century; 2008; Pittsburgh, PA, USA. p. 1–8. doi:10.1109/PES.2008.4596032. [Google Scholar] [CrossRef]
16. De Oliveira LW, Carneiro SJr, de Oliveira EJ, Pereira JLR, Silva ICJr, Costa JS. Optimal reconfiguration and capacitor allocation in radial distribution systems for energy losses minimization. Int J Electr Power Energy Syst. 2010;32(8):840–8. doi:10.1016/j.ijepes.2009.11.013. [Google Scholar] [CrossRef]
17. Rezaei P, Vakilian M. Distribution system efficiency improvement by reconfiguration and capacitor placement using a modified particle swarm optimization algorithm. In: 2010 IEEE Electrical Power & Energy Conference; 2010; Halifax, NS, Canada. p. 1–6. doi:10.1109/EPEC.2010.5697205. [Google Scholar] [CrossRef]
18. Muthukumar K, Jayalalitha S. Integrated approach of network reconfiguration with distributed generation and shunt capacitors placement for power loss minimization in radial distribution networks. Appl Soft Comput. 2017;52(11):1262–84. doi:10.1016/j.asoc.2016.07.031. [Google Scholar] [CrossRef]
19. Wang HJ, Pan JS, Nguyen TT, Weng S. Distribution network reconfiguration with distributed generation based on parallel slime mould algorithm. Energy. 2022;244(9):123011. doi:10.1016/j.energy.2021.123011. [Google Scholar] [CrossRef]
20. Fathi R, Tousi B, Galvani S. Allocation of renewable resources with radial distribution network reconfiguration using improved salp swarm algorithm. Appl Soft Comput. 2023;132(4):109828. doi:10.1016/j.asoc.2022.109828. [Google Scholar] [CrossRef]
21. Stojanović B, Rajić T, Šošić D. Distribution network reconfiguration and reactive power compensation using a hybrid Simulated Annealing-Minimum spanning tree algorithm. Int J Electr Power Energy Syst. 2023;147(3):108829. doi:10.1016/j.ijepes.2022.108829. [Google Scholar] [CrossRef]
22. Adegoke SA, Sun Y, Wang Z, Oladipo S. Network reconfiguration using hybrid archimedes optimization algorithm for multiobjective functions. J Electr Comput Eng. 2024;2024(1):6682046. doi:10.1155/jece/6682046. [Google Scholar] [CrossRef]
23. Adegoke SA, Sun Y, Adegoke AS, Ojeniyi D. Optimal placement of distributed generation to minimize power loss and improve voltage stability. Heliyon. 2024;10(21):e39298. doi:10.1016/j.heliyon.2024.e39298. [Google Scholar] [PubMed] [CrossRef]
24. Brown R, Pan I, Feng X, Koudev K. Siting distributed generation to defer T&D expansion. Proc IEEE T&D Conf. 2001;2:622–7. [Google Scholar]
25. Puttgen HB, MacGregor PR, Lambert FC. Distributed generation: semantic hype or the dawn of a new era. IEEE Trans Power Energy. 2003;1(1):22–9. doi:10.1109/TPWRD.2003.813840. [Google Scholar] [CrossRef]
26. Ng HN, Salama MMA, Chikhami AY. Classification of capacitor allocation techniques. IEEE Trans Power Delivery. 2000;15(1):387–92. doi:10.1109/61.847250. [Google Scholar] [CrossRef]
27. Glamocanin V. Optimal loss reduction of distribution network. IEEE Trans PWRS. 1990;5(3):752–60. doi:10.1109/59.66611. [Google Scholar] [CrossRef]
28. Deb K, Agrawal S, Pratap A, Meyarivan T. A fast elitist non-dominated sorting genetic algorithm for multi-objective optimization: nSGA-II. In: Schoenauer M, et al. editor. Parallel problem solving from nature PPSN VI. Berlin/Heidelberg, Germany: Springer; 2000. p. 849–58. doi:10.1007/3-540-45356-3_83. [Google Scholar] [CrossRef]
29. Qawaqneh H. New contraction embedded with simulation function and cyclic (α, β)-admissible in metriclike spaces. Int J Math Comput Sci. 2020;15(4):1029–44. doi:10.28945/4456. [Google Scholar] [CrossRef]
30. Hamadneh T, Athanasopoulos N, Ali M. Minimization and positivity of the tensorial rational Bernstein form. In: IEEE Jordan International Joint Conference on Electrical Engineering and Information Technology (JEEIT-Proceedings); 2019; Amman, Jordan. p. 1–6. doi:10.1109/JEEIT.2019.8717423. [Google Scholar] [CrossRef]
31. Sun G, Xu Z, Yu H, Chang V. Dynamic network function provisioning to enable network in box for industrial applications. IEEE Trans Ind Inform. 2021;17(10):7155–64. doi:10.1109/TII.2020.3042872. [Google Scholar] [CrossRef]
32. Sun G, Wang Y, Yu H, Guizani M. Proportional fairness-aware task scheduling in space-air-ground integrated networks. IEEE Trans Serv Comput. 2024;17(6):4125–37. doi:10.1109/TSC.2024.3478730. [Google Scholar] [CrossRef]
33. Zhang J, Li H, Kong X, Zhou J, Shi G, Zang J, et al. A novel multiple-medium-AC-port power electronic transformer. IEEE Trans Ind Electron. 2024;71(7):6568–78. doi:10.1109/TIE.2023.3301550. [Google Scholar] [CrossRef]
34. Zhang J, Feng X, Zhou J, Zang J, Wang J, Shi G et al. Series-shunt multiport soft normally open points. IEEE Trans Ind Electron. 2023;70(11):10811–21. doi:10.1109/TIE.2022.3229375. [Google Scholar] [CrossRef]
35. Li S, Zhou J, Zhou F, Niu F, Deng W. A reduced current ripple overmodulation strategy for indirect matrix converter. IEEE Trans Ind Electron. 2025;72(4):3768–77. doi:10.1109/TIE.2024.3453934. [Google Scholar] [CrossRef]
36. Miao Z, Meng X, Li X, Liang B, Watanabe H. Enhancement of net output power of thermoelectric modules with a novel air-water combination. Appl Therm Eng. 2025;258(162):124745. doi:10.1016/j.applthermaleng.2024.124745. [Google Scholar] [CrossRef]
37. Li N, Zhang C, Liu Y, Zhuo C, Liu M, Yang J, et al. Single-degree-of-freedom hybrid modulation strategy and light-load efficiency optimization for dual-active-bridge converter. IEEE J Emerg Sel Top Power Electron. 2024;12(4):3936–47. doi:10.1109/JESTPE.2024.3396340. [Google Scholar] [CrossRef]
38. Wang X, Guo Q, Tu C, Che L, Xu Z, Xiao F, et al. A comprehensive control strategy for F-SOP considering three-phase imbalance and economic operation in ISLDN. IEEE Trans Sustain Energy. 2025;16(1):149–59. doi:10.1109/TSTE.2024.3444794. [Google Scholar] [CrossRef]
39. Zhang X, Zhu Q, Wang S, Ma T, Gao S, Kong Y, et al. Hybrid triboelectric-variable reluctance generator assisted wireless intelligent condition monitoring of aero-engine main bearings. Nano Energy. 2025;136:110721. doi:10.1016/j.nanoen.2025.110721. [Google Scholar] [CrossRef]
40. Lin L, Liu J, Huang N, Li S, Zhang Y. Multiscale spatio-temporal feature fusion based non-intrusive appliance load monitoring for multiple industrial industries. Appl Soft Comput. 2024;167:112445. doi:10.1016/j.asoc.2024.112445. [Google Scholar] [CrossRef]
41. Lin L, Ma X, Chen C, Xu J, Huang N. Imbalanced industrial load identification based on optimized CatBoost with entropy features. J Electr Eng Technol. 2024;19(8):4817–32. doi:10.1007/s42835-024-01933-5. [Google Scholar] [CrossRef]
42. Gao S, Chen Y, Song Y, Yu Z, Wang Y. An efficient half-bridge MMC model for EMTP-type simulation based on hybrid numerical integration. IEEE Trans Power Syst. 2024;39(1):1162–77. doi:10.1109/TPWRS.2023.3262584. [Google Scholar] [CrossRef]
43. Hui H, Bao M, Ding Y, Meinrenken CJ. Incorporating multi-energy industrial parks into power system operations: a high-dimensional flexible region method. IEEE Trans Smart Grid. 2025;16(1):463–77. doi:10.1109/TSG.2024.3426997. [Google Scholar] [CrossRef]
44. Zhang M, Cai S, Xie Y, Zhou B, Zheng W, Wu Q, et al. Supply resilience constrained scheduling of MEGs for distribution system restoration: a stochastic model and FW-PH algorithm. IEEE Trans Smart Grid. 2025;16(1):194–208. doi:10.1109/TSG.2024.3446873. [Google Scholar] [CrossRef]
45. Xia Y, Huang Y, Fang J. A generalized Nash-in-Nash bargaining solution to allocating energy loss and network usage cost of buildings in peer-to-peer trading market. Sustain Energ Grids Netw. 2025;42(1):101628. doi:10.1016/j.segan.2025.101628. [Google Scholar] [CrossRef]
46. Zhao H, Zong Q, Zhou H, Yao W, Sun K, Zhou Y et al. Frequency-voltage active support strategy for hybrid wind farms based on grid-following and grid-forming hierarchical subgroup control. CSEE J Power Energy Syst. 2025;11(1):65–77. doi:10.17775/CSEEJPES.2024.02340. [Google Scholar] [CrossRef]
47. Yang M, Han C, Zhang W, Fang G, Jia Y. A short-term power prediction method based on numerical weather prediction correction and the fusion of adaptive spatiotemporal graph feature information for wind farm cluster. Expert Syst Appl. 2025;274(4):126979. doi:10.1016/j.eswa.2025.126979. [Google Scholar] [CrossRef]
Cite This Article
 Copyright © 2025 The Author(s). Published by Tech Science Press.
This work is licensed under a Creative Commons Attribution 4.0 International License , which permits unrestricted use, distribution, and reproduction in any medium, provided the original work is properly cited.
 Downloads
 Citation Tools