
 Submit a Paper
 Propose a Special lssue
 Open Access
ARTICLE

DriveMe: Towards Lightweight and Practical Driver Authentication System Using Single-Sensor Pressure Data
1 Division of Computer Engineering, Hankuk University of Foreign Studies, Yongin-si, 17035, Republic of Korea
2 Department of Information Security, Sejong University, Seoul, 05006, Republic of Korea
* Corresponding Author: Ki-Woong Park. Email:
(This article belongs to the Special Issue: Cutting-Edge Security and Privacy Solutions for Next-Generation Intelligent Mobile Internet Technologies and Applications)
Computer Modeling in Engineering & Sciences 2025, 143(2), 2361-2389. https://doi.org/10.32604/cmes.2025.063819
Received 24 January 2025; Accepted 25 March 2025; Issue published 30 May 2025
 View Full Text
 Download PDF
Abstract
To date, many previous studies have been proposed for driver authentication; however, these solutions have many shortcomings and are still far from practical for real-world applications. In this paper, we tackle the shortcomings of the existing solutions and reach toward proposing a lightweight and practical authentication system, dubbed DriveMe, for identifying drivers on cars. Our novelty aspects are ① Lightweight scheme that depends only on a single sensor data (i.e., pressure readings) attached to the driver’s seat and belt. ② Practical evaluation in which one-class authentication models are trained from only the owner users and tested using data collected from both owners and attackers. ③ Rapid Authentication to quickly identify drivers’ identities using a few pressure samples collected within short durations (1, 2, 3, 5, or 10 s). ④ Realistic experiments where the sensory data is collected from real experiments rather than computer simulation tools. We conducted real experiments and collected about 13,200 samples and 22,800 samples of belt-only and seat-only datasets from all 12 users under different settings. To evaluate system effectiveness, we implemented extensive evaluation scenarios using four one-class detectors One-Class Support Vector Machine (OCSVM), Local Outlier Factor (LOF), Isolation Forest (IF), and Elliptic Envelope (EE), three dataset types (belt-only, seat-only, and fusion), and four different dataset sizes. Our average experimental results show that the system can authenticate the driver with an F1 score of 93.1% for seat-based data using OCSVM classifier, an F1 score of 98.53% for fusion-based data using LOF classifier, an F1 score of 91.65% for fusion-based data using IF classifier, and an F1 score of 95.79% for fusion-based data using EE classifier.Keywords
To identify the identity of drivers, many driver-based authentication solutions are proposed by monitoring behavioral attributes and fingerprinting driving habits of drivers using collecting sensory data from various devices in cars such as controller area network (CAN) bus as well as exploiting smartphones [1–3]. We have gone through many of these studies and found that there are many security issues and limitations that keep them away from practicality and generality and need to be addressed to provide more secure vehicles. First, we found that many studies rely on various controllers (e.g., brake pedal, steering wheel, engine speed, on-board diagnostics-II OBD-II, accelerator, and vehicle speed) [4–6] to collect large amounts of data on the CAN bus and share it through networks for authenticating drivers. These systems seem slow in response (i.e., needs a long time about 8 to 15 min) [7–9] and vulnerable to cyber-attacks [10]. Second, the camera was used for many face and eye-based recognition systems by recording the driver’s face and building in-car face fingerprints for authenticating drivers with the aid of deep learning [11,12]. However, this kind of solution has many limitations that restrict authentication performance such as extreme illumination change, different head poses, covering the face, wearing glasses, and multiple face appearances. Third, other proposals focused on collecting location, time, and accelerometer measurements from GPS devices to extract users’ daily driving information such as speed, routes, and destinations [13,14]. Besides that, these studies are vulnerable to location and time spoofing attacks, they suffer from severe privacy violations in which GPS data includes time synchronization and private location data. Fourth, rather than collecting actual data from drivers on cars, many previous studies generated computer-based data from various simulators and used it for evaluating driver authentication [3,5,15–17]—which limits its performance in real-world usage. Finally, wireless signals such as 5G-assisted vehicular authentication schemes [18,19], channel state information (CSI), and Radio Frequency (RF) signals (e.g., Wi-Fi or Bluetooth) collected from portable devices (e.g., smartphones and laptops) are also used in many existing studies [20–23]. However, it is difficult to extract constant driving patterns from the characteristics of wireless signals because of multi-path propagation issues in cars and various specifications of antennas which increase the system cost and add security threats.
Therefore, to bridge the gap, we tackle the shortcomings of the existing solutions and propose novel design goals for our driver authentication systems as follows. First (Lightweight) in which our system relies only on data collected from a single-pressure sensor instead of involving data from many sensors on the CAN bus, GPS, camera, or smartphones. Second, our system is costless in that no CAN bus, CSI cards, or smartphones are required as external devices for identifying drivers –which makes the system widely applicable. Third, rapid authentication, we target to authenticate the driver’s identity using a few samples of pressure data that are collected within a few seconds (sample amounts are collected in 1, 2, 3, 5, or 10 s). Fourth, realistic experiments, in which the datasets are collected from real experiments and implementations rather than conducting simulation data using tools on computers. Finally, our system does not rely on any privacy-violation data such as GPS collecting time and location information nor camera recording faces, instead it supports privacy-preserving since it depends only on pressure data which has no privacy violation.
Authenticating the driver’s identity using only a single sensor of pressure data is a challenging task because various factors related to users (e.g., body weight, width, height, clothes, seating position, etc.) affect the system performance of authentication. The work in this paper focuses on investigating the feasibility of whether a few samples of pressure data that should be collected in some seconds are enough to authenticate a driver’s identity or not. To verify this, we proposed to use the driver’s belt and seat as suitable locations to install pressure sensors in the car. Then, we asked a group of 12 volunteers who have diverse characteristics to conduct real experiments and collect pressure datasets under various settings and many iterations of evaluations. We also implemented practical evaluation by creating one-class machine-learning models that trained only on the car owner’s pressure data and tested using unseen data from other users considered attackers. Therefore, the main goal of this work is to investigate the feasibility of achieving good authentication performance and fast authentication time in which a driver can be correctly identified using only a few samples of data that are collected within a few seconds.
Here, we summarize our work’s contributions as follows.
1. We propose a novel, lightweight, practical, and fast driver authentication system using data acquired from only pressure sensors equipped in the driver’s belt and seat.
2. We conducted real experiments, rather than using computer simulators, by installing 60 pressure sensors on the driver’s seat (30 on the belt and 30 on the seat) and collected real-world datasets from 12 users, each of them repeated for 10 iterations under different settings.
3. We constructed four one-class machine-learning models and evaluated the system using three dataset types (Belt-based, Seat-based, fusion: Belt+Seat) and several different sample sizes collected in (1, 2, 3, 5, and 10 s).
4. Our experimental results show the effectiveness of the proposed system by achieving the best average performance of an F1 score of 93.1% for seat-based data using One-Class Support Vector Machine (OCSVM) classifier, an F1 score of 98.53% for fusion-based data using Local Outlier Factor (LOF) classifier, an F1 score of 91.65% for fusion-based data using Isolation Forest (IF) classifier, and an F1 score of 95.79% for fusion-based data using Elliptic Envelope (EE) classifier.
The remainder of this paper is structured as follows. In Section 2, we review related works. In Section 3, we present the design overview of DriveMe and demonstrate the dataset collection details of our work. In Section 4, we explain models’ learning algorithms and different settings of evaluations. Section 5 shows system performance and experiments’ results from various evaluation approaches. We explain a discussion and limitations of the work in Section 6. We finally provide our conclusion and directions for future work in Section 7.
In this section, we provide a comprehensive review of the related works from the perspective of driver authentication. Many previous studies have focused on collecting sensory data from the controller area network (CAN) from various devices and circuits in the car. Xun et al. [24] proposed an automobile fingerprinting scheme by studying the behavioral characteristics of the drivers using data collected from the CAN bus in two vehicles. Banerjee et al. [13] presented an approach to authenticating drivers using features extracted from GPS-only data, and achieved an overall mean area under the receiver operating characteristic curve (ROC) of 0.9. Regani et al. [20] exploited the unique radio-based biometric signals in the channel state information (CSI) for recognizing driver identity. Kwak et al. [23] investigated the auto theft of cars caused by the increasing number of computerized electric circuits. Burton et al. [15] addressed the problem of carjacking that may occur in the middle of a driving session. Recently, Xun et al. [25] addressed the problem of a fixed number of drivers based on their biometrics behaviors and proposed a growable scheme for adding a new authorized driver to the system. Xun et al. [26] established a multi-task learning network for driver authentication by extracting behavioral characteristics from the CAN bus data to conduct three tasks which are illegal driver detection, legal driver identification, and driving behavior evaluation.
Another direction of driver authentication research is to exploit the face fingerprinting and eye movements of the driver by using camera recording. Taha et al. [11] proposed a biometric-based continuous authentication by developing end-to-end learning of eye movement profiles and producing embeddings for identifying drivers. Borghi et al. [27] investigated that monitoring the upper body and head pose of the driver is the key task for driver authentication. Derman et al. [12] introduced a continuous driver authentication using face recognition and its features extracted from pre-trained convolution neural networks of 52 different subjects. Gupta et al. [28] addressed the problem of the reliability of drivers for on-demand rides and ride-sharing services such as Uber and Lyft companies. Also, many other proposals utilize facial features and use face recognition technology for developing solutions for detecting several issues of drivers while driving the cars such as driver fatigue detection, Distracted driving detection, and Driver drowsiness detection [29–31].
On the basis of previous research, we explore their shortcomings such as involving sensory data from many devices on the CAN bus in the car which are prone to cyber-threats and need a long time (a couple of minutes) to produce outputs and authenticate drivers, requiring sensitive data that disclose the privacy of driver’s locations and time such as GPS, or exploiting wireless sensing of the radio signal that suffer from severe multipath propagation [20,21,32]. Also, we found that most of the previous studies were based on simulation datasets collected from simulation tools on computers. All the above issues may limit the practical employment of these schemes for real-world applications. In contrast, our work uses a realistic dataset collected from a single pressure sensor that can be attached to the driver’s seat and belt, authenticate the driver in a few seconds with high accuracy, and preserve the privacy aspects of users.
Our work contributes to the literature as follows. (1) We provided a comprehensive view of the main shortcomings that are in the existing studies and focused on tackling the key constraints for developing a practical driver authentication system. (2) Most of the existing studies focused on improving authentication accuracy and neglected the other requirements and aspects that are required for practical deployment such as developing a lightweight system, way of evaluation, privacy concerns, and rapid authentication. (3) We extensively analyze how much each requirement can affect the accuracy of authentication and investigate usability measurements (e.g., authentication time and memory usage) for deploying a lightweight and practical authentication system. Note that since there is no directly related work conducted as DriveMe (i.e., with the same practical requirements that we addressed in this work), we could not directly compare DriveMe with previous studies. However, we list most related studies with comparable items in Table 1 to show the differences and advantages of our work compared to others.

3 System Design and Methodology
Here, we explain the system overview design and experiments that we conducted for the dataset collection process.
In this research, we were inspired by the shortcomings of the existing studies of driver authentication mentioned in the previous section to initiate the work’s idea. Therefore, the objective of this research is to investigate whether we can develop a lightweight (only using one sensor), fast (using a few seconds of pressure data collection), and accurate driver authentication system. Additionally, our system supports privacy-preserving and costless properties in which pressure data has no privacy violation, and no external devices are required.
Fig. 1 shows the overview of the main stages of the DriveMe system as follows. Stage 1: Data collection in which pressure measurements are collected from the sensors installed on the driver’s seat and built. Then, the data are continuously and automatically sent through the Arduino kit to the database in the server that is under our control. Stage 2: Learning and building models in which offline learning is executed on the server including preprocessing, building one-class machine-learning models for each user, and then saving them (.pickle) in the user’s directory for further processing such as online predictions. This stage is only conducted once for the legitimate users who are authorized to drive the car to build their pressure-based templates or profiles in the database. Stage 3: Driver authentication in which online classification takes place whenever legitimate or attacker users sit and drive the car. This happens when the sensors collect his/her pressure data for a few seconds and then send it to the server for authentication based on the models’ predictions and outputs. Stage 4: Warning the owner where a warning message can be sent to the owner’s smartphone in case the models predict that the tested sensory data does not belong to the legitimate user’s template. Note that, in this work, we only focus on investigating the feasibility of whether pressure-based authentication for drivers is effective enough and promising. We leave the development of sending warning messages to the owner’s smartphone for future work.

Figure 1: The pipeline of pressure data collection, preprocessing, model training, and authentication
3.2 Experiments of Dataset Collection Process
Here, we explain in detail the experiments that we conducted for the dataset collection process and its demography.
Fig. 2 shows the general description of how the development environment of our system was built for conducting real-world experiments and collecting real pressure datasets from persons who drive cars precisely. The development environment has three cascaded stages: (1) Sensors are installed on the car’s seat and belt, (2) a sensor shield is used to connect pressure sensors to an Arduino, and (3) an Arduino promicro type. The process works as follows. In the beginning, when a user sits on the car’s seat and wears the belt, the pressure sensors start generating reading values continuously (every 0.1 s), send the generated data via sensor shield to the Arduino Pro micro, and send it to our database. For conducting this scenario, we used two development languages which are C and Python, several libraries such as TensorFlow, Pandas, Numpy, etc., and some development tools such as Visual Studio Code for data visualization. We asked 12 volunteers to participate in the experiments of data collection. They are all undergraduate students (males and females), who have a background in computer science and applications, and they are informed about the experiment’s purpose. We collected pressure datasets from the belt (top and bottom) and the seat. Fig. 3a shows the way we installed the pressure sensors in three positions of the driver seat: (1) the top of the belt (15 sensors), (2) the bottom of the belt (15 sensors), and (3) the base of the seat (30 sensors). So, the fusion data is collected from both belt and seat positions (i.e., 60 sensors). Specifically, we intentionally asked participants to wear different heavy and light clothes as well as different setting postures as shown in Fig. 3b–d. These settings are important for studying many impacts that may directly affect the pressure measurements and then change the authentication performance.

Figure 2: Steps show how the development environment of our system was built (sensor-shield-Arduino)

Figure 3: Illustrations show the testbed of data collection experiments: (a) Driver seat attached with belt and seat pressure sensors. (b), (c), and (d) show participants under different postures, clothes, and gender settings
Furthermore, to make sure that all readings are collected correctly, we have implemented data distribution visualizations using visual studio code in which sensory data are shown and plotted live whenever a user sits in the driver’s seat and wears the belt. Fig. 4 shows an example of how pressure data distribution visualizations of all seat sensors are plotted providing values vary from 0 (dark blue) to 140 (yellow). The value of the pressure measured through the sensor for a certain period of time is shown in color. The bar representing 0 to 140 on the right is the color spectrum that matches the magnitude of the pressure. The participant’s data consists of the pressure measurements from the belt that were collected every


Figure 4: Pressure data distribution visualization
Therefore, for each experiment, we create two matrices of pressure dataset for each participant. The first matrix is called “belt-only” and has dimensions of

4 Implementation and Evaluation Settings
Here, we explain the preprocessing steps applied to the dataset, one-class driver-pressure detectors, and the evaluation algorithm that we used for assessing the performance of our system.
We first explored the whole dataset and found some missing values in some data samples (i.e., values of some sensors are missed from the rows) for both belt and seat data frames. For example, some samples that were collected during the 5 s of belt-only or 10 s of seat-only data frames have less than 30 values (ranging from 20 to less than 30 data points). Since we found that these incomplete samples are very few (usually less than 5 samples per user), we decided to remove them from the data frames. To input the data into the one-class model, we vertically contacted data frames from the ten iterations for each user so that models are sufficiently trained with enough samples to better understand the user’s behaviors and create an offline template that will be used later for online predictions. Then, we applied the “max-min” normalization method for the whole dataset to re-scale the pressure measurements to be within 0 and 1 values.
4.2 One-Class Driver-Pressure Learning Detectors
Several machine-learning-based techniques are used for one-class classification that involves fitting a model on the normal data and predicting whether new data is normal or an outlier/anomaly. In our work, we selected four common ML algorithms for performing a one-class detection as follows.
One-class SVM is an unsupervised algorithm that learns a decision function for novelty detection by classifying new data as similar or different to the training set. OCSVM is one of the most convenient methods to approach one-class problem statements, including anomaly detection. It works on the basic idea of minimizing the hypersphere of the single class of examples in training data and considers all the other samples outside the hypersphere to be outliers or out of training data distribution. We implemented OCSVM from SK-learn using the “OneClassSVM” library. The most hyperparameters of one-class SVM algorithm are kernel, gamma, and nu. In this work, we used the Kernel coefficient for “rbf’, gamma for (scale, auto, 0.001, 0.01, and 0.1), and nu for (0.001, 0.01, 0.1, 0.3, 0.5, 0.7).
4.2.2 Local Outlier Factor (LOF)
LOF is an unsupervised outlier detection focused on the locality given by k-nearest neighbors. Specifically, LOF measures the local deviation of the density of a given sample concerning its neighbors. By comparing a sample’s local density to its neighbors’ local densities, outliers are considered for those samples with a substantially lower density than their neighbors. We implemented LOF through SK-learn from class “sklearn.neighbors” class and the most hyperparameter of the one-class LOF algorithm are n-neighbors. In this work, we used n-neighbors = (10, 20, 50, 100, 1000, 10000).
Isolation Forest is a tree-based structure algorithm in which observations are isolated after randomly selecting a feature and then a split value between the maximum and minimum values of the selected feature. LOF represents a recursive partitioning to determine the number of splittings required to isolate a sample, ultimately equal to the path length between root and terminating nodes. This path length is a measure of decision function and the samples’ normality. Often, shorter path lengths for particular samples indicate they are anomalies. We implemented the IF detector through SK-learn from the “sklearn.ensemble” class and the most hyperparameter of the one-class IF algorithm is n-estimators. In this work, we used n-estimators = (10, 20, 50, 100, 500, 1000, 10000).
The Elliptic Envelope can be used as a supervised or unsupervised algorithm to model the data. EE is mostly used for detecting outliers in a Gaussian-distributed dataset. In detail, it represents the dataset as a high dimensional data Gaussian distribution with possible covariance between features. Then, EE finds Elliptical boundaries containing most data points and considers data that lies outside the elliptical boundary as outliers. We implemented the EE detector through SK-learn from the “sklearn.covariance” class and the most hyperparameter of the one-class EE algorithm is contamination. In this work, we used n-estimators = (0.00001, 0.0001, 0.001, 0.01, 0.1, 0.2, 0.3, 0.4, 0.5).
Finally, in Section 5, we provide experimental details about finding optimal hyperparameters of the four machine learning algorithms for accurate and practical driver authentication on cars.
During the training phase, we only used normal driver data collected from the owner user for creating models (one-class models). However, for the need to compute evaluation metrics of the performance of the DriveMe system, we need other users’ data as attackers. Therefore, we decided to loop across the 12 users in which each user’s data is considered one-time training to create a training model and then test it over all the remaining 11 users’ data one by one.
In each testing time, we calculate the F1 score, precision, recall, training time, and testing time. Fig. 5 describes the workflow of our evaluation process for the whole driver authentication system in which we started by collecting the raw pressure datasets, progressing them to remove missing readings of sensors, concatenating them, and normalizing all the measurement ranges to be within 0 and 1, and applying four one-class classifiers learning them with different train/test ratios, three dataset types, and four dataset sizes. To accurately evaluate our system, we selected five train/test split ratios which are 50/50, 60/40, 70/30, 80/20, and 90/10 for the three data types (belt-base, seat-based, and the fusion of them, and using four dataset sizes (A, B, C, and D) as shown in the Table 2. Since we have multiple arguments such as Data-Type, Data-Size, Model-Type, and Users in the work, we developed Algorithm 1 to explain the detailed evaluation process of our system as follows. First of all, we loop over each user so that we create one training model (OCSVM, LOF, IF, or EE), using one Data-Type (Belt, Seat, or Fusion), and using one Data-Size (Size A, Size B, Size C, and Size D). Then we tested that trained model using datasets from the other 11 users as attackers.

Figure 5: Describing the workflow of the evaluation process for the driver authentication system

In each of those training processes, we set the pre-determined values of each model hyperparameter and apply brute-force training iterations, collect all F1 scores for each iteration, and append all results for all combinations of hyperparameters. After that, we average all collected results per user and get the overall mean_F1 and Max_F1 scores under all combinations of hyperparameters. We calculated both mean_F1 and Max_F1 scores because we found that a user-trained model can produce different F1 scores when tested using the other 11 users’ datasets. For example, the model that is trained using the dataset of user 0 gives an F1 score when tested using user 1 data different than when tested using data from users 2, 3, . . . , etc. So, we computed the mean_F1 and max_F1 scores over all 11 users that were tested using the trained model of user 0. Then, we sorted the results in descending order based on the mean_F1 factor and selected the best hyperparameters corresponding to the highest F1 scores for each user’s trained model separately. Similarly, the process is repeated when the trained model is created from the remaining users in a round-roop manner (e.g., train model of user 1, user 2, . . . , user 11).
The above process has been repeated for the remaining model types, dataset sizes, and data types. Finally, we collected the results of all evaluation stages and showed them in detail in Section 5.
5 Performance and Evaluation Results
In this section, we demonstrate in detail the performance results under the aforementioned evaluation scenario and using the above variety of three input givens such as Data-Model (OCSVM, LOF, IF, or EE), Data-Type (Belt, Seat, or Fusion), and Data-Size (Size A, Size B, Size C, and Size D) to show the feasibility and effectiveness of our work.
Note that since we do not know what are the best hyperparameters of each model type that highly affect the performance of the system as well as what are the most effective train/test ratios, we used the brute force approach which a guaranteed way to find the best solutions by listing all possible candidate values of hyperparameters under each case of the three input givens Data-Model (OCSVM, LOF, IF, or EE), Data-Type (Belt, Seat, or Fusion), and Data-Size (A, B, C, and D). The brute force approach is a generic method and is not limited to any specific domain of problems. We know about the time complexity of brute force, however, we argue that this evaluation manner using the brute force approach is conducted only once to set up the best hyperparameters that support the best performance of our driver authentication system. After that, the selected hyperparameters will be automatically used for the designed system without executing the brute force approach. We provide below all the details about evaluation results collected using four different one-class classifiers (OCSVM, LOF, IF, and EE) under various settings such as data types, dataset sizes, and train/test split ratios.
5.1 Evaluation Method 1: Using OCSVM
Here, we demonstrate experiments conducted to choose the best optimal hyperparameters of one-class SVM and show the evaluation results for validating driver authentication.
The purpose of this experiment is to take into consideration the effect of several factors on the performance of driver authentication such as model hyperparameters (i.e., gamma and nu), train/test split ratios, data types, and data sizes. To do that, we ran the brute force approach over all possible candidates of these factors. Without loss of generality, in this evaluation method, we ran the Python code of OCSVM model for the 12 users and each user’s models should be trained with the following factors: five train/test split ratios (0.5, 0.6, 0.7, 0.8, 0.9), five gamma values (scale, auto, 0.001, 0.01, 0.1), six nu values (0.001, 0.01, 0.1, 0.3, 0.5, 0.7), three data types (Belt, Seat, Fusion), and four data sizes (Size A, Size B, Size C, Size D). By calculating the above factors, the total number of brute force evaluation iterations is equal to 12
For example, for Belt-based pressure data of Size A, we trained 12 OCSVM models (i.e., 12 users) and run the brute force approach using the hyperparameters: five train/test split ratios (50/50, 60/40, 70/30, 80/20, and 90/10), five gamma values (scale, auto, 0.001, 0.01, and 0.1), and six nu values (0.001, 0.01, 0.1, 0.3, 0.5, 0.7). So, we have checked 150 combinations of OCSVM hyperparameters (i.e., 5
After that, we averaged the 11 results of the trained user and computed his Mean_F1 and Max_F1 metrics. This is one result row when using one combination of hyperparameters for the trained user. We repeated over all 150 hyperparameters combinations (i.e., we got 150 result rows). After that, we sorted the 150 rows of results descending based on Mean_F1 values to choose the best hyperparameters combination for that trained user (i.e., user 0). This gives the first row of results in Table 3 where the trained model of user 0 showed Max_F1 = 94.91% and Mean_F1 = 92.75% values when using the best hyperparameters (gamma = 0.1, nu = 0.1, and Train/test ratio = 0.6). The same process was repeated when training the other 11 users (i.e., users 1, 2, . . . , 11) to show the results row from 1 to 11 in Table 3.

Note that, all results shown in Table 3 are only using Belt-based pressure data type with dataset Size A. Similarly, we have repeated the evaluation process but using seat-based data type with dataset size A as shown in Table 4 and using fusion-based data type with dataset size A as shown in Table 5. By looking at these three tables, we can see that Max_F1 and Mean_F1 scores vary based on dataset types (i.e., Belt, Seat, and Fusion) as well as vary among users (


Note that, in the same manner, we have created another nine evaluation tables of results using the same OCSVM model but under different settings such as size B, size C, and size D for the three dataset types (Belt, Seat, and Fusion). We did not add the nine tables because of page length limitation.
Instead, we plotted their overall driver authentication performance using the OCSVM algorithm under all possible settings. Fig. 6 shows Max_F1 and Mean_F1 scores using OCSVM under four different dataset sizes (A, B, C, and D) for three dataset types (Belt, Seat, and Fusion). This is important to compare what dataset type and dataset size provide the best driver authentication results. We can see in Fig. 6a that the seat-based dataset type with the size C provides the highest performance in terms of Max_F1 score of 93.1%. However, in terms of Mean_F1 scores (Fig. 6b), the best performance results were from the dataset of size A and size C using the belt-based dataset type of Mean_F1 scores equal to 88% and 88.1%, respectively. For OCSVM, we can see that the fusion dataset type does not work well and provides a bit lower performance for most cases of dataset sizes.

Figure 6: Illustrations show overall driver authentication performance using the OCSVM algorithm when considering different sizes (A, B, C, and D) of belt, seat, and fusion datasets with two settings. (a) Measuring maximum F1 scores. (b) Measuring mean F1 scores
5.2 Evaluation Method 2: Using LOF
Here, we demonstrate experiments conducted to choose the optimal hyperparameters of one-class LOF and show the evaluation results for validating driver authentication. The most important hyperparameter of the LOF classifier is considering the number of neighbors (parameter
For example, for Belt-based pressure data of Size A, we trained 12 LOF models (i.e., 12 users) and run the brute force approach using the above hyperparameters. Then, we averaged and sorted Max_F1 and Mean_F1 scores for each user to find the best hyperparameters that give best driver authentication performance. As shown in Table 6, we found that only


We plotted the overall driver authentication performance using the LOF algorithm under all possible settings. Fig. 7 shows Max_F1 and Mean_F1 scores using LOF under four different dataset sizes (A, B, C, and D) for three dataset types (Belt, Seat, and Fusion). We can compare different types and dataset sizes to provide the best driver authentication results. In opposite to the OCSVM model, we can see in Fig. 7a that the LOF model works using fusion_based dataset type with size B and size C providing the highest overall Max_F1 scores of 98.53% and 98.01%, respectively. Also, in terms of the Mean_F1 (Fig. 7b) scores, the LOF model still provides the best performance results using the same dataset of size B and size C with fusion-based dataset type of Mean_F1 scores equal to 93.66% and 95.96.1%, respectively. Finally, for the LOF model, we conclude two points: 1) Fusion_based dataset is the best choice with size B and C for the best performance of the system; 2) a few set of neighbors hyperparameter

Figure 7: Illustrations show overall driver authentication performance using the LOF algorithm when considering different sizes (A, B, C, and D) of belt, seat, and fusion datasets with two settings. (a) Measuring maximum F1 scores. (b) Measuring mean F1 scores
5.3 Evaluation Method 3: Using IF
Here, we demonstrate experiments conducted to choose the optimal hyperparameters of one-class IF and show the evaluation results for validating driver authentication. The Isolation Forest algorithm returns the anomaly score of each sample. It “isolates” observations by randomly selecting a feature and then randomly selecting a split value between the maximum and minimum values of the selected feature. The most important hyperparameter of the IF classifier is considering the number of base estimators in the ensemble
During the experiments of the IF classifier, we followed the same training and evaluating process as explained for OCSVM and LOF classifiers. In detail, we considered the effect of the following factors: model hyperparameters (i.e.,


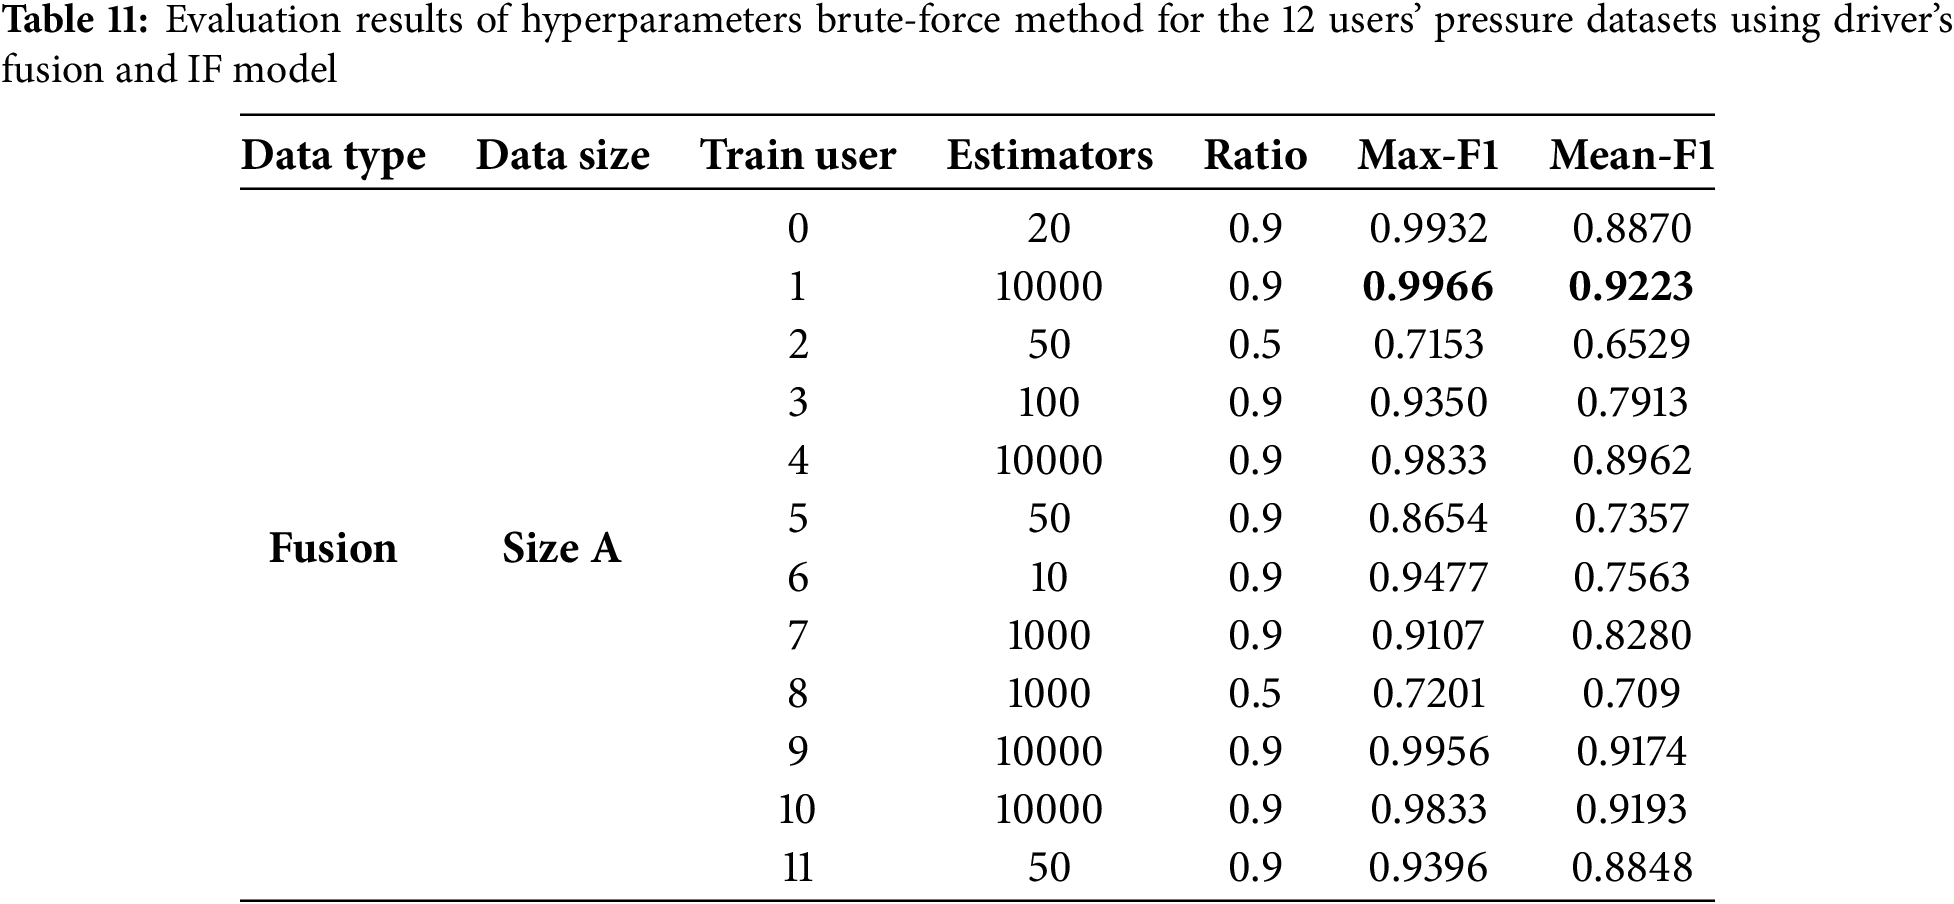
We plotted the overall driver authentication performance using the IF algorithm under all possible settings. Fig. 8 shows Max_F1 and Mean_F1 scores using IF under four different dataset sizes (A, B, C, and D) for three dataset types (Belt, Seat, and Fusion). We can compare different types and dataset sizes to provide the best driver authentication results. Similar to the LOF model, we can see in Fig. 8a that the IF model works well using a fusion-based dataset type with size A and provides the highest overall Max_F1 score of 91.56%. Also, in terms of the Mean_F1 (Fig. 8b) scores, IF model still provides the best performance results using the dataset type fusion_based with dataset size B of Mean_F1 score equal to 82.78%. Finally, for the IF model, we conclude two points: 1) Fusion_based dataset is the best choice with sizes A and B for the best performance of the system; 2) the overall F1 scores performance seems lower than those provided by OCSVM and LOF classifiers.
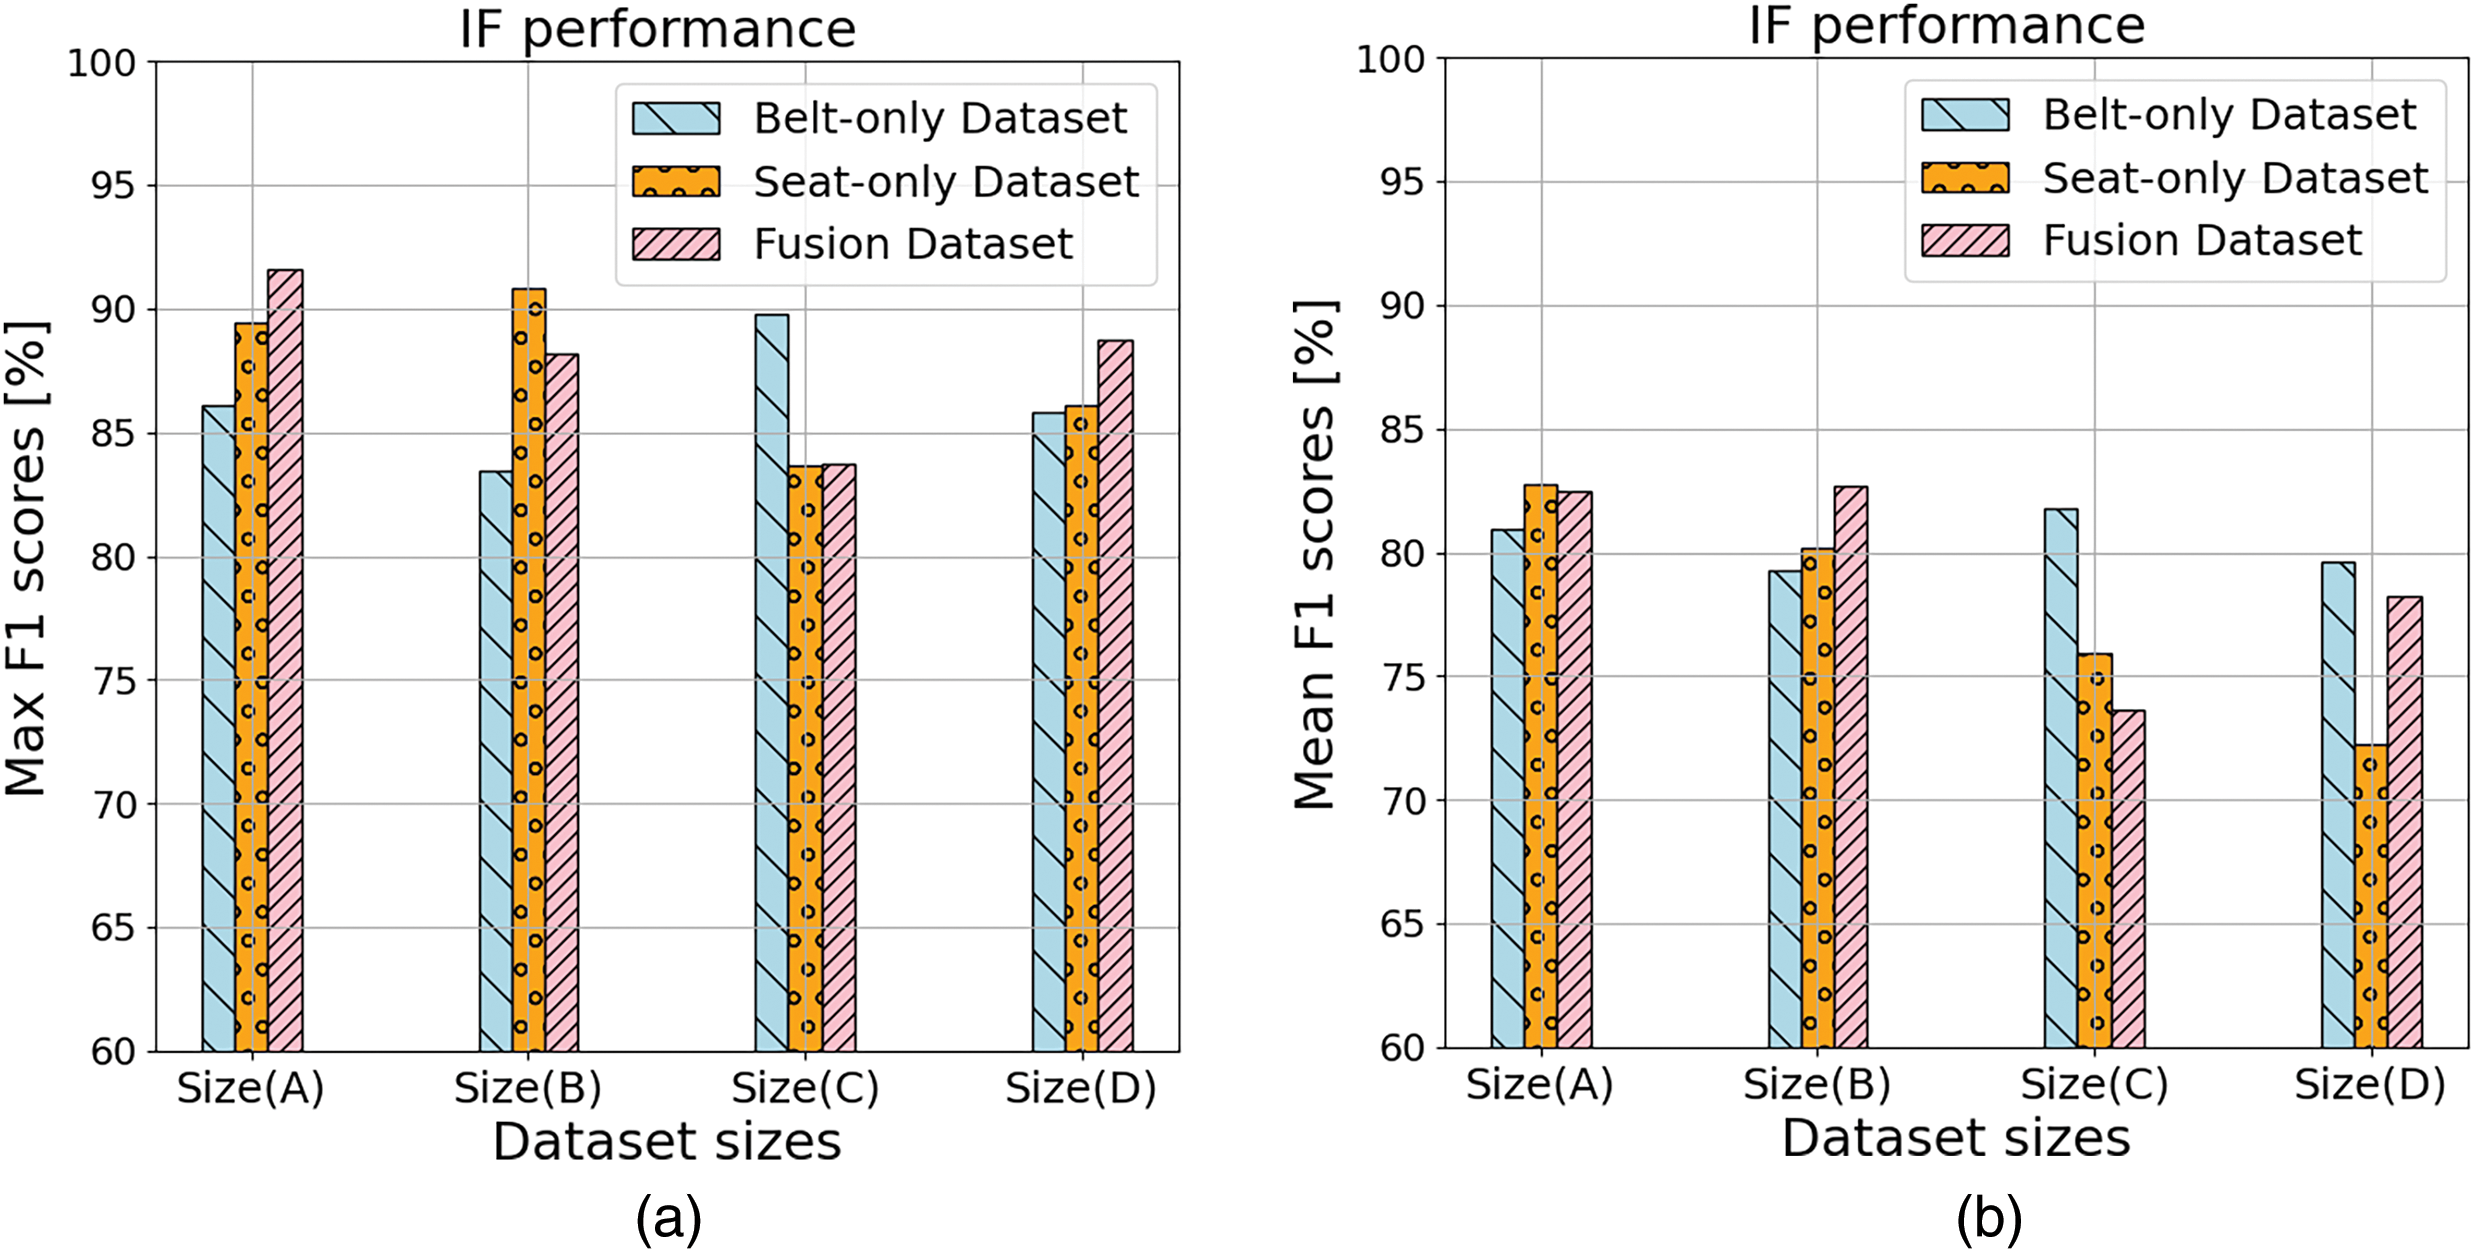
Figure 8: Illustrations show overall driver authentication performance using the IF algorithm when considering different sizes (A, B, C, and D) of belt, seat, and fusion datasets with two settings. (a) Measuring maximum F1 scores. (b) Measuring mean F1 scores
5.4 Evaluation Method 4: Using EE
Here, we demonstrate experiments conducted to choose the optimal hyperparameters of one-class EE and show the evaluation results for validating driver authentication. Basically, the Elliptical Envelope classifier is a statistical-based method for detecting anomalies and outliers in a dataset.
In our work, EE is particularly useful because we have multivariate data (sensory data with multiple dimensions). EE can identify sensory observations that deviate significantly from the normal readings. Technically, EE detects the outliers in Gaussian-distributed data. The most important hyperparameter of the EE classifier is considering the amount of contamination of the data set (
During the experiments of the EE classifier, we followed the same training and evaluating process as explained for the previous three OCSVM, LOF, and IF classifiers. In detail, we considered the effect of the following factors: model hyperparameters (i.e.,
As shown in Table 12, we found that only


We plotted the overall driver authentication performance using the EE algorithm under all possible settings. Fig. 9 shows Max_F1 and Mean_F1 scores using EE under four different dataset sizes (A, B, C, and D) for three dataset types (Belt, Seat, and Fusion). We can compare different types and dataset sizes to provide the best driver authentication results. Similar to the LOF and IF models, we can see in Fig. 9a that the EE model works well using a fusion-based dataset type with size D and provides the highest overall Max_F1 score of 95.79%. Also, in terms of the Mean_F1 (Fig. 9b) scores, the EE model provides the best performance results using the same dataset type fusion-based with dataset size D of Mean_F1 score equal to 94.51%. Finally, for the EE model, we conclude two points: 1) Fusion_based dataset is the best choice with size D for the best performance of the system; 2) the overall F1 scores performance is almost similar to those provided by LOF and IF classifiers.

Figure 9: Illustrations show overall driver authentication performance using the EE algorithm when considering different sizes (A, B, C, and D) of belt, seat, and fusion datasets with two settings. (a) Measuring maximum F1 scores. (b) Measuring mean F1 scores
5.5 Computational Efficiency Analysis
In this section, we provide a detailed assessment of the computational cost and real-time processing feasibility of the authentication system. We understand that it is important to evaluate factors such as processing speed and Memory usage for the machine-learning models used in our work. This is crucial because of the system application in embedded systems in vehicles, which often have limited computational resources.
5.5.1 Processing Time Computation
Here, we computed the train and test processing times for the three data types of our datasets (Belt, Seat, and Fusion). Note that, since our work has applied four models (OCSVM, LOF, IF, EE), we just plot the processing time for OCSVM with size (A) and 90/10 train/test split ratio as the case study to verify the computational efficiency of the system. The computational evaluations for other models are the same, so we omitted them due to the page-length limitation.
Figs. 10a and 10b show the train and test processing times for each of the 12 users separately, where it is clear that the train time is higher than the test time under all settings and for all users, but still within a few milliseconds. After that, we computed the overall and averaged computational results for all users using the OCSVM model with three data types (Belt, Seat, Fusion), and four dataset sizes (A, B, C, D) as shown in Table 15.

Figure 10: Illustrations show the computational processing time for the 12 users using the OCSVM model when considering the size (A) of belt, seat, and fusion datasets. (a) Train time. (b) Test time

Note that, since the training and testing model of each user provides different time values (in milliseconds), we listed the minimum, maximum, and average statistics of the 12 users together (using one setting) as one row in the table. Looking at Table 15, it is clear that all train/test processing results are in milliseconds using various settings that reflect computational efficiency. Also, this proves that the proposed approach can operate in real-time without any delays and shows the practical deployment feasibility of the system.
To develop a practical driver authentication system that holds trained machine-learning models, it is necessary to ensure that the proposed approach can operate without problems in real-world on embedded systems. Specifically, when deploying driver authentication models, it is important to monitor the memory usage of the size of the models on vehicles. Therefore, we calculated the sizes of four types of trained models (OCSVM, LOF, IF, EE) under various settings such as different data types (Belt, Seat, Fusion) and different data sizes and reported the results in Table 16. Our memory usage calculations are conducted using each user’s pressure dataset and ran using all possible hyperparameters for each trained model to check all possible memory sizes for models. Note that the results shown in Table 16 are the maximum memory sizes that we got from the calculations under some hyperparameters. This means these are the upper limits of sizes that the models can use on the memory.
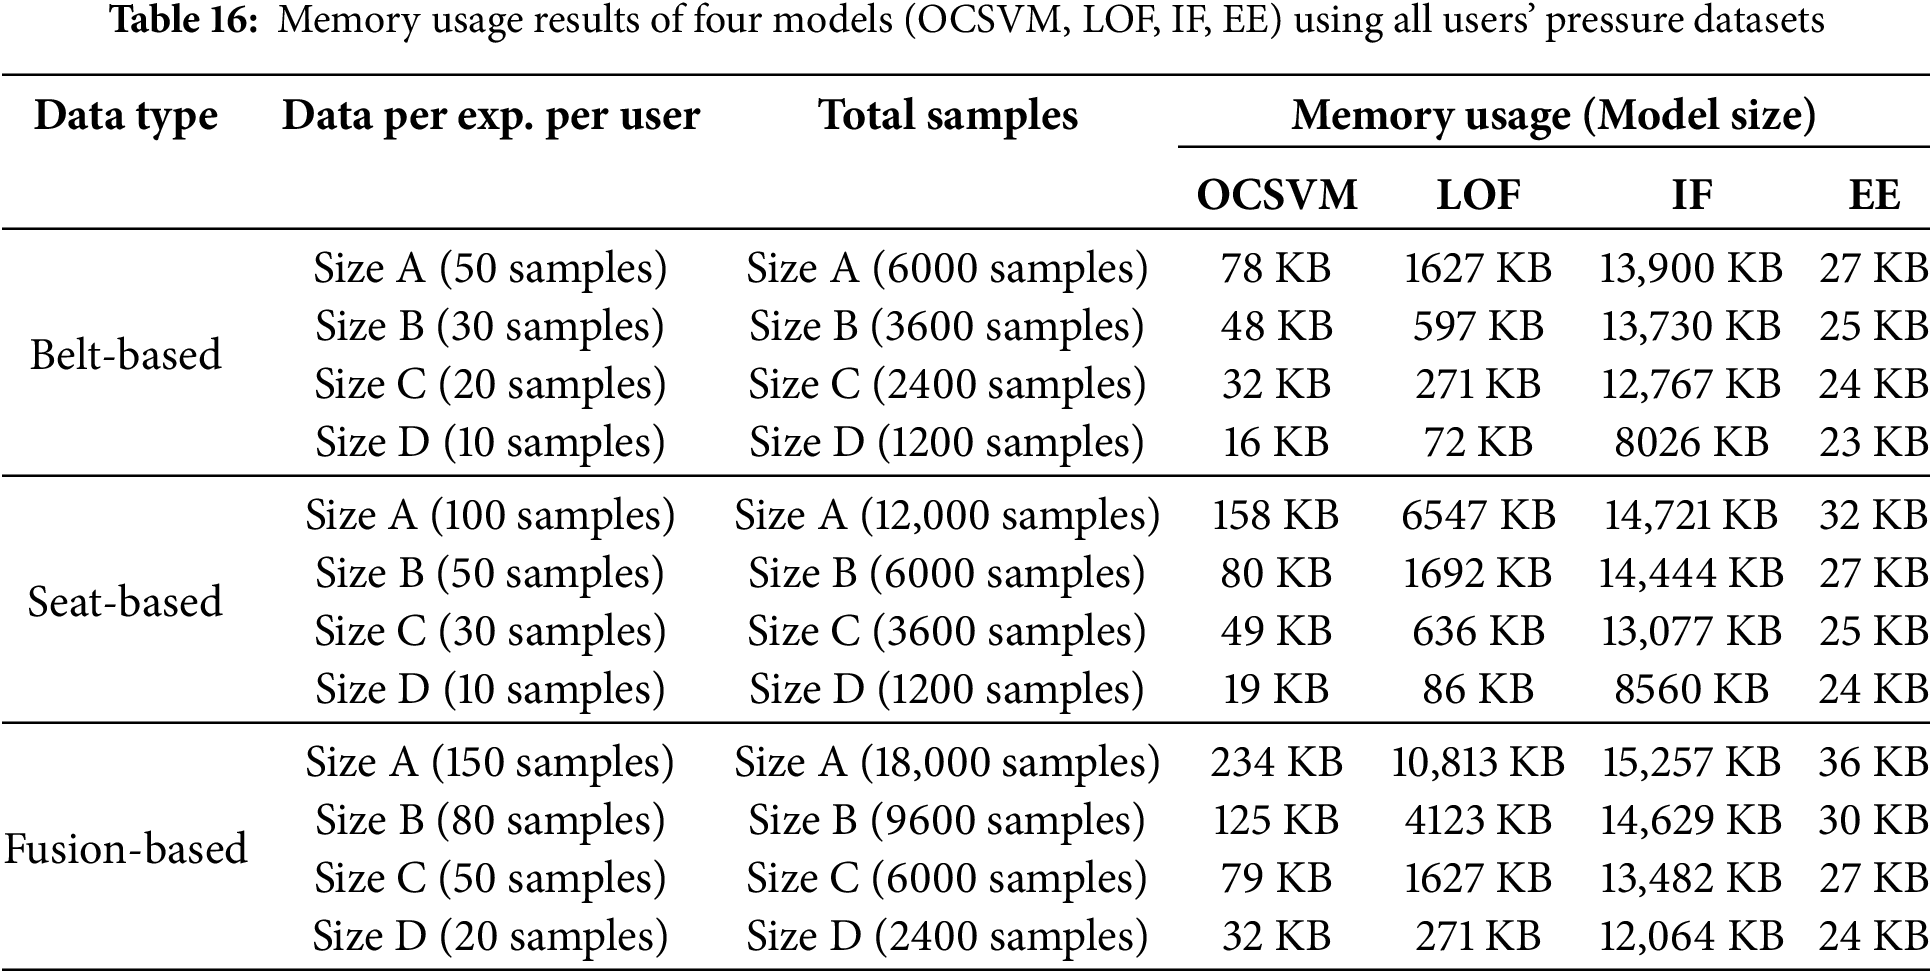
Table 16 clearly shows that the memory sizes for the four machine-learning models are noticeably increased as the data size (A, B, C, D) increases, as well as depending on the datatype (Belt, Seat, Fusion). As the number of samples increases, the memory size of the model increases regardless of the model type. Also, EE models provide the lowest memory size (up to 27 KB) while IF models the highest memory size (up to 15 MB) for 18,000 fusion samples data. However, the best option is the OCSVM models that provide lightweight memory sizes (ranges from 16 to 234 KB), while giving the second-best authentication performance. Another good option is LOF models that provide memory sizes (up to 10 MB) while giving the highest authentication performance. Finally, we conclude that the report of memory sizes shows clearly the feasibility of the practical deployment of the system in embedded systems such as vehicles.
In this section, we provide a detailed explanation of the limitations and shortcomings of this study that may concern readers and reviewers. First of all, the goal of this paper is only to investigate the feasibility behind the idea of exploiting pressure-based sensory data for driver authentication. In future work, we will cover and address all following limitations and directions which are currently out of the scope of this paper.
• Collected dataset: We know that the dataset used consists of only 12 users seems not enough for the system to generalize well for a larger or more varied population. However, we explain that the complexity of driving data collection from users and the hardness of car-based experiments was a barrier to a recruiting large number of users in this paper. Therefore, we tried our best to convince 12 users to conduct the experiments using different clothes, postures, and ten iterations. Also, our dataset was collected using real experiments compared with many published studies that used generated computer-based data from various simulators to evaluate the performance of their driver authentication solutions [3,5,15,16]. Therefore, we believe the current dataset is enough to support the goal of the paper which is showing the feasibility of using pressure data for driver authentication. Additionally, we explored number of recruited users in previous studies of driver authentication and found that several studies have done their work with a few users (e.g., [33] (4 users), [3] (5 users), [7] (6 users), [20] (7 users), [15] (10 users), [25] (15 users)).
• Uncontrolled conditions experiments: Although our experiments in this paper have been conducted in controlled conditions, they are still real experiments compared with many existing studies in driver authentication conducted using just simulators [1,3,15,16,34]. The dataset was collected from sensors equipped on the “off-car” seat and belt as shown in Fig. 3. We know that other external factors can be included in the experiments such as real-world driving conditions, vibrations from rough roads, and varying driving speeds. Although these factors are out of the scope of the current paper’s work, we argue that performance results show that our system can identify the driver rapidly in a very short time (1 to 5 s) once he sits in the driver’s seat. This means there is no need for on-driving detection since the driver’s identity can be detected before the vehicle moves. However, we plan to discuss the system’s adaptability with these factors in the extended version of the work in the future.
• Comparison with existing studies: While the paper highlights its novelty by providing a new approach to authenticating drivers using pressure data, the existing authentication schemes use different methods (e.g., CAN-based, camera-based, biometric, Wi-Fi-based, or multimodal systems). Therefore, we could not provide a direct and in-depth comparison, instead, we provided an indirect comparison in Section 2 to show the validation of our performance against the accuracy results of the existing driver authentication works. As far as we know, there is no prior study that used pressure data to address practical shortcomings as we did in this work, therefore, we could not conduct a direct and in-depth comparison. We surveyed most related works of driver authentication and provided a detailed Table 1 comparing our work with them in the key terms addressed in this work: (1) Lightweight, (2) Practical evaluation approach, (3) Rapid Authentication, (4) Type of experiments, (5) Privacy-preserving. We believe that such a comparison could be enough to show the differences and advantages of our work compared with the literature.
• Integrating multi-modal authentication: This study focuses on a single-modality authentication system that relies solely on pressure data from seat and belt. However, we believe that applying multi-factor authentication (MFA), which is commonly used in security-critical applications is necessary to enhance the robustness of the system. Our intention in this work is to just show whether the pressure data only is feasible to detect the driver identity or not as a baseline module. We emphasize that this work is not aimed to be used as a comprehensive system or a standalone approach for authenticating drivers. Instead, DriveMe can be integrated with additional biometric data (e.g., fingerprint, facial recognition), behavioral patterns (e.g., steering behavior, pedal pressure), or physiological signals (e.g., heart rate) for developing multi-modal authentication to improve security and reduce false positives or negatives.
We designed a novel driver authentication scheme that achieves practical requirements using pressure data attached to the driver’s seat and belt. We conducted real experiments and collected real pressure datasets (rather than simulation data) of 12 users and built up a database in our server for later learning process. We conducted extensive evaluation implementations using four one-class detectors, three dataset types, and four dataset sizes to prove the validity of our work under various evaluation settings. Our results show the promising aspects of the pressure-based system practically and accurately.
For future work, we plan to extend the work to continue addressing the limitations provided in the previous section such as gathering pressure datasets from a larger and more diverse pool of users, conducting uncontrolled conditions experiments in real-world driving, and integrating our system with more feature for robust multi-modal authentication system. Also, we plan to conduct a full application design of a client-server architecture to send warning alarms to the owner’s smartphone in case of detecting a car’s unauthorized access.
Acknowledgement: We are thankful for the insightful comments from anonymous reviewers, which have greatly improved this manuscript.
Funding Statement: This work was supported by the Institute of Information & Communications Technology Planning & Evaluation (IITP) (Project Nos. RS-2024-00438551, 30%; 2022-11220701, 30%; 2021-0-01816, 30%), and the National Research Foundation of Korea (NRF) grant funded by the Korean Government (Project No. RS2023-00208460, 10%).
Author Contributions: The authors confirm their contribution to the paper as follows: study conception, design, performance evaluation, producing results, and writing the manuscript: Mohsen Ali Alawami; all experiments design, hardware implementations, and datasets collection process: Dahyun Jung, Yewon Park, Yoonseo Ku, Gyeonghwan Choi; supervision and funding: Ki-Woong Park. All authors reviewed the results and approved the final version of the manuscript.
Availability of Data and Materials: The dataset used in the manuscript will be available upon request.
Ethics Approval: The authors confirm that this research study was conducted ethically and following established guidelines. All participants involved in the experiment were fully informed before their participation about the purpose of the study, their right to withdraw at any time, and the confidentiality of their responses. Also, any external sources used have been properly cited.
Conflicts of Interest: The authors declare no conflicts of interest to report regarding the present study.
References
1. Zhu B, Liu Z, Zhao J, Chen Y, Deng W. Driver behavior characteristics identification strategies based on bionic intelligent algorithms. IEEE Trans Human-Mach Syst. 2018;48(6):572–81. doi:10.1109/THMS.2018.2861225. [Google Scholar] [CrossRef]
2. Alawami MA, Abuhmed T, Abuhamad M, Kim H. MotionID: towards practical behavioral biometrics-based implicit user authentication on smartphones. Pervasive Mob Comput. 2024;101:101922. doi:10.1016/j.pmcj.2024.101922. [Google Scholar] [CrossRef]
3. Duan S, Yu T, WiDriver He J. Driver activity recognition system based on WiFi CSI. Int J Wireless Inform Netw. 2018;25:146–56. doi:10.1007/s10776-018-0389-0. [Google Scholar] [CrossRef]
4. Enev M, Takakuwa A, Koscher K, Kohno T. Automobile driver fingerprinting. Proc Priv Enhancing Technol. 2016;2016(1):34–50. doi:10.1515/popets-2015-0029. [Google Scholar] [CrossRef]
5. Miyajima C, Nishiwaki Y, Ozawa K, Wakita T, Itou K, Takeda K, et al. Driver modeling based on driving behavior and its evaluation in driver identification. Proc IEEE. 2007;95(2):427–37. doi:10.1109/JPROC.2006.888405. [Google Scholar] [CrossRef]
6. Garg S, Kaur K, Kumar N, Rodrigues JJ. Hybrid deep-learning-based anomaly detection scheme for suspicious flow detection in SDN: a social multimedia perspective. IEEE Trans Multimed. 2019;21(3):566–78. doi:10.1109/TMM.2019.2893549. [Google Scholar] [CrossRef]
7. Ezzini S, Berrada I, Ghogho M. Who is behind the wheel? Driver identification and fingerprinting. J Big Data. 2018;5(1):1–15. doi:10.1186/s40537-018-0118-7. [Google Scholar] [CrossRef]
8. Zhang C, Patel M, Buthpitiya S, Lyons K, Harrison B, Abowd GD. Driver classification based on driving behaviors. In: Proceedings of the 21st International Conference on Intelligent User Interfaces; 2016; Sonoma, CA, USA. p. 80–4. [Google Scholar]
9. Xun Y, Sun Y, Liu J. An experimental study towards driver identification for intelligent and connected vehicles. In: ICC 2019-2019 IEEE International Conference on Communications (ICC); 2019; Shanghai, China: IEEE. p. 1–6. [Google Scholar]
10. Liu J, Zhang S, Sun W, Shi Y. In-vehicle network attacks and countermeasures: challenges and future directions. IEEE Network. 2017;31(5):50–8. doi:10.1109/MNET.2017.1600257. [Google Scholar] [CrossRef]
11. Taha B, Seha SNA, Hwang DY, Hatzinakos D. EyeDrive: a deep learning model for continuous driver authentication. IEEE J Sel Top Signal Process. 2023. doi:10.1109/JSTSP.2023.3235302. [Google Scholar] [CrossRef]
12. Derman E, Salah AA. Continuous real-time vehicle driver authentication using convolutional neural network based face recognition. In: 2018 13th IEEE International Conference on Automatic Face & Gesture Recognition (FG 2018); 2018; Xi’an, China: IEEE. p. 577–84. [Google Scholar]
13. Banerjee T, Chowdhury A, Chakravarty T, Ghose A. Driver authentication by quantifying driving style using GPS only. In: 2020 IEEE International Conference on Pervasive Computing and Communications Workshops (PerCom Workshops); 2020; Austin, TX, USA: IEEE. p. 1–6. [Google Scholar]
14. Bittl S, Gonzalez AA, Myrtus M, Beckmann H, Sailer S, Eissfeller B. Emerging attacks on VANET security based on GPS time spoofing. In: 2015 IEEE Conference on Communications and Network Security (CNS); 2015; Florence, Italy: IEEE. p. 344–52. [Google Scholar]
15. Burton A, Parikh T, Mascarenhas S, Zhang J, Voris J, Artan NS, et al. Driver identification and authentication with active behavior modeling. In: 2016 12th International Conference on Network and Service Management (CNSM); 2016 Oct 31–Nov 04; Montreal, QC, Canada: IEEE; 2016. p. 388–93. [Google Scholar]
16. Van Ly M, Martin S, Trivedi MM. Driver classification and driving style recognition using inertial sensors. In: 2013 IEEE Intelligent Vehicles Symposium (IV); 2013; Gold Coast, QLD, Australia: IEEE. p. 1040–5. [Google Scholar]
17. Meng X, Lee KK, Xu Y. Human driving behavior recognition based on hidden markov models. In: 2006 IEEE International Conference on Robotics and Biomimetics; 2006; Kunming, China: IEEE. p. 274–9. [Google Scholar]
18. Almazroi AA, Aldhahri EA, Al-Shareeda MA, Manickam S. ECA-VFog: an efficient certificateless authentication scheme for 5G-assisted vehicular fog computing. PLoS One. 2023;18(6):e0287291. doi:10.1371/journal.pone.0287291. [Google Scholar] [PubMed] [CrossRef]
19. Al-Shareeda MA, Manickam S, Mohammed BA, Al-Mekhlafi ZG, Qtaish A, Alzahrani AJ, et al. CM-CPPA: chaotic map-based conditional privacy-preserving authentication scheme in 5G-enabled vehicular networks. Sensors. 2022;22(13):5026. doi:10.3390/s22135026. [Google Scholar] [PubMed] [CrossRef]
20. Regani SD, Xu Q, Wang B, Wu M, Liu KR. Driver authentication for smart car using wireless sensing. IEEE Internet Things J. 2019;7(3):2235–46. doi:10.1109/JIOT.2019.2958692. [Google Scholar] [CrossRef]
21. Alawami MA, Kim H. LocAuth: a fine-grained indoor location-based authentication system using wireless networks characteristics. Comput Secur. 2020;89:101683. doi:10.1016/j.cose.2019.101683. [Google Scholar] [CrossRef]
22. Alawami MA, Vinay AR, Kim H. LocID: a secure and usable location-based smartphone unlocking scheme using Wi-Fi signals and light intensity. IEEE Internet Things J. 2022;9(23):24357–72. doi:10.1109/JIOT.2022.3189358. [Google Scholar] [CrossRef]
23. Kwak BI, Woo J, Kim HK. Know your master: driver profiling-based anti-theft method. In: 2016 14th Annual Conference on Privacy, Security and Trust (PST); 2016; Auckland, New Zealand: IEEE. p. 211–8. [Google Scholar]
24. Xun Y, Liu J, Kato N, Fang Y, Zhang Y. Automobile driver fingerprinting: a new machine learning based authentication scheme. IEEE Trans Ind Inform. 2019;16(2):1417–26. doi:10.1109/TII.2019.2946626. [Google Scholar] [CrossRef]
25. Xun Y, Guo W, Liu J. G-DriverAUT: a growable driver authentication scheme based on incremental learning. IEEE Trans Vehicular Technol. 2023. doi:10.1109/TVT.2022.3233739. [Google Scholar] [CrossRef]
26. Xun Y, Liu J, Shi Z. Multitask learning assisted driver identity authentication and driving behavior evaluation. IEEE Trans Ind Inform. 2020;17(10):7093–102. doi:10.1109/TII.2020.3034276. [Google Scholar] [CrossRef]
27. Borghi G, Venturelli M, Vezzani R, Cucchiara R. Poseidon: face-from-depth for driver pose estimation. In: Proceedings of the IEEE Conference on Computer Vision and Pattern Recognition; 2017; Honolulu, HI, USA. p. 4661–70. [Google Scholar]
28. Gupta S, Buriro A, Crispo B. DriverAuth: a risk-based multi-modal biometric-based driver authentication scheme for ride-sharing platforms. Comput Secur. 2019;83:122–39. doi:10.1016/j.cose.2019.01.007. [Google Scholar] [CrossRef]
29. Junaedi S, Akbar H. Driver drowsiness detection based on face feature and PERCLOS. In: Journal of Physics: Conference Series; IOP Publishing; 2018. Vol. 1090. [Google Scholar]
30. Xing J, Fang G, Zhong J, Li J. Application of face recognition based on CNN in fatigue driving detection. In: Proceedings of the 2019 International Conference on Artificial Intelligence and Advanced Manufacturing; 2019; Dublin Ireland. p. 1–5. [Google Scholar]
31. Akrout B, Mahdi W. A novel approach for driver fatigue detection based on visual characteristics analysis. J Ambient Intell Humaniz Comput. 2023;14(1):527–52. doi:10.1007/s12652-021-03311-9. [Google Scholar] [CrossRef]
32. Ma Y, Zhou G, Wang S. WiFi sensing with channel state information: a survey. ACM Comput Surv. 2019 Jun;52(3):1–36. doi:10.1145/3310194. [Google Scholar] [CrossRef]
33. Ma Y, Wu J, Long C, Lin YB. Mobidiv: a privacy-aware real-time driver identity verification on mobile phone. IEEE Internet Things J. 2021;9(4):2802–16. doi:10.1109/JIOT.2021.3093480. [Google Scholar] [CrossRef]
34. Wakita T, Ozawa K, Miyajima C, Igarashi K, Itou K, Takeda K, et al. Driver identification using driving behavior signals. IEICE Trans Inform Syst. 2006;89(3):1188–94. doi:10.1093/ietisy/e89-d.3.1188. [Google Scholar] [CrossRef]
Cite This Article
 Copyright © 2025 The Author(s). Published by Tech Science Press.
This work is licensed under a Creative Commons Attribution 4.0 International License , which permits unrestricted use, distribution, and reproduction in any medium, provided the original work is properly cited.
 Downloads
 Citation Tools