
 Submit a Paper
 Propose a Special lssue
 Open Access
ARTICLE

Dynamic Response of Bridge Pile Foundations under Pile-Soil-Fault Interaction in Seismic Areas
1 School of Highway, Chang’an University, Xi’an, 710064, China
2 School of Urban and Rural Planning and Architectural Engineering, Shangluo University, Shangluo, 726000, China
3 Third Highway Design Division, Hainan Provincial Institute of Transportation Planning and Survey Design, Haikou, 570203, China
* Corresponding Author: Zhongju Feng. Email:
Computer Modeling in Engineering & Sciences 2025, 143(2), 1549-1573. https://doi.org/10.32604/cmes.2025.064785
Received 24 February 2025; Accepted 28 April 2025; Issue published 30 May 2025
 View Full Text
 Download PDF
Abstract
To study the dynamic response rules of pile foundations of mega-bridges over faults in strong seismic areas, a finite element model of the pile foundation-soil-fault interaction of the Haiwen Bridge is established. The 0.2–0.6 g peak acceleration of the 5010 seismic waves is input to study the effect of the seismic wave of different intensities and the distance changes between the fault and the pile foundation on the dynamic response of the pile body. The results show that the soil layer covering the bedrock amplifies the peak pile acceleration, and the amplifying effect decreases with increasing seismic wave intensity. However, bedrock has less of an effect on peak acceleration. The relative pile displacement shows the mechanical properties of elastic long piles. The pile foundation generates a large bending moment at the bedrock face and the upper soil layer interface, and a large shear force at the pile top and the soft-hard soil body interface. The relative displacement, bending, and shear bearing characteristics of the pile foundations on the upper and lower plates of the fault are significantly different. The deformation characteristics are affected by faults in a region ten times the pile diameter. Analysis of the dynamic p-y curves shows that the soil resistance on the pile side of the lower plate at the same depth is greater than that of the upper plate. Sensitivity of the dynamic response of pile foundations on either side of the fault to the effects of seismic intensity and distance between the pile foundation and the fault: distance l > seismic intensity q.Keywords
When the large diameter, deep, and long pile foundation of the bridge is constructed in strong seismic areas, the seismic wave will disturb the bridge structure and its surrounding geotechnical body, thus affecting the bearing capacity and stability of the pile foundation and even causing its damaging failure [1–4]. The design and construction process becomes much more difficult when faults are encountered during the building process. The interaction of earthquakes and faults changes the nature of the rock and soil mass of the foundation to some extent [5–7]. The problem of the dynamic response of bridge pile foundations is more complicated when considering velocity impulses, displacement misalignments, upper-plate effects, and directional effects of near-fault surface rupture [8–10]. Many scholars have carried out some research on this. In terms of theoretical studies, Yang et al. [11] verified the correctness of the response spectrum analysis method in the structural analysis of bridges crossing strike-slip faults by comparing it with the nonlinear response history analysis method. Shirgir et al. [12] established a six-degree-of-freedom bridge model considering the effect of Spsi to analyse its seismic response under the soil-pile interaction. Dai et al. [13] used transfer function and frequency domain 3D structural modelling to evaluate the influence and importance of soil-structure interaction effects on the dynamic properties of the system. In terms of model tests, Feng et al. [14–16] investigated more systematically the anti-liquefaction performance of bridge pile foundations and the dynamic response law, such as pile damage under the action of pile-soil-fault coupling. Jiang et al. [17] tested the dynamic response of scaled-down bridge pier specimens under higher seismic loads on a shaking table, and the results of the study can provide a reference for the seismic design to change from the current principle of tertiary to quaternary defence. Fiorentino et al. [18] investigated the interaction effects between bridge pile foundations and backfill on a seismic simulation table to learn about the dynamic behaviour of monolithic bridge piers under ground shaking. Xu et al. [19] investigated the structural dynamic response of pile foundations and the effect of soil-structure interaction on non-liquefiable and liquefiable sites and rigid foundations. Xie et al. [20] investigated the effect of near-fault seismic waves on the seismic response of bridge models and pile-soil interaction subjected to near-fault and far-field longitudinal seismic waves. Yang et al. [21] investigated the dynamic response law of pile-soil-structure in soft foundation under seismic loading by shaking table test, and the results showed that soft soil has an amplifying effect under smaller seismic excitation and a vibration isolating effect under larger seismic intensity. In terms of numerical simulation, Li et al. [22] used numerical modelling of the structure-soil-structure interaction using ANSYS finite element software based on shaker test results, which showed that contact pressure, strain amplitude, and pile slip increased with increasing excitation, while the peak acceleration gain factor decreased. Simos et al. [23] evaluated the sensitivity of the Konitsa Bridge to near-field and far-field earthquakes based on finite element analysis with nonlinear modelling. Zheng et al. [24] studied the seismic dynamic response of a large span asymmetric suspension bridge under near-fault seismicity under a magnitude IV earthquake based on the OpenSees platform and recommended seismic design. Zhang et al. [25] used the hyperbolic hysteresis model and an equivalent full elastoplastic model for finite element analysis of the dynamic characteristics of soft clay foundation and pile-pier system, respectively. Anastasopoulos et al. [26] investigated the effects of positive fault rupture on bridge pile foundations and superstructures by realistically modelling the nonlinear pile-soil interface and the structural inelasticity of piles. Yan et al. [27] established a two-dimensional numerical model of the Sulphur Gully Bridge and site soils under strong near-fault earthquakes, and used finite element dynamic time-range analysis to investigate the dynamic response characteristics of the piers, pile foundations, and the site under ground motion loading.
Most of the above studies focus on the effects of seismic waves on the mechanical and deformation characteristics of bridge pile foundations, and there are relatively few studies on the effects of faults on the dynamic bearing characteristics of bridge pile foundations under seismic loading. The recognition of the effect of faults on the seismic performance of pile foundations in seismic design also relies heavily on engineering experience. When bridges are built close to faults, most of them are designed to avoid the fault zone, or the bridge foundations are set on the lower plate of the fault. At this point, the safe distance between the pile and the fault is particularly important. However, there will inevitably be situations in the actual project where the route cannot avoid the fault, and the bridge has to cross the fault. Therefore, it is of great engineering significance to study in depth the dynamic response law of pile foundations of bridges across faults under seismic conditions [28,29]. In this paper, because of the current status and existing problems in the study of the dynamic characteristics of near-fault highway bridges, based on the Haiwen Bridge project, the finite element software is used to establish a dynamic numerical analysis model to carry out the research on the load transfer law and dynamic response characteristics of acceleration, horizontal relative displacement, bending moment and shear force of the bridge pile foundations under the action of seismic loading, and to give the safe avoidance distance between the pile foundations and the faults, to provide technical basis for the design of deep and long pile foundations for near-fault bridges in strong earthquake areas.
The length of the Haiwen Bridge is 5.6 km, of which the cross-harbour bridge is 3.96 km long. The bridge pile foundations are located in an environment with high seismic loads, high wind and wave frequencies, and seismically active faults. The 50-year exceedance probabilities of 10% and 2% of the peak dynamic acceleration are 0.35 and 0.59 g, respectively, the highest in China. The bridge crosses three faults, of which the active, positive fault F2 is located between piers 37# and 38#. The fault is approximately 30 m wide, dips to the south-west, has a dip angle of 75°, and a strike of 345°. Pier 37# is on the lower plate of the F2 fault, and Pier 38# is on the upper plate, both approximately 25 m from the fault. The construction environment of the bridge’s pile foundations is an outstanding issue. The location of fault F2, relative to piers 37# and 38#, is shown in Fig. 1.
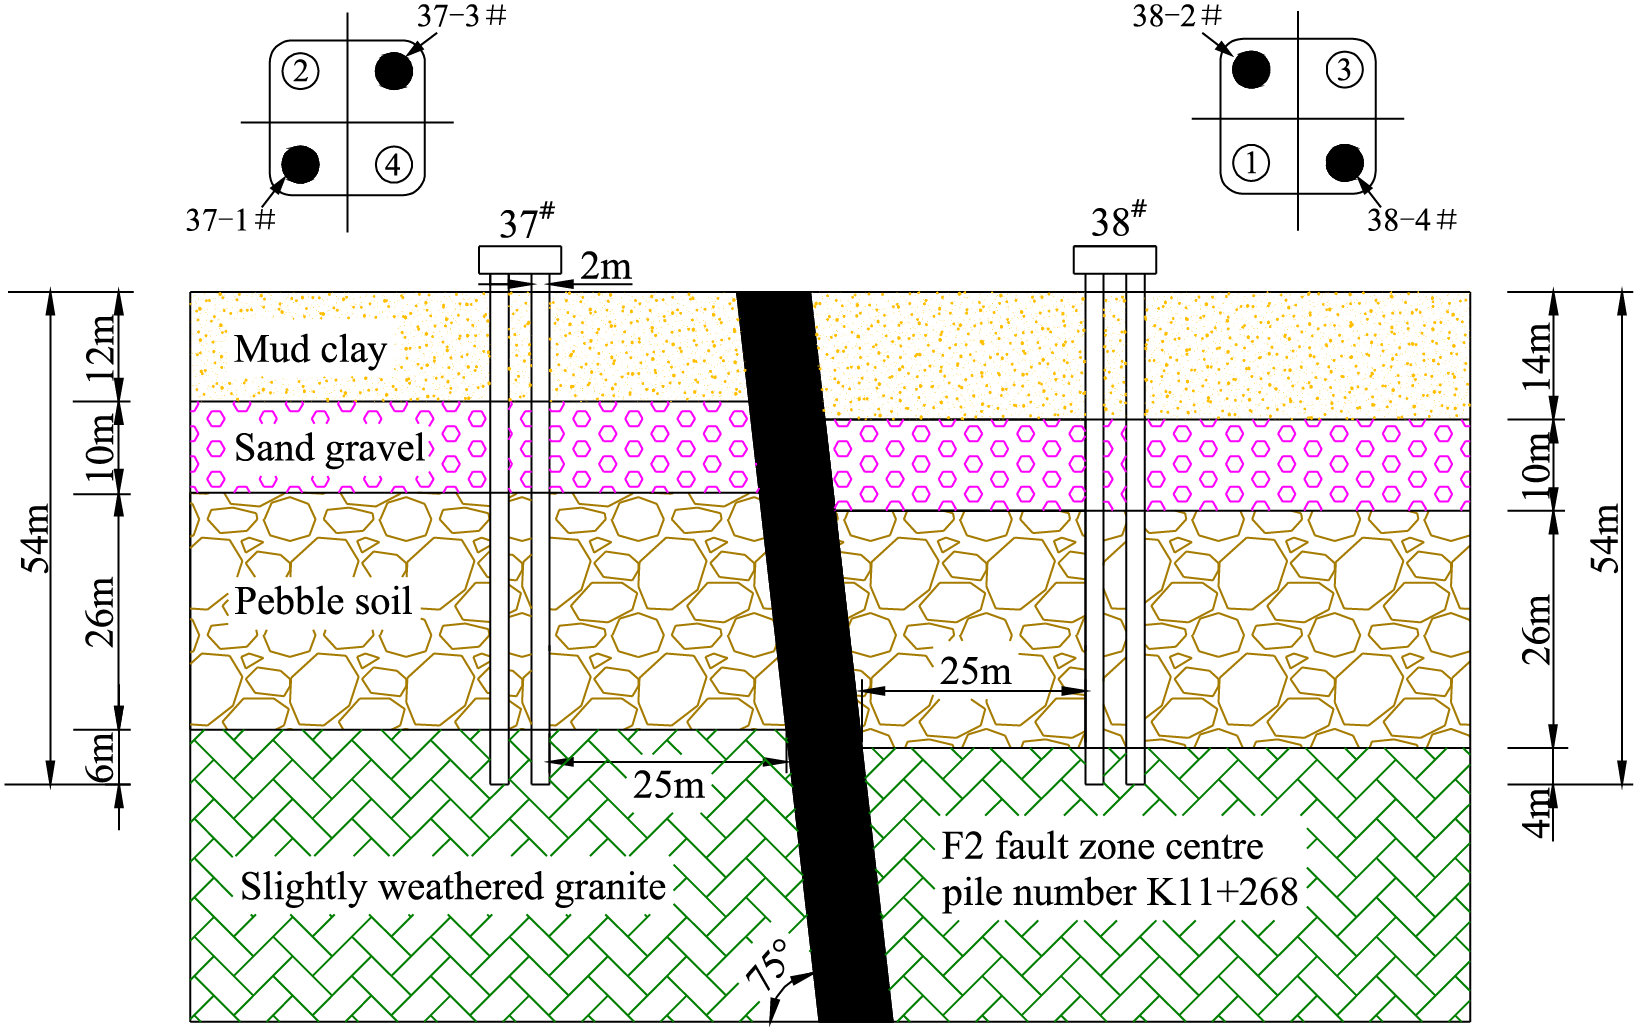
Figure 1: Relative position of pile foundation and fault
The soil body has a typical nonlinear ontological relationship. The nonlinear time history calculation method is chosen for the seismic time history analysis to obtain reasonable and accurate analysis results. An elastic model is used for the bearing platform and pile foundation analysis, and an elastoplastic model is used for the geotechnical analysis. The modelling is based on the Moore-Cullen convergence criterion, with nonlinear calculations such as displacements and internal forces as convergence conditions.
The numerical modelling was carried out using Midas GTS finite element software. The dimensions of the bearing platform of both piers 37# and 38# are 9.2 m × 9.2 m × 3 m. Four pile foundations with a pile spacing of 5.5 m, a pile diameter of 2 m, and a pile length of 54 m were connected under the bearing platform. The embedment depth of the piles ends in the slightly weathered granite layer, which is 6 m in the lower plate and 4 m in the upper plate. The dimensions of the model are 100, 62, and 82 m in the X, Y, and Z directions. The soil distribution is, from top to bottom, a silty clay layer, 14 m thick in the upper plate and 12 m thick in the lower plate; a 10 m thick layer of sand and gravel; a 26 m thick layer of pebbly soil; and a layer of slightly weathered granite. The fault action is implemented by discounting the fault fracture zone parameters, and the model mesh is shown in Fig. 2. Among them, the grid size of the fault fragmentation zone and the soil body around the pile is encrypted and divided into 1 m, and the grid size of the outer soil body is gradually divided into 1–4 m.
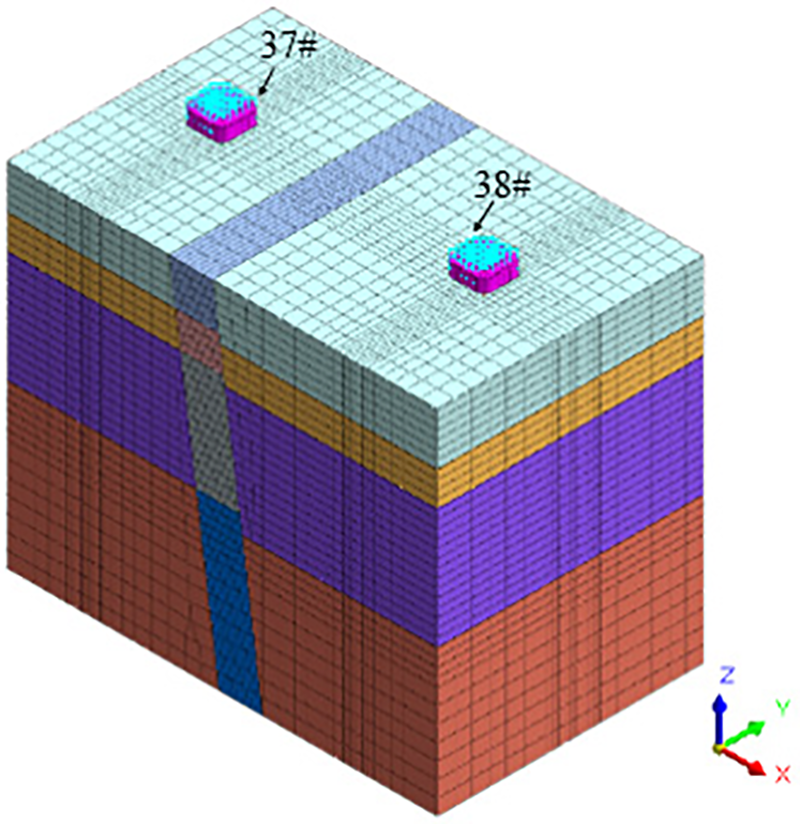
Figure 2: Model meshing
3.2.1 Pile Foundation Constitutive Model
The seismic design code for highway bridges (JTGT 2231-01-2020) stipulates that pile foundations should be kept in an elastic working condition under the level of seismic defense. This study focuses on the dynamic response of near-fault pile foundations under seismic loading. The pile foundation material is concrete; therefore, an isotropic elastic model is chosen. It satisfies the generalised Hooke’s law, and the stress-strain relationship is:
where
3.2.2 Rock and Soil Constitutive Model
Damage to pile foundations is mainly caused by the development of plastic zones in the rock and soil bodies around the piles. There are both elastic and plastic deformations in geotechnical bodies. Therefore, the Moore-Coulomb elastic-plastic constitutive model is adopted. The elastic deformation phase satisfies the generalised Hooke law mentioned above, and the plastic deformation phase satisfies the plastic theory solution, which must simultaneously satisfy the yield criterion, the plastic flow law, and the hardening law. The stress variables of the structure are assumed to be elastic strain components and plastic strain components, expressed in incremental form as:
where {dε} is the strain component matrix; {dεP} plastic strain matrix; p denotes plasticity.
Numerous theories now suggest that the plastic potential function is identical or similar to the yield function, and the direction of the plastic strain increment generated during loading is then determined from the flow law:
where g is the plastic potential function; dλ is the proportional coefficient of each component of the strain increment and the corresponding stress deviation, i.e.,
Available for isotropic hardened materials:
Plasticity work:
Eq. (7) is obtained by bringing in the derivation:
where
Multiply both ends of Eq. (5) by
Bringing Eq. (9) into Eq. (1) yields:
where
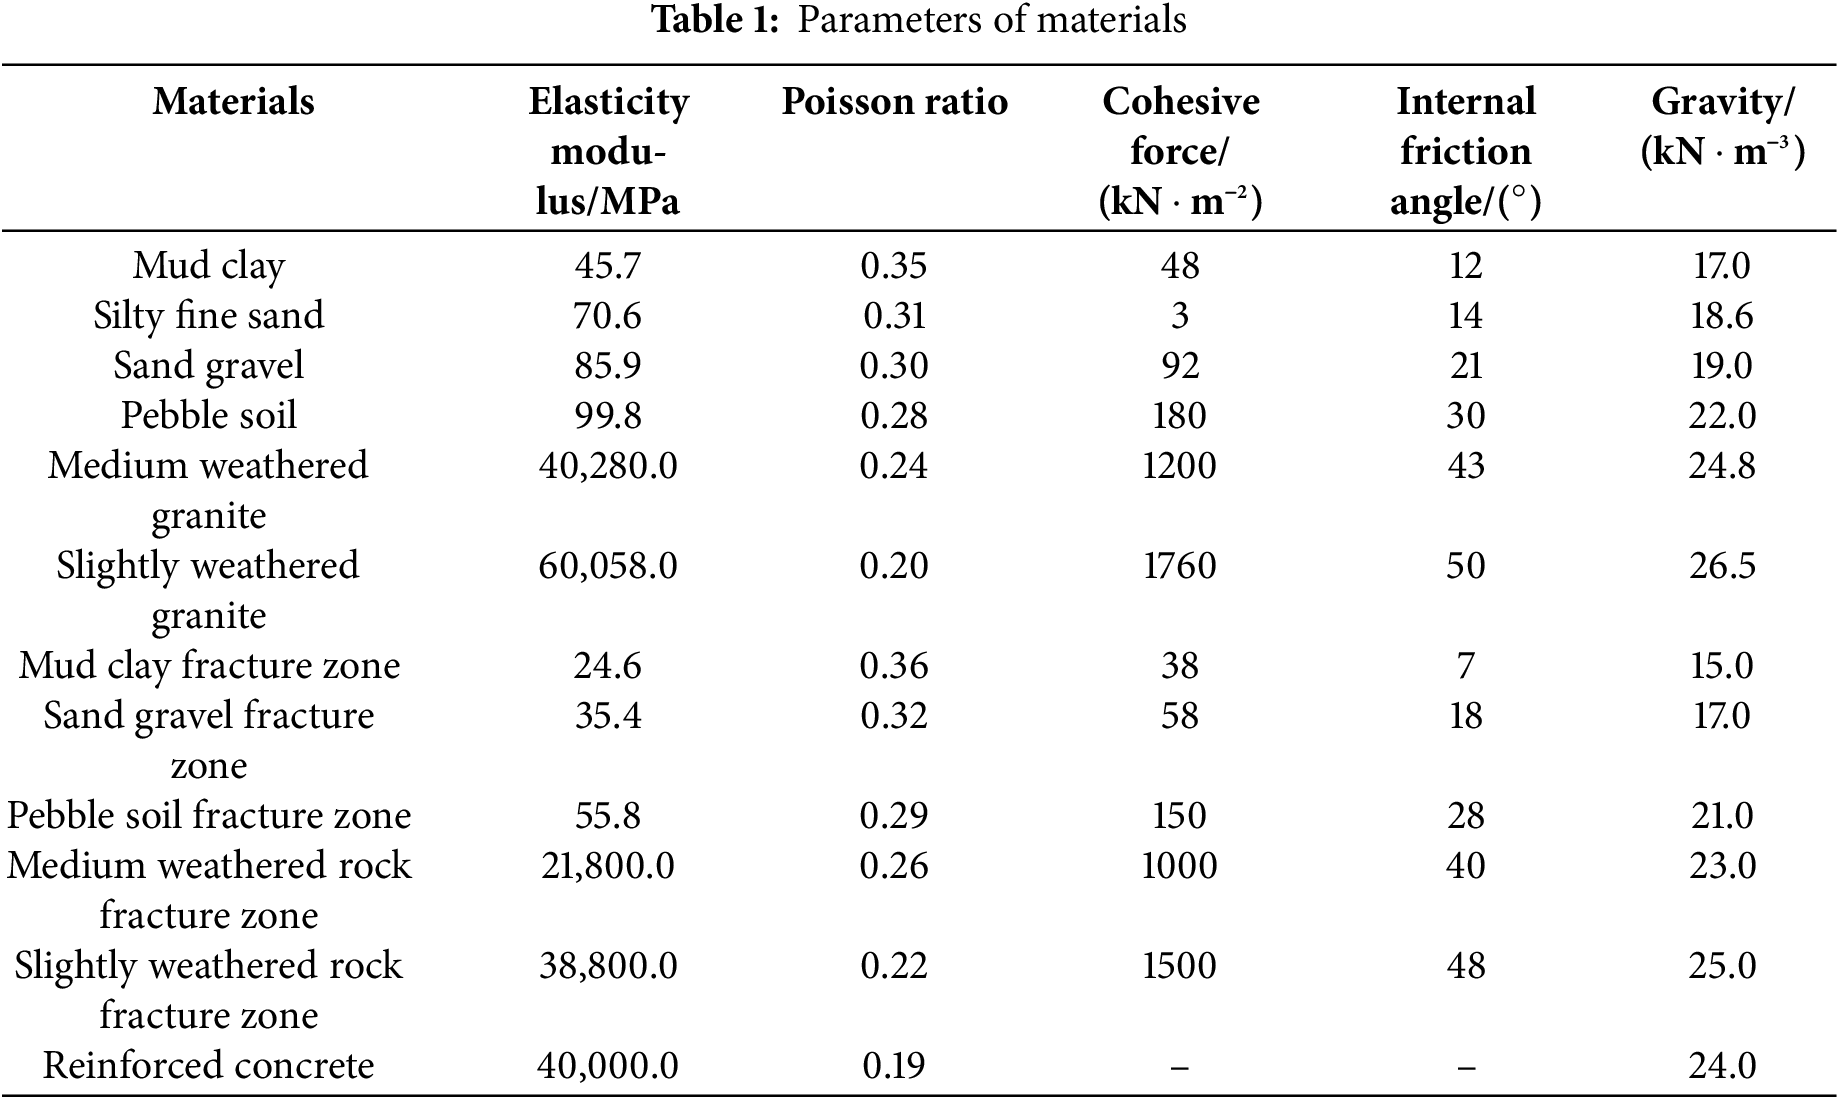
Each material parameter in the model is shown in Table 1 according to the geological survey report of the Haiwen Bridge construction area.
In seismic time history analysis, the characteristic period in the finite element analysis system is first obtained by vibration pattern analysis to calculate its damping parameters. Midas GTS finite element software typically uses elastic boundary conditions to analyse characteristic periods defined by surface springs. The horizontal and vertical foundation reaction coefficients can be calculated using Eqs. (12) and (13), respectively.
Vertical foundation reaction coefficient:
Horizontal foundation reaction coefficient:
where
To avoid errors due to wave reflection effects, the model uses a viscous boundary condition, which is achieved by adding a curved surface damping spring to the outer boundary of the soil body [30–32]. The damping ratios of the P and S waves can be calculated using Eqs. (14) and (15), respectively:
where λ is the volume elasticity coefficient of the foundation,
According to the ‘Seismic Safety Evaluation Report of Haiwen Bridge Project Site in Wenchang City, Hainan Province’, the Institute of Geophysics, China Earthquake Administration has synthesized a 5010 seismic wave for the project site, which corresponds to a 50-year probability of greater than 10%. Therefore, the 5010 seismic waves, which is consistent with the seismic hazard of the site, was selected for the structural seismic analysis. The seismic intensity of the Haiwen Bridge site area is VIII, and the peak acceleration of the 50-year probability of exceeding 10% is 0.35 g. The 5010 wave with an intensity of 0.35 g is used as the reference wave, and the seismic wave processing software SeismoSigna is used to correct the baseline and limit the peak acceleration to obtain the seismic waves with intensities of 0.20, 0.25, 0.30, 0.35, 0.40, 0.45, 0.50, 0.55, and 0.60 g to study the dynamic response law of the bridge pile foundation across the fault under the action of seismic waves of different intensities.
The time history curve and Fourier spectrum of the seismic wave with a peak acceleration of 0.35 g are shown in Fig. 3. The vibrational time-history of the 5010 wave is mainly concentrated within 50 s, and the predominant frequencies are mainly concentrated at 4.3–8.8 Hz. Seismic wave inputs with different peak values from 0.20 to 0.60 g are selected, and the working conditions are given in Table 2.
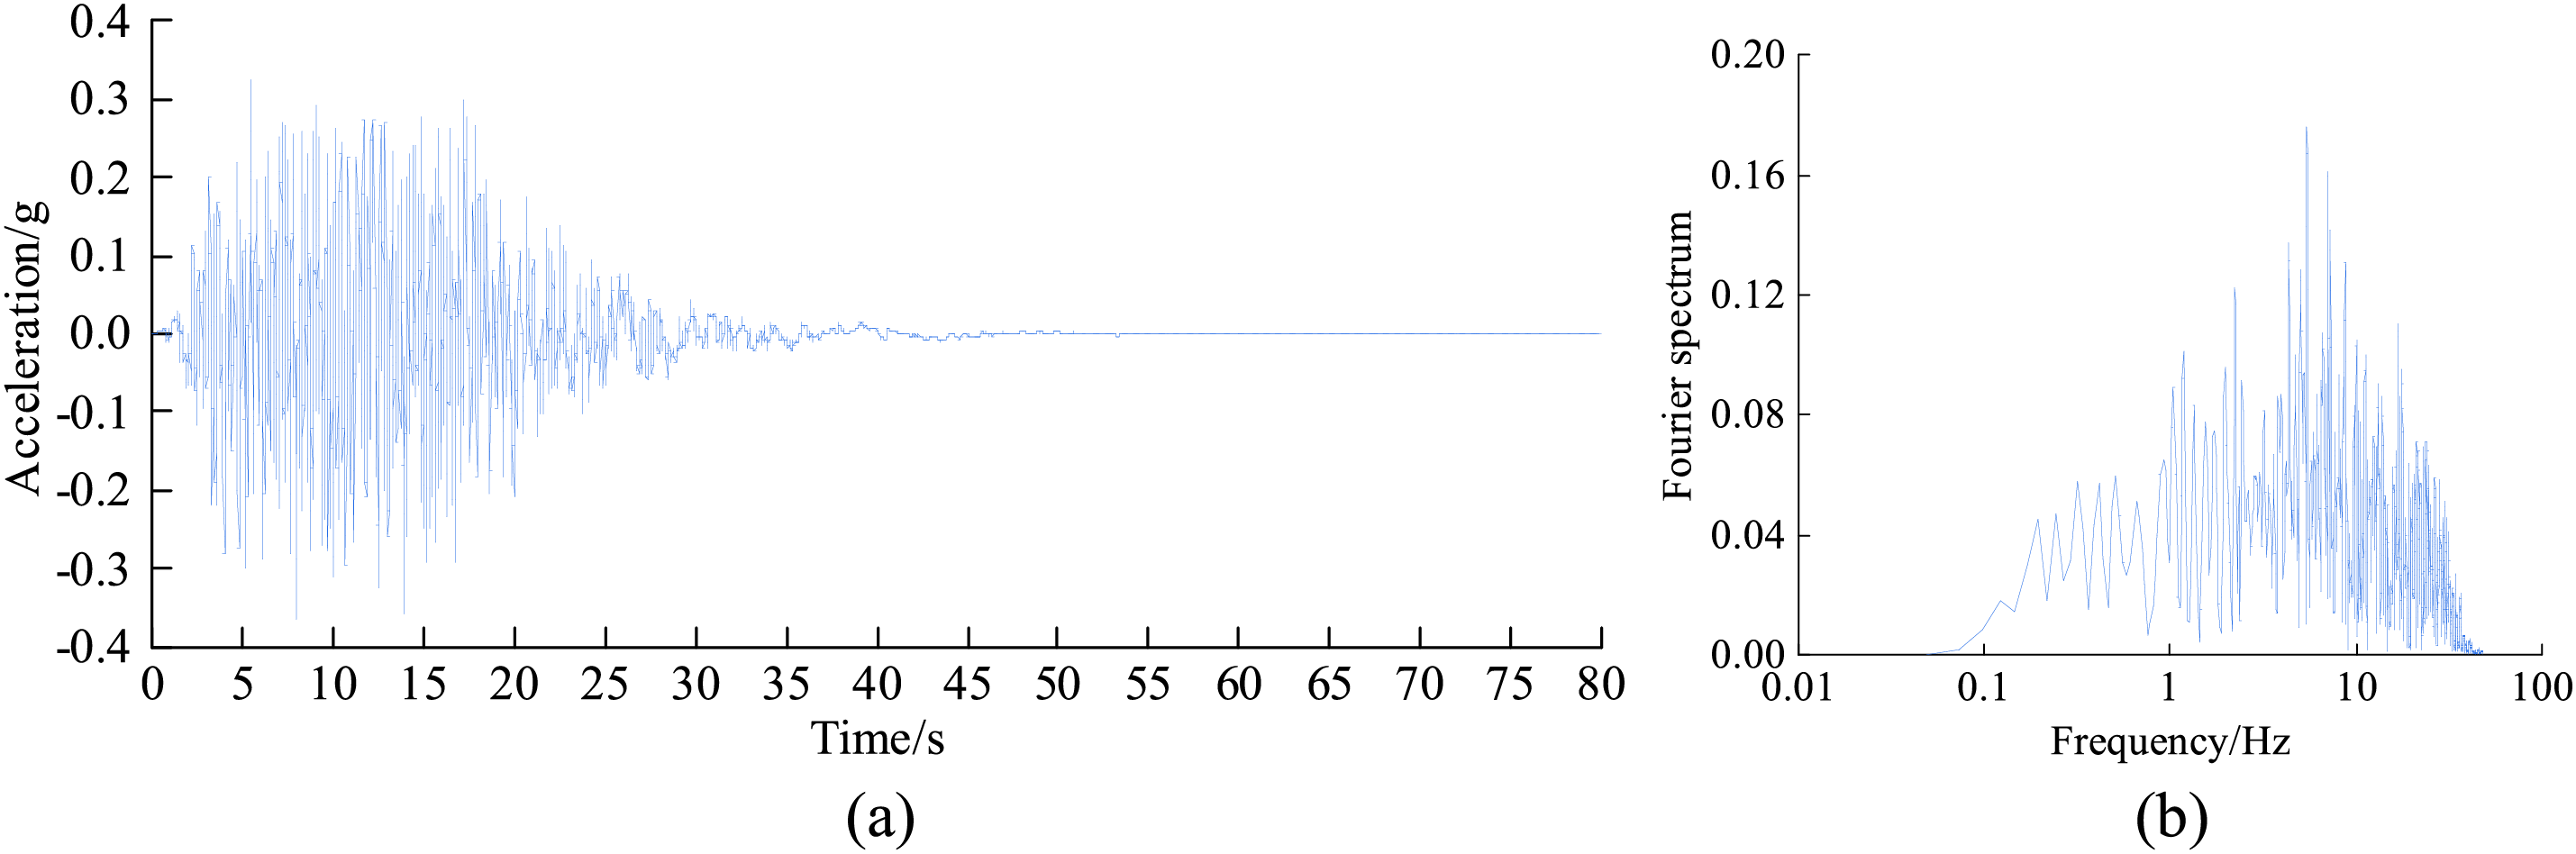
Figure 3: 0.35 g peak acceleration of 5010 wave: (a) Seismic wave time history, (b) Fourier spectrum
4 Mechanical Characteristics of Pile Foundation under Different Intensities of Seismic Waves
4.1 Pile Acceleration Response
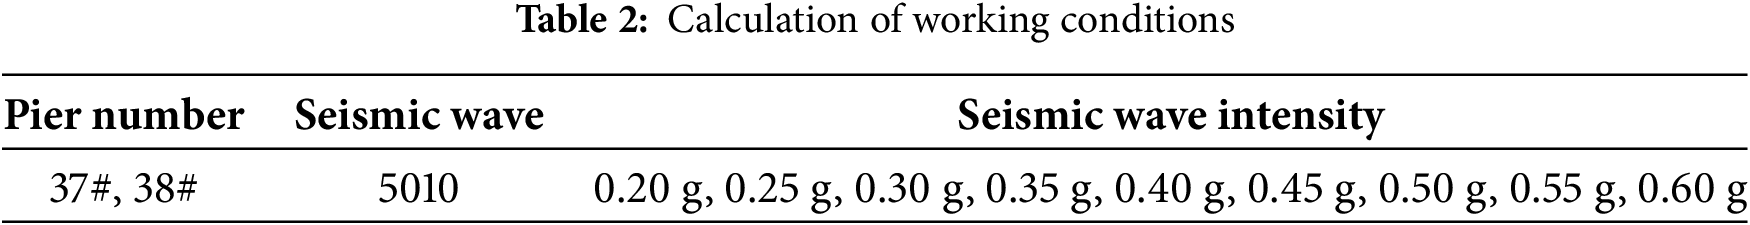
The acceleration of pile foundations 37-1#, 37-3#, 38-2#, and 38-4# under the action of seismic waves of different intensities is shown in Fig. 4. Fig. 4 shows that the acceleration response laws of pile foundations in the upper and lower plates of the fault are similar. The acceleration of the pile foundation under the same bearing platform, whose sections at the same position are almost the same under seismic waves of the same intensity, increases with the increase in seismic intensity.
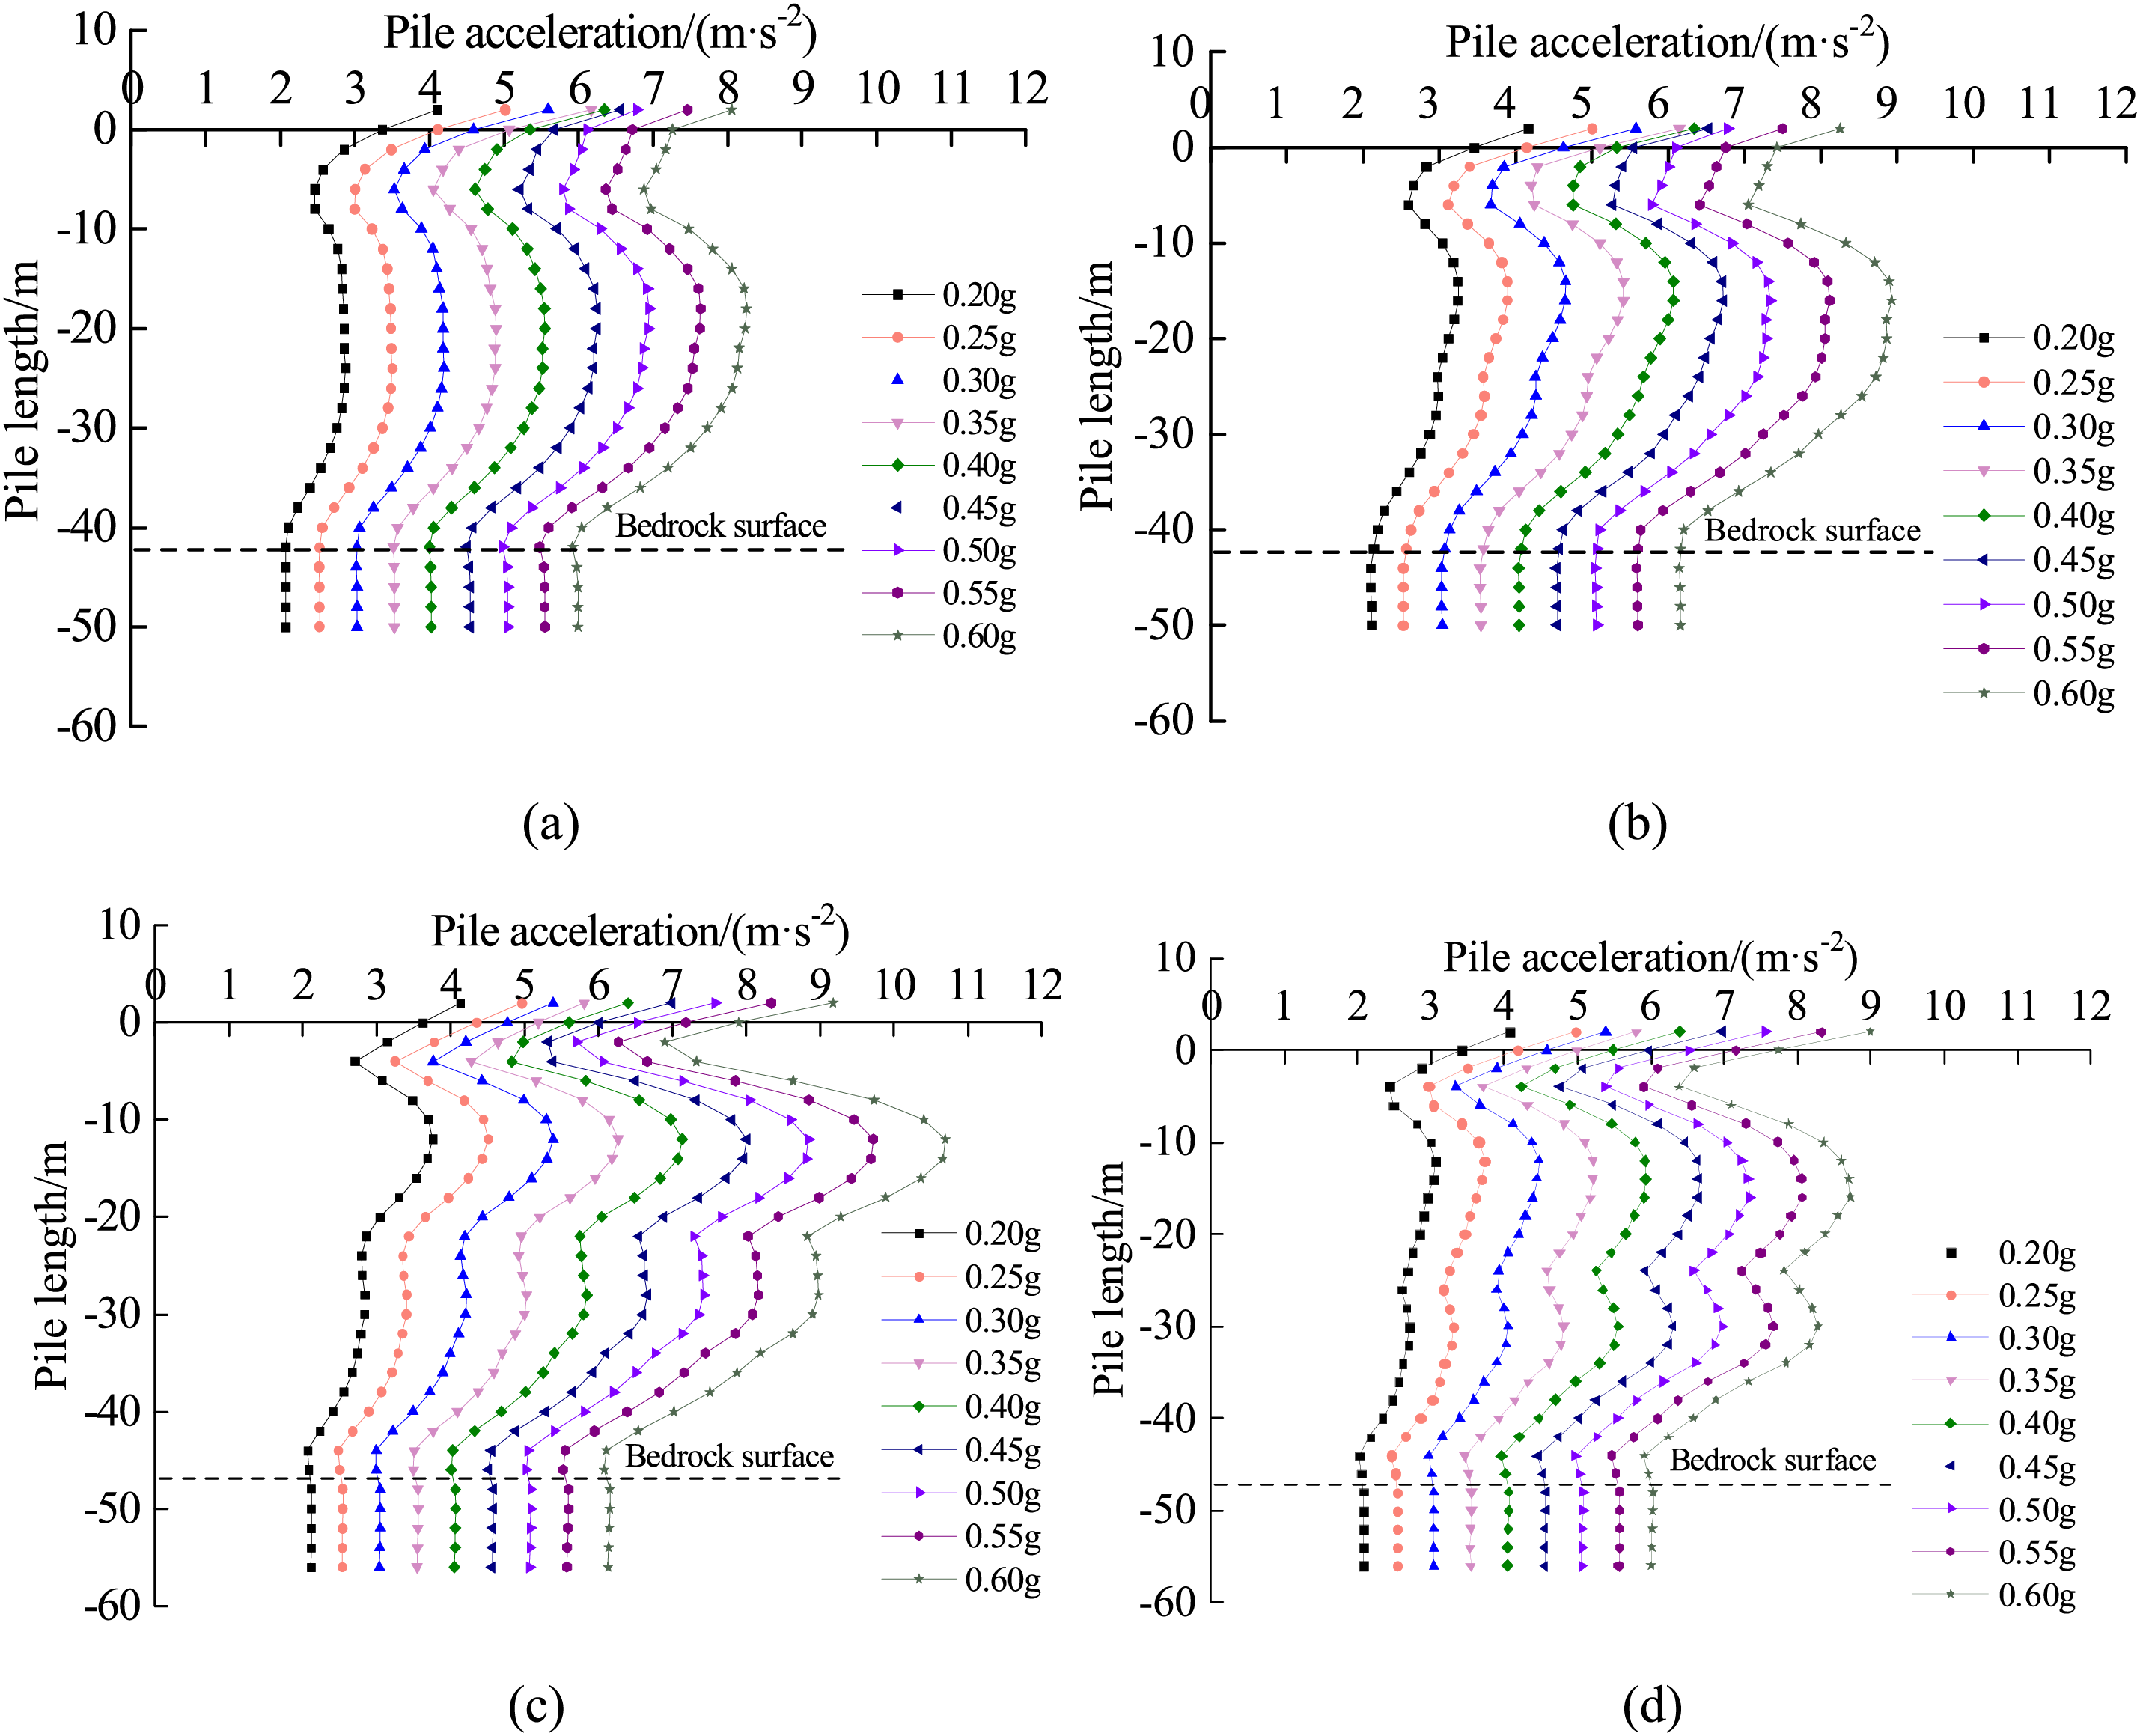
Figure 4: Peak pile acceleration: (a) 37-1# (Lower plate), (b) 37-3# (Lower plate), (c) 38-2# (Upper plate), (d) 38-4# (Upper plate)
The pile acceleration is essentially unchanged within the rock layers, indicating that the rock has a relatively small effect on the acceleration. Overall, the acceleration of the pile body increases gradually from the rock face to the pile top. The reason for this is that the pile bottom is in hard rock, whereas the pile top is in exposed free space, and the pile top is not restrained and therefore has an enormous amplitude response to the input seismic wave. In addition, when the input seismic wave frequency is close to the self-oscillation frequency of the site, the resonance effect will increase the amplifying effect of the site soil layer on the seismic wave energy, making the pile top more sensitive and responsive to the seismic wave. The complexity of the pile-soil interaction and the difference in the amplification effect of the soil around the pile on seismic waves cause a relative decrease in the pile acceleration near the pile top under seismic action.
The acceleration amplification factor α is calculated from Eq. (16), and the acceleration amplification factors at the top of the pile foundations of 37-1#, 37-3#, 38-2#, and 38-4# are shown in Fig. 5.
where
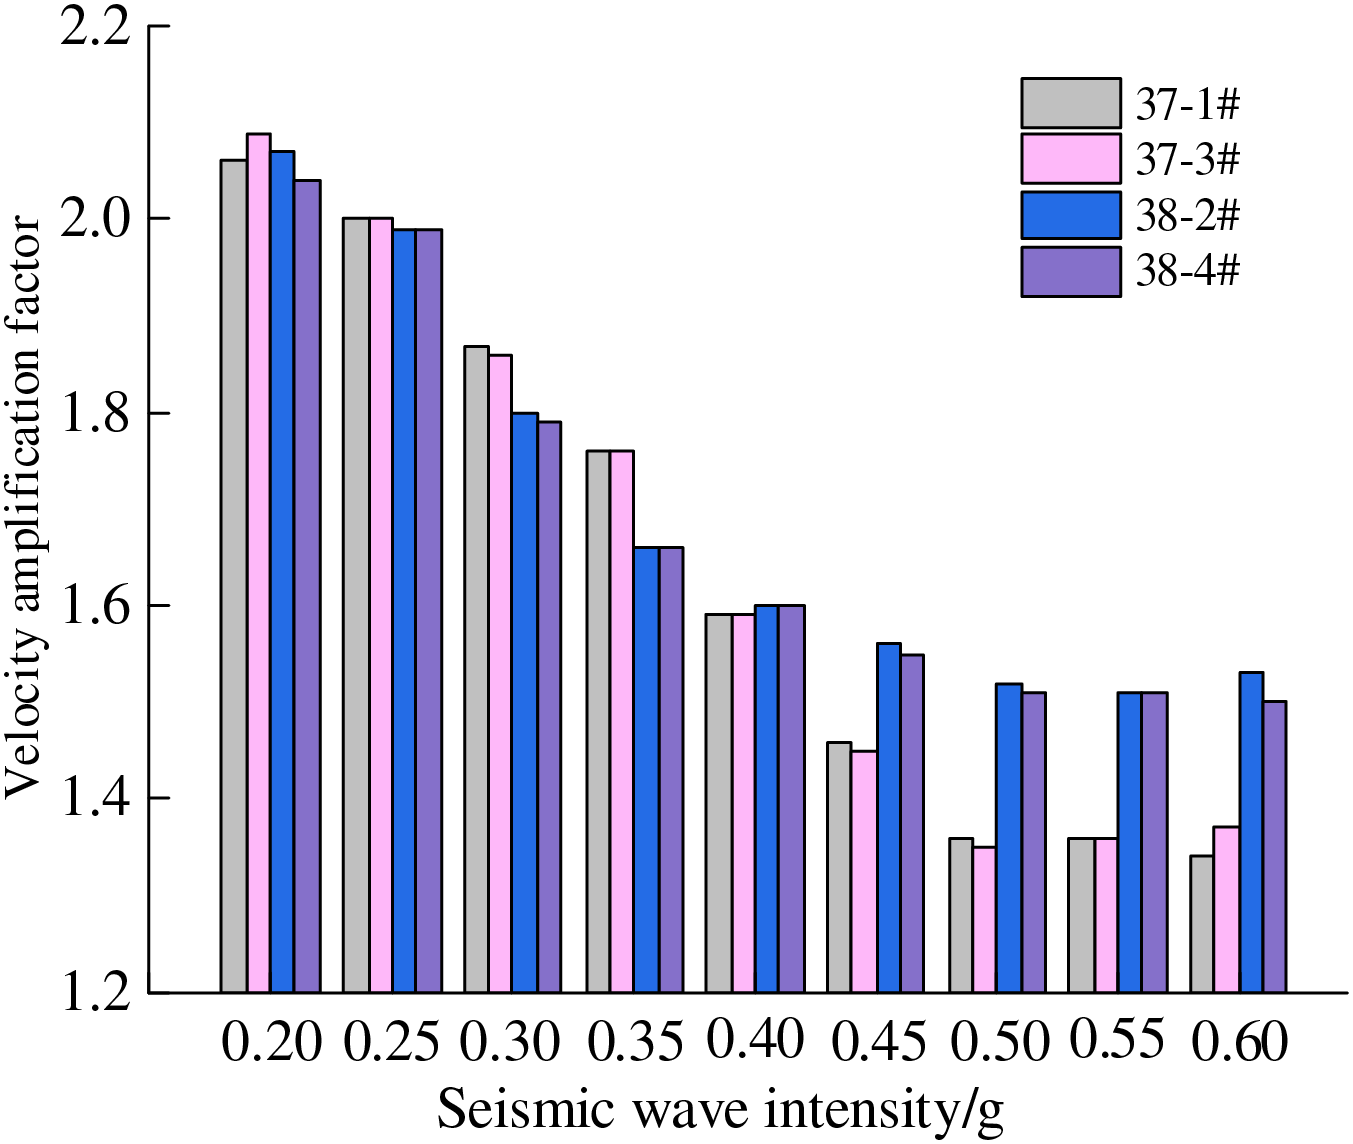
Figure 5: Trend of amplification factor of acceleration at the top of pile
Fig. 5 shows that the acceleration amplification factor of the top pile decreases as the input acceleration increases. When the input seismic wave is less than or equal to 0.4 g, the difference in the acceleration amplification effect between the pile tops of the foundation piles at the upper and lower plates of the fault is not obvious. When the seismic wave is greater than 0.4 g, the acceleration amplification coefficient of the pile top at the upper plate is greater than that at the lower plate, indicating that the fault has the ‘upper plate effect’ under the strong seismic action. The accepted explanation for the ‘upper plate effect’ is the geometric asymmetry caused by faults, where the upper plate is generally closer to the seismic fault and receives more seismic wave energy, resulting in a greater seismic response of the pile foundation in the upper plate [33,34].
4.2 Acceleration Time History Response
Taking 37-1# of the lower plate and 38-4# of the upper plate as examples to analyse the acceleration time history response law of the pile foundation. The time history response of the acceleration at the top and bottom of the pile foundations of 37-1# and 38-4# piles under the action of seismic waves of different intensities is shown in Fig. 6. The amplitude of the time history acceleration response at the bottom of the pile is similar to that of the input seismic wave, while the acceleration response value at the top of the pile is larger than the amplitude of the input seismic wave. Taking the 0.35 g seismic wave as an example, the peak acceleration at the bottom of pile 37-1# is 3.53 m/s2, and the peak acceleration at the top of the pile is 6.17 m/s2. It is because when the frequency of the input seismic wave is close to the self-oscillation frequency of the site, the pile-soil interaction will increase the amplification of the seismic wave by the soil layer of the site, and the resonance effect makes the top of the pile sensitive and responsive to the seismic wave.
Figure 6: Acceleration time history response: (a) Pile top of 37-1# (Lower plate), (b) Pile top of 38-4# (Upper plate), (c) Pile bottom of 37-1# (Lower plate), (d) Pile bottom of 38-4# (Upper)
The acceleration time history response at the bottom of the pile stabilized at 30 s, while the top of the pile stabilized at 50 s, indicating that the large thickness of the overburden layer has a significant ‘filtering effect’ on the seismic waves, filtering out the high frequency components of the seismic waves, while the bedrock has less influence on the frequency of the seismic waves.
Taking the 37-1# pile foundation as an example, under the action of a 0.35 g seismic wave, the frequency domain analysis of the acceleration at the bottom and top of the pile is shown in Fig. 7. The main frequency components of the Fourier spectra of both the input seismic wave and the acceleration at the pile bottom are in the range of 4.3–8.8 Hz, and those at the top of the pile are in the range of 1.7–2.4 Hz, indicating that the acceleration frequency at the pile bottom is similar to the input acceleration, and that the frequency at the pile top is smaller than that at the pile bottom.
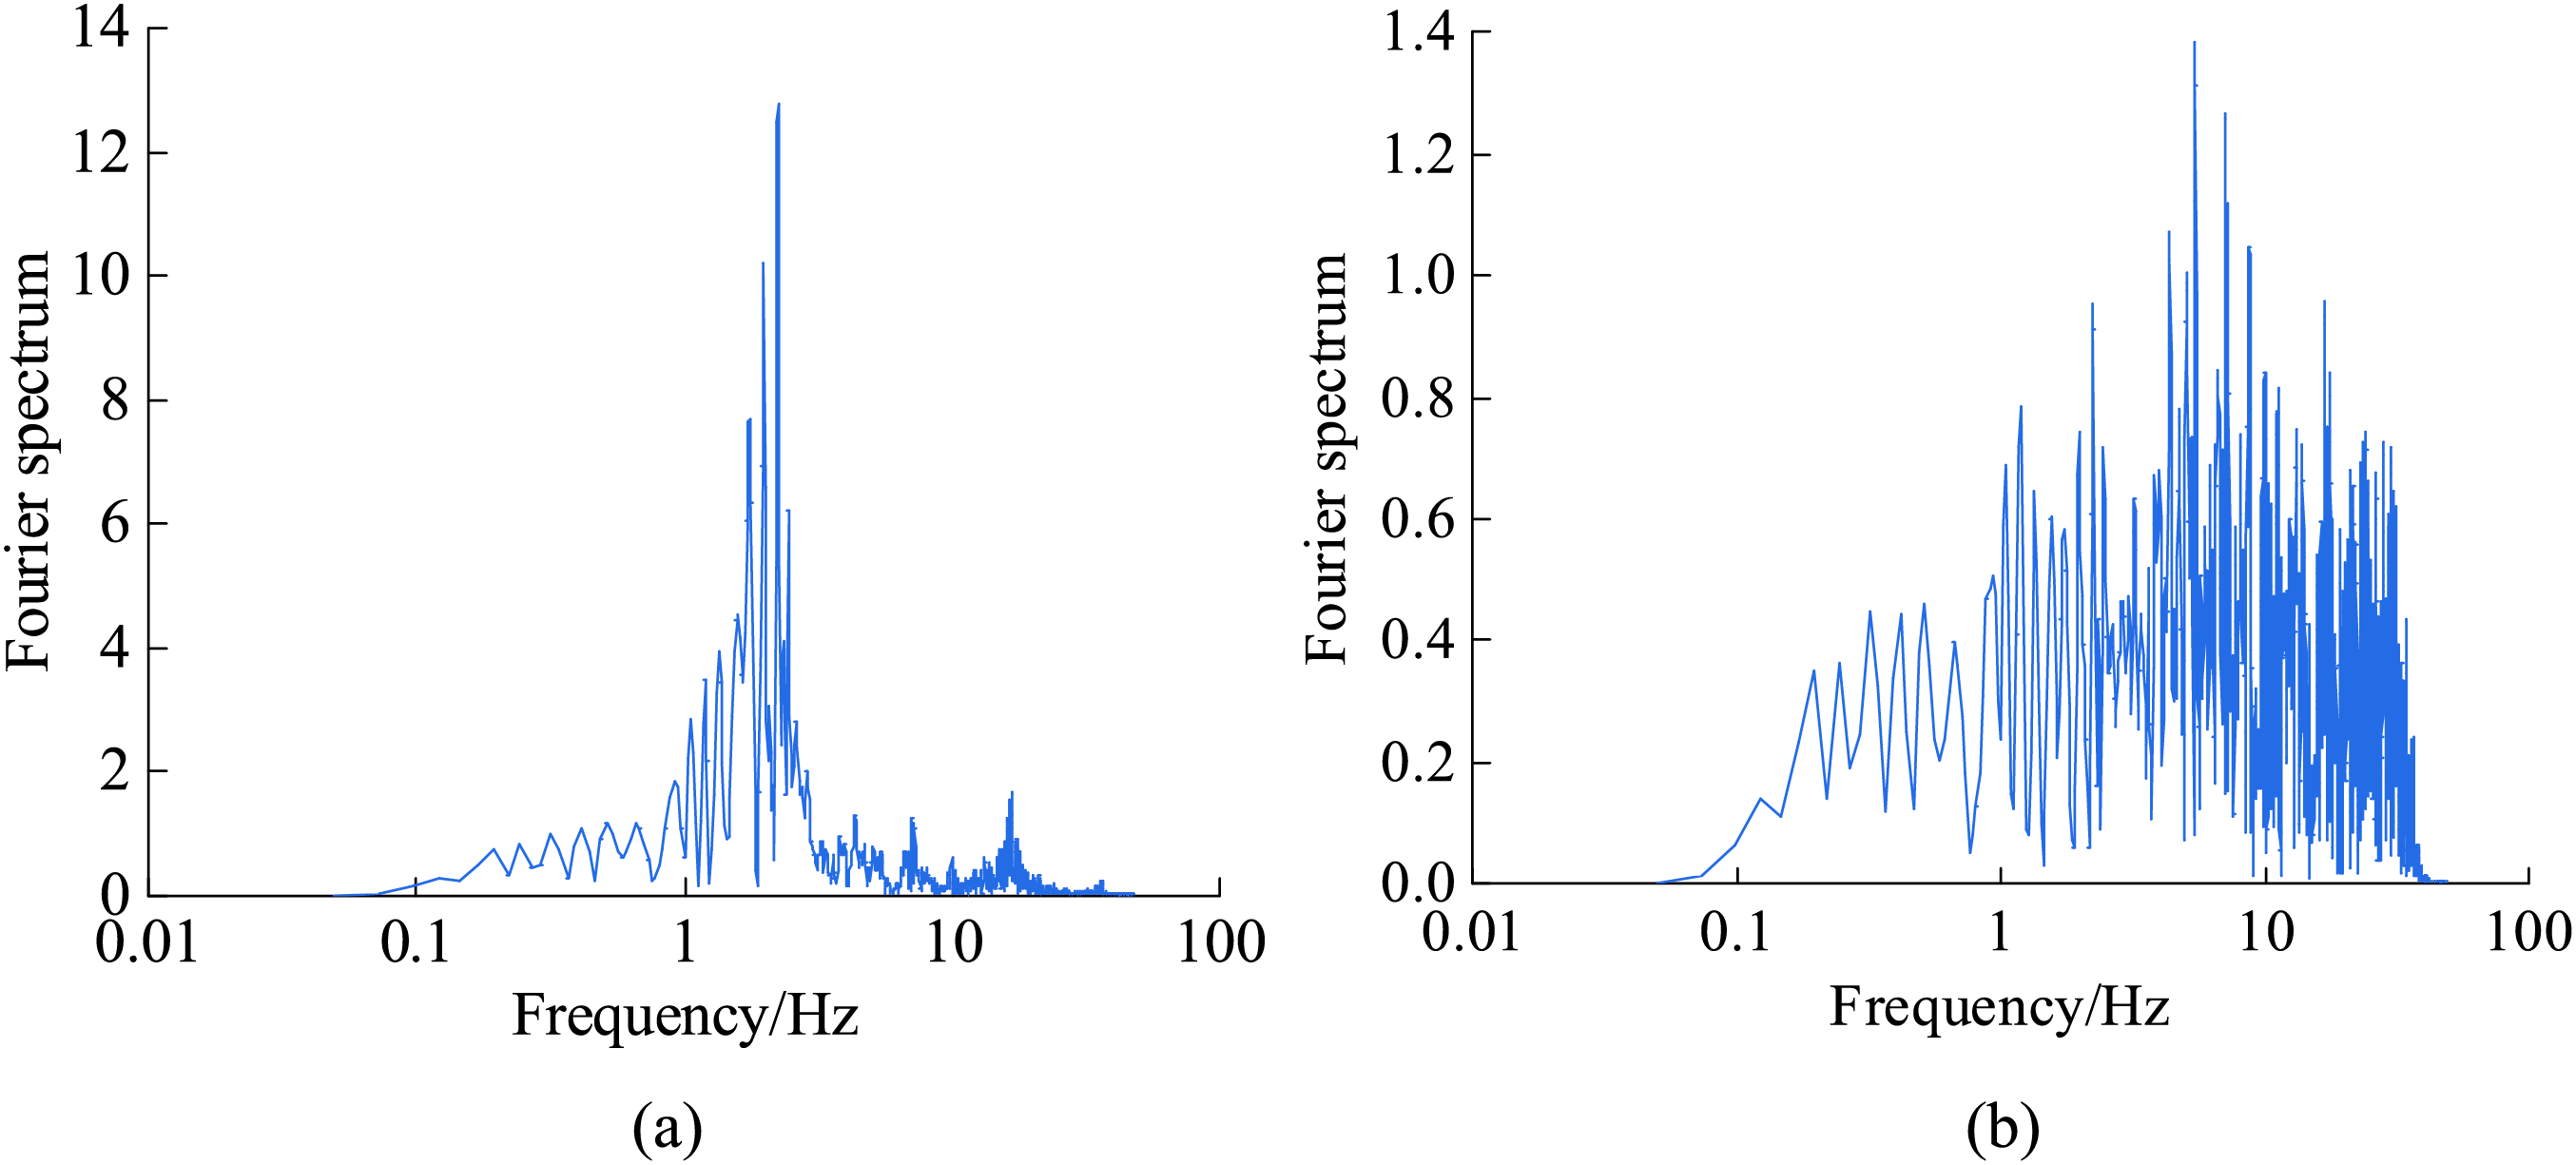
Figure 7: Fourier spectrum: (a) Pile top of 37-1#, (b) Pile bottom of 37-1#
As can be seen from Fig. 8, when the input seismic wave is 0.20–0.60 g, respectively, the peak acceleration at the base of the pile foundations in both the upper and lower plates of the fault appear at 7.96 s. The moments of peak acceleration at the pile top were different, between 11.28–18.20 s for the lower plate pile and 10.06–15.36 s for the upper plate pile, which shows that there is a relative delay in the moment of peak acceleration at the pile top compared to that at the pile bottom. It is due to the fast response rate of the bedrock to the input seismic waves and the hysteresis in the response rate of the upper overburden layer to the input ground shaking due to inertial effects and pile-soil interaction. The moment when the lower peak lags behind the upper peak, and there is an ‘upper effect’ on the fault.
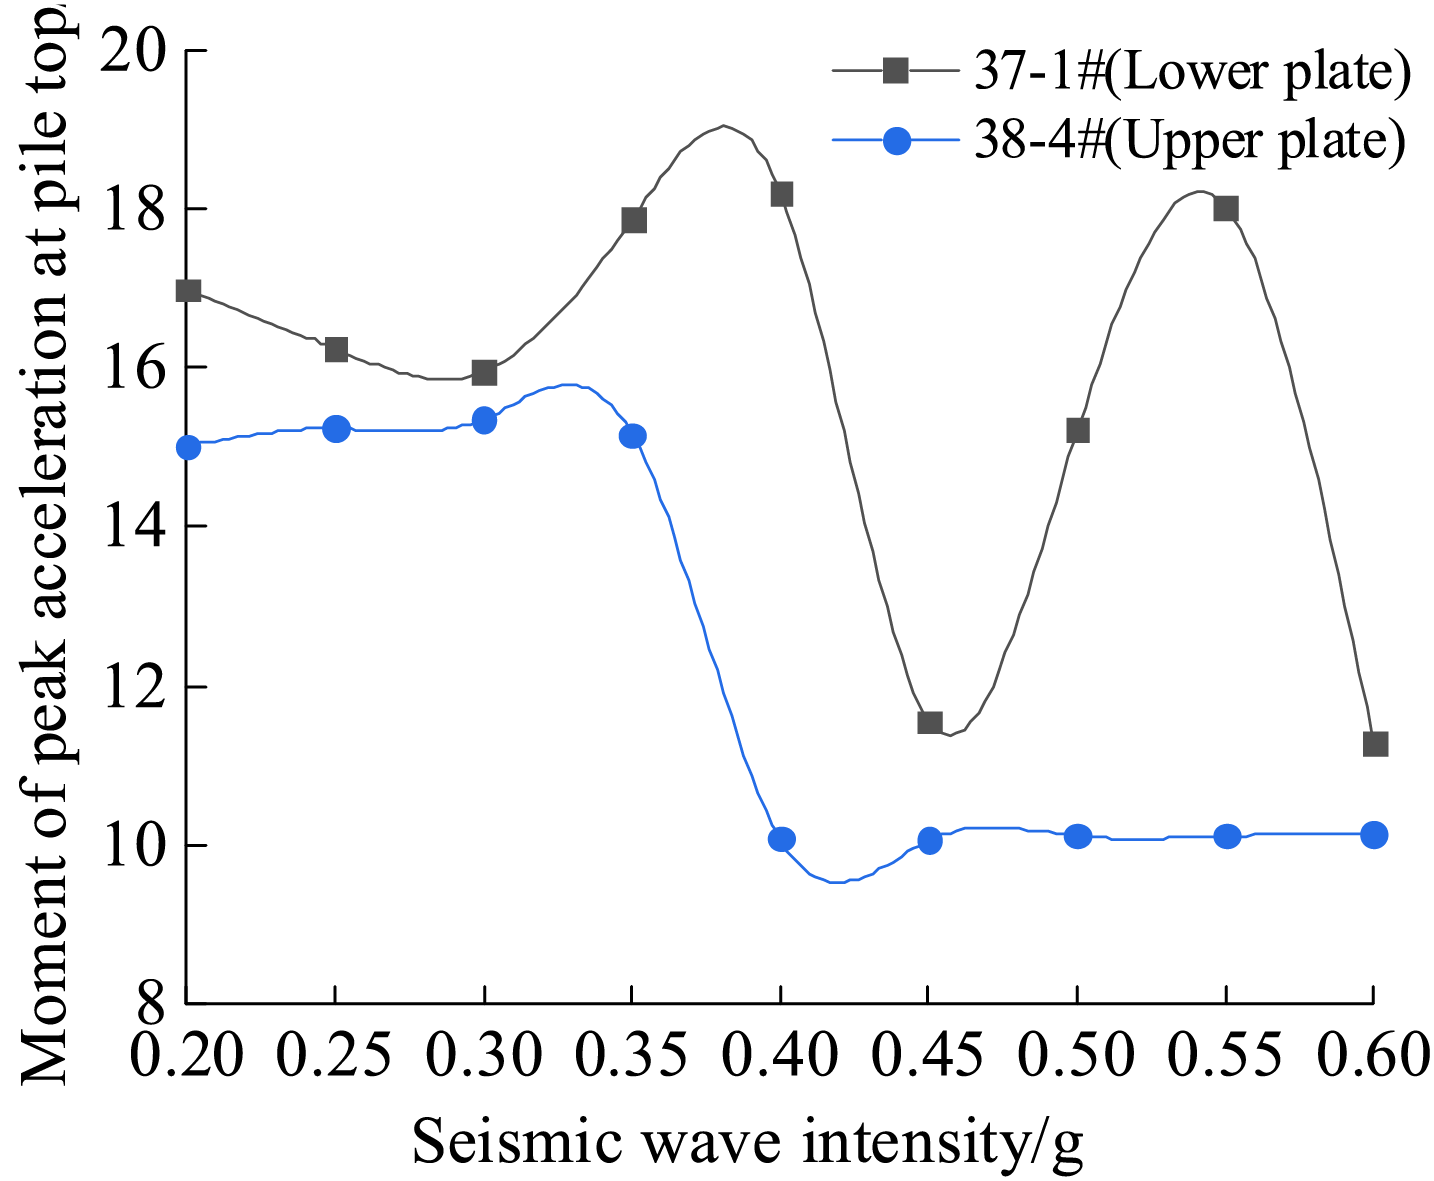
Figure 8: Moment of peak acceleration at pile top
4.3 Pile Body Horizontal Relative Displacement Response
The relative displacement of the pile body at the moment of maximum amplitude of the pile top relative displacement under the seismic waves of different intensities is shown in Fig. 9. Fig. 9 shows that the horizontal relative displacement of the pile body of piers 37# and 38# increases with the increase of the input seismic wave intensity. The law of change under the seismic waves of different intensities is almost the same. The horizontal relative displacement of the pile body is almost zero within the rock layer. It gradually increases from the rock face to the pile top, showing the mechanical properties of elastic long piles.
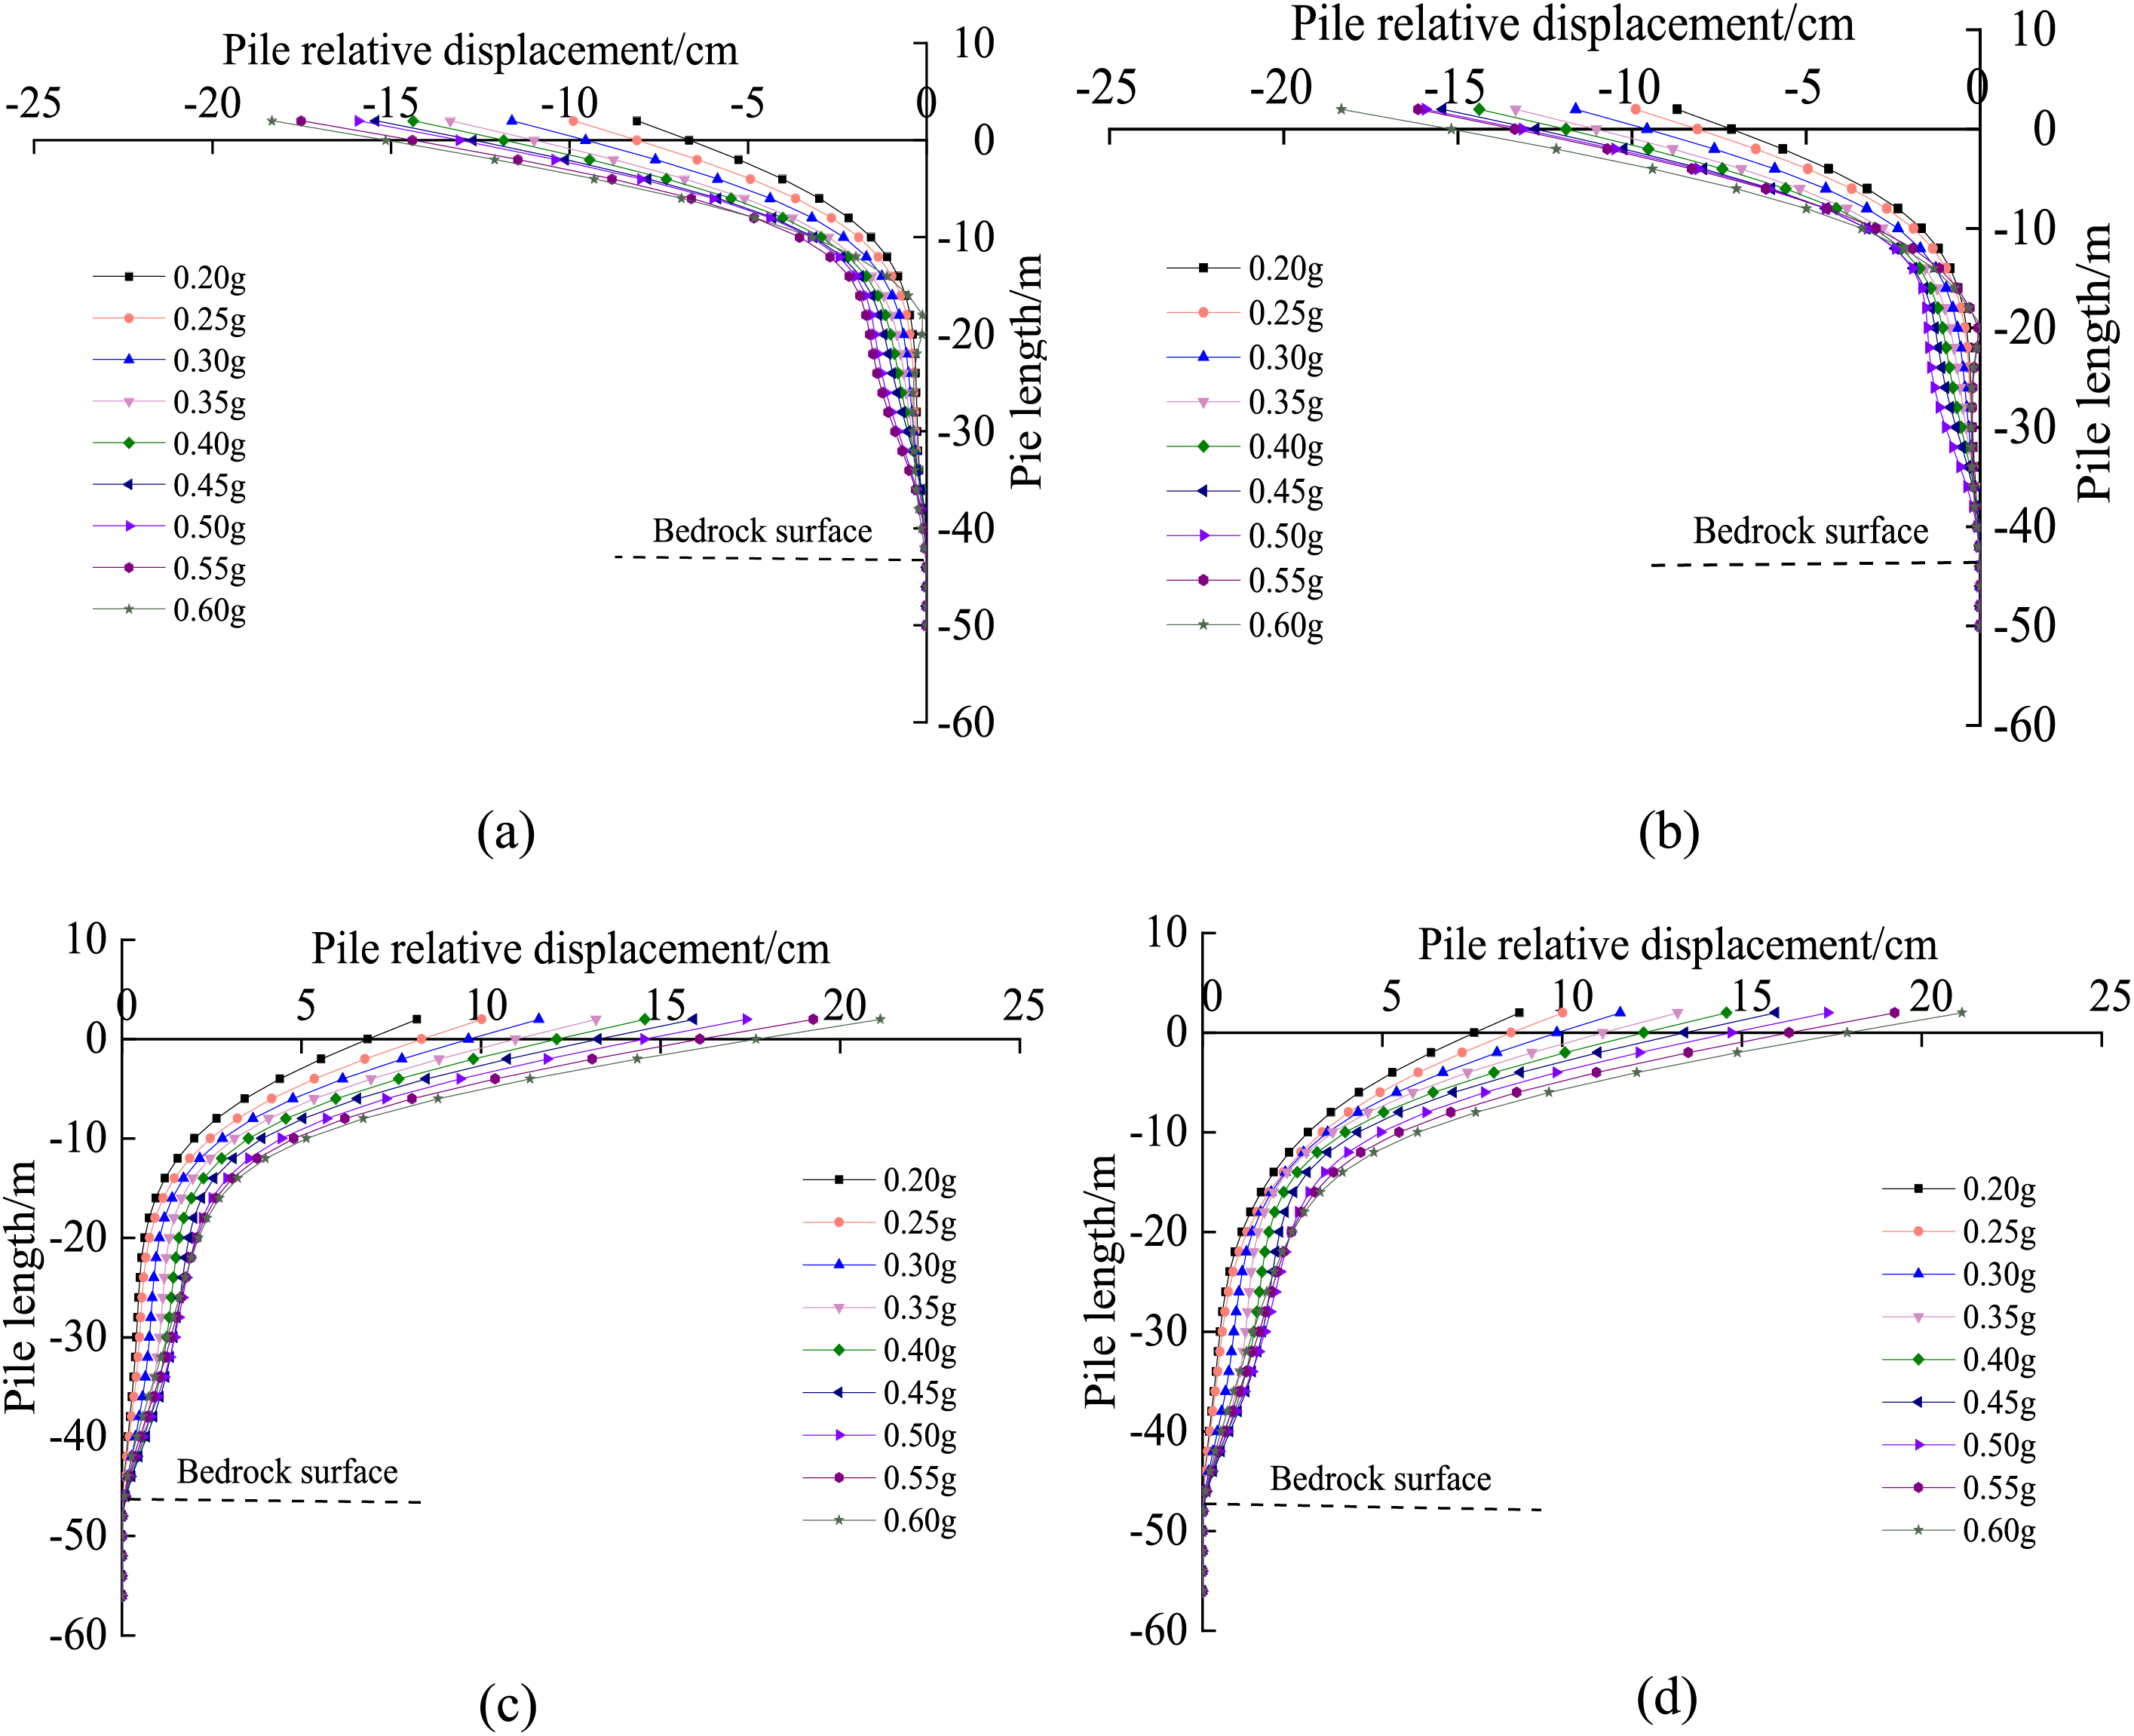
Figure 9: Horizontal relative displacement of pile: (a) 37-1# (Lower plate), (b) 37-3# (Lower plate), (c) 38-2# (Upper plate), (d) 38-4# (Upper plate)
The relative displacement of the piles varies very little from the pile’s bottom to the bedrock face, indicating that the bedrock has little effect on the pile displacement. The increase in relative pile displacement from the bedrock face to the pile top is significant. This is because the bedrock has a greater embedding effect on the pile foundation than the overburden. In addition, when the response spectrum frequency of the input seismic wave is close to the natural frequency of the site, the amplification of the seismic wave by the soil layer of the site is increased.
Fig. 10 shows that the pile top horizontal relative displacement becomes more significant with increasing seismic intensity. Under the same intensity of seismic waves, the pile top horizontal relative displacement of the pile foundation on the same side of the fault is the same. The pile top horizontal relative displacement of the pile foundation of pier 38# is always greater than that of pier 37#. This is because the pile foundation of pier 38# is in the upper plate of the fault. Due to the fault, the difference in the soil around the pile, and the different depths of the embedded rock, there is a noticeable ‘upper plate effect’ under the action of seismic waves.
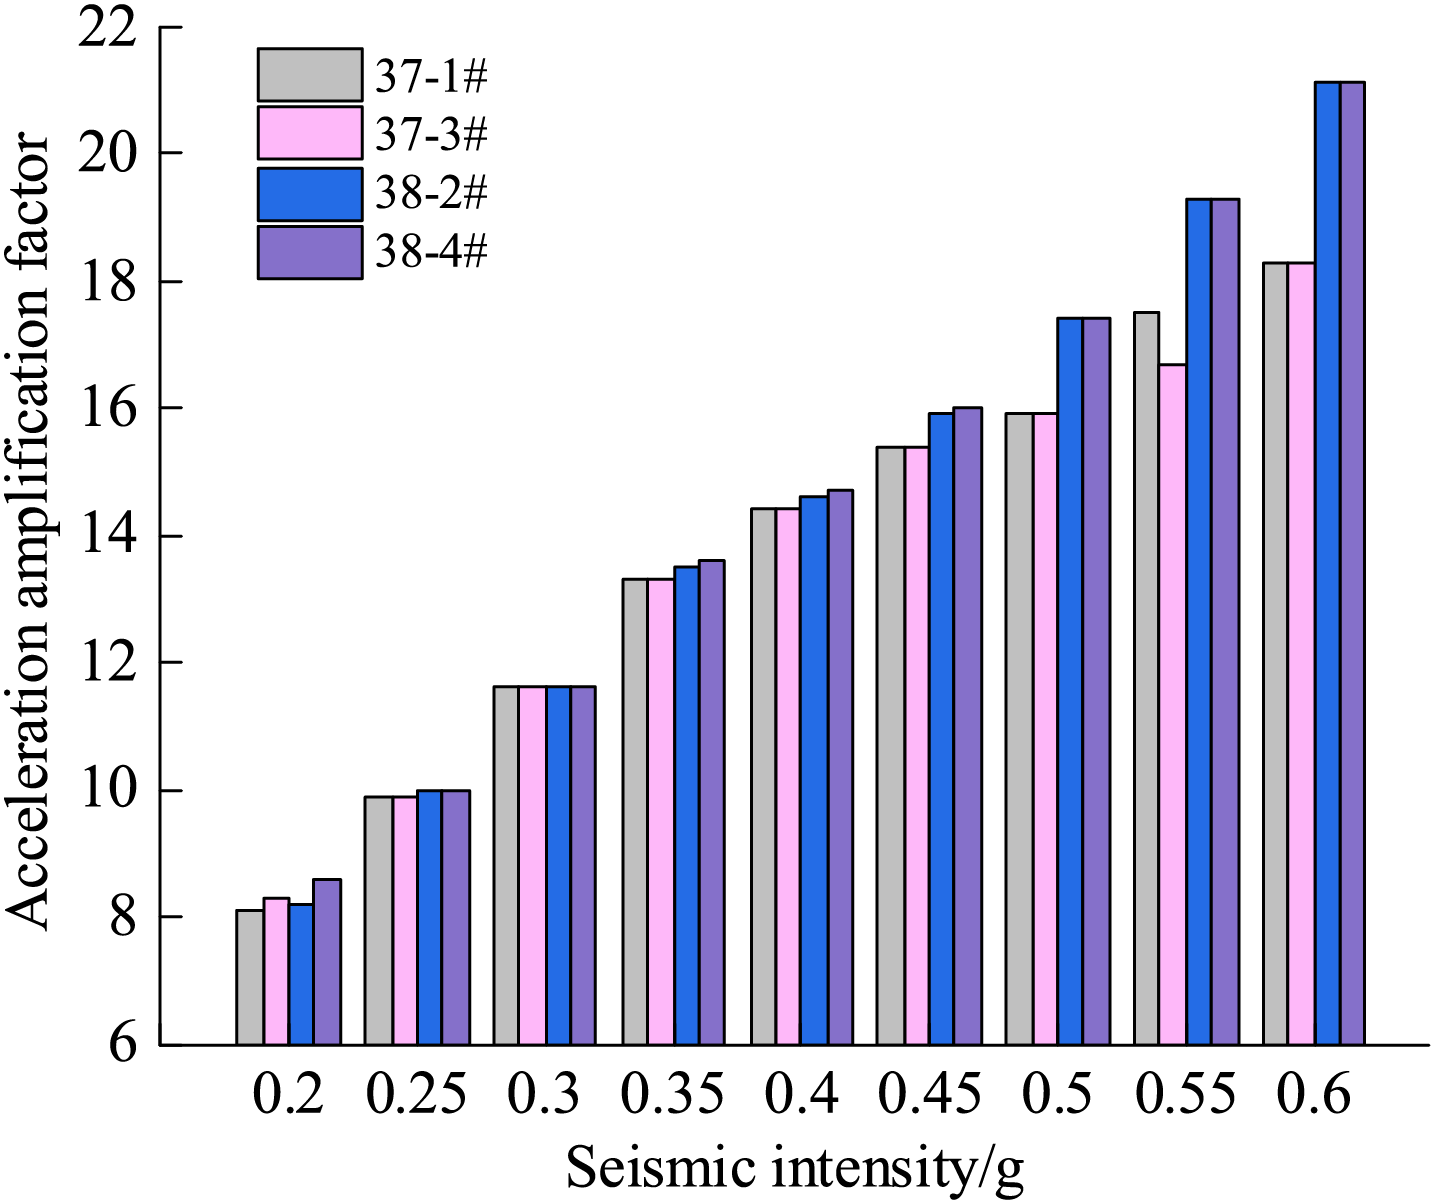
Figure 10: Trend of horizontal relative displacement of pile top
4.4 Pile Bending Moment Response
The design value of the bending capacity of the pile foundations of piers 37# and 38# of Haiwen Bridge is 37.1 MN·m. The bending moments of piles under seismic effects of different intensities are shown in Fig. 11. Fig. 11 shows that the maximum pile bending moment in the upper plate pile foundation is more significant than that in the lower plate under seismic waves of the same intensity. This is because the fault makes the embedded rock depth and the distribution of rock and soil around the piles different between the upper and lower plate pile foundations. Therefore, the effect of faults should be taken into account when designing the flexural capacity of bridge pile foundations.
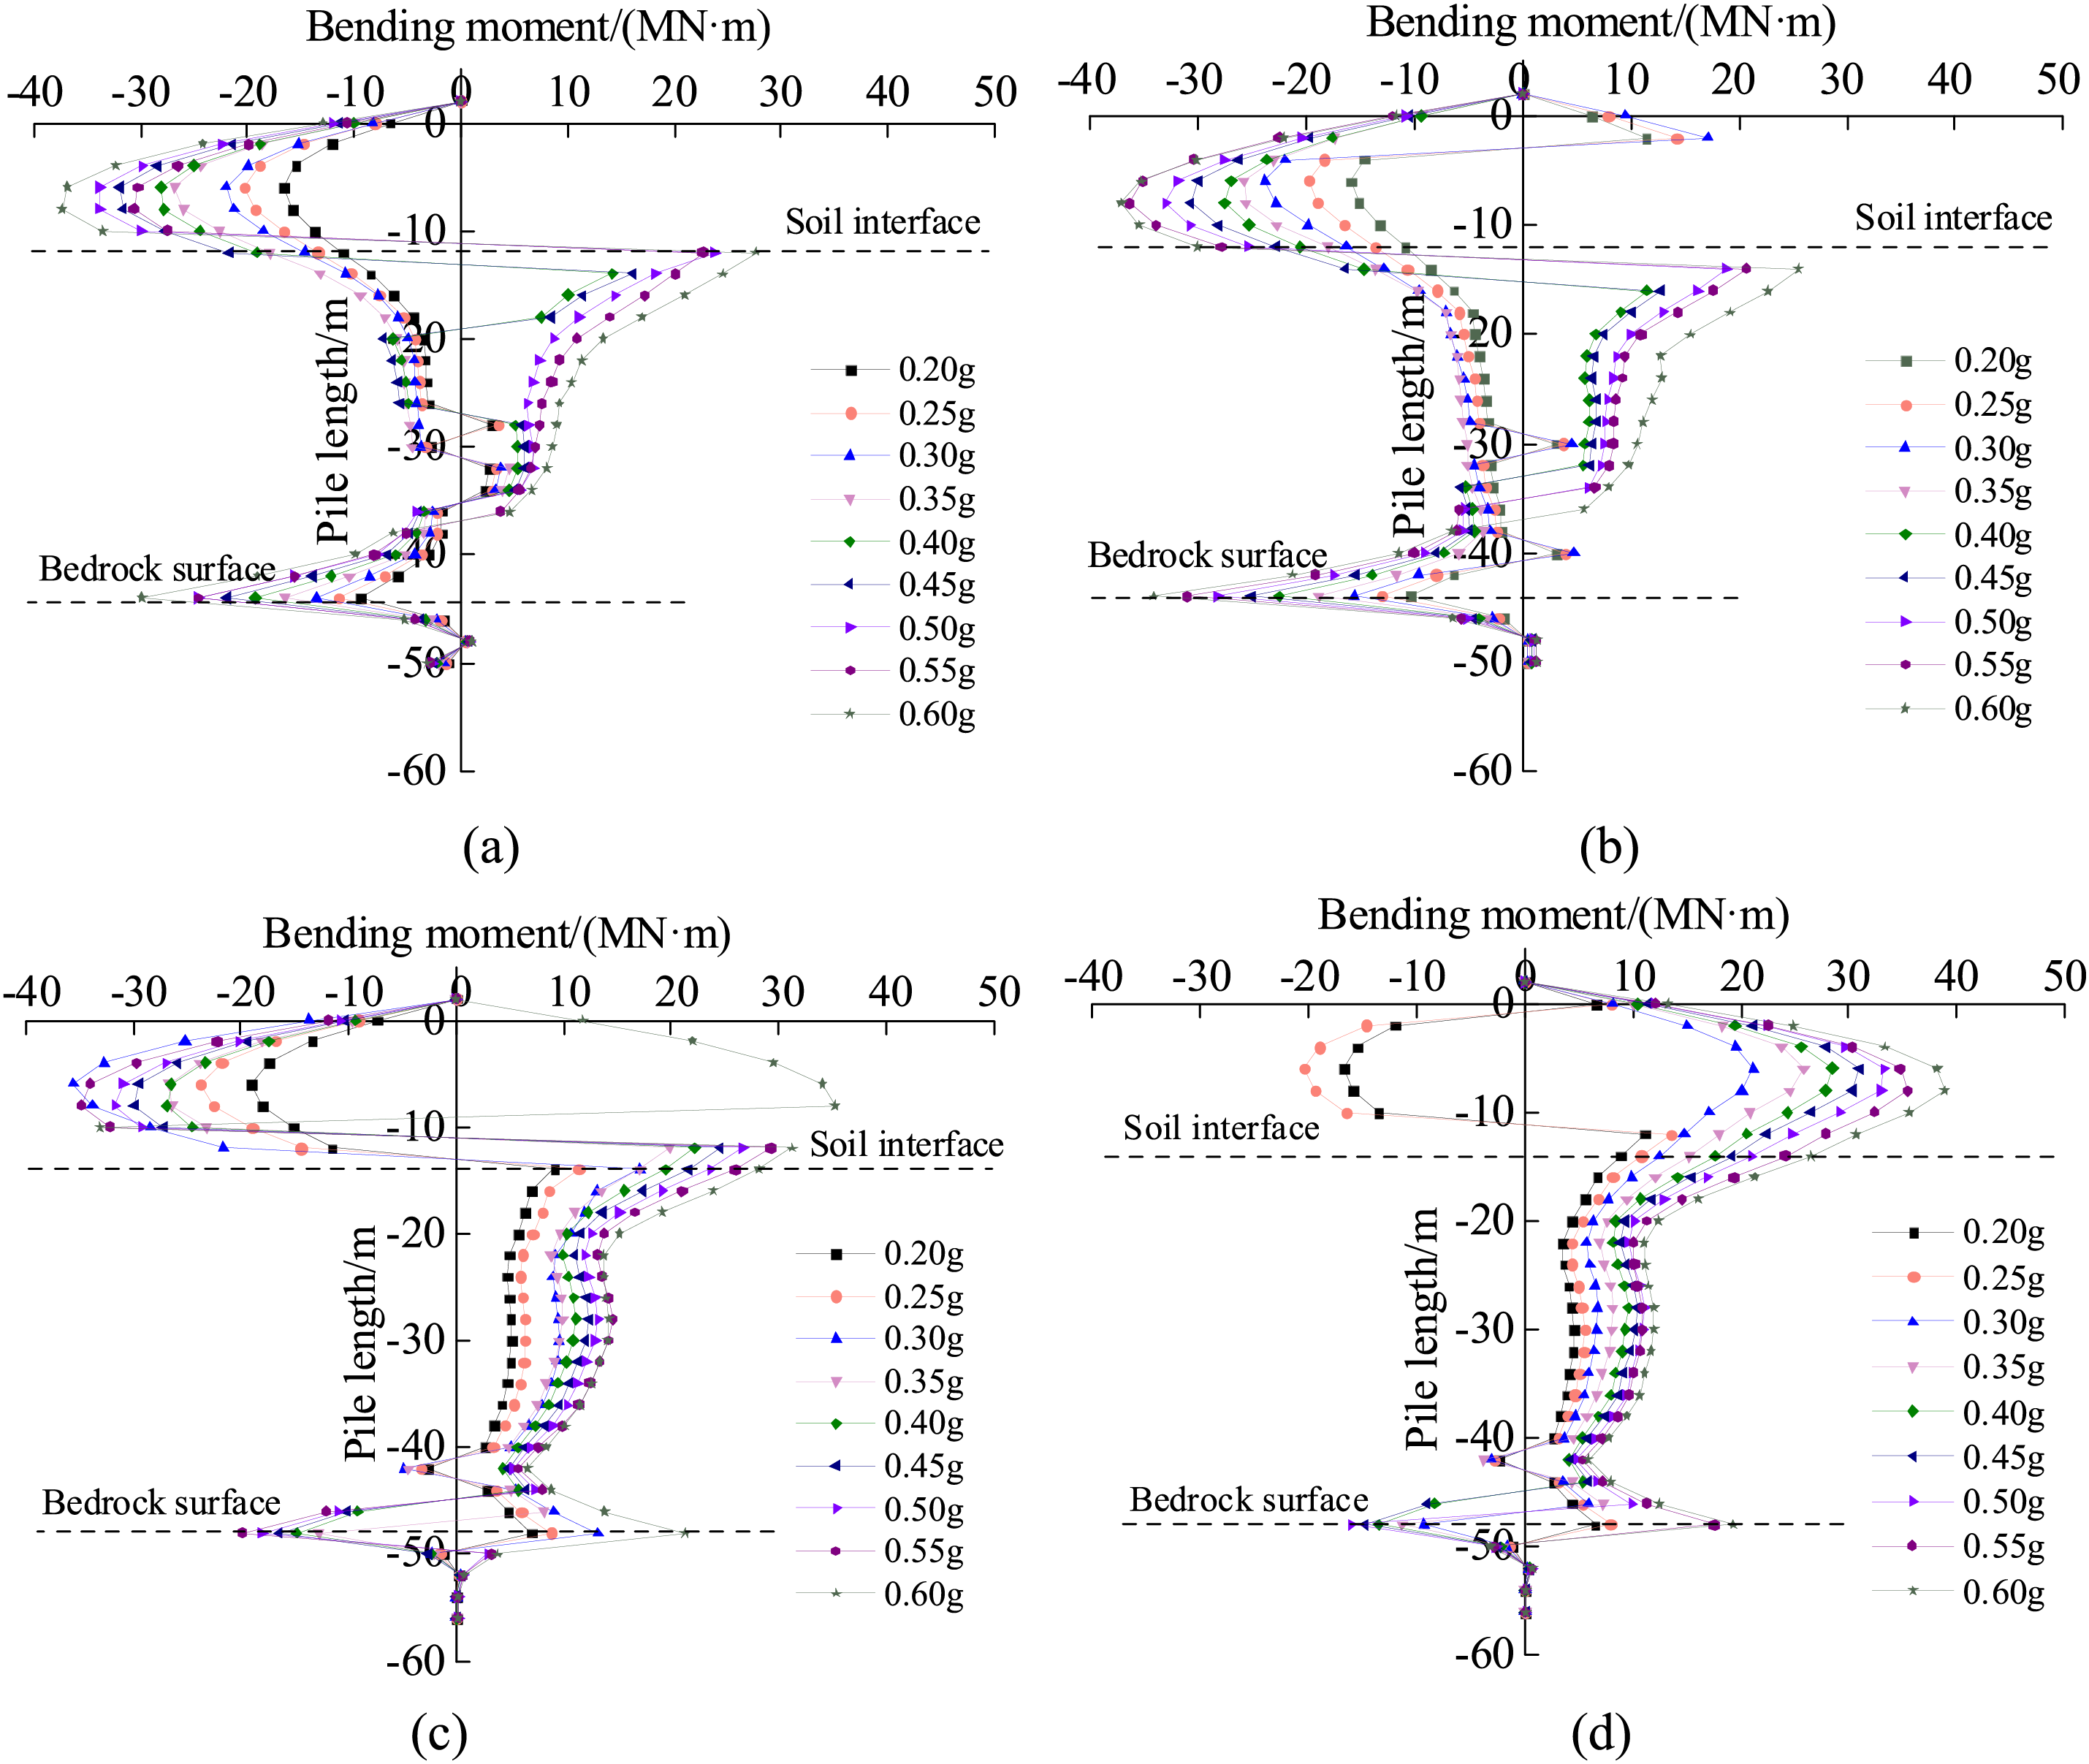
Figure 11: Bending moment diagram of pile body under seismic action of different intensities: (a) 37-1# (Lower plate), (b) 37-3# (Lower plate), (c) 38-2# (Upper plate), (d) 38-4# (Upper plate)
Under the effect of seismic waves of different intensities, the trends of bending moments of piles 37-1#, 37-3#, 38-2#, and 38-4# are the same. The maximum bending moments of the upper and lower plate pile foundations increase with increasing seismic intensity, and the maximum value is concentrated in the range of 15.9 to 38.9 MN · m. The significant difference in soil intensity causes relatively large bending moments at the interface between the bedrock surface and the upper soil layer. Therefore, the seismic resistance of bridge pile foundations should pay attention to the bending capacity design at the locations with significant differences in the softness and hardness of the geotechnical body.
Fig. 12 shows that the maximum bending moments of piles 37-1#, 37-3#, 38-2#, and 38-4# are not the same when seismic waves of different intensities are input. When the seismic wave intensity is 0.35 g, the maximum pile bending moment at the upper and lower plates is 26.78 MN-m, which is smaller than the bending capacity of the pile foundation. It shows that the bending bearing capacity of the pile foundation of Haiwen Bridge meets the seismic intensity requirement VIII. When the seismic intensity is equal to or greater than 0.55 g, the maximum bending moment of piles 37-1#, 37-3# and 38-4# exceeds the bending capacity of the pile section with a difference of 0.26 to 2.76 MN · m, which is exceeded by 0.7% to 7.4%.
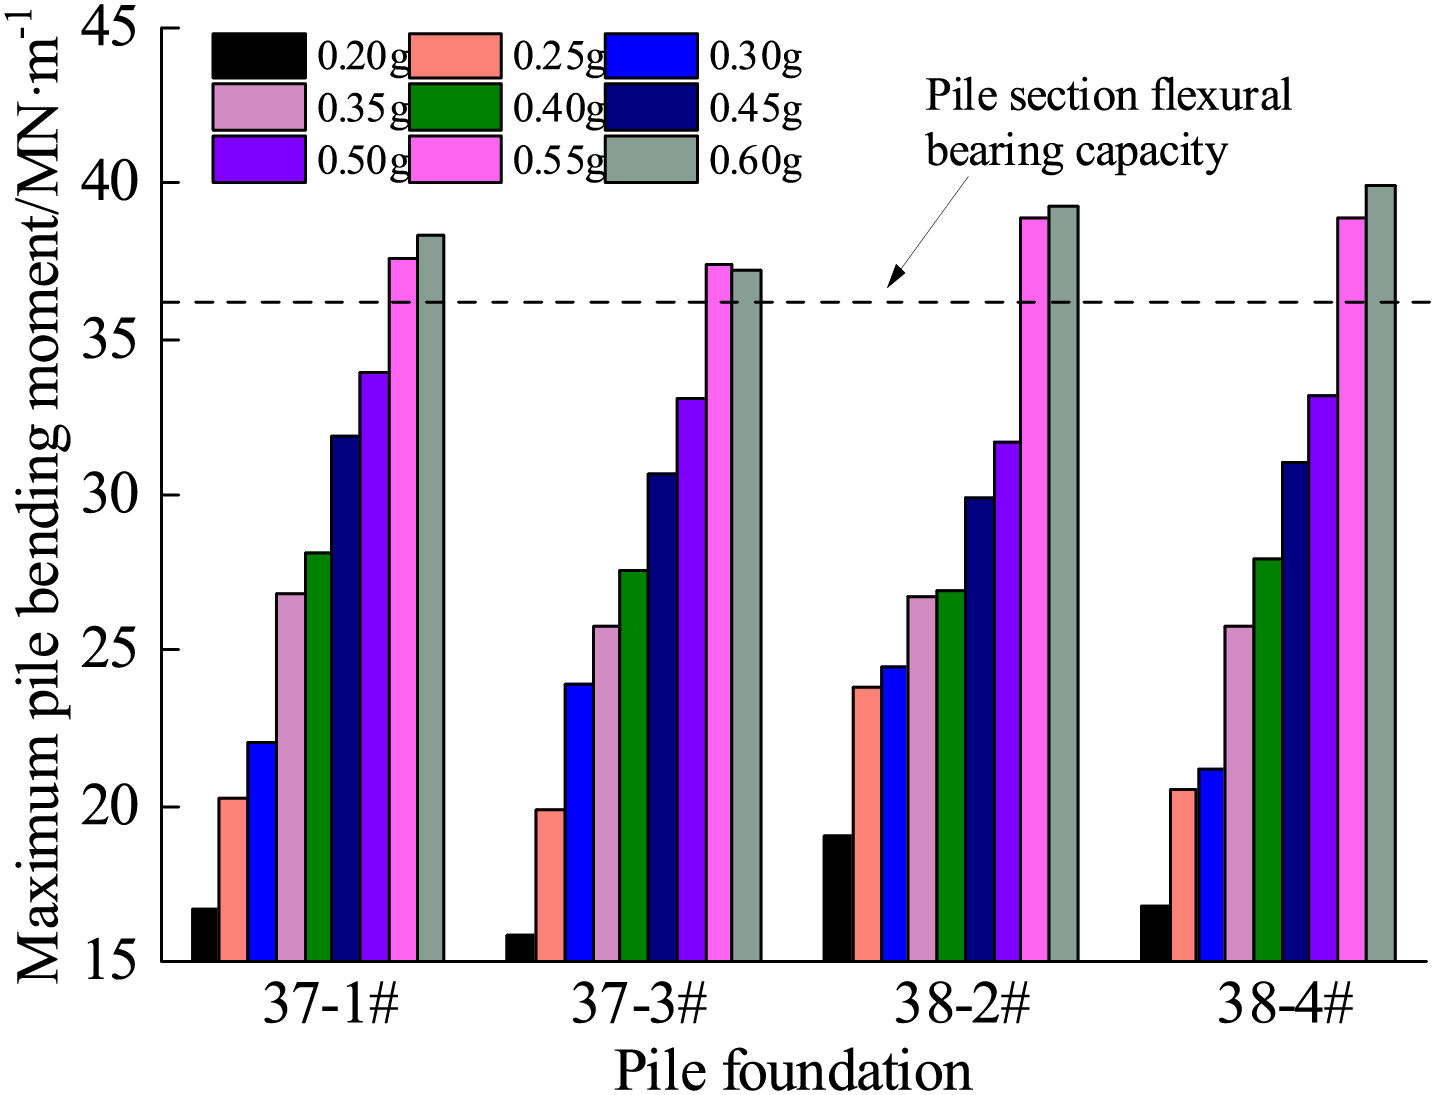
Figure 12: Maximum value of pile bending moment
The pile shear response at different seismic intensities is shown in Fig. 13. Fig. 13 shows that the pile section shear force increases as the input seismic intensity increases, with the maximum pile shear force appearing at the rock-soil interface. This is due to the significant difference in the degree of pile embedment by the rock and overburden layers and the large shear forces generated at the rock face under seismic action. In addition, a large shear force is generated at the top of the pile. This is due to the sudden change in stiffness at the pile-bearing joint. The inertia of the structure above the pile top under horizontal seismic loads weakens the shear capacity of this area. Therefore, the seismic design of the pile foundation should fully take into account the pile shear capacity at the pile top and the boundary between soft and hard rock.
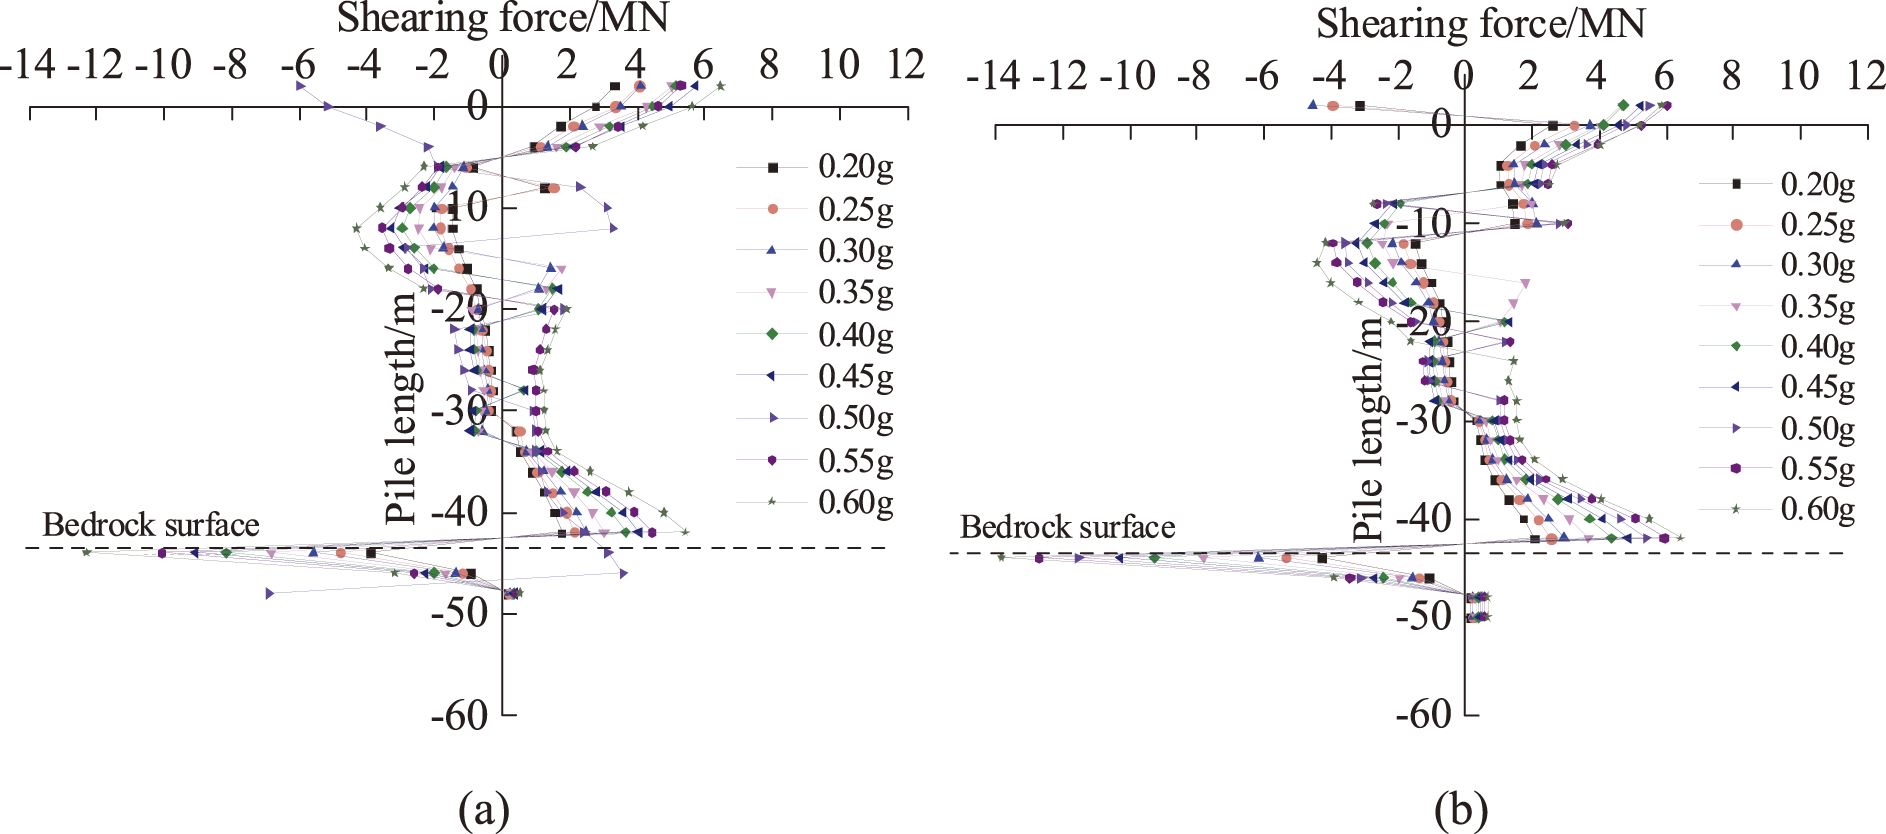
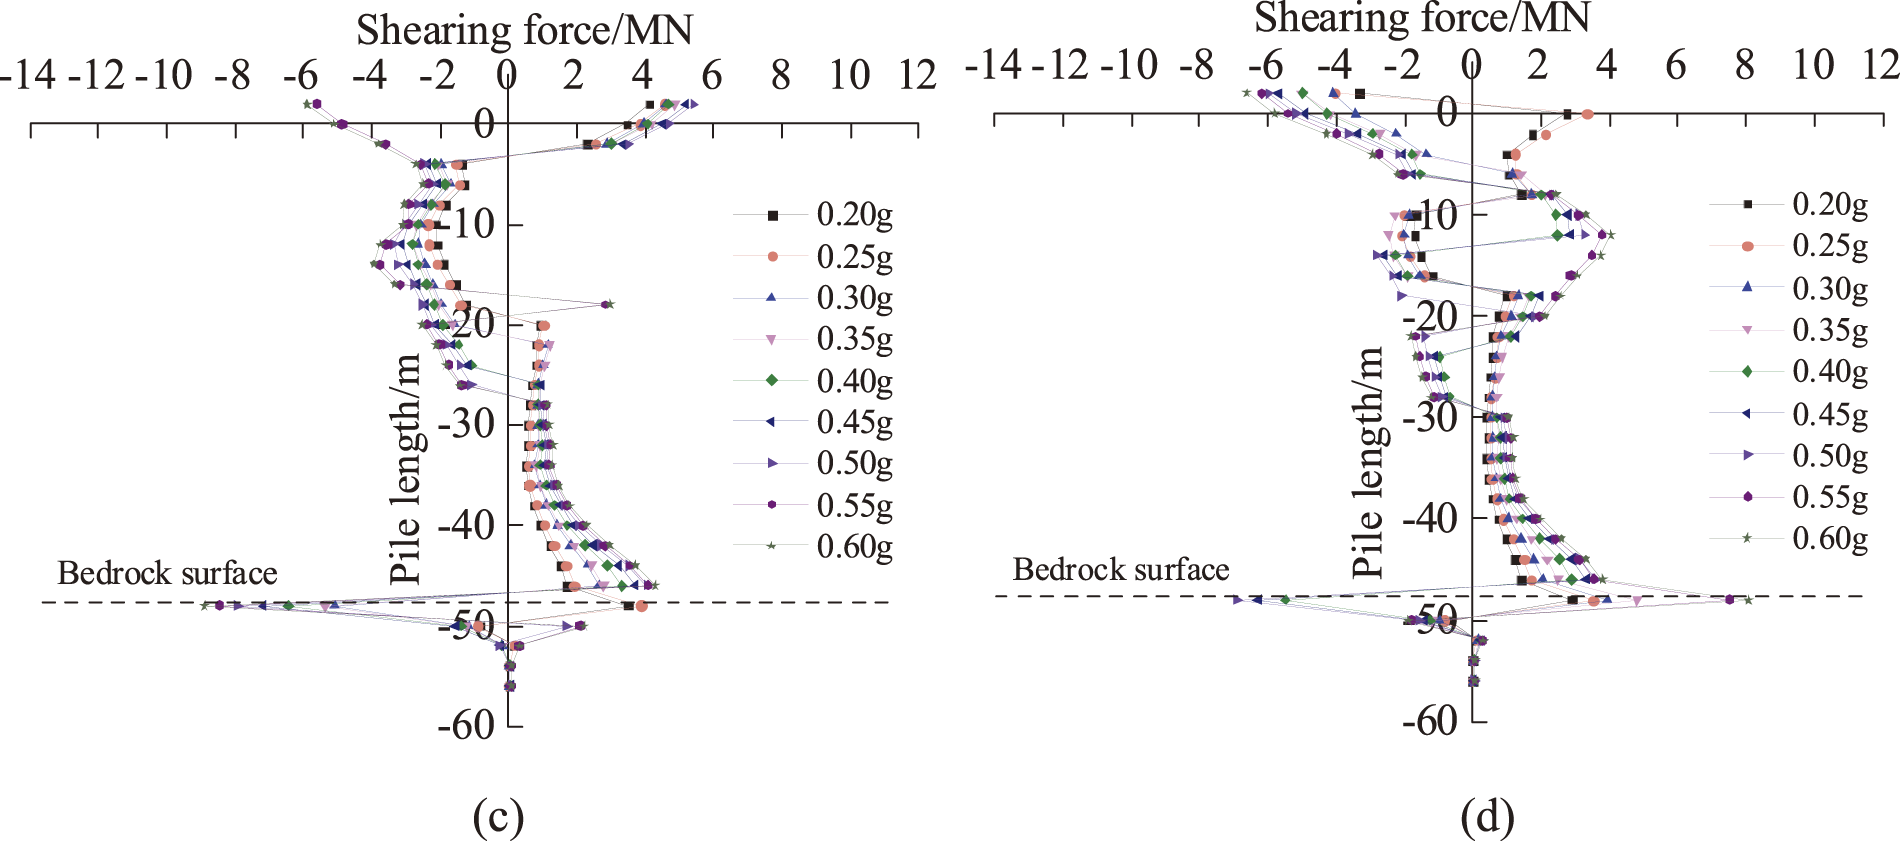
Figure 13: Shear response of pile body under different seismic intensities: (a) 37-1# (Lower plate), (b) 37-3# (Lower plate), (c) 38-2# (Upper plate), (d) 38-4# (Upper plate)
Fig. 14 shows that the maximum pile shear of 37-1#, 37-3#, 38-2#, and 38-4# piles are different under the same intensity of the seismic wave. When the peak input acceleration is 0.20–0.60 g, respectively, the difference between the peak pile body shear force of the upper and lower plate pile foundation is in the range of 0.2–5.7 MN, which is due to the difference in the soil and embedded rock depth around the pile of the upper and lower plate of the fault.
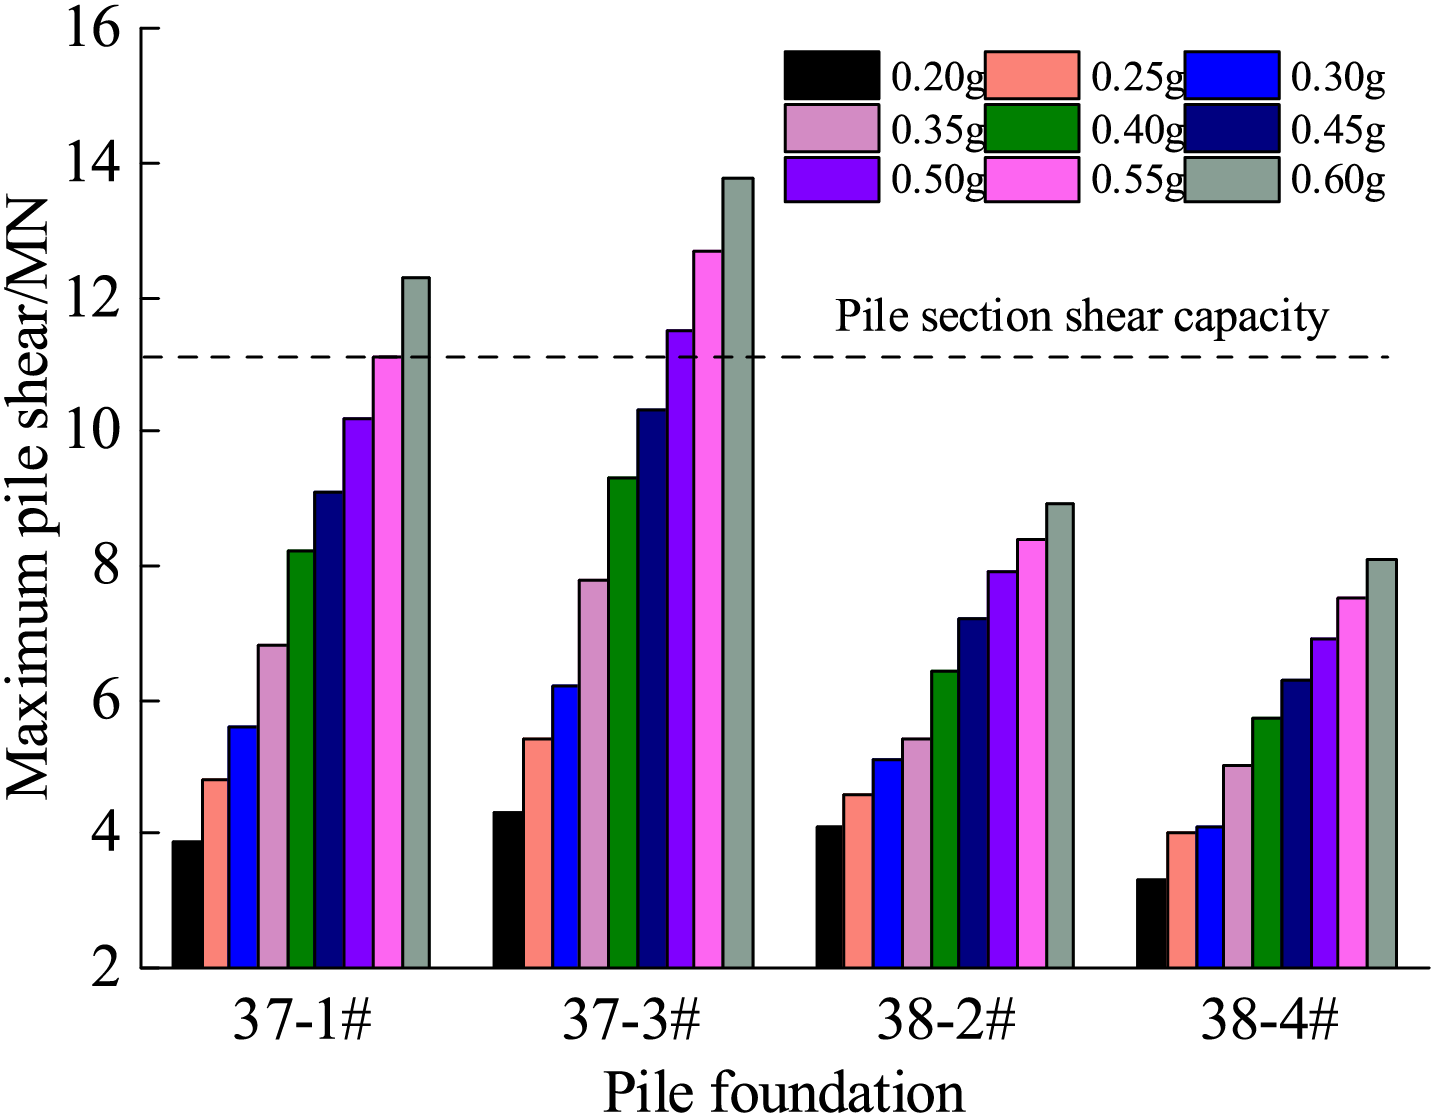
Figure 14: Maximum value of pile shear
When the seismic wave intensity is 0.35 g, the maximum shear force of piles 37# and 38# is 7.8 MN and 5.4 MN, respectively, which is smaller than the design value of the shear bearing capacity of the pile section of the Haiwen Bridge pile foundation of 11.3 MN. It can be seen that its shear-bearing capacity meets the requirements of seismic intensity VIII. Under the effect of different seismic wave intensities, the peak pile shear force of the 37# pile foundation is generally more significant than that of 38# pile foundation. When the seismic wave intensity is greater than or equal to 0.5 g, the peak shear force of the 37# pile foundation is greater than its shear capacity. However, the peak shear force of the 38# pile foundation under different intensity seismic waves is within the shear-bearing capacity. Therefore, attention should be paid to the design of the shear-bearing capacity of the 37# pile foundation.
Dynamic p-y curves are widely used in the analysis of pile-soil interaction problems under dynamic loading. Under dynamic loading, y in the dynamic p-y curve refers to the relative pile-soil displacement, i.e., the displacement of the pile minus the displacement of the soil. The relationship between soil resistance on the pile side, pile displacement, and pile bending moment can be expressed by the following equation:
where M(z) is the bending moment of the pile; yp is the lateral displacement of the pile; p(z) is the soil resistance on the pile side; z is the vertical depth of a point on the pile; EI is the bending stiffness of the pile cross-section; E is the modulus of elasticity; and I is the cross-section penetration moment.
4.6.1 Soil Resistance on the Pile Side p
The pile lateral soil resistance is determined by double differentiation based on the pile dynamic bending moment data, but there is a potential numerical error in the double differentiation process, therefore, so in this study, the pile lateral soil resistance p(z) distributed along the pile body is solved by the weighted residual method [35]. The calculations are performed by using the points where the pile body strains are measured as separation points, assuming that f(z) is a function of the absolute value of the bending moment along the pile body and g(z) is a function of the shear force along the body of the pile. Thus,
where
where n is the total number of measurement points; i is the measurement point number
Thus, f(z) and g(z) can be expressed as
where fi is the bending moment at measurement point i; gi is the shear force at measurement point i.
For different measurement points, the following equation can be obtained using Eq. (19) for the 0th measurement point:
The ith measurement point:
nth measurement point:
Joint Eqs. (25)–(27), solve this system of equations to obtain the shear segmentation function at each measurement point, and by the weighted residual method, the resistance function p(z) is obtained. Then, by interpolation, the soil resistance p(z) at any depth of the pile body can be obtained.
4.6.2 Relative Pile Displacement y
Integration of the absolute value distribution function of the bending moment M(z) gives the pile displacement Eq. (18) and requires two boundary conditions to determine. Since the pile foundation is fixed, the boundary conditions for the corner and the displacement at the pile end are assumed to be zero, and the pile displacement yp is calculated. From Fig. 3, the acceleration time-history response of the soil layer at different depths can be obtained, and the displacement response of the soil body at different depths is obtained by numerical integration. The relative pile-soil displacement is obtained by the difference between the pile displacement and the soil displacement.
4.6.3 Dynamic p-y Curves Analysis
Corresponding to the seismic loads of 0.20–0.60 g, the p-y curves at the location of the maximum bending moments of the four pile foundations are shown in Fig. 15. The figure shows that the changes rules of the p-y curves of the pile foundations of the upper and lower plates are similar, and the soil resistance on the pile side increases with the increase of the relative displacement of the pile and soil. The soil resistance on the pile side of the lower plate at the same depth is greater than that of the upper plate, and the maximum soil resistance of the lower plate is about 16.8% greater than that of the upper plate. It is because the lower plate belongs to the stabilization plate, and when the horizontal distance between the fault and the pile foundation is certain, the effective range of rock and soil bodies that can bear the load around the pile in the lower plate is larger than that in the upper plate, and the range of stress diffusion is larger, which can provide a stronger constraint. The soil resistance on the pile side of pile 37-1# in the lower plate of the fault is greater than that of pile 37-3#, and the soil resistance on the pile side of pile 38-4# in the upper plate is greater than that of pile 38-2#. It shows that for the pile foundation on the same side of the fault, the larger the distance from the fault, the smaller the rock and soil body on the pile side is affected by the fault, the larger the soil resistance on the pile side is, and the horizontal bearing characteristics of the pile foundation have obvious ‘upper plate effect’.
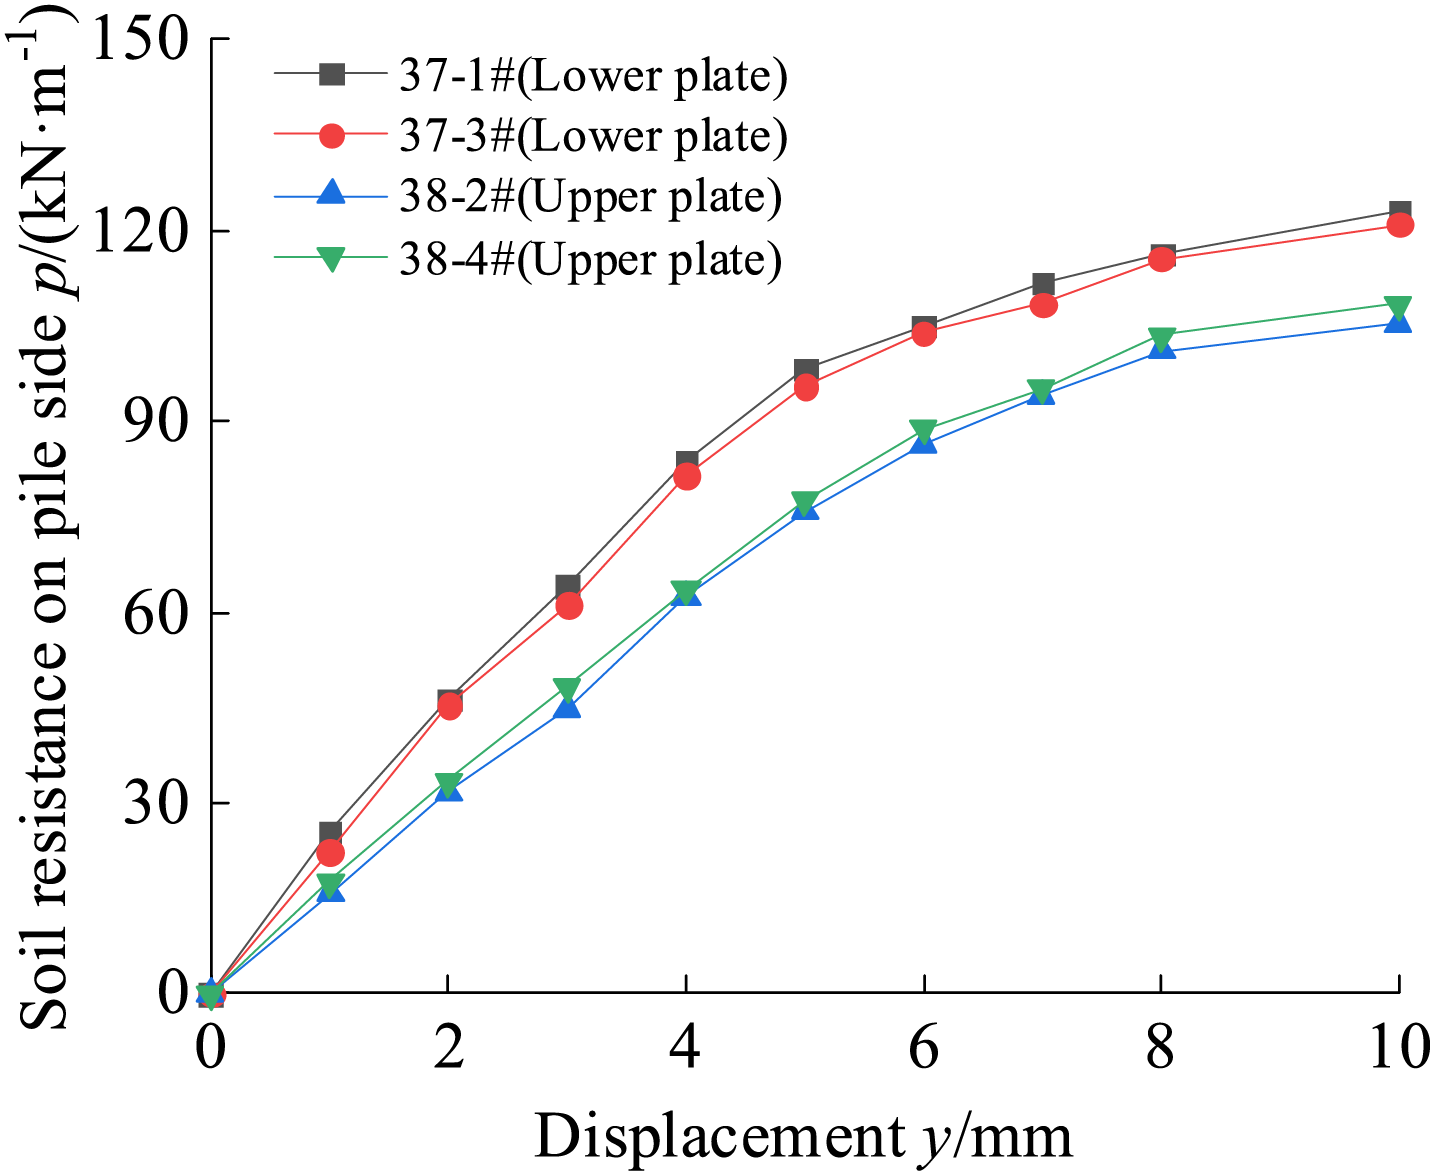
Figure 15: Pile foundation p-y curves on the upper and lower plates
5 Effect of Pile-Fault Distance on Pile Foundation’s Mechanical Properties
5.1 Change in Peak Relative Pile Displacement
Since the 38-2# pile foundation is located in the upper plate of the fault, the seismic effect on it is significantly more significant than that on the lower plate. Therefore, 38-2# is taken as an example to analyse the response of the relative displacement, bending moment and shear force of the pile with the change of the distance between the fault and the pile foundation under the 5010 waves at 0.35 g, as shown in Figs. 16–18, respectively. The distances between the piles and the fault are 4, 8, 12, 16, 20, 25 m (actual project), 28, and 32 m, respectively. Relative pile displacements, bending moments, and shear forces are taken as absolute values.
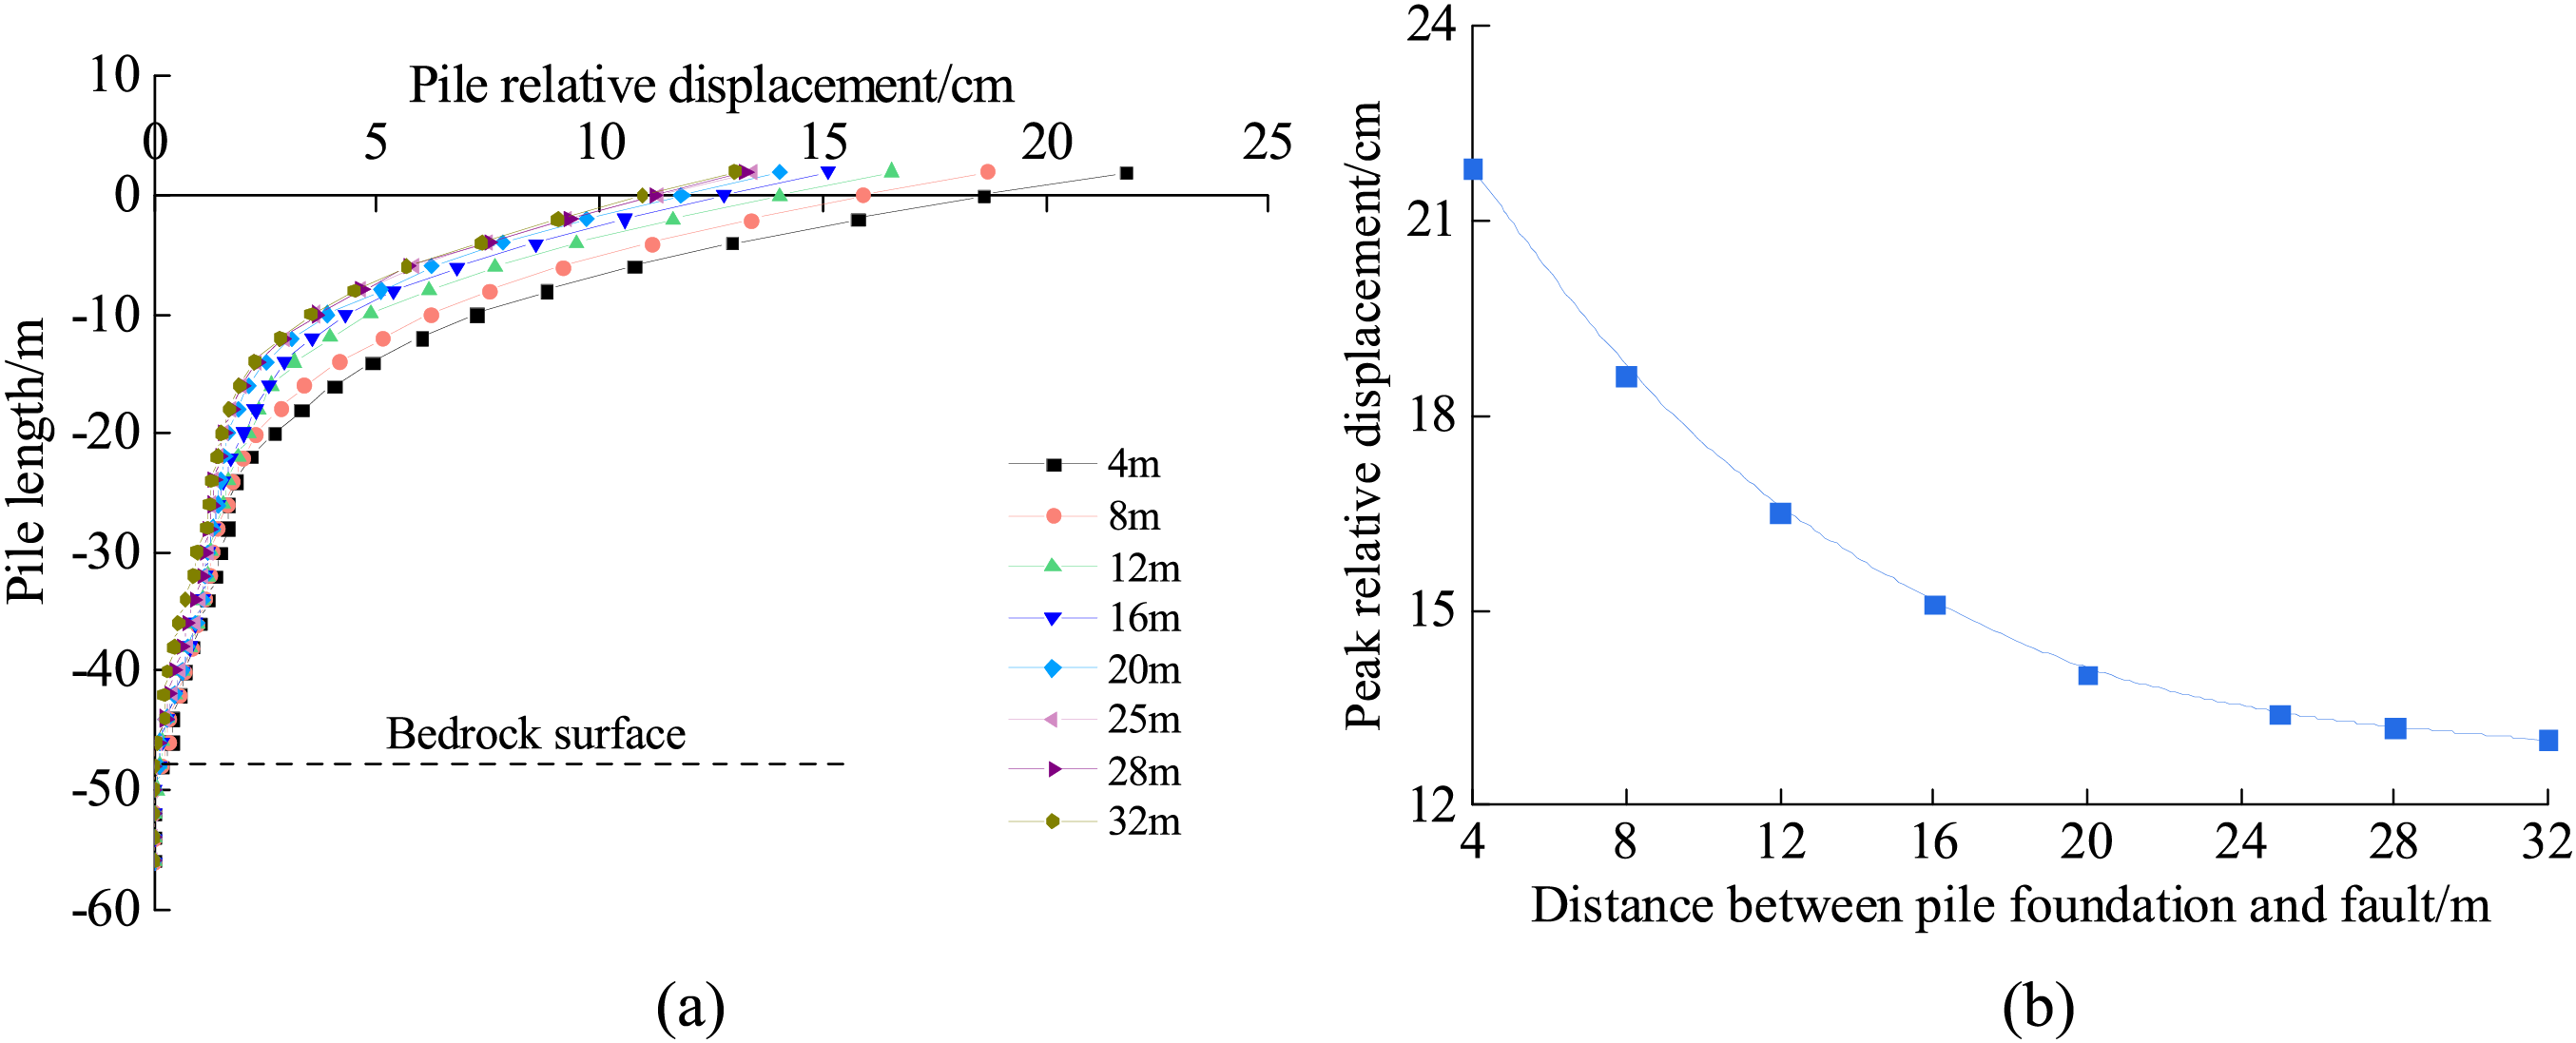
Figure 16: Variation of peak relative displacement of pile foundation: (a) Change in relative pile displacement, (b) Change rules of pile tops’ horizontal relative displacement with the distance of faults
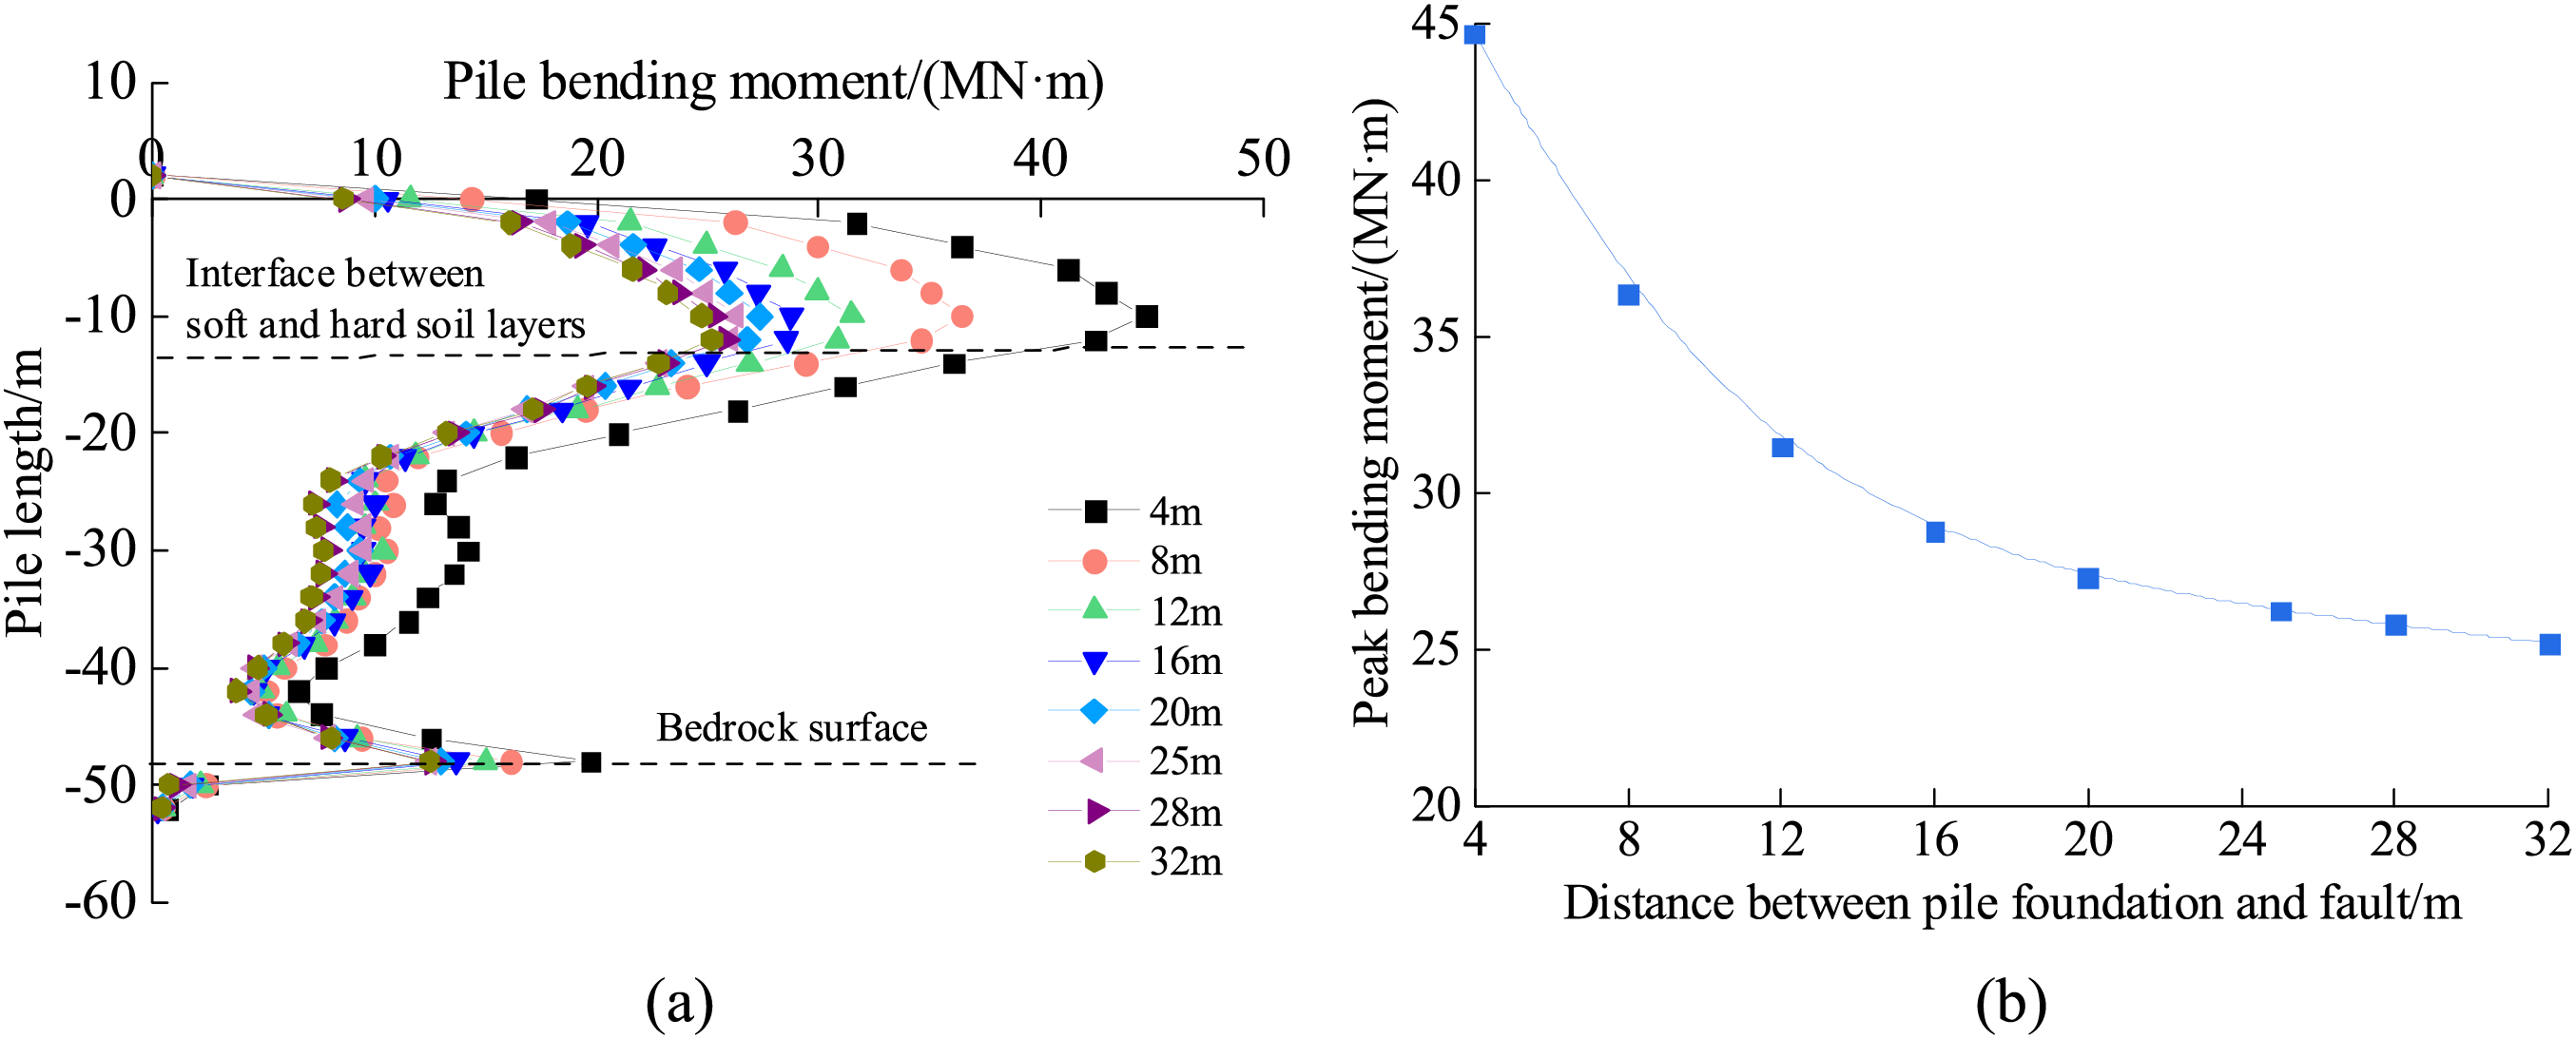
Figure 17: Variation of peak pile bending moment: (a) Change in pile bending moment, (b) Change rules of peak pile bending moment with fault distance
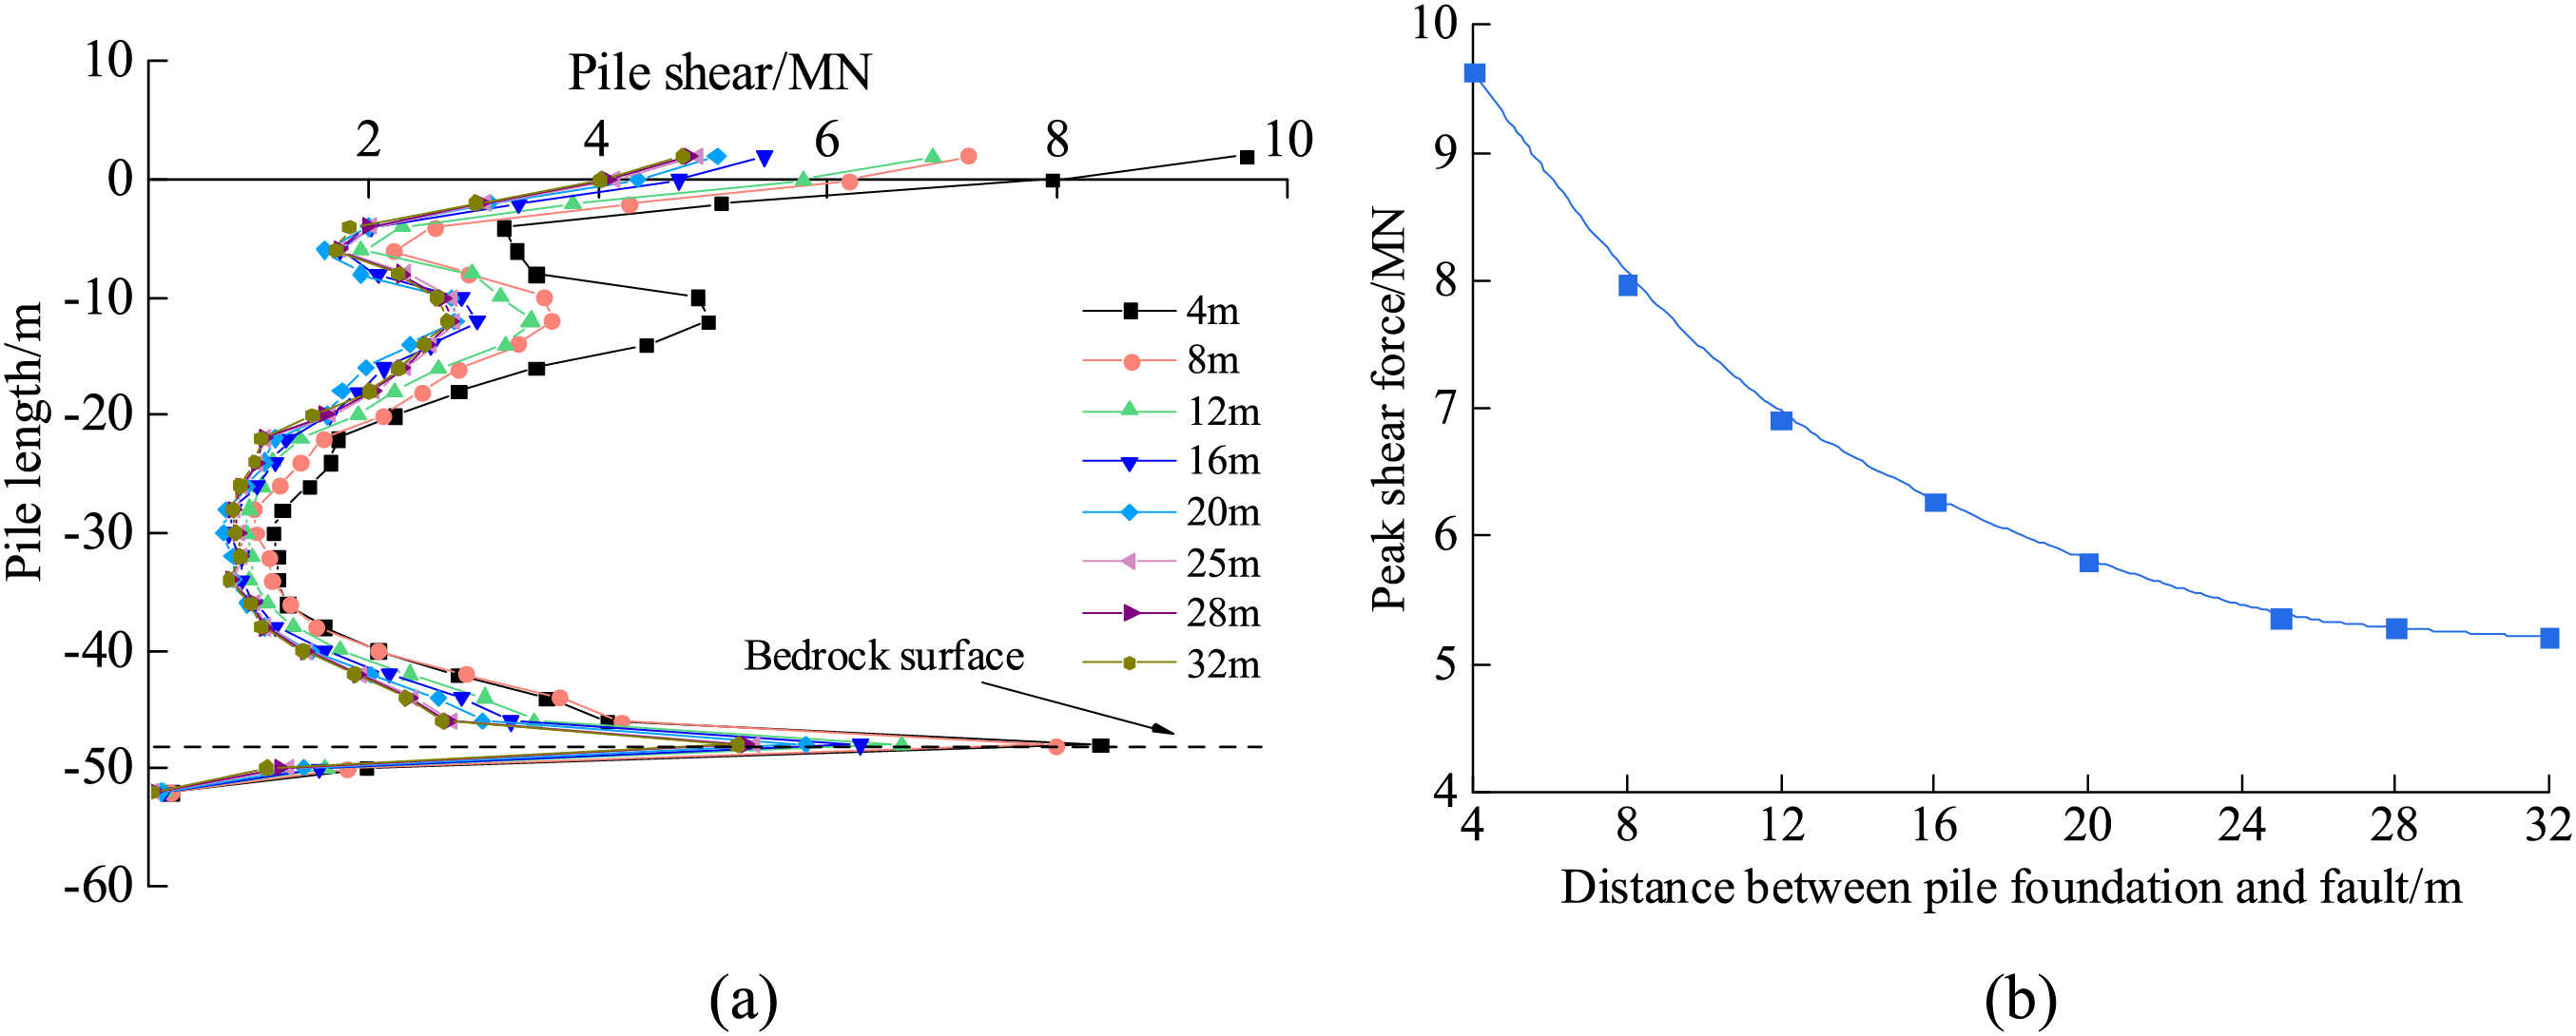
Figure 18: Variation of peak pile shear: (a) Changes in pile shear, (b) Change rules of peak pile shear with fault distance
Fig. 16 shows that the relative displacement of the 38-2# pile foundation increases gradually from bottom to top. The relative displacement of the pile is maximum in the upper weak cover layer, while it is almost zero in the embedded rock layer. As the distance between the pile foundation and the fault increases, the maximum relative displacement at the top of the pile decreases in an inverse proportional curve shape, and the reduction decreases gradually. When the distance between the pile foundation and the fault is greater than 20 m, the maximum relative displacement at the top of the pile gradually stabilises.
5.2 Change in Peak Pile Bending Moment
Fig. 17 shows that the maximum bending moment for the 38-2# pile foundation appears at the silty clay-sand and gravel layer interface, and the second peak bending moment appears at the pebbly soil-granite interface. As the distance between the pile foundation and the fault gradually increases, the maximum pile bending moment gradually decreases, and the reduction decreases gradually. When the distance between the pile foundation and the fault is greater than 20 m, the maximum pile bending moment gradually tends to stabilise.
5.3 Change in Peak Pile Shear Force
Fig. 18 shows that the shear force of the 38-2# pile foundation is relatively large at the top of the pile and at the junction of the bedrock and overburden layers, with the maximum appearing at the bedrock face. As the distance between the pile foundation and the fault increases, the maximum pile shear force decreases as an inverse proportional curve, and the reduction gradually decreases. When the distance between the pile foundation and the fault is greater than 20 m, the peak pile shear force gradually tends to stabilise.
In summary, as the distance between the pile foundation and the fault increases, the peak relative displacement at the pile top, the peak pile bending moment, and the peak shear force decrease in the form of inversely proportional curves. When the distance between the pile foundation and the fault is more than 20 m (ten times the pile diameter), the relative displacement at the pile top, the pile bending moment, and the shear force tend to be stable. Compared to the ‘areas where active fault traces exist, an avoidance distance of 50 ft (approximately 16 m) may be specified’, as stated in the Seismic Design Rules for Highway Bridges, which is safer [36]. The distance between the pile foundations of Haven Bridge and the fault is 25 m. The effect of the fault on the mechanical deformation characteristics of the pile foundations is small.
6 Sensitivity Analysis of Dynamic Response Parameters of Pile Foundation
To study the sensitivity of the dynamic response of the pile foundation on both sides of the fault to the seismic intensity and the distance between the pile foundation and the fault, a multi-factor effect system model is established as shown in Eq. (28), and the sensitivity function Si(xi) of the parameter xi is defined by the ratio of the system characteristic P to the relative error of the parameter xi as shown in Eq. (29). The maximum bending moment Mu of the pile foundation is taken as the system characteristic P, with the seismic load (q = 0.35 g) and the distance between the pile foundation and fault (l = 25 m) as the base parameters. The effect of the parameters analysed in the study on the system characteristic P is investigated, with the other parameters taking the baseline values.
Functional models between the maximum bending moment Mu and the parameters q and l are fitted by the characteristic curve of the system in Figs. 11 and 17b, respectively, as shown in Table 3. The sensitivity function of each parameter is obtained according to Eq. (29), and the baseline parameters are inserted into the Sensitivity function to obtain the baseline sensitivity factors, as shown in Table 4. The sensitivity function curves for seismic load and the distance between pile foundation and the fault are shown in Fig. 19.
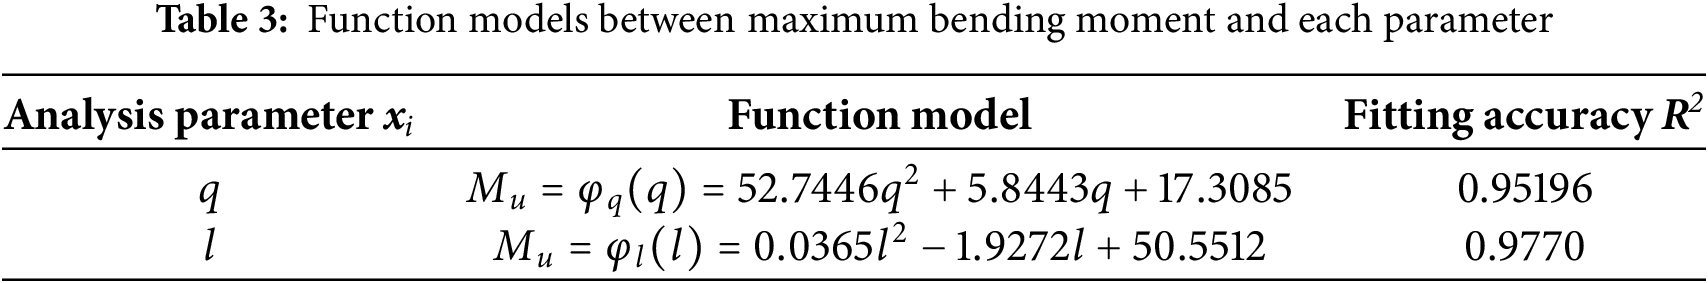
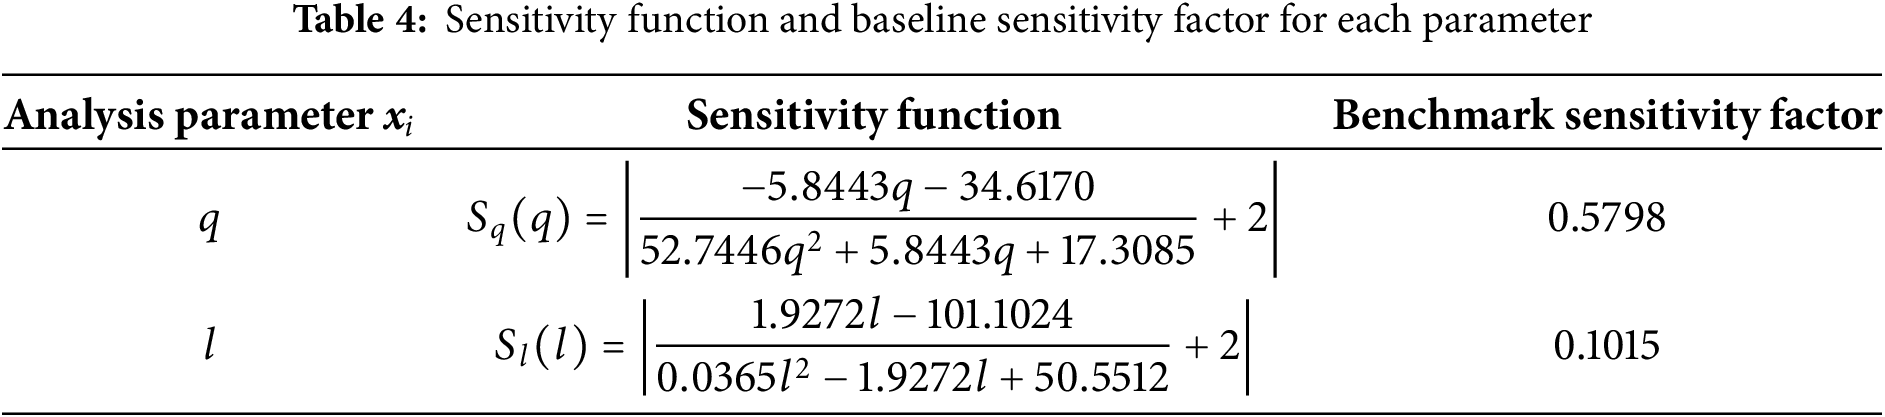
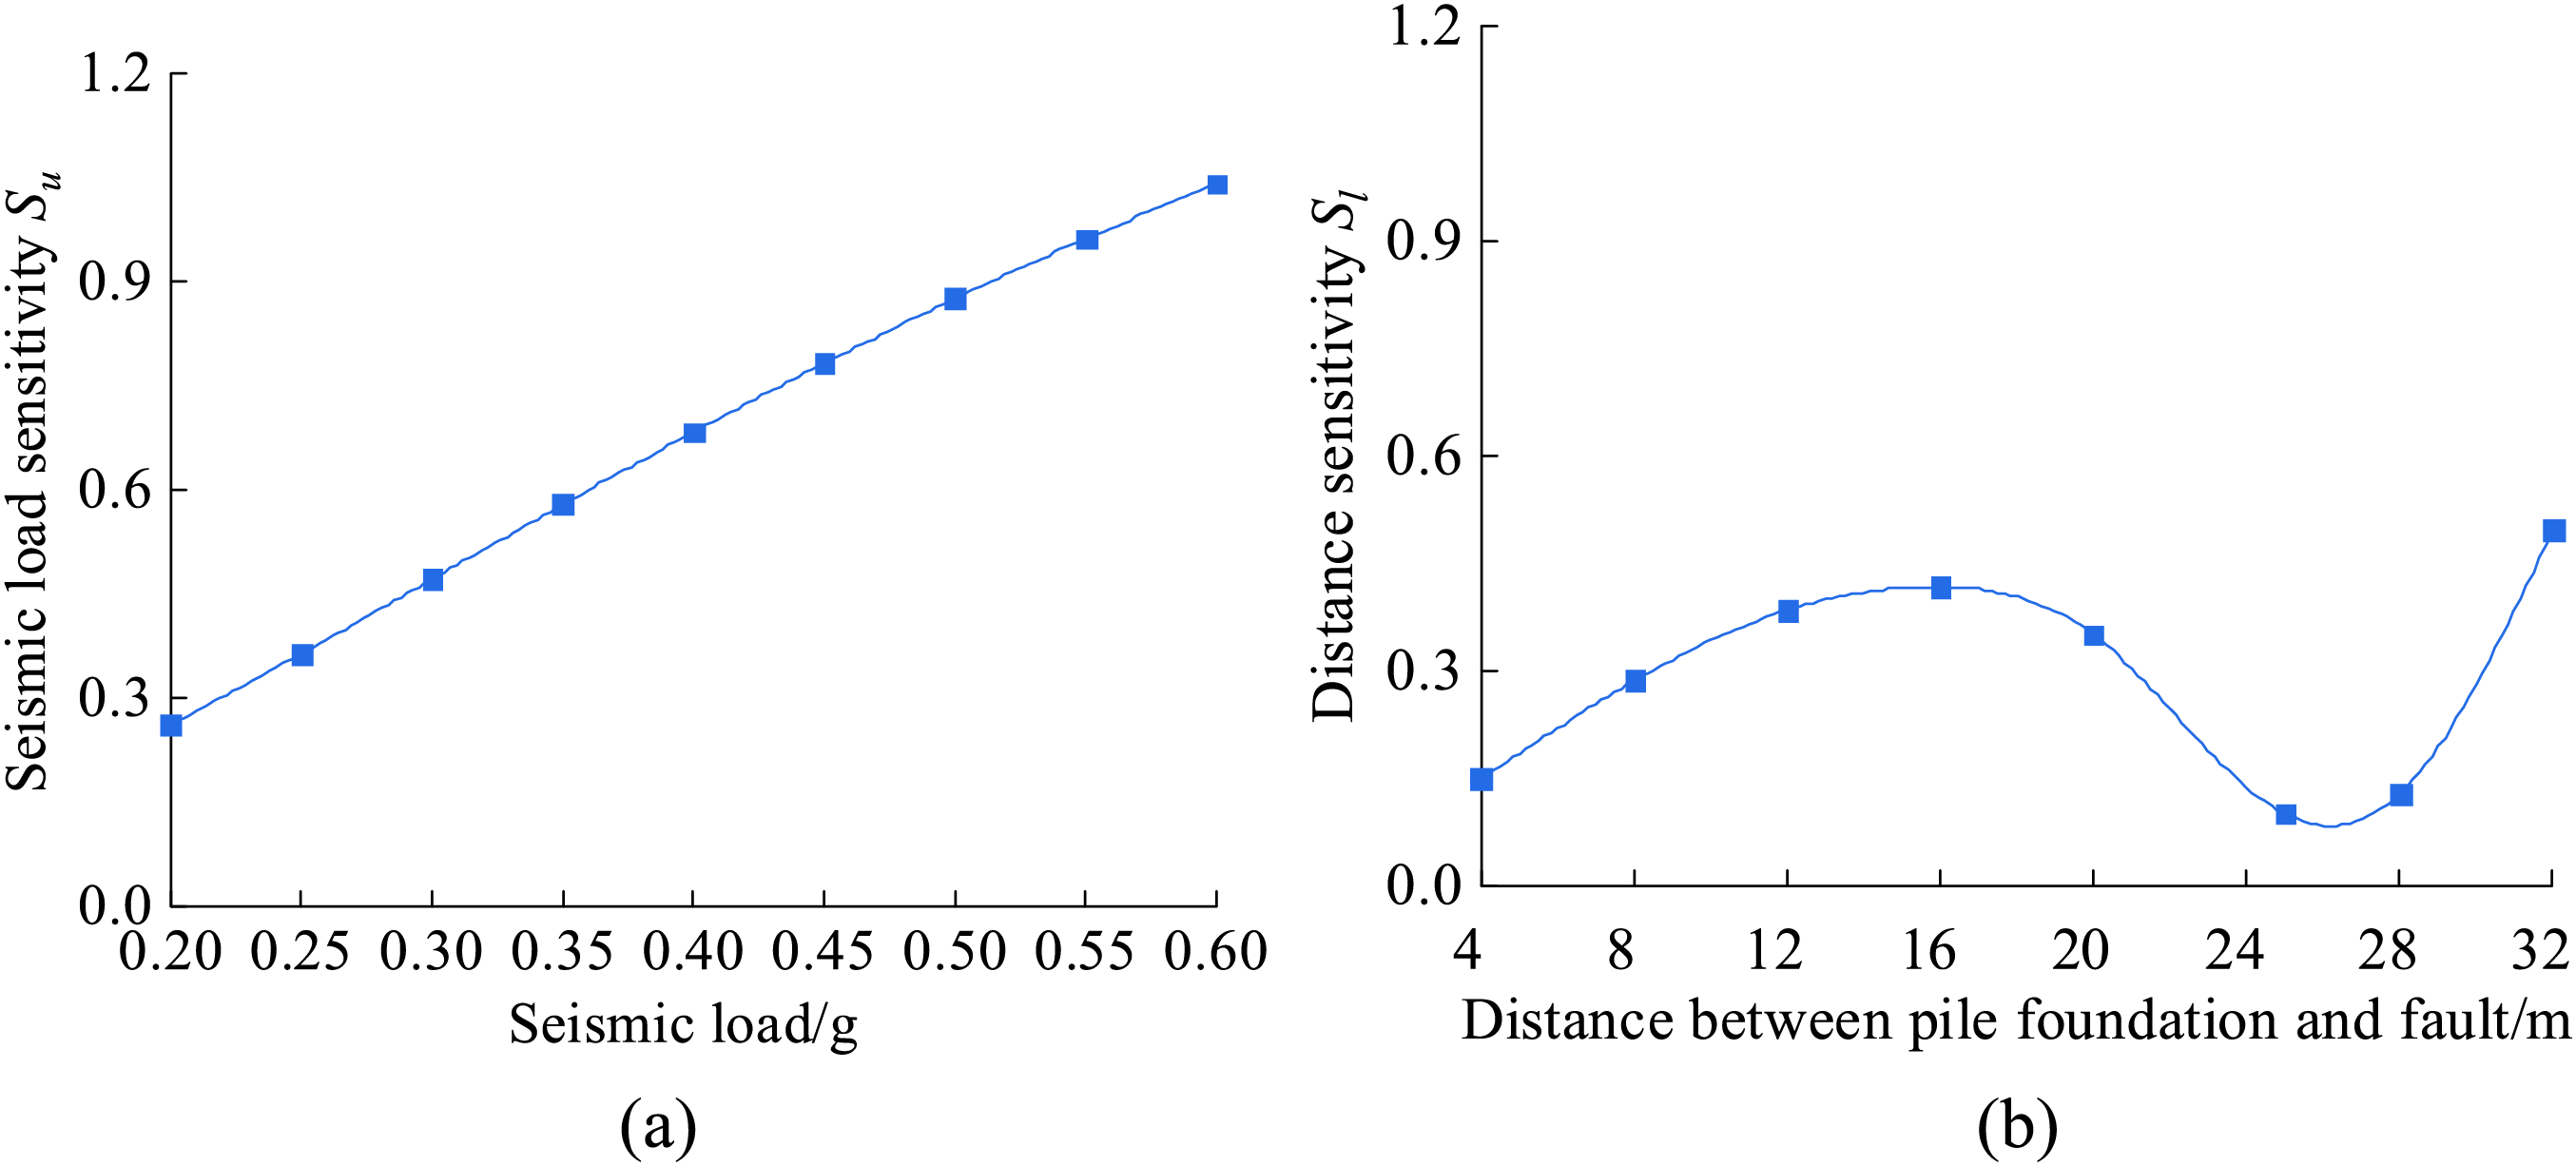
Figure 19: Sensitivity function curve: (a) Seismic load; (b) Distance between pile foundation and fault
Fig. 19 shows that Sq increases linearly with increasing seismic intensity. It shows that the maximum value of the pile bending moment is positively correlated with the seismic intensity, with a baseline sensitivity factor of 0.5798. As the distance between the pile foundation and the fault increases, Sl increases, then decreases, then increases again. Distances of 16 and 25 m are the sensitivity inflection points. It shows that the positive correlation between the maximum value of pile bending moment and distance is weakened after the distance is greater than 16 m. After the distance is greater than 25 m, the positive correlation between the maximum value of pile bending moment and distance is gradually strengthened, and its baseline sensitivity coefficient is 0.1015. Therefore, the sensitivity of the maximum value of the bending moment of the pile foundations on both sides of the fault to the effects of the seismic intensity and the distance between the pile foundations and the fault is: distance l > seismic intensity q.
7 Conclusions and Recommendations
In this paper, a numerical model is established based on the actual project of Haiwen Bridge to study the dynamic response law of pile foundation of bridge across active fault under the action of earthquake, give the safe avoidance distance of pile foundation of bridge near the fault, and analyse the sensitivity degree of the dynamic response of pile foundation to each factor. The following conclusions are obtained:
1. The bedrock affects the peak pile acceleration to a lesser extent. However, the overburden layer amplifies the pile acceleration, and the magnitude of the effect gradually decreases with increasing seismic wave intensity. When the seismic wave intensity is greater than 0.4 g, the pile top acceleration amplification coefficient of the pile foundation in the upper plate is significantly greater than that in the lower plate.
2. The horizontal relative displacement of the pile is almost zero in the embedded rock layer and gradually increases from bottom to top in the overburden layer. The pile foundation has the mechanical properties of an elastic long pile. The horizontal relative displacement of the pile tops of the pile foundations in the upper plate is more significant than that in the lower plate, and the ‘upper plate effect’ of the fault is significant.
3. Under seismic action, the pile foundation generates a large bending moment at the interface between the upper soil layer and the rock face and a large shear force at the top of the pile and the rock face. The seismic resistance of pile foundations should take into account the design of the bending capacity at the location of the change in elasticity modulus of the foundation soil layer and the design of the shear-bearing capacity at the location of sudden changes in stiffness of the structure. The maximum bending moment and shear force of the pile foundation in the upper plate are greater than those in the lower. Therefore, the difference in the effect of the upper and lower plates of the fault on the bending and shear capacity of the pile foundation should also be considered.
4. As the distance between the pile foundation and the fault increases, the peak relative displacement of the pile top, the peak bending moment, and the peak shear force of the pile foundation decrease as inversely proportional curves and gradually tend to stabilise. The dynamic response characteristics of the pile foundation within ten times the pile diameter from the fault are more significantly affected by the fault. Bridge pile foundations should be constructed outside the safe avoidance distance from the fault.
5. Analysis of the dynamic p-y curves shows that the soil resistance on the pile side of the lower plate at the same depth is greater than that of the upper plate. Sensitivity of the dynamic response of pile foundations on either side of the fault to the effects of seismic intensity and distance between the pile foundation and the fault: distance l > seismic intensity q.
At the same time, this paper has some limitations, only studied the dynamic response of pile foundation across the fault under the action of 5010 seismic wave, and should continue to research the effect of other types of seismic waves on the dynamic response of pile foundation.
Acknowledgement: None.
Funding Statement: The research reported in this manuscript is funded by National Natural Science Foundation of China Projects (51708040); Hainan Provincial Transportation Science and Technology Project (HNZXY2015-045R); Chang’an University Central University Basic Research Business Fund Special Funds (No. 300102218115).
Author Contributions: The authors confirm contribution to the paper as follows: Conceptualization, Zhongju Feng; methodology, Yujie Li; validation, Fuchun Wang; data curation, Jiang Guan and Xiaoqian Ma. All authors reviewed the results and approved the final version of the manuscript.
Availability of Data and Materials: All data generated or analyzed during this study are included in this published article.
Ethics Approval: Not applicable.
Conflicts of Interest: The authors declare no conflicts of interest to report regarding the present study.
References
1. Cubrinovski M, Haskell J, Winkley A, Robinson K, Wotherspoon L. Performance of bridges in liquefied deposits during the 2010–2011 Christchurch, New Zealand. Earthquakes J Perform Constr Facil. 2014;28(1):24–39. doi:10.1061/(ASCE)CF.1943-5509.0000402. [Google Scholar] [CrossRef]
2. Kong DS, Deng MX, Li YZ. Numerical simulation of seismic soil-pile interaction in liquefying ground. IEEE Access. 2020;8:195–204. doi:10.1109/ACCESS.2019.2925664. [Google Scholar] [CrossRef]
3. Guan ZG, Li JZ. Advances in earthquake resisting systems for long-span bridges. SCIENTIA SINICA Technologica. 2021;51(5):493–504. doi:10.1360/SST-2020-0105. [Google Scholar] [CrossRef]
4. Namdar A. Nonlinear lateral displacement of the single pile—a seismic analytical investigation. Eng Fail Anal. 2021;127(53):105509. doi:10.1016/j.engfailanal.2021.105509. [Google Scholar] [CrossRef]
5. Hussien MN, Karray M, Tobita T, Iai S. Kinematic and inertial forces in pile foundations under seismic loading. Adv Civil Eng. 2015;2015(69):166–81. doi:10.1016/j.compgeo.2015.05.011. [Google Scholar] [CrossRef]
6. Li CH, Lin ML, Huang WC. Interaction between pile groups and thrust faults in a physical sandbox and numerical analysis. Eng Geol. 2019;252(10):65–77. doi:10.1016/j.enggeo.2019.02.023. [Google Scholar] [CrossRef]
7. Heidari S, Gerami M. The effect of skewness on rotational response of the curved bridge deck under near-fault motions. KSCE J Civil Eng. 2019;23(11):4836–45. doi:10.1007/s12205-019-0427-1. [Google Scholar] [CrossRef]
8. Alizadeh M, Khodaparast M, Rajabi AM. Simulation of the interaction of micropiles and a fault rupture. KSCE J Civil Eng. 2021;25(12):4620–30. doi:10.1007/s12205-021-0068-z. [Google Scholar] [CrossRef]
9. Shrestha B. Seismic response of long span cable-stayed bridge to near-fault vertical ground motions. KSCE J Civil Eng. 2015;19(1):180–7. doi:10.1007/s12205-014-0214-y. [Google Scholar] [CrossRef]
10. Su P, Zhu XY, Xue B, Chen YJ, Zhang B. Experimental investigation of a curved bridge under hanging-wall and footwall ground motions. KSCE J Civil Eng. 2022;26(2):741–52. doi:10.1007/s12205-021-1947-z. [Google Scholar] [CrossRef]
11. Yang S, Mavroeidis GP, Tsopelas P. Seismic response study of ordinary and isolated bridges crossing strike-slip fault rupture zones. Earthquake Eng Struct. 2021;50(11):2841–62. doi:10.1002/eqe.3475. [Google Scholar] [CrossRef]
12. Shirgir V, Ghanbari A, Massumi A. Analytical model for time history analysis of single pier bridges considering soil-pile structure interaction effects. Appl Math Model. 2021;93(750):257–75. doi:10.1016/j.apm.2020.12.011. [Google Scholar] [CrossRef]
13. Dai WT, Rojas F, Shi C, Tan Y. Effect of soil structure interaction on the dynamic responses of base isolated bridges and comparison to experimental results. Soil Dyn Earthq Eng. 2018;114(12):242–52. doi:10.1016/j.soildyn.2018.07.024. [Google Scholar] [CrossRef]
14. Dong YX, Feng ZJ, He JB, Chen HY, Jiang G, Yin HH. Seismic response of a bridge pile foundation during a shaking table test. Shock Vib. 2019;2019(1):9726013. doi:10.1155/2019/9726013. [Google Scholar] [CrossRef]
15. Feng ZJ, Wang XQ, Li XX, Hu MH, Yuan FB, Yin HH, et al. Effect of sand liquefaction on mechanical properties of pile foundation under strong earthquake. J Transp Eng. 2019;19(1):71–84. doi:10.19818/j.cnki.1671-1637.2019.01.008. [Google Scholar] [CrossRef]
16. Feng ZJ, Zhang C, He JB, Liu C, Dong YX, Yuan FB. Shaking table test of liquefaction resistance of group piles under strong earthquake. Transport Eng J. 2021;21(4):72–83. doi:10.19818/j.cnki.1671-1637.2021.04.004. [Google Scholar] [CrossRef]
17. Jiang LZ, Kang X, Chen LK. Mega-earthquake response of benchmark high-speed rail bridge piers based on shaking table tests. Eng Fail Anal. 2022;140(6):106608. doi:10.1016/j.engfailanal.2022.106608. [Google Scholar] [CrossRef]
18. Fiorentino G, Cengiz C, De Luca F, Mylonakis G, Karamitros D, Dietz M, et al. Integral abutment bridges: investigation of seismic soil-structure interaction effects by shaking table testing. Earthq Eng Struct Dynam. 2021;50(6):1517–38. doi:10.1002/eqe.3409. [Google Scholar] [CrossRef]
19. Xu CS, Dou PF, Du XL, El Naggar MH, Miyajima M, Chen S. Seismic performance of pile group-structure system in liquefiable and non-liquefiable soil from large-scale shake table tests. Soil Dyn Earthq Eng. 2020;138(9–12):106299. doi:10.1016/j.soildyn.2020.106299. [Google Scholar] [CrossRef]
20. Xie WL, Sun M. Assessment and mitigation on near-fault earthquake wave effects on seismic responses and pile-soil interactions of soil-pile-bridge model. Soil Dyn Earthq Eng. 2021;143(4):106596. doi:10.1016/j.soildyn.2021.106596. [Google Scholar] [CrossRef]
21. Yang JP, Li PZ, Lu Z. Large-scale shaking table test on pile-soil-structure interaction on soft soils. Struct Des Tall Special Build. 2019;28(18):e1679. doi:10.1002/tal.1679. [Google Scholar] [CrossRef]
22. Li PZ, Liu ST, Lu Z, Yang JP. Numerical analysis of a shaking table test on dynamic structure-soil-structure interaction under earthquake excitations. Struct Des Tall Special Build. 2017;26(15):e1382. doi:10.1002/tal.1382. [Google Scholar] [CrossRef]
23. Simos N, Manos GC, Kozikopoulos E. Near- and far-field earthquake damage study of the Konitsa Stone Arch Bridge. Eng Struct. 2019;177(3):256–67. doi:10.1016/j.engstruct.2018.09.072. [Google Scholar] [CrossRef]
24. Zheng SX, Shi XH, Jia JY, Zhao CH, Qu HL, Shi XL. Seismic response analysis of long-span and asymmetrical suspension bridges subjected to near-fault ground motion. Eng Fail Anal. 2020;115(6):104615. doi:10.1016/j.engfailanal.2020.104615. [Google Scholar] [CrossRef]
25. Zhang L, Zhang PP, Xu DS, Zhou T. Seismic damage analysis of piled pier system constructed on soft clay ground. J Bridge Eng. 2021;26(3):04020133. doi:10.1061/(ASCE)BE.1943-5592.0001682. [Google Scholar] [CrossRef]
26. Anastasopoulos I, Kourkoulis R, Gazetas G, Tsatsis A. Interaction of piled foundation with a rupturing normal fault. Geotechnique. 2014;63(12):1042–59. doi:10.1680/geot.12.P.114. [Google Scholar] [CrossRef]
27. Yan WJ, Tian XX, Wu ZJ, Ping W, Lin K. Seismic response of concrete bridge of Lanzhou-Xinjiang high-speed railway under the near-fault strong earthquake. Structures. 2023;50(3):1416–28. doi:10.1016/j.istruc.2023.02.039. [Google Scholar] [CrossRef]
28. Jia HY, Yang J, Zheng SX, Zhao CH, Du XL. A review on aseismic bridges crossing fault rupture regions. J Southwest Jiaotong Univ. 2021;56(5):1075–93. doi:10.3969/j.issn.0258-2724.20200162. [Google Scholar] [CrossRef]
29. Antonellis G, Panagiotou M. Seismic response of bridges with rocking foundations compared to fixed-base bridges at a near-fault site. J Bridge Eng. 2014;38(12):2070–2. doi:10.1061/(ASCE)BE.1943-5592.0000570. [Google Scholar] [CrossRef]
30. Yang ZQ. Numerical simulation of soil-pile—nuclear Island dynamic interaction on non-bedrock site. Harbin, China: Institute of Engineering Mechanics, CEA; 2022. doi:10.27490/d.cnki.ggjgy.2022.000079. [Google Scholar] [CrossRef]
31. Bai JF, Dong SX. Selection of lateral artificial boundary distance and analysis of its influence factors in seismic responses analysis of sites. World Earthquake Eng. 2018;34(3):179–87. [Google Scholar]
32. Wu S, Zhao ZG, Pei Q. Study on the seismic input method of viscoelastic artificial boundary condition in finite element software. J Dalian Univ. 2017;38(3):8–11. [Google Scholar]
33. Laubach SE, Hundley TH, Hooker JN, Marrett RA. Spatial arrangement and size distribution of normal faults, Buckskin detachment upper plate, Western Arizona. J Struct Geol. 2018;108(B):230–42. doi:10.1016/j.jsg.2017.10.001. [Google Scholar] [CrossRef]
34. Peng L. Hanging wall effect in wenchuan earthquake [Ph.D. thesis]. Harbin, China: Institute of Engineering Mechanics, CEA; 2011. [Google Scholar]
35. Feng ZJ, Meng YY, Zhang C, Lai DJ, Zhu JX, Lin LY. Dynamic response and p-y curve of pile groups in liquefaction site under strong earthquake. Rock Soil Mech. 2022;43(5):1289–98. doi:10.16285/j.rsm.2021.1447. [Google Scholar] [CrossRef]
36. Ministry of Transport of the People’s Republic of China. Guidelines for seismic design of highway bridges (JTG/T B02-01-2008). Beijing, China: China Communications Press; 2008. [Google Scholar]
Cite This Article
 Copyright © 2025 The Author(s). Published by Tech Science Press.
This work is licensed under a Creative Commons Attribution 4.0 International License , which permits unrestricted use, distribution, and reproduction in any medium, provided the original work is properly cited.
 Downloads
 Citation Tools