
 Submit a Paper
 Propose a Special lssue
 Open Access
ARTICLE

Hybrid Models of Multi-CNN Features with ACO Algorithm for MRI Analysis for Early Detection of Multiple Sclerosis
1 Computer Department, Applied College, Najran University, Najran, 66462, Saudi Arabia
2 Department of Computer Science, College of Applied Sciences, Hajjah University, Hajjah, 9677, Yemen
3 Department of Artificial Intelligence, Faculty of Computer Science and Information Technology, Al-Razi University, Sana’a, 9671, Yemen
4 Department of Information Technology, College of Computing and Information Sciences, University of Technology and Applied Sciences-Salalah, Salalah, 211, Oman
5 Computer Science and Information Technology Department, Thamar University, Dhamar, 9676, Yemen
* Corresponding Author: Mohammed Al-Jabbar. Email:
(This article belongs to the Special Issue: Artificial Intelligence Emerging Trends and Sustainable Applications in Image Processing and Computer Vision)
Computer Modeling in Engineering & Sciences 2025, 143(3), 3639-3675. https://doi.org/10.32604/cmes.2025.064668
Received 21 February 2025; Accepted 15 May 2025; Issue published 30 June 2025
 View Full Text
 Download PDF
Abstract
Multiple Sclerosis (MS) poses significant health risks. Patients may face neurodegeneration, mobility issues, cognitive decline, and a reduced quality of life. Manual diagnosis by neurologists is prone to limitations, making AI-based classification crucial for early detection. Therefore, automated classification using Artificial Intelligence (AI) techniques has a crucial role in addressing the limitations of manual classification and preventing the development of MS to advanced stages. This study developed hybrid systems integrating XGBoost (eXtreme Gradient Boosting) with multi-CNN (Convolutional Neural Networks) features based on Ant Colony Optimization (ACO) and Maximum Entropy Score-based Selection (MESbS) algorithms for early classification of MRI (Magnetic Resonance Imaging) images in a multi-class and binary-class MS dataset. All hybrid systems started by enhancing MRI images using the fusion processes of a Gaussian filter and Contrast-Limited Adaptive Histogram Equalization (CLAHE). Then, the Gradient Vector Flow (GVF) algorithm was applied to select white matter (regions of interest) within the brain and segment them from the surrounding brain structures. These regions of interest were processed by CNN models (ResNet101, DenseNet201, and MobileNet) to extract deep feature maps, which were then combined into fused feature vectors of multi-CNN model combinations (ResNet101-DenseNet201, DenseNet201-MobileNet, ResNet101-MobileNet, and ResNet101-DenseNet201-MobileNet). The multi-CNN features underwent dimensionality reduction using ACO and MESbS algorithms to remove unimportant features and retain important features. The XGBoost classifier employed the resultant feature vectors for classification. All developed hybrid systems displayed promising outcomes. For multi-class classification, the XGBoost model using ResNet101-DenseNet201-MobileNet features selected by ACO attained 99.4% accuracy, 99.45% precision, and 99.75% specificity, surpassing prior studies (93.76% accuracy). It reached 99.6% accuracy, 99.65% precision, and 99.55% specificity in binary-class classification. These results demonstrate the effectiveness of multi-CNN fusion with feature selection in improving MS classification accuracy.Keywords
Multiple sclerosis is a chronic and often disabling neurological disorder characterized by the immune system’s attack on the central nervous system (CNS), including the spinal cord, brain and optic nerves [1]. This autoimmune response damages myelin [2], the protective covering of nerves, and leads to disruptions in communication between the brain and body. This leads to disruption of nerve signaling and a wide range of symptoms [3]. Early classification of multiple sclerosis is important for beginning timely and effective interventions, managing symptoms, and preventing complications of the disease [4]. MS symptoms, especially in the early stages, are nonspecific and mimic other neurological or systemic conditions. The symptoms of MS overlap with those of other neurological disorders, making it difficult to differentiate MS from conditions such as migraines, fibromyalgia, or peripheral neuropathy [5]. The lack of specific early biomarkers, sophisticated diagnostic criteria, expensive testing, nonspecific symptoms, and insufficient experience make accurate classification of MS by neurologists difficult [6]. MS is diagnosed through clinical evaluation, medical history evaluation, and various diagnostic tests [2]. Measure electrical signals along the pathways to check for nerve damage. Spinal fluid analysis using the detection of oligoclonal bands and increased IgG levels suggests MS [7]. MRI is a major diagnostic tool for MS, allowing the detection of disease or plaques characteristic of MS. MRI is very sensitive for detecting active, chronic lesions, even those that do not cause noticeable symptoms [8]. MRI helps visualize the distribution and location of lesions, which aids in differential classification and treatment planning [9]. Early classification of MS using AI technologies significantly addresses the shortcomings of manual classification by neurologists and experts. Neurologists rely on clinical assessment, medical history, MRI scans, and cerebrospinal fluid (CSF) analysis [10]. Still, the following factors hinder classification accuracy: MRI-based diagnosis is subjective and relies on the expertise of specialists. Some specialists make incorrect diagnoses. MS lesions often resemble those of other neurological disorders, making it difficult to distinguish between them. The diagnostic process involves multiple tests, including MRI scans and lumbar punctures, which are time-consuming and expensive [11]. Due to the heterogeneous nature of early MS symptoms, many patients experience delayed diagnosis. AI algorithms analyze patterns and features in images with high accuracy and consistency [12]. This helps overcome the variability and subjectivity often associated with manual interpretation. AI algorithms excel at detecting subtle changes in imaging data that may pose a challenge to human observers. AI algorithms are capable of efficiently processing and analyzing large data sets [13]. AI helps identify accurate imaging biomarkers that may precede clinical symptoms. This ability allows the identification of individuals at risk of developing MS. This ensures that individuals who show early symptoms of MS receive an accurate and timely classification [14].
Many previous studies still have limitations, including: Many studies rely on single CNN models without considering diverse feature representations. High-dimensional feature vectors extracted from CNNs contain redundant or irrelevant features, which reduces classification accuracy. Feature selection algorithms are not utilized. Most previous studies focus on either CNN models or machine learning classification or their combination. This study undertook a novel approach to constructing hybrid systems by integrating multi-CNN models with machine learning. The fundamental objective of these hybrid systems is to synergistically leverage the feature extraction capabilities of CNN models and subsequently amalgamate these extracted features into high-dimensional feature vectors. The fusion of CNN models involves simultaneously using multi-CNN models, each contributing its unique ability to discern intricate patterns and representations within the MRI of multiple sclerosis. Subsequently, recognizing the redundancy within these high-dimensional feature vectors, feature selection algorithms are applied. These algorithms are strategically applied to extract the most important and informative features, discarding redundancies and enhancing the discriminatory ability of the resultant feature vectors. The process of dimensionality reduction through feature selection serves the dual purpose of enhancing computational efficiency and, more critically, refining the discriminatory capacity of the feature vectors. This approach combines the strengths of multi-CNN and ML (Machine Learning) algorithm through intricate feature extraction and subsequent dimensionality reduction. Contributes to developing a powerful and effective system for analyzing complex MRI of multiple sclerosis.
The key contributions of this work are as follows:
• Enhancing MRI images by fusing processes between the Gaussian filter and the CLAHE process.
• Applying the GVF algorithm to extract white matter, isolate it from the brain components, and send it to CNN models.
• Combining the features of the CNN as follows: (ResNet101-DenseNet201, DenseNet201-MobileNet, ResNet101-MobileNet, and ResNet101-DenseNet201-MobileNet) and saving them in fused feature vectors.
• Applying the ACO and MESbS methods to reduce the features.
The remainder of this study was organized as follows: Section 2 discusses relevant previous studies and reviews the systems and results. Section 3 analyzes and interprets MRI images of the MS dataset by hybrid methods and materials. Section 4 reviews the results of the proposed hybrid systems. Section 5 discusses the proposed systems and compares the results of previous studies with the proposed hybrid systems. Section 6 concludes the proposed hybrid systems.
This section comprehensively discusses the methodologies, tools and results used in prior studies to diagnose MS.
2.1 Machine Learning with Handcrafted Features
Macin et al. [15] proposed a computationally efficient ML algorithm for classifying MS using handcrafted features from axial brain MRI images. Features were extracted using exemplar multiple parameters LPQ (Local Phase Quantization) with subsequent discriminative feature via iterative neighborhood. A KNN (K-Nearest Neighbor) algorithm, Fine KNN, achieved a binary classification Sensitivity of 95.01%. In Montolío et al. [16] many classifications, including ensemble classifier (EC), KNN, SVM (Support Vector Machine), and LSTM (Long Short-Term Memory), were used to develop MS diagnosis and disability course prediction models. The EC achieved the best MS diagnosis performance with 87.7% accuracy, 87% sensitivity 0.8775 and AUC (Area Under Curve).
2.2 Deep Learning-Based Classification
Storelli et al. [17] proposed a CNN to classify MRI images of MS patients. The CNN predicted clinical and cognitive deterioration, individually or combined. The CNN reached an accuracy for cognitive 67.7%, with optimal performance (85.7%) when trained on both. In Seok et al. [18], a modified ResNet18 based on Grad-CAM for distinguishing between MS and neuromyelitis. The model exhibited 76.1% accuracy, with a 77.3% sensitivity, a specificity of 74.8%, and an AUC of 85%. In Hagiwara et al. [19], a CNN based on SqueezeNet was employed to analyze maps and diagnose MS. Leave-one-out cross-validation showed an AUC of 0.859, with sensitivity and accuracy of 80.0%, 83.3%, and 81.1%, respectively. Alijamaat et al. [20] used the family wavelet transform for spectral information utilization. The method integrates the two discrete family wavelets transform with a CNN. Rehan Afzal et al. [21] introduced an automated CNN model for the diagnosis of MS lesions with two networks for enhanced accuracy. The first network precisely segments lesions, while the second reduces false positives. Using T1-w, T2-w, and MRI sequences as input. The methods achieve up to 90% accuracy in MS lesions. Yılmaz Acar et al. [22] proposed a CNN for MS identification through lesion detection in MRI images. The CNN extracts MS lesion features efficiently. Results show superior performance for the proposed CNN yields 90.3% accuracy, 90.5% sensitivity, 90.1% specificity, and 91.1% precision.
2.3 Segmentation-Based Approaches
McKinley et al. [23] trained two convolutional neural networks—3D UNet and DeepSCAN—on a multiple sclerosis lesion segmentation (MSSEG) dataset annotated by seven human raters. Integrating weak anatomical labels degraded 3D UNet performance but improved DeepSCAN. The DeepSCAN demonstrated better than 3D UNet performance. In Coronado et al. [24], a CNN model applied to segment gadolinium lesions in MRI data from MS. The system displayed average DSC/FPR values of 0.72/0.31. In Fenneteau et al. [25], U-net network is used by the collective and connects them through extended skip connections. By increasing convolutional layers while reducing features, we created an exceptionally lightweight and competitive architecture termed the minimally parameterized U-net. Lopez-Dorado et al. [26] proposed a Deep generative adversarial method augmentation augments the CNN. Discriminant structures include GCL++ 44.99%, complete retina 26.71%. Feature pre-selection and CNN application prove promising for noninvasive and effective early MS diagnosis.
Cruciani et al. [27] presented a model for deciphering microstructural signatures distinguishing MS using MRI images. Microstructural descriptors from 3D-Simple Harmonics Oscillator. CNN models are fitted to each feature, generating layerwise relevance propagation heatmaps. Zhang et al. [28] evaluated three heat mapping techniques for the interpretability of CNNs in classifying multiple sclerosis of the brain through MRI. Analysis of Grad-CAM heatmaps for the top VGG19 model showed significantly higher heterogeneity in progressive MS. VGG16 with GAP got an accuracy of 93.76%. Results show dMRI features in grey matter aid in distinguishing MS types. Alijamaat et al. [29] presented a CNN that was employed for MS detection. The CNN includes pooling layers, with the novel use of wavelet-transform-based pooling, enhancing specificity.
By reviewing the techniques and results of the previous studies mentioned above, it is noted that all researchers have devoted their efforts to achieving superior results for the early classification of multiple sclerosis. These studies have used various methodologies, from ML to deep learning techniques. However, the untapped potential lies in harnessing the capabilities of CNN to extract deep feature maps. To address these gaps, this study uses CNN models to extract features from multi-CNNs and then uses essential feature selection algorithms to select the most important features. The final classification is accomplished through the application of the XGBoost classifier.
This study presents a novel hybrid deep model of an XGBoost classifier with multi-CNN based on feature extraction for automated analysis of brain MRI scans to help early classification of MS. The procedural sequence of the proposed systems is explained in Fig. 1. First, the MRI image is enhanced by applying a Gaussian filter to reduce noise and CLAHE to improve contrast in white matter lesions. The GVF algorithm then segments brain regions to isolate white matter lesions from other brain components. These preprocessed segmented scans are passed through ResNet101, DenseNet201, and MobileNet models to extract features from the MRI image. The features extracted by each CNN have been combined and fused to form high-accuracy hybrid features of lesion morphological features from multi-CNN. To select essential features, ACO and MESbS algorithms are applied to the fused vectors to select essential feature subsets containing only the most discriminative features. Finally, the fused feature vectors are inputted into the XGBoost classifier, combining their features into accurate predictions of MS through its ensemble of XGBoost.
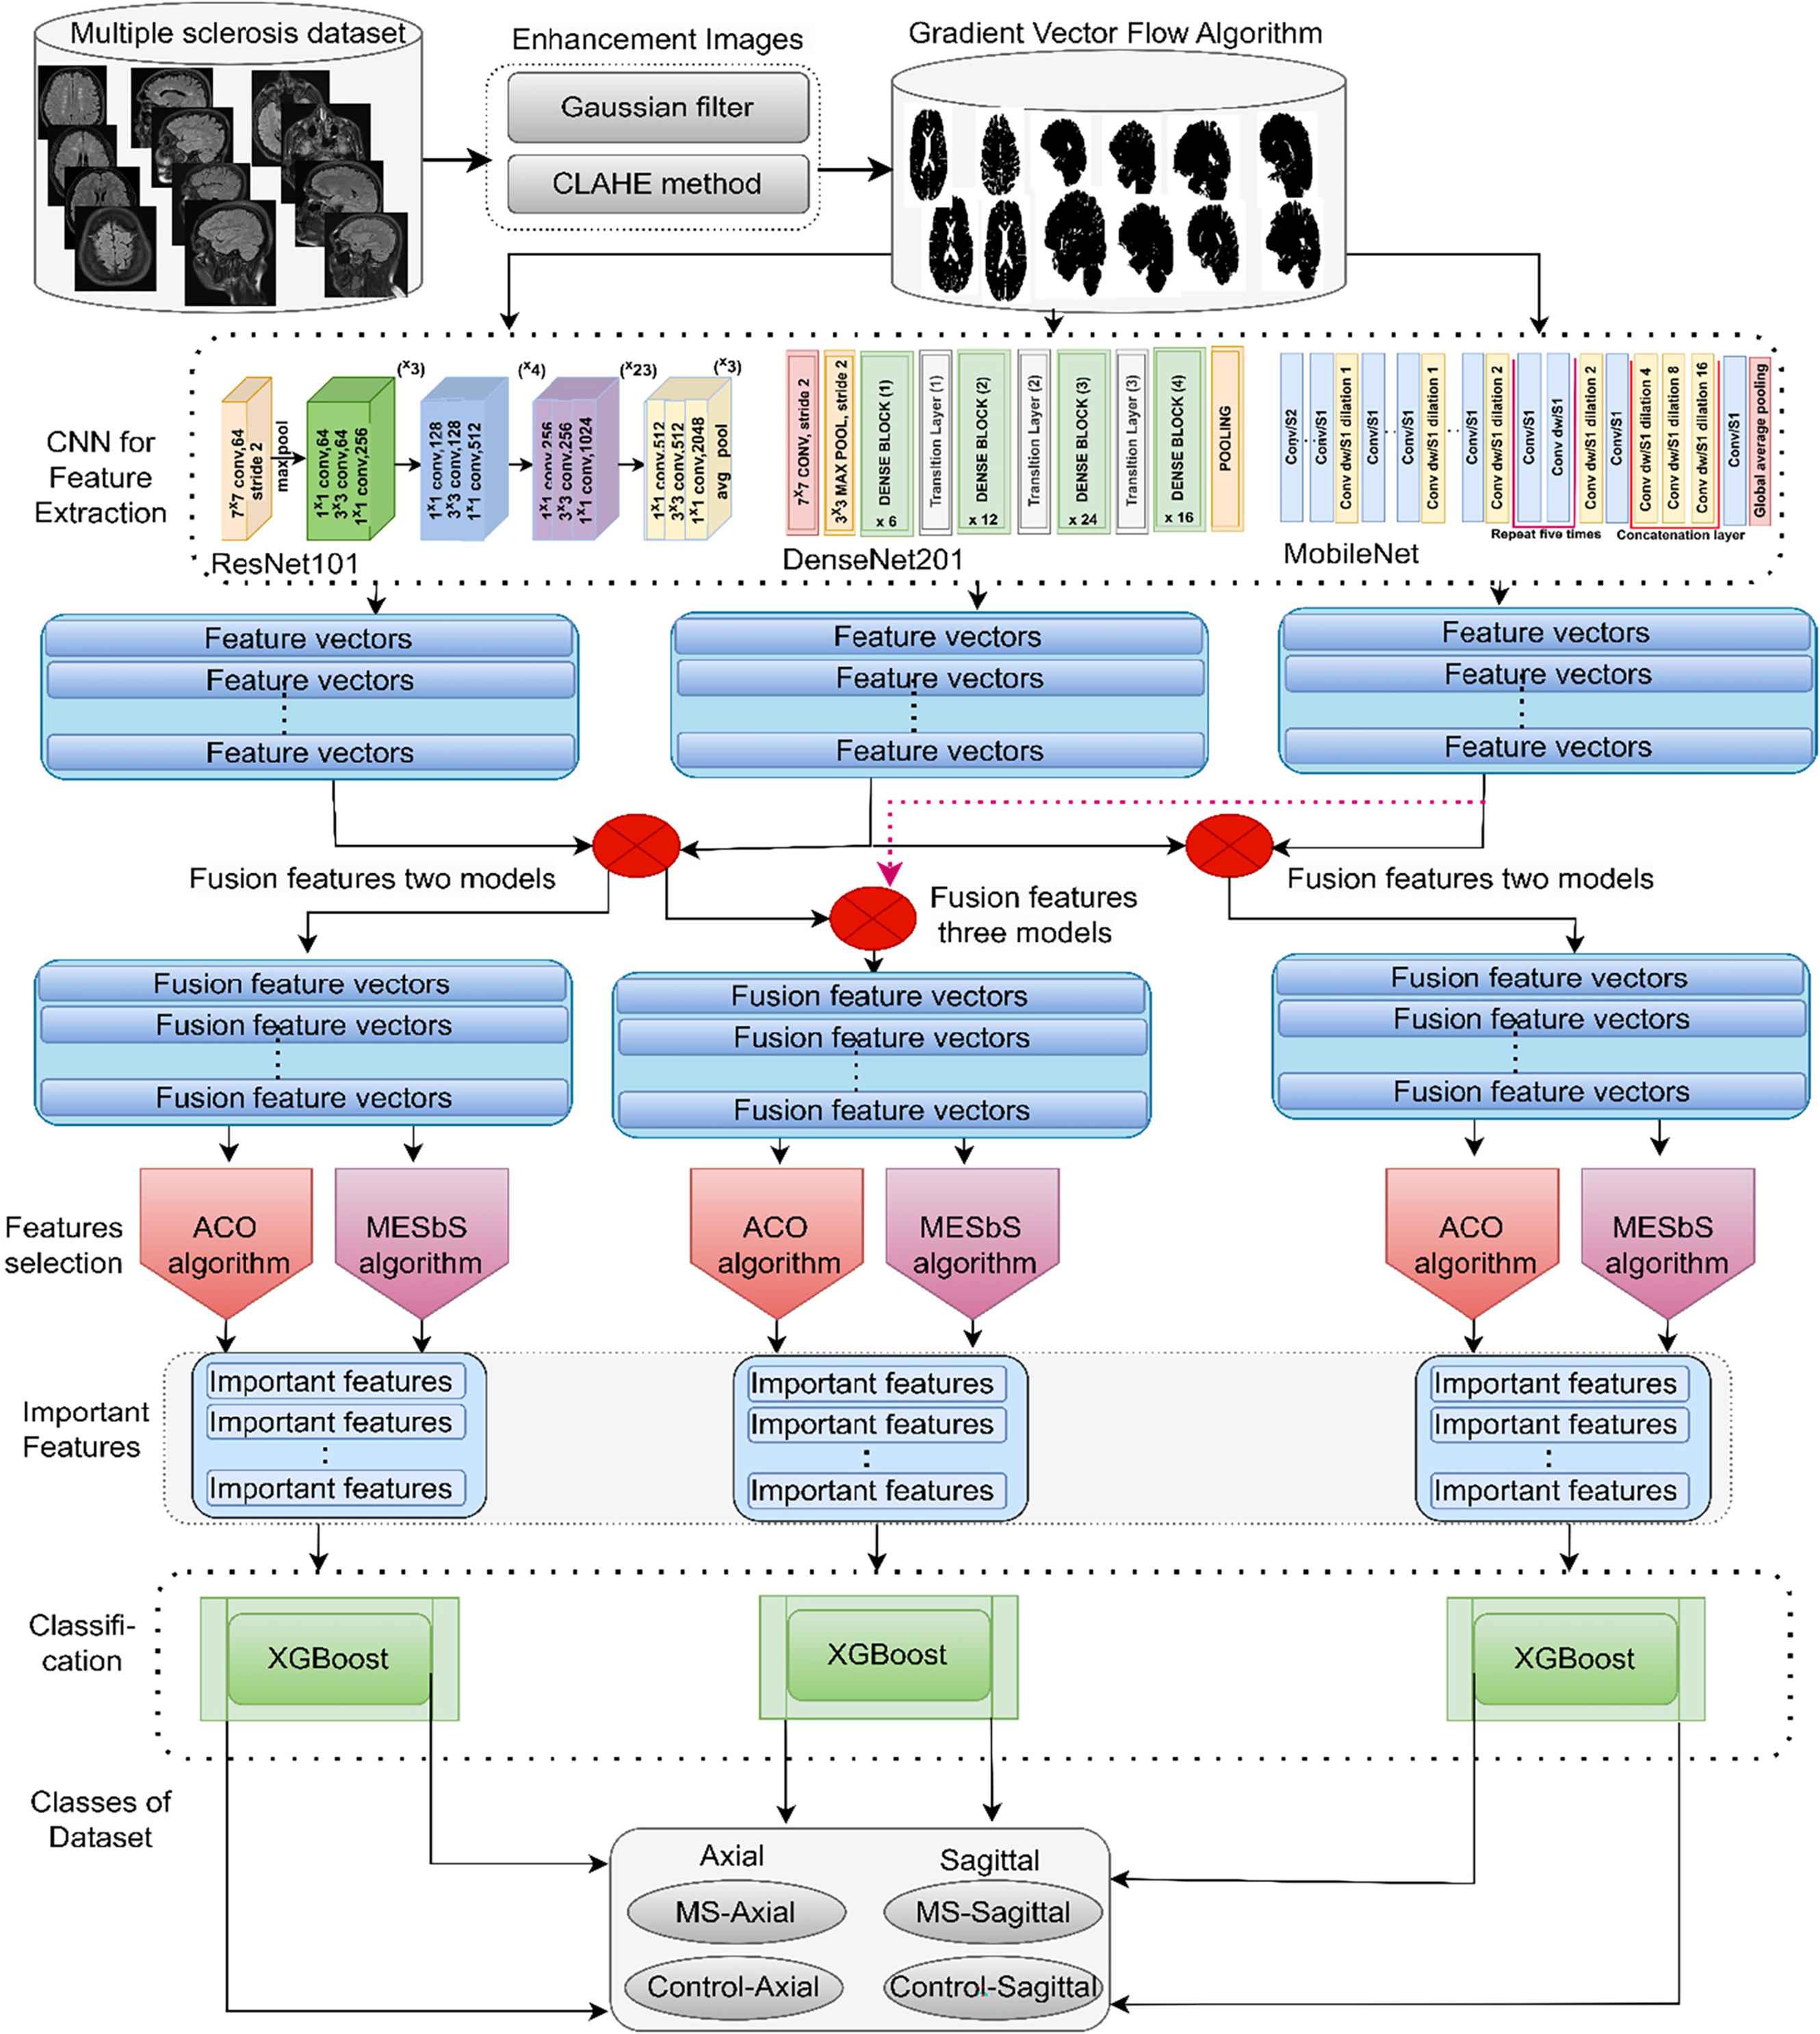
Figure 1: XGBoost hybrid methodology framework with hybrid features of multi-CNN based on feature selection for analyzing brain MRI images for early classification of MS
3.1 Description and Split of the MS Dataset
This study uses a dataset of brain MRI images containing confirmed cases of MS and healthy subjects obtained from a trusted public research data repository, Kaggle; the aim is to facilitate the development and evaluation of automated diagnostic methods for early MS screening. The dataset comprises 3427 total axial and sagittal MRI images optimized for visualizing white matter lesions indicative of MS. Cases include 1411 MRI images across MS patients, divided into 650 axial images and 761 sagittal images showing disease manifestations. Controls healthy include 1002 healthy axial images and 1014 healthy sagittal images [30]. This standardized collection allows binary-class evaluation to distinguish MS from healthy states and multi-class analysis of axial and sagittal differences in MS lesions and healthy images. Sample images depicting representative MRI findings in MS are provided in Fig. 2a to illustrate the diversity of scans available for system development and evaluation on this curated data source toward advancing automated multi-orientation MRI analysis methods for early assistance in MS classification.
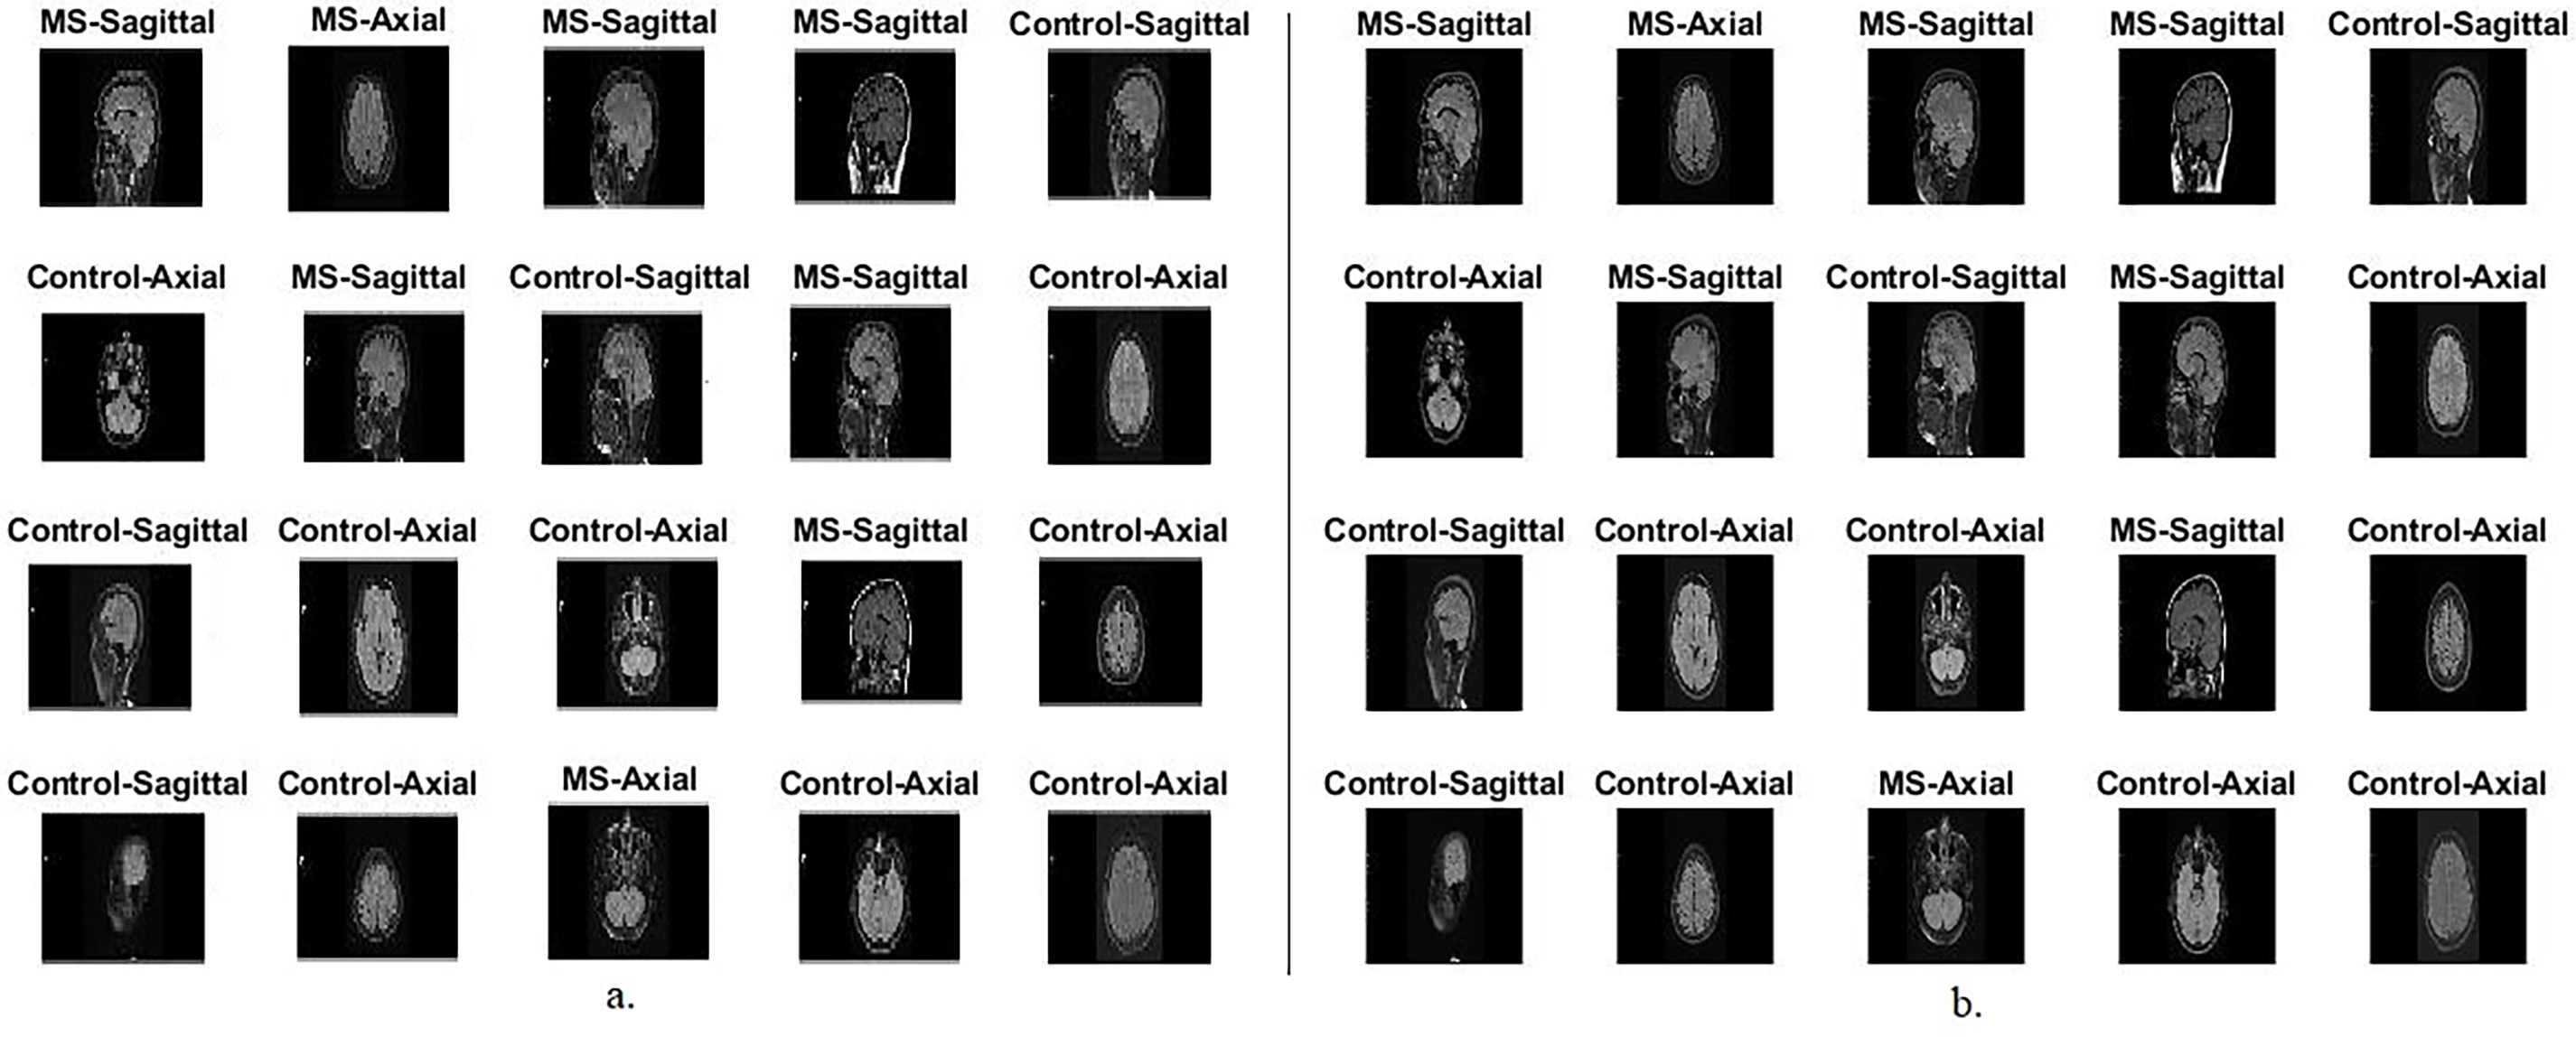
Figure 2: Samples of the MS dataset randomly selected from an MRI image. (a): Before pre-processing; (b): After pre-processing
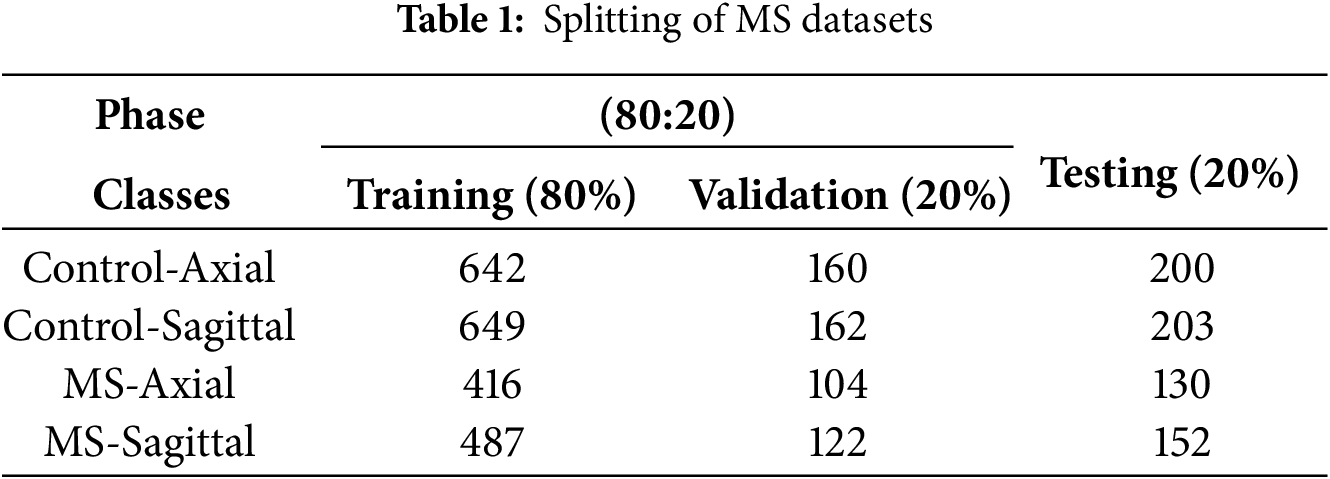
As presented in Table 1, this standardized dataset enables both binary classification (MS vs. healthy controls) and multi-class classification (distinguishing axial and sagittal imaging for MS and healthy cases). To assess the proposed systems, the dataset was partitioned into training/validation (80%) for hybrid system development and hyperparameter optimization, and testing (20%) for evaluating the optimized systems. All systems focus on achieving automated screening systems that reliably distinguish early signs of lesions in MS. These proposed systems aim to help neurologists and experts make timely diagnostic and intervention decisions to improve patient outcomes.
This study employed 5-fold cross-validation to validate the performance of the proposed hybrid system. The dataset was systematically divided into five subsets, each used as a test set once, while the remaining four were used for training and validation. This ensures that the results are not single-run outcomes but rather an average over multiple runs, mitigating concerns about random fluctuations and overfitting. The results presented in the study represent the mean performance across these five folds. This approach enhances reliability by demonstrating the proposed model’s performance consistently across different data splits. Additionally, implemented data augmentation techniques and used a separate test set to prevent overfitting further.
3.2 Enhancement of MRI Images for the MS Dataset
MRI images are susceptible to noise and artifacts, interfering with the clarity of essential information. Image enhancement helps reduce noise, ensuring visible structures are more accurately represented. Removing artifacts is essential to improve the accuracy of diagnostics and prevent misinterpretations based on abnormalities. Enhancing MRI images enhances tissue contrast, especially lesions and surrounding healthy tissue. This increased variability is essential to accurately identify and quantify the pathological features associated with MS, such as demyelinating lesions.
In this work, MRIs were enhanced by fused methods of Gaussian filter to remove noise, followed by the CLAHE method to increase the contrast of low-illumination areas. The Gaussian filter is widely used for its ability to smooth or blur images, which helps in reducing noise. Noise in MRI images is effectively reduced by convolving the image with a Gaussian kernel, attenuating high-frequency noise components as in Eq. (1).
where
Artifacts in MRI images, caused by various factors, distort the diagnostic information. A Gaussian filter helps suppress artifacts. The filter averages pixel values, minimizing sudden intensity changes that might arise from artifacts. The Gaussian filter contributes to enhancing the contrast between different structures in the image. By smoothing the image, the filter highlights the major structural components, making the image more visually distinguishable. While reducing noise, it’s crucial to preserve important details in the image. The Gaussian filter has been designed to balance noise reduction and detail preservation. It achieves this by applying a weighted average to neighboring pixels, with weights determined by the Gaussian distribution. The 2D Gaussian kernel is defined as in Eq. (2) [31].
where (x, y) are the spatial coordinates and σ is the standard deviation, controlling the spread of the Gaussian. By changing σ, the amount of smoothing is adjusted; When σ is larger, it results in more homogeneity.
CLAHE is a technology used to improve the contrast of images, especially in low-illumination areas, by adapting to the local characteristics of the image. The CLAHE method increases the contrast in low-illumination areas to enhance MRI images in an MS dataset. The MRI image was divided into small tiles. For each tile, calculate the histogram, which represents the frequency of each density value within that region, as in Eq. (3).
This study used a tile size of 16 × 16 and a clip limit of 2.0. These parameters were chosen based on testing by increasing and decreasing the values and observing the results to balance contrast enhancement with noise reduction.
Calculate the Cumulative Distribution Function (CDF) from the histogram for each tile as in Eq. (4).
Applying histogram equalization to each tile using the calculated CDF, as in Eq. (5).
Contrast limiting prevents over-amplification of noise and artifacts. Inputting a contrast-limiting parameter L to restrict the amplification, as in Eq. (6).
where
Recombining the transformed tiles to form the final CLAHE-enhanced image. Combining processed tiles to reconstruct the entire image. The adaptive nature of CLAHE allows it to focus on local details, enhancing contrast where needed while preserving the overall structure of the image [32]. This makes CLAHE particularly effective at improving the visibility of structures in low-illumination regions of MRI images, making it valuable for applications such as the MS dataset, where accurate and clear imaging is critical for classification. As shown in Fig. 2b, the randomly selected samples show the results of MRI image enhancement.
3.3 Gradient Vector Flow Method
Applying the GVF algorithm to segment white matter brain lesions of an MS dataset and isolate them. The GVF algorithm allows isolation of lesional areas, allowing subsequent analyses to focus on MS-related features specifically. The GVF algorithm helps in the accurate identification of white matter lesions, leading to improved feature extraction [33]. This is particularly important for identifying MS features and MS-associated variations, contributing to more accurate analyses.
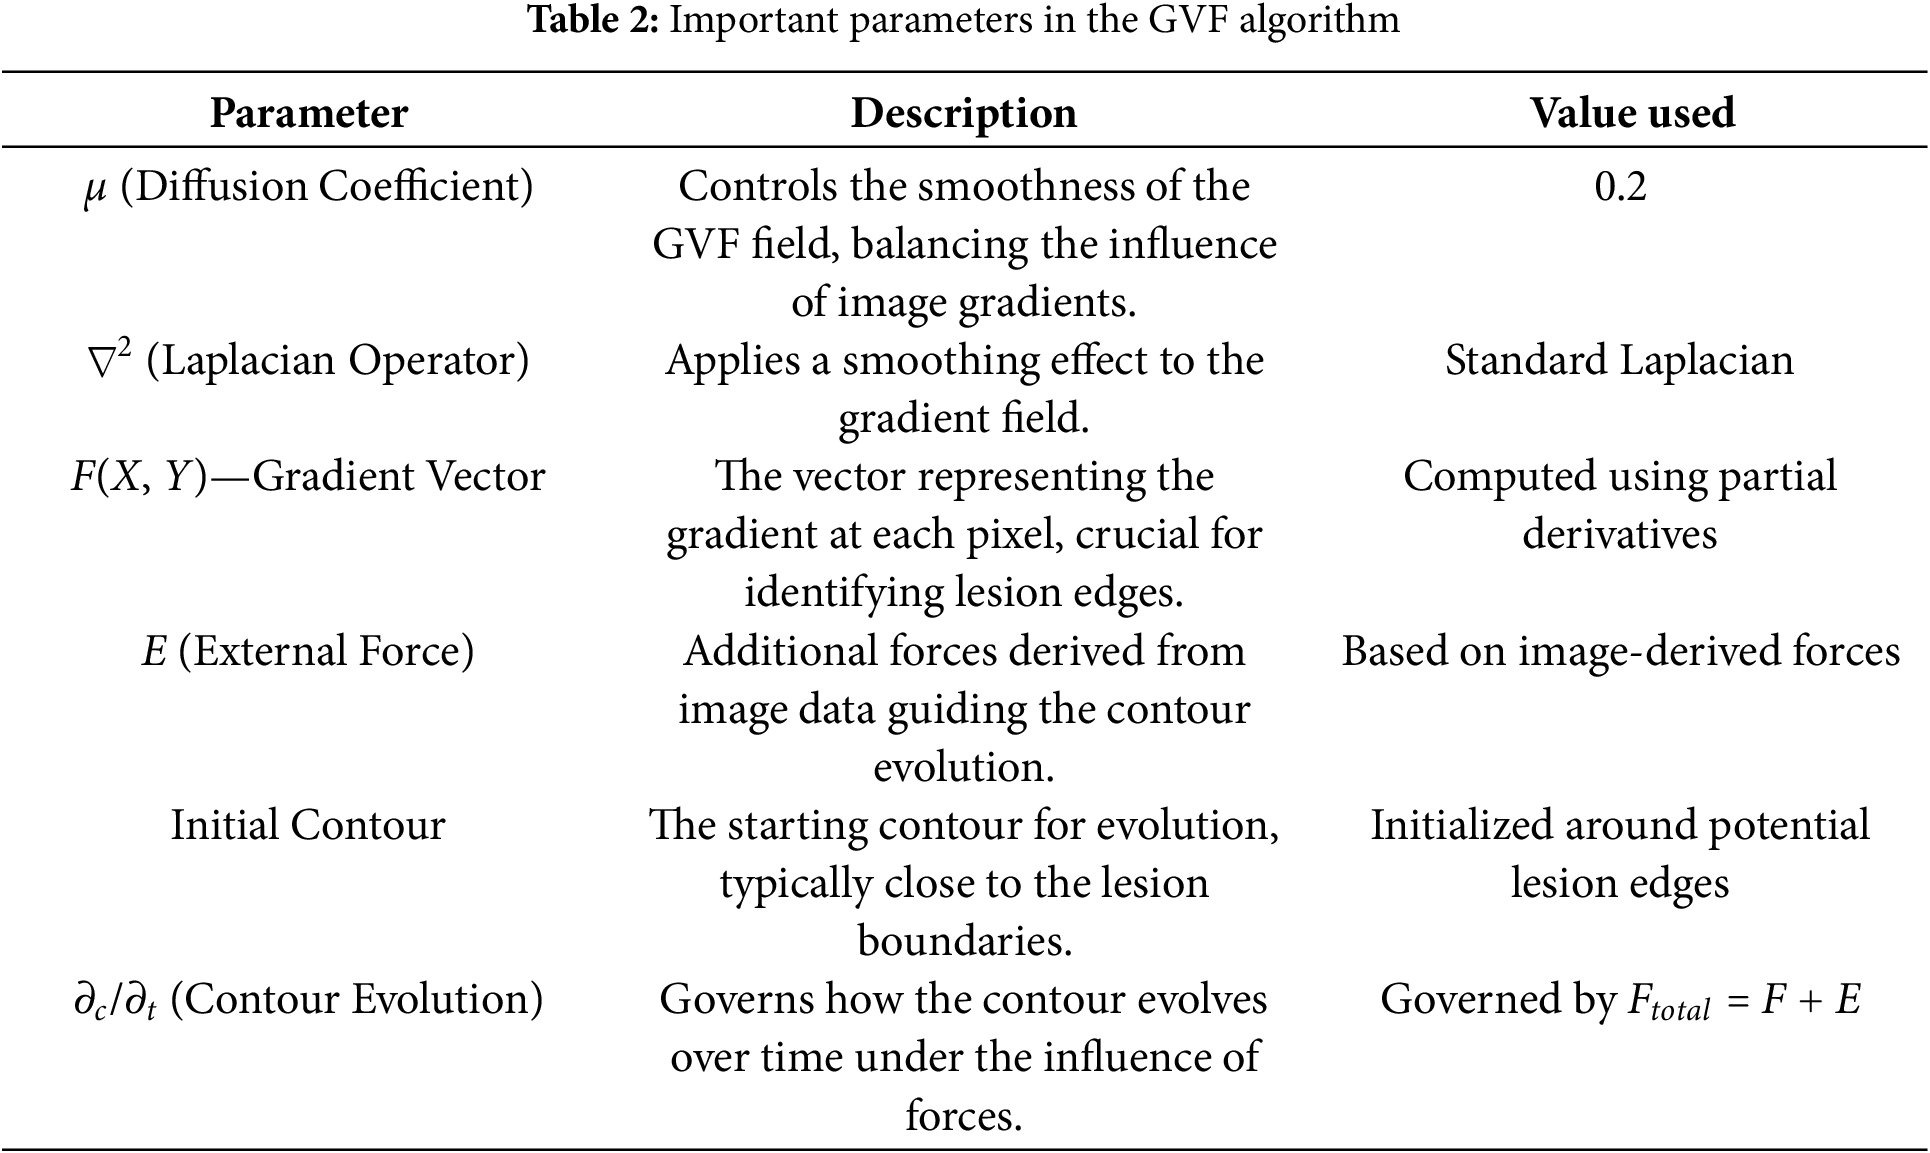
This study uses the GVF algorithm to segment the white matter in a brain region. Applying an edge detection algorithm to identify potential boundaries of white matter lesions in a brain [34]. Calculate gradient vectors for each pixel in the image. The gradient vector F(X, Y) is calculated using partial derivatives with respect to x and y [35]:
Gradient in the x-direction:
Gradient in the y-direction:
where I(x, y) mean the pixel intensity at location (x, y)
Compute the GVF field using the gradient vectors. This is typically achieved by solving a diffusion 10 equation:
where
Calculating the force field from the GVF field. The force field F is derived from the negative gradient of the GVF field as in Eq. (11):
Applying external forces, such as image-derived forces, guides the deformable contour toward the desired object boundaries. The external force E is combined with the GVF force as in Eq. (12):
Evolving the initial contour using the total force field to reach the final segmented contour. This process is modeled by a differential equation as in Eq. (13):
The contour evolves until convergence is reached, indicating that the contour has stabilized around the border of the brain’s white matter lesion area. The final segmented contour defines a mask that isolates the white matter region of the brain [36]. Fig. 3 shows random samples from the axial and sagittal MS dataset after using the GVF algorithm for segmentation.
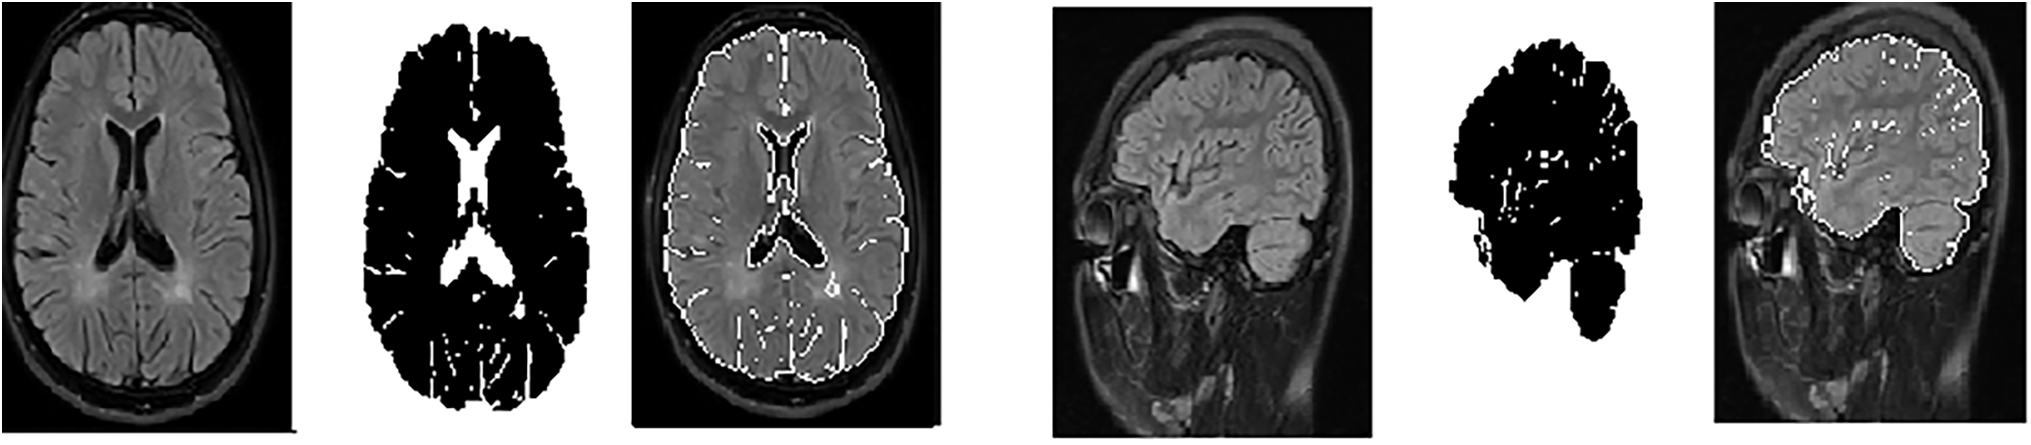
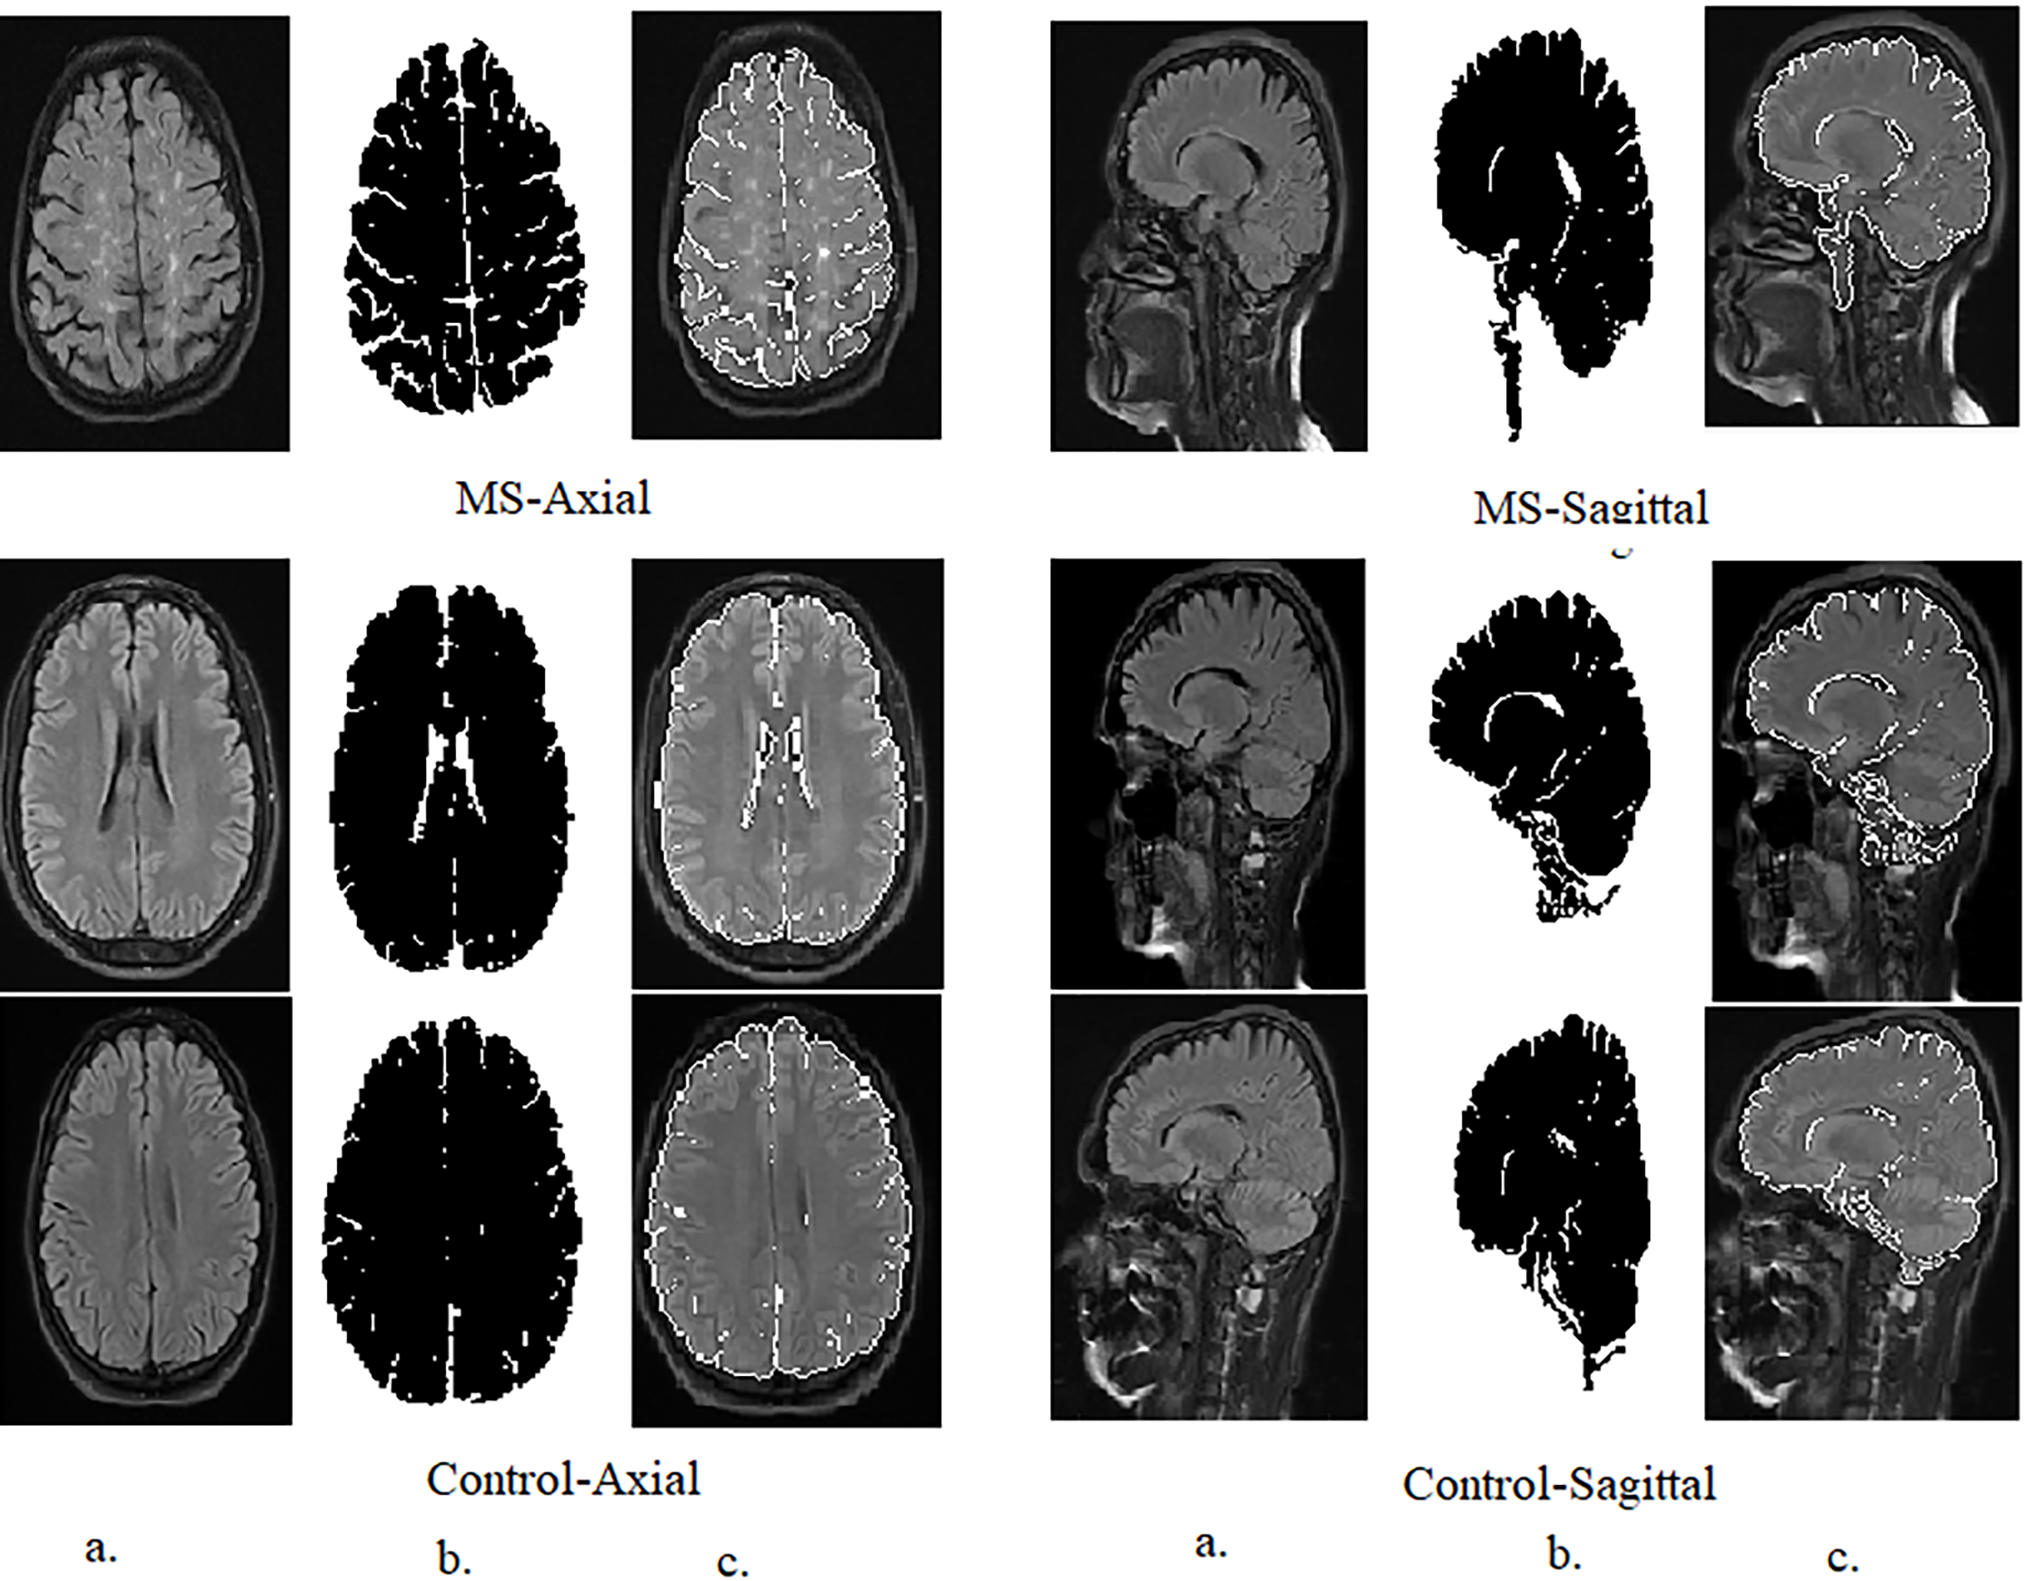
Figure 3: Samples from the axial and sagittal MS dataset after segmentation and ROI (Region of interest) identification. (a): Original images; (b): Segmented image; (c): Select the region of interest
These parameters were carefully chosen to ensure that the GVF algorithm effectively isolates the hyperintense areas within MS lesions, which are often sufficient for accurate classification by the CNN models used in this study, as Table 2. The goal was to identify the diagnostically relevant parts of the lesions, even if the entire lesion is not segmented, as these hyperintense regions can provide enough information for accurate MS detection.
The intention behind using GVF was to focus on the most hyperintense areas or edges within the MS lesions, which are often sufficient for classification. It is true that in some cases, not the entire lesion is segmented. However, the aim was to identify the most diagnostically relevant parts of the lesions, as even small portions of hyperintense areas can provide enough information for the CNNs to accurately detect MS.
In Fig. 3, the segmented images are used as input to the CNNs. The process of selecting the ROI was as follows: After applying GVF for segmentation, the white matter lesions were isolated from the surrounding brain tissue. This segmented area, containing the lesions, was then designated as the ROI. The ROI is essentially the area of the image where MS-related features are most prominent, ensuring that the CNNs focus on the most relevant parts of the image.
3.4 Balancing and Augmenting Data on an MS Dataset
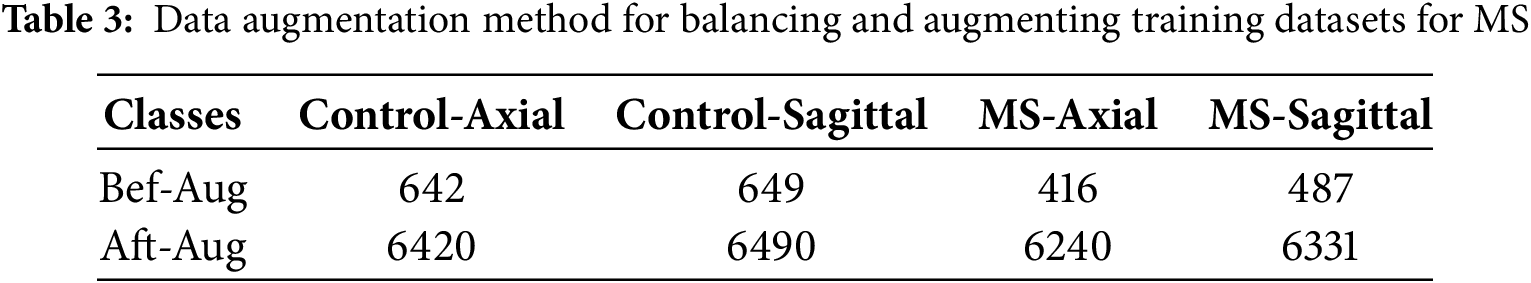
In medical imaging, such as MS classification, datasets often show class imbalance, where positive cases (MS patients) are fewer than negative cases (healthy controls). Data augmentation helps balance a dataset by creating augmented images from existing images. This ensures that the model is exposed to a more balanced representation of both categories, enhancing its ability to recognize and patterns associated with MS [37]. The limited training data set size leads to overfitting, where the model memorizes the training data set instead of learning meaningful patterns. Data augmentation artificially expands the training dataset by creating variations of existing images through rotating, flipping, zooming, and cropping transformations. Medical images, especially MRI of the brain, show variations in orientation, illumination, and other factors. Data augmentation introduces diversity into the training set, making the system more robust to different image conditions. This robustness is necessary to deal with the natural contrast found in medical images. Careful selection of magnification techniques ensures that disease-specific features, such as white matter lesions suggestive of MS, are preserved or realistically simulated. This allows the model to focus on relevant patterns during training. To balance the MS data set, each class was increased differently from the others. The Control-Axial and Control-Sagittal classes were artificially increased by nine images from each image, while the MS-Axial class was artificially increased by 14 images from each image, and the MS-Sagittal class by 12 artificial images from each image, as Table 3. Therefore, the training data set was increased and balanced.
3.5 Extracting Deep Feature Maps
CNNs models designed for image analysis. CNNs play a crucial role in extracting intricate features from MRI images that aid in diagnosing and understanding neurological conditions such as MS. There are many CNN layers. CNNs consist of multiple convolutional layers responsible for feature extraction. Each convolutional layer employs filters (kernels) to scan the input image, capturing different aspects of information. Within the network, each convolutional layer specializes in extracting specific features. Early convolutional layers focus on identifying geometric patterns, such as edges, corners, and shapes. Some layers delve into texture extraction, discerning finer details related to image texture and structure [38]. Other layers specialize in color feature extraction, distinguishing variations in pixel intensity and color distribution. Three basic steps control the work of convolutional layers. Filter Size: Determines the dimensions of the convolutional filter (kernel). Larger filters capture broader features, while smaller filters focus on finer details. Zero Padding: Prevents the reduction of spatial dimensions as the convolutional operation is applied. It helps maintain spatial integrity throughout the network. Stride (p-step): Governs the step size with which the convolutional filter moves across the input. A larger stride results in spatial downsampling, reducing the output size. The hierarchy of convolutional layers facilitates a multilayered approach to feature extraction. Early layers capture basic features, while deeper layers build upon these to extract complex, abstract features. Feature maps generated by each layer collectively contribute to a comprehensive representation of the input image. In the MRI, CNNs automatically leverage these principles to learn and extract features relevant to MS classification. Geometric, texture, and color features are essential for identifying abnormalities, lesions, and subtle patterns indicative of neurological conditions [39].
Pooling layers play a crucial role in feature extraction by reducing the spatial features of the input volume, which in turn helps in managing computational complexity and controlling overfitting. Max Pooling and Average Pooling are the most common layers [40]. Pooling layers reduce the dimensions of the input volume (width and height), thus reducing the number of parameters and computations in the network. This reduction helps control computational costs and mitigates the risk of overfitting. Maximum pooling involves determining the maximum value from the set of neighboring pixels in each feature map. The pooling kernel, or sliding window, traverses the input, retaining the highest value in each window. Average pooling calculates the average value of neighboring pixels in each feature map. Like max pooling, it uses a sliding window to traverse the input [41]. Fully connected layers play a vital role in neural networks, especially at the back end of the architecture. These layers connect each neuron in one layer to each neuron in the next layer, forming a fully connected structure. Fully connected layers aggregate features learned by previous layers, creating higher-level representations.
In this study, the ResNet101, DenseNet201, and MobileNet models were initially pre-trained on the ImageNet dataset to leverage their strong feature extraction capabilities. Then applied transfer learning by fine-tuning these models on the MS dataset to adapt them for MS classification. The fine-tuning process involved adjusting the network parameters using the MS dataset while retaining the learned representations from ImageNet.
This work uses CNNs of ResNet101, DenseNet201, and MobileNet to extract hierarchical feature representations that encode subtle features associated with multiple sclerosis lesions from 3427 MRI images. These CNN transform raw input into high-level semantic feature maps that capture complex features of lesions and discriminative histology through enhanced convolution and pooling operations. The output dimensions of the final convolutional layer are: (3 × 3 × 512) for ResNet101, (896 × 32 × 32) for DenseNet201 and (7 × 7 × 1024) for MobileNet. To reduce these features into fixed-length vectors suitable for classification and analysis, Adaptive average pooling (AAP) is applied to normalize the spatial dimensions and produce feature vectors of sizes 2048 for ResNet101, 1920 for DenseNet201, and 1024 for MobileNet for each image. The MS dataset containing 3427 images is encoded into discriminant embeddings of dimensions 3427 × 2048 using ResNet101model, 3427 × 1920 using DenseNet201 and 3427 × 1024 using MobileNet.
In this study, feature fusion from multi-CNN models is achieved through the combined features of ResNet101-DenseNet201, DenseNet201-MobileNet, ResNet101-MobileNet, and ResNet101-DenseNet201-MobileNet. As a result, this fused generates high-dimensional feature sets characterized by redundancy and the inclusion of less informative features. In illumination of this, the study uses two distinct algorithms for feature selection: ACO and MESbS. These algorithms are applied individually to identify and preserve the most important features while removing redundant and less informative features.
3.6 Selection Essential Features
Applying ACO algorithms after extracting features from multi-CNN models on MRI images for an MS dataset has several key advantages. MRI brain images from the MS dataset generate high-dimensional feature sets due to complex representations extracted by multi-CNN. Feature selection methods help mitigate the curse of dimensionality by selecting and retaining only the most relevant and discriminating features. Feature selection ensures that the selected subset of features retains the most discriminating information, leading to improved accuracy, precision, and robustness in subsequent classification or analysis tasks. Feature selection helps create more robust and effective models on MRI images.
3.6.1 Ant Colony Optimization Algorithm
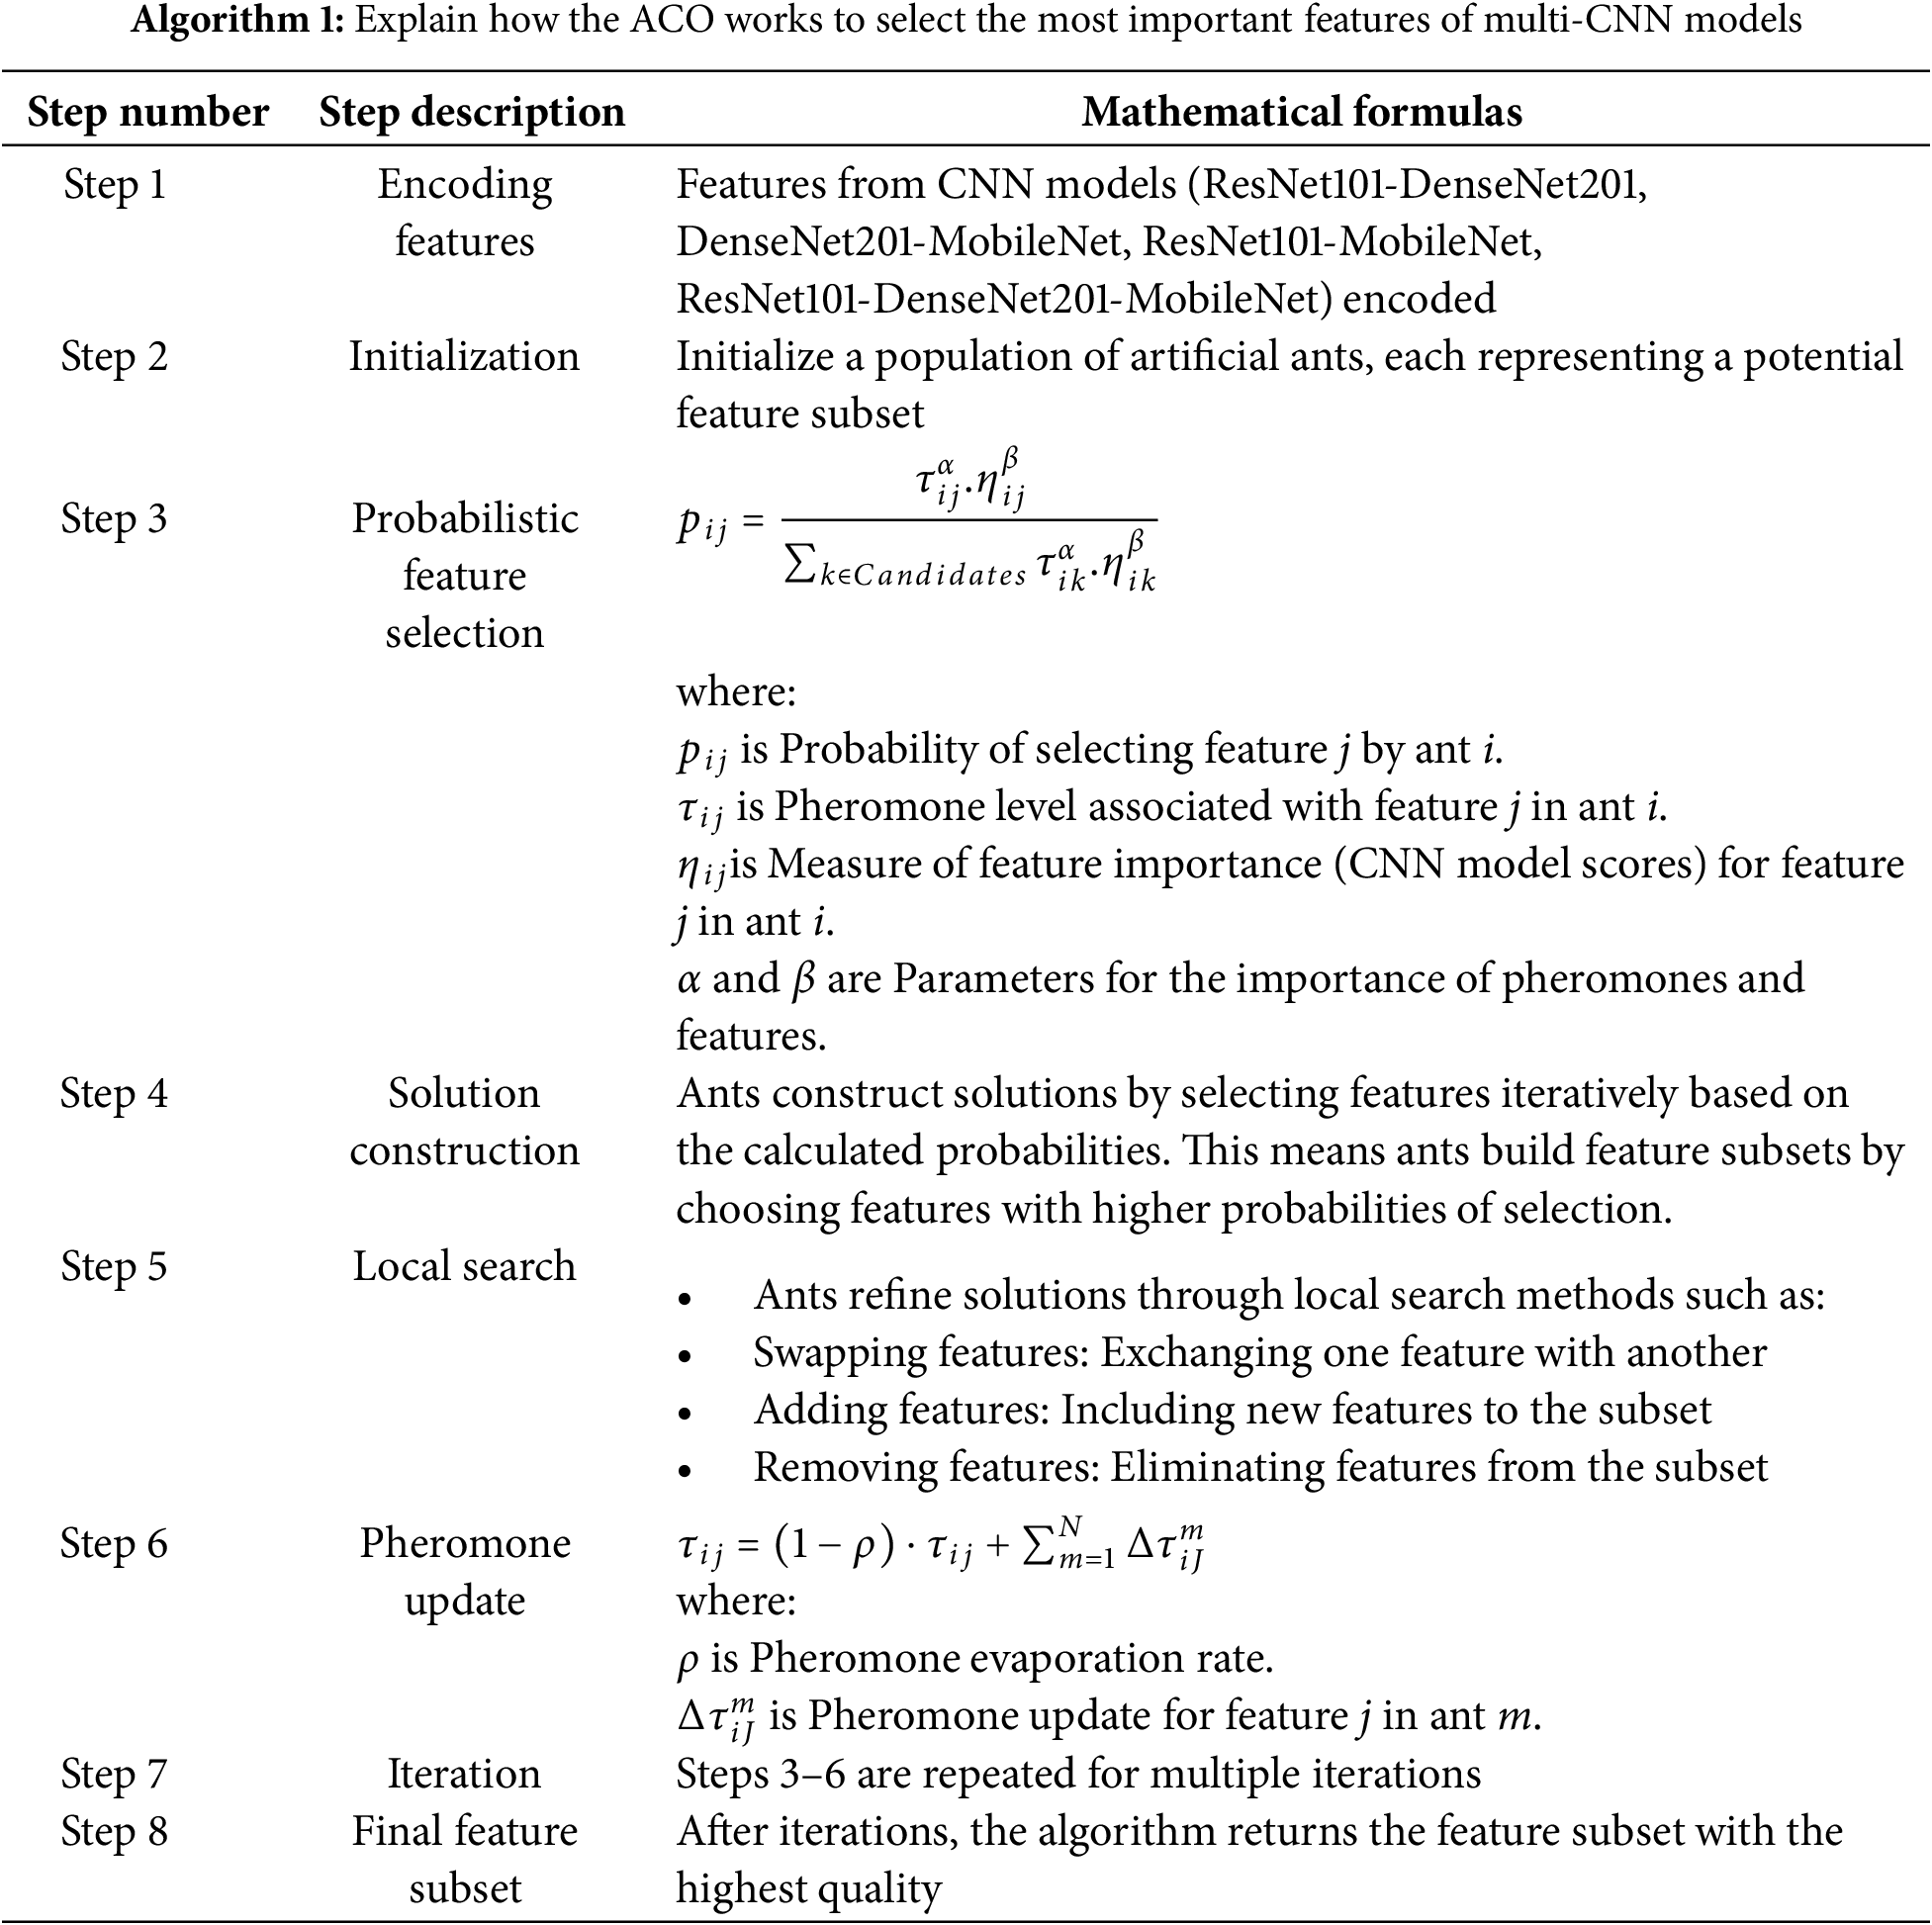
The ACO algorithm selects the essential features from multi-CNNs (from ResNet101-DenseNet201, DenseNet201-MobileNet, ResNet101-MobileNet, and ResNet101-DenseNet201-MobileNet) applied to MRI brain images of the MS dataset. ACO works on how ants search for the shortest path. Ants deposit a chemical called pheromone along the paths they traverse. Paths with higher pheromone levels become more attractive to other ants [42]. In ACO, candidate solutions are repeatedly generated by artificial ants. Each ant probabilistically selects its features to form a subset, and this process is influenced by the pheromone levels associated with the features. Ants perform local search inferences to improve their solutions. This helps them adapt and improve the quality of selected features. After each iteration, the pheromone levels are updated based on the quality of the solutions. Features that contribute positively to the objective function will get higher pheromone levels. The method is repeated for a predetermined until convergence. Algorithm 1 explains the mechanism of the ACO to select the essential features for multiple MRI brain imaging CNN models for the MS dataset.
3.6.2 Maximum Entropy Score-Based Selection Method
The MESbS algorithm is a feature selection method used to identify and retain the most important features from a set of combined features extracted by multi-CNN models. Entropy is used to measure the information content of features and select those that contribute most to the important information. MESbS calculates the entropy score for each feature that measures the information content. These scores classify the features, and the top predictive subset with the highest entropy is kept to derive an optimal representation. Algorithm 2 explains the mechanism of the MESbS algorithm to select the important features for multiple MRI brain imaging CNN models for the MS dataset.
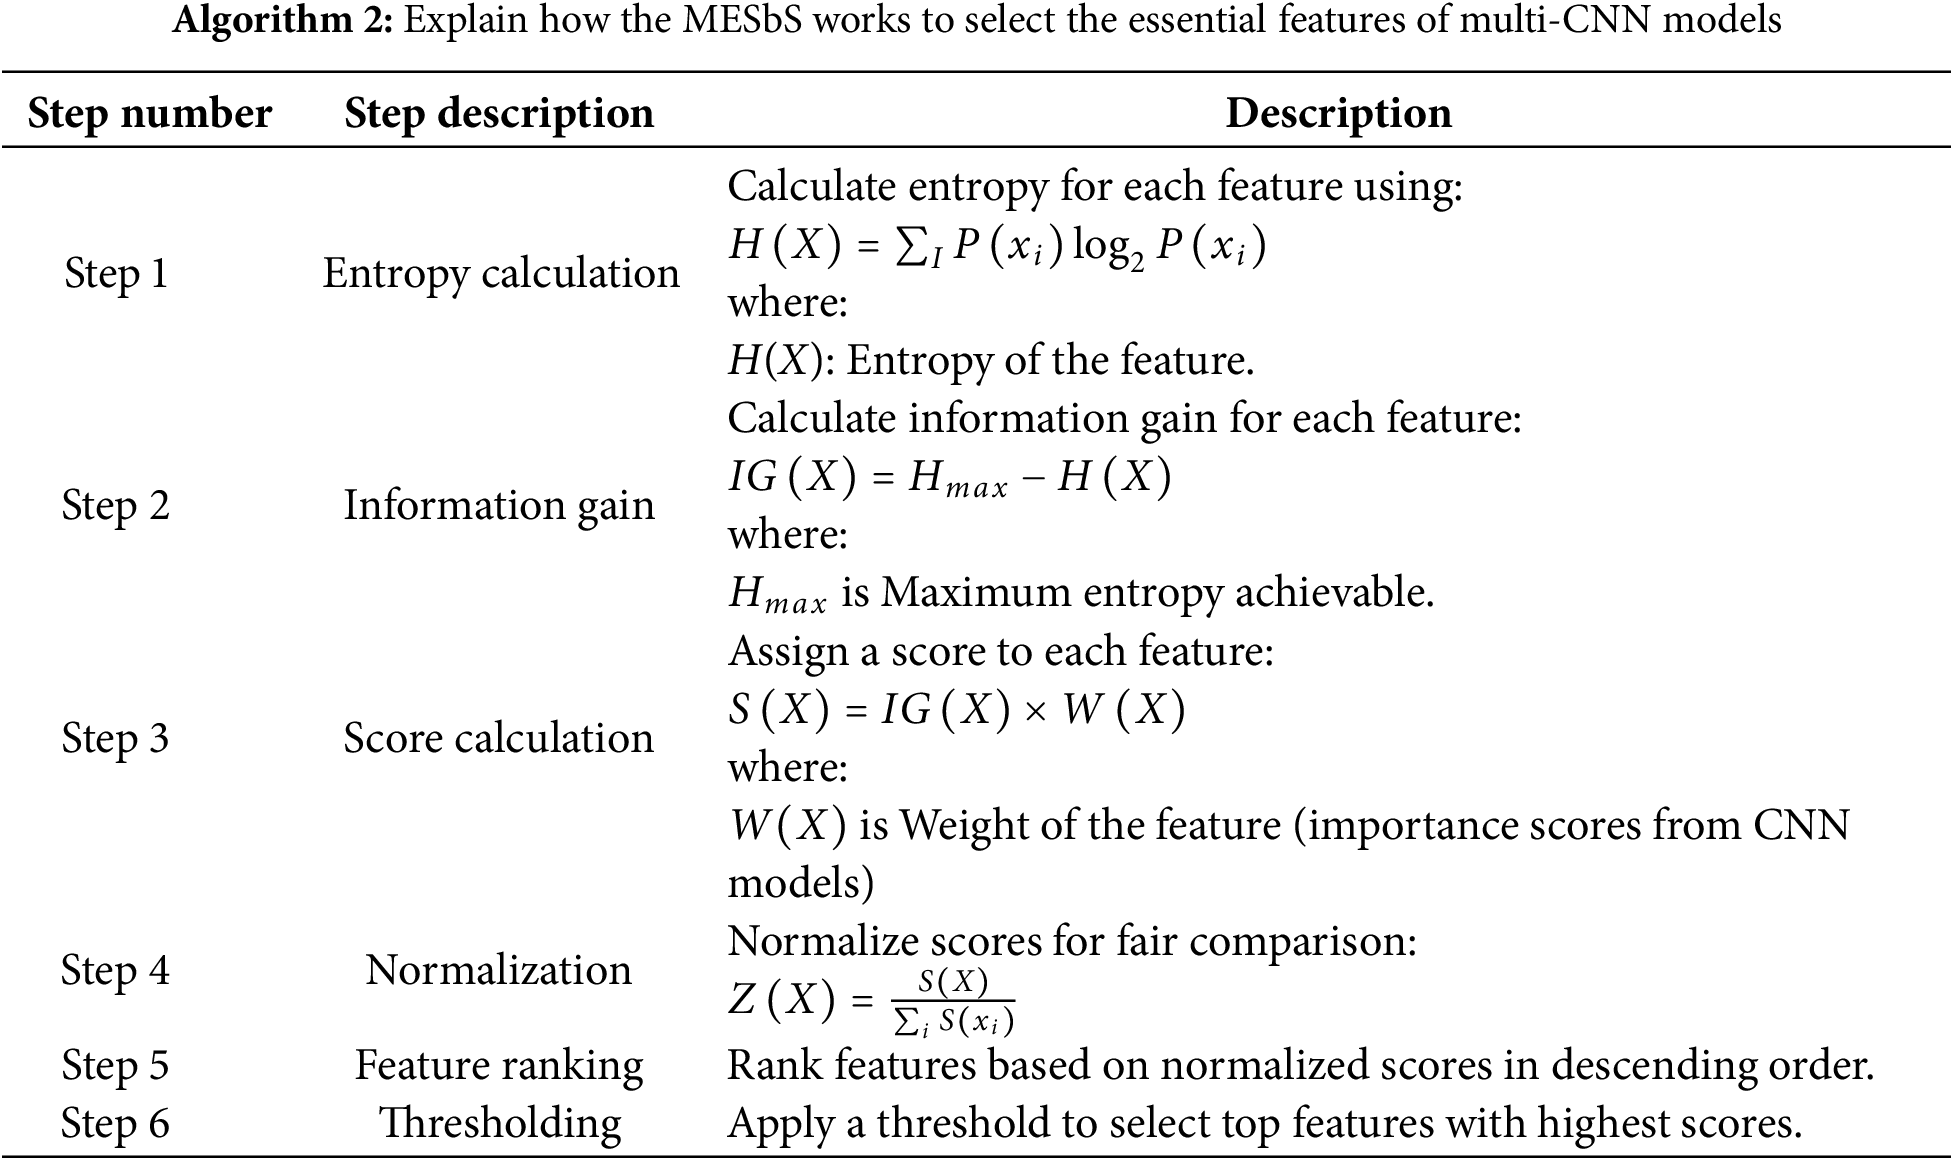
Feature Importance from CNN Models: Each CNN model (such as ResNet101, MobileNet, etc.) processes the input data and assigns importance scores to various features. These scores indicate how significant a particular feature is in contributing to the model’s decision-making process.
Integration into Score Calculation:
The importance scores W(X) obtained from the CNN models are multiplied by the Information Gain IG(X) of each feature. This multiplication is done to combine the relevant information provided by the CNN models with the statistical significance of the features (measured by Information Gain).
S(X) is the final score for the feature, reflecting both its statistical importance (via Information Gain) and its relevance as judged by the CNN models.
Multiplying IG(X) by W(X), will effectively enhance the features that are both statistically significant and highly valued by the CNN models, ensuring that these features are prioritized in the subsequent steps of the algorithm.
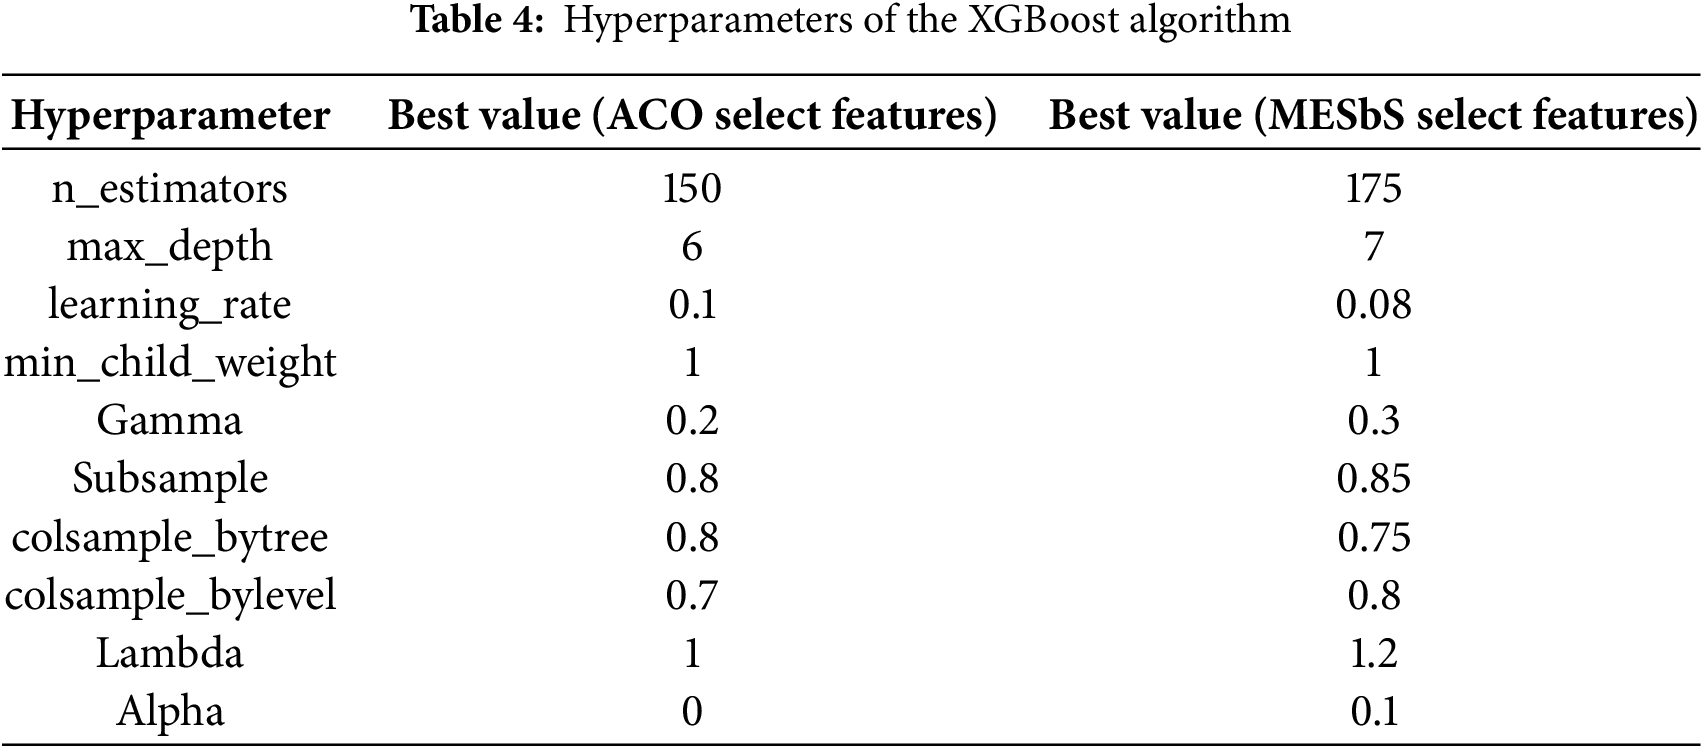
XGBoost is a powerful and versatile ML algorithm that belongs to ensemble learning methods, specifically boosting algorithms. The XGBoost classifier receives features from multi-CNN models after feature selection using ACO and MESbS algorithms. Ensemble learning involves combining the predictions of multiple base learners to improve overall model performance [43]. XGBoost primarily uses decision trees as base learners. Decision trees are simple models that make decisions based on input features. In the context of XGBoost, these are referred to as weak learners. The boosting involves training weak learners sequentially, with each subsequent learner correcting the errors made by the previous ones. XGBoost builds a series of decision trees, and each new tree focuses on the mistakes of the previous ensemble. Trees are constructed using a process called pruning, where the tree is simplified to capture the most significant patterns. XGBoost measures the importance of features based on how frequently features are used in decision trees. The XGBoost classifier becomes a robust and accurate model, combining the strengths of ensemble learning with the feature selection capabilities of ACO and MESbS.
Table 4 displays the important hyperparameters of the XGBoost algorithm with the best values selected for the two cases:
3.8 Model Training and Computational Setup
The experiments were done on a laptop with the following specifications: Processor: Intel Core i5, 7th, RAM: 12 GB, and GPU: 940MX.
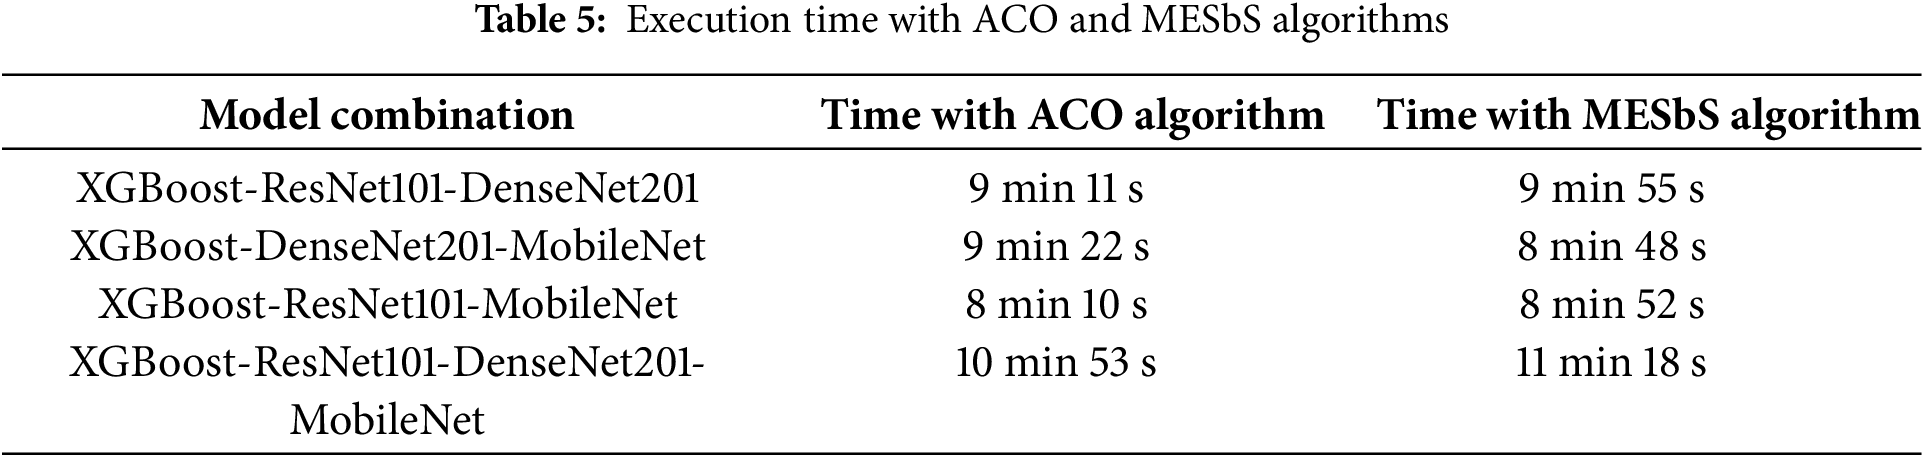
In this proposed system, CNNs are utilized exclusively for feature extraction, without performing classification, which significantly reduces computational overhead. The classification algorithm handles the XGBoost step, which is computationally efficient and optimized for structured data. This distinction minimizes the need for extensive processing within the CNN models beyond feature extraction, thereby reducing overall execution time. The execution time recorded is during the training phase, where the weights are updated and the model performance is evaluated repeatedly over multiple epochs. Table 5 shows the execution time during the training phase, as it represents the time required to train different models using different algorithms.
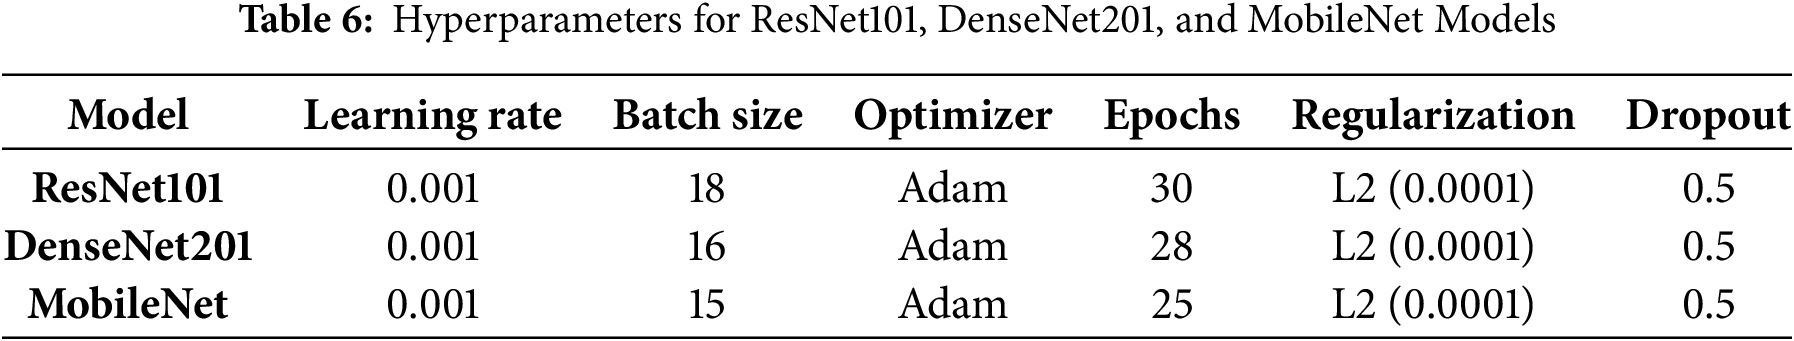
The ResNet101, DenseNet201, and MobileNet models were fine-tuned on the MS dataset. The hyperparameters used during fine-tuning, including learning rate, batch size, optimizer, number of epochs, regularization technique, and dropout rate, are detailed in Table 6 of this study. These models were also utilized for deep feature extraction, where pre-trained weights were leveraged to extract meaningful representations from the MRI images. This dual approach—fine-tuning and deep feature extraction—was adopted to optimize model performance while preserving robust feature representations.
4 Results of the Proposed System
4.1 Evaluating Proposed Systems
The confusion matrix and Area Under Curve (AUC) are a cornerstone in evaluating the performance of hybrid systems, which combine the XGBoost classifier with features extracted from multi-CNN models based on feature selection algorithms for the early classification of MS. The importance of the confusion matrix lies in its ability to provide a detailed analysis of the model’s classification results, particularly in this study involving binary-class (MS vs. Health) and multi-class (Control-Axial, Control-Sagittal, MS-Axial, and MS-Sagittal) classifications. The confusion matrix comprises four components: TP, TN, FP and FN. TP/TN indicate cases correctly predicted as MS/healthy. FP is healthy but falsely predicted as MS. FN is MS but falsely predicted as healthy. This analysis provides accuracy about the evaluation metrics shown in Eqs. (14)–(18). The multi-class confusion matrix generalizes this evaluation across fine-grained axial/sagittal subclasses, providing a more nuanced assessment of model strengths, limitations and suitability for clinical.
4.2 Results of Pre-Trained CNN
This section presents the results of three models, ResNet101, DenseNet201, and MobileNet, all pre-trained on the ImageNet dataset. ImageNet, with over 1.2 million images covering over 1000 categories, is a powerful general-purpose image recognition standard. It is worth noting that medical images are absent, especially brain MRI images of MS, in the ImageNet dataset. While these pre-trained models show proficiency in tasks unrelated to medical imaging, their benefit lies in their ability to transfer learning. Transfer learning enables models to leverage knowledge gained from classifying ImageNet to perform new tasks effectively, such as classification on an MS dataset. The initial layers of these models, responsible for detecting global features such as edges and textures, are retained, while subsequent fully connected layers are retrained on the MS dataset. The MRI images of the MS dataset serve as input and undergo feature extraction through convolutional and pooling layers. Subsequent retraining of the fully connected layers involves adapting the model to the feature complexities of the MS, which facilitates the classification of the extracted features into their correct classes.
Regarding the classification of MS through MRI, using pre-trained models, namely ResNet101, DenseNet201, and MobileNet, demonstrated less efficiency compared to the hybrid systems in this study. Table 7 and Fig. 4 show the results of the pre-trained on the multi-class dataset. The ResNet101 model reached an AUC of 90.05%, sensitivity of 89.75%, accuracy of 89.6%, precision of 89.3%, and specificity of 89.33%. The DenseNet201 model achieved an AUC of 89.9%, sensitivity of 90.5%, accuracy of 90.9%, precision of 90.83%, and specificity of 96.63%. Notably, the MobileNet model surpassed both, attaining an AUC of 91.2%, sensitivity of 92.23%, accuracy of 92.8%, precision of 92.65%, and specificity of 97.53%.
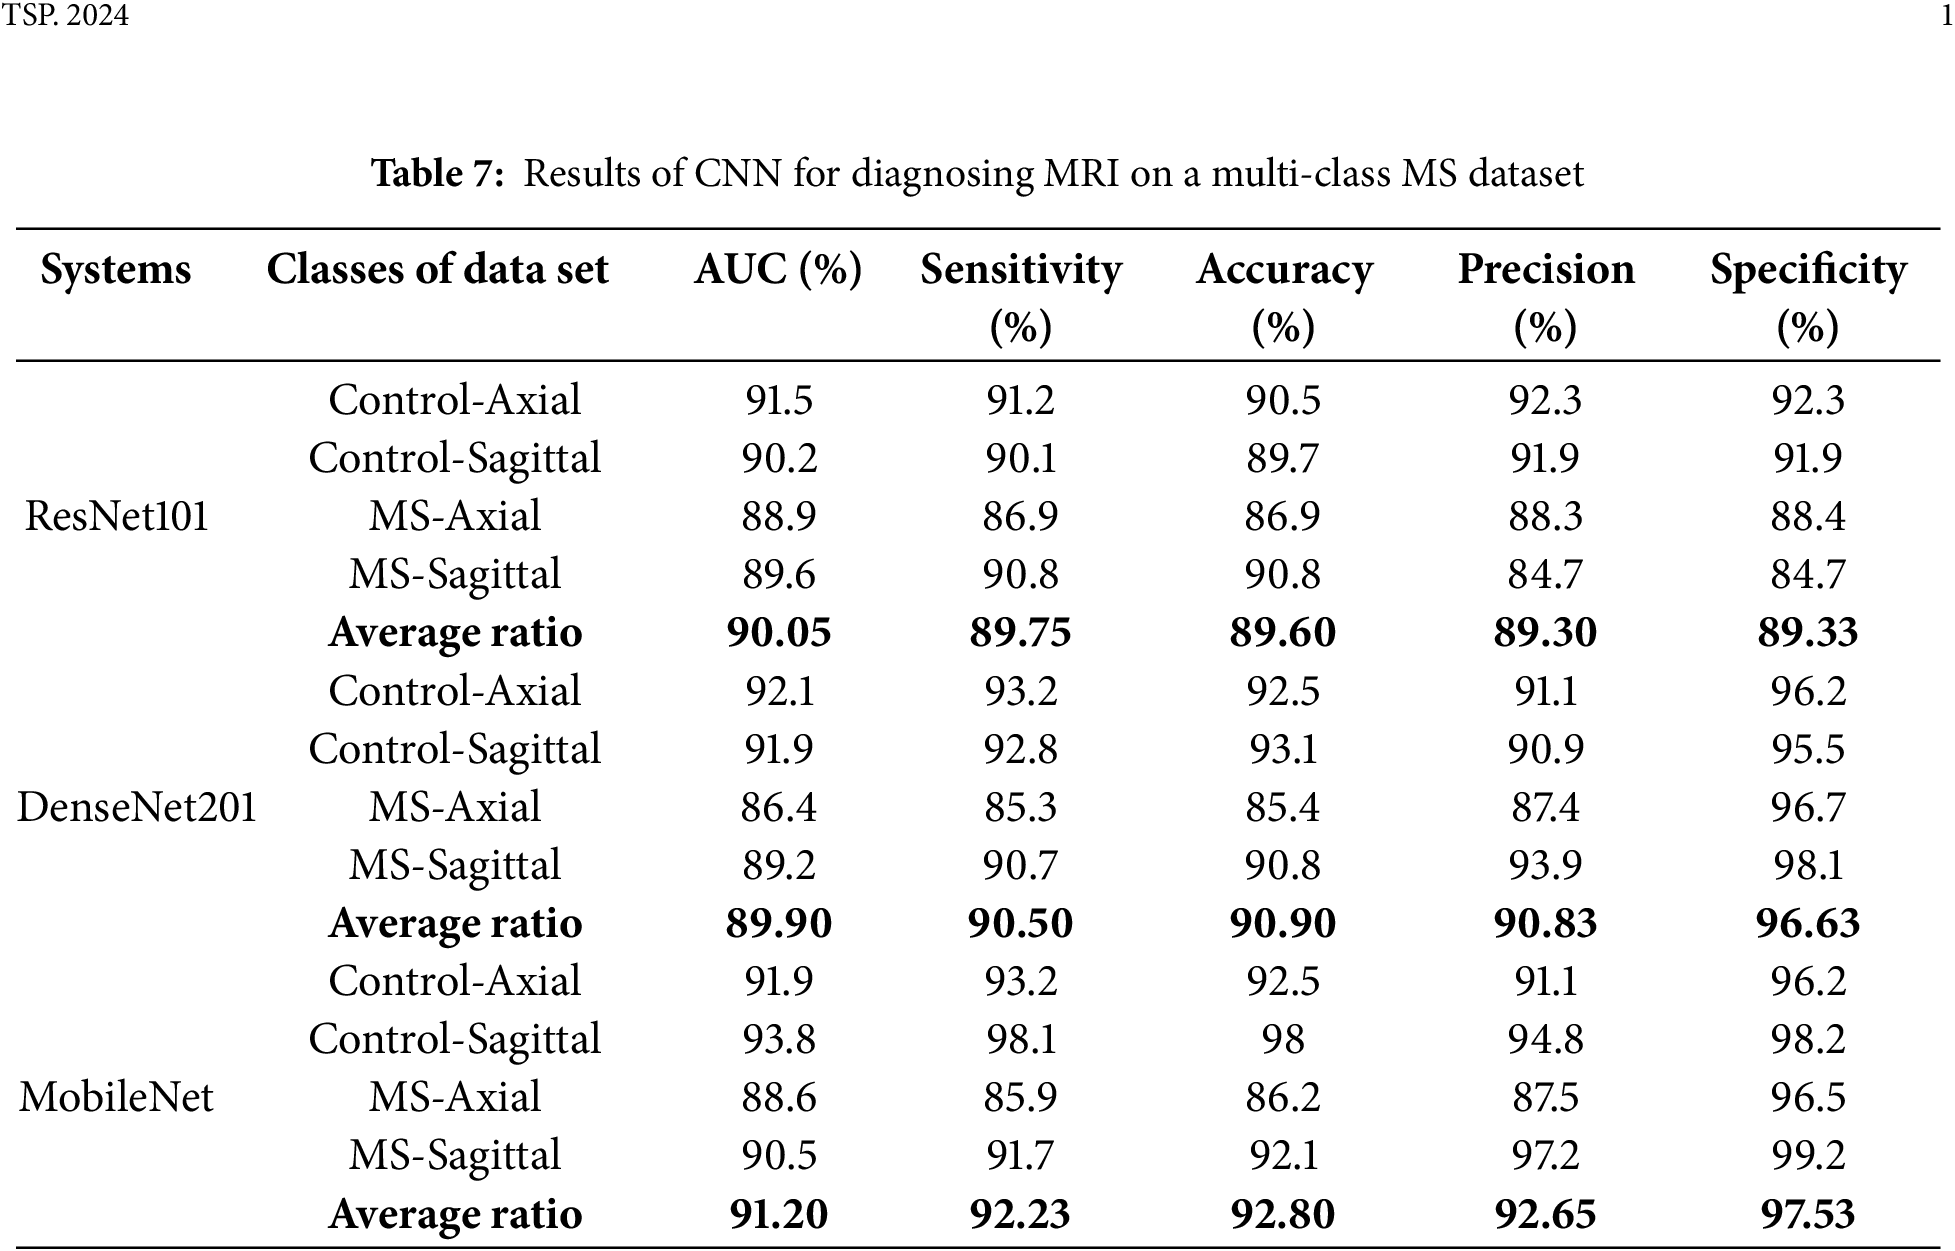
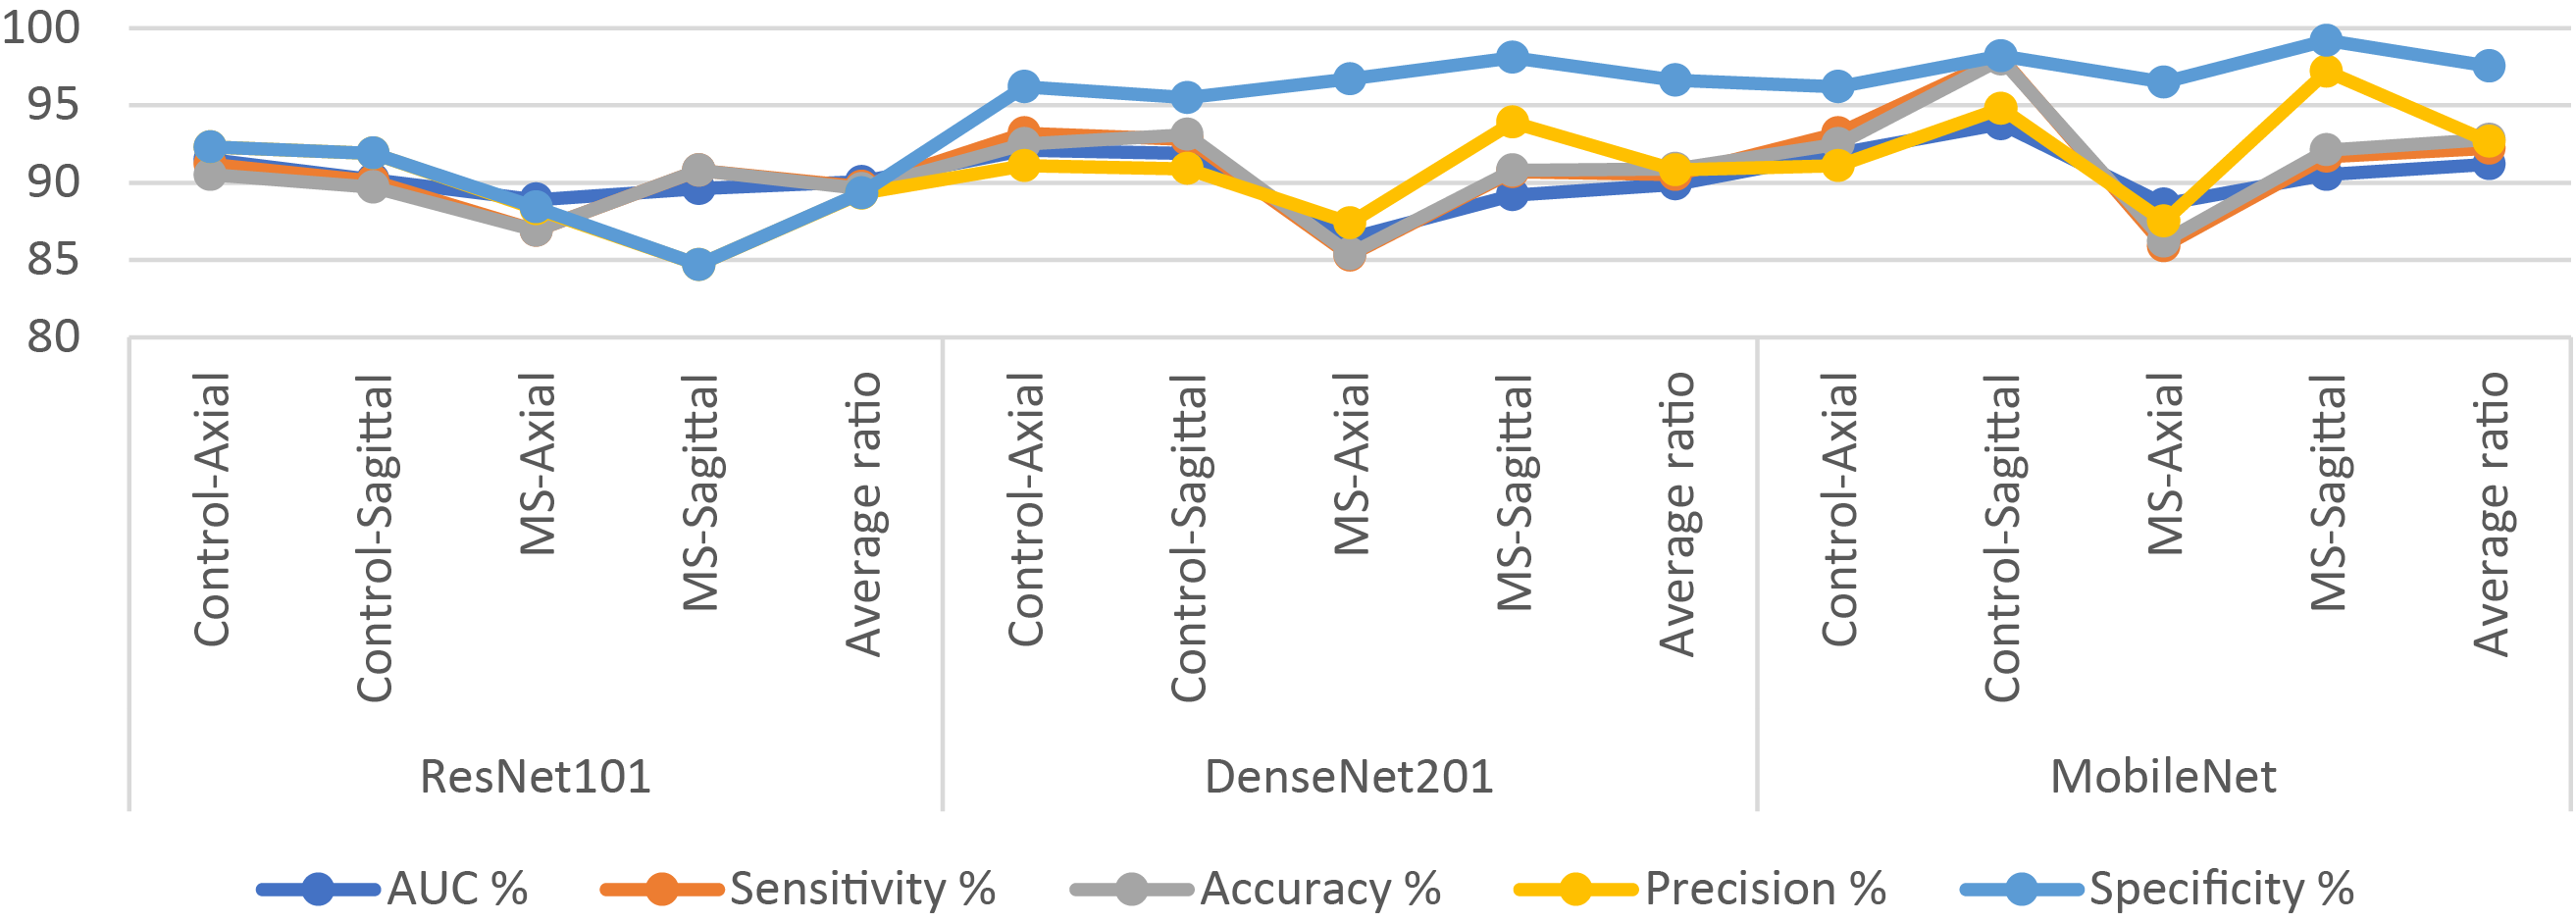
Figure 4: Display of results of CNN models for diagnosing images on a multi-class MS dataset
The results of ResNet101, DenseNet201, and MobileNet, on a binary class dataset, are presented in Table 8 and Fig. 5, facilitating a thorough scientific analysis and comparison. The ResNet101 model reached an AUC of 92.3%, sensitivity of 92.25%, accuracy of 92.1%, precision of 91.8%, and specificity of 92%. In contrast, the DenseNet201 model demonstrated superior performance, achieving an AUC of 92.8%, sensitivity of 91.95%, accuracy of 92.6%, precision of 92.35%, and specificity of 92.3%. The MobileNet model attained an AUC of 92.55%, sensitivity of 93.3%, accuracy of 93.3%, precision of 92.85%, and specificity of 93.55%.
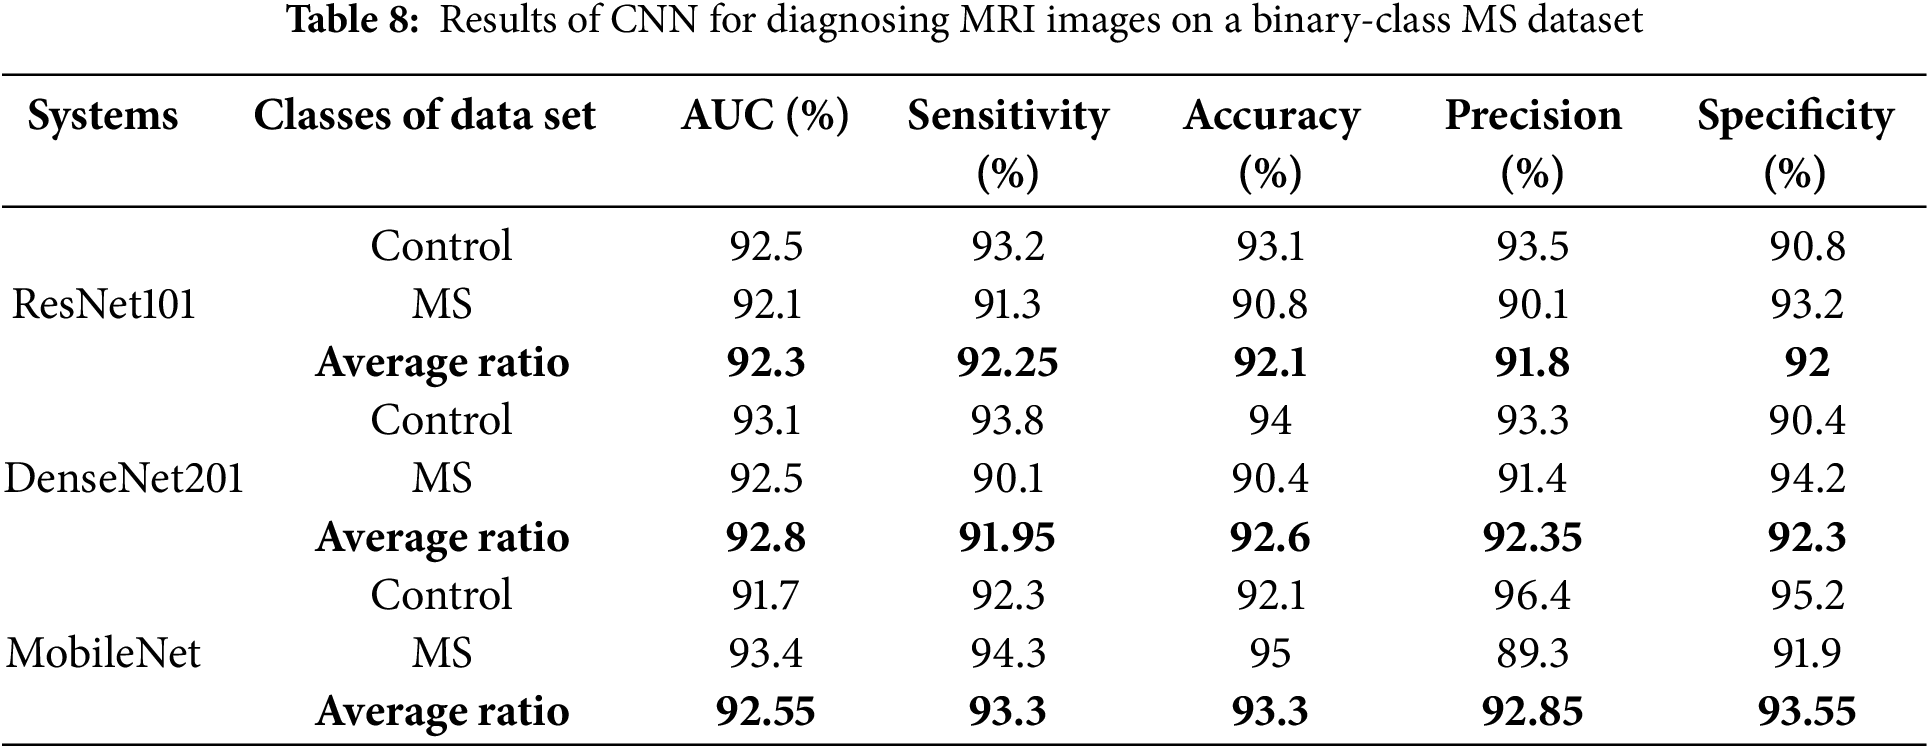
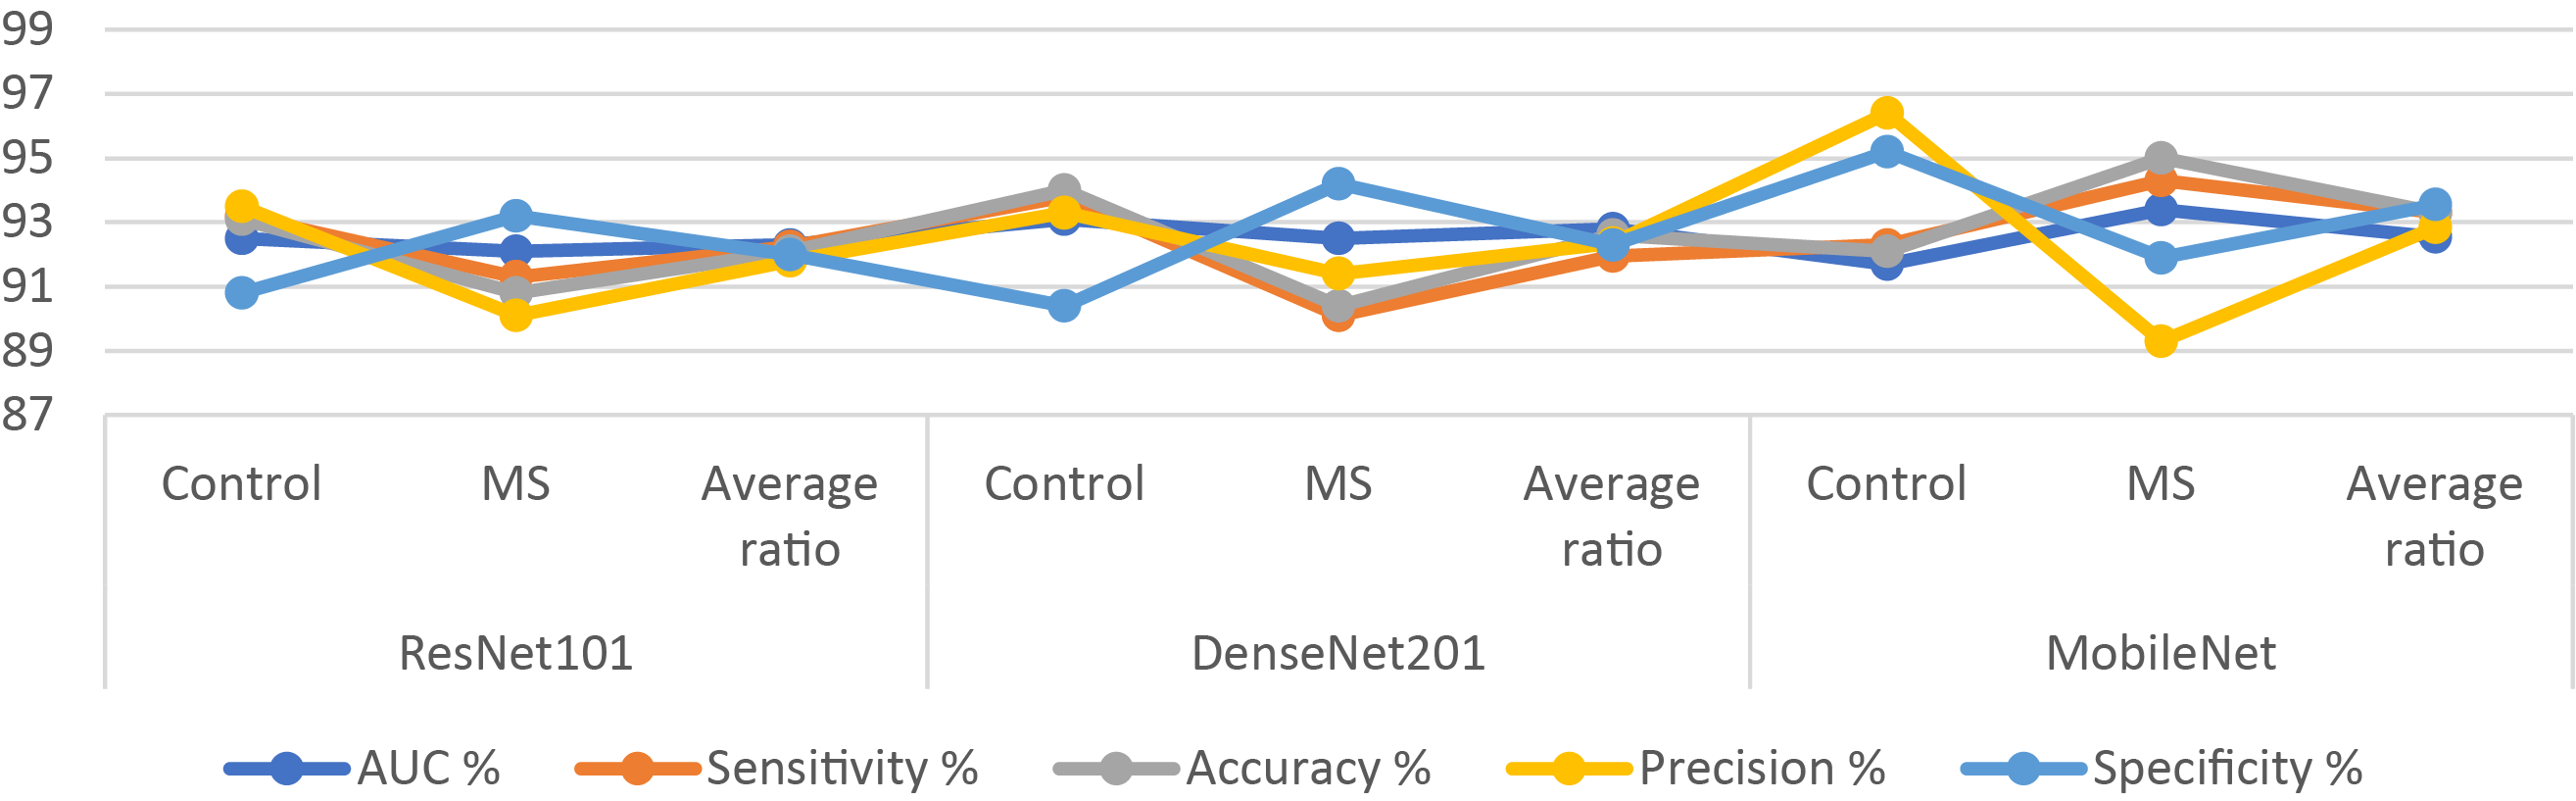
Figure 5: Display of results of CNN models for diagnosing MRI on a binary-class MS dataset
4.3 Results of XG Boost with Fusion CNN Features Based on ACO Algorithm
The section shows the results of a hybrid system proposed by XGBoost with fused features of CNN models (ResNet101, DenseNet201, and MobileNet) with the ACO algorithm for early classification of MS patients. CNN models are fed with segmented MRI images to extract the feature. Features of several CNNs (ResNet101-DenseNet201, DenseNet201-MobileNet, ResNet101-MobileNet, and ResNet101-DenseNet201-MobileNet) are combined and preserved into feature vectors. The ACO algorithm was applied to retain essential features and delete redundant and unimportant features. Important features are sent to the XGBoost classifier for training and performance testing.
Table 9 and Fig. 6 provide a deep analysis of the outcomes for hybrid systems, combining the multi-feature CNN with XGBoost with the ACO algorithm for the early classification of a multi-class dataset of MS. The ResNet101-DenseNet201-XGBoost model showcased robust metrics, achieving an AUC of 96.23%. Notably, it showed a high sensitivity of 96.93%, specificity of 98.93%, accuracy of 97.2%, and precision of 97.15%. The DenseNet201-MobileNet-XGBoost model reached promising results with an AUC of 98.25% and excellent sensitivity of 98.68%, accuracy of 98.8%, precision of 98.93%, and specificity of 99.3%. The ResNet101-MobileNet-XGBoost model displayed vital performance, achieving an AUC of 97.7%, accuracy of 98%, precision of 97.83%, sensitivity of 98.03%, and specificity of 99.1%. However, the ResNet101-DenseNet201-MobileNet-XGBoost model outperformed all others, attaining an AUC of 99.05%. This model showed exceptional sensitivity of 99.23%, accuracy of 99.4%, precision of 99.45%, and specificity of 99.75%. The ResNet101-DenseNet201-MobileNet-XGBoost model emerged as the superior system, exhibiting outstanding diagnostic performance across all metrics for early MS classification in a multi-class dataset, utilizing the ACO method.
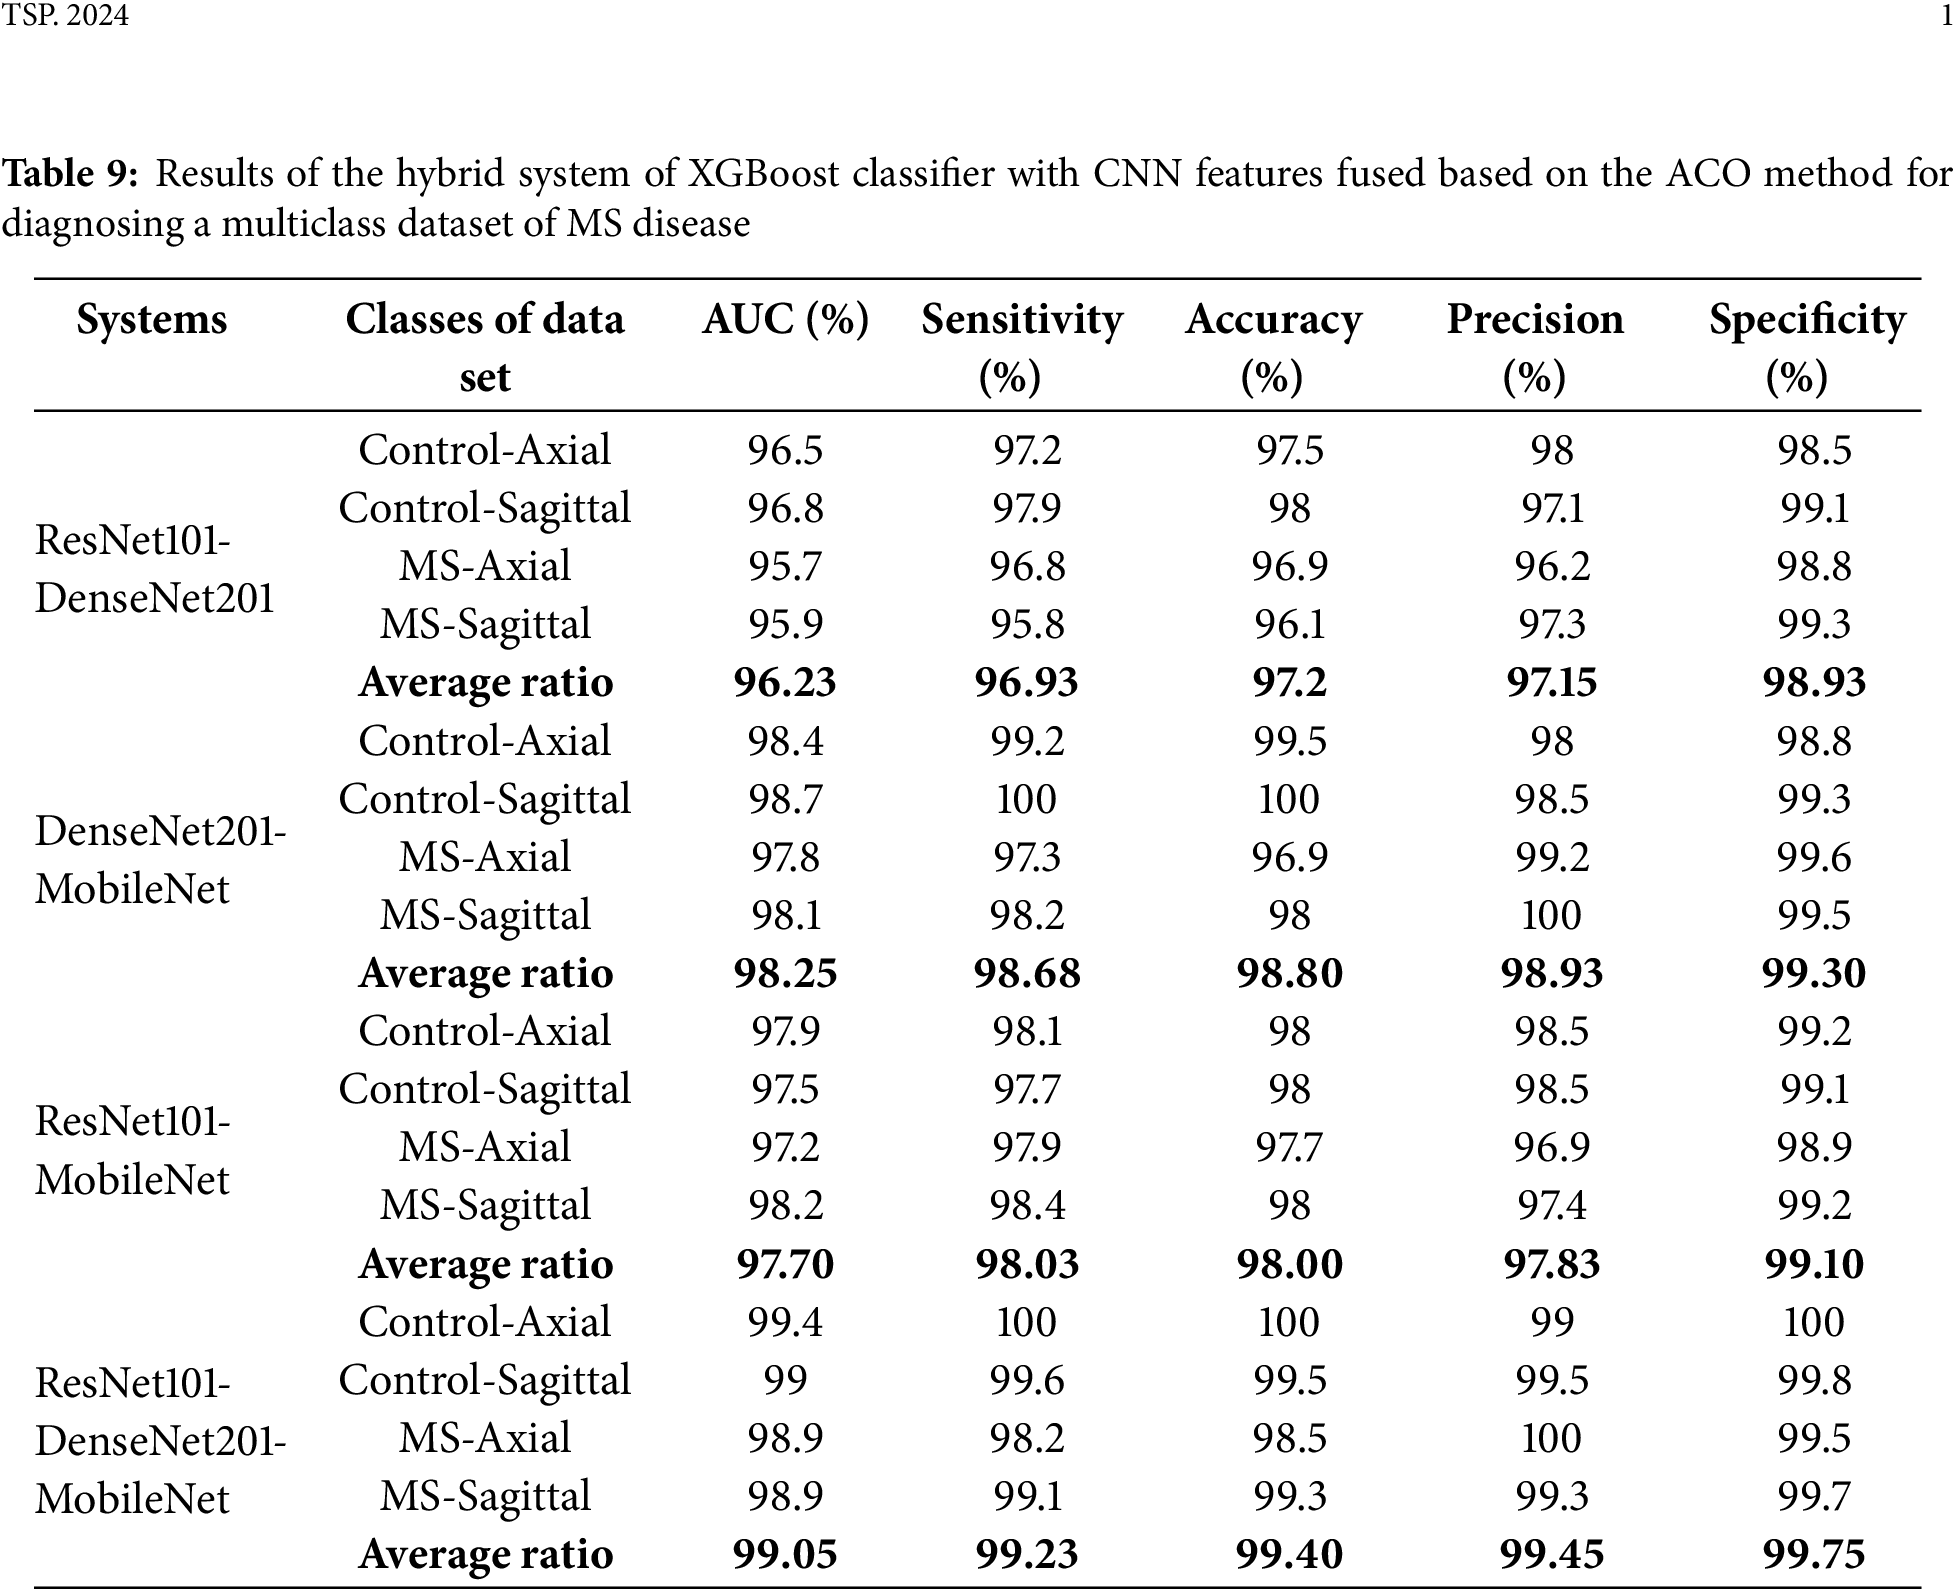
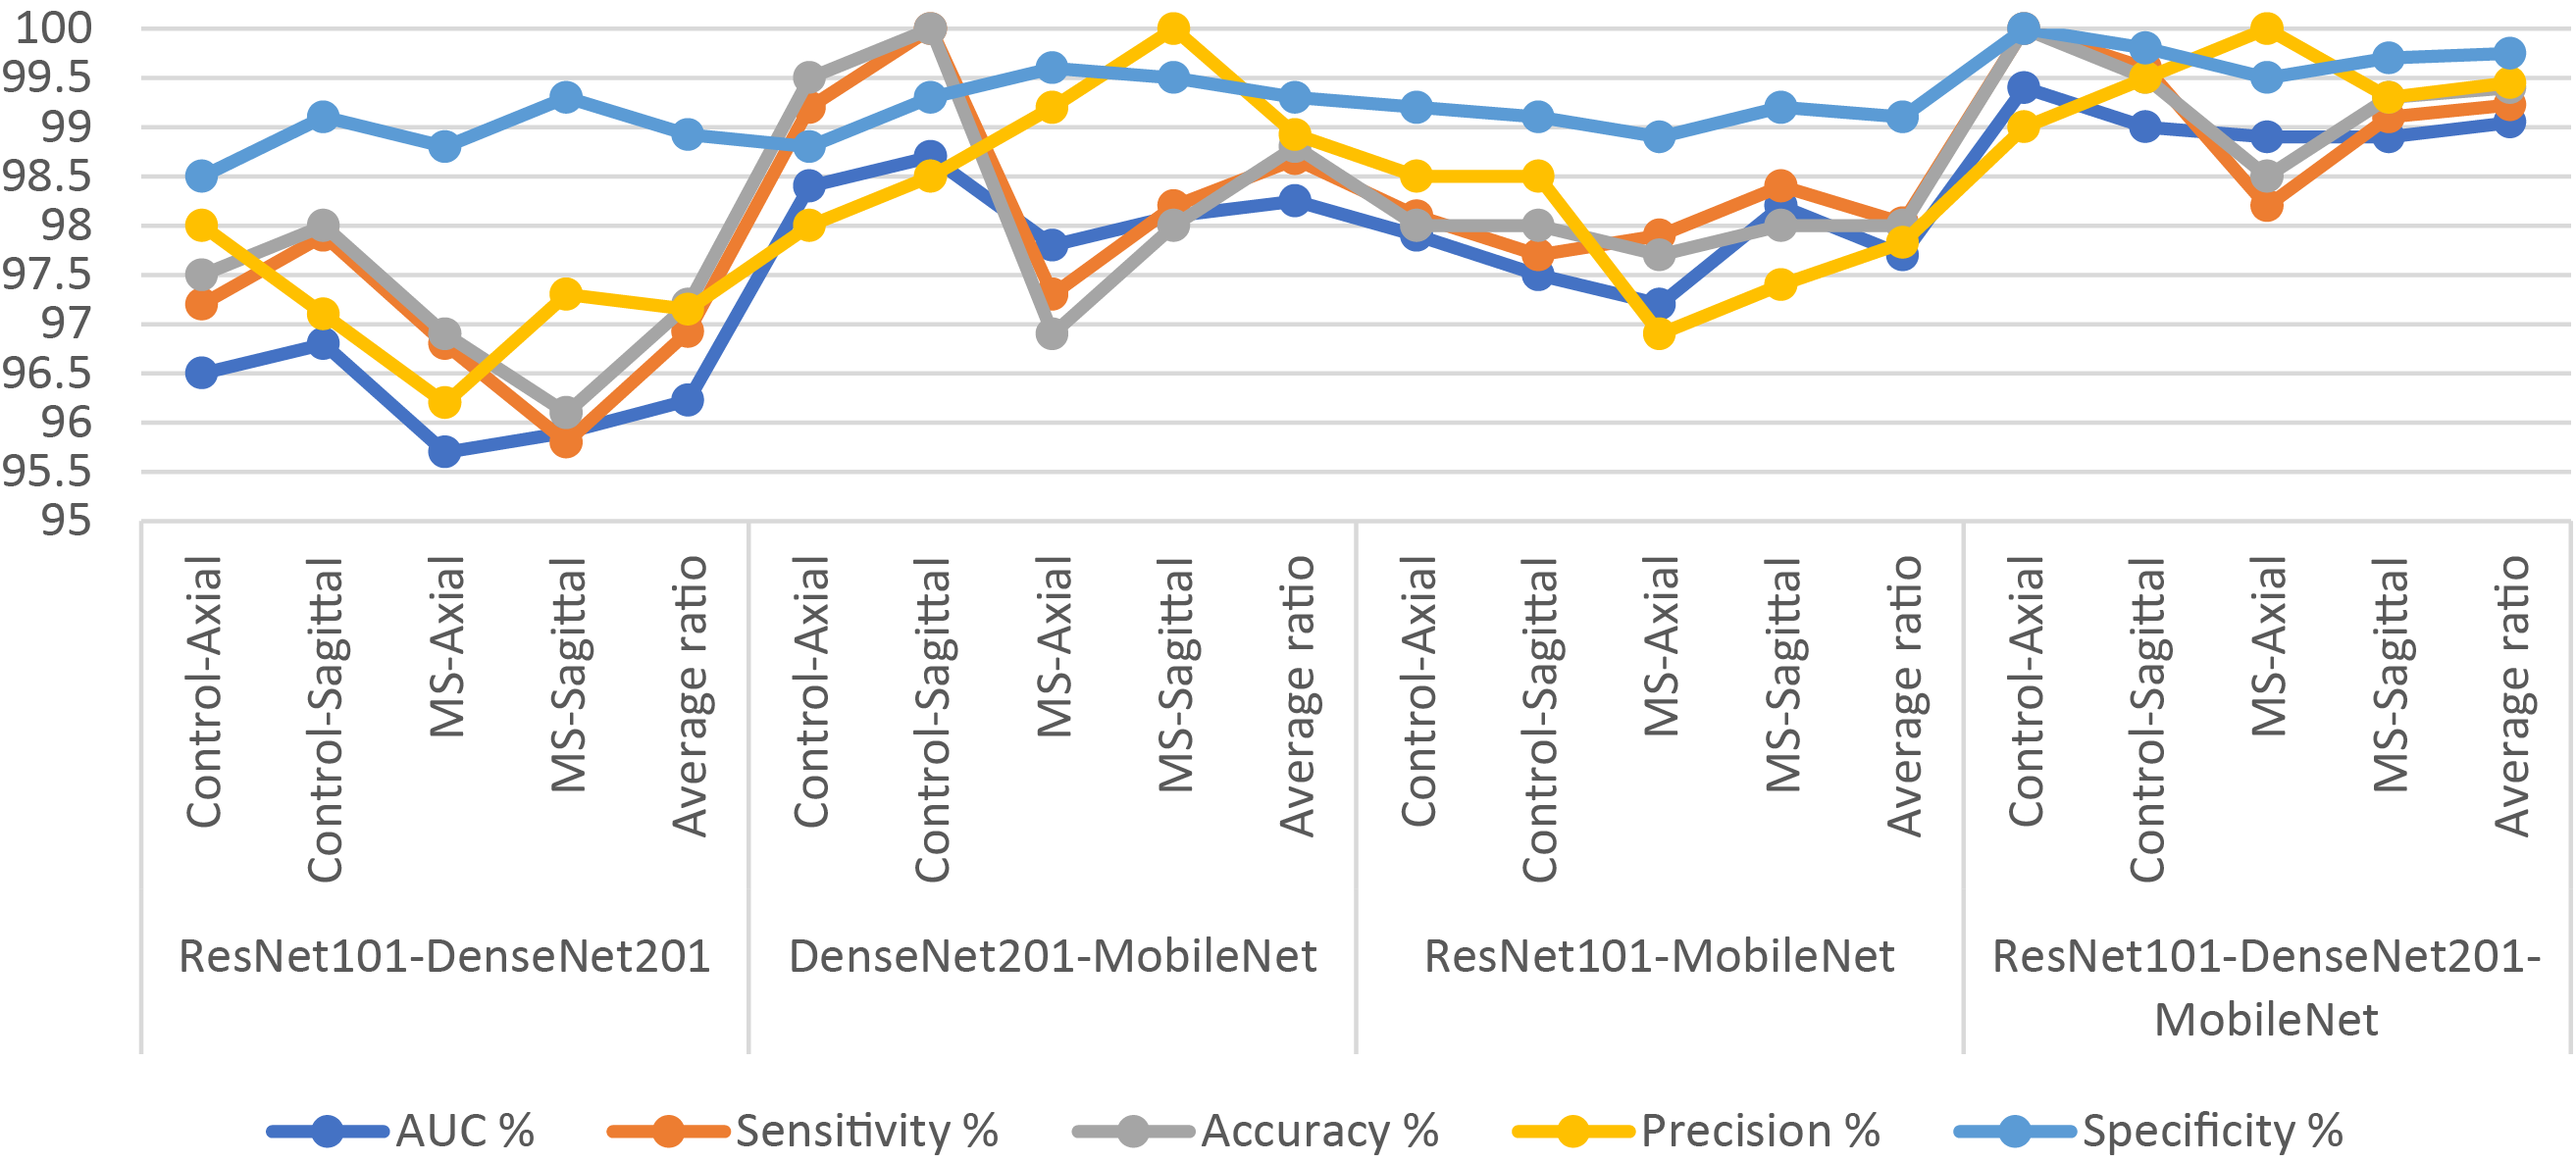
Figure 6: Display of results of the hybrid system of XGBoost classifier with CNN features fused based on the ACO algorithm for diagnosing a multiclass dataset of MS disease
Fig. 7 represents the training and testing curves of the proposed XGBoost with Fusion CNN Features Based on the ACO Algorithm for the multiclass MS dataset.
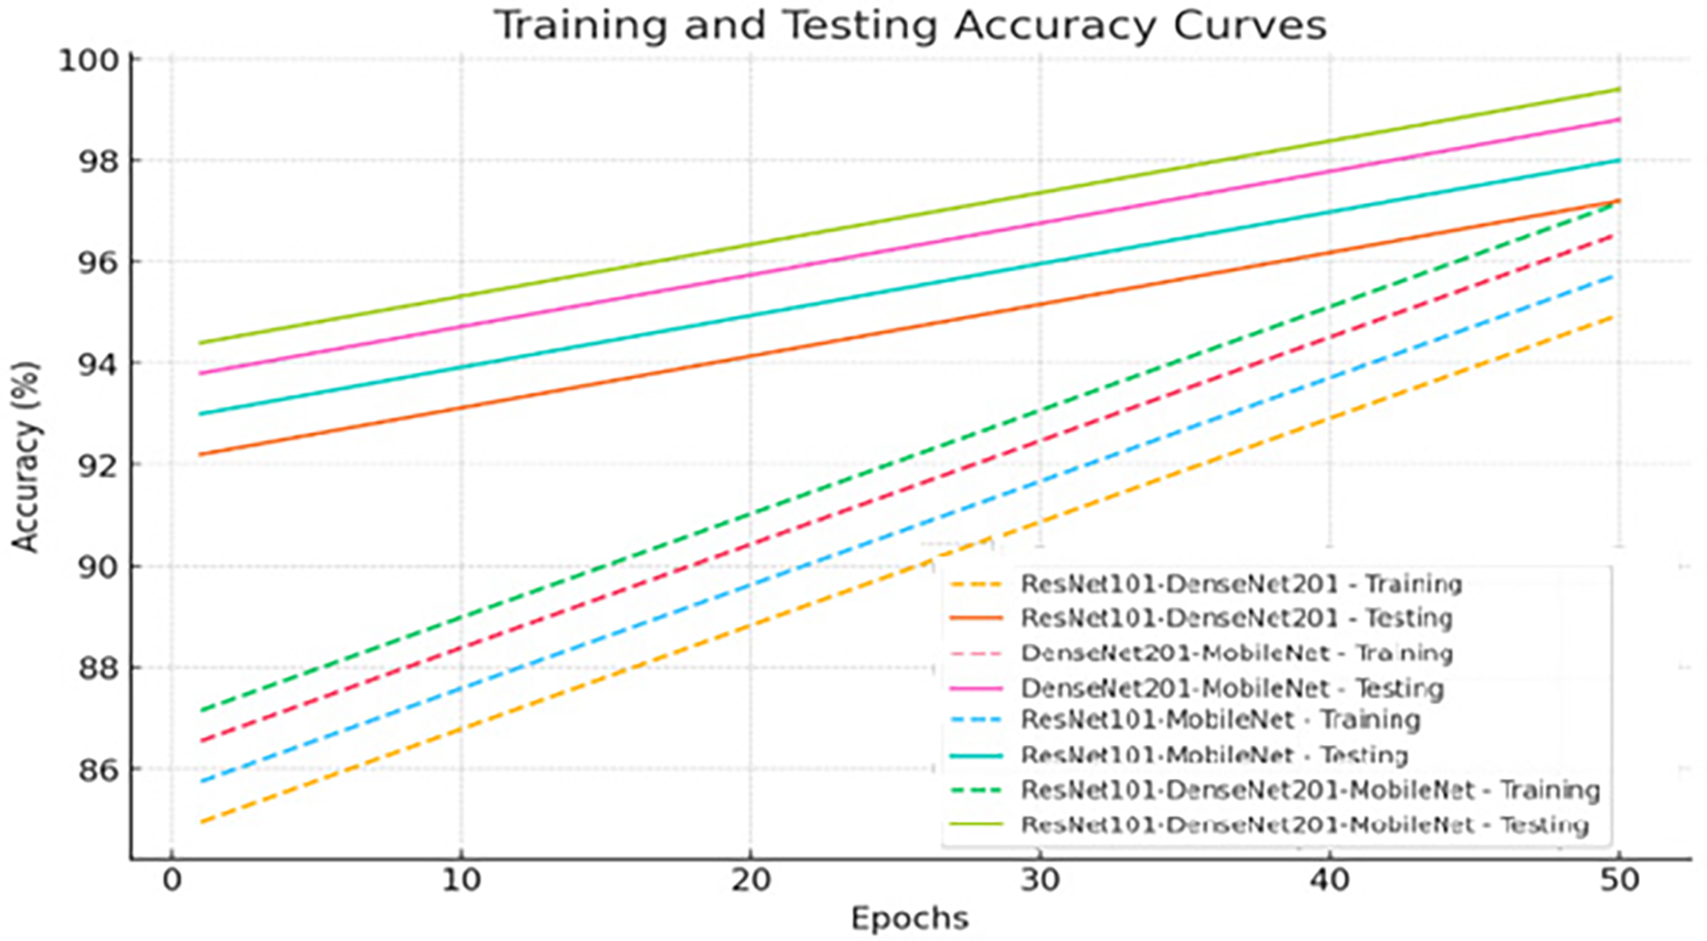
Figure 7: Training and testing curve for the XGBoost with Fusion CNN Features Based on the ACO
Fig. 8 illustrates the confusion matrix of XGBoost-multi-CNN models, based on the ACO to detect MS early within a multi-class dataset. The assessment delves into the accuracy of each class, unveiling distinct performances across various hybrid systems. The ResNet101-DenseNet201-XGBoost model showed promising accuracy, reaching 97.5% for Control-Axial, 98% for Control-Sagittal, 96.9% for MS-Axial, and 96.1% for MS-Sagittal. However, the DenseNet201-MobileNet-XGBoost model exhibited superior performance, achieving exceptional accuracy rates of 99.5%, 100%, 96.9%, and 98% for Control-Axial, Control-Sagittal, MS-Axial, and MS-Sagittal, respectively. The ResNet101-MobileNet-XGBoost showed robust accuracy, securing 98% for Control-Axial, 98% for Control-Sagittal, 97.7% for MS-Axial, and 98% for MS-Sagittal. Despite this, the ResNet101-DenseNet201-MobileNet-XGBoost model emerged as the top-performing system, achieving perfection in accuracy 100% for Control-Axial, 99.5% for Control-Sagittal, 98.5% for MS-Axial, and 99.3% for MS-Sagittal. The ResNet101-DenseNet201-MobileNet-XGBoost model showed superior accuracy across all classes, establishing itself as the most effective system for early MS detection in a multi-class dataset when leveraging the ACO method.
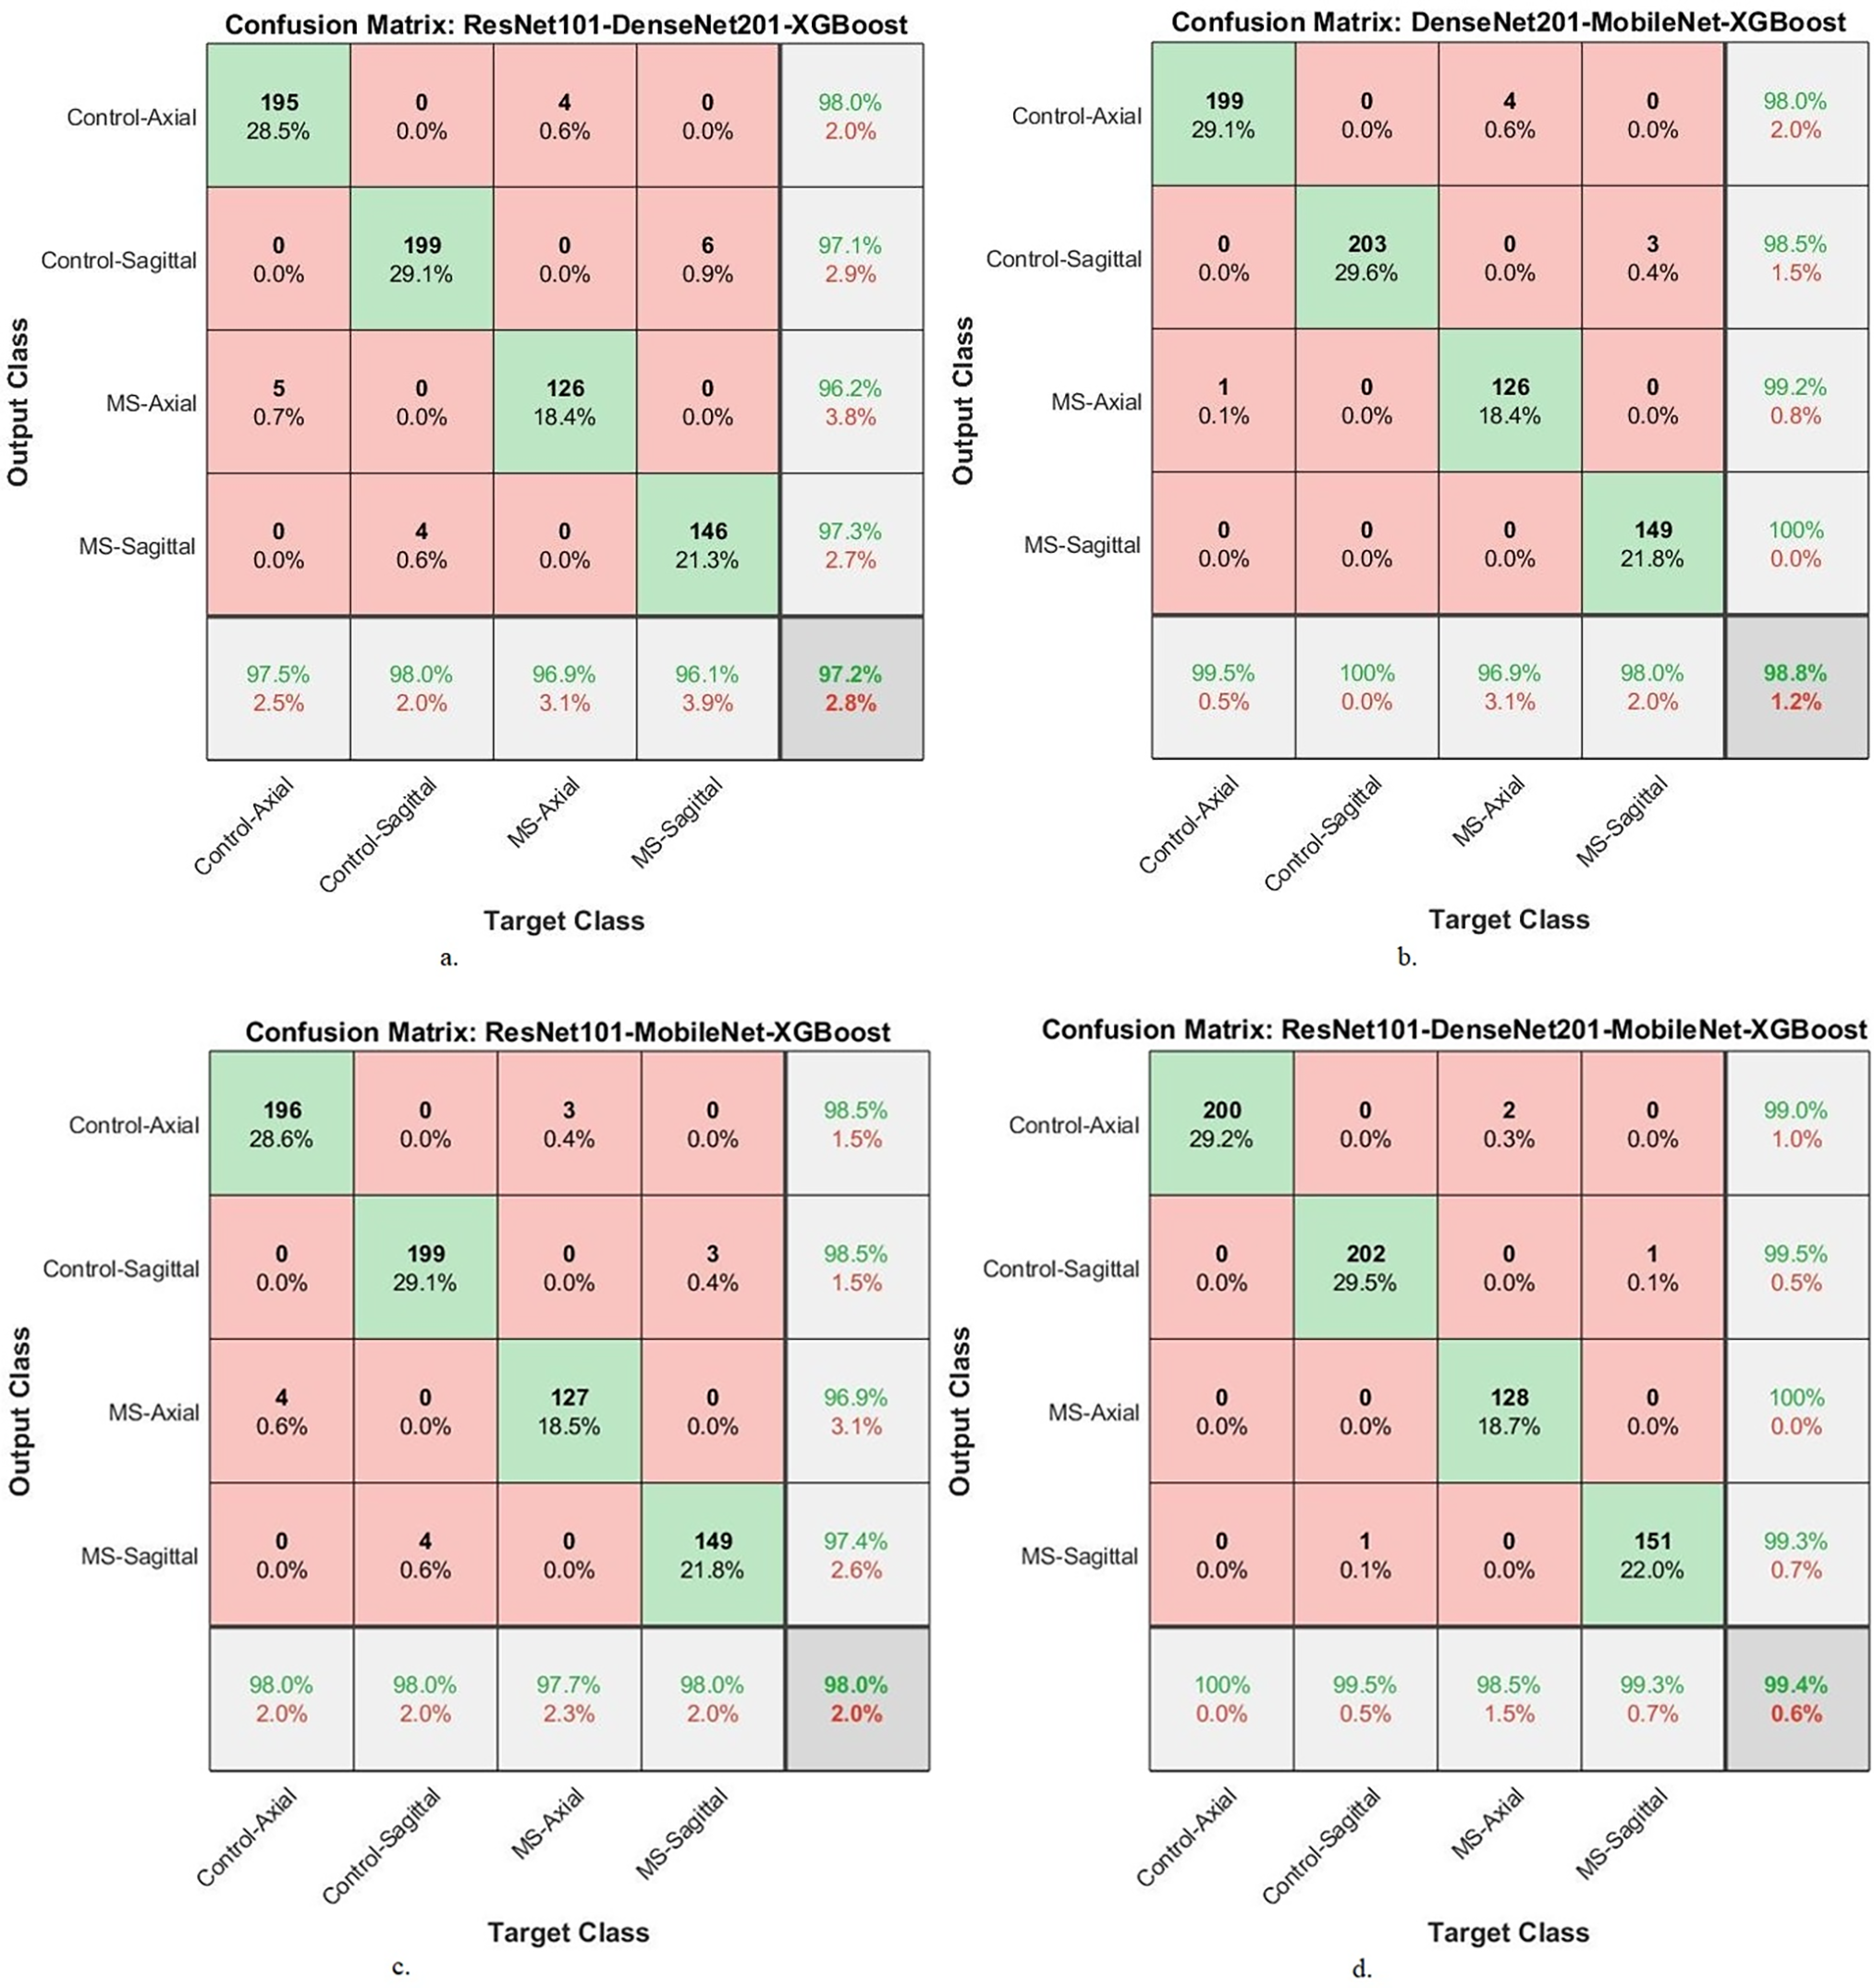
Figure 8: A confusion matrix of results of the hybrid system of XGBoost classifier with CNN features fused with ACO for diagnosing a multi-class dataset of MS disease
Table 10 and Fig. 9 show the performance results of the hybrid systems between the multi-feature CNN and XGBoost with ACO for early classification of a binary-class dataset of MS patients. The ResNet101-DenseNet201-XGBoost model achieved an AUC of 98%, sensitivity of 98.6%, accuracy of 98.1%, precision of 97.95%, and specificity of 98.6%. The DenseNet201-MobileNet-XGBoost model reached an AUC of 98.5%, sensitivity of 98.95%, accuracy of 99%, precision of 98.95%, and specificity of 99.15%. The ResNet101-MobileNet-XGBoost model achieved an AUC of 98.2%, sensitivity of 98.75%, accuracy of 98.4%, precision of 98.25%, and specificity of 99.05%. The ResNet101-DenseNet201-MobileNet-XGBoost model achieved an AUC of 99.3%, sensitivity of 99.5%, accuracy of 99.6%, precision of 99.65%, and specificity of 99.55%.
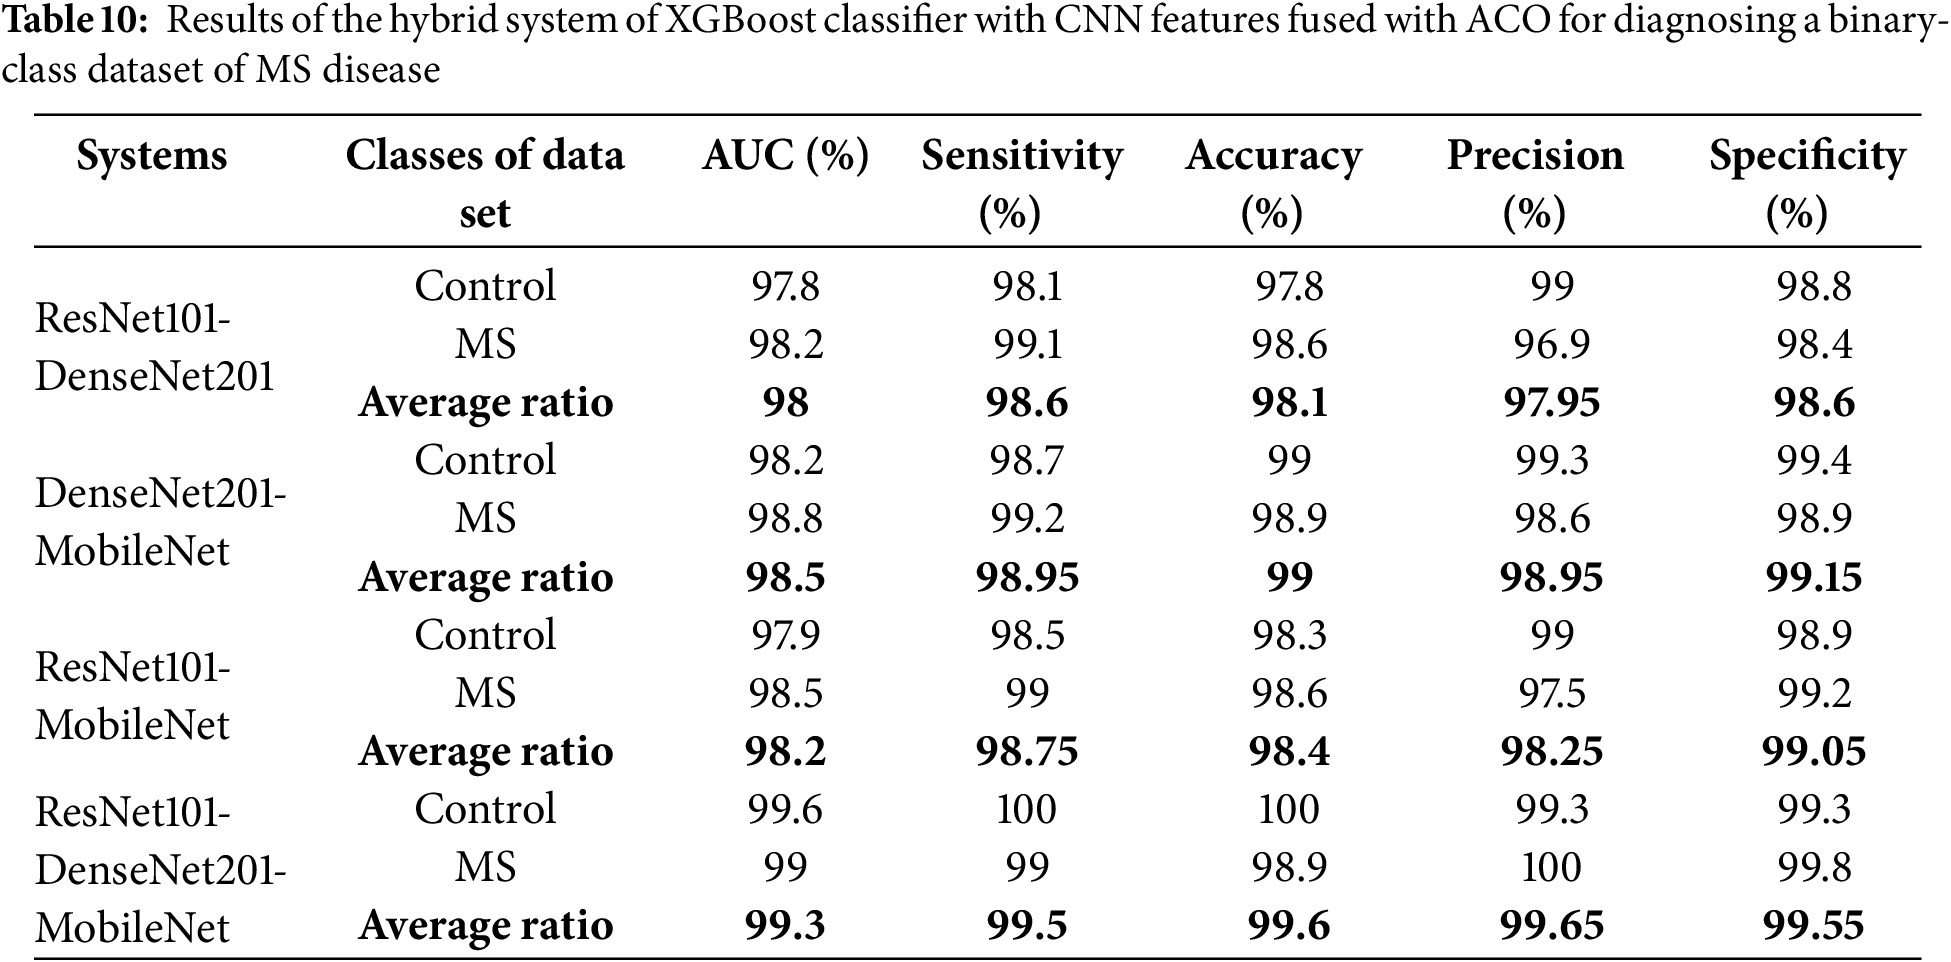
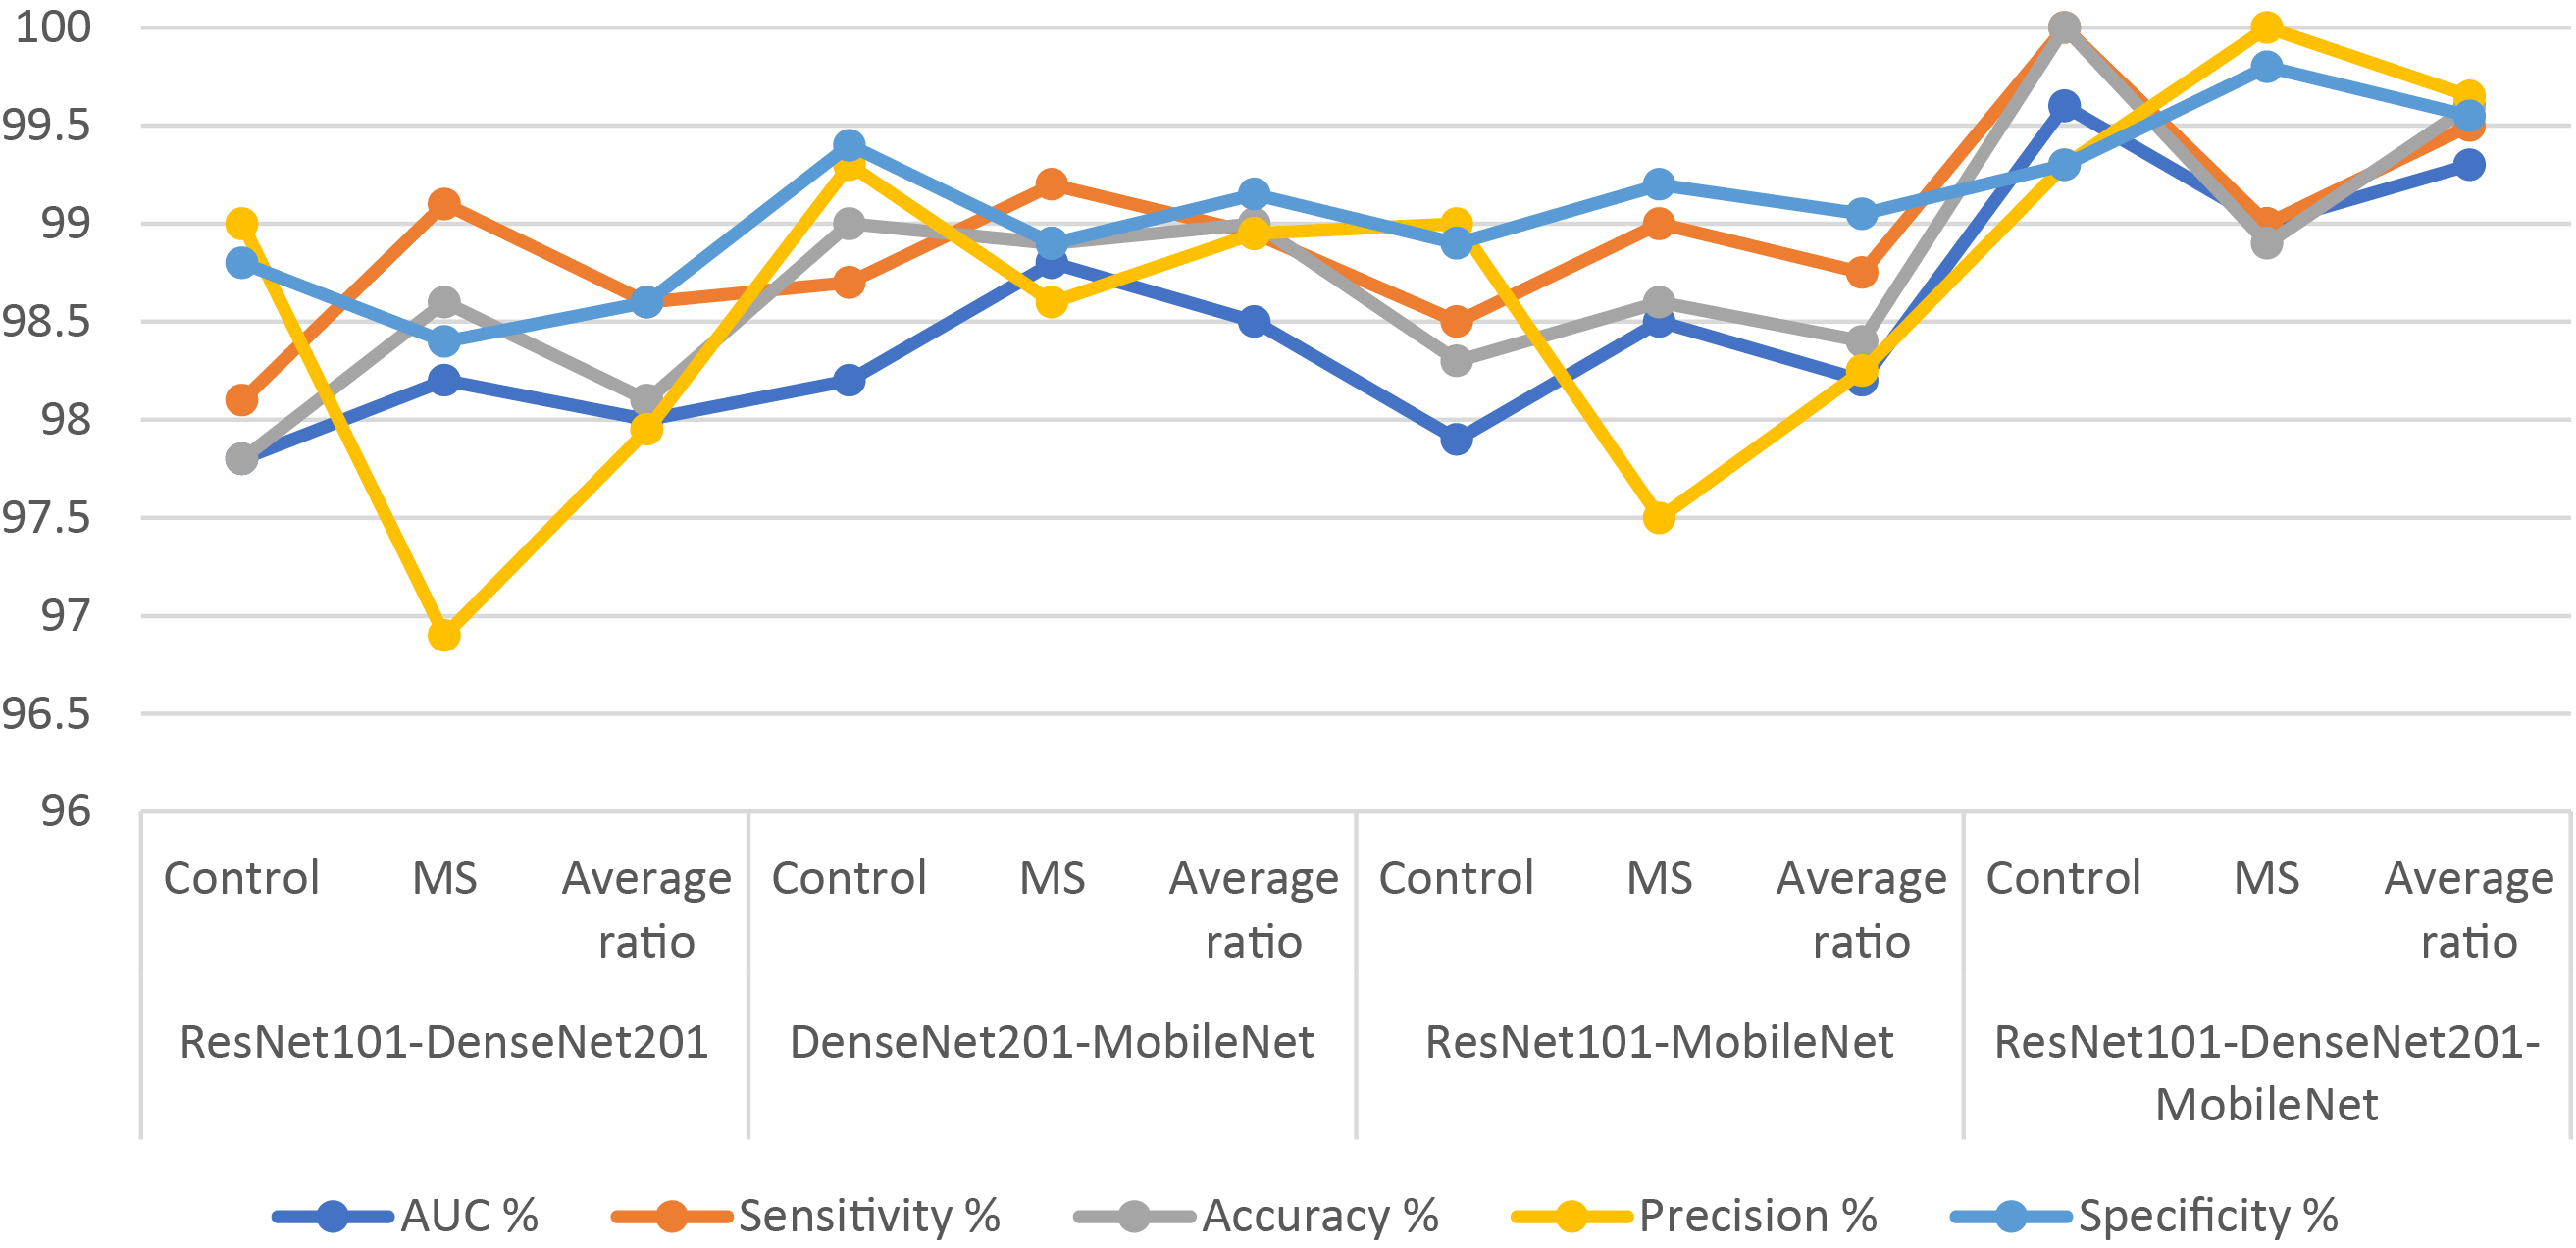
Figure 9: Display of results of the hybrid system of XGBoost classifier with CNN features fused with ACO algorithm for diagnosing a binary-class dataset of MS disease
Fig. 10 presents the confusion matrix of XGBoost-multi-CNN models, based on the ACO algorithm for the early detection of MS within a binary-class dataset. The ResNet101-DenseNet201-XGBoost model showed significant accuracy, achieving 97.8% for the Control class and 98.6% for the MS class. Meanwhile, the model of DenseNet201-MobileNet-XGBoost surpassed expectations, attaining exceptional accuracy rates of 99% for the Control class and 98.9% for the MS class. The ResNet101-MobileNet-XGBoost model exhibited robust performance, securing 98.3% accuracy for the Control class and 98.6% for the MS class. However, the model of ResNet101-DenseNet201-MobileNet-XGBoost achieved 100% accuracy for the Control class and 98.9% for the MS class.
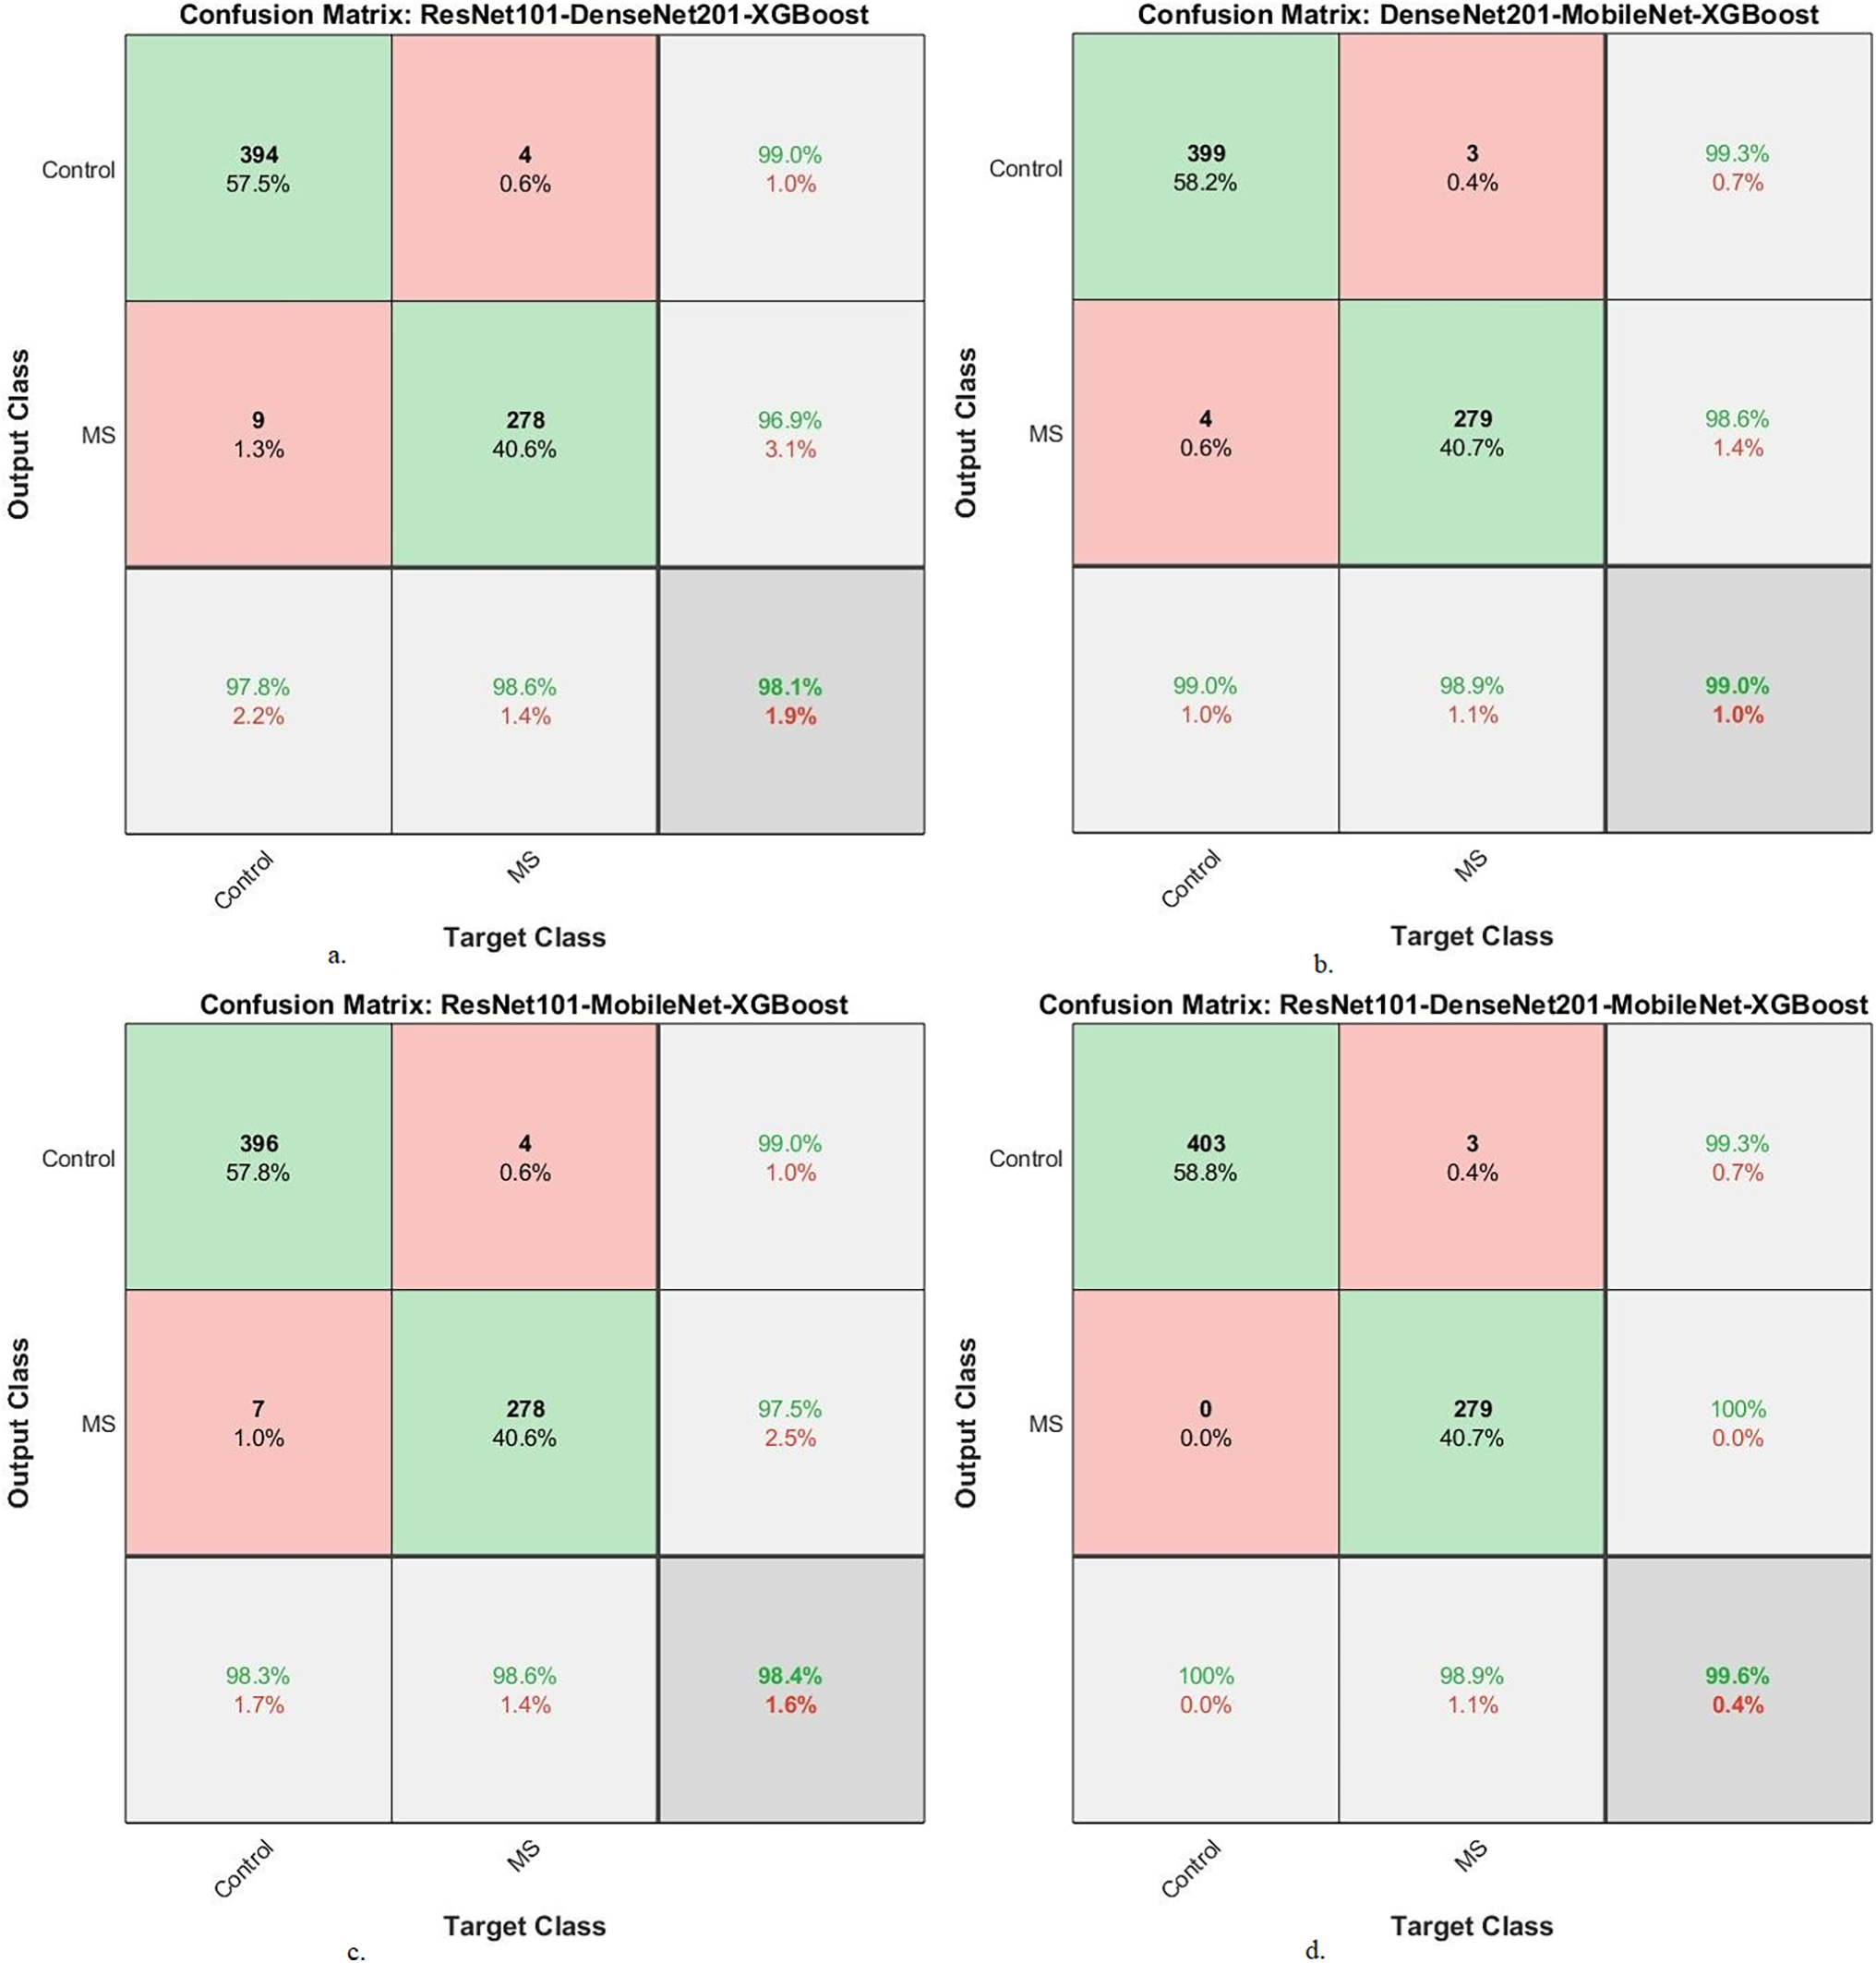
Figure 10: A confusion matrix of results of the hybrid system of XGBoost classifier with CNN features fused with ACO for diagnosing a binary-class dataset of MS disease
4.4 Results of XG Boost with Fusion CNN Features Based on MESbS Method
The section presents the results of a hybrid system of an XGBoost classifier with fused features of CNN (ResNet101, DenseNet201, and MobileNet) based on the MESbS algorithm for early classification of MS patients. Features of several CNN models (ResNet101-DenseNet201, DenseNet201-MobileNet, ResNet101-MobileNet, and ResNet101-DenseNet201-MobileNet) are combined and preserved into feature vectors. After integrating multiple features of CNN models, the feature vectors become high features and contain frequent and non-significant features. Therefore, the MESbS algorithm was applied to retain important and delete redundant and unimportant features. Important feature vectors are sent to the XGBoost classifier for training and performance testing.
Table 11 and Fig. 11 provide a thorough insight into hybrid systems’ performance outcomes, combining the multi-feature CNN models and XGBoost classifier based on the MESbS algorithm to diagnose a multi-class dataset of MS patients early. The results display different strengths and capabilities across different hybrid systems. The ResNet101-DenseNet201-XGBoost model displayed performance metrics, achieving an AUC of 96.6%, sensitivity of 96.68%, accuracy of 97.1%, precision of 97.08%, and specificity of 98.68%. In contrast, the DenseNet201-MobileNet-XGBoost model showed superior performance with an AUC of 98.1%, sensitivity of 98.38%, precision of 98.5%, specificity of 99.2% and accuracy of 98.5%. The ResNet101-MobileNet-XGBoost model showcased robust performance, achieving an AUC of 97.28%, sensitivity of 97.15%, accuracy of 97.5%, precision of 97.58%, and specificity of 99.05%. Significantly, the ResNet101-DenseNet201-MobileNet-XGBoost model appeared as the top-performing system, achieving an AUC of 98.88%, sensitivity of 99.15%, accuracy of 99.3%, precision of 99.18%, and specificity of 99.6%. In this comprehensive evaluation, the ResNet101-DenseNet201-MobileNet-XGBoost model is the most effective system for early MS classification in a multi-class dataset, demonstrating superior performance across key metrics.
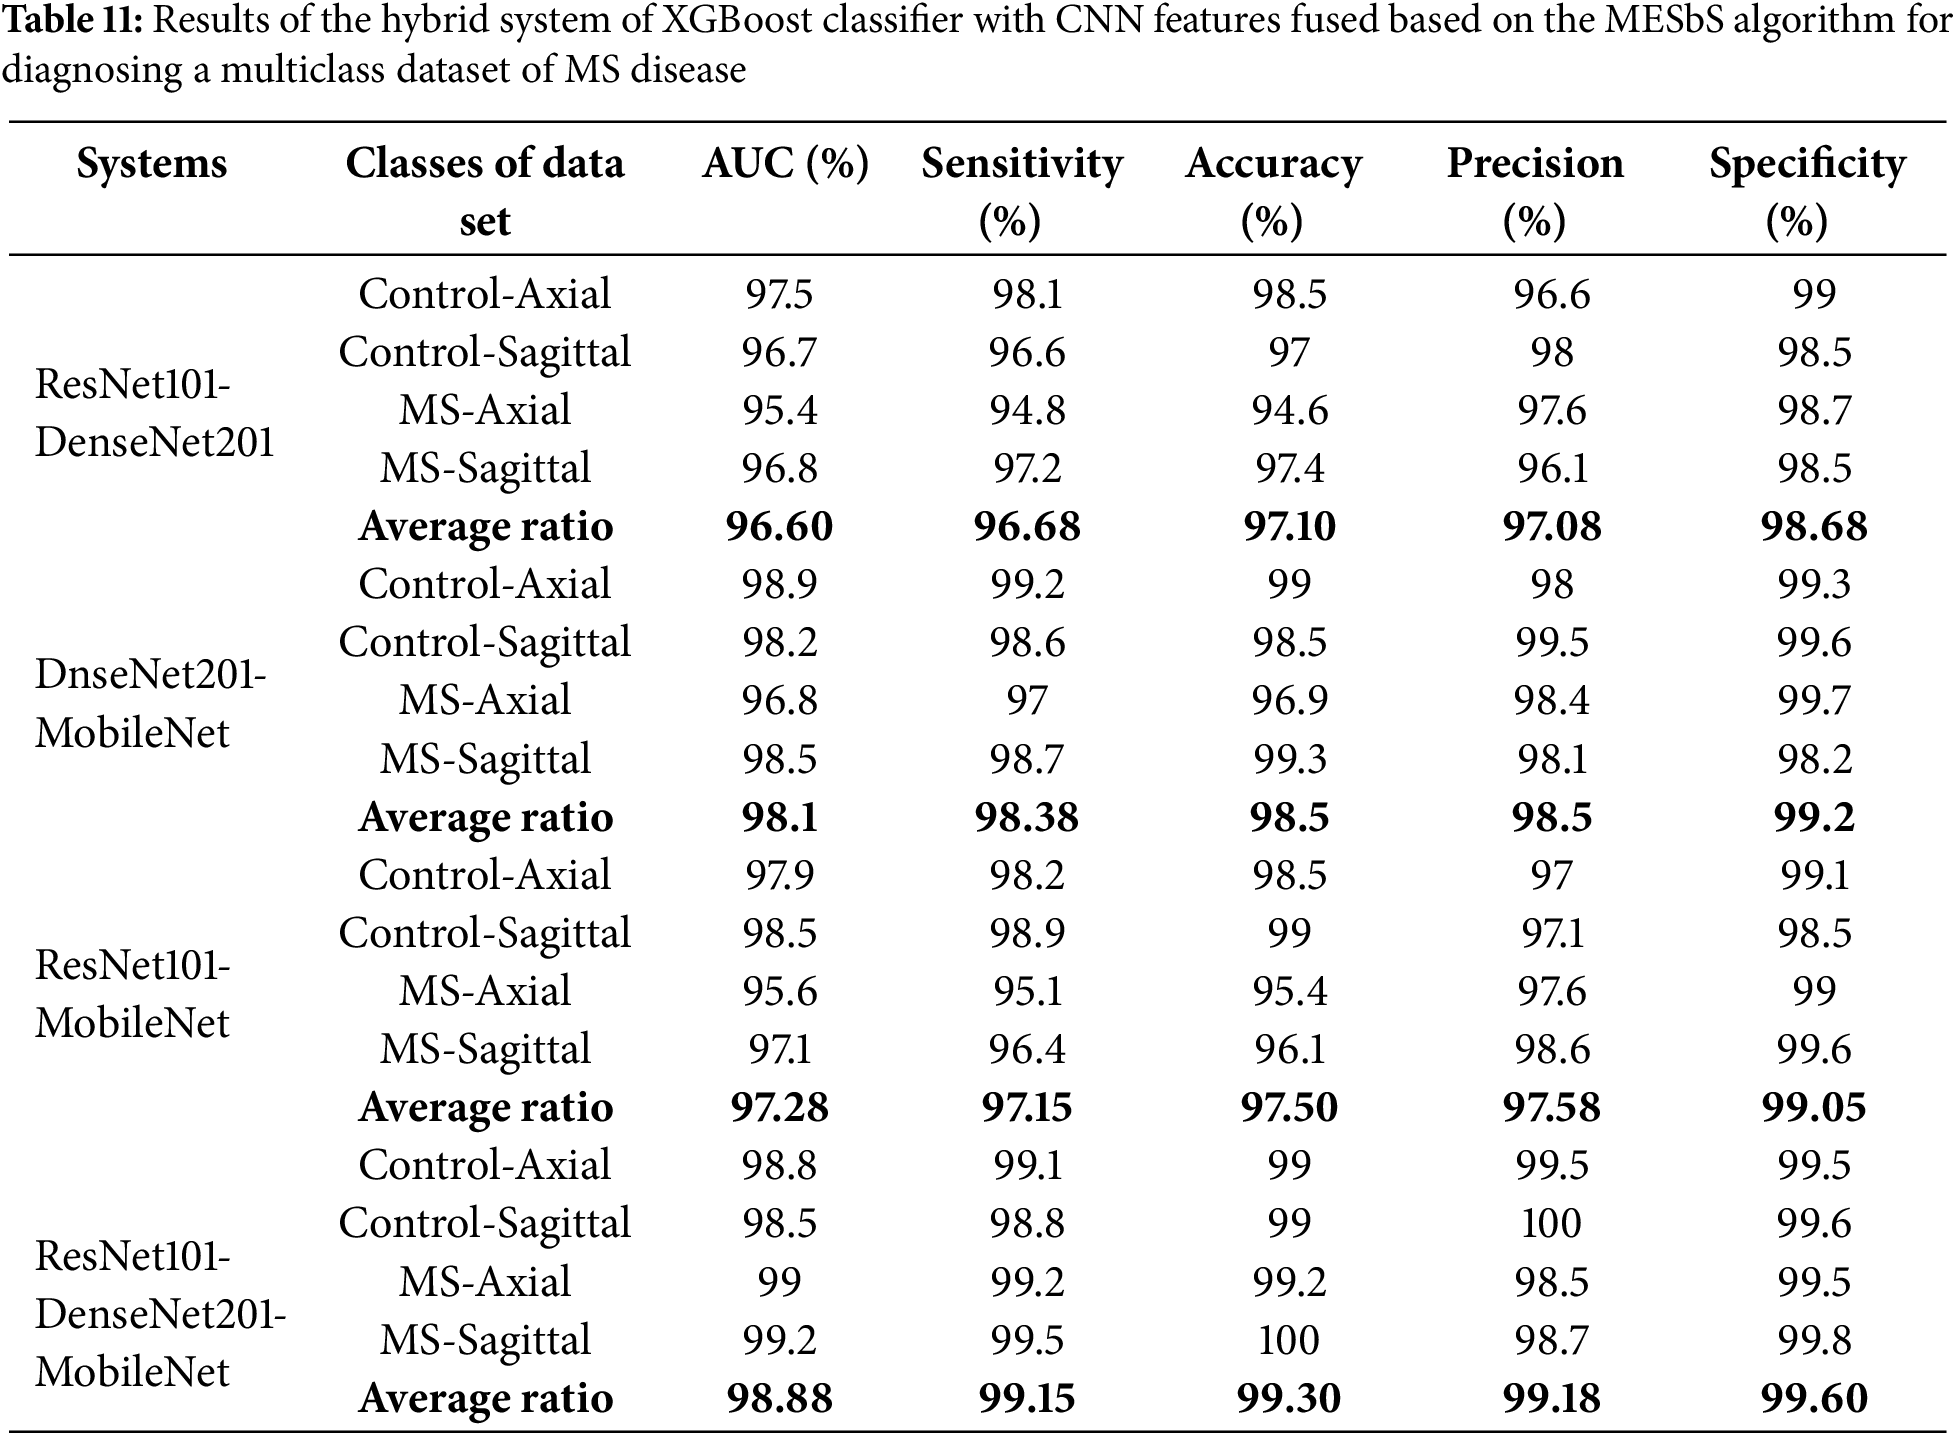
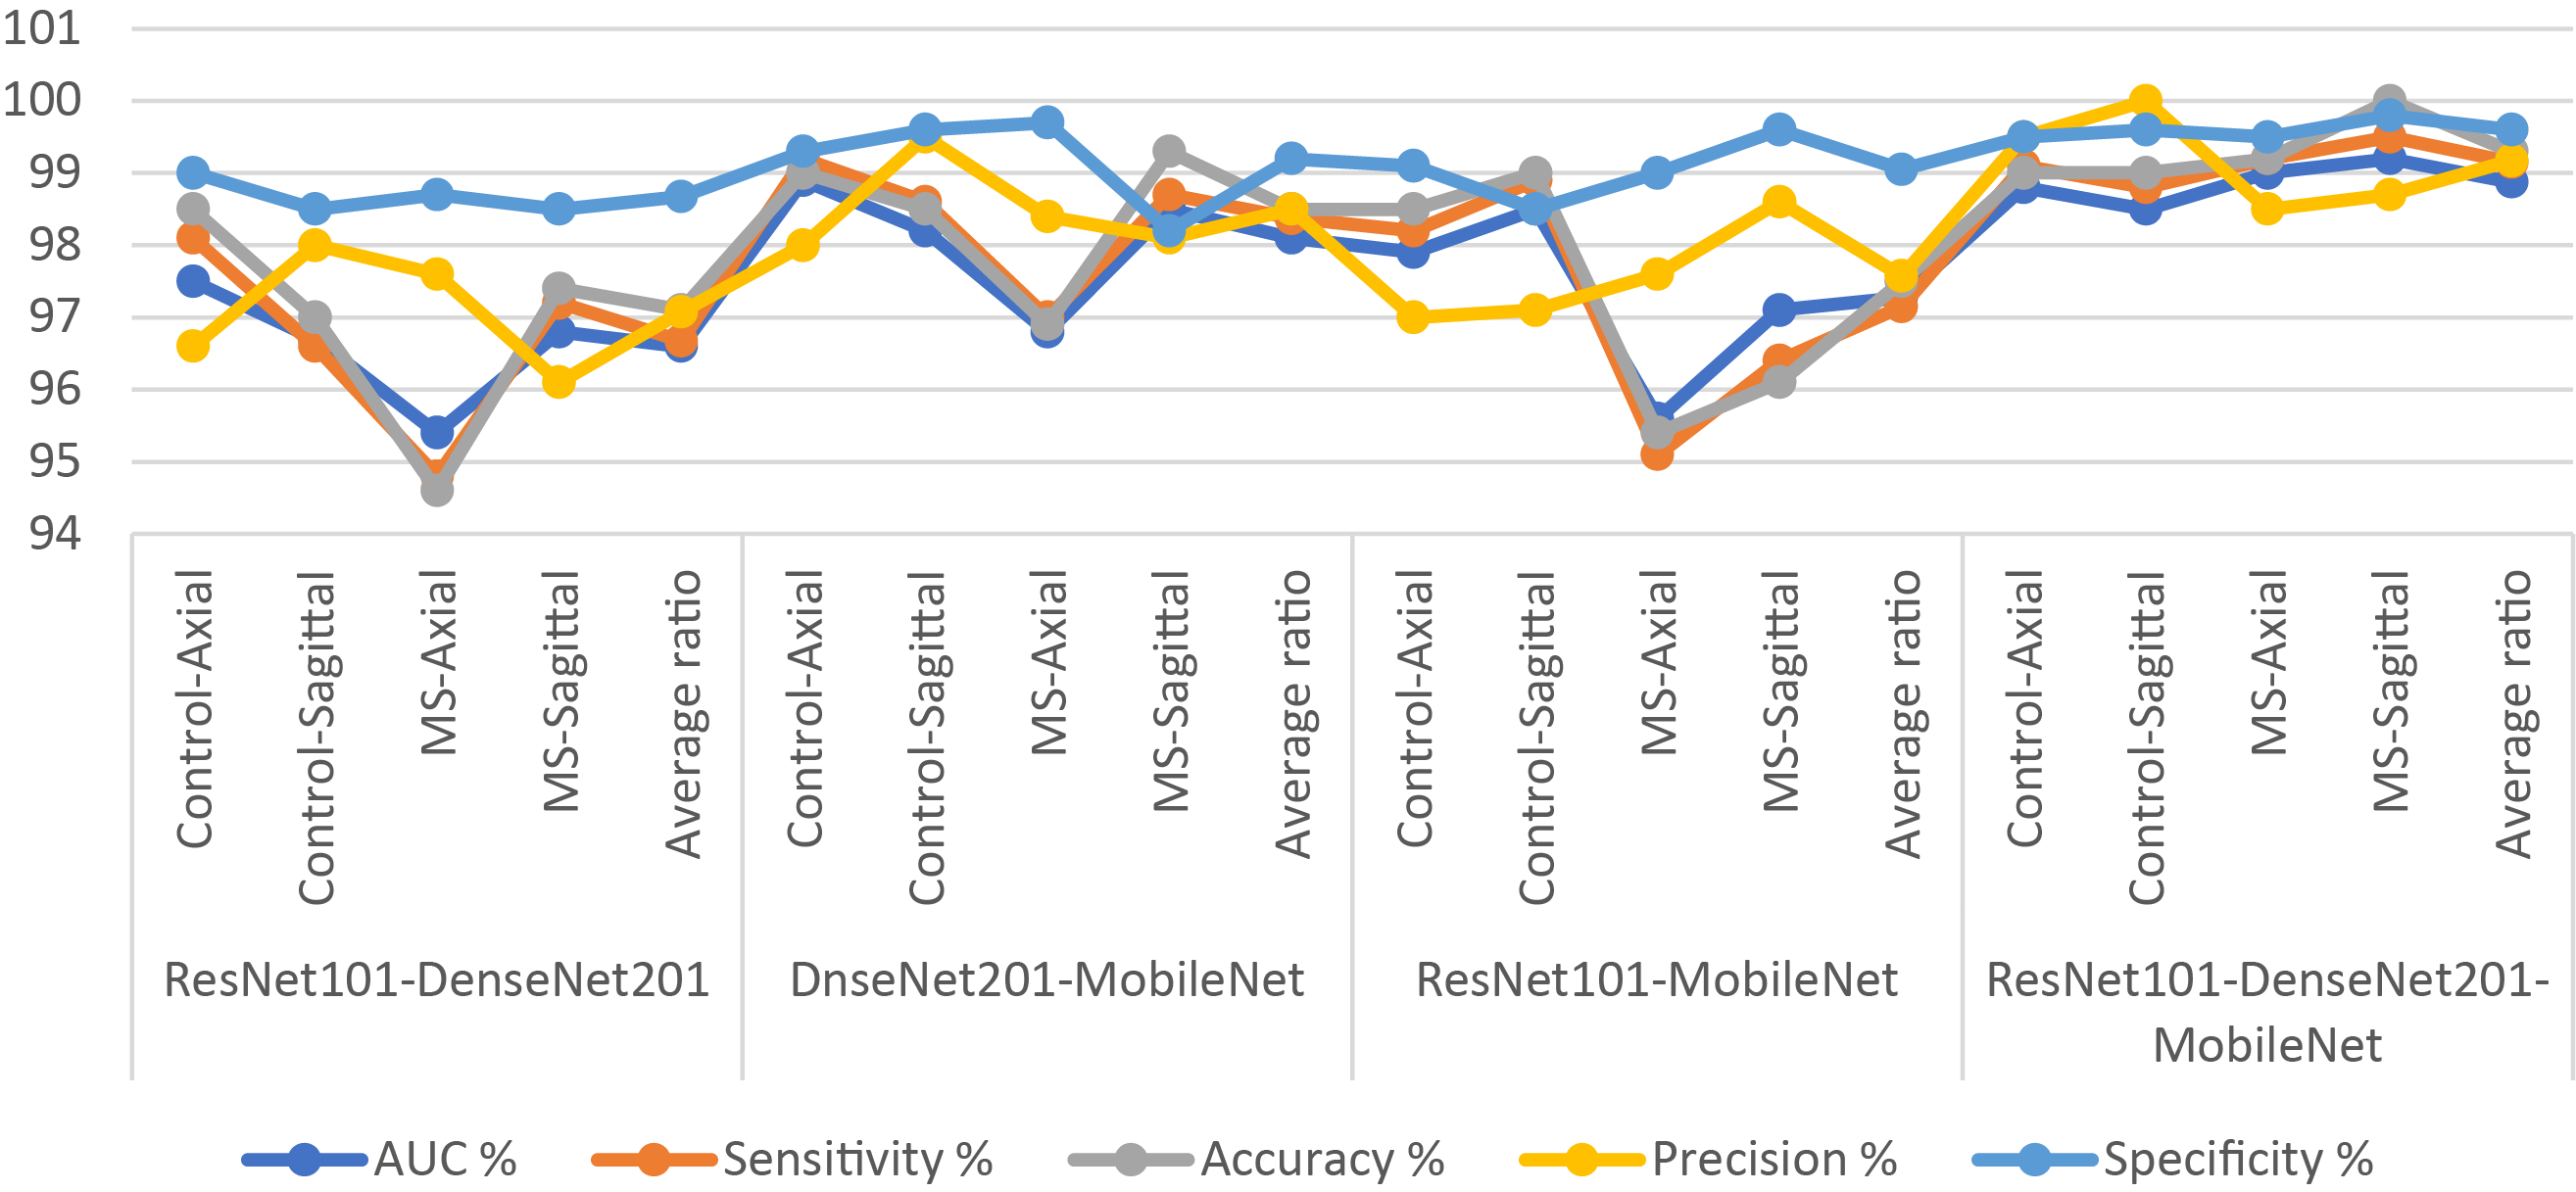
Figure 11: Display of results of the hybrid system of XGBoost classifier with CNN features fused based on the MESbS algorithm for diagnosing a multiclass dataset of MS disease
Fig. 12 shows the confusion matrix of XGBoost-multi-CNN based on the MESbS for early MS detection in a multi-class dataset. The accuracy of each class is meticulously analyzed, revealing distinct performance patterns among different hybrid systems. The ResNet101-DenseNet201-XGBoost model presented accuracy across classes, achieving 98.5% for Control-Axial, 97% for Control-Sagittal, 94.6% for MS-Axial, and 97.4% for MS-Sagittal. In comparison, the DenseNet201-MobileNet-XGBoost model showed notable accuracy, registering 99% for Control-Axial, 98.5% for Control-Sagittal, 96.9% for MS-Axial, and 99.3% for MS-Sagittal. The ResNet101-MobileNet-XGBoost model showed strong performance with accuracy rates of 98.5% for Control-Axial, 99% for Control-Sagittal, 95.4% for MS-Axial, and 96.1% for MS-Sagittal. Notably, the ResNet101-DenseNet201-MobileNet-XGBoost model emerged as the top performer, achieving exceptional accuracy of 99% for Control-Axial, 99% for Control-Sagittal, 99.2% for MS-Axial, and a perfect 100% for MS-Sagittal. In this evaluation, the ResNet101-DenseNet201-MobileNet-XGBoost model showed superior accuracy across all classes, establishing itself as the most effective system for early MS detection in a multi-class dataset.
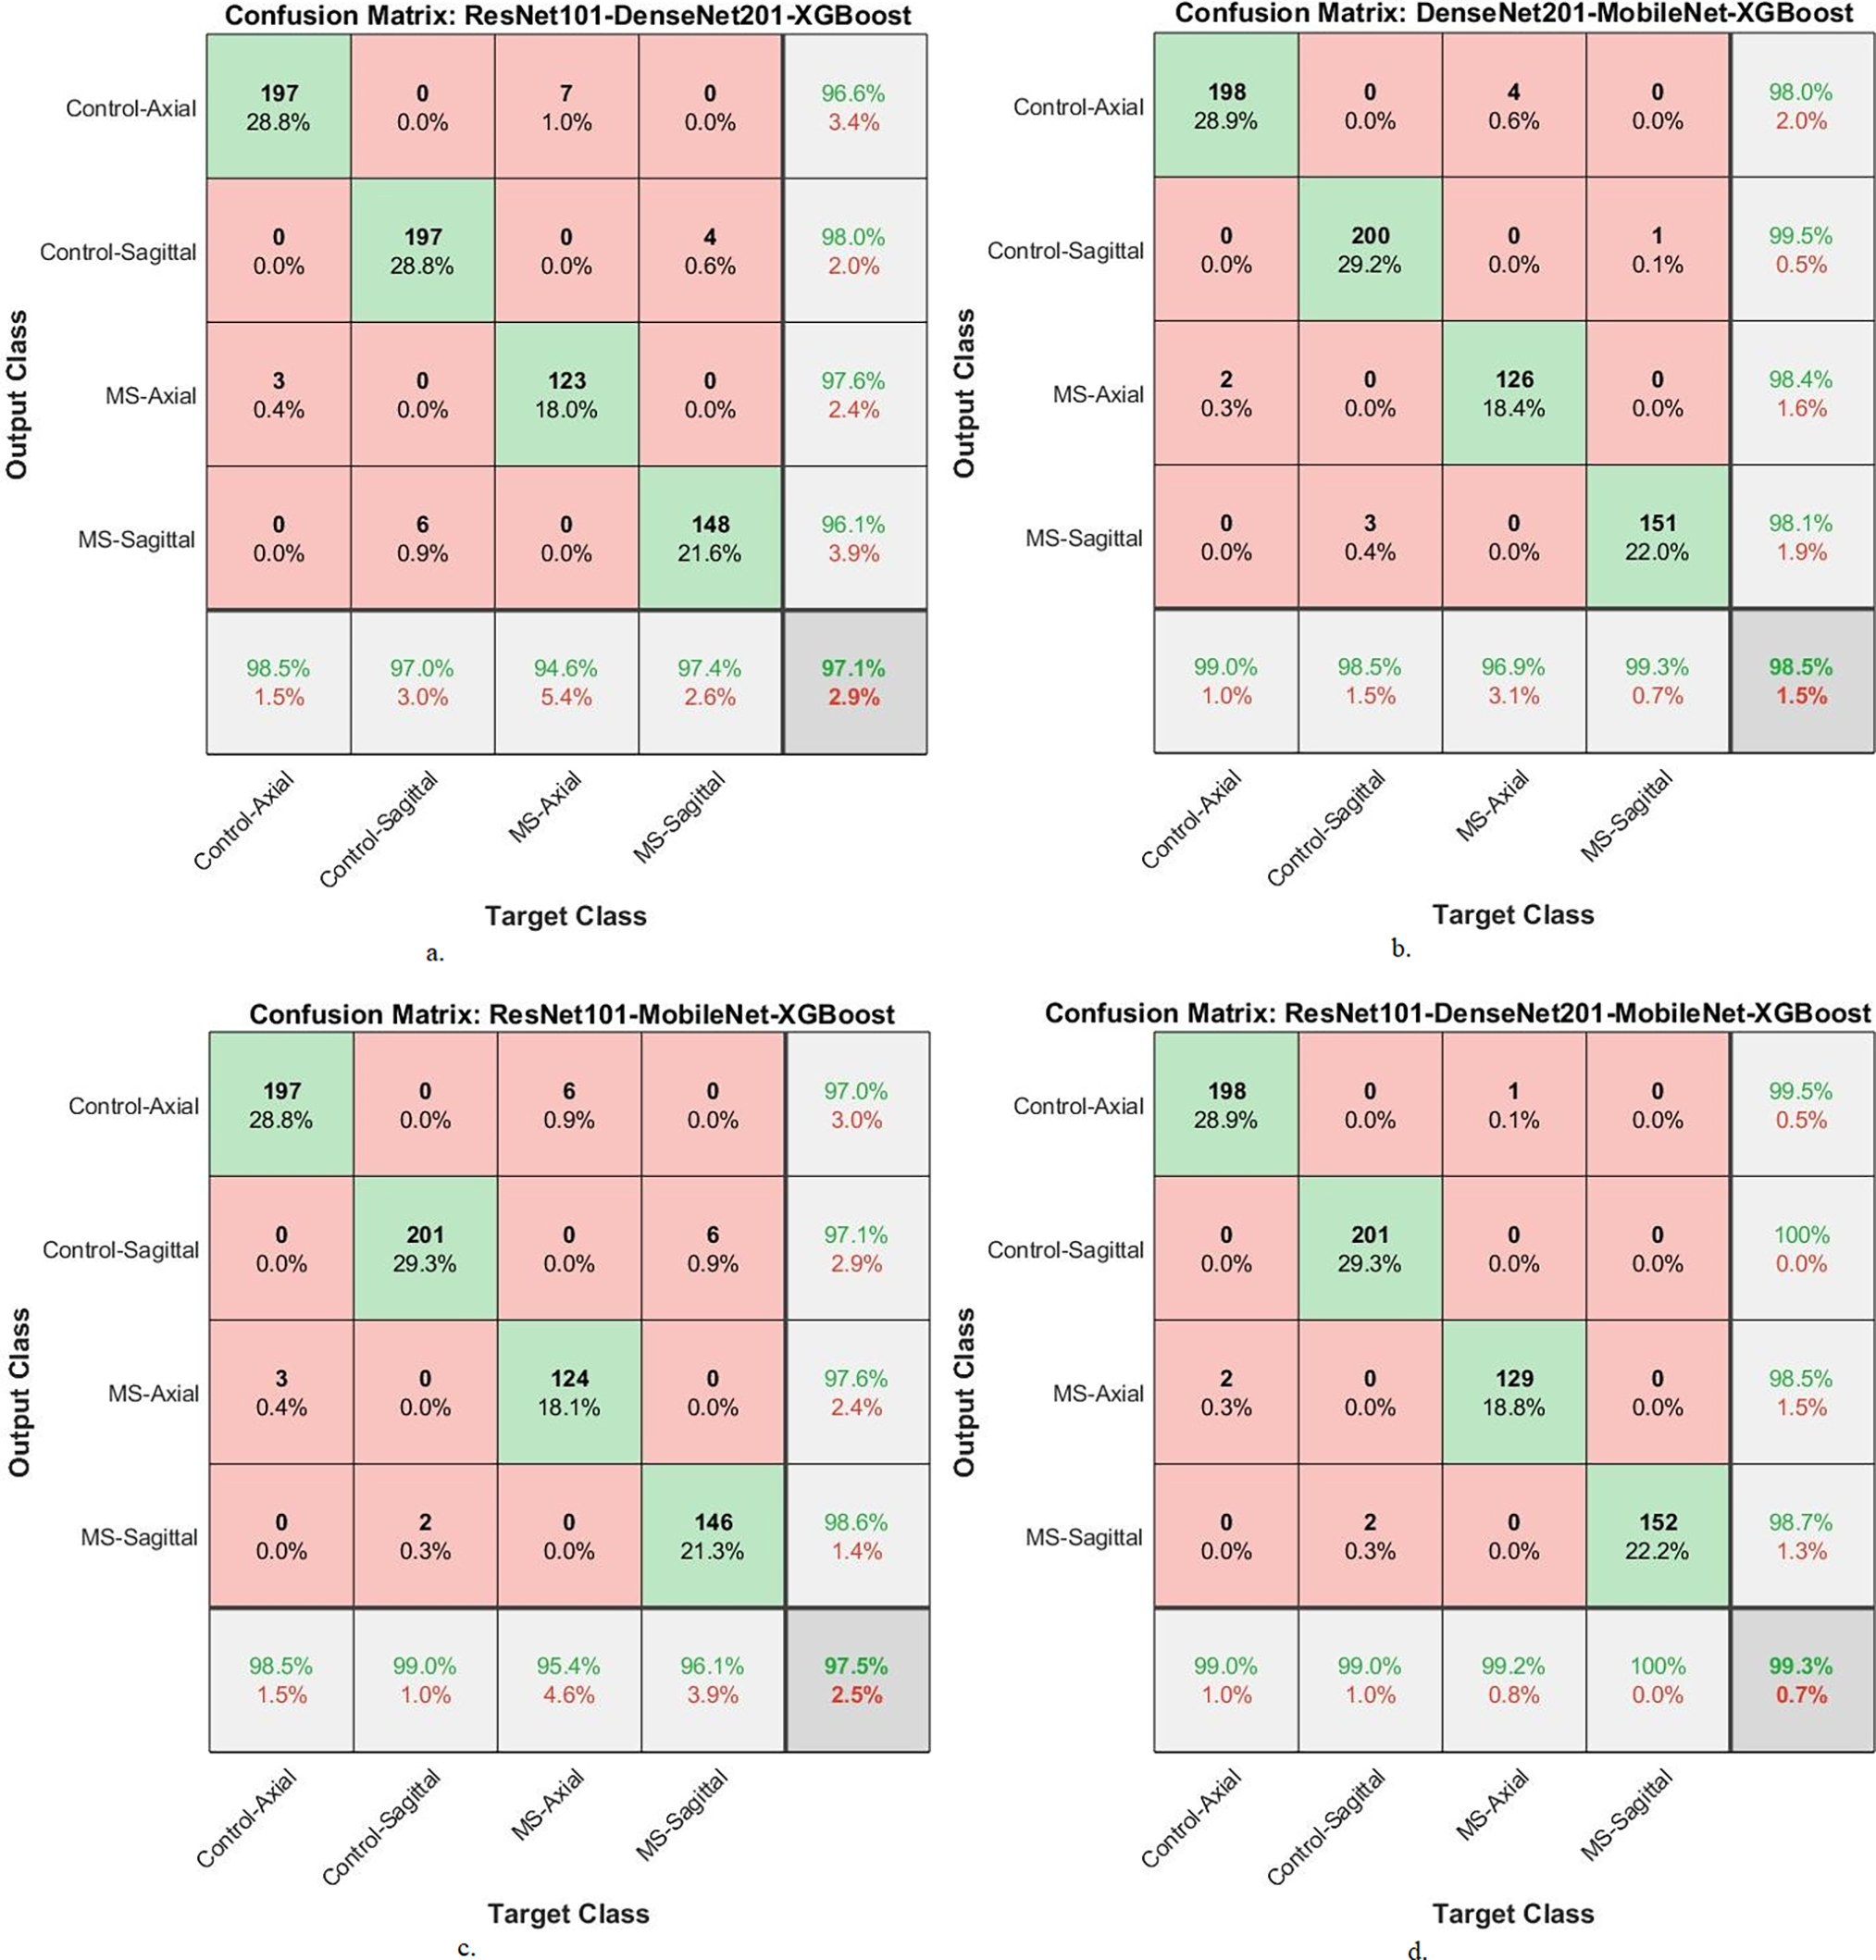
Figure 12: A confusion matrix of results of the system of XGBoost classifier with CNN features fused with MESbS for diagnosing a multi-class dataset of MS disease
Table 12 and Fig. 13 present the outcomes of hybrid systems integrating the multi-feature CNN models and XGBoost with the MESbS to diagnose a binary-class dataset comprising MS patients early. The ResNet101-DenseNet201-XGBoost model showed promising performance, achieving an AUC of 97.4%, sensitivity of 97.75%, accuracy of 97.7%, precision of 97.55%, and specificity of 98.15%. The DenseNet201-MobileNet-XGBoost model displayed superior results with an AUC of 98.35%, sensitivity of 98.5%, accuracy of 98.8%, precision of 98.85%, and specificity of 98.75%. The ResNet101-MobileNet-XGBoost model also displayed robust performance, securing an AUC of 98.05%, sensitivity of 97.65%, accuracy of 98%, precision of 98.1%, and specificity of 97.8%. However, the ResNet101-DenseNet201-MobileNet-XGBoost model emerged as the most proficient, boasting an AUC of 99%, sensitivity of 98.95%, accuracy of 99.1%, precision of 99.1%, and specificity of 99.15%.
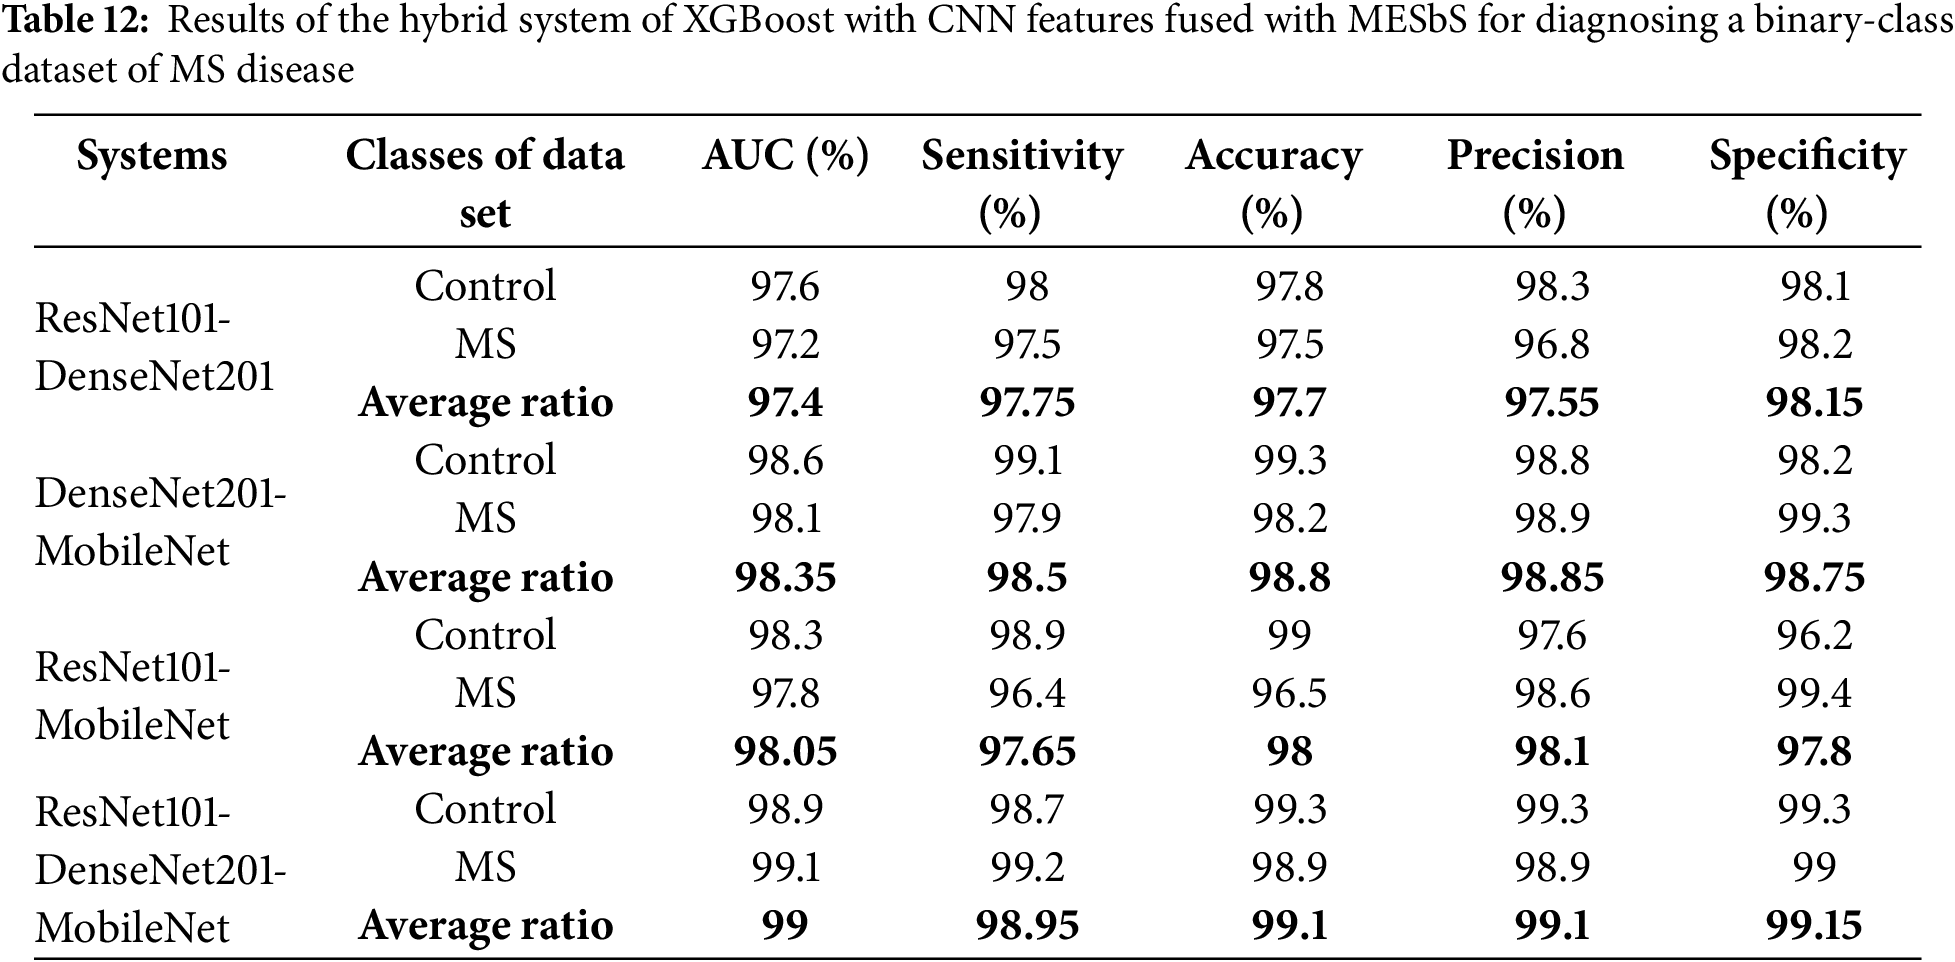
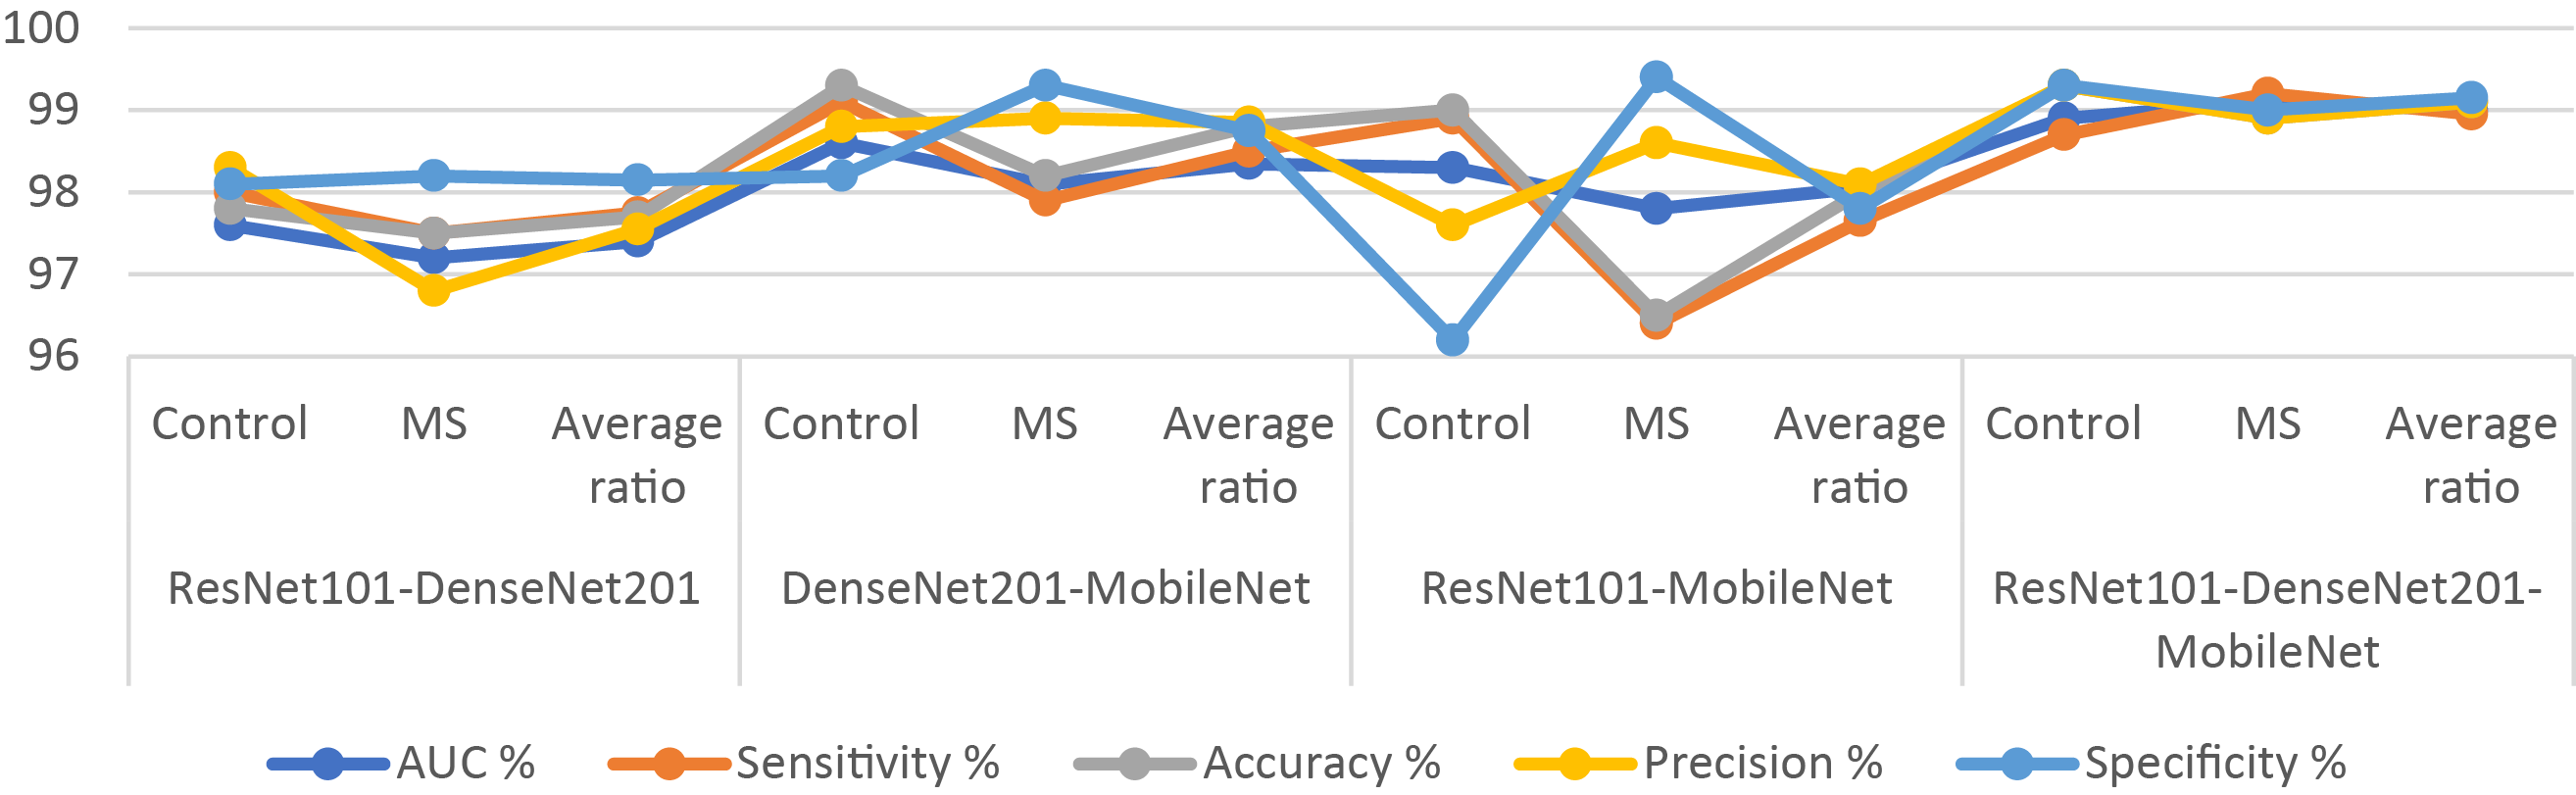
Figure 13: Display of results of the hybrid system of XGBoost with CNN features fused with MESbS for diagnosing a binary-class dataset of MS disease
In Fig. 14, the confusion matrix illustrates the performance of XGBoost-multi-CNN using the MESbS for the binary-class MS dataset for the accuracy of each class. This analysis evaluates class-specific diagnostic performance for multiple sclerosis detection using confusion matrix analysis of XGBoost classifiers trained on optimized features from multi-CNNs, including ResNet101, DenseNet201, and MobileNet, selected by the MESbS algorithm. The ResNet101-DenseNet201 fusion with XGBoost achieves a strong accuracy of 97.8% on healthy controls and 97.5% for the MS class. The DenseNet201-MobileNet model performs slightly better, with an accuracy of 99.3% for the control class and 98.2% for the MS class. The ResNet101-MobileNet model produces comparable metrics. The proposed ResNet101-DenseNet201-MobileNet integration with MESbS-XGBoost attains the highest performance, correctly diagnosing with an accuracy of 99.3% of the control class and 98.9% of the MS class. This demonstrates the benefits of assimilating complementary feature perspectives from all three CNNs through the MESbS feature optimization pipeline for improving differential classification of multifactorial neurological disorders like MS.
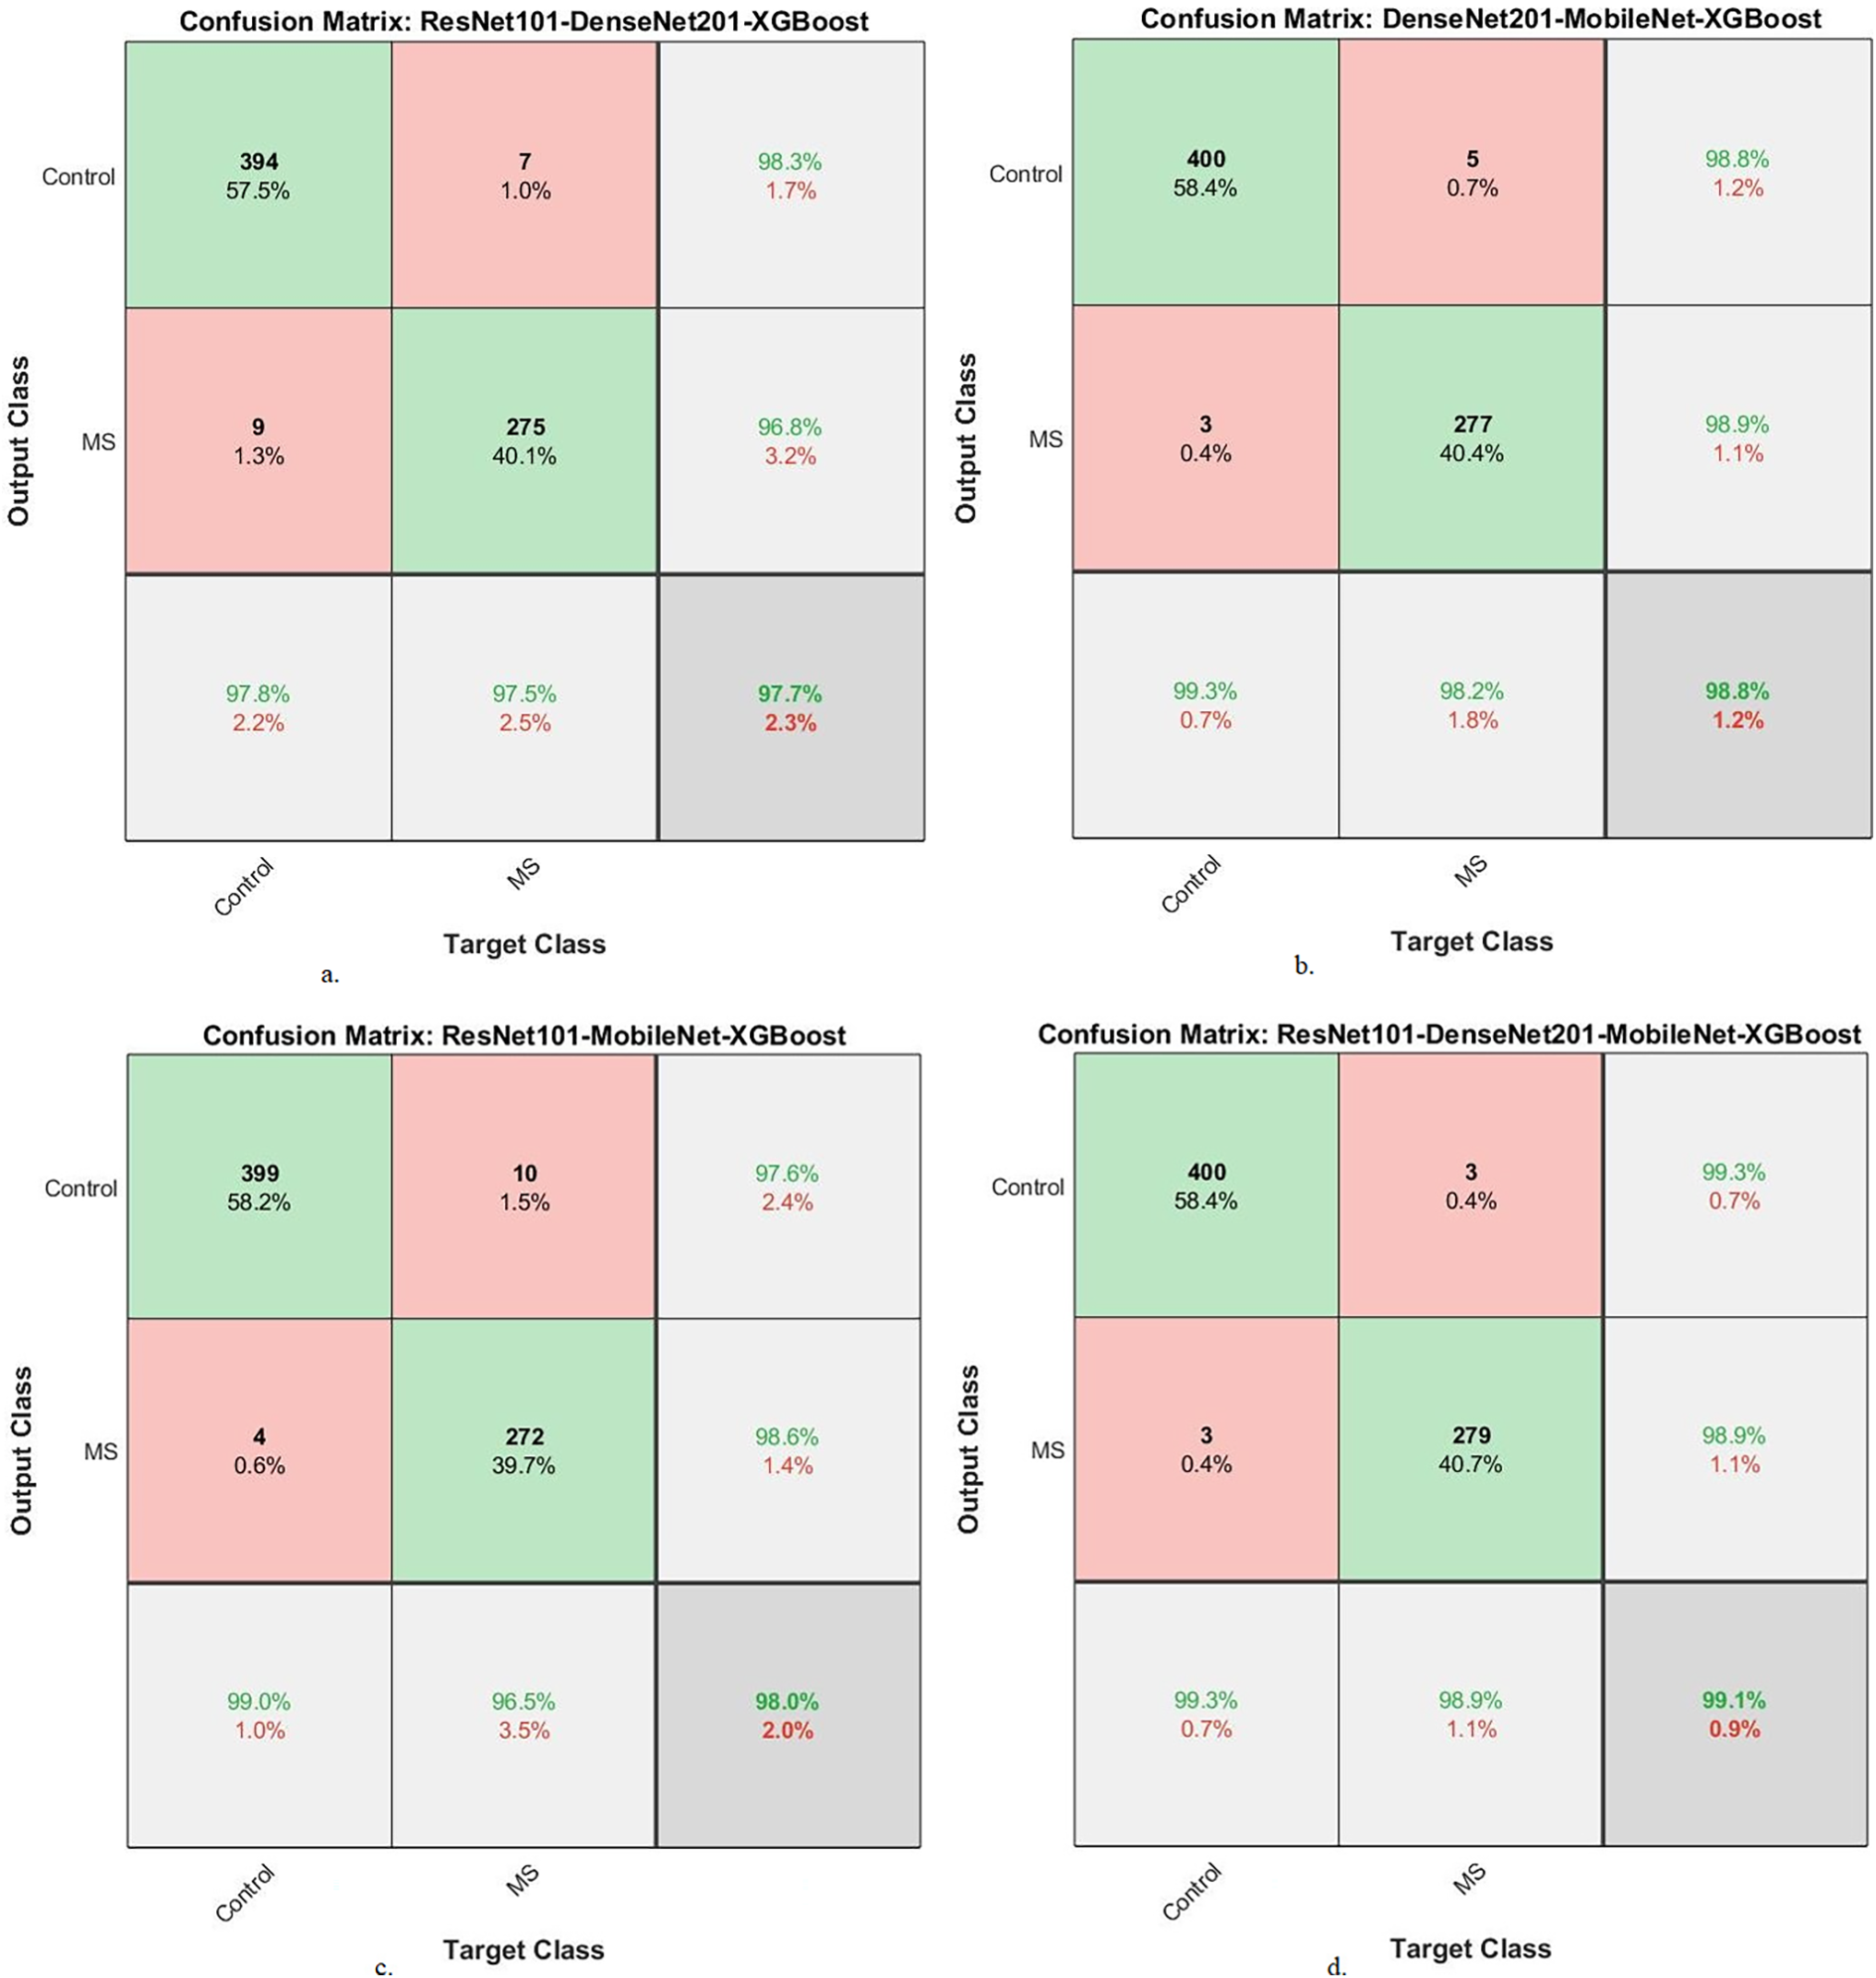
Figure 14: A confusion matrix of results of the system of XGBoost with CNN features fused with MESbS for diagnosing a binary-class dataset of MS disease
4.5 Generalization of the Proposed Systems on New Dataset
To address concerns regarding overfitting due to a limited training dataset, our study evaluates the proposed hybrid systems on two multiclass and biclass MS datasets and MRI images from the Alzheimer’s Disease Neuroimaging Initiative (ADNI) dataset. The ADNI dataset provides a diverse and representative sample of neuroimaging data, allowing us to assess the robustness and generalizability of our models.
The proposed hybrid systems were tested on fMRI images from the ADNI dataset. This dataset consists of 2,575 fMRI images belonging to five classes for Alzheimer’s Disease (AD) and 906 images for Parkinson’s disease (PD). The classes are AD (810 images), Cognitively Normal (CN) of 1220 images, Mild Cognitive Impairment (MCI) of 233 images, Early Mild Cognitive Impairment (EMCI) of 240 images, Late Mild Cognitive Impairment (LMCI) of 72 images and Parkinson’s Disease (PD) of 906 images. This dataset provides a well-characterized range of cognitive impairment and, therefore, makes an excellent standard for evaluating the generalization of our proposed models.
Table 13 and Fig. 15 present the performance of two hybrid CNN-XGBoost models, integrating ResNet101, DenseNet201, and MobileNet, evaluated on the ADNI dataset. ResNet101-DenseNet201-MobileNet-XGBoost-ACO: This model’s performance has an average AUC of 90.08%, sensitivity of 91.63%, accuracy of 94.40%, precision of 88.93%, and specificity of 98.85%. ResNet101-DenseNet201-MobileNet-XGBoost-MESbS: The second model performed has an average AUC of 83.60%, sensitivity of 83.37%, accuracy of 92.40%, precision of 85.13%, and specificity of 98.42%. These results indicate that the proposed hybrid models are highly effective in generalizing across different datasets and neurodegenerative conditions, reducing concerns about overfitting.
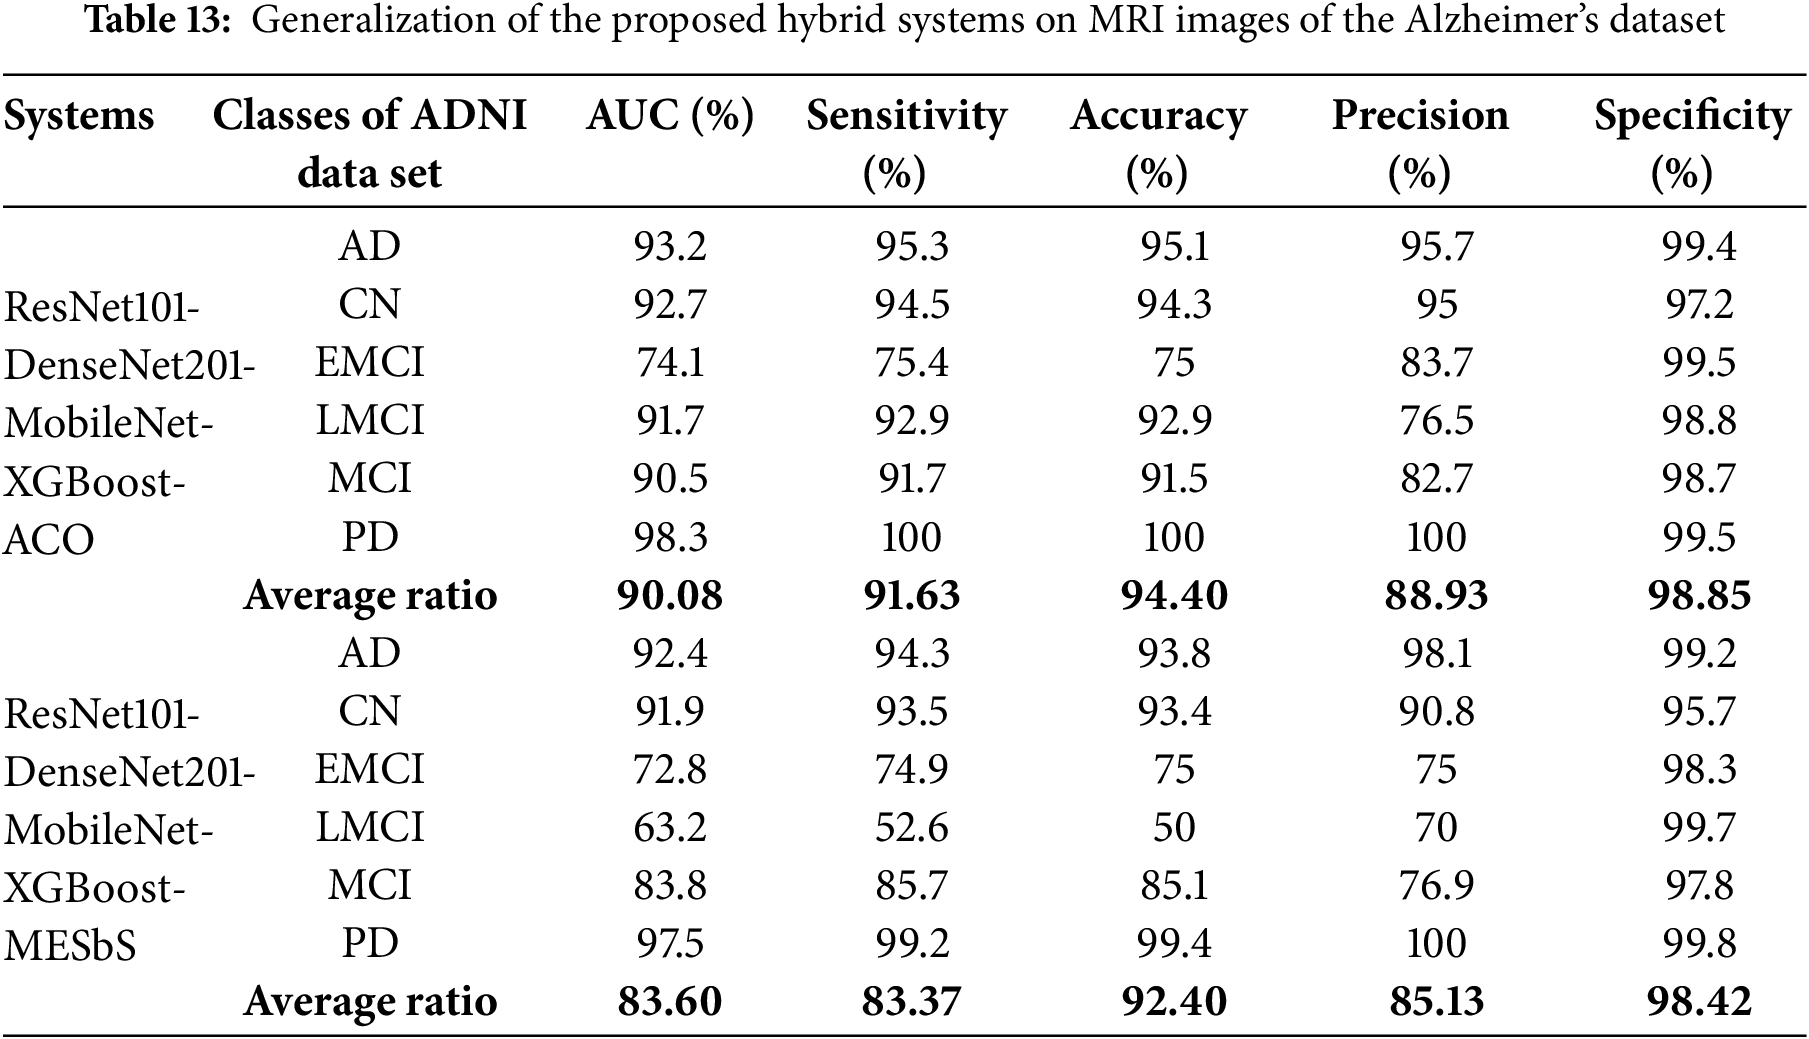
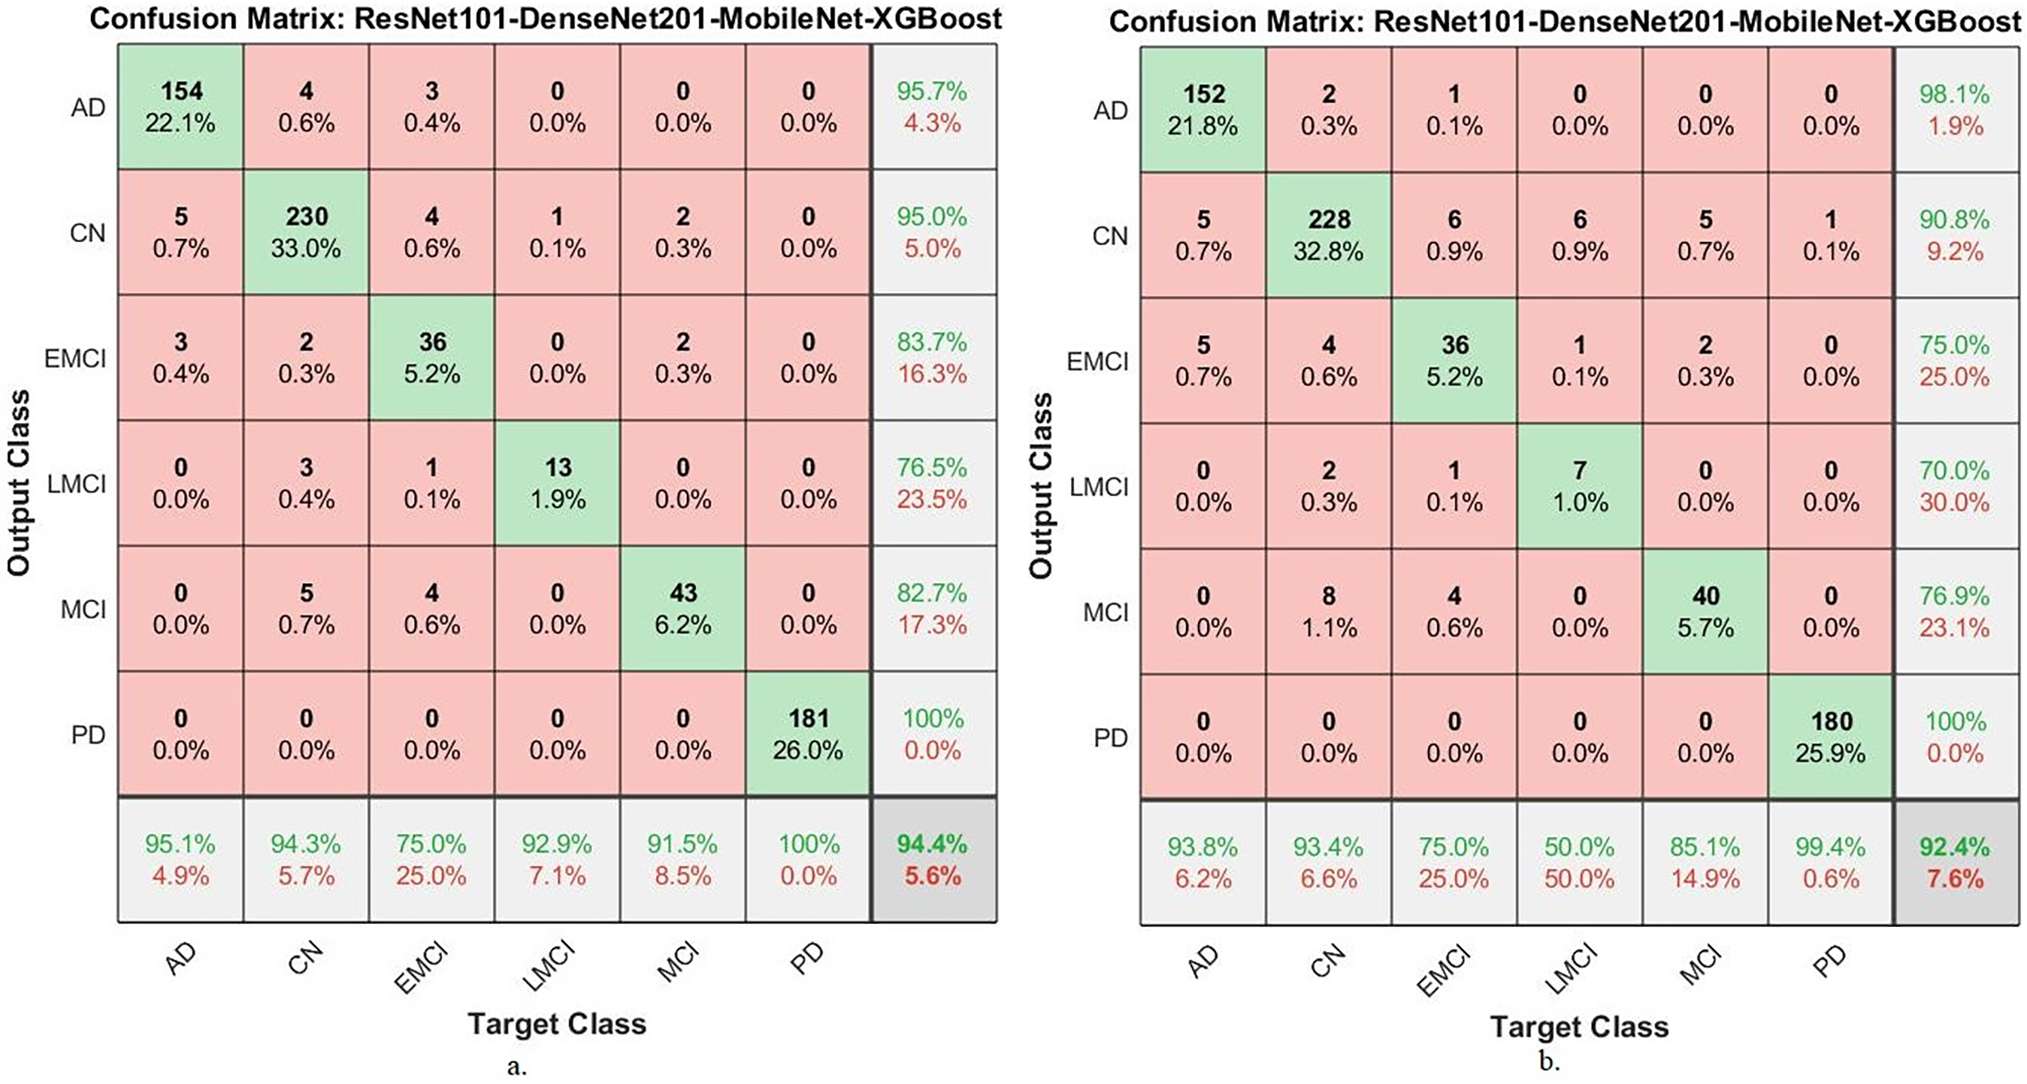
Figure 15: Confusion matrix for generalization of the proposed hybrid systems to MRI images from the Alzheimer’s disease dataset (a): with ResNet101-DenseNet201-MobileNet-XGBoost-ACO; (b): with ResNet101-DenseNet201-MobileNet-XGBoost-MESbS
5 Discussion and Comparison of the Performance of the Proposed Hybrid Systems
AI techniques have revolutionized medical diagnostics, particularly in detecting diseases such as MS early. In the context of MS classification, the utilization of advanced AI methods, including CNNs and ensemble techniques, has shown promising results.
This study presents a new hybrid system, combining an XGBoost classifier and multiple CNN models based on feature selection algorithms for MS classification. XGBoost provides ensemble learning capabilities, excels at handling complex features, and is suitable for classification tasks. The fusion of features of the ResNet101, DenseNet201, and MobileNet models ensures accurate extraction of deep features from brain MRI images. CNNs excel at capturing complex MRI patterns, biomarkers, and features. The ACO and MESbS algorithms are important in selecting the features that are most relevant to the target features.
Hybrid systems proposed a deep analysis using an XGBoost classifier and multi-CNN features for early MS classification. For multi-class classification, the ResNet101-DenseNet201-MobileNet-XGBoost model based on the ACO algorithm achieved the best overall performance with an AUC of 99.05%, accuracy of 99.4%, sensitivity of 99.23%, specificity of 99.75%, and precision of 99.45%. Integration of all three CNNs provides maximal discriminative ability to distinguish subtle lesion variations across MRI modalities. Similarly, for binary MS detection, the ResNet101-DenseNet201-MobileNet-XGBoost combination based on the ACO algorithm attained superior results with AUC hitting 99.3%, accuracy of 99.6%, sensitivity of 99.5%, precision of 99.65%, and specificity of 99.55%. The ResNet101-MobileNet-XGBoost and DenseNet201-MobileNet-XGBoost pairs also perform strongly in multi-class and binary tasks, indicating MobileNet’s efficiency. The comparative evaluation across metrics and datasets validates that assimilating complementary visual knowledge through optimized multi-CNN and XGBoost integration enables sensitive classification of multifactorial MS pathology. Adding more CNNs consistently improves results. The trio system leveraging ResNet101, DenseNet201, and MobileNet surpasses all other frameworks, setting new standards for automated screening using MRI.
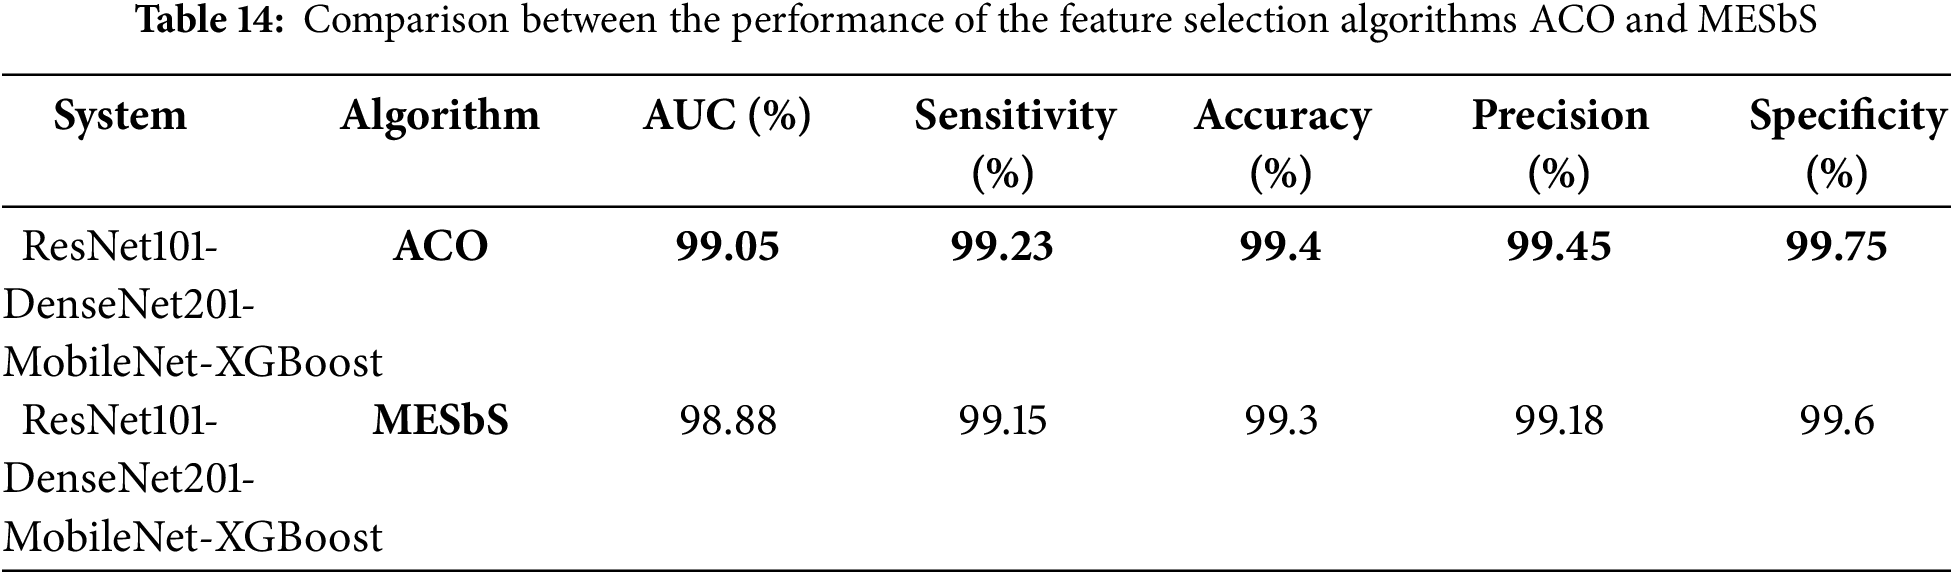
Table 14 is a comparison based on the key performance metrics. ACO Algorithm: The hybrid system utilizing the ACO algorithm demonstrated slightly higher performance across most metrics, with an AUC of 99.05% and an accuracy of 99.40%. This suggests that ACO is effective in optimizing feature selection by retaining essential features and discarding redundant ones. Based on the results, the ACO algorithm slightly outperforms the MESbS algorithm in this specific study. Therefore, recommend the use of ACO for scenarios where maximizing accuracy and other performance metrics is crucial. However, MESbS remains a viable alternative, particularly when considering the balance between computational efficiency and accuracy.
Specifically, Table 13 summarizes our model’s performance, highlighting the superior accuracy of 99.40% and AUC of 99.05% achieved with the ACO algorithm. In comparison, existing studies in MS classification have reported accuracy values ranging between 80% and 94%, with the highest being 93.76% (Zhang et al.). While previous approaches, including CNN architectures, handcrafted feature extraction, segmentation models, and diffusion MRI techniques, have contributed significantly to the field, they have not exceeded the performance metrics attained in our study. The proposed hybrid framework effectively optimizes discriminative power by leveraging deep feature fusion from ResNet101, DenseNet201, and MobileNet with XGBoost. Using ACO for feature selection further enhances classification performance by retaining essential features while discarding redundancies. By integrating multi-CNN fusion and advanced feature selection, our study establishes a new benchmark for MS classification, surpassing prior methodologies.
Strengths: The strengths of this study lie in several aspects: A hybrid system that combines XGBoost and multiple CNN models (ResNet101, DenseNet201, and MobileNet), which combines the strengths of both ensemble learning and deep features fused from multiple CNN models. Extracting comprehensive features by merging multiple CNN models, where each model adds features that were not detected by the other model, is essential in detecting subtle differences in MS lesions. Also, merging features from multiple CNN models leads to some redundancy of features, and thus, these features were overcome by applying the ACO and MESbS methods to select essential features and delete the redundant and unimportant ones. The model is effective in distinguishing between MS cases and normal types in MRI axial and sagittal images.
Limitation: The proposed systems in this study were evaluated on a specific training dataset, but this limitation was overcome by applying data augmentation techniques. Data augmentation techniques increase the number of images during the training phase and balance the dataset to avoid overfitting, as shown in Table 6.
Validity of the methods: The proposed methods in the study are advanced and suitable for the task of MS classification. The combination of CNNs and XGBoost, along with feature selection algorithms, is a valid approach to dealing with complex medical imaging data. The systems are applied to a well-structured dataset of 3427 brain MRI images consisting of confirmed and healthy cases in both axial and sagittal orientations to depict MS white matter lesions. The dataset was split into 1411 MRI images from MS patients (650 axial and 761 sagittal) and 2016 MRI images from healthy subjects (1002 axial and 1014 sagittal). This uniform dataset is essential to ensure that the hybrid system is evaluated. The dataset was split into 80% training/validation and 20% testing, with careful attention to tuning the hyperparameters. This approach is sound, as it ensures that the model is trained on a large portion of the data while maintaining a separate test set to evaluate the final system. Table 1 shows the exact distribution of data across the training, validation, and testing phases, ensuring transparency in the model development process. The study system to divide the dataset into distinct training, validation, and testing phases is a necessary step to avoid overfitting. The application of the data augmentation technique in this study is also important to avoid bias by balancing the data and ensuring that there is no overfitting by artificially increasing the number of images. Validity of the results—Test and cross-validation set: The dataset during the testing phase includes 685 images (axial control: 200, sagittal control: 203, axial MS: 130, sagittal MS: 152), which ensures that the proposed systems are evaluated. In this study, validation was done through 5-fold which helps to prevent overfitting by ensuring the consistency of the proposed systems across various subsets of training data.
The data effectively and accurately supports the hybrid models that combine CNN models (ResNet101, DenseNet201, and MobileNet) and the XGBoost algorithm for diagnosing MS. The results indicate the efficiency and effectiveness of the models in reliably distinguishing MS patients from healthy controls across various types of MRI images (axial and sagittal). By combining the capabilities of CNN models in extracting fine features and merging them with the classification power of XGBoost, which enables them to capture complex patterns in MS MRI images, leading to reliable and effective diagnostic results.
The clinical value of the presented models is that they assist in the early identification of MS with the help of better deep and machine learning algorithms. As shown in the results, applying a hybrid model consisting of XGBoost and CNN model features (ResNet101, DenseNet201, and MobileNet) optimized further by the ACO algorithm improves diagnostic performance. Integrating these models with clinical workflows redefines the diagnosis process, particularly in situations with limited access to expert knowledge. Automating the detection of MS through these blended models would allow clinicians to read MRI images efficiently and identify crucial lesions indicative of MS. Not only would this accelerate diagnosis but also reduce the risk of human error, which is a prime consideration for illnesses like MS, where treatment is critical early on to prevent further disease progression. The models are applied in clinics as a diagnosis support system, along with existing MRI analysis software. With their high measure performance, the proposed models offer a valuable improvement over existing diagnostic methods, including standard manual assessment and less advanced automated systems, which lack the accuracy and sensitivity required to detect MS at an early stage. Moreover, the system’s ease of use and ability to automate would make it an invaluable addition to any clinical setting. It would provide doctors with a powerful tool to help make informed, data-driven decisions while allowing for the timely treatment of MS patients.
The proposed hybrid system, which integrates optimized multi-CNN features with the XGBoost classifier through feature selection methods, demonstrates a promising approach for early and accurate classification of MS from MRI scans. This study explored two feature selection techniques—ACO and MESbS—to refine and enhance the extracted deep features, which improve classification performance. The results indicate that the XGBoost classifier, when applied to fused ResNet101-DenseNet201-MobileNet features selected via ACO, achieved an AUC of 99.05%, sensitivity of 99.23%, accuracy of 99.4%, precision of 99.45%, and specificity of 99.75%.
Future work will focus on validating these findings, using a new dataset to evaluate the generalizability of the proposed system, and applying a hybrid technique between CNN models and a vision transformer for early diagnosis.
Acknowledgement: None.
Funding Statement: The authors received no specific funding for this study.
Author Contributions: Conceptualization, Mohammed Alshahrani, Ebrahim Mohammed Senan, Mohammed Al-Jabbar, Eman A. Alshari and Sultan Ahmed Almalki; methodology, Mohammed Alshahrani, Ebrahim Mohammed Senan, Fatima Ali Amer jid Almahri, Mohammed Al-Jabbar, Sultan Ahmed Almalki and Eman A. Alshari; software, Ebrahim Mohammed Senan, Mohammed Alshahrani, Eman A. Alshari and Mohammed Al-Jabbar; validation, Fatima Ali Amer jid Almahri, Sultan Ahmed Almalki, Mohammed Al-Jabbar, Ebrahim Mohammed Senan, Mohammed Alshahrani and Eman A. Alshari; formal analysis, Mohammed Alshahrani, Fatima Ali Amer jid Almahri, Sultan Ahmed Almalki, Mohammed Al-Jabbar and Ebrahim Mohammed Senan; investigation, Mohammed Al-Jabbar, Ebrahim Mohammed Senan, Mohammed Alshahrani and Eman A. Alshari; resources, Fatima Ali Amer jid Almahri, Mohammed Alshahrani, Ebrahim Mohammed Senan and Mohammed Al-Jabbar; data curation, Ebrahim Mohammed Senan, Mohammed Alshahrani, Sultan Ahmed Almalki, Eman A. Alshari and Mohammed Al-Jabbar; writing—original draft preparation, Ebrahim Mohammed Senan; writing—review and editing, Mohammed Alshahrani, Mohammed Al-Jabbar and Eman A. Alshari; visualization, Ebrahim Mohammed Senan, Fatima Ali Amer jid Almahri, Mohammed Al-Jabbar, Sultan Ahmed Almalki, Mohammed Alshahrani and Eman A. Alshari; supervision, Mohammed Alshahrani, Mohammed Al-Jabbar, Ebrahim Mohammed Senan and Fatima Ali Amer jid Almahri; project administration, Mohammed Alshahrani, Ebrahim Mohammed Senan and Mohammed Al-Jabbar; funding acquisition, Mohammed Alshahrani and Mohammed Al-Jabbar. All authors reviewed the results and approved the final version of the manuscript.
Availability of Data and Materials: Data supporting the proposed systems for diagnosing MS were obtained from the publicly available Internet at: https://www.kaggle.com/datasets/falahgatea/multiple-sclerosis (accessed on 20 February 2025).
Ethics Approval: Not applicable.
Conflicts of Interest: The authors declare no conflicts of interest to report regarding the present study.
References
1. Attfield KE, Jensen LT, Kaufmann M, Friese MA, Fugger L. The immunology of multiple sclerosis. Nat Rev Immunol. 2022;22(12):734–50. doi:10.1038/s41577-022-00718-z. [Google Scholar] [PubMed] [CrossRef]
2. Landry RL, Embers ME. The probable infectious origin of multiple sclerosis. NeuroSci. 2023;4(3):211–34. doi:10.3390/neurosci4030019. [Google Scholar] [PubMed] [CrossRef]
3. López-Muguruza E, Matute C. Alterations of oligodendrocyte and myelin energy metabolism in multiple sclerosis. Int J Mol Sci. 2023;24(16):12912. doi:10.3390/ijms241612912. [Google Scholar] [PubMed] [CrossRef]
4. Luchesa Smith A, Sudarsan N, Hemingway C, Lim M. Diagnosis and management of multiple sclerosis and other relapsing demyelinating disease in childhood. Arch Dis Child. 2022;107(3):216–22. doi:10.1136/archdischild-2021-321911. [Google Scholar] [PubMed] [CrossRef]
5. Yang J, Hamade M, Wu Q, Wang Q, Axtell R, Giri S, et al. Current and future biomarkers in multiple sclerosis. Int J Mol Sci. 2022;23(11):5877. doi:10.3390/ijms23115877. [Google Scholar] [PubMed] [CrossRef]
6. Arneth B, Kraus J. Laboratory biomarkers of multiple sclerosis (MS). Clin Biochem. 2022;99(1):1–8. doi:10.1016/j.clinbiochem.2021.10.004. [Google Scholar] [PubMed] [CrossRef]
7. Hegen H, Walde J, Berek K, Arrambide G, Gnanapavan S, Kaplan B, et al. Cerebrospinal fluid kappa free light chains for the diagnosis of multiple sclerosis: a systematic review and meta-analysis. Mult Scler. 2023;29(2):169–81. doi:10.1177/13524585221134213. [Google Scholar] [PubMed] [CrossRef]
8. Sinnecker T, Schädelin S, Benkert P, Ruberte E, Amann M, Lieb JM, et al. Brain atrophy measurement over a MRI scanner change in multiple sclerosis. Neuroimage Clin. 2022;36(3):103148. doi:10.1016/j.nicl.2022.103148. [Google Scholar] [PubMed] [CrossRef]
9. Mendelsohn Z, Pemberton HG, Gray J, Goodkin O, Carrasco FP, Scheel M, et al. Commercial volumetric MRI reporting tools in multiple sclerosis: a systematic review of the evidence. Neuroradiol. 2023;65(1):5–24. doi:10.1007/s00234-022-03074-w. [Google Scholar] [PubMed] [CrossRef]
10. Kołtuniuk A, Chojdak-Łukasiewicz J. Adherence to therapy in patients with multiple sclerosis—review. Int J Environ Res Public Health. 2022;19(4):2203. doi:10.3390/ijerph19042203. [Google Scholar] [PubMed] [CrossRef]
11. England M, Ferrazzo A, Klug L, Hoie E. Current monoclonal antibody options for multiple sclerosis. US Pharm. 2023;48(3):40–4. [Google Scholar]
12. Mahmudi Nezhad Dezfouli SR, Kyani Y, Mahmoudinejad Dezfouli SA. A novel classification and diagnosis of multiple sclerosis method using artificial neural networks and improved multi-level adaptive conditional random fields. J AI Data Min. 2022;10:361–72. doi:10.22044/JADM.2021.10647.2201. [Google Scholar] [CrossRef]
13. Filippi M, Amato MP, Centonze D, Gallo P, Gasperini C, Inglese M, et al. Early use of high-efficacy disease-modifying therapies makes the difference in people with multiple sclerosis: an expert opinion. J Neurol. 2022;269(10):5382–94. doi:10.1007/s00415-022-11193-w. [Google Scholar] [PubMed] [CrossRef]
14. Vázquez-Marrufo M, Sarrias-Arrabal E, García-Torres M, Martín-Clemente R, Izquierdo G. A systematic review of the application of machine-learning algorithms in multiple sclerosis. Neurol Engl Ed. 2023;38(8):577–90. doi:10.1016/j.nrleng.2020.10.013. [Google Scholar] [PubMed] [CrossRef]
15. Macin G, Tasci B, Tasci I, Faust O, Barua PD, Dogan S, et al. An accurate multiple sclerosis detection model based on exemplar multiple parameters local phase quantization: exmplpq. Appl Sci. 2022;12(10):4920. doi:10.3390/app12104920. [Google Scholar] [CrossRef]
16. Montolío A, Martín-Gallego A, Cegoñino J, Orduna E, Vilades E, Garcia-Martin E, et al. Machine learning in diagnosis and disability prediction of multiple sclerosis using optical coherence tomography. Comput Biol Med. 2021;133:104416. doi:10.1016/j.compbiomed.2021.104416. [Google Scholar] [PubMed] [CrossRef]
17. Storelli L, Azzimonti M, Gueye M, Vizzino C, Preziosa P, Tedeschi G, et al. A deep learning approach to predicting disease progression in multiple sclerosis using magnetic resonance imaging. Investig Radiol. 2022;57(7):423–32. doi:10.1097/RLI.0000000000000854. [Google Scholar] [PubMed] [CrossRef]
18. Seok JM, Cho W, Chung YH, Ju H, Kim ST, Seong JK, et al. Differentiation between multiple sclerosis and neuromyelitis optica spectrum disorder using a deep learning model. Sci Rep. 2023;13(1):11625. doi:10.1038/s41598-023-38271-x. [Google Scholar] [PubMed] [CrossRef]
19. Hagiwara A, Otsuka Y, Andica C, Kato S, Yokoyama K, Hori M, et al. Differentiation between multiple sclerosis and neuromyelitis optica spectrum disorders by multiparametric quantitative MRI using convolutional neural network. J Clin Neurosci. 2021;87:55–8. doi:10.1016/j.jocn.2021.02.018. [Google Scholar] [PubMed] [CrossRef]
20. Alijamaat A, NikravanShalmani A, Bayat P. Multiple sclerosis identification in brain MRI images using wavelet convolutional neural networks. Int J Imag Syst Technol. 2021;31(2):778–85. doi:10.1002/ima.22492. [Google Scholar] [CrossRef]
21. Rehan Afzal HM, Luo S, Ramadan S, Lechner-Scott J, Ruhul Amin M, Li J, et al. Automatic and robust segmentation of multiple sclerosis lesions with convolutional neural networks. Comput Mater Contin. 2020;66(1):977–91. doi:10.32604/cmc.2020.012448. [Google Scholar] [CrossRef]
22. Yılmaz Acar Z, Başçiftçi F, Ekmekci AH. A convolutional neural network model for identifying multiple sclerosis on brain FLAIR MRI. Sustain Comput Inform Syst. 2022;35:100706. doi:10.1016/j.suscom.2022.100706. [Google Scholar] [CrossRef]
23. McKinley R, Wepfer R, Aschwanden F, Grunder L, Muri R, Rummel C, et al. Simultaneous lesion and brain segmentation in multiple sclerosis using deep neural networks. Sci Rep. 2021;11(1):1087. doi:10.1038/s41598-020-79925-4. [Google Scholar] [PubMed] [CrossRef]
24. Coronado I, Gabr RE, Narayana PA. Deep learning segmentation of gadolinium-enhancing lesions in multiple sclerosis. Mult Scler. 2021;27(4):519–27. doi:10.1177/1352458520921364. [Google Scholar] [PubMed] [CrossRef]
25. Fenneteau A, Bourdon P, Helbert D, Fernandez-Maloigne C, Habas C, Guillevin R. Investigating efficient CNN architecture for multiple sclerosis lesion segmentation. J Med Imaging. 2021;8(1):014504. doi:10.1117/1.JMI.8.1.014504. [Google Scholar] [PubMed] [CrossRef]
26. López-Dorado A, Ortiz M, Satue M, Rodrigo MJ, Barea R, Sánchez-Morla EM, et al. Early diagnosis of multiple sclerosis using swept-source optical coherence tomography and convolutional neural networks trained with data augmentation. Sensors. 2021;22(1):167. doi:10.3390/s22010167. [Google Scholar] [PubMed] [CrossRef]
27. Cruciani F, Brusini L, Zucchelli M, Retuci Pinheiro G, Setti F, Boscolo Galazzo I, et al. Interpretable deep learning as a means for decrypting disease signature in multiple sclerosis. J Neural Eng. 2021;18(4):0460a6. doi:10.1088/1741-2552/ac0f4b. [Google Scholar] [PubMed] [CrossRef]
28. Zhang Y, Hong D, McClement D, Oladosu O, Pridham G, Slaney G. Grad-CAM helps interpret the deep learning models trained to classify multiple sclerosis types using clinical brain magnetic resonance imaging. J Neurosci Methods. 2021;353:109098. doi:10.1016/j.jneumeth.2021.109098. [Google Scholar] [PubMed] [CrossRef]
29. Alijamaat A, Nikravan Shalmani AR, Bayat P. Diagnosis of multiple sclerosis disease in brain MRI images using convolutional neural networks based on wavelet pooling. J AI Data Min. 2021;9:161–8. doi:10.22044/JADM.2021.9783.2109. [Google Scholar] [CrossRef]
30. Gatea F. Multiple Sclerosis [Internet]. [cited 2025 Feb 20]. Available from: https://www.kaggle.com/datasets/falahgatea/multiple-sclerosis. [Google Scholar]
31. Chede S, Washimkar S. Progression detection of multiple sclerosis in brain MRI images. In: Shinde SV, Bendre V, Hemanth DJ, Balafar MA, editors. Applied artificial intelligence: a biomedical perspective. Abingdon, UK: Talylor Francis Group; 2023. p. 133–50. [Google Scholar]
32. Alharbi KO, Abujamea AH, Alomair OI, Alsakkaf HM, Alharbi AA, Alghamdi SA, et al. Improving cervical spinal cord lesion detection in multiple sclerosis using filtered fused proton density-T2 weighted images. Acta Radiol Open. 2022;11(6):20584601221105228. doi:10.1177/20584601221105228. [Google Scholar] [PubMed] [CrossRef]
33. Qian Q, Cheng K, Qian W, Deng Q, Wang Y. Image segmentation using active contours with hessian-based gradient vector flow external force. Sensors. 2022;22(13):4956. doi:10.3390/s22134956. [Google Scholar] [PubMed] [CrossRef]
34. Ganesh S, Kannadhasan S, Jayachandran A. Multi class robust brain tumor with hybrid classification using DTA algorithm. Heliyon. 2024;10(1):e23610. doi:10.1016/j.heliyon.2023.e23610. [Google Scholar] [PubMed] [CrossRef]
35. Wang D, Dang X, Liu W, Wang Y. Image segmentation using active contours with image structure adaptive gradient vector flow external force. Front Appl Math Stat. 2023;9:1271296. doi:10.3389/fams.2023.1271296. [Google Scholar] [CrossRef]
36. Guo Q, Li R, Zhou W, Li X. Image segmentation-based cervical spine MRI images to evaluate the treatment of patients with chronic pain. Comput Math Methods Med. 2022;2022(2):2648659. doi:10.1155/2022/2648659. [Google Scholar] [PubMed] [CrossRef]
37. Li JB, Farrell JW, Valles D. Data augmentation for classifying multiple sclerosis severity through inertial measurement unit-based gait analysis. In: Proceedings of the 2024 IEEE International Conference on Bioinformatics and Biomedicine (BIBM); 2024 Dec 3–6; Lisbon, Portugal. doi:10.1109/BIBM62325.2024.10822219. [Google Scholar] [CrossRef]
38. Rahman MA, Masum MI, Hasib KM, Mridha MF, Alfarhood S, Safran M, et al. GliomaCNN: an effective lightweight CNN model in assessment of classifying brain tumor from magnetic resonance images using explainable AI. Comput Model Eng Sci. 2024;140(3):2425–48. doi:10.32604/cmes.2024.050760. [Google Scholar] [CrossRef]
39. Messaoud NH, Mansour A, Aissi M, Ayari R, Frih M, Ben Abdallah A, et al. Automated segmentation of multiple sclerosis lesions based on convolutional neural networks. Comput Meth Biomech Biomed Eng Imag Vis. 2023;11(4):1359–77. doi:10.1080/21681163.2022.2129454. [Google Scholar] [CrossRef]
40. Rondinella A, Crispino E, Guarnera F, Giudice O, Ortis A, Russo G, et al. Boosting multiple sclerosis lesion segmentation through attention mechanism. Comput Biol Med. 2023;161(3):107021. doi:10.1016/j.compbiomed.2023.107021. [Google Scholar] [PubMed] [CrossRef]
41. Ma Y, Zhang C, Cabezas M, Song Y, Tang Z, Liu D, et al. Multiple sclerosis lesion analysis in brain magnetic resonance images: techniques and clinical applications. IEEE J Biomed Health Inform. 2022;26(6):2680–92. doi:10.1109/JBHI.2022.3151741. [Google Scholar] [PubMed] [CrossRef]
42. Awadallah MA, Makhadmeh SN, Al-Betar MA, Dalbah LM, Al-Redhaei A, Kouka S, et al. Multi-objective ant colony optimization: review. Arch Comput Meth Eng. 2025;32(2):995–1037. doi:10.1007/s11831-024-10178-4. [Google Scholar] [CrossRef]
43. Rasouli S, Dakkali MS, Azarbad R, Ghazvini A, Asani M, Mirzaasgari Z, et al. Predicting the conversion from clinically isolated syndrome to multiple sclerosis: an explainable machine learning approach. Mult Scler Relat Disord. 2024;86(1):105614. doi:10.1016/j.msard.2024.105614. [Google Scholar] [PubMed] [CrossRef]
Cite This Article
 Copyright © 2025 The Author(s). Published by Tech Science Press.
This work is licensed under a Creative Commons Attribution 4.0 International License , which permits unrestricted use, distribution, and reproduction in any medium, provided the original work is properly cited.
 Downloads
 Citation Tools