
 Submit a Paper
 Propose a Special lssue
 Open Access
ARTICLE

Enhancing IoT Resilience at the Edge: A Resource-Efficient Framework for Real-Time Anomaly Detection in Streaming Data
1 Department of Mathematics, Amrita School of Physical Sciences, Amrita Vishwa Vidyapeetham, Coimbatore, 641112, India
2 Department of Computer Science, College of Computer and Information Sciences, King Saud University, Riyadh, 11543, Saudi Arabia
3 School of Computer Science and Engineering, The University of Aizu, Aizuwakamatsu, Fukushima, 965-0006, Japan
* Corresponding Authors: Kirubavathi G.. Email: ; Sultan Alfarhood. Email:
Computer Modeling in Engineering & Sciences 2025, 143(3), 3005-3031. https://doi.org/10.32604/cmes.2025.065698
Received 19 March 2025; Accepted 29 May 2025; Issue published 30 June 2025
 View Full Text
 Download PDF
Abstract
The exponential expansion of the Internet of Things (IoT), Industrial Internet of Things (IIoT), and Transportation Management of Things (TMoT) produces vast amounts of real-time streaming data. Ensuring system dependability, operational efficiency, and security depends on the identification of anomalies in these dynamic and resource-constrained systems. Due to their high computational requirements and inability to efficiently process continuous data streams, traditional anomaly detection techniques often fail in IoT systems. This work presents a resource-efficient adaptive anomaly detection model for real-time streaming data in IoT systems. Extensive experiments were carried out on multiple real-world datasets, achieving an average accuracy score of 96.06% with an execution time close to 7.5 milliseconds for each individual streaming data point, demonstrating its potential for real-time, resource-constrained applications. The model uses Principal Component Analysis (PCA) for dimensionality reduction and a Z-score technique for anomaly detection. It maintains a low computational footprint with a sliding window mechanism, enabling incremental data processing and identification of both transient and sustained anomalies without storing historical data. The system uses a Multivariate Linear Regression (MLR) based imputation technique that estimates missing or corrupted sensor values, preserving data integrity prior to anomaly detection. The suggested solution is appropriate for many uses in smart cities, industrial automation, environmental monitoring, IoT security, and intelligent transportation systems, and is particularly well-suited for resource-constrained edge devices.Keywords
The rapid development of the Internet of Things (IoT) and its specialised branches, like Industrial Internet of Things (IIoT) and the Transportation Management of Things (TMoT), has transformed data-driven decision-making across various fields, such as smart cities, industrial automation, environmental monitoring, and intelligent transportation systems. These linked ecosystems generate vast real-time streaming data from heterogeneous sensors and devices. However, for real-time anomaly detection, a necessary component for ensuring system dependability, operational efficiency, and safety, the inherent resource constraints of edge devices, such as low computational power, memory, and energy, pose major challenges. Anomaly detection in IoT, IIoT, and TMoT networks helps to identify unexpected behaviours, including equipment malfunctions, cyberattacks, environmental hazards, and transportation delays [1]. Furthermore, the dynamic nature of concept drift in streaming data and the need for real-time responsiveness, particularly in resource-limited environments like edge computing platforms and Wireless Sensor Networks (WSN), is a significant challenge [2].
This work presents a scalable anomaly detection system, especially for IoT, IIoT, and TMoT systems, whereby real-time anomaly identification is based on predefined sensor thresholds. Anomalies can occur as isolated outliers in spatial data or as unexpected shifts in time-series trends. The proposed method combines Principal Component Analysis (PCA) for dimensionality reduction and a Z-score-based outlier detection mechanism to efficiently flag deviations within a sliding window architecture, allowing continuous streaming data processing. The system also employs linear regression-based imputation to handle missing or incomplete sensor data, guaranteeing robust anomaly detection even in data gaps, a common occurrence in IoT networks. The lightweight computational footprint of this approach is advantageous for low-power edge nodes, Arduino, Raspberry Pi, and other IoT devices with limited resources. PCA reduces data complexity, while the Z-score method enables fast, statistically driven anomaly detection without requiring extensive model training. The sliding window mechanism supports real-time data updates, allowing the system to adapt to evolving data patterns and detect contextual anomalies and point anomalies in dynamic environments.
This work complements current advancements in anomaly detection systems such as IoT systems, including quantised autoencoders [3] for intrusion detection in resource-limited devices and Preprocessed Isolation Forest (PiForest) for streaming data [4]. The proposed anomaly detection system provides a scalable, real-time, and resource-efficient solution for IoT, IIoT, and TMoT systems. Enhancing anomaly detection capabilities in resource-constrained environments helps increase system resilience, operational efficiency, and decision-making accuracy in significant, data-driven applications. The suggested model is motivated by two factors. Its primary goal is to overcome concept drift, which occurs when previously trained models lose accuracy over time due to changes in the target variable’s statistical characteristics. Second, it addresses situations where sensor defects prevent data transmission. The model can nevertheless produce accurate results in these situations. The following are this paper’s primary contributions:
• A resource-efficient anomaly detection framework intended for real-time monitoring in IoT and network security environments.
• MLR-based technique estimates missing or corrupted sensor values, preserving data integrity prior to anomaly detection.
• Following the application of PCA for dimensionality reduction, Z-score-based anomaly detection is performed to obtain accurate predictions.
• The proposed Algorithm is tested on several real-world datasets.
The paper is organized as follows: Section 2 reviews relevant research and contributions. Section 3 outlines the datasets and methodology used to achieve high detection accuracy and efficiency. In Section 4, we evaluate performance across multiple datasets, adjusting the sliding window size and threshold value. Section 5 discusses the findings and their implications, while Section 6 concludes the paper and suggests future improvements.
Chatterjee and Ahmed [1] reviewed anomaly detection methods in the IoT, emphasising the increasing need for reliable detection in sectors like smart cities, healthcare, and network security. They identified challenges such as managing high-dimensional and multi-modal data, ensuring data privacy, and developing lightweight models for resource-constrained IoT systems. Jain et al. [4] introduced PiForest, an enhanced anomaly detection method that overcomes the limitations of the isolation forest (iForest) algorithm by incorporating a preprocessing stage and a sliding window mechanism. With the rise of real-time analytics, traditional batch-oriented Machine Learning (ML) models struggle with scalability and latency. In response, Jamil et al. [5] developed the Scalable Online ML and Data Mining Algorithms (SOLMA) package. SOLMA improves Apache Flink’s capabilities for low-latency processing of continuous data streams by integrating scalable algorithms for classification, regression, and anomaly detection, making it a vital tool for IoT security and real-time analytics.
Min-Gyu Kim [6] created an autoencoder-based model for one-class anomaly detection in encrypted IoT network traffic, showcasing the potential of self-supervised learning in resource-limited scenarios. To enhance Advanced Persistent Threat (APT) detection in the IIoT domain, Kirubavathi and Guruakshya [7,8] presented an ensemble stacked boosting framework using ML models like Gradient Boost, XGBoost, LightGBM, and Random Forest, along with a meta-classifier based on Linear Discriminant Analysis (LDA) to address DDoS and other network attacks. Liu et al. [9] introduced a distributed data streaming strategy using random projection techniques in a sketch-based framework to enhance PCA-based anomaly detection. This approach allowed local monitors to perform lightweight data aggregation before sending compressed data to a centralised Network Operation Center (NOC), significantly reducing computational strain and memory usage while preserving detection accuracy.
Kumar and Champa [10] proposed a hybrid data analysis system that integrated PCA with an enhanced k-Nearest Neighbours (kNN) method for efficient outlier detection and sensor data aggregation in IoT systems. Gupta et al. [11] introduced an LSTM-based framework for detecting elderly falls in smart homes, focusing on resource-constrained settings. They employed the Synthetic Minority Over-sampling Technique (SMOTE) to address class imbalances, resulting in an enriched dataset that improved classification performance. Their model demonstrated the effectiveness of lightweight DL for real-time monitoring in smart healthcare and IoT applications. Early anomaly detection in technical systems, especially in manufacturing automation, is essential for worker safety and reducing downtime and losses. Migenda and Schenck [12] proposed an improved version of Neural Gas Principal Component Analysis (NGPCA), incorporating adaptive dimensionality reduction for every local PCA model in response to the challenges presented by streaming data and concept drift in such situations. Especially in resource-limited technical systems, traditional anomaly detection techniques such as autoencoders and Gaussian Mixture Models (GMMs) either suffer from poor interpretability or computational inefficiency.
Sun et al. [13] presented Dynamic Tensor Analysis (DTA) and its derivative Streaming Tensor Analysis (STA), which expands conventional matrix decomposition to accommodate higher-order data structures, such as tensors, while maintaining scalability and efficiency in dynamic contexts. By developing new methods for approximating total functions over sliding windows in both single-stream and distributed-stream models, Gibbons and Tirthapura [14] addressed this demand. Their study focused on the sliding window setting, analysing only the most recent data items. This is essential for applications like network monitoring and telecommunications, where outdated data loses value. The authors proposed methods to optimise time and space complexity, enabling accurate estimations of important data and supporting tasks such as traffic analysis, anomaly detection, and network security monitoring. Time-series data anomaly detection has been extensively investigated using both unsupervised techniques like clustering and statistical analysis, and conventional methodologies typically depending on supervised methods, including Support Vector Machines (SVM) and Decision Trees (DT). However, many of these techniques, meanwhile, are meant for batch processing and struggle with the specific challenges of real-time streaming data, such as concept drift, noise, and the need for continuous learning [15].
Cook et al. [16] examined the challenges of anomaly detection in IoT systems, such as high dimensionality, contextual dependencies, noise, and concept drift. They reviewed various detection methods, from traditional statistical techniques to advanced ML models like Recurrent Neural Networks (RNNs) and LSTM, categorising anomalies into point, contextual, and collective types. The authors highlighted the growing importance of unsupervised and semi-supervised learning for real-time anomaly detection and highlighted the need for scalable, resource-efficient models that can adapt to changing conditions in IoT applications. Li et al. [17] proposed a lightweight framework for unsupervised network anomaly detection that combines deep autoencoding with density estimation, improving detection performance over baseline models on intrusion detection datasets. Vázquez et al. [2] examined anomaly detection techniques in streaming data, considering issues like non-stationary data and concept drift. They evaluated eight algorithms for accuracy, memory use, and parameterisation across different conditions.
Zhang et al. [18] proposed a method using a novel y-distance metric enhanced by PCA to quickly identify sensor problems in gas turbines, ensuring system integrity and safety with minimal computational demands. Jinad et al. [19] developed a multi-squad monitoring architecture for military operations, enabling real-time anomaly detection in vital physiological parameters with low latency. Alalwany et al. [20] explored DL-based intrusion detection in Internet of Medical Things (IoMT) networks using a stacking ensemble approach, achieving high accuracy in dynamic healthcare settings. Venkataanusha et al. [21] developed a method for identifying outliers in high-dimensional datasets, emphasising efficiency and accuracy in anomaly detection for critical areas like healthcare and fraud detection. Their Z-score approach highlights anomalies by measuring deviations beyond 3 standard deviations, minimising false positives while handling large datasets efficiently.
Sharmila and Nagapadma [3] introduced a Quantised Autoencoder (QAE) for anomaly detection in resource-limited IoT devices, focusing on balancing model accuracy with lower memory usage, CPU load, and energy consumption. Their work aims to improve network anomaly detection across sectors like smart cities and healthcare. Teixeira and Milidiú [22] presented the Fast Rank-adaptive row-householder Subspace Tracking (FRAHST) algorithm, which dynamically adjusts latent variables to address anomaly detection in changing data. FRAHST effectively processes real-time streaming data, making it suitable for network monitoring and other scalability-required applications. Song et al. [23] introduced an adaptive Graph Convolutional Network (AS-GCN-MTM) for anomaly detection in IoT systems, utilising a Mean-Teacher Mechanism to improve generalisation with limited labelled data.
Qi et al. [24] proposed the Multiaspect Data Stream Anomaly Detection (MDS_AD) method for intelligent intrusion detection in Industry 4.0 environments. This method addresses the challenges of dynamic, multispectral data streams, which include both point and group anomalies, as well as inter-attribute correlations. MDS_AD surpasses traditional techniques by using Locality Sensitive Hashing (LSH) for efficient handling of mixed data types, iForest for anomaly isolation, and PCA for dimensionality reduction. Operating in a streaming manner, it ensures scalability and real-time anomaly detection while maintaining consistent memory and time complexity. Zachos et al. [25] presented a lightweight Anomaly-Based Intrusion Detection System (AIDS) specifically tailored for resource-constrained devices in IoMT networks, addressing the critical security issues raised by limited computational resources and network heterogeneity. Operating on IoMT devices to gather behavioural data (e.g., CPU and memory consumption), the Remote Detection Engine (RDE) component was deployed on a gateway to process and analyse data for anomalies.
Huo et al. [26] developed a novel traffic anomaly detection method that combines an enhanced Gated Recurrent Unit (GRU) model with an optimised K-means clustering algorithm, called EFMS-Kmeans. This approach improves detection accuracy in streaming data environments by using a modified highway GRU (HS-GRU) to forecast traffic patterns, along with Seasonal Trend decomposition with the Loess (STL) algorithm and Box-Cox transformation to capture periodic behaviours. EFMS-Kmeans processes the traffic data, dynamically optimising the number of clusters through a combination of Mean Shift clustering and electrostatic force optimisation. This method identifies anomalous traffic patterns in real-time with superior accuracy and efficiency compared to traditional techniques, making it ideal for resource-constrained IoT systems.
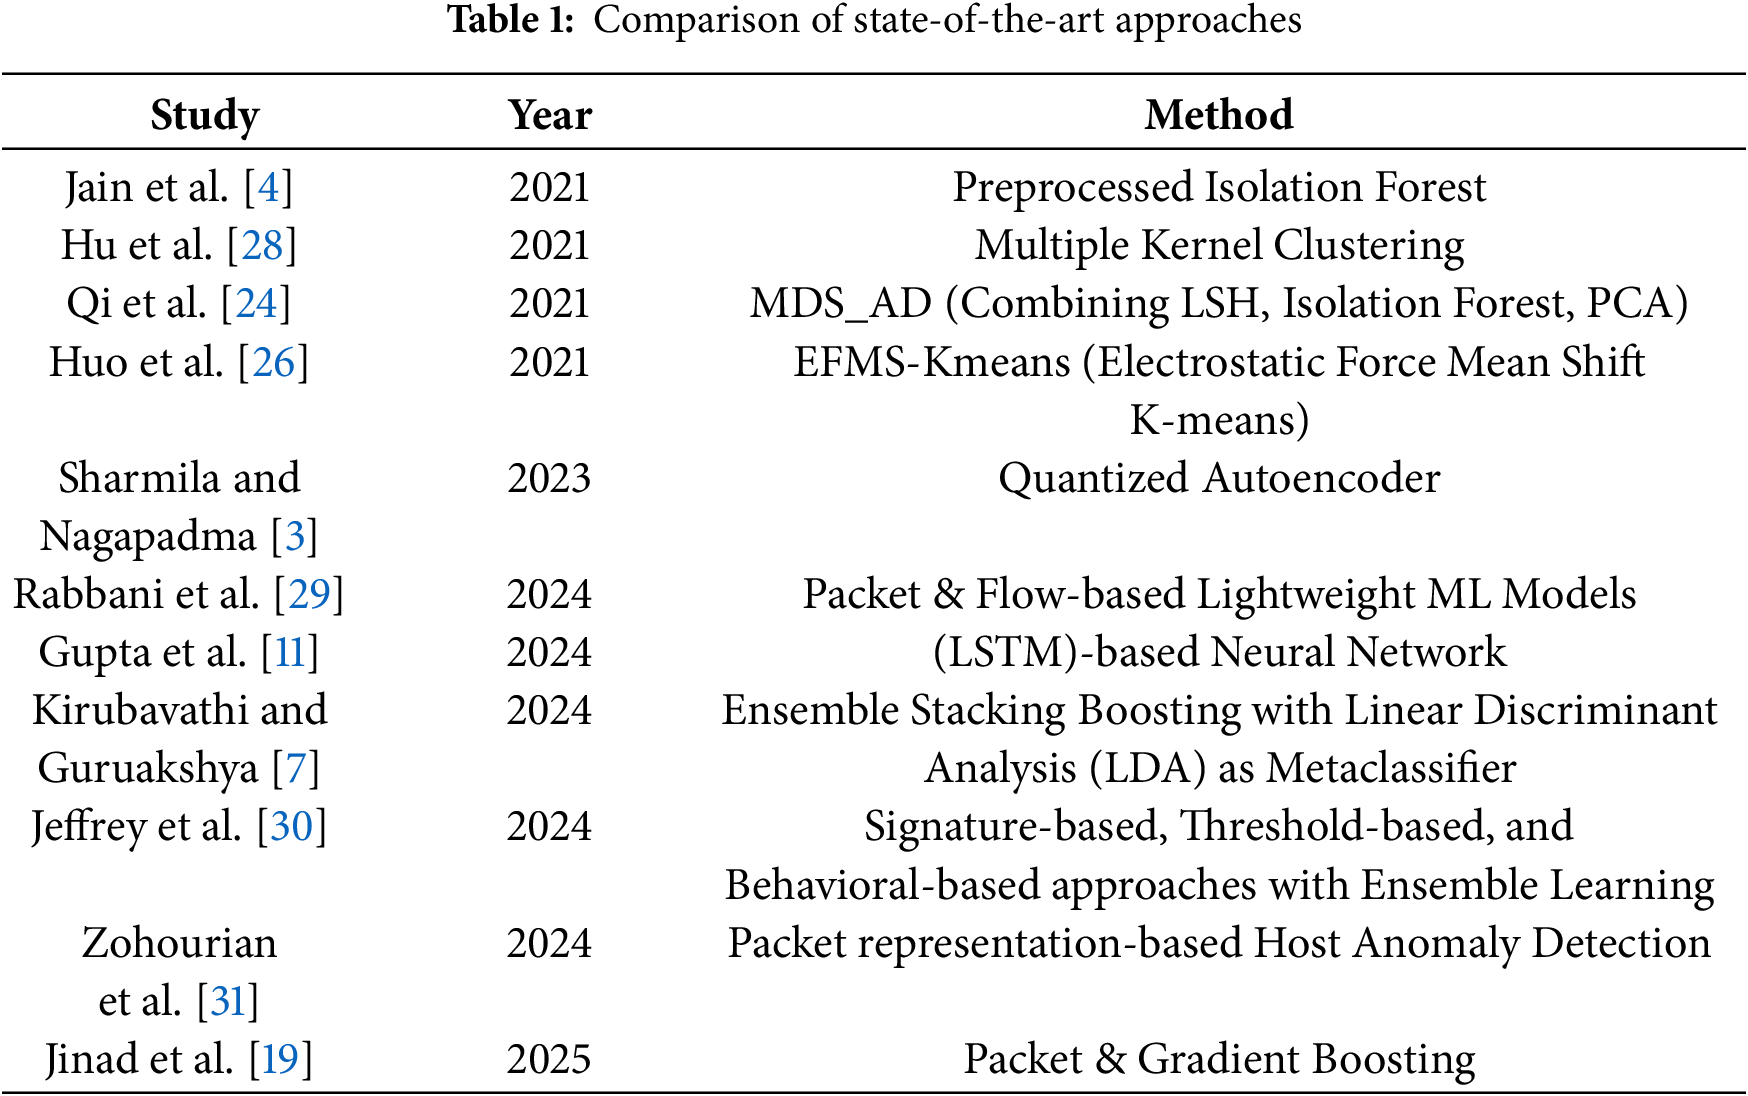
Yatagha et al. [27] assessed the complexity and real-time performance of ML models for anomaly detection in environments with limited resources, emphasising RF, SVM, XGBoost, Neural Networks, Autoencoders, and Logistic Regression. Utilising theoretical analysis and empirical testing on datasets from industrial monitoring, agriculture, and healthcare, the paper underlined the trade-off between model accuracy and computational requirements. Even if they offer great accuracy, complex models like neural networks and autoencoders need major optimisation for edge implementation; simpler models like RF and Logistic Regression may sacrifice accuracy. Variational autoencoders have shown better resistance against adversarial attacks. The work offered a decision matrix to allow model selection based on variables including resource use, real-time performance, and robustness, thereby supporting effective anomaly detection in environments with limited resources. Table 1 provides a comparison of the state-of-the-art works.
The datasets and techniques used to create and assess the proposed anomaly detection system are described in this section. Continuous streaming data from IoT devices is analysed using anomaly detection techniques and monitored in real-time to enable rapid identification of irregular activity and possible system failures.
Three different datasets covering both environmental monitoring and network intrusion detection scenarios were used to validate the efficiency of the proposed anomaly detection framework. These datasets comprise two NetFlow-based network traffic datasets intended for cybersecurity research, as well as actual sensor data from a WSN node.
3.1.1 Arduino Real-World Dataset
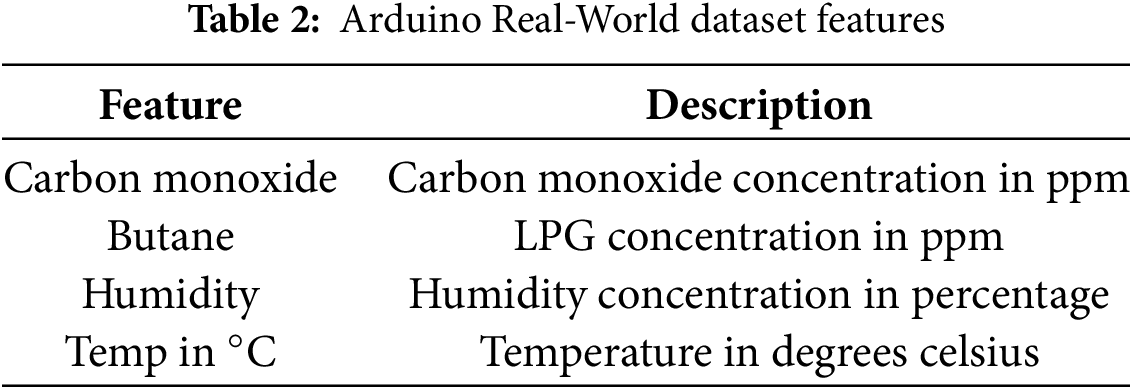
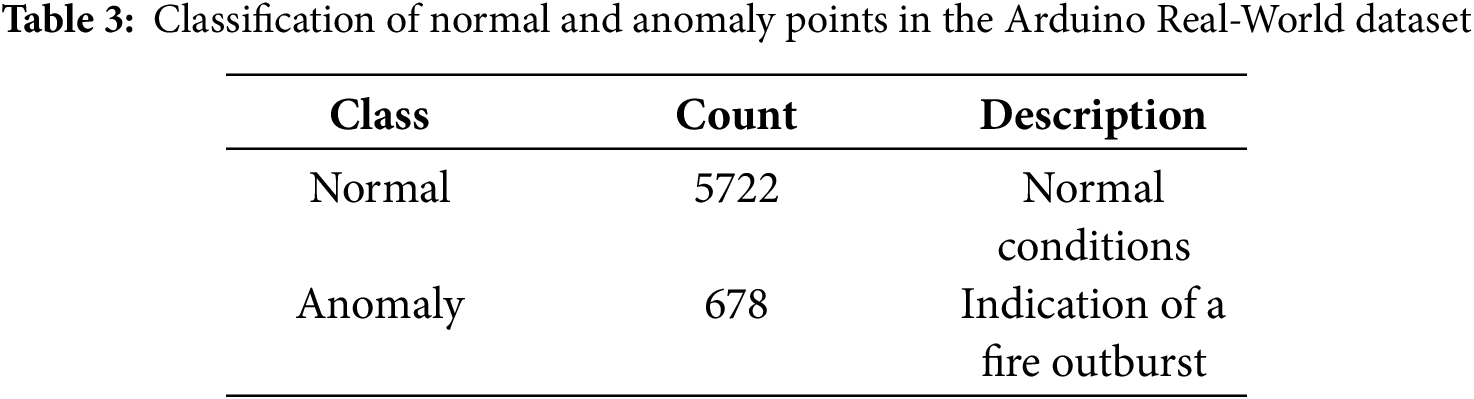
This collection came from a WSN node that combines three environmental sensors with an Arduino UNO microcontroller. DHT11 is used for temperature and humidity monitoring, MQ6 is used for butane gas detection, and MQ7 is used for carbon monoxide (CO) detection. Constantly observing environmental conditions, the WSN node creates streaming data to replicate real-time operational scenarios [4]. Finding abnormalities that might point to dangerous circumstances, such as fire hazards or gas leaks, is the main goal of gathering this information. The dataset consists of four features and a binary classification as shown in Tables 2 and 3, respectively. Carbon Monoxide: Sensor readings indicating CO levels, Butane: Sensor readings for butane gas levels. Humidity: The percentage of humidity in the environment, Temp in ∘C: temperature readings in degrees Celsius, Class: A binary class label where 0 represents normal conditions and 1 indicates an anomaly. Created especially for real-time anomaly detection in IoT-based environmental monitoring systems, this dataset is especially for uses like fire detection, where a mix of rising temperature, CO levels, and butane gas may indicate an environmental hazard. The anomaly labels help in the training and evaluation of ML models. Notably, PCA conducted on the dataset indicated the first principal component accounts for approximately 99.06% of the total variance, indicating a highly structured dataset with minimal redundancy. Using this dataset, the proposed framework aims to enhance early warning systems and safety protocols in IoT systems with constrained means.
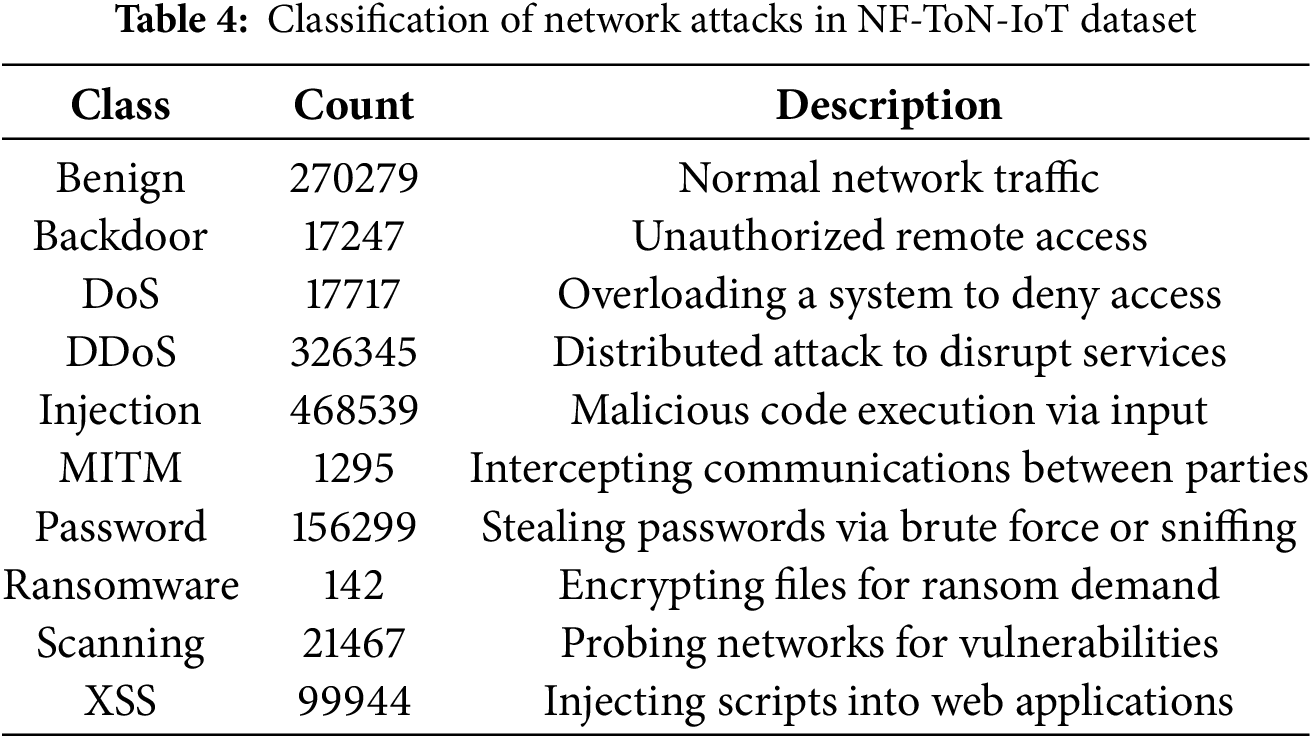
The NF-ToN-IoT [32] dataset is a widely used NetFlow-based variant of the ToN-IoT dataset developed and evaluated for the aim of Network Intrusion Detection System (NIDS) development. This dataset was produced by converting raw packet capture (pcap) files into NetFlow records, offering a comprehensive view of network traffic and supporting accurate anomaly detection and efficient analysis. The dataset consists of twelve features and a multiclass classification as shown in Tables 4–6. This dataset is meant to help the creation of strong ML-based models on NIDS in challenging network environments and concentrates on contemporary attack patterns. Its all-encompassing coverage of benign and attack traffic guarantees a balanced dataset for training artificial intelligence (AI) models. Additionally, PCA on this dataset showed the first principal component captures approximately 93.42% of the total variance, emphasising the compactness of the dataset and its suitability for dimensionality reduction.
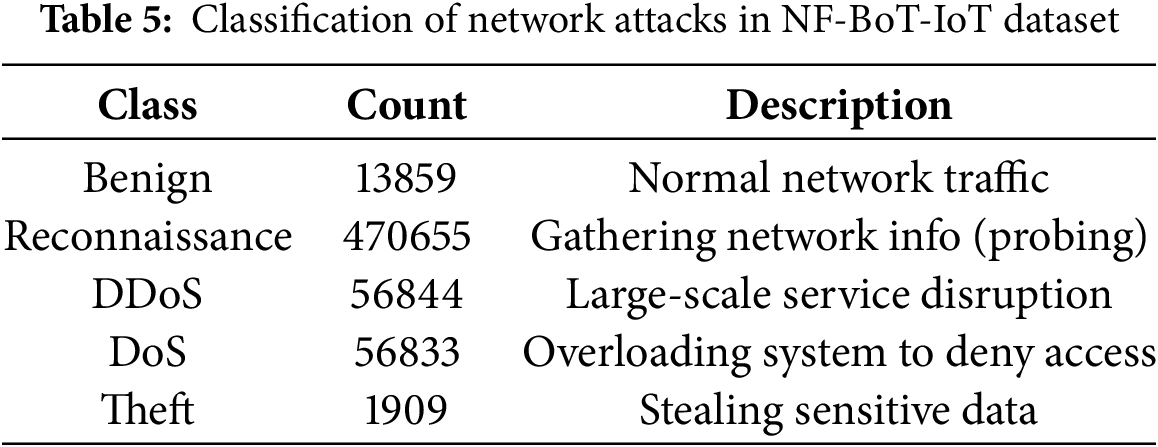
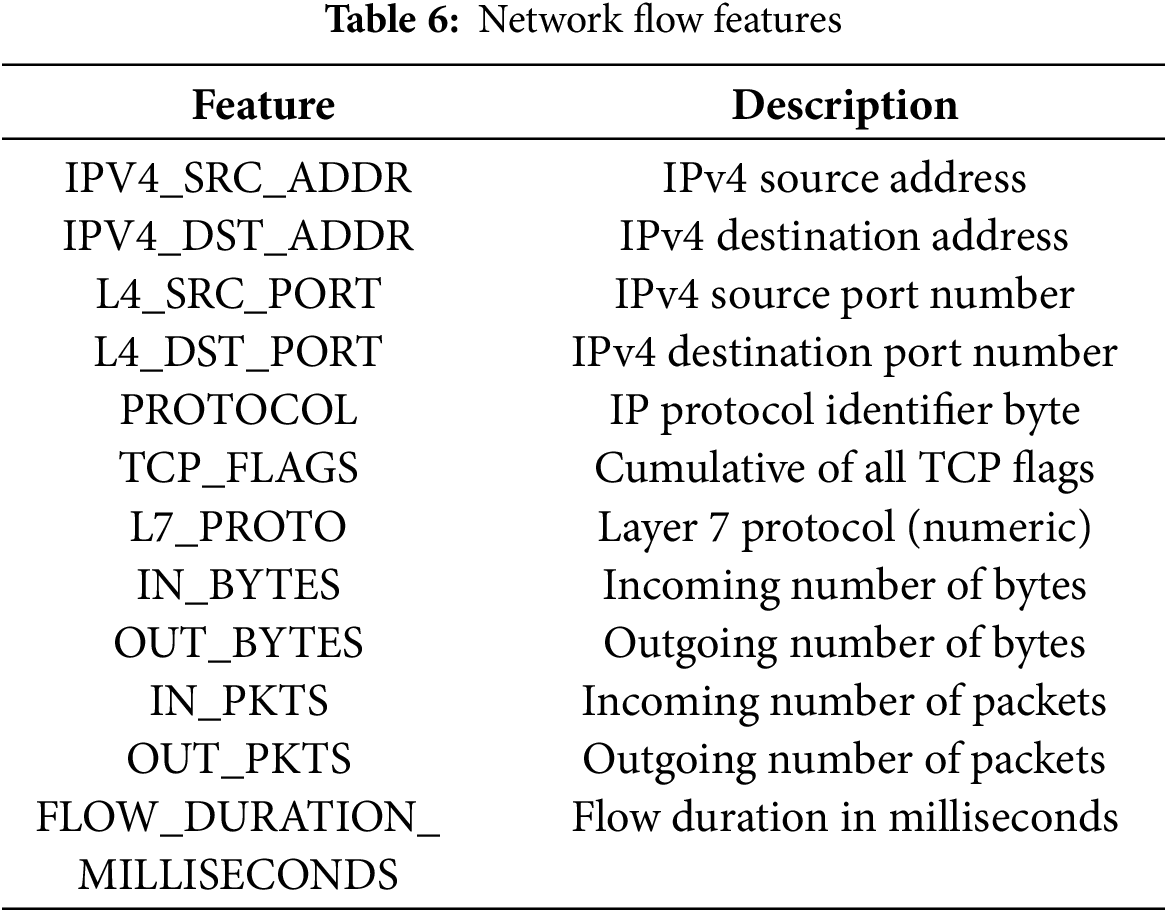
Derived from the original BoT-IoT dataset, this dataset is yet another NetFlow-based dataset like NF-ToN-IoT [32]. This dataset was produced by converting pcap files into NetFlow records. This method is suitable for analysing network traffic and spotting hostile activity, and is structured and efficient. The dataset consists of twelve features and a multiclass classification, as shown in Tables 5 and 6. The dataset captures a wide spectrum of attack situations, which provides a consistent benchmark for the training and testing of ML models intended to recognise and classify network intrusions. Its structure makes it a great fit for anomaly detection systems aiming at IoT-based network environments, acknowledging the need for real-time intrusion detection. Furthermore, PCA performed on the dataset revealed that the first principal component alone explains approximately 86.97% of the total variance, indicating a strong underlying structure in the data which can be used for dimensionality reduction.
3.1.4 Significance of the Datasets
Together, environmental monitoring data and network traffic datasets allow a thorough assessment of the suggested anomaly detection system in several IoT contexts. While the Arduino Real-World Dataset addresses real-time anomaly detection in environmental monitoring (e.g., fire hazards, gas leaks), the NF-BoT-IoT and NF-ToN-IoT datasets focus on enhancing cybersecurity in IoT networks by detecting a wide range of network intrusions. Together, these datasets facilitate the development and validation of a versatile anomaly detection framework that can be adapted for various IoT, IIoT, and TMoT applications, improving system resilience, operational safety, and security.
The logical workflow shown in Fig. 1 processes streaming sensor data using a sliding window approach, handles missing values and detects anomalies using MLR, PCA, and Z-score-based outlier detection. This method has been tested on three datasets separately.
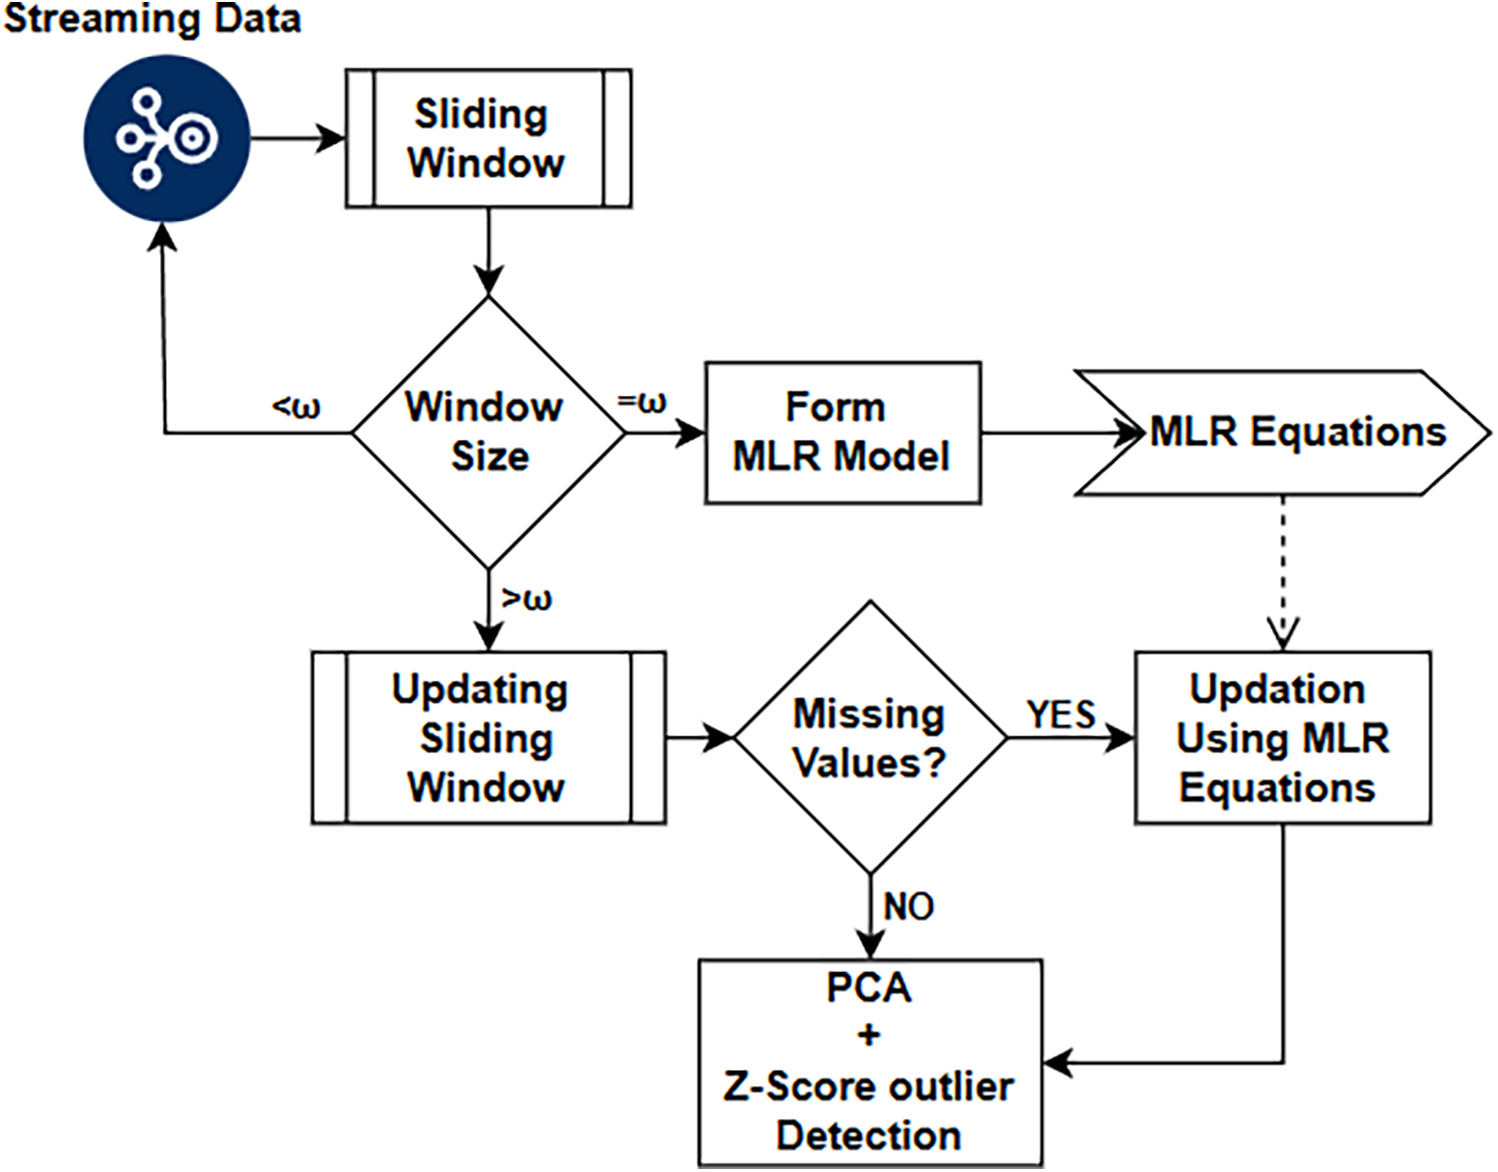
Figure 1: A systematic procedure for the proposed approach
3.2 Streaming Data and Sliding Window Initialisation
The sliding window mechanism processes streaming data by maintaining a fixed-size subset of the most recent data, updating it as new information arrives. This allows for efficient real-time analysis. To combat concept drift, the system tracks the most recent data within the sliding window and compares its distribution to earlier windows. If drift is detected, the model is retrained using the current window’s data. This approach reduces computing costs by focusing on recent data, ensuring the model remains adaptable to changes over time.
The system processes real-time sensor data using a Sliding Window technique. The maximum window size is denoted as
where:
• Y is the dependent variable (e.g., the sensor with missing values),
•
•
•
•
•
The coefficients are computed by Ordinary Least Squares (OLS) using Eq. (2):
Updating Sliding Window—If the current window size
3.3 PCA for Dimensionality Reduction
Principal Component Analysis (PCA) is widely used for dimensionality reduction, aiming to simplify complex datasets while preserving as much of the original variance as possible. It enhances efficiency in anomaly detection by focusing on the most important features, which reduces computational overhead and improves detection accuracy. PCA is particularly suitable for resource-constrained environments due to its minimal memory requirements, computational efficiency, and ease of use. Unlike nonlinear techniques such as t-distributed Stochastic Neighbour Embedding (t-SNE), Uniform Manifold Approximation and Projection (UMAP), or autoencoders, PCA relies solely on linear algebra (e.g., Singular Value Decomposition, or SVD), making it deterministic, fast, and scalable even on low-end hardware. It does not necessitate neural networks, extensive pairwise distance matrices, or iterative optimisation processes, all of which can be resource-intensive in terms of memory and processing power.
Additionally, PCA is ideal for preprocessing, noise reduction, and providing quick insights while working with limited computing or energy resources, thanks to its interpretability and ability to maintain the global structure of the data. In this context, PCA transforms all features into a single predictor that captures the individual contributions of every feature. The process begins with standardising the data to ensure that each feature has an equal impact on the analysis. Eq. (4) illustrates how each feature in the dataset is centred and scaled using its mean (
This step is crucial because features with larger scales could otherwise dominate the analysis. Once standardised, the next step involves computing the covariance matrix, which captures the linear relationships between the variables. The covariance matrix is calculated using Eq. (5):
where
The covariance matrix serves as the foundation for identifying the principal components. Following this, the eigenvalues (
Whereas the eigenvectors define the directions of each principal component in the feature space, the eigenvalues show the degree of variance explained by each component. The best eigenvector matching the greatest eigenvalue is chosen to obtain a single predictor. At last, the new feature space generated by the best eigenvector projects the original standardised data. Eq. (7) is used to accomplish this change.
where
The resulting data,
To detect anomalies in the data, the Z-score is applied to data
where:
•
•
•
•
If
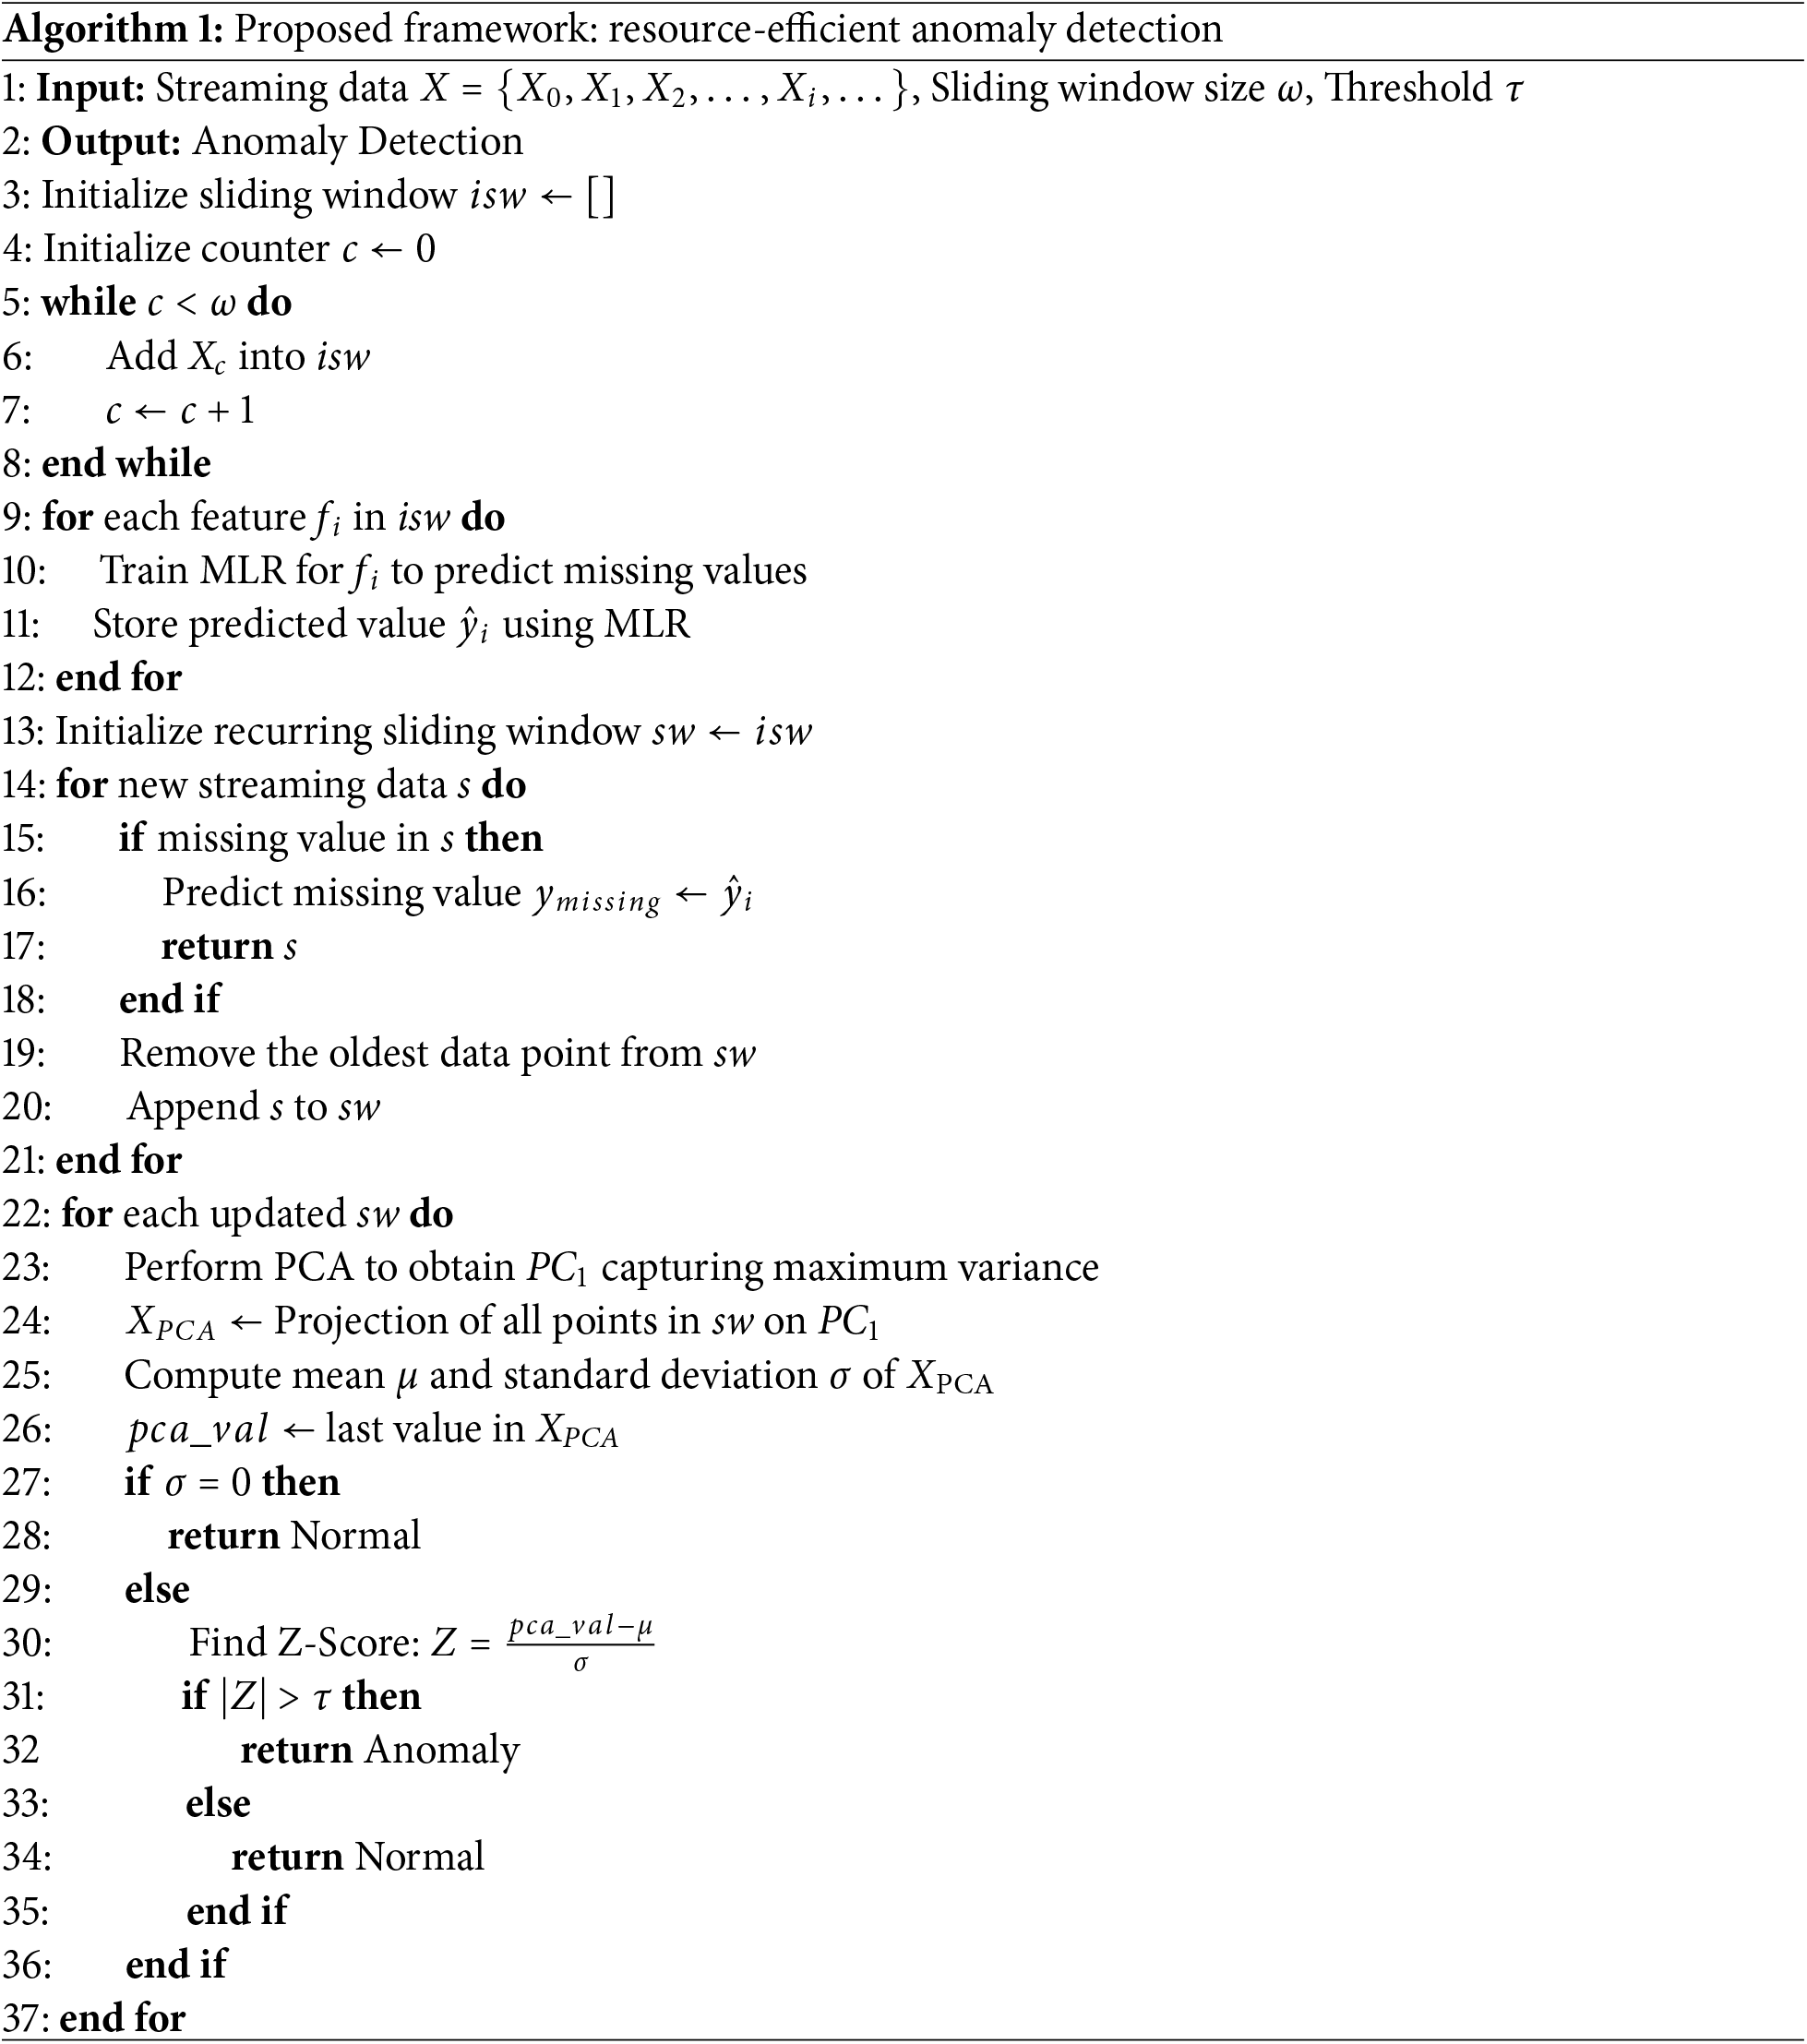
In conclusion, this framework processes streaming sensor data using a sliding window approach for resource-efficient real-time anomaly detection and sensor failure prediction by successfully integrating MLR for missing value prediction, PCA for dimensionality reduction, and Z-score for anomaly detection in real-time sensor data streams. As depicted in Fig. 2, enabling accurate and efficient detection of anomalies in dynamic environments. To enable continuous analysis, the streaming data produced by IoT devices is first divided into segments using a sliding window technique. To guarantee data completeness, any missing data points inside these windows are estimated and filled using an MLR model. After the data is finished, PCA is used to apply dimensionality reduction, which turns the data into a single representative feature. The Z-score approach, which divides each data point into normal and anomalous categories according to its statistical divergence from the mean, is then used to examine this reduced feature. The step-by-step process of this methodology is detailed in Algorithm 1.
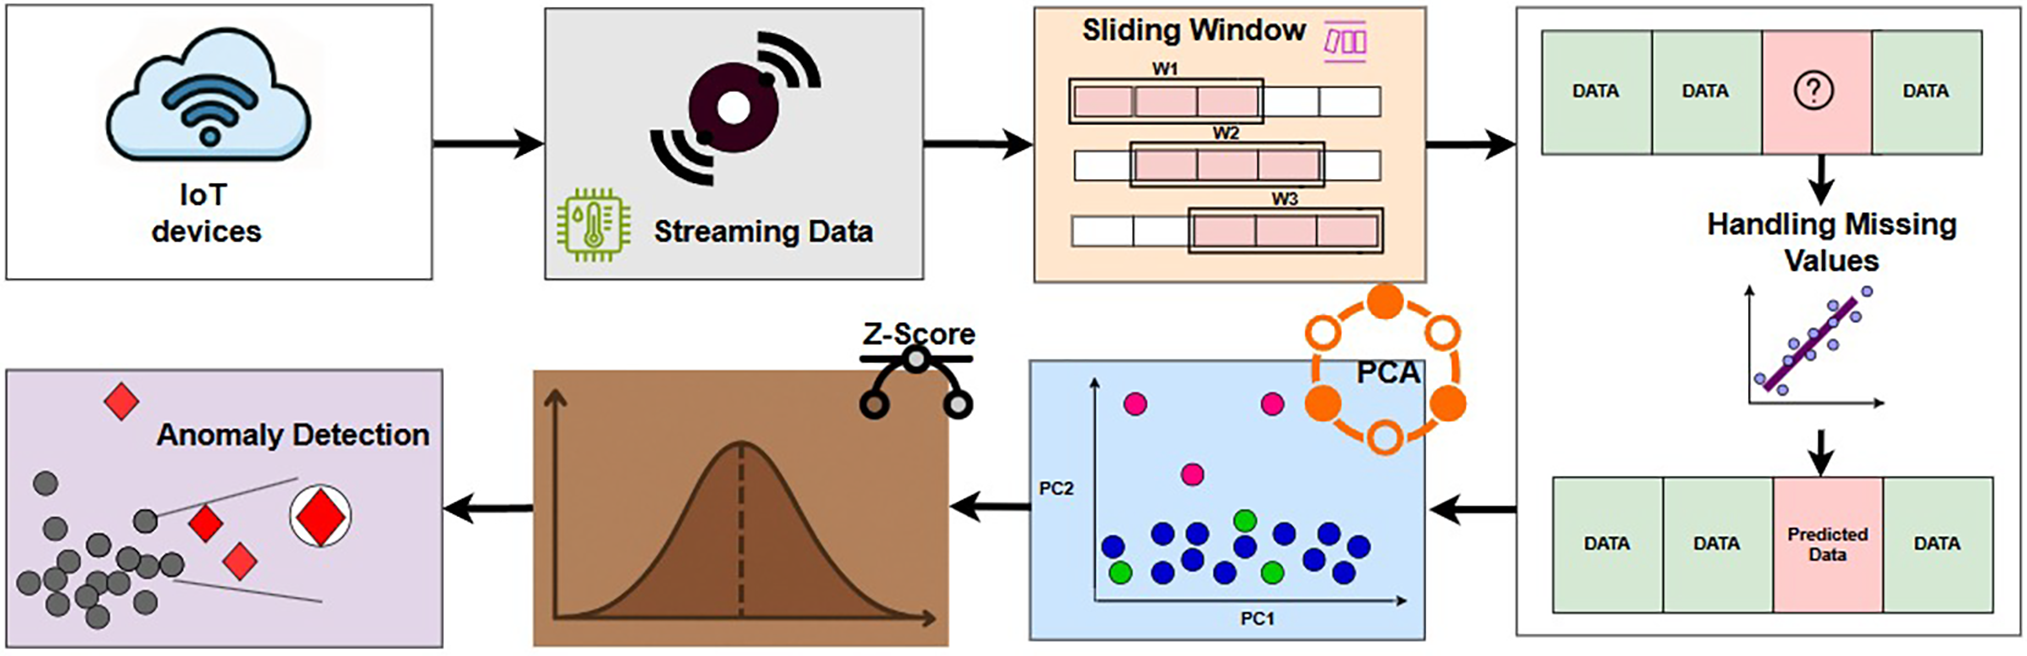
Figure 2: Workflow of the proposed anomaly detection framework, illustrating key processes such as streaming data collection, sliding window processing, handling of missing values, PCA-based dimensionality reduction, and anomaly detection using the Z-score
This section presents the experimental results evaluating the performance of the proposed anomaly detection framework using three distinct datasets: Arduino Real-World Dataset, NF-BoT-IoT, and NF-ToN-IoT. The evaluation focuses on key metrics such as accuracy and processing time, assessed under varying window sizes and Z-score thresholds to determine the framework’s adaptability and efficiency in resource-constrained environments.
The performance of the proposed anomaly-detecting system was assessed using the Arduino Real-World Dataset, which consists of streaming sensor data gathered from a WSN, including environmental sensors for temperature, humidity, and gas detection. Variations in sliding window size and Z-score threshold values let the tests measure effects on processing time and detection accuracy.
Table 7 shows that, although at the expense of more processing time, larger window sizes usually translate into better detection accuracy. Conversely, smaller windows afford somewhat less accuracy but faster processing. We choose Z-score thresholds ranging from 1.5 to 2.5 to investigate the trade-off between sensitivity and specificity in detecting outliers. A larger number of possible abnormalities, including marginal cases, can be flagged by lower criteria, such as 1.5, which are often more sensitive. Higher thresholds, like 2.5, on the other hand, are more conservative and only flag more extreme deviations as outliers, which helps reduce false positives. This range offers a useful compromise between minimising noise and overfitting and identifying significant anomalies. We fine-tuned by using a step of 0.25, which aids in identifying the best threshold for our particular dataset and task.
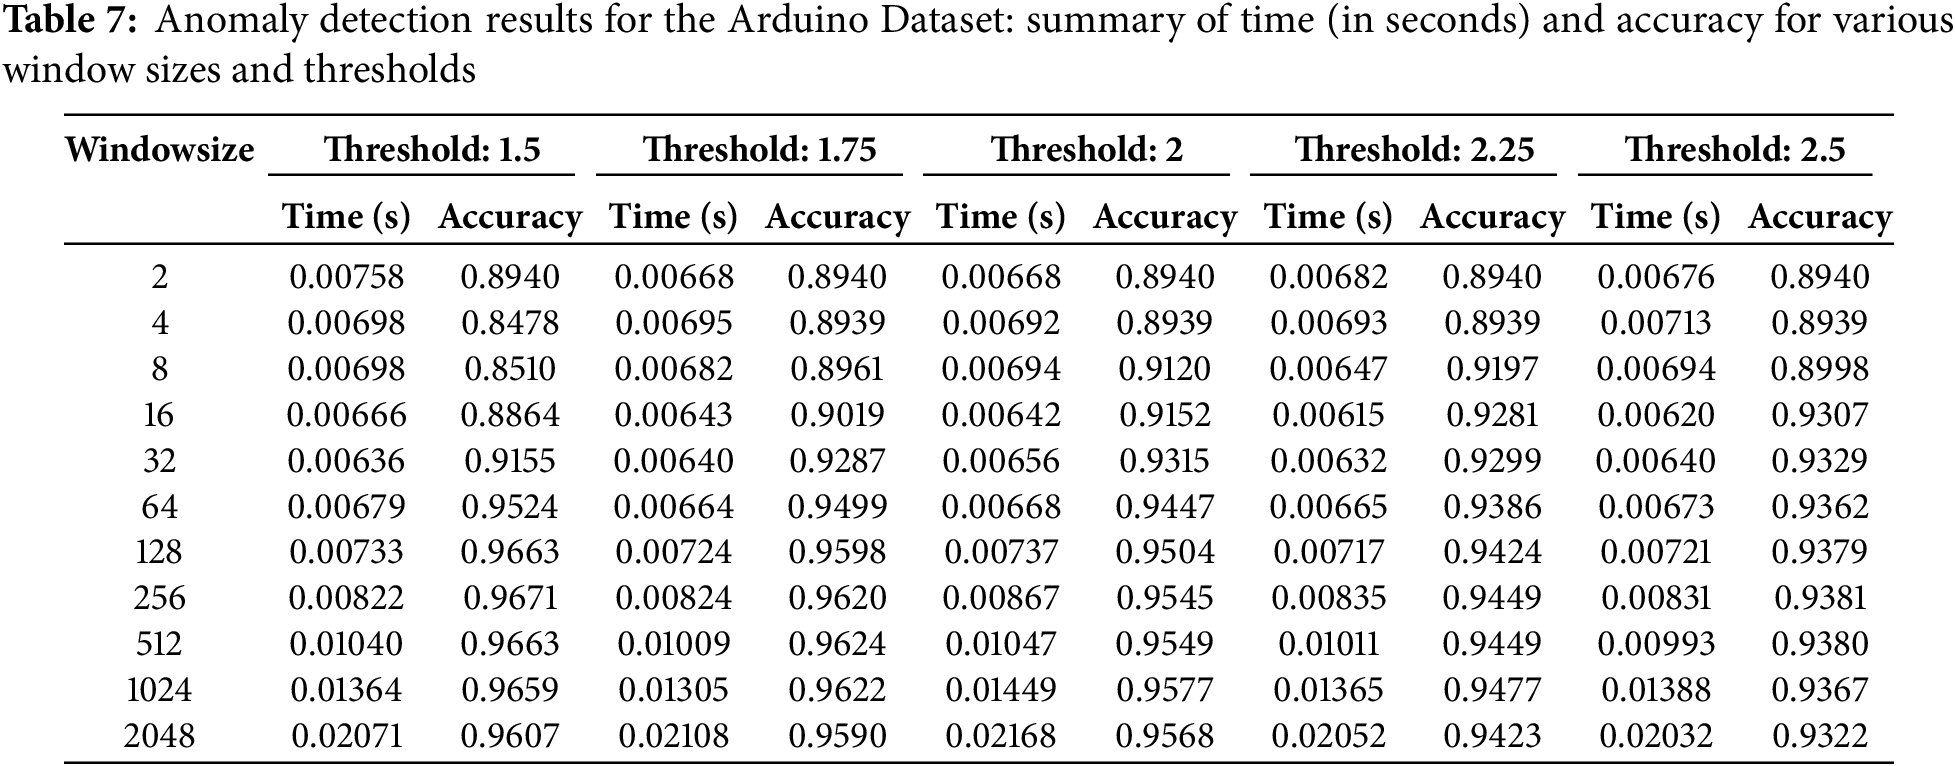
With a window size of 128 and a threshold of 1.5, the ideal balance between accuracy and time efficiency was found to produce over 96% accuracy with reasonable computation time. Fig. 3 shows the data distribution of all data points of each of the four primary features of the Arduino Real-World Dataset as line plots with respect to index values. Fig. 4 shows the comparison between actual values present in the data and values predicted by our designed MLR model. Fig. 5 shows the distribution of reduced data obtained by performing PCA. The data points lie further from the normal line, as shown in the plot, as vertical lines are considered anomalies. Fig. 6A shows the variability of accuracy scores obtained by setting various threshold values with respect to different window sizes. From the plot, we can see that a threshold value of 1.5 shows the best accuracy results in most cases. On the other hand, a window size of 128 is seen as optimal, as accuracies are seen to be more or less constant after that. Fig. 6B shows how increasing the window size affects the time taken for anomaly detection. It is clearly depicted that as the window size is increased, the time taken increases.
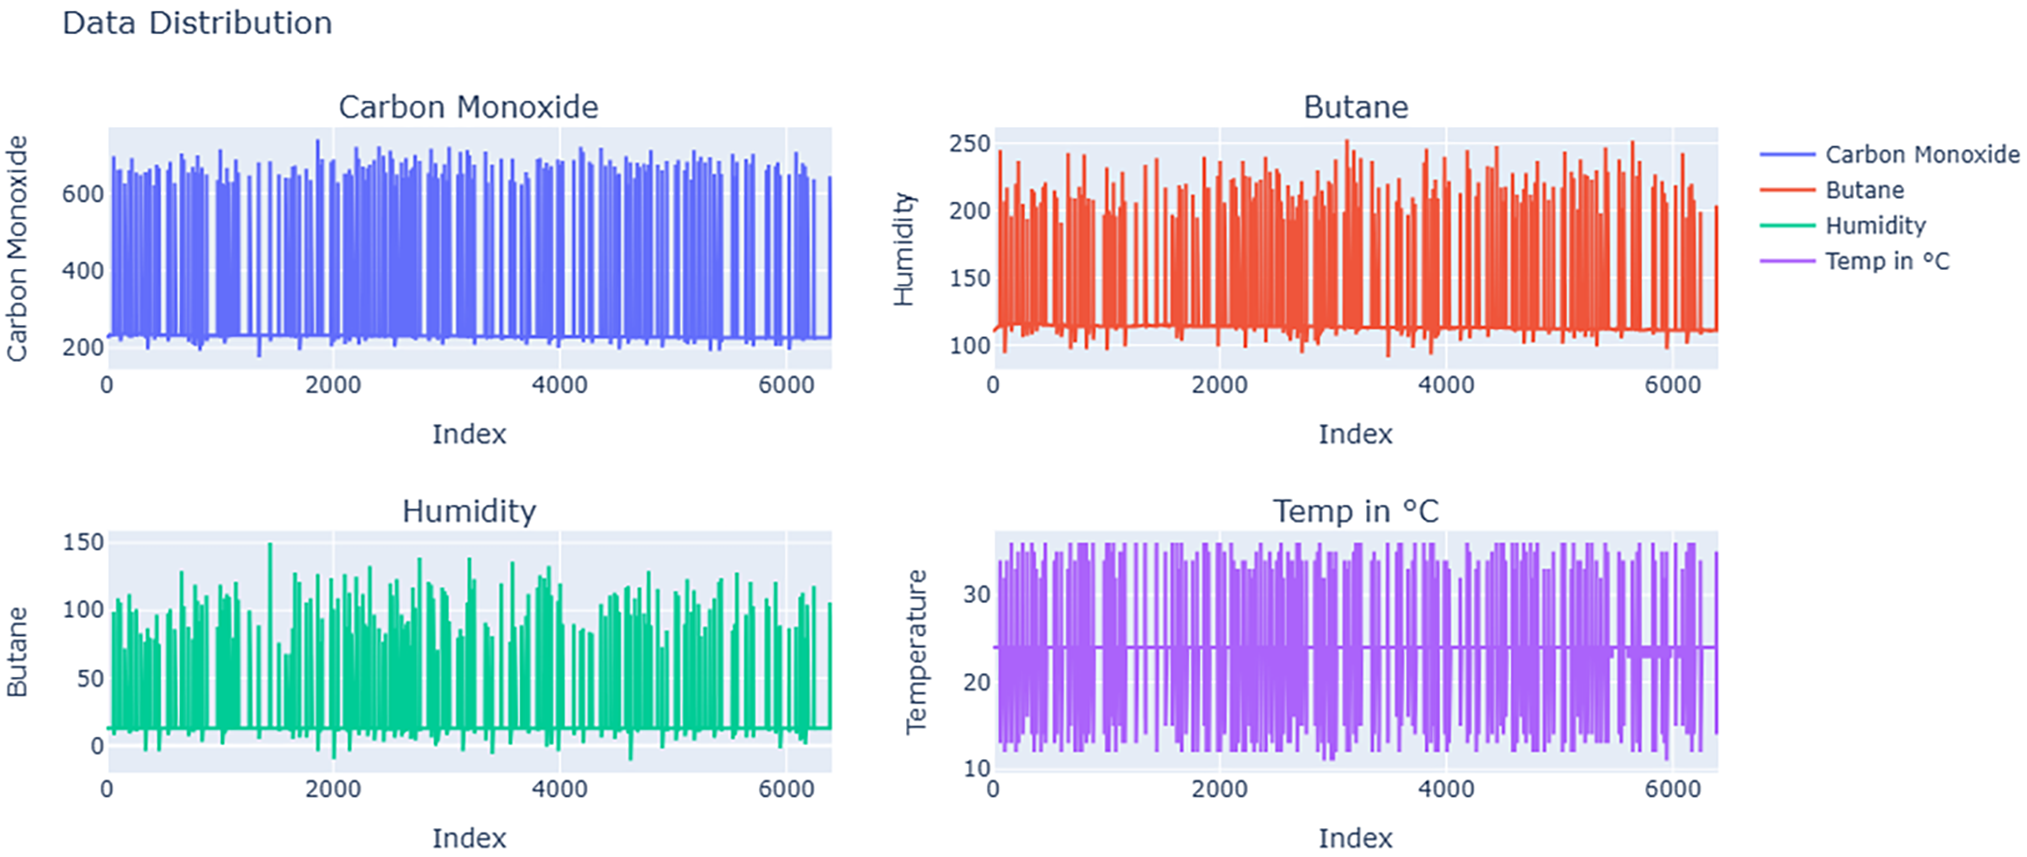
Figure 3: Data distribution of individual features in the Arduino Real-World Dataset, illustrating the variation in sensor readings for carbon monoxide, butane, humidity, and temperature over time
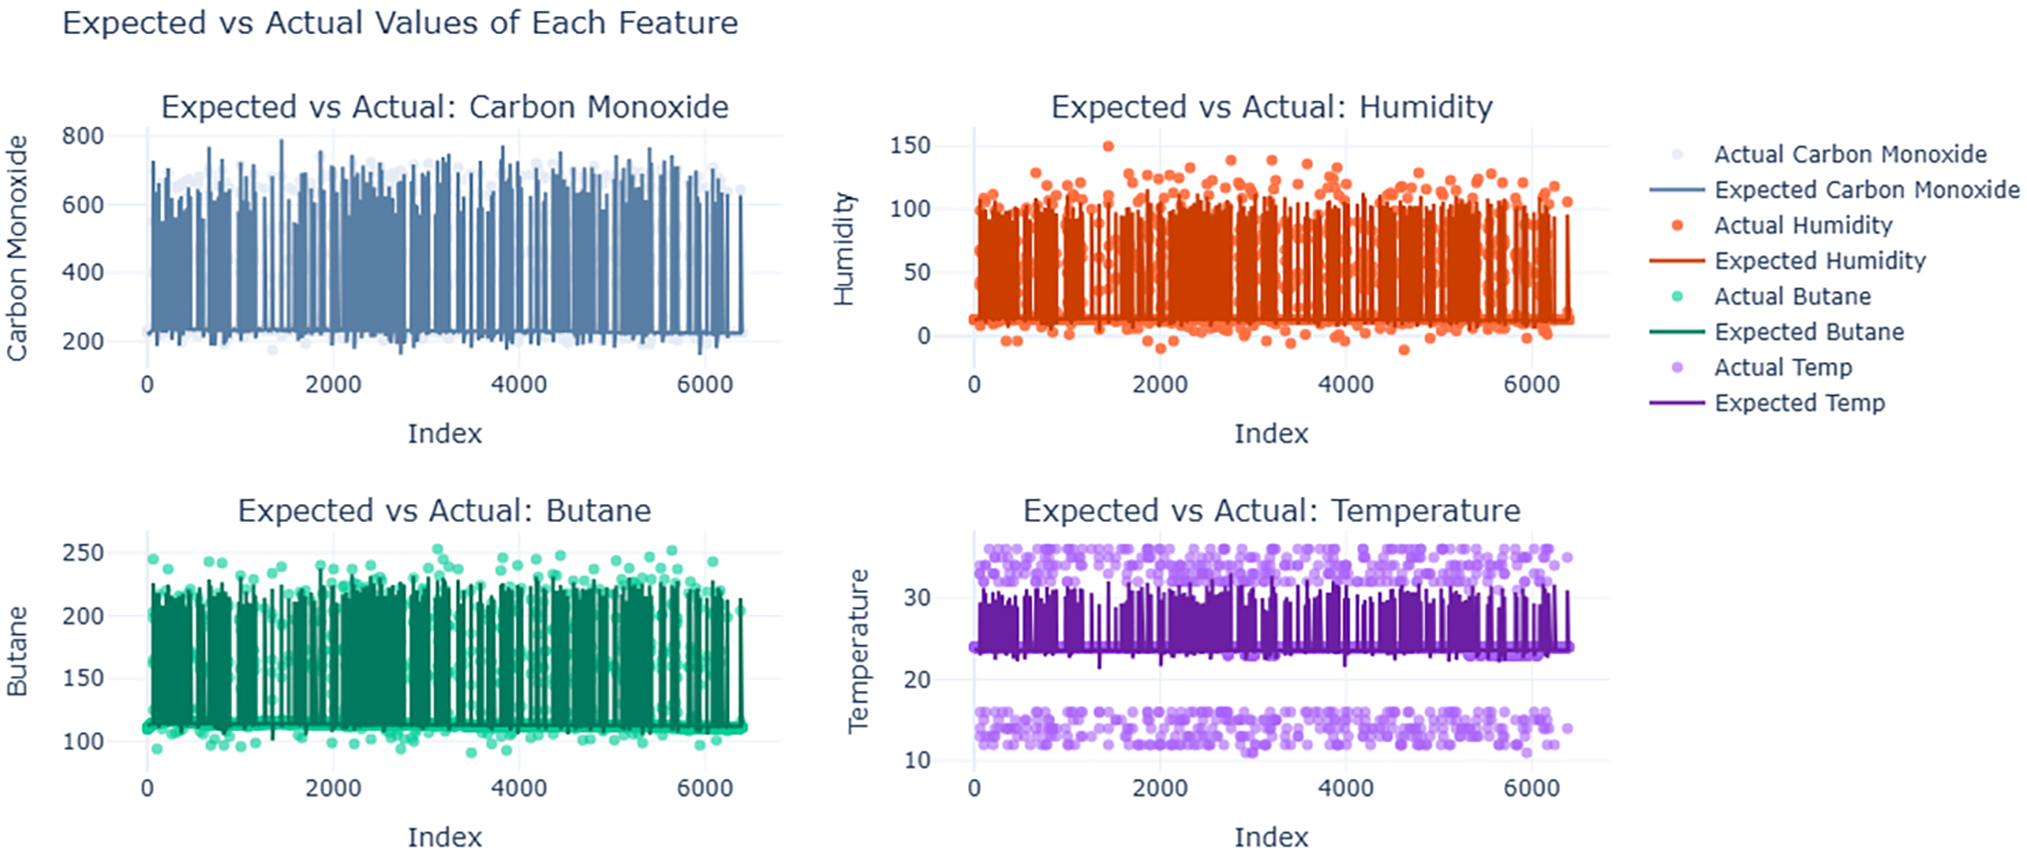
Figure 4: The comparison between the expected values of the Arduino Real-World Dataset, calculated using Multiple Linear Regression (MLR), and the actual sensor readings is shown. Each subplot reveals the model’s accuracy in predicting expected feature values and identifying potential anomalies by illustrating the differences between the observed and predicted values for each feature
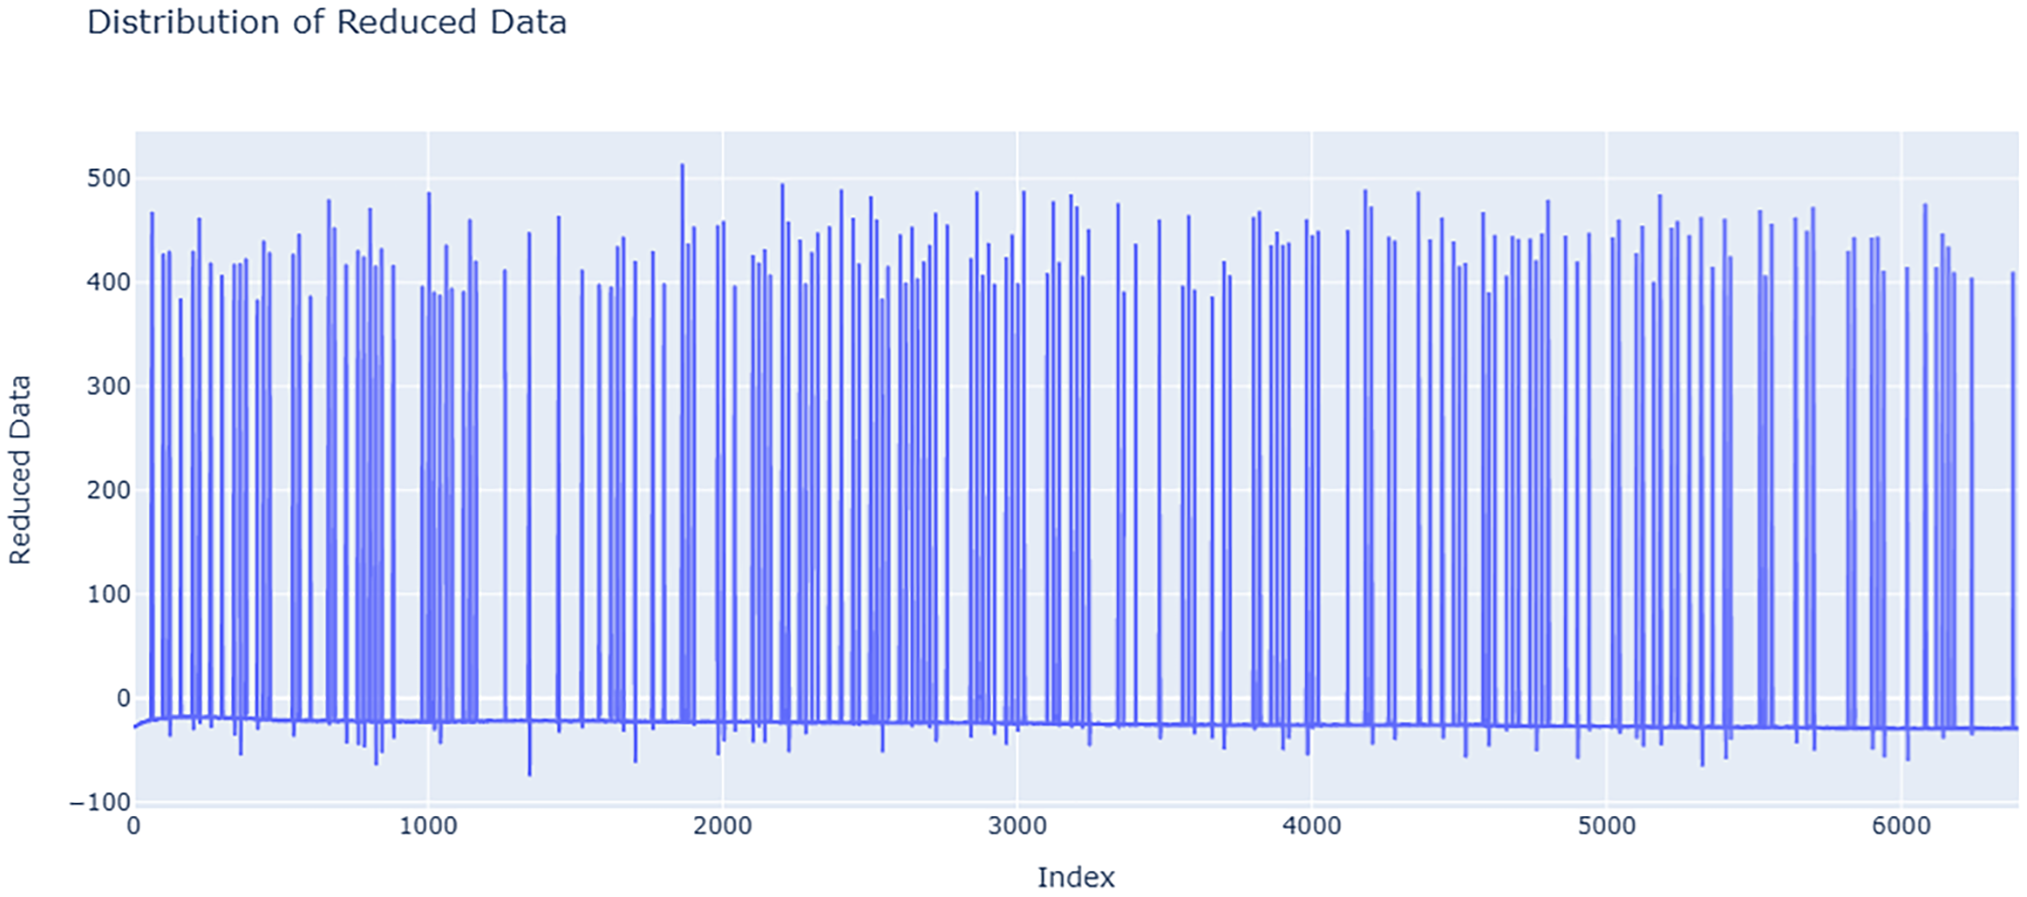
Figure 5: Data distribution on the Arduino Real-World Dataset following PCA. By reducing the multi-dimensional data into a single reduced form and highlighting the variance captured by the principal component, the plot preserves important patterns and anomalies for additional analysis
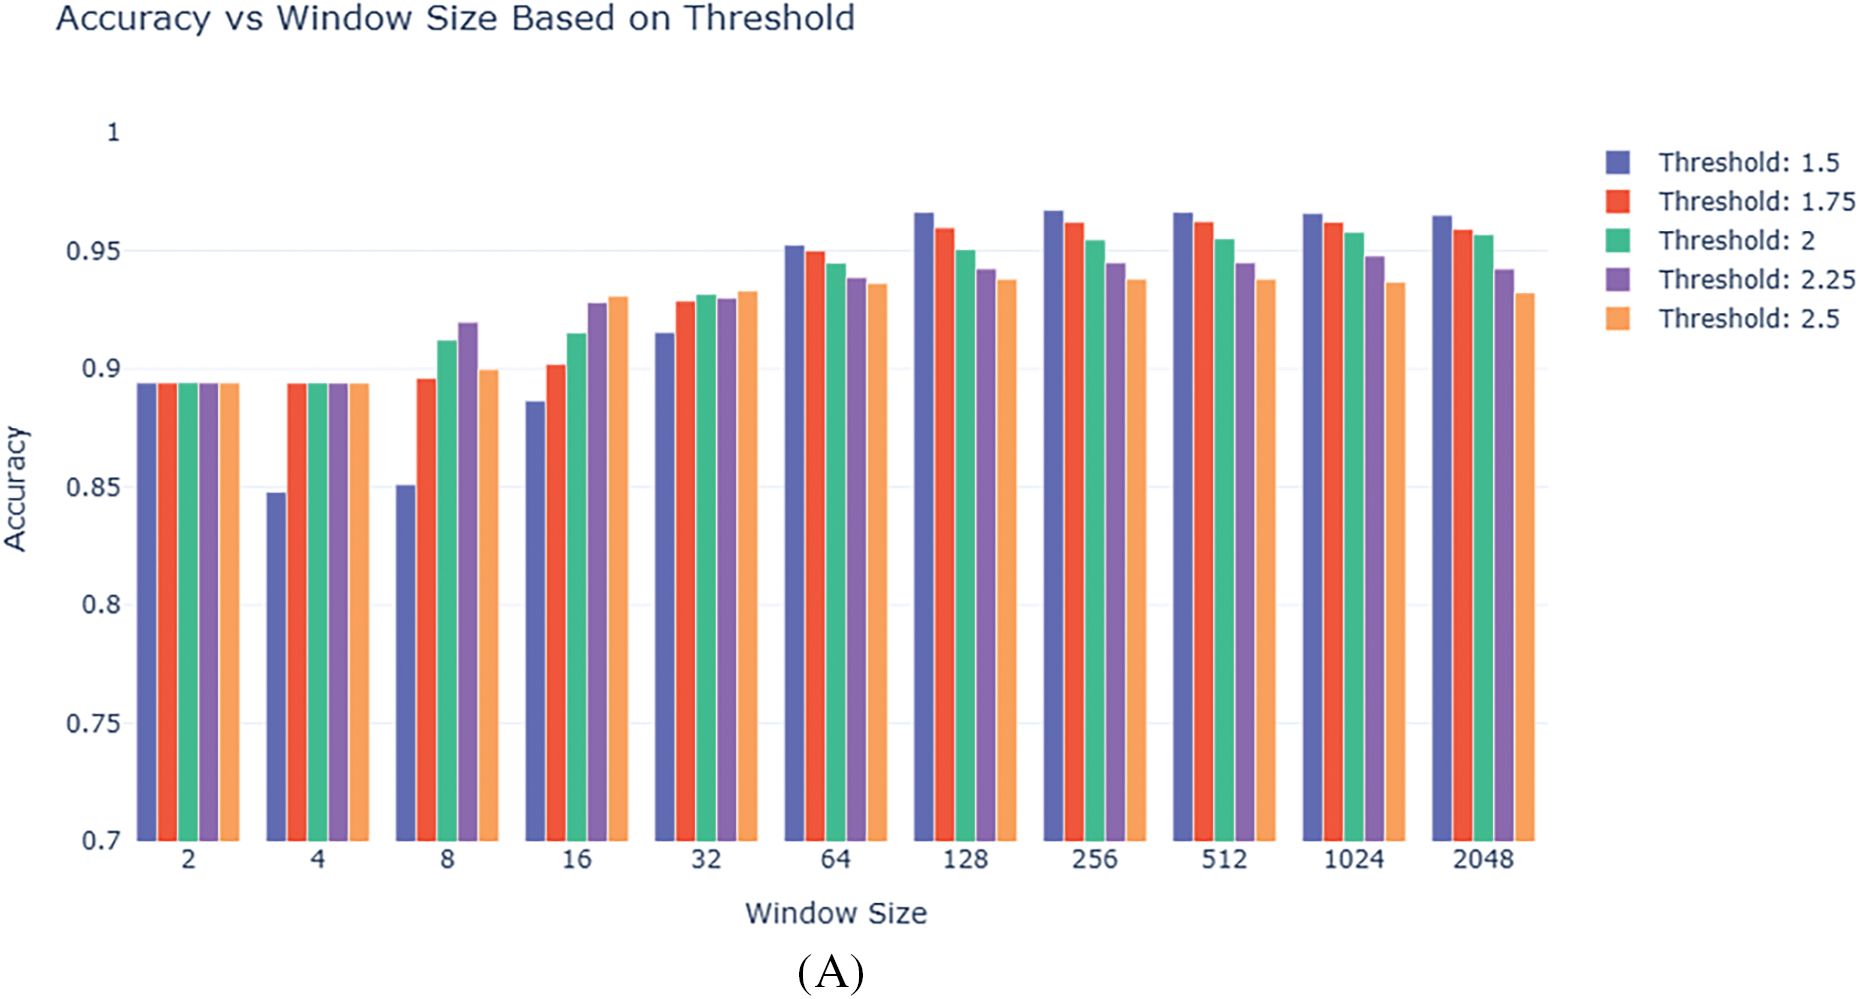
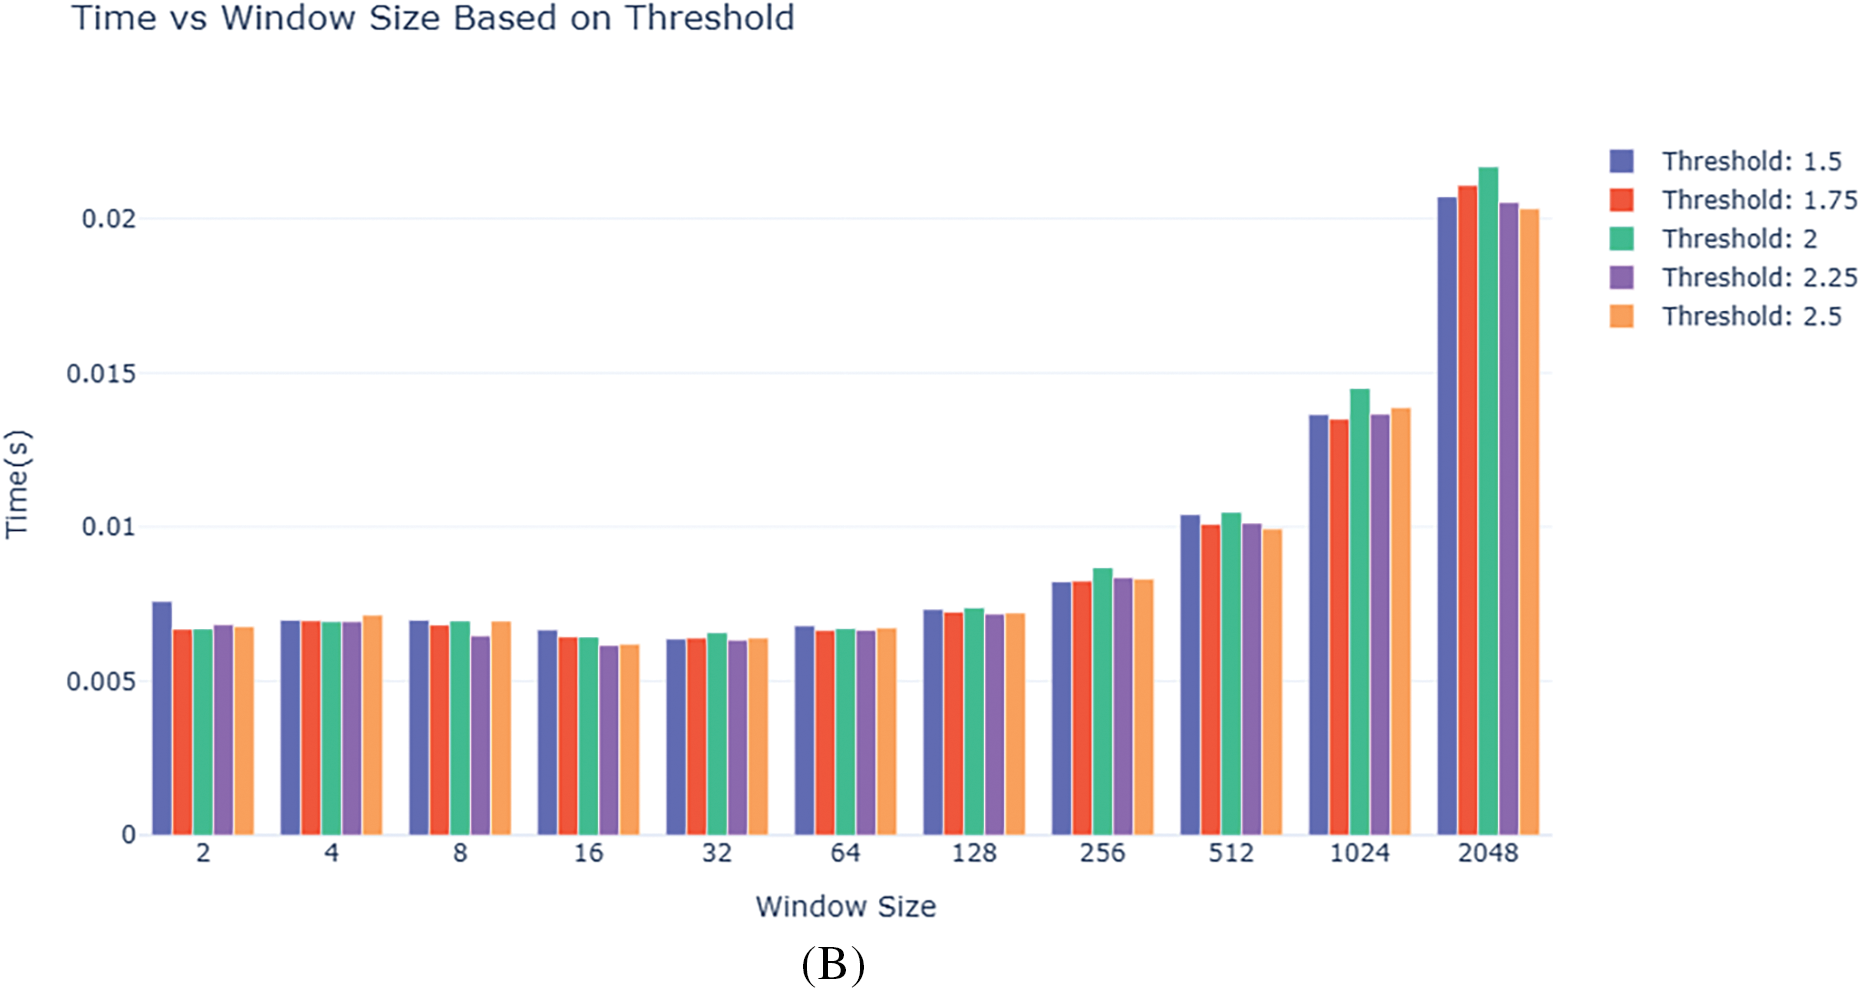
Figure 6: Variation of evaluation and efficiency metrics for anomaly detection in the Arduino Real-World Dataset. (A) Accuracy score on different window sizes with varied threshold values. (B) Anomaly detection time (in seconds) on different window sizes with varied threshold values
Table 8 shows the outcomes of the anomaly detection framework applied to the NF-ToN-IoT dataset, illustrating the effect of different window sizes and threshold values on both processing time and detection accuracy. The complex network traffic patterns of the dataset were used to assess the system’s capacity to handle massive network data. The experimental results show that the processing time increases significantly as the window size rises, particularly evident at bigger window sizes such as 2048. Nevertheless, the detection accuracy remains relatively stable over several thresholds, with minor variations observed at very large window sizes. With a window size of 128 and a threshold of 2.25, the highest accuracy over 90% while still allowing reasonable computational time was noted. The study highlights the need to tune hyperparameters depending on particular application needs to maximise performance.
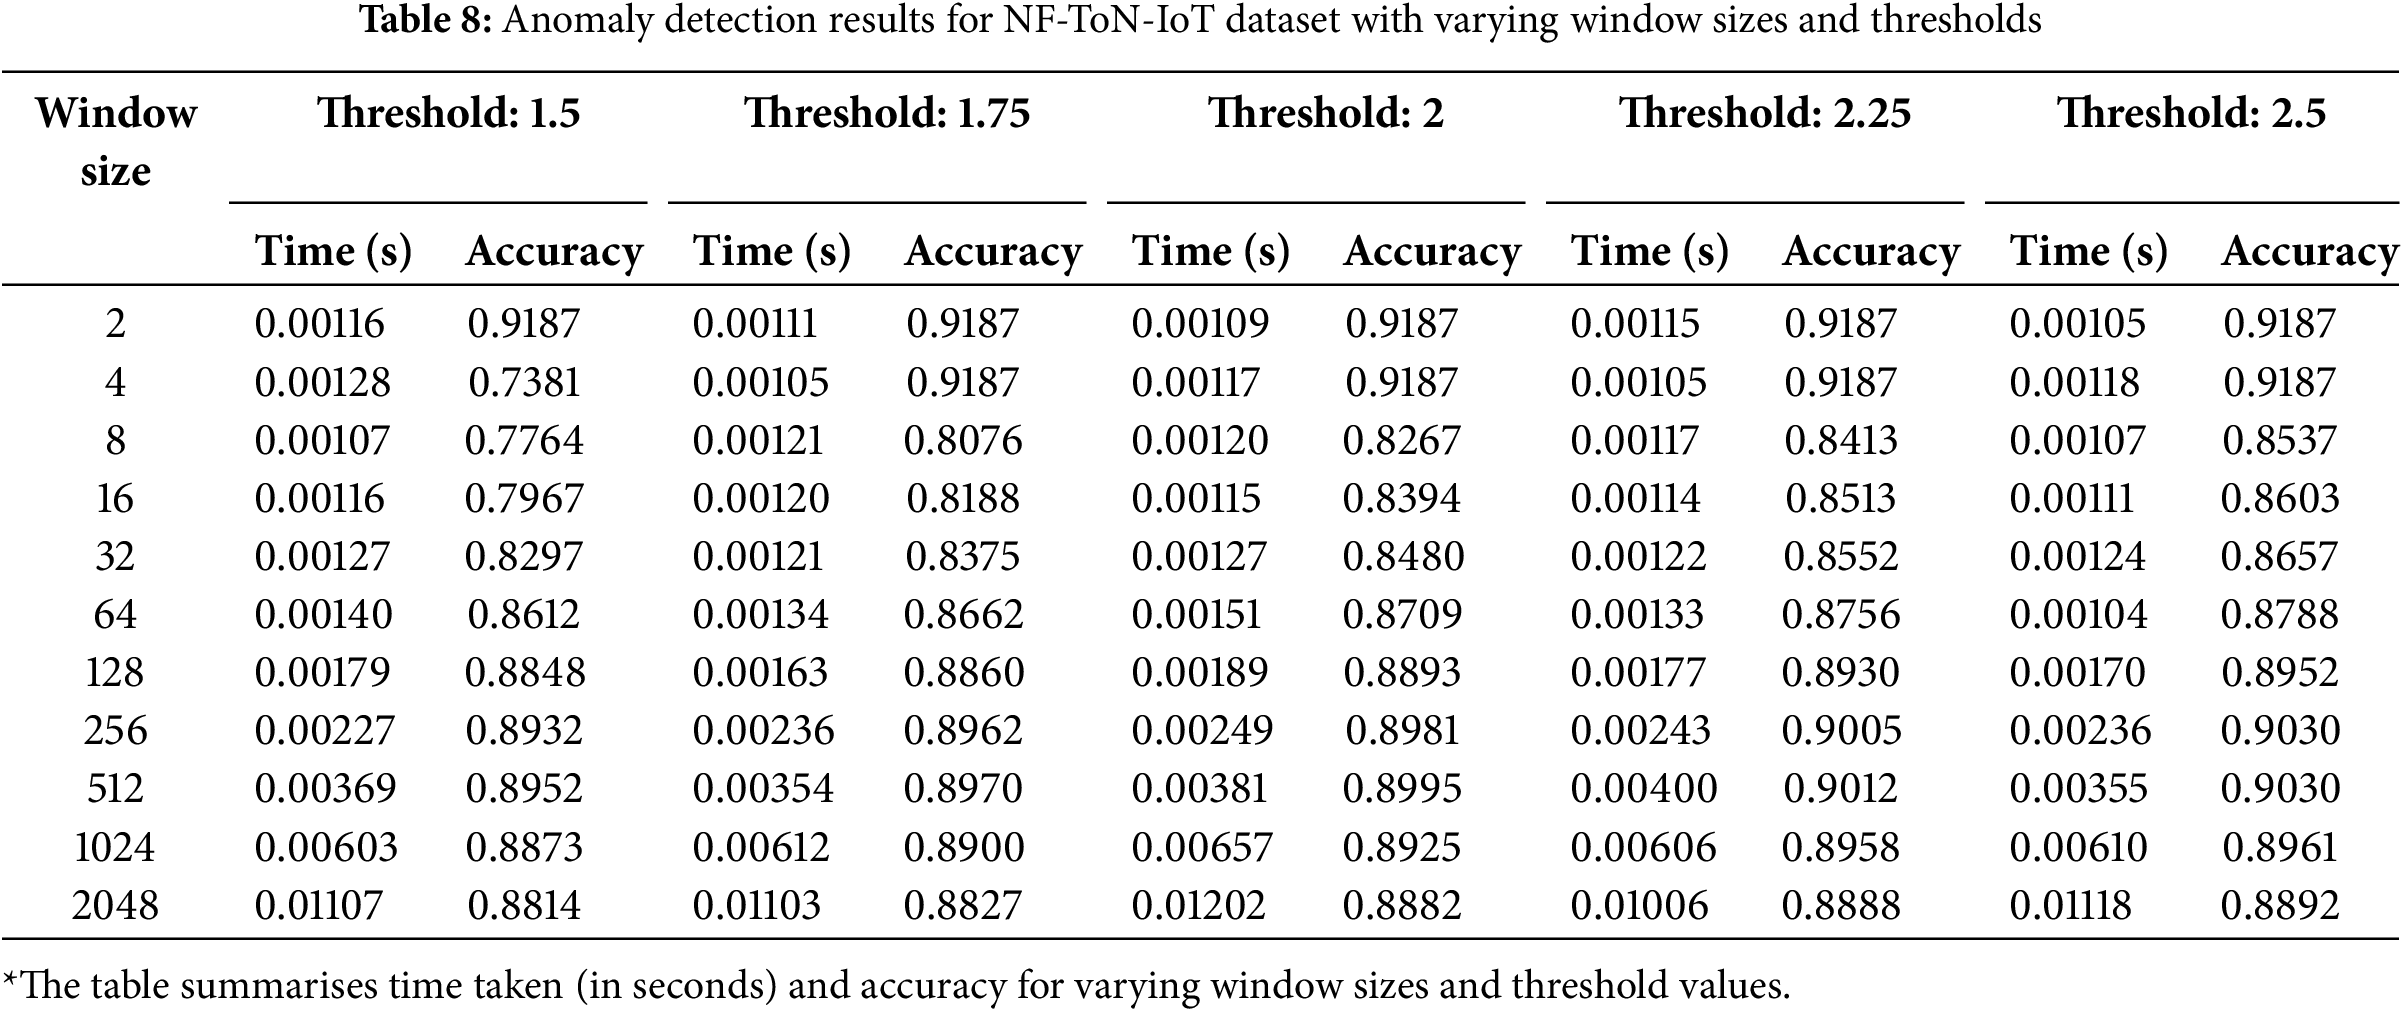
Fig. 7 shows the data distribution of all data points of each of the four primary features that we used from the NF-ToN-IoT dataset as line plots with respect to index values. Fig. 8 shows the closeness of expected data values obtained when fed into our designed MLR model with the actual values that were present in the data. Fig. 9 shows the distribution of reduced data obtained by performing PCA. The data points lying further from the normal line, as shown in the plot as vertical lines, are considered anomalies. Anomalous data is seen more prominently around index 1000. Fig. 10A shows the variability of accuracy scores obtained by setting various threshold values with respect to different window sizes. From the plot, we can see that a threshold value of 2.5 shows the best accuracy results in most cases. On the other hand, a window size of 256 is seen as optimal as accuracy appears to peak or plateau. From Fig. 10B, it is clearly depicted that as the window size is increased, the time taken is also increased.
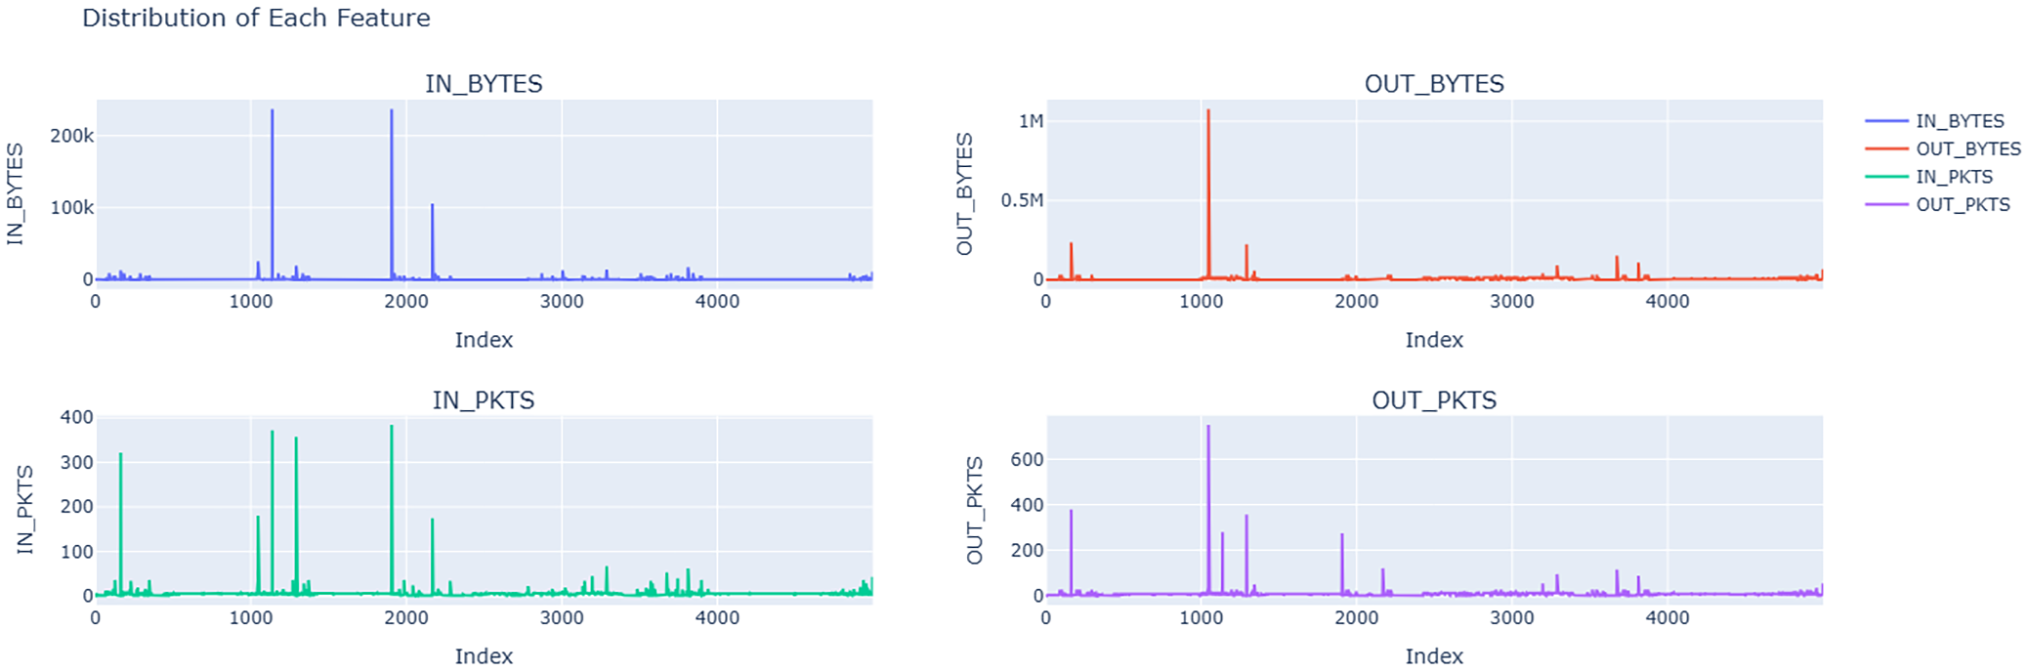
Figure 7: Data distribution of every feature in the NF-ToN-IoT Dataset, showing the variation in network traffic measurements. Essential for spotting network anomalies and intrusion patterns in IoT systems, the plots show swings in data flow

Figure 8: Comparison of actual and expected values for each feature in the NF-ToN-IoT dataset, estimated using MLR equations. The plots highlight discrepancies between observed network traffic data and their predicted counterparts
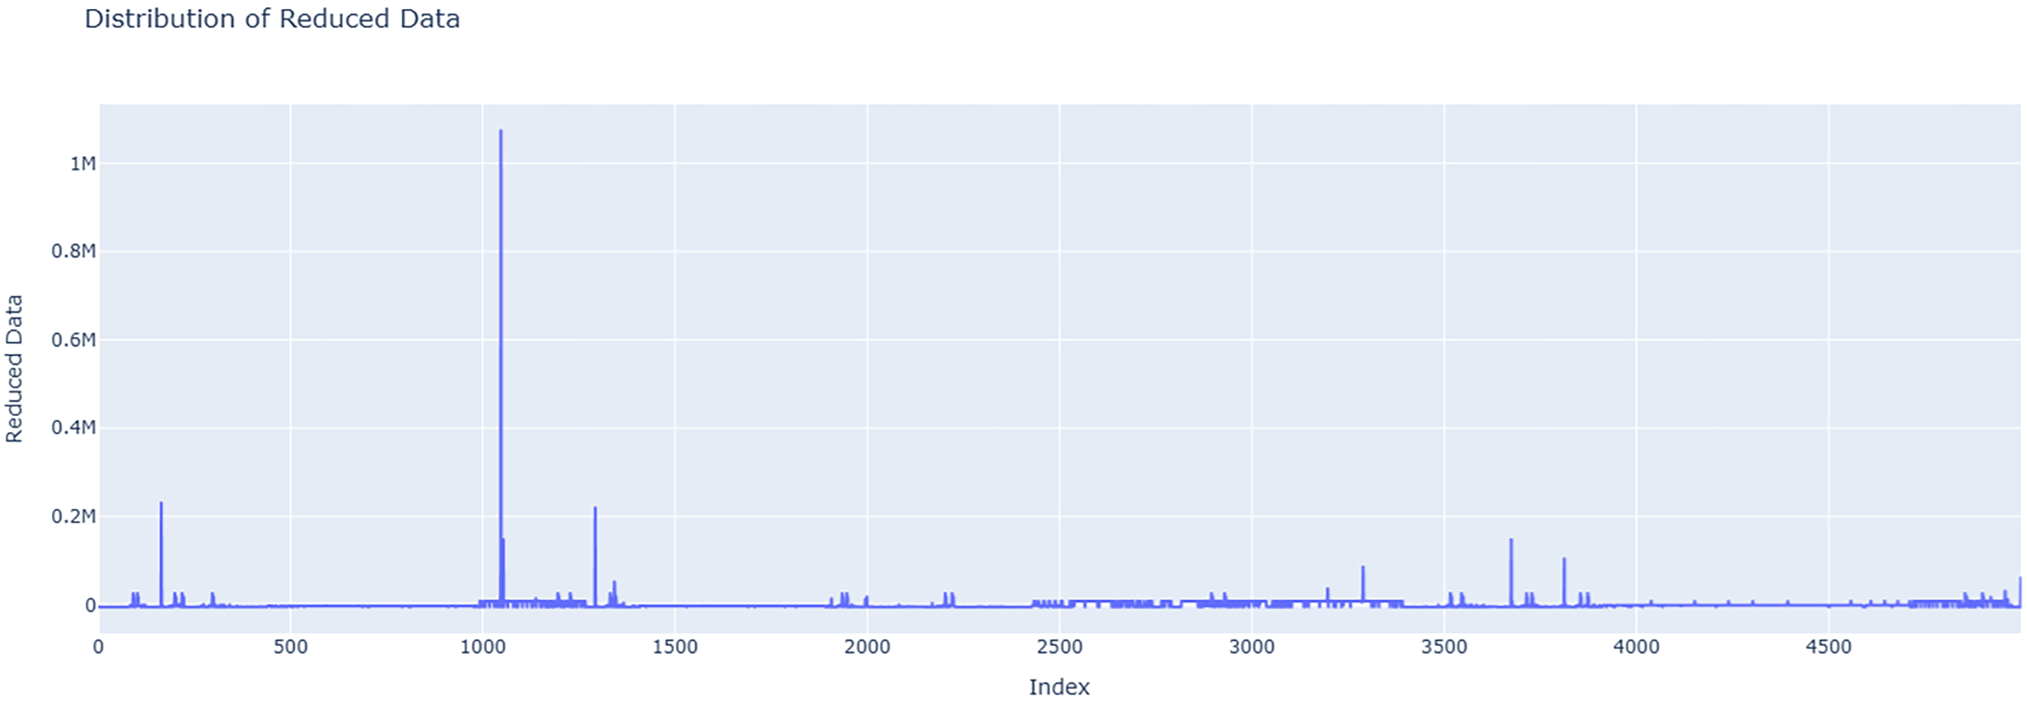
Figure 9: Distribution of the data after applying PCA on the NF-ToN-IoT dataset. This plot highlights the variance captured by the principal component, effectively compressing the multi-dimensional network traffic data into a single reduced form while preserving essential patterns
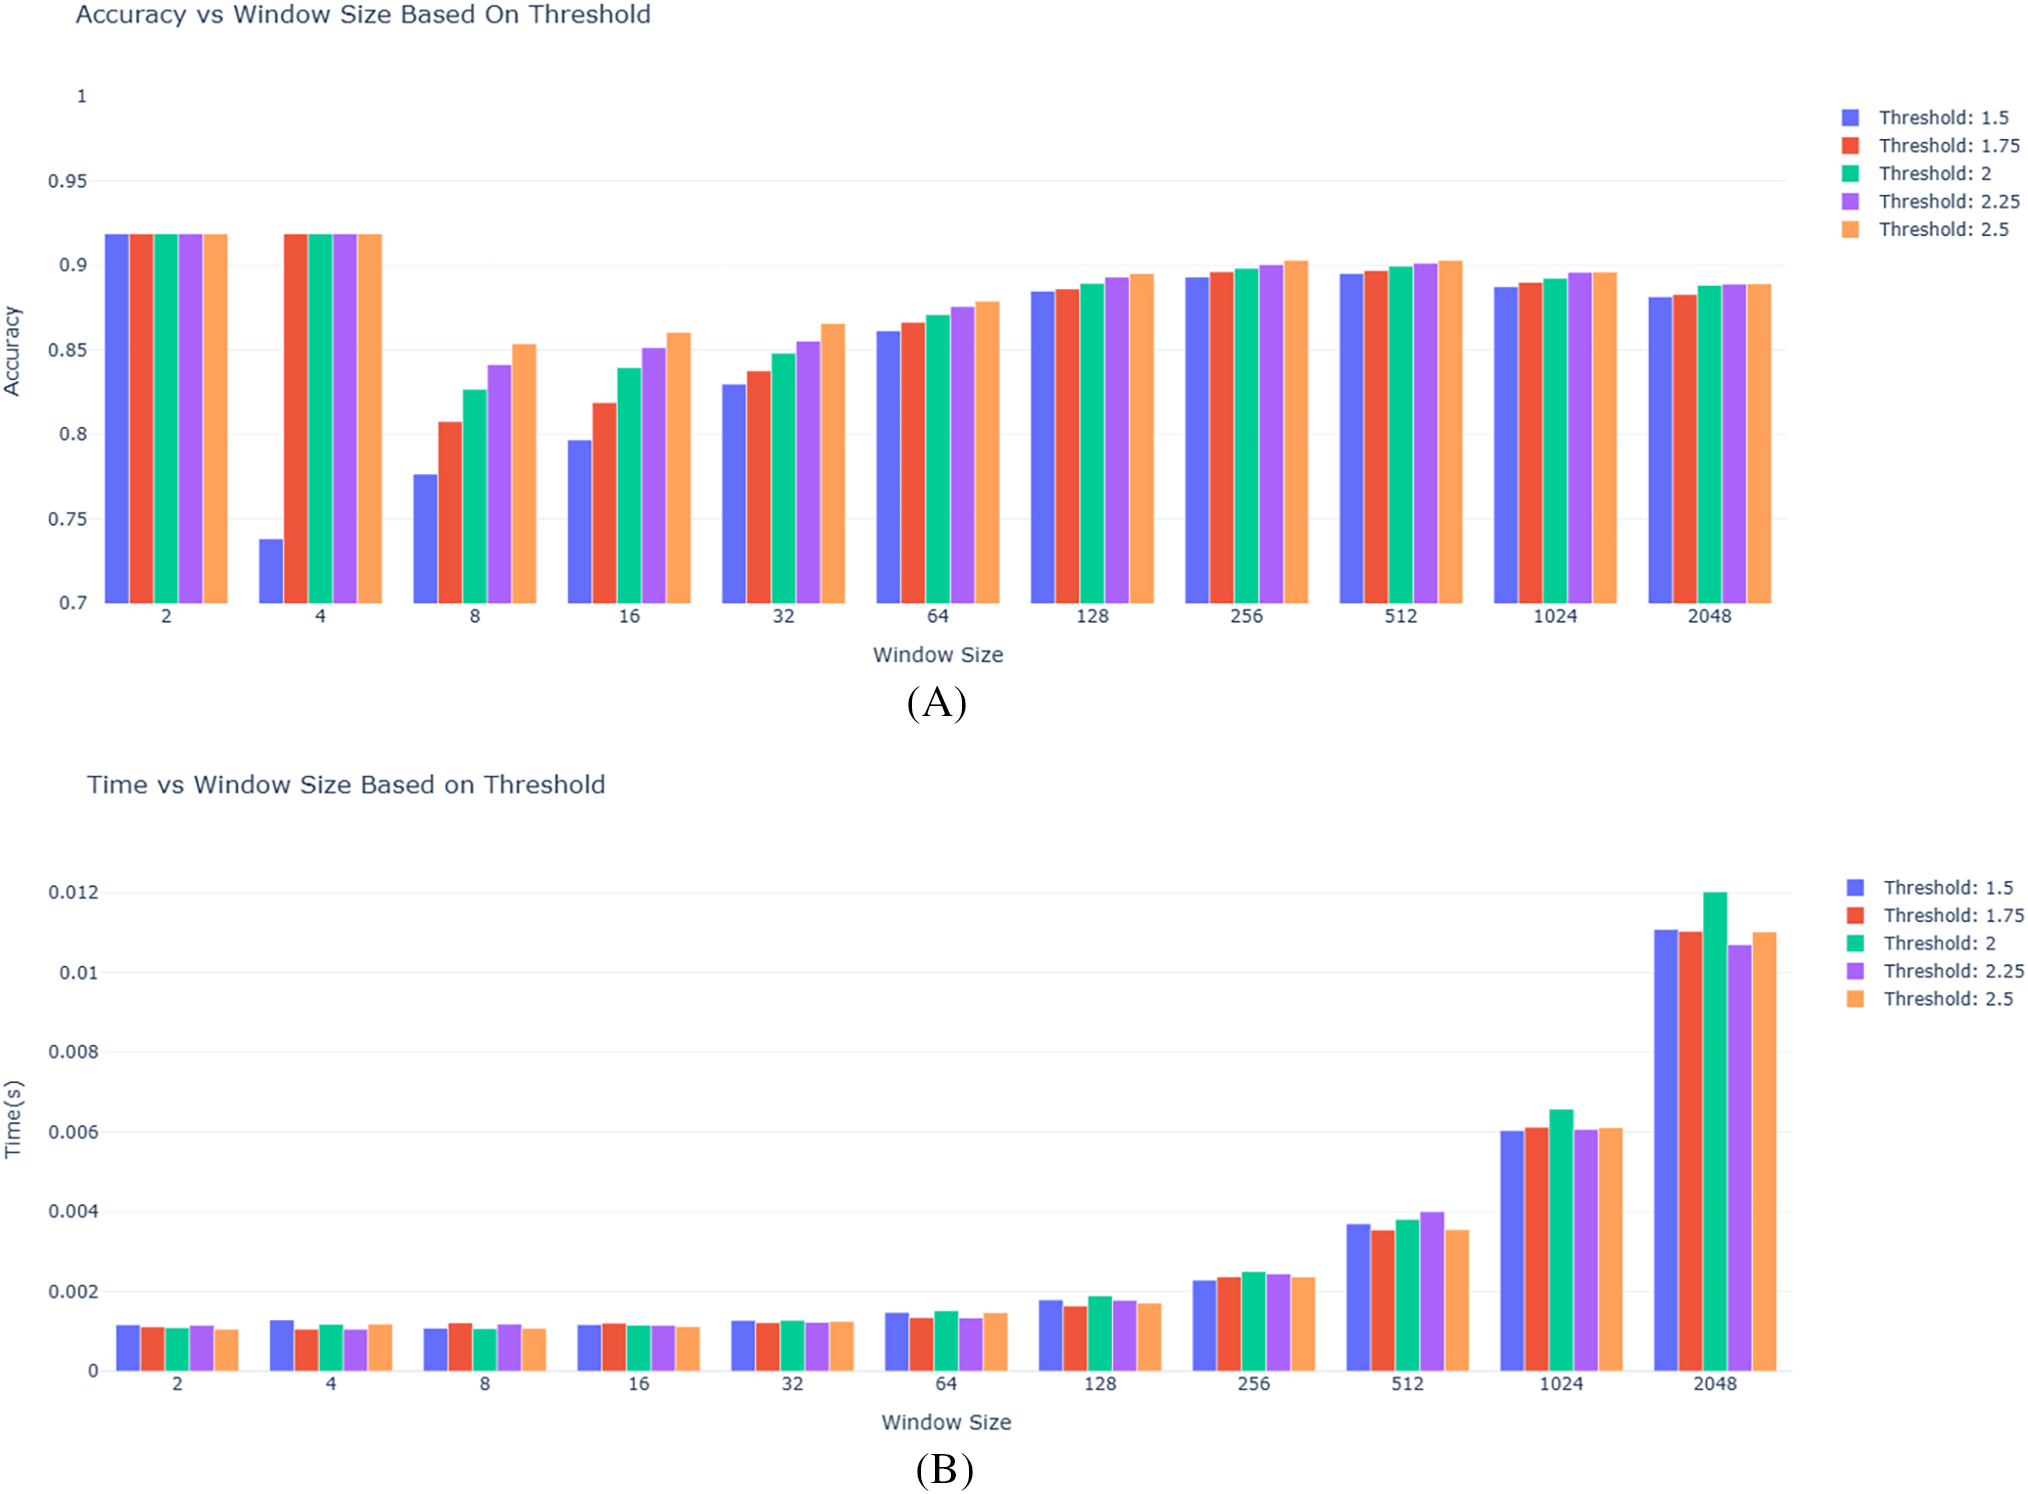
Figure 10: The variation of evaluation and efficiency metrics as: (A) Accuracy score on different window sizes with varied threshold values. (B) Anomaly detection time (in seconds) on different window sizes with varied threshold values
The proposed anomaly detection system was evaluated using the NF-BoT-IoT dataset, focusing on the system’s capacity to manage significant network traffic while balancing accuracy and computational efficiency. The experiments varied the sliding window size as well as the Z-score threshold to assess their impact on detection performance.
Table 9 summarises the generally high accuracy the framework obtained over many parameter values. At a higher window size across all threshold values, the highest accuracy was observed, even with a significant increase in processing time. While keeping an accuracy above 93%, smaller window sizes–128 and 256 significantly reduced computational overhead. The results also show that threshold values had a small impact on accuracy, with ideal performance reached at levels between 2.0 and 2.5. When real-time processing is essential and speed and detection accuracy must be fairly balanced, window sizes between 512 and 1024 offer a good compromise. Especially in large-scale network intrusion detection activities represented by the NF-BoT-IoT Dataset, these results generally confirm the resilience of the proposed framework for real-time anomaly detection in IoT systems.
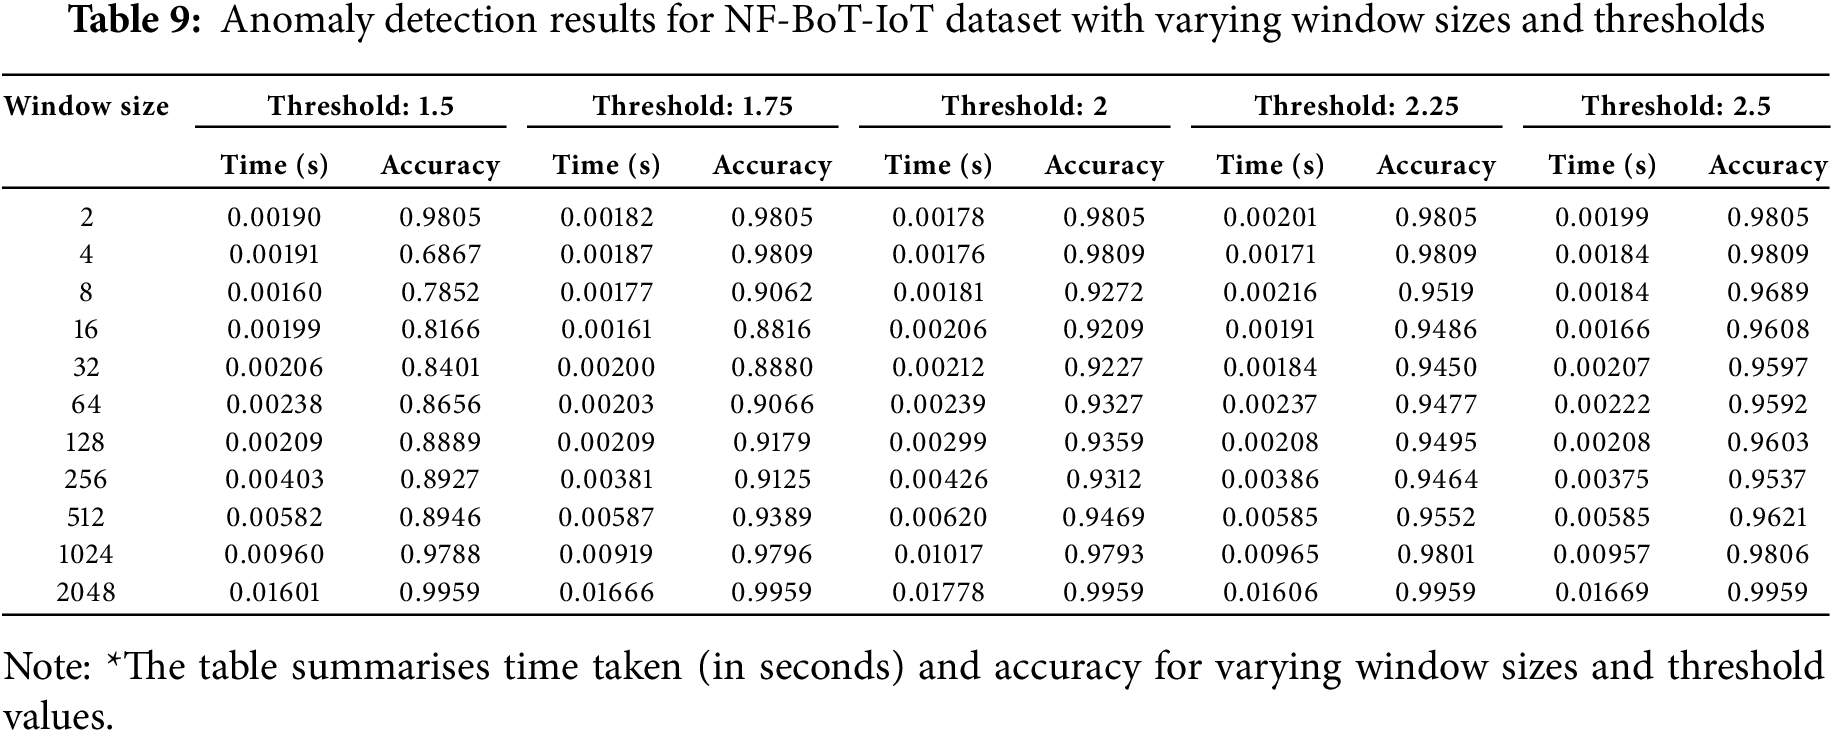
Fig. 11 shows the data distribution of all data points of each of the four primary features that we used from the NF-BoT-IoT dataset as line plots with respect to index values. Fig. 12 shows the closeness of expected data values obtained when fed into our designed MLR model with the actual values that were present in the data. Fig. 13 shows the distribution of reduced data obtained by performing PCA. The data points lie further from the normal line, as shown in the plot, as vertical lines are considered anomalies. Anomalous data is seen more prominently between indices 0 and 200. Fig. 14A shows the variability of accuracy scores obtained by setting various threshold values with respect to different window sizes. From the plot, we can see that a threshold value of 2.5 shows the best accuracy results in most cases. On the other hand, a window size of 256 is seen as optimal as accuracies are higher. From Fig. 14B, it is depicted that as the window size is increased, the time taken increases.
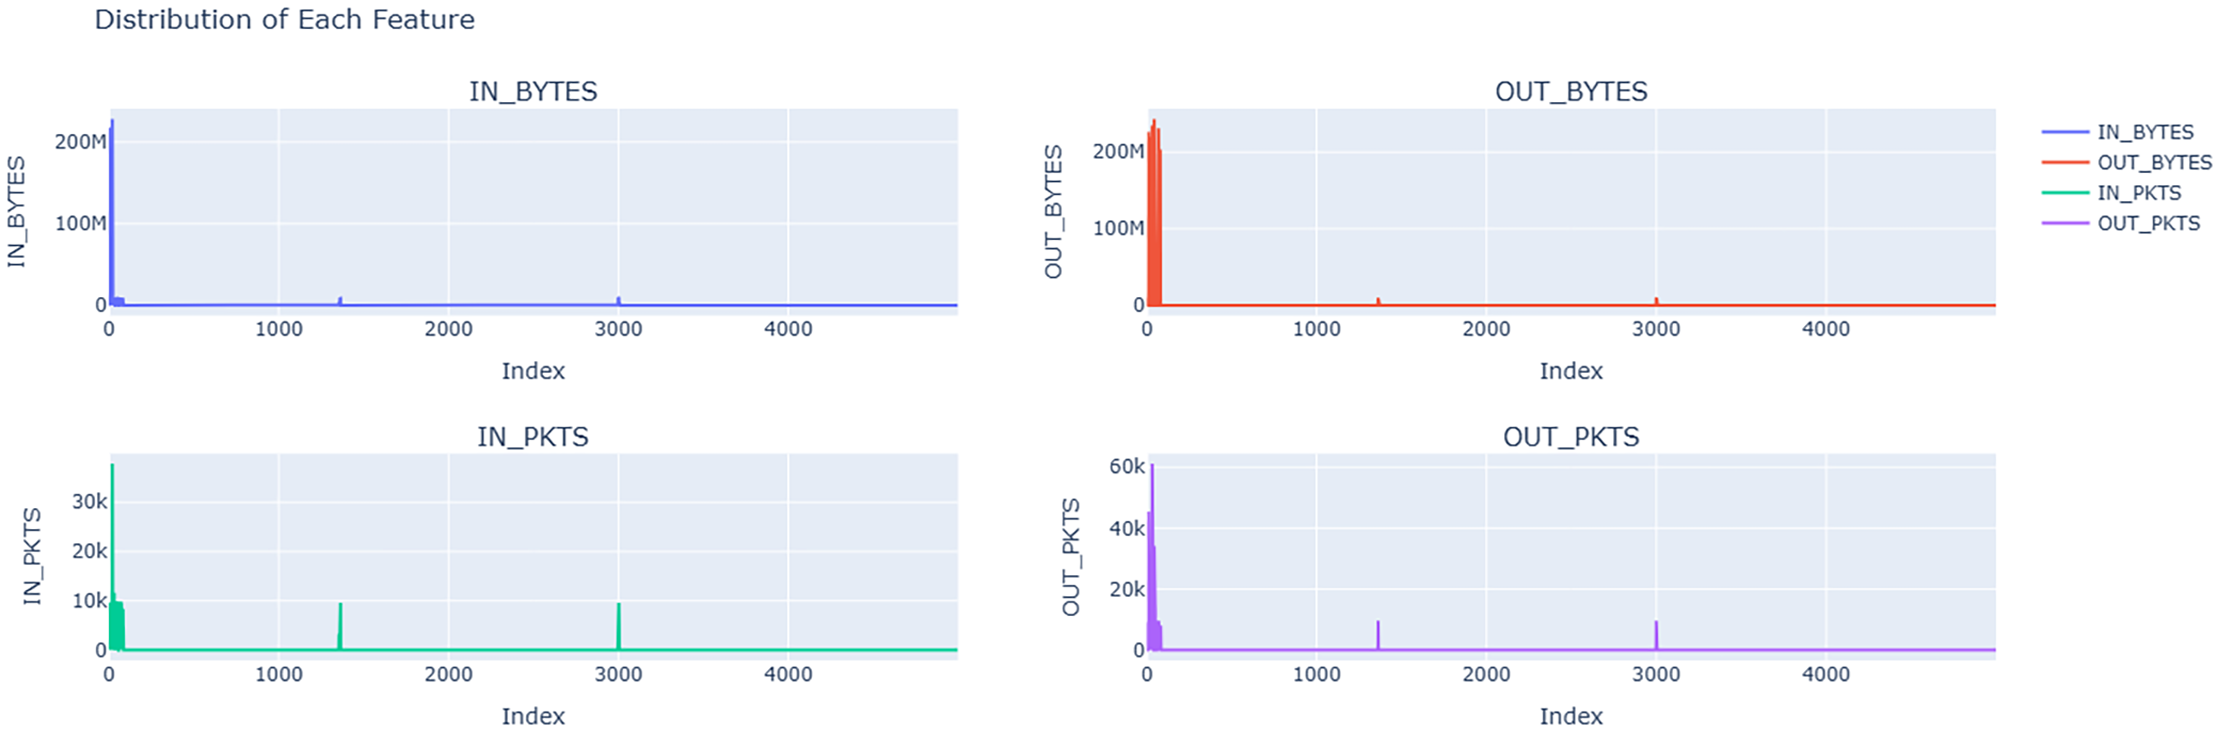
Figure 11: Data distribution of each feature in the NF-BoT-IoT Dataset, showcasing the network traffic metrics. The plots highlight fluctuations and spikes in data flow, which are critical for identifying anomalies and potential intrusion patterns in IoT network environments
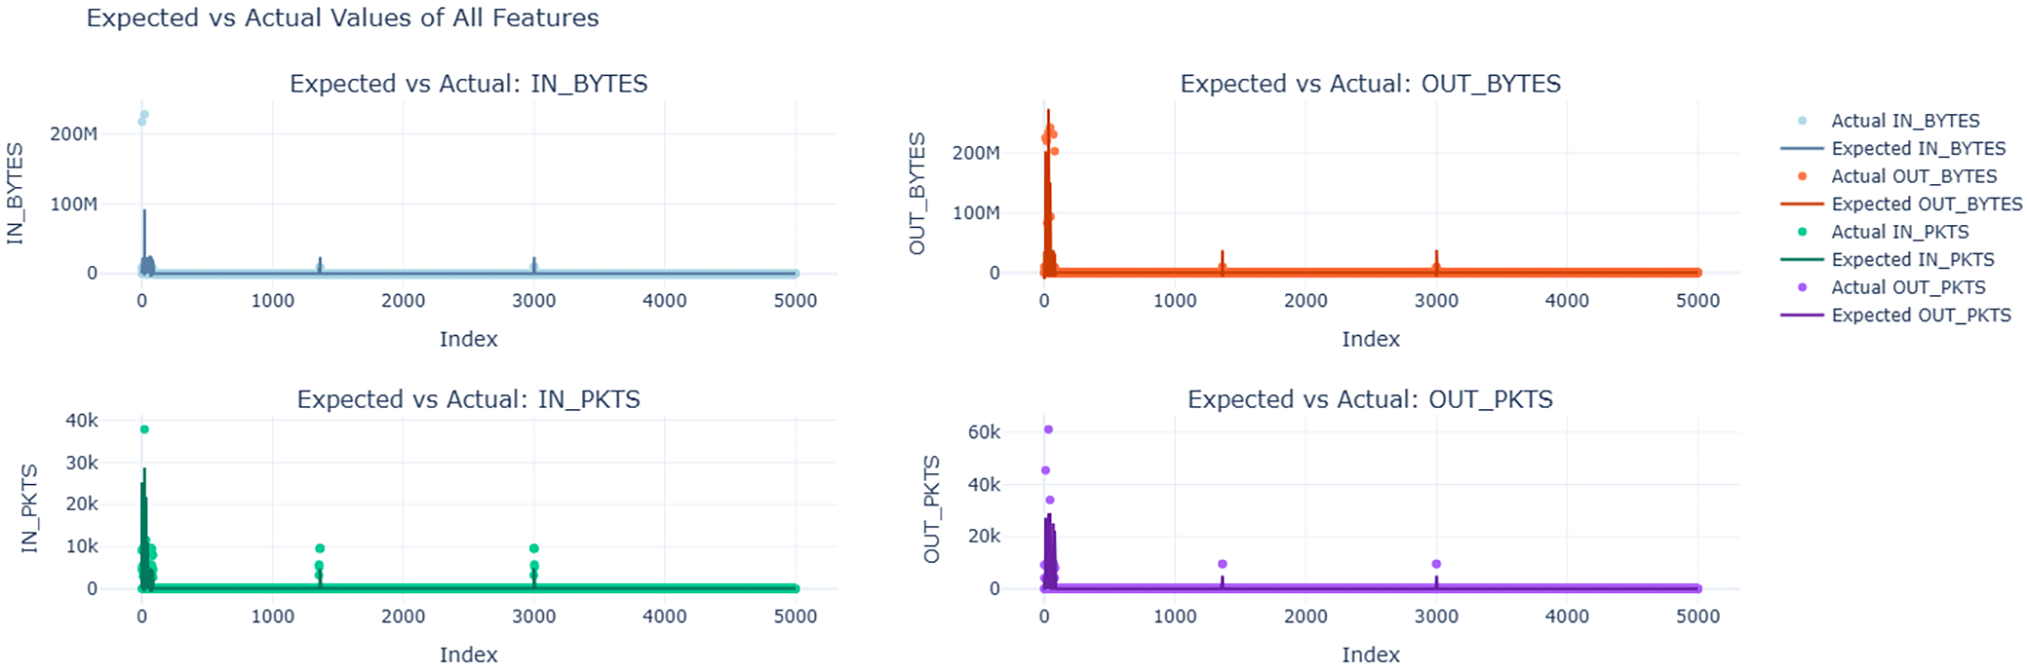
Figure 12: Comparison of actual and expected values for each feature in the NF-BoT-IoT dataset, estimated using MLR equations

Figure 13: Shows the distribution of data reduced using PCA on the NF-BoT-IoT dataset
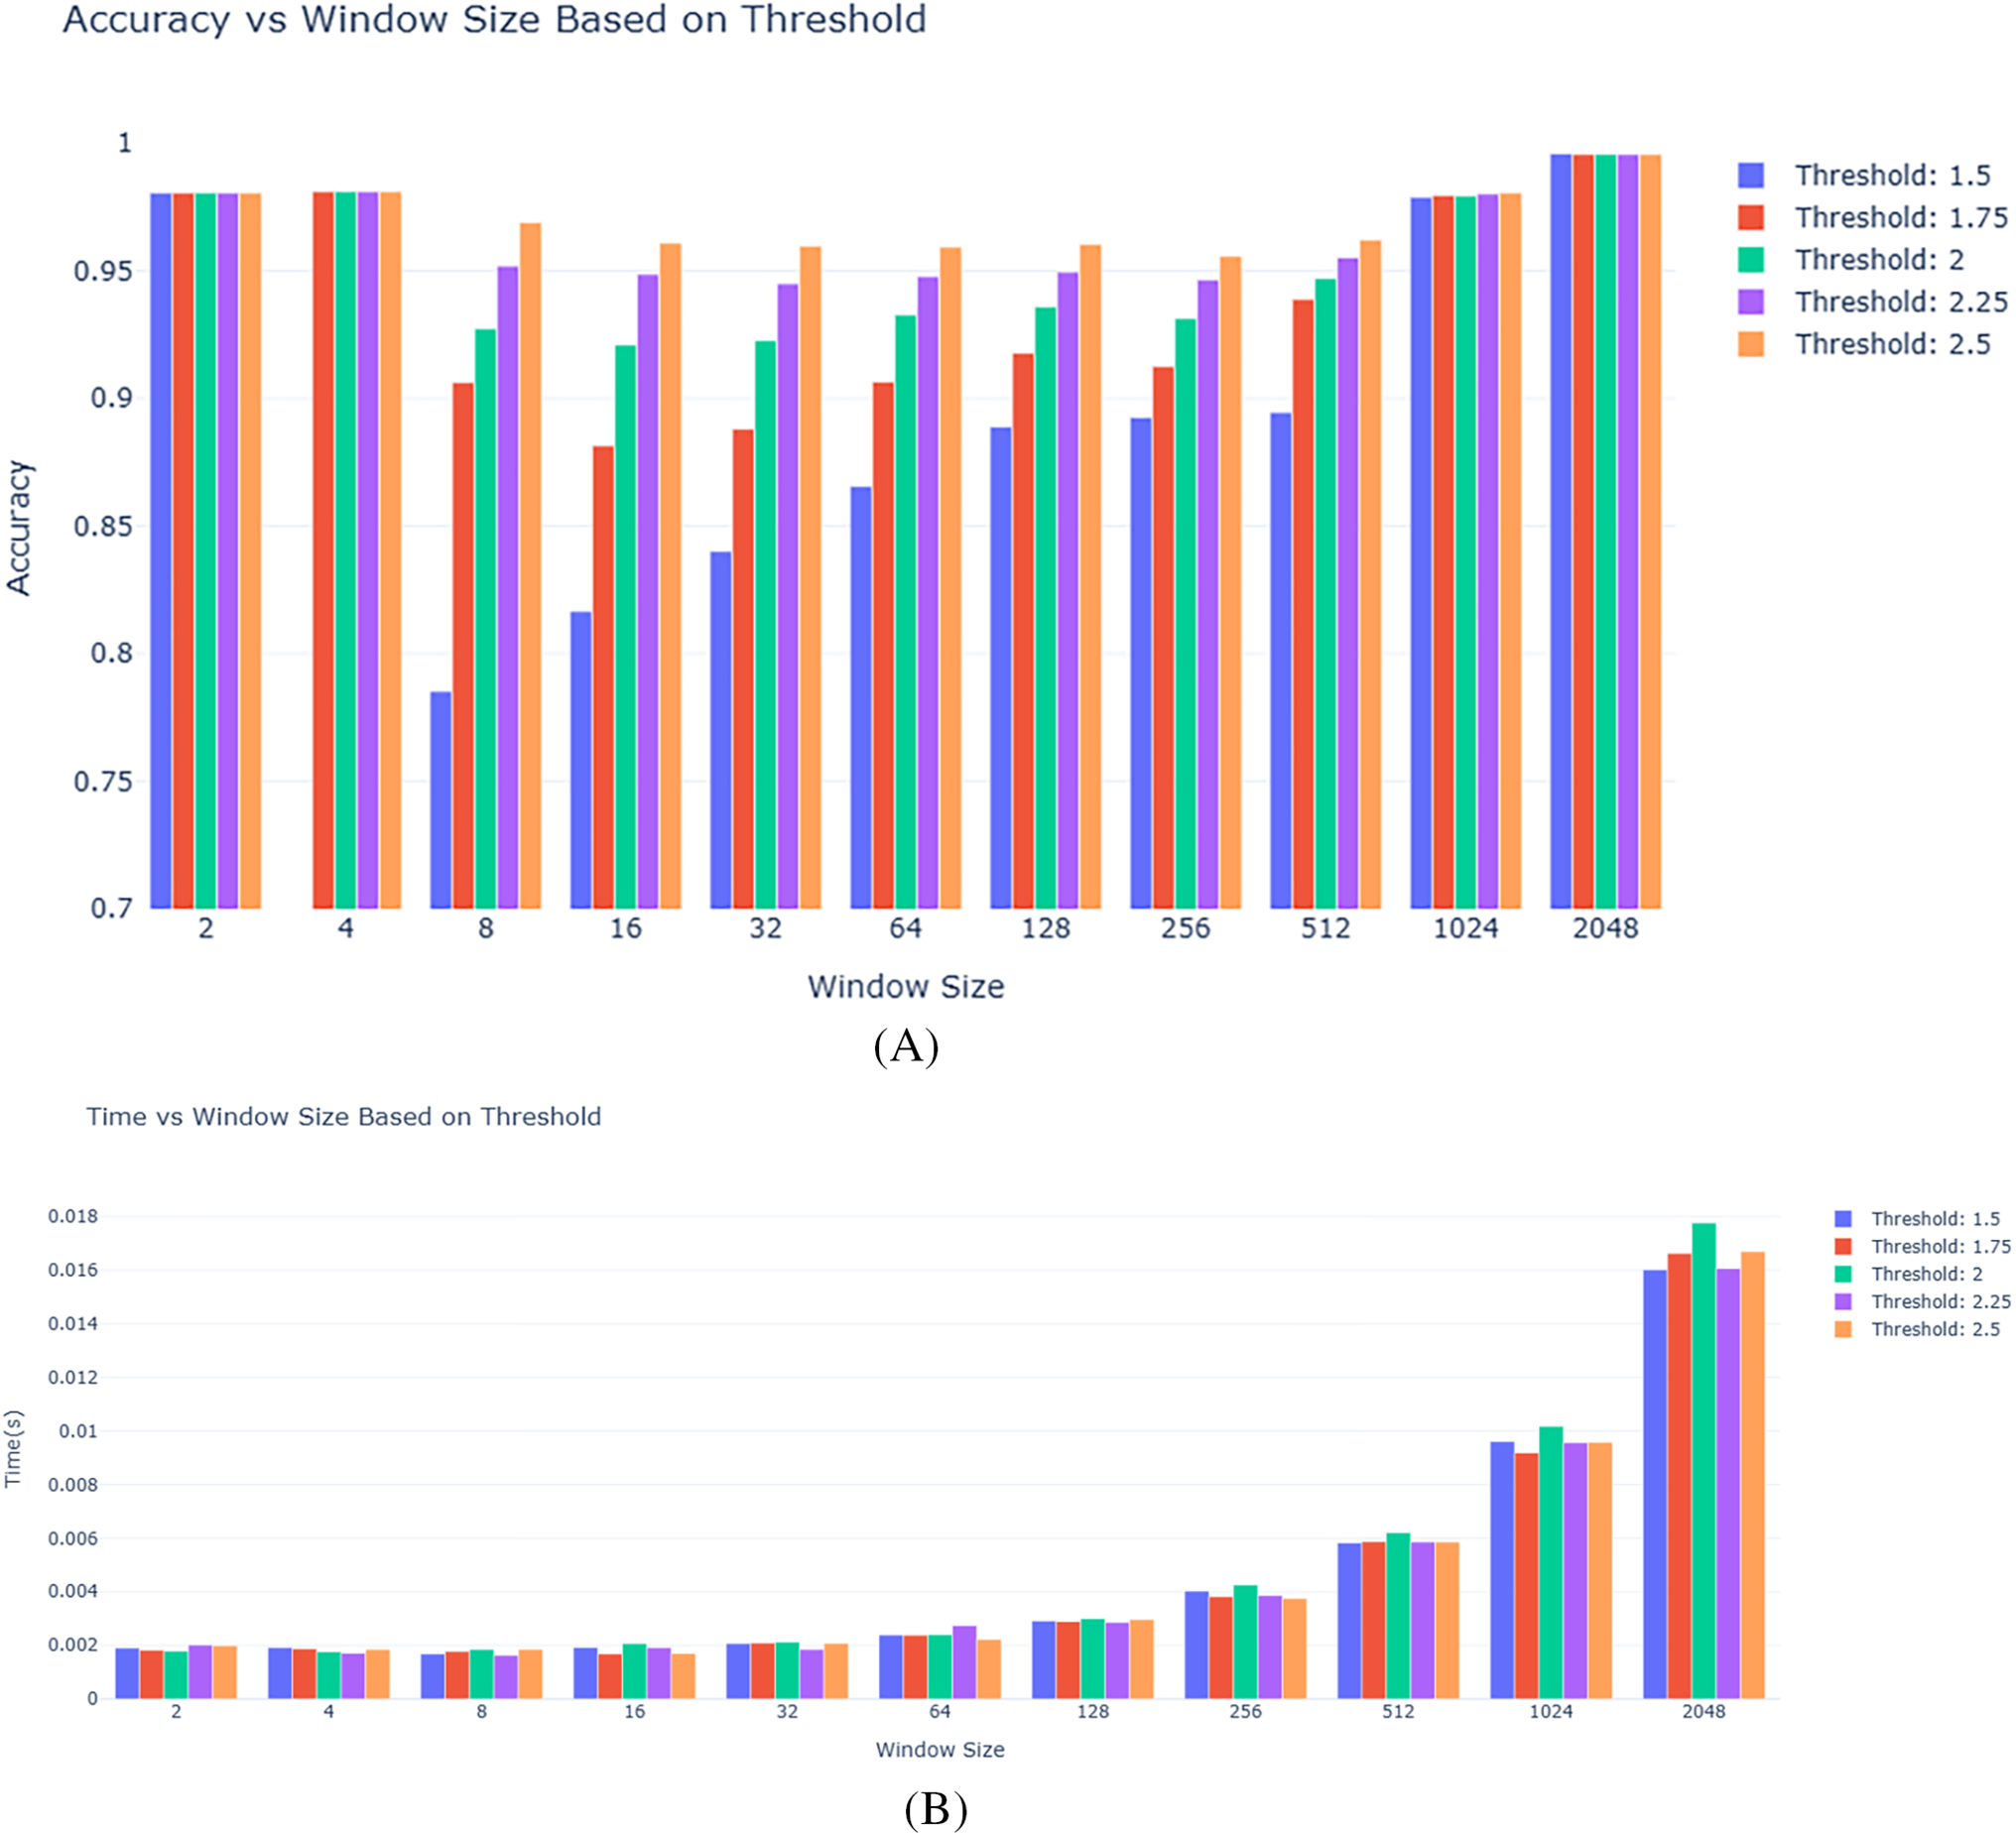
Figure 14: Shows the variation of evaluation and efficiency metrics as: (A) Accuracy score on different window sizes with varied threshold values. (B) Anomaly detection time (in seconds) on different window sizes with varied threshold values
Table 10 presents the performance metrics for models evaluated on three different datasets. The Arduino Real World Dataset, NF-ToN-IoT, and NF-BoT-IoT show varying results in terms of Accuracy, Precision, Recall, and F1 Score. These metrics highlight the effectiveness and generalisation capabilities of the models across diverse data sources.
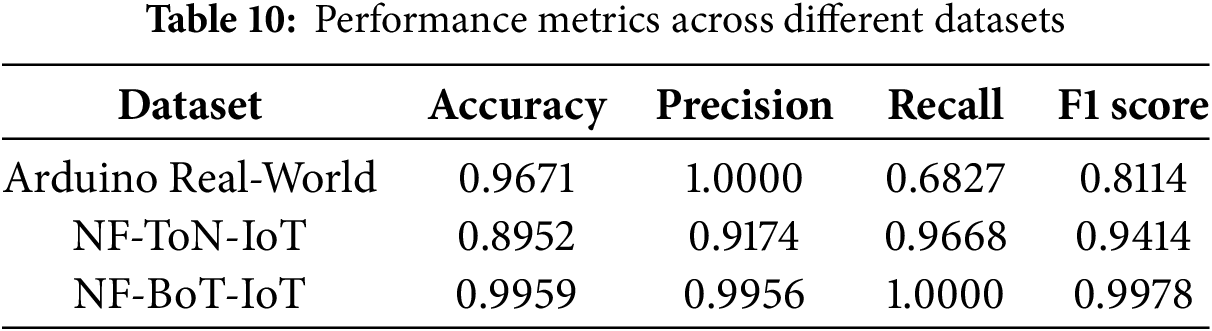
Fig. 15 shows a comparison of accuracy over several threshold values for the three datasets. Looking at the Arduino Real-World Dataset, it is clear that raising threshold values does not improve accuracy, but in cases of NF-ToN-IoT and NF-BoT-IoT, accuracy clearly improves. As such, it can be concluded that the ideal threshold value depends on the properties of the dataset. Fig. 16 plots contrast accuracy over several window sizes. When comparing the three, the optimal window size varies significantly across the datasets. As such, it can be concluded that the ideal window size depends on the features of the dataset. Fig. 17 plots the time needed for anomaly detection is evaluated over several window sizes, showing that for all three used datasets, the time needed increases proportionately with window size. A smaller window allows for faster processing per window.

Figure 15: Accuracy score vs. threshold values on different datasets
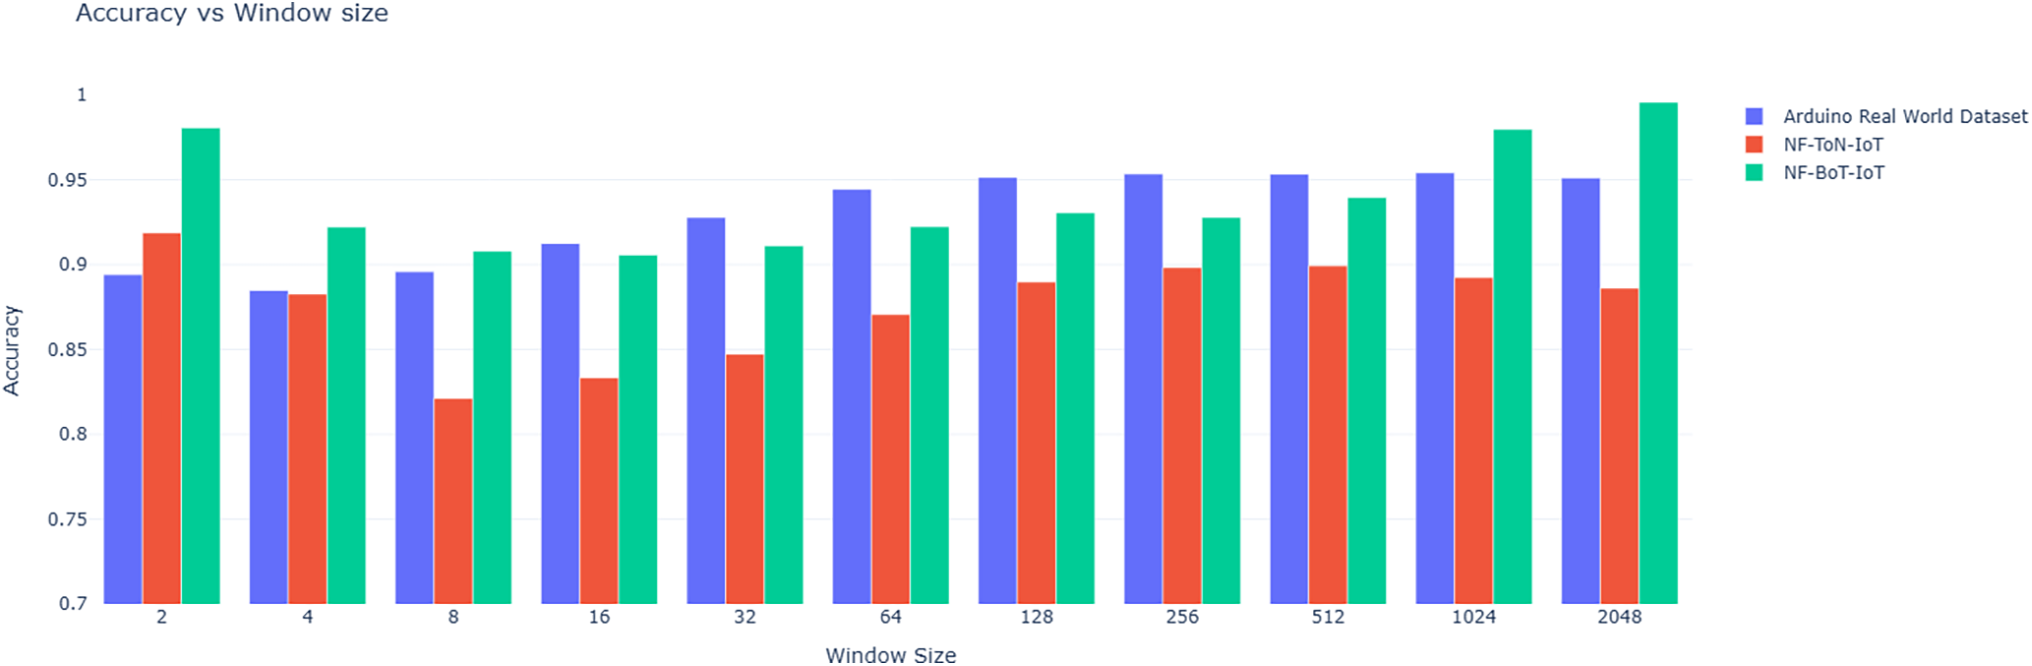
Figure 16: Accuracy score vs. window size on different datasets

Figure 17: Anomaly detection time (in seconds) vs. Window size on different datasets
All experiments were executed on a local computing environment consisting of an Intel Core i3-1215U processor with 8.0 GB of RAM, operating on the Windows 11 platform.
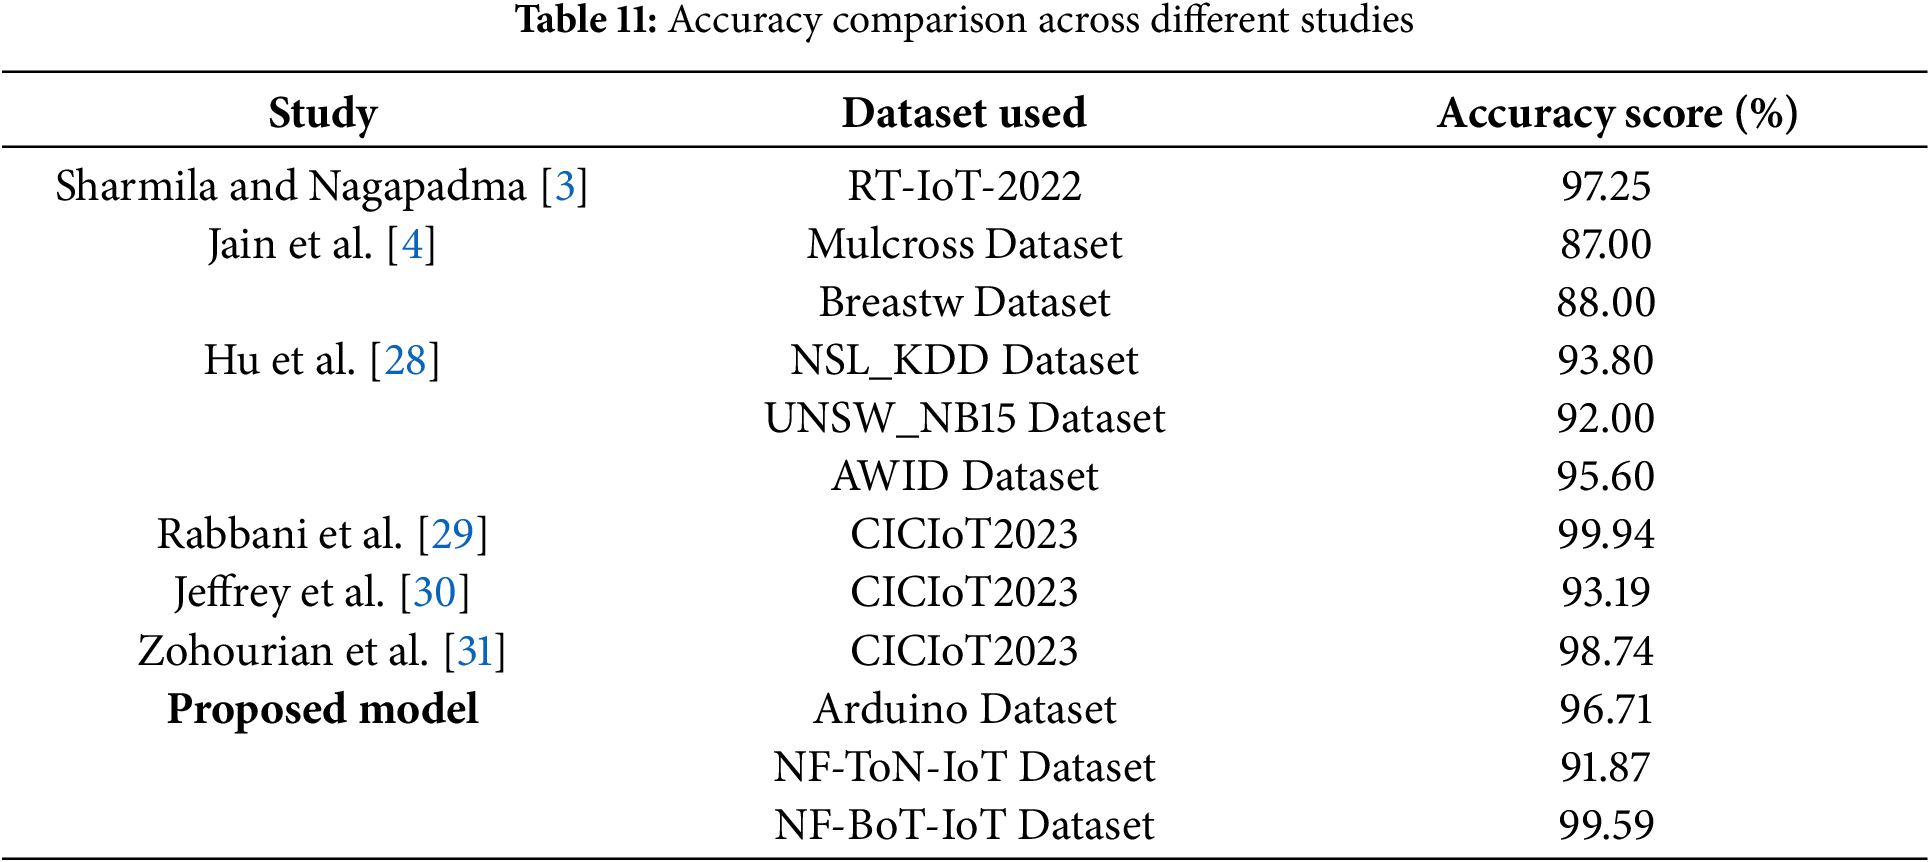
The presented resource-efficient anomaly detection system effectively addresses real-time anomaly detection in streaming data. The framework guarantees data continuity and accuracy even with partial data using a sliding window approach combined with MLR for missing value prediction. PCA helps to reduce dimensionality, thus optimising computational efficiency without sacrificing data integrity. While maintaining low computational overhead and simplicity, the Z-score approach for anomaly detection enables the system to identify significant deviations. Framework robustness and adaptability are confirmed by experimental data spanning several datasets, including the Arduino Real-World Dataset, NF-ToN-IoT, and NF-BoT-IoT. The comparison of the obtained balance between detection accuracy and processing time reveals the possible real-world applications of the framework in IoT ecosystems where fast anomaly detection is needed for maintaining operational integrity and security. The comparative analysis of accuracy scores across various existing studies and the proposed model is summarised in Table 11.
While the NF-ToN-IoT, NF-BoT-IoT, and Arduino Real-World datasets are frequently utilised for developing IDS in IoT settings, each has its own drawbacks. Although the NF-ToN-IoT dataset is extensive, its NetFlow-based format prevents payload-level data, and its simulated attacks may lack realism. The NF-BoT-IoT dataset faces similar issues, including a significant class imbalance and synthetic traffic, and might not accurately represent network behaviours. The Arduino Real-World dataset, although useful for sensor-level anomaly detection, is limited to a few types of sensors, which limits its scalability and applicability to larger IoT systems.
In this work, we demonstrated the flexibility over many datasets, including the Arduino Real-World dataset, NF-ToN-IoT, and NF-BoT-IoT, by presenting a resource-efficient anomaly detection framework designed for real-time monitoring in IoT and network security environments. The system effectively balances missing or corrupted sensor values through its use of MLR, so preserving data integrity prior to anomaly detection, PCA for dimensionality reduction, and Z-Score-based anomaly detection essentially balance detection accuracy and computational efficiency in the framework. The results show consistent performance across different threshold values and sliding window sizes, preserving real-time feasibility in resource-constrained environments. High accuracies were achieved, particularly on complex network datasets like NF-BoT-IoT, which show the highest values. As our research highlights, depending on specific application criteria, the trade-off between accuracy and processing time highlights the need for parameter tuning.
Though the proposed architecture shows promising adaptability and resilience, some limitations still exist. One notable constraint lies in the use of the MLR model for imputing missing values. This model is trained only once using the data available during the initial filling of the sliding window. As a result, scenarios involving concept drift may degrade. Future work will focus on integrating adaptive thresholding techniques and lightweight ML models designed for edge computing environments. Furthermore, improving the scalability and responsiveness of the system could be done by exploring real-time stream processing systems and advanced dimensionality reduction methods. Incorporating DL models for dynamic feature extraction and anomaly classification, and testing the framework on more diverse datasets, could further enhance its generalizability and robustness considerably. The ultimate goal is to extend the framework’s applicability for broader uses in IoT, IIoT, and TMoT systems, enabling more accurate and efficient anomaly detection in demanding real-world settings.
Acknowledgement: The authors extend their appreciation to King Saud University for funding this research through Ongoing Research Funding Program (ORF-2025-890), King Saud University, Riyadh, Saudi Arabia. Also, this work was supported by the Competitive Research Fund of the University of Aizu, Japan.
Funding Statement: This research is funded by the Ongoing Research Funding Program (ORF-2025-890), King Saud University, Riyadh, Saudi Arabia and was supported by the Competitive Research Fund of the University of Aizu, Japan.
Author Contributions: The authors confirm their contribution to the paper as follows: Conceptualization, Kirubavathi G and Sultan Alfarhood; Methodology, Kirubavathi G, Arjun Pulliyasseri and Aswathi Rajesh; Software, Arjun Pulliyasseri, Aswathi Rajesh and Amal Ajayan; Validation, Sultan Alfarhood, Kirubavathi G and Mejdl Safran; Formal Analysis, Amal Ajayan, Aswathi Rajesh, Meshal Alfarhood and Jungpil Shin; Investigation, Amal Ajayan, Mejdl Safran and Meshal Alfarhood; Resources, Amal Ajayan and Sultan Alfarhood; Writing—original draft preparation, Aswathi Rajesh, Arjun Pulliyasseri and Amal Ajayan; Writing—review and editing, Sultan Alfarhood and Mejdl Safran; Project administration, Kirubavathi G and Sultan Alfarhood; Supervision, Jungpil Shin, Sultan Alfarhood, and Kirubavathi G. All authors reviewed the results and approved the final version of the manuscript.
Availability of Data and Materials: The data that support the findings of this study are openly available at the following sources: The NF-BoT-IoT and NF-ToN-IoT datasets are available at http://staff.itee.uq.edu.au/marius/NIDS_datasets/ (accessed on 28 May 2025). The Anomaly Detection dataset is openly available at IEEE Dataport [33].
Ethics Approval: Not applicable.
Conflicts of Interest: The authors declare no conflicts of interest to report regarding the present study.
Abbreviations
| IoT | Internet of Things |
| IIoT | Industrial Internet of Things |
| TMoT | Transportation Management of Things |
| IoMT | Internet of Medical Things |
| PCA | Principal Component Analysis |
| GRU | Gated Recurrent Unit |
| MLR | Multivariate Linear Regression |
| WSN | Wireless Sensor Networks |
| NIDS | Network Intrusion Detection Systems |
| DDoS | Distributed Denial of Service |
| NOC | Network Operation Center |
| GMM | Gaussian Mixture Models |
| DTA | Dynamic Tensor Analysis |
| STA | Streaming Tensor Analysis |
| RNN | Recurrent Neural Networks |
| kNN | k-Nearest Neighbours |
| DT | Decision Trees |
| LSTM | Long Short-Term Memory |
| RF | Random Forest |
| AI | Artificial Intelligence |
| ML | Machine Learning |
| DL | Deep Learning |
| QAE | Quantised Autoencoder |
| IDS | Intrusion Detection Systems |
| AIDS | Anomaly-Based Intrusion Detection System |
| RDE | Remote Detection Engine |
| SVM | Support vector machine |
| APT | Advanced Persistent Threat |
| LDA | Linear Discriminant Analysis |
| t-SNE | t-distributed Stochastic Neighbor Embedding |
| UMAP | Uniform Manifold Approximation and Projection |
| SVD | Singular Value Decomposition |
| STL | Seasonal and Trend Decomposition Using Loess |
| SMOTE | Synthetic Minority Over-sampling Technique |
| CAFFN | Cross-Dimension Attentive Feature Fusion Network |
References
1. Chatterjee A, Ahmed BS. IoT anomaly detection methods and applications: a survey. Internet of Things. 2022;19(3):100568. doi:10.1016/j.iot.2022.100568. [Google Scholar] [CrossRef]
2. Vázquez FI, Hartl A, Zseby T, Zimek A. Anomaly detection in streaming data: a comparison and evaluation study. Expert Syst Appl. 2023;233:120994. doi:10.1016/j.eswa.2023.120994. [Google Scholar] [CrossRef]
3. Sharmila BS, Nagapadma R. Quantized autoencoder (QAE) intrusion detection system for anomaly detection in resource-constrained IoT devices using RT-IoT2022 dataset. Cybersecurity. 2023;6(1):41. doi:10.1186/s42400-023-00178-5. [Google Scholar] [CrossRef]
4. Jain P, Jain S, Zaïane OR, Srivastava A. Anomaly detection in resource constrained environments with streaming data. IEEE Trans Emerg Top Comput Intell. 2021;6(3):649–59. doi:10.1109/tetci.2021.3070660. [Google Scholar] [CrossRef]
5. Jamil W, Duong NC, Wang W, Mansouri C, Mohamad S, Bouchachia A. Scalable online learning for flink: SOLMA library. In: ECSA '18: Proceedings of the 12th European Conference on Software Architecture: Companion Proceedings; 2018; Madrid, Spain. p. 1–4. doi:10.1145/3241403.3241438. [Google Scholar] [CrossRef]
6. Min-Gyu Kim HK. Anomaly detection in imbalanced encrypted traffic with few packet metadata-based feature extraction. Comput Model Eng Sci. 2024;141(1):585–607. doi:10.32604/cmes.2024.051221. [Google Scholar] [CrossRef]
7. Kirubavathi G, Guruakshya C. An ensemble stacked boosting framework for advanced persistent threat (APT) detection in the industrial internet of things (IIoT). In: 2024 4th International Conference on Mobile Networks and Wireless Communications (ICMNWC); 2024 Dec 4–5; Tumkuru, India. p. 1–6. [Google Scholar]
8. Kirubavathi G, Nair AR. Hybrid deep learning framework-based intrusion detection system for the internet of things. In: 2024 International Conference on Intelligent Systems for Cybersecurity (ISCS); 2024 May 3–4; Gurugram, India. p. 1–6. [Google Scholar]
9. Liu Y, Zhang L, Guan Y. A distributed data streaming algorithm for network-wide traffic anomaly detection. ACM SIGMETRICS Perform Eval Rev. 2009;37(2):81–2. doi:10.1145/1639562.1639596. [Google Scholar] [CrossRef]
10. Kumar YRS, Champa HN. IoT streaming data outlier detection and sensor data aggregation. In: 2020 Fourth International Conference on I-SMAC (IoT in Social, Mobile, Analytics and Cloud) (I-SMAC); 2020 Oct 7–9; Palladam, India. p. 150–5. doi:10.1109/i-smac49090.2020.9243509. [Google Scholar] [CrossRef]
11. Gupta BB, Gaurav A, Attar RW, Arya V, Alhomoud A, Chui KT. LSTM based neural network model for anomaly event detection in care-independent smart homes. Comput Model Eng Sci. 2024;140(3):2689–706. doi:10.32604/cmes.2024.050825. [Google Scholar] [CrossRef]
12. Migenda N, Schenck W. Adaptive dimensionality reduction for local principal component analysis. In: 2020 25th IEEE International Conference on Emerging Technologies and Factory Automation (ETFA); 2020 Sep 8–11; Vienna, Austria. p. 1579–86. doi:10.1109/etfa46521.2020.9212129. [Google Scholar] [CrossRef]
13. Sun J, Tao D, Faloutsos C. Beyond streams and graphs: dynamic tensor analysis. In: KDD ’06: Proceedings of the 12th ACM SIGKDD International Conference on Knowledge Discovery and Data Mining; 2006 Aug 20–23; Philadelphia, PA, USA. p. 374–83. doi:10.1145/1150402.1150445. [Google Scholar] [CrossRef]
14. Gibbons PB, Tirthapura S. Distributed streams algorithms for sliding windows. In: SPAA ’02: Proceedings of the Fourteenth Annual ACM Symposium on Parallel Algorithms and Architectures; 2002 Aug 10–13; Winnipeg, MB, Canada. p. 63–72. doi:10.1145/564870.564880. [Google Scholar] [CrossRef]
15. Ahmad S, Lavin A, Purdy S, Agha Z. Unsupervised real-time anomaly detection for streaming data. Neurocomputing. 2017;262:134–47. doi:10.1016/j.neucom.2017.04.070. [Google Scholar] [CrossRef]
16. Cook AA, Misirli G, Fan Z. Anomaly detection for IoT time-series data: a survey. IEEE Internet Things J. 2020;7(7):6481–94. doi:10.1109/jiot.2019.2958185. [Google Scholar] [CrossRef]
17. Li R, Li Y, He W, Chen L, Luo J. Multi-layer reconstruction errors autoencoding and density estimate for network anomaly detection. Comput Model Eng Sci. 2021;128(1):381–98. doi:10.32604/cmes.2021.016264. [Google Scholar] [CrossRef]
18. Zhang Y, Bingham CM, Yang Z, Gallimore M, Ling WK. Sensor fault detection for industrial gas turbine system by using principal component analysis based y-distance indexes. In: 2012 8th International Symposium on Communication Systems, Networks & Digital Signal Processing (CSNDSP); 2012 Jul 18–20; Poznan, Poland. p. 1–6. doi:10.1109/csndsp.2012.6292687. [Google Scholar] [CrossRef]
19. Jinad R, Gupta K, Oladimeji D, Rasheed A, Varol C. Real-time anomaly detection in physiological parameters: a multi-squad monitoring and communication architecture. Sensors. 2025;25(3):929. doi:10.3390/s25030929. [Google Scholar] [PubMed] [CrossRef]
20. Alalwany E, Alsharif B, Alotaibi Y, Alfahaid A, Mahgoub I, Ilyas M. Stacking ensemble deep learning for real-time intrusion detection in IoMT environments. Sensors. 2025;25(3):624. doi:10.3390/s25030624. [Google Scholar] [PubMed] [CrossRef]
21. Venkataanusha P, Anuradha C, Murty PSRC, Chebrolu SK. Detecting outliers in high dimensional data sets using Z-score methodology. Int J Inno Technol Exploring Eng. 2019;9(1):48–53. doi:10.35940/ijitee.a3910.119119. [Google Scholar] [CrossRef]
22. Teixeira PHDS, Milidiú RL. Data stream anomaly detection through principal subspace tracking. In: SAC ’10: Proceedings of the 2010 ACM Symposium on Applied Computing; 2010 Mar 22–26; Sierre, Switzerland. p. 1609–16. doi:10.1145/1774088.1774434. [Google Scholar] [CrossRef]
23. Song W, Li X, Chen P, Chen J, Ren J, Xia Y. A novel graph structure learning based semi-supervised framework for anomaly identification in fluctuating IoT environment. Comput Model Eng Sci. 2024;140(3):3001–16. doi:10.32604/cmes.2024.048563. [Google Scholar] [CrossRef]
24. Qi L, Yang Y, Zhou X, Rafique W, Ma J. Fast anomaly identification based on multiaspect data streams for intelligent intrusion detection toward secure Industry 4.0. IEEE Trans Ind Inform. 2021;18(9):6503–11. doi:10.1109/tii.2021.3139363. [Google Scholar] [CrossRef]
25. Zachos G, Mantas G, Porfyrakis K, Rodriguez J. Implementing anomaly-based intrusion detection for resource-constrained devices in IoMT networks. Sensors. 2025;25(4):1216. doi:10.3390/s25041216. [Google Scholar] [PubMed] [CrossRef]
26. Huo Y, Cao Y, Wang Z, Yan Y, Ge Z, Yang Y. Traffic anomaly detection method based on improved GRU and EFMS-Kmeans clustering. Comput Model Eng Sci. 2021;126(3):1053–91. doi:10.32604/cmes.2021.013045. [Google Scholar] [CrossRef]
27. Yatagha R, Mejri O, Waedt K, Ruland C. Assessing the complexity and real-time performance of anomaly detection algorithms in resource-constrained environments. In: 2024 IEEE 20th International Conference on Intelligent Computer Communication and Processing (ICCP); 2024 Oct 17–19; Cluj-Napoca, Romania. p. 1–8. doi:10.1109/iccp63557.2024.10793006. [Google Scholar] [CrossRef]
28. Hu N, Tian Z, Lu H, Du X, Guizani M. A multiple-kernel clustering based intrusion detection scheme for 5G and IoT networks. Int J Mach Learn Cybern. 2021;12(11):3129–44. doi:10.1007/s13042-020-01253-w. [Google Scholar] [CrossRef]
29. Rabbani M, Gui J, Nejati F, Zhou Z, Kaniyamattam A, Mirani M, et al. Device identification and anomaly detection in IoT environments. IEEE Int Things J. 2025;12(10):13625–43. doi:10.1109/jiot.2024.3522863. [Google Scholar] [CrossRef]
30. Jeffrey N, Tan Q, Villar JR. Using ensemble learning for anomaly detection in cyber-physical systems. Electronics. 2024;13(7):1391. doi:10.3390/electronics13071391. [Google Scholar] [CrossRef]
31. Zohourian A, Dadkhah S, Molyneaux H, Neto ECP, Ghorbani AA. IoT-PRIDS: leveraging packet representations for intrusion detection in IoT networks. Comput Secur. 2024;146(15):104034. doi:10.1016/j.cose.2024.104034. [Google Scholar] [CrossRef]
32. Sarhan M, Layeghy S, Moustafa N, Portmann M. NetFlow datasets for machine learning-based network intrusion detection systems. In: Deze Z, Huang H, Hou R, Rho S, Chilamkurti N, editors. Big data technologies and applications. Cham, Switzerland: Springer International Publishing; 2021. p. 117–35. doi:10.1007/978-3-030-72802-1_9. [Google Scholar] [CrossRef]
33. Jain P, Jain S. Anomaly detection dataset. IEEE Dataport. 2020. doi:10.21227/rt7n-2x60. [Google Scholar] [CrossRef]
Cite This Article
 Copyright © 2025 The Author(s). Published by Tech Science Press.
This work is licensed under a Creative Commons Attribution 4.0 International License , which permits unrestricted use, distribution, and reproduction in any medium, provided the original work is properly cited.
 Downloads
 Citation Tools