
 Submit a Paper
 Propose a Special lssue
 Open Access
ARTICLE

Intrusion Detection Model on Network Data with Deep Adaptive Multi-Layer Attention Network (DAMLAN)
1 Information Systems Department, College of Computer and Information Sciences, Princess Nourah bint Abdulrahman University, Riyadh, 11671, Saudi Arabia
2 Computer Science Department, College of Computer & Information Sciences, Prince Sultan University, 11586, Riyadh
3 Department of Computing, College of Engineering and Computing, Umm Al-Qura University, Makkah, 24382, Saudi Arabia
4 College of Computing, Umm Al-Qura University, Makkah, 24382, Saudi Arabia
* Corresponding Author: Syed Umar Amin. Email:
Computer Modeling in Engineering & Sciences 2025, 144(1), 581-614. https://doi.org/10.32604/cmes.2025.065188
Received 06 March 2025; Accepted 08 July 2025; Issue published 31 July 2025
 View Full Text
 Download PDF
Abstract
The growing incidence of cyberattacks necessitates a robust and effective Intrusion Detection Systems (IDS) for enhanced network security. While conventional IDSs can be unsuitable for detecting different and emerging attacks, there is a demand for better techniques to improve detection reliability. This study introduces a new method, the Deep Adaptive Multi-Layer Attention Network (DAMLAN), to boost the result of intrusion detection on network data. Due to its multi-scale attention mechanisms and graph features, DAMLAN aims to address both known and unknown intrusions. The real-world NSL-KDD dataset, a popular choice among IDS researchers, is used to assess the proposed model. There are 67,343 normal samples and 58,630 intrusion attacks in the training set, 12,833 normal samples, and 9711 intrusion attacks in the test set. Thus, the proposed DAMLAN method is more effective than the standard models due to the consideration of patterns by the attention layers. The experimental performance of the proposed model demonstrates that it achieves 99.26% training accuracy and 90.68% testing accuracy, with precision reaching 98.54% on the training set and 96.64% on the testing set. The recall and F1 scores again support the model with training set values of 99.90% and 99.21% and testing set values of 86.65% and 91.37%. These results provide a strong basis for the claims made regarding the model’s potential to identify intrusion attacks and affirm its relatively strong overall performance, irrespective of type. Future work would employ more attempts to extend the scalability and applicability of DAMLAN for real-time use in intrusion detection systems.Keywords
Intrusion Detection Systems (IDS) are fundamental for current network and system protection against unauthorized access, misuse, and malicious activities [1,2]. Due to the increased growth of the internet and new technologies in the network, new attacks have emerged, thus complicating the identification of the potential of an attack [3,4]. Typically, first-generation IDS relies on strong preprogrammed patterns and set rules. Therefore, traditional IDSs don’t identify new, unknown, or camouflaged attacks. This limitation highlights that the future of cybersecurity lies in developing a more flexible and self-learning system capable of updating on the fly due to the emergence of new, unknown attack plans [5]. Therefore, the use of machine learning (ML) and deep learning (DL) models in integrating IDS has garnered considerable interest because they enable the IDS to learn from past experiences and adapt to improve its threat detection capabilities [6].
However, the effectiveness of IDS models depends mainly on the quality and the sample of the dataset used in learning. Some problems exist with the NSL-KDD dataset, a benchmark for IDS. Some of these are structural characteristics of the dataset, such as the existence of a variety of attack types, which are imbalanced, and the data features, where some of the feature spaces have high dimensionality and are heavily overlapping, making it difficult to build an ideal model [7]. However, all these come with several challenges. Therefore, there is a need to design more effective intrusion detection models that can address these challenges. To address these challenges, this study introduces a novel methodology utilizing DAMLAN, designed to facilitate the identification of complex attack scenarios within network traffic data. The proposed DAMLAN model adopts numerous techniques, such as sequential processing based on Gated Recurrent Unit (GRU) [8], graph methods to cluster features, attention mechanisms to attend crucial features, and multi-scale self-attention to detect finer attack pattern changes [9,10]. They enable the model to independently distinguish different patterns of attacks and diversify them despite their noise or overlapping characteristics.
This study aims to incorporate an intelligent, scalable, and adaptable IDS due to the shortcomings of earlier systems. By employing all layers of attention in DAMLAN, the proposed model is expected to offer enhanced detection accuracy, particularly in the real-world imbalanced NSL-KDD network traffic dataset.
As depicted in Fig. 1, the intrusion detection model for network data using DAMLAM comprises data ingestion (raw and NSL-KDD), data preprocessing (data cleaning, feature extraction), the DAMLAM framework (GRU, attention mechanism, clustering, and multi-scale attention), and IDS output.
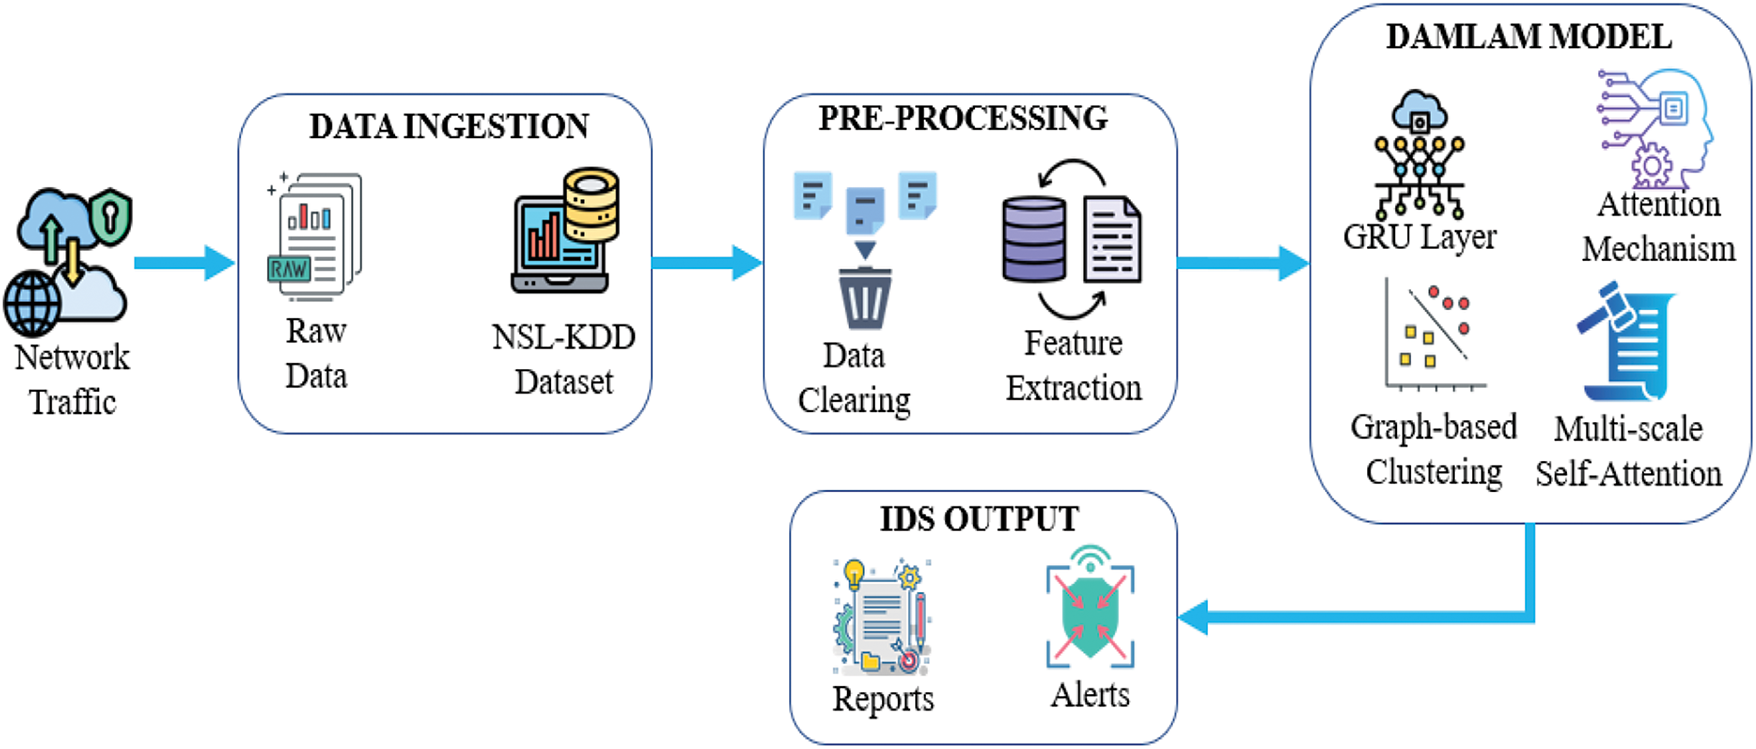
Figure 1: Framework of intrusion detection model on network data with DAMLAN
The following are the contributions of the study:
i Introduction of DAMLAN Architecture: This paper presents DAMLAN, which incorporates several state-of-the-art methodologies to enhance intrusion detection performance, especially for intricate attacks.
ii Innovative Integration of GRU and Attention Mechanisms: The GRU is incorporated into the model for sequential learning, while enhanced attack features are achieved using an advanced attention mechanism to enable the model to focus on specific data rather than noisy data.
iii Graph-Based Clustering for Feature Representation: Instead of traditional clustering methods, DAMLAN utilizes graphs to enhance the conceptualization and identification of attacks based on contextual issues in NSL-KDD and other high-dimensional datasets.
iv Evaluation of NSL-KDD Dataset: The model is then applied to learn and detect intrusions from a real-world dataset, namely NSL-KDD, which is used to prove the effectiveness of the model in dealing with the internal complexities, imbalance, and overlapping features present in actual real-time intrusion detection scenarios.
The proposed DAMLAN model significantly enhances the identification of complex cyber threats and provides a clear path for growth in IDS solutions.
Problem Statement
The continued growth and evolution of cyber threats necessitate the development of more comprehensive procedures for safeguarding network systems. Intrusion Detection Systems (IDSs) require no brief introduction to their functions and importance in detecting unauthorized access and blocking potential intrusions on a network. Previous IDS models have used set, rule-based, or machine-learning approaches that cannot change quickly, resulting in high false-positive or false-negative scores. Since attacks are more complex and continuing to evolve, a more sophisticated model that can detect intrusions with low false positives is required. For large-scale, complex data, and therefore may not be effective when trying to detect new or more complex attack patterns. Hence, new strategies must be developed to learn from the data, precisely the growing number of cyber threats.
To overcome these limitations in intrusion detection, this research develops the DAMLAN. DAMLAN also uses state-of-the-art techniques in deep learning that incorporate multi-layer attention to amplify the model’s directional feature learning on the data. The model can also learn from new incoming traffic patterns and, therefore, differentiate between normal and suspicious traffic. A multilayered attention structure in DAMLAN can also help detect complex interdependencies between network traffic, thereby improving and accelerating the intrusion detection process. The approach helps minimize false positive rates, enhances true identification, and provides a high-throughput solution for practical near-real-time use in complex networks, qualifying it as a viable defense instrument for protecting vulnerable global network systems against various types of cyber threats.
Intrusion detection systems (IDS) are necessary for modern networks, and deep learning models are often used to detect malicious attacks. Significant research has been conducted to enhance the accuracy, effectiveness, and flexibility of IDS by employing various machine learning and deep learning structures.
Zhang et al. [11] have introduced network intrusion detection using an innovative method called Bidirectional Long Short-Term Memory (BiLSTM) accompanied by Multi-Head Attention. They tested their model on benchmark datasets, including KDDCUP99, NSLKDD, and CICIDS2017, achieving detection accuracy rates of 98.29%, 95.19%, and 99.08%, respectively. However, their approach suffers from the issue of model complexity and a potential overfitting problem. In the same year, Soltani et al. [12] proposed an ML-agent deep learning framework to handle the problem of concept drift and big data in online intrusion detection. The authors implemented federated learning and continual deep anomaly detectors, achieving detection rates exceeding 95%. The authors’ model still has some drawbacks due to the distributed architecture.
In addition, Xi et al. [13] proposed a multi-scale network intrusion detection model using transformers and achieved accuracies of over 99%. They found that when the data’s complexity and the features’ integration were challenging, which pointed to the importance of feature extraction in IDS. In this case, Momand et al. [14] proposed the ABCNN-IDS model, an attention-based CNN with feature selection for IoT networks. They achieved an accuracy rate of 98.02% but faced problems such as class imbalance and diverse datasets.
Later, improvements to the self-attention mechanism were conducted by Xu et al. [15] in an iterative refinement manner for a few-shot learning network intrusion detection scheme, and the accuracy achieved was 98.3%. However, considering the complexity of the constructed model, the sample size limited the model. Similarly, Jihado et al. [16] combined CNN and BiLSTM for intrusion detection in hybrid deep learning models with an accuracy of 82.91% and 94.22%. The hurdles in multiclass classification and feature diminution were identified as issues; furthermore, Long et al. [17] proposed a transformer-based IDS for cloud security, achieving an accuracy of over 93%. However, the model proposed by this team was inefficient in terms of false positives and coverage of new threats. Other work includes the random forest-based IDS by Abdelaziz et al. [18], which focused on feature selection and got an accuracy of 93.31% but had the problem of imbalanced classes. Bamber et al. [19] fused CNN and LSTM and reached an accuracy of 95%, although the work done on the ensemble was restrained; further, Mo et al. [20] proposed a CNN-based IDS using Bayesian optimization and showed a classification accuracy of 98.36%; however, the problem of data imbalance and the absence of information on the dataset collection were discussed. Finally, the Network intrusion detection that Vinayakumar et al. [21] undertook using CNN-based architectures yielded 97.3% accuracy for CNN RNN, but suffered from overfitting as well as poorer performance resulting from deeper networks. In addition, Le et al. [22] utilize Graph Neural Networks (GNNs) with more informative edge features to improve multi-class attack detection; however, other limitations of traditional GNNs generalize. In contrast to these, our DAMLAN can effectively reduce feature redundancy and improve generalization via deep adaptive multi-layer attention.
These studies emphasize the need for ongoing efforts to further improve IDS performance, utilizing deep learning and attention mechanisms to address specific issues that require further investigation.
Further details of related work are given in Table 1.
Limitations of the Current Method
As it is evident to anyone familiar with network intrusion detection, current models have several drawbacks and challenges, especially regarding scalability, flexibility, and model Expressions. One major shortcoming is overfitting. A rather fussy model that is overfit to the training data and does not generalize well to unseen instances. Furthermore, many models fail to handle enormous and dynamic datasets efficiently and cannot effectively respond to changing network threats. Another problem evident in some models is the failure to incorporate numerous features, which, in turn, leads to a decline in the models’ ability to perceive different real-world scenarios.
For instance, multiple models today demonstrate high levels of accuracy; however, issues such as class imbalance, concept drift, or the fact that the system is distributed are not well addressed. Another model can utilize advanced approaches, such as deep learning or attention, to enhance the effectiveness of detectors. Still, detectors may sometimes fail to detect, make false detections, or provide incorrect predictions. Many models proposed for specific scenarios and designed to work, for example, in the cloud, may have issues when applied in other domains.
To address these challenges, the proposed model is DAMLAM—the Deep Adaptive Multi-Layer Attention Network. Specifically, it adapts the model to concept drift and combines complex features by using the adaptive attention mechanism across different layers. As mentioned, DAMLAM is not sensitive to the amount of sample data and remains effective in changing conditions, a characteristic not shared by other models. Moreover, extracting attention layers in DAMLAM often avoids deducting unnecessary patterns, which makes it better for real-time detection than the above models.
3 Data Acquisition and Preparation
The NSL-KDD dataset is a filtered dataset derived from the KDD Cup 1999 dataset [11,13,19] made available for testing IDS performance. The data for the KDD Cup 1999 was compiled during a machine learning exercise aimed at differentiating between normal traffic and intrusive traffic. That is precisely where and why the given dataset was initially effective at providing a benchmark for IDS models; however, it was not entirely without flaws: the aforementioned procedure of collection led to record redundancy, and the distribution of distinct attack types was imbalanced, which was not suitable for training strong models. Most of these concerns were addressed, leading to the formation of the NSL-KDD dataset, which eliminates many of these flaws, making it more suitable for research in intrusion detection.
The data used in the NSL-KDD dataset is derived from a simulated military computer network environment where both normal and intrusive traffic were produced. Capturing the traffic used a process similar to that of the KDD Cup 1999 dataset, which was generated from the DARPA 1998 Intrusion Detection Evaluation Program. This program required creating a realistic network load using various models, including normal communication and attack models, which closely simulate real threats to computer systems and networks.
The dataset consists of two main files: KDDTrain+.txt and KDDTest+.txt. KDDTrain+.txt contains labeled instances for training IDS models, where each record is represented by 41 features, such as connection type, protocol, and duration, as well as the label that classifies the connection as either “normal” or belonging to one of the four attack categories: This can be in the form of Denial of Service (DoS) or Remote to Local (R2L), User to Root (U2R), or Probe. While KDDTest+.txt includes previously generated and newly discovered attacks, it helps assess the algorithms’ ability to generalize the learned knowledge to novel threats. Such a structure enables IDS models to be rigorously evaluated for their detection capabilities in relation to a specific attack.
3.2 Pre-Processing and Cleaning
i. Missing Value Treatment: While handling the dataset, it became clear that no missing values or duplicate records were present. This eases the preprocessing, as there is no need to impute or drop any missing values.
ii. Label Transformation: The target variable was transformed into binary values:
• 0 for Normal traffic;
• 1 for Intrusion attack traffic.
This binary mapping is invaluable for simplifying classification tasks and improving the uniformity of model results.
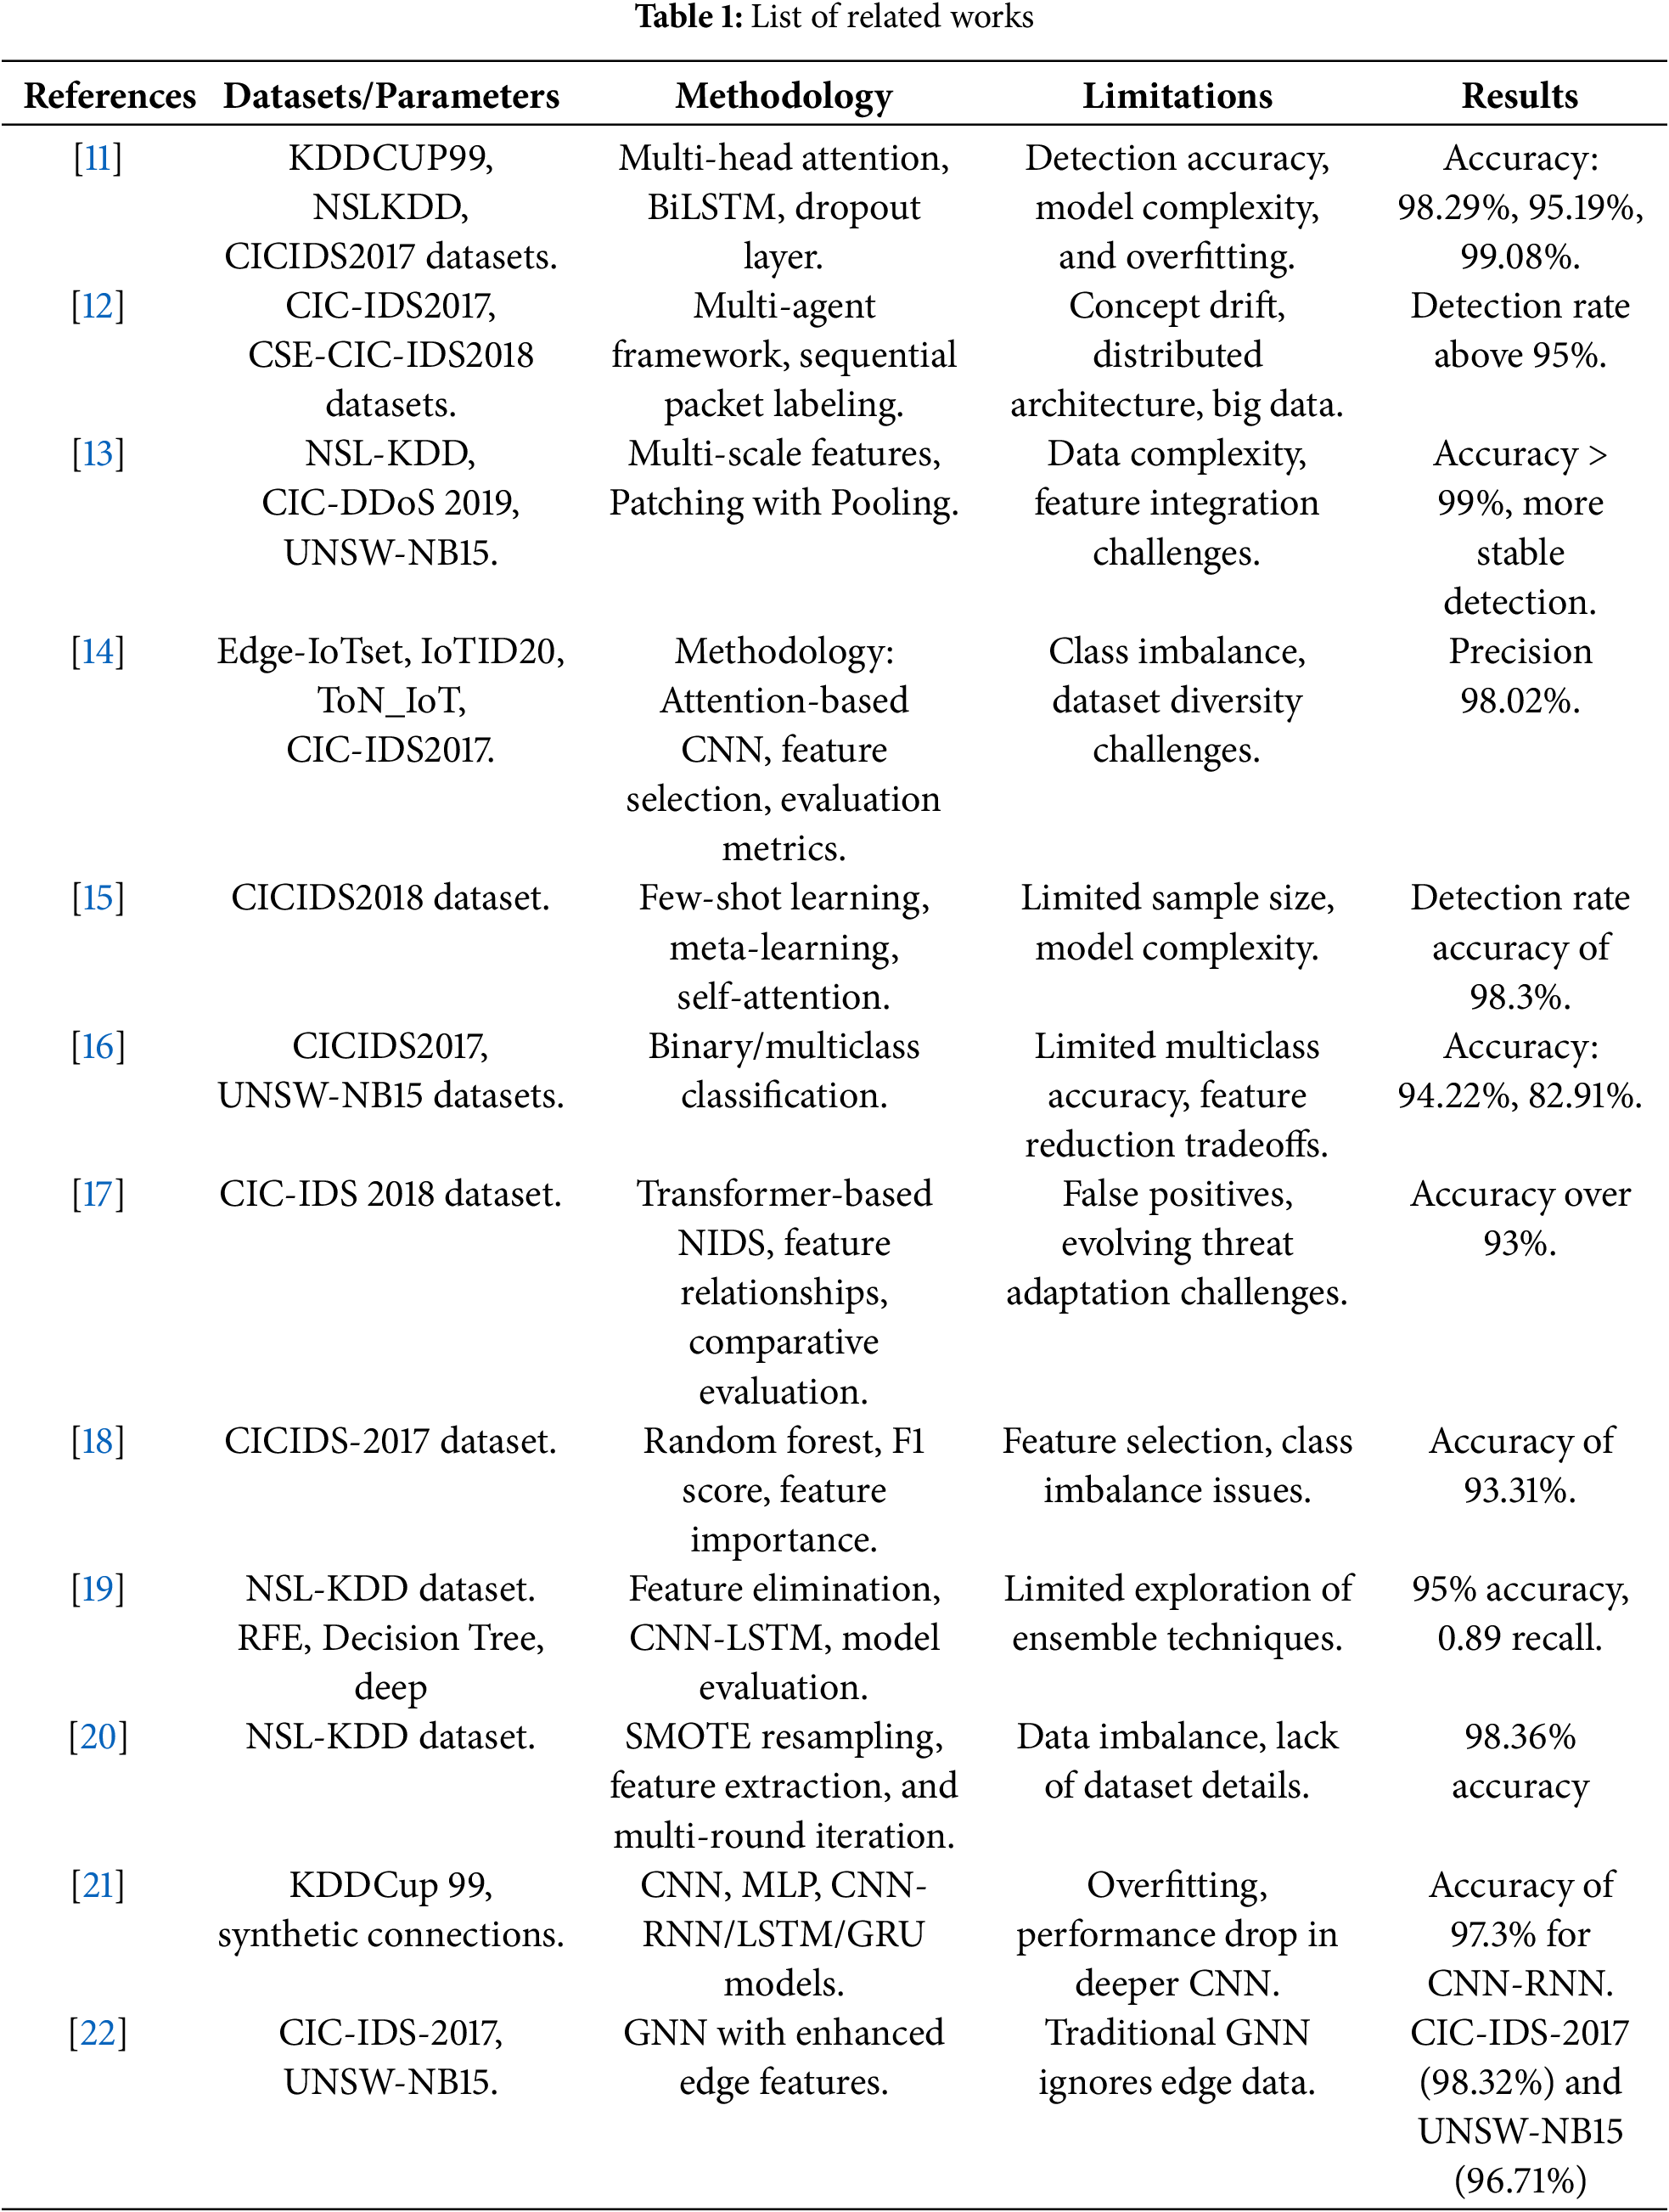
iii. Class Distribution
Training Set:
• Normal traffic: 67,343 records;
• Intrusion attacks: 58,630 records.
Testing Set:
• Normal traffic: 12,833 records;
• Intrusion attacks: 9711 records.
Figs. 2 and 3 illustrate the proportion of classes in the training and test data that can be used to diagnose class imbalance and take appropriate action.
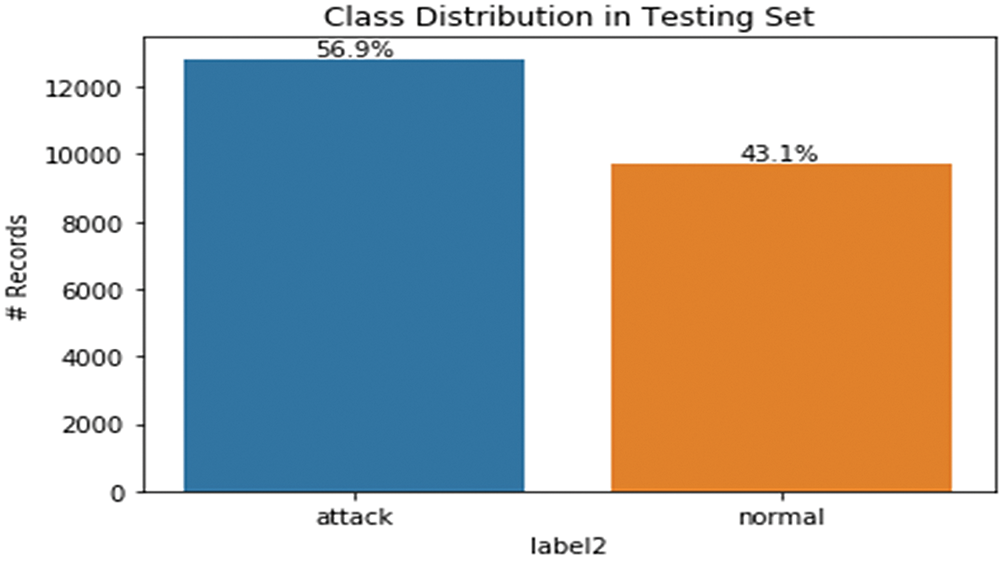
Figure 2: Target distribution in the training set
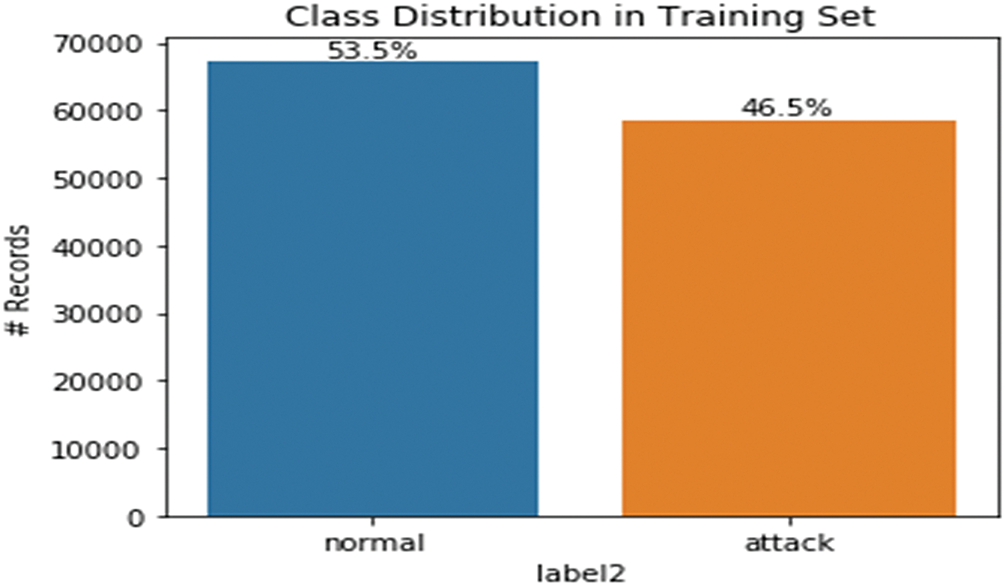
Figure 3: Target distribution in the testing set
iv. Categorical Data Encoding: The categorical features such as protocol_type, service, and flag were encoded with LabelEncoder. A custom function was extended to handle unseen labels in the test set, ensuring a smooth transformation and preventing errors.
v. Attack Types: The dataset contains several forms of intrusion, such as DoS attacks, Trojan horses, ports scans, etc.
vi. Derivation of Additional Features: To optimize the model performance, 22 new features were developed as part of the enhanced model features. These features include:
• Connection Frequency: IPs involved in malicious scanning activities can be identified.
• Failed Login Attempts: Detects FF protocol and brute force attacks.
• Data Flow Ratios: This may indicate data exfiltration or flooding attacks.
• Session Anomalies: Identify abnormal activities occurring in network sessions.
These derived features enrich the model’s input and may improve the model’s ability to detect complex attacks.
vii. Feature Correlation: Fig. 4 shows a heatmap of correlations between raw features and the target variable. In feature selection, it helps to find out which features are closely related to the target [18].
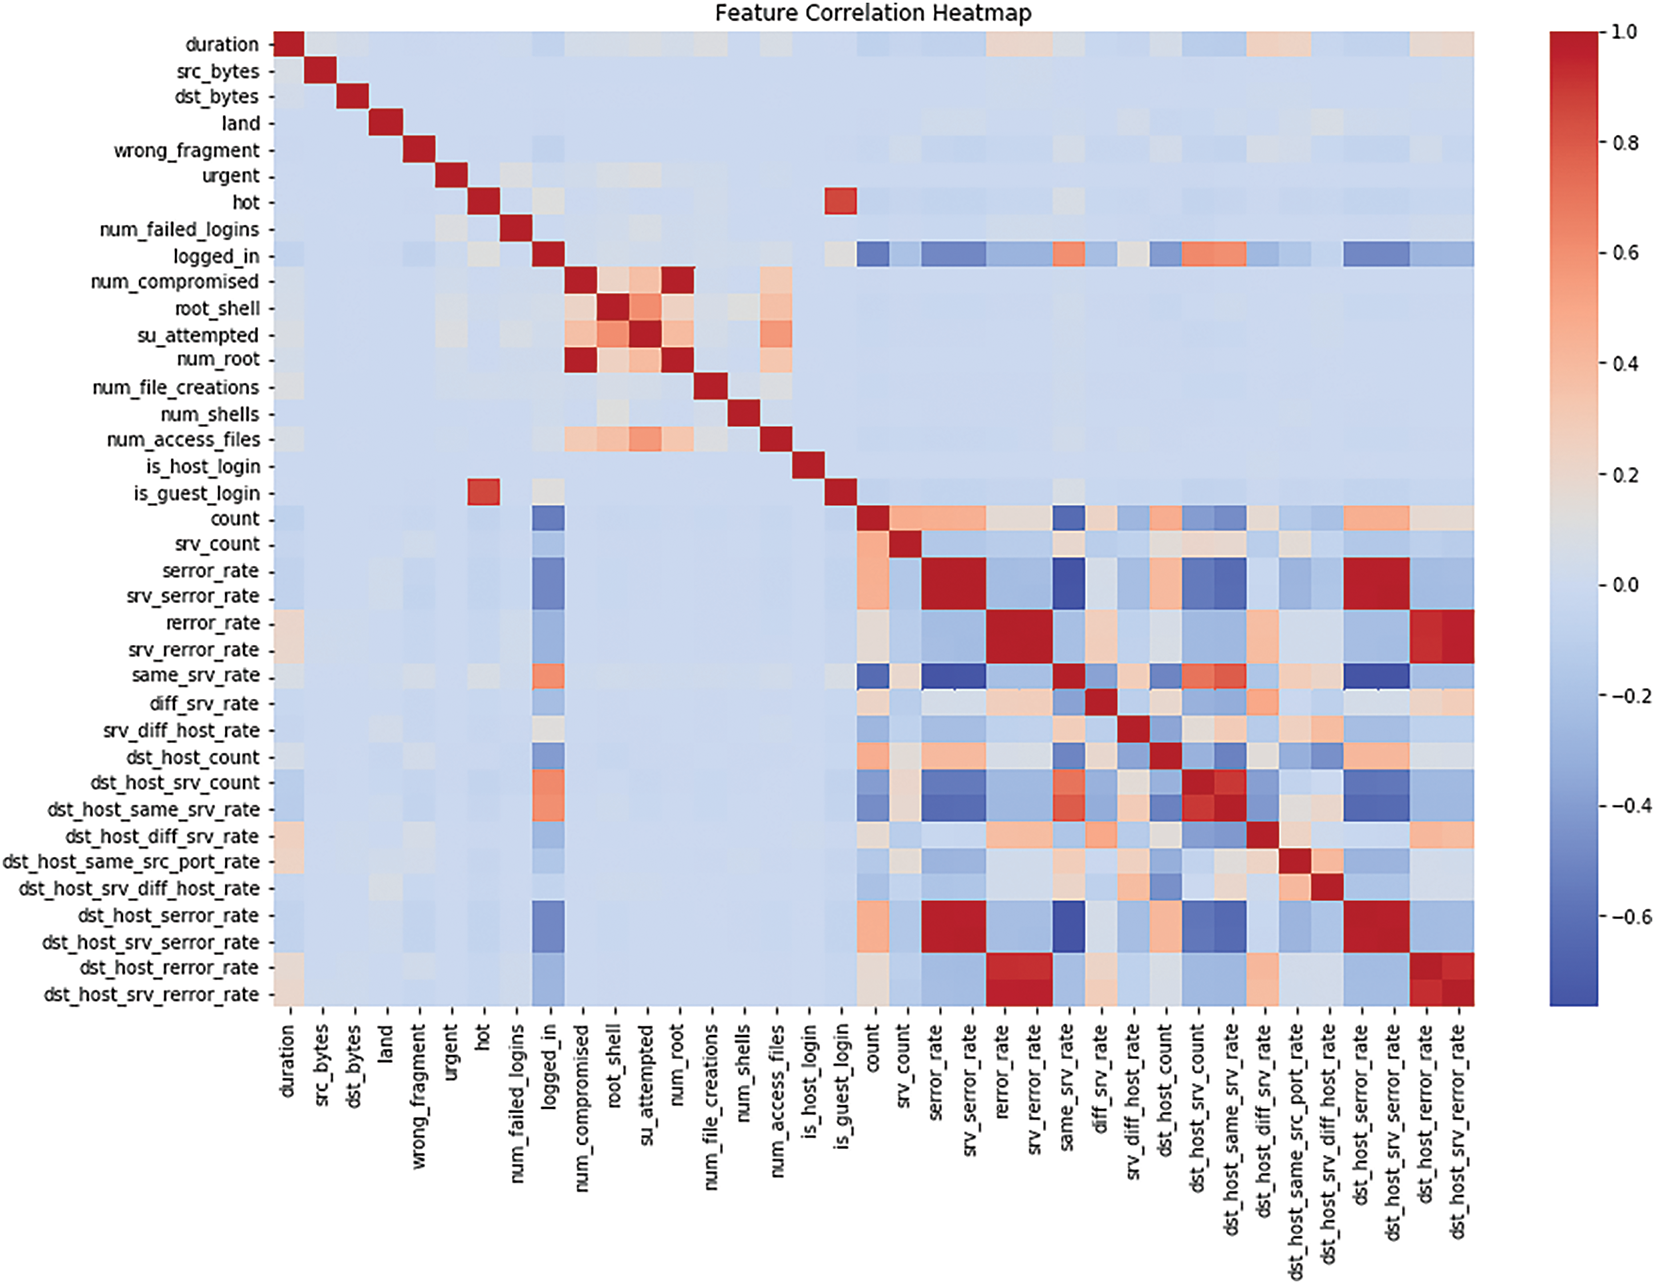
Figure 4: Correlation heatmap of features and target
High positive or negative values indicate that these features are better target predictors. In contrast, low values of the target signal can be eliminated to make a more effective model.
These preprocessing techniques make the dataset preprocessed, relevant, and prepared for building a good machine-learning model for intrusion detection.
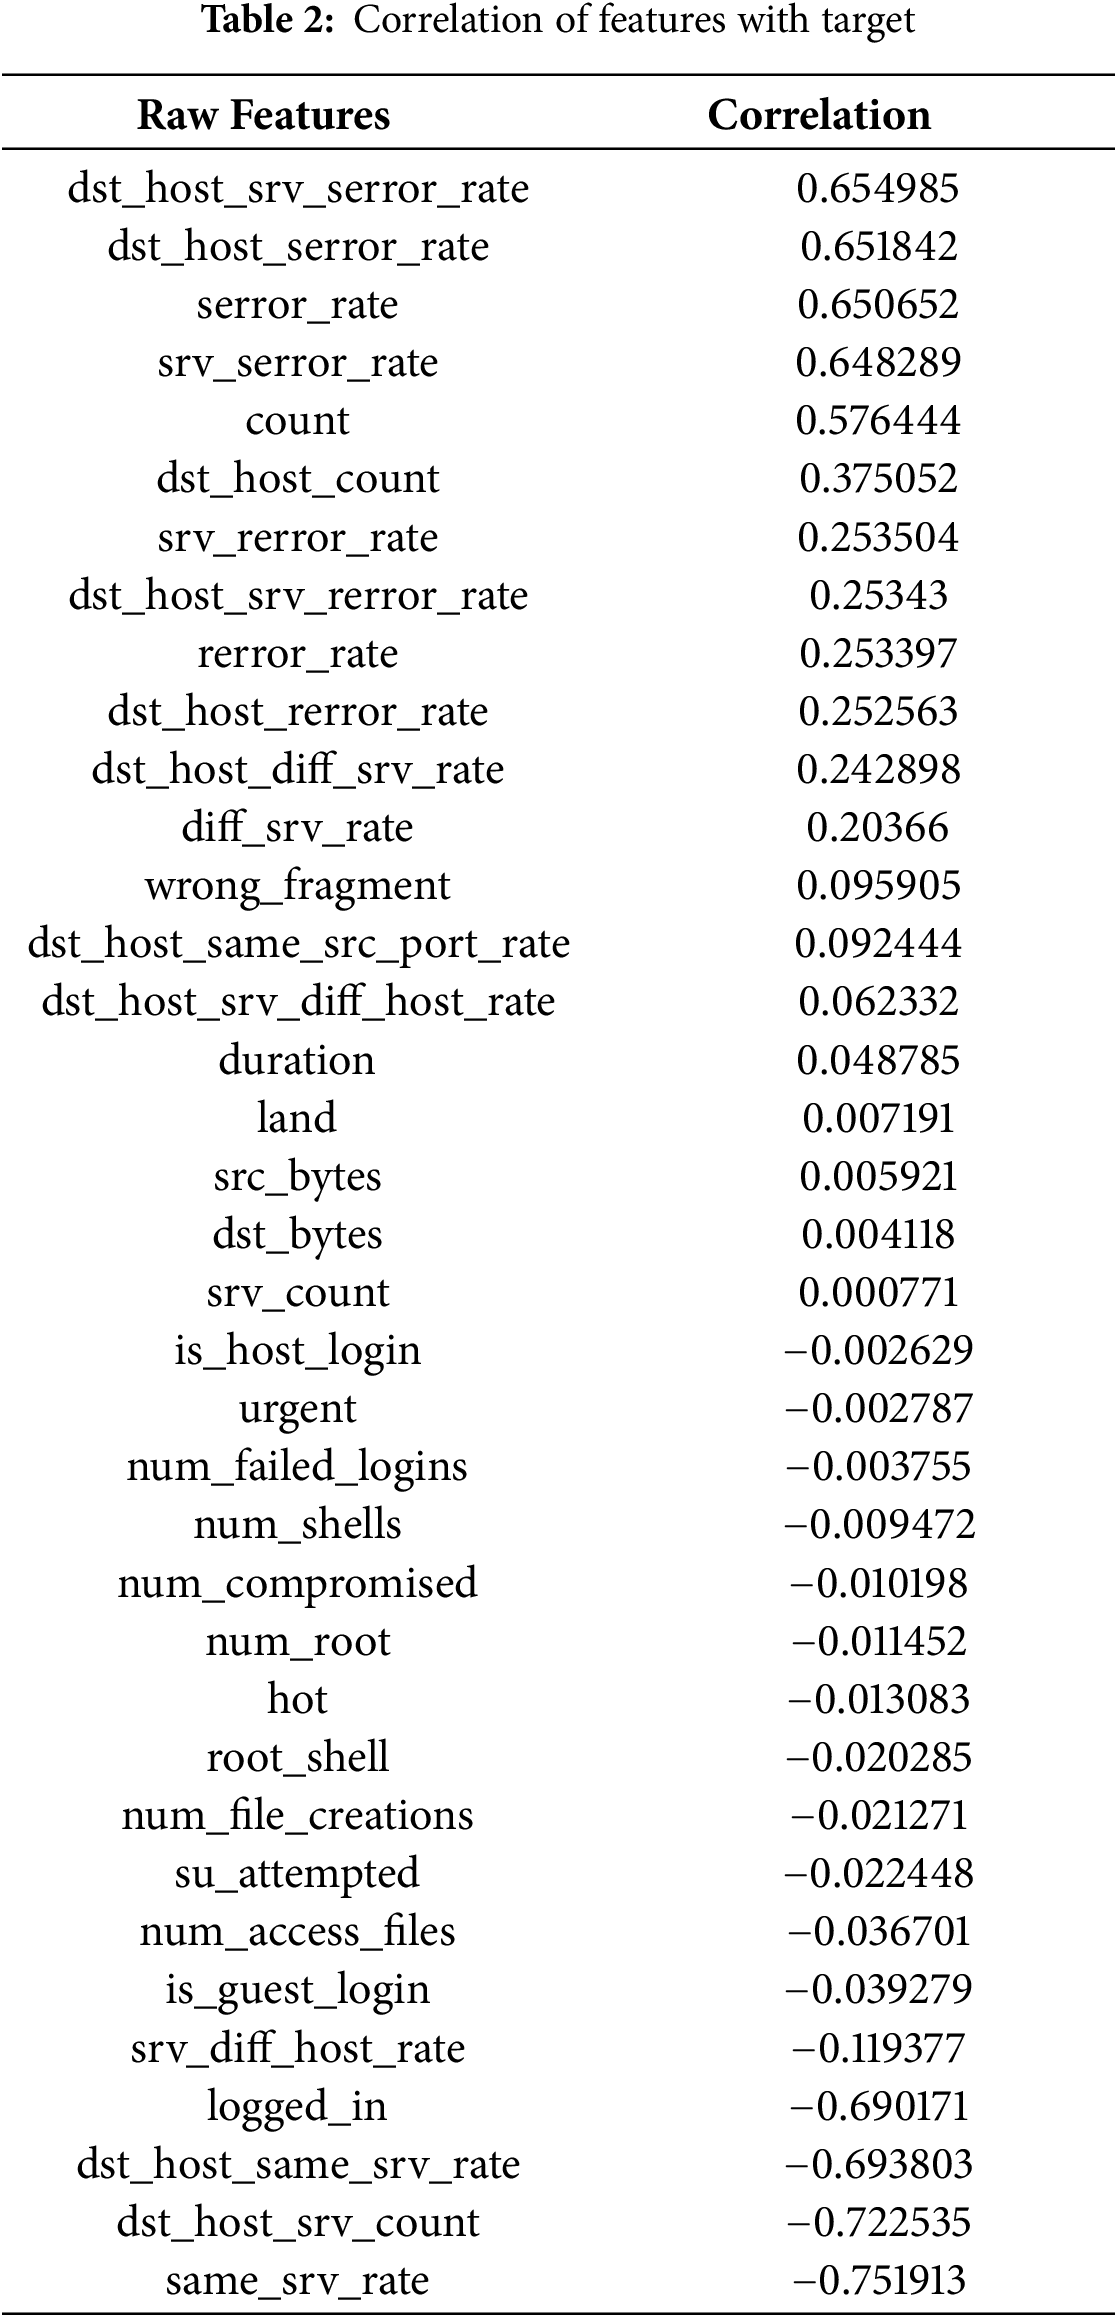
Table 2 presents the model of different characteristics in relation to the target variable. Therefore, the higher the positive values (for example, ‘dst_host_srv_serror_rate’ is 0.655), the stronger the relation with the target; the lower the negative value (for example, ‘logged_in’ is −0.690), the stronger the negative relation to the target [16]. It is observed that some of the parameters, including count, srv_serror_rate, and serror_rate, exhibit moderate positive levels of dependency on the target. In contrast, the parameters, namely num_access_files and is_guest_login, have small negative levels of dependency, meaning the weaker or negative nature of the required target.
A bivariate analysis of the highly correlated variables concerning the target is depicted in Fig. 5.
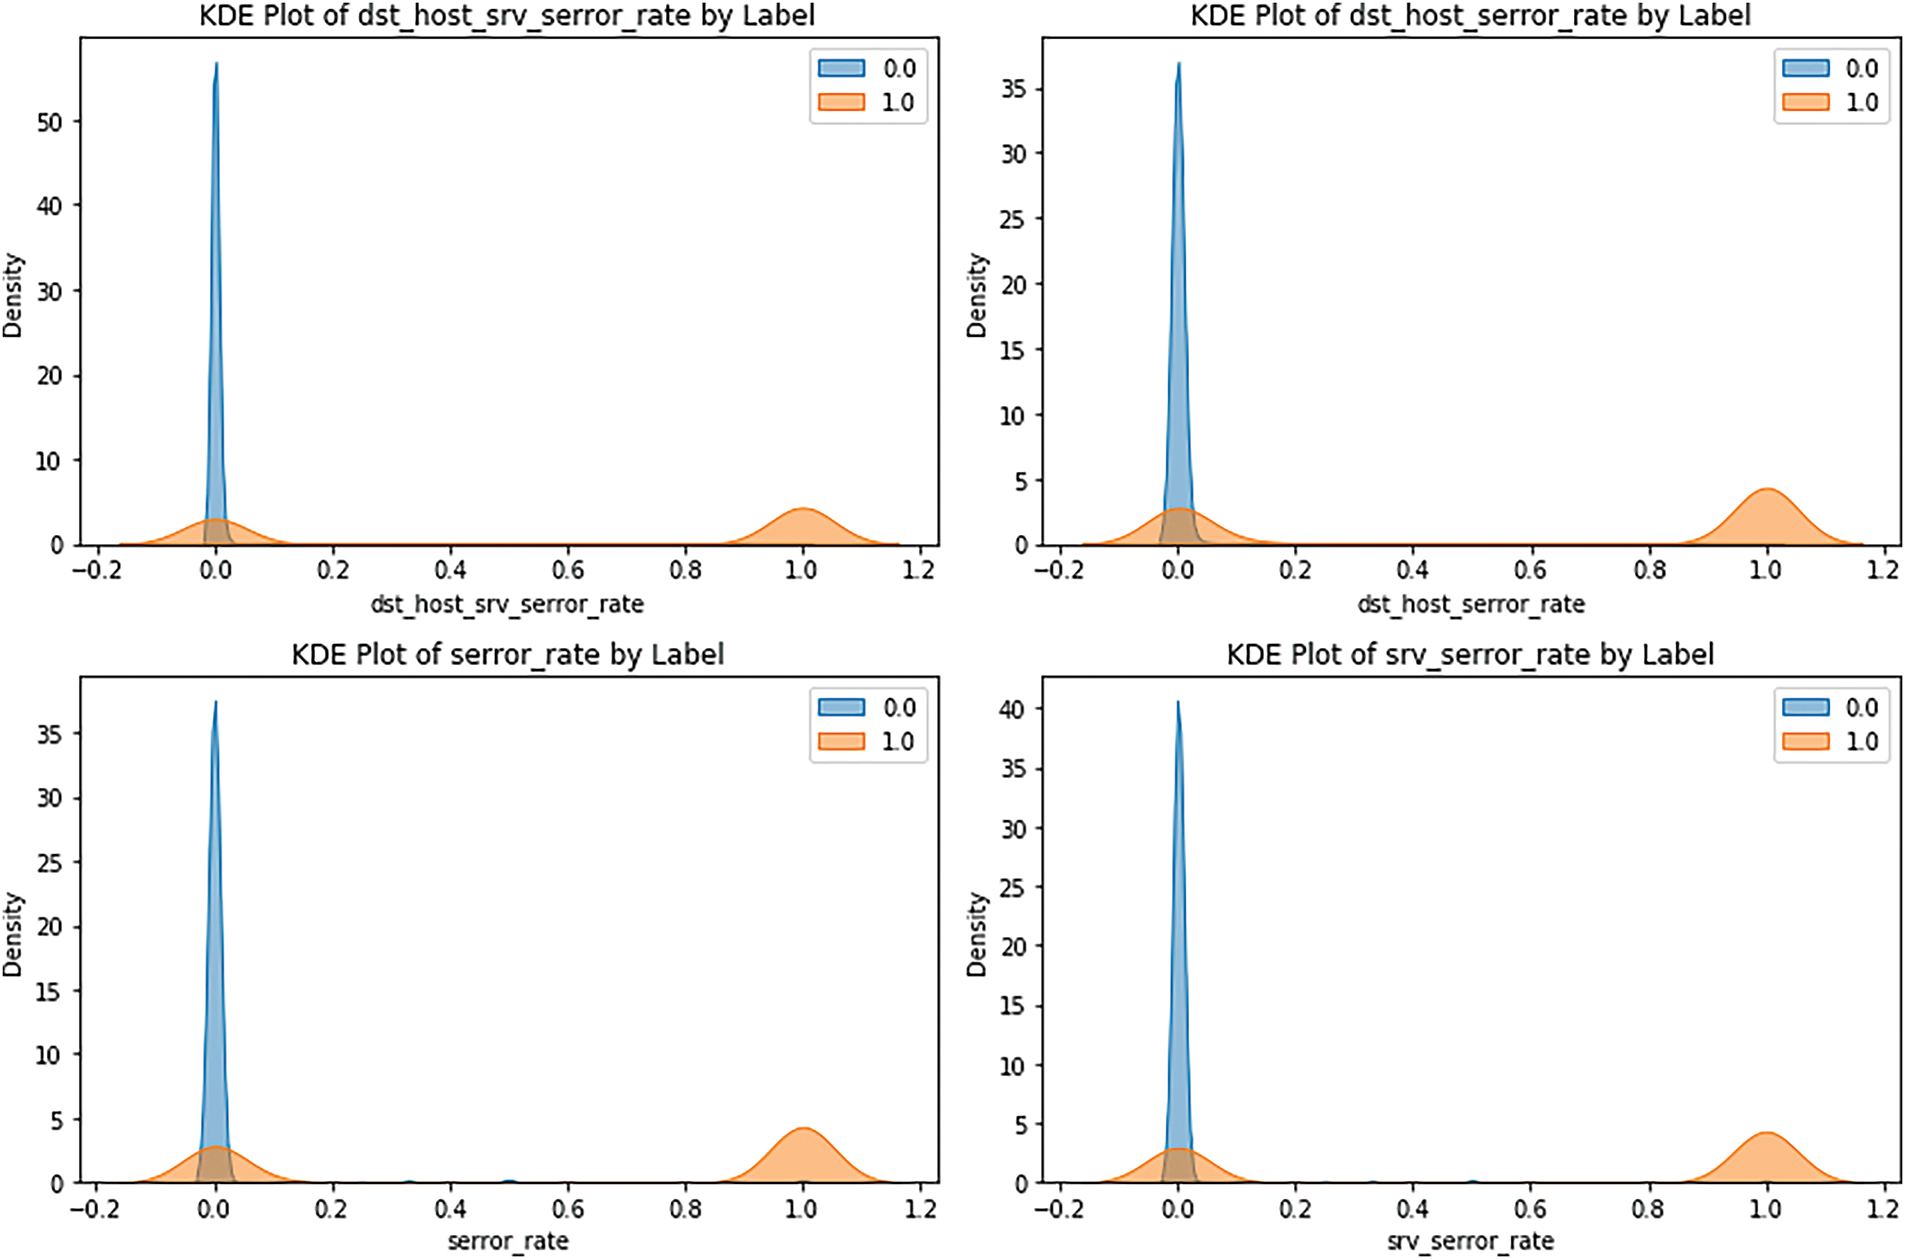
Figure 5: Density of target classes in highly positively correlated features
Fig. 5 represents the density of the pong value for non-intrusion (blue line) and two classes of intrusion attacks (orange line). The two probability density functions can be observed from the two diagrams; the blue one, which reflects non-intrusion values, is close to zero in contrast to the orange one, which looks like a filter with maxima of higher values, which indicates that intrusion occurrences may be associated with increased intensity or atypical activity, as it was mentioned above. These differences are important in showing the value of these variables when discriminating between the two labels. In Fig. 6 below, we have interpreted bivariate scatter plots for the highly negatively correlated features. For example, the ‘same_srv_rate’ variable demonstrates that non-intrusion values are placed higher. In contrast, the intrusion values are distributed with greater density in the lower values, indicating less abnormal activity during the intrusion. On the contrary, the ‘logged_in’ variable shows the opposite progress. The distinction between the curves starts at the necessary level for all three models. Still, the residual parallelism at lower Area Under Curve (AUC) values suggests that false positives/negatives are possible and that further work, such as scaling/normalization, may be required for optimal results.
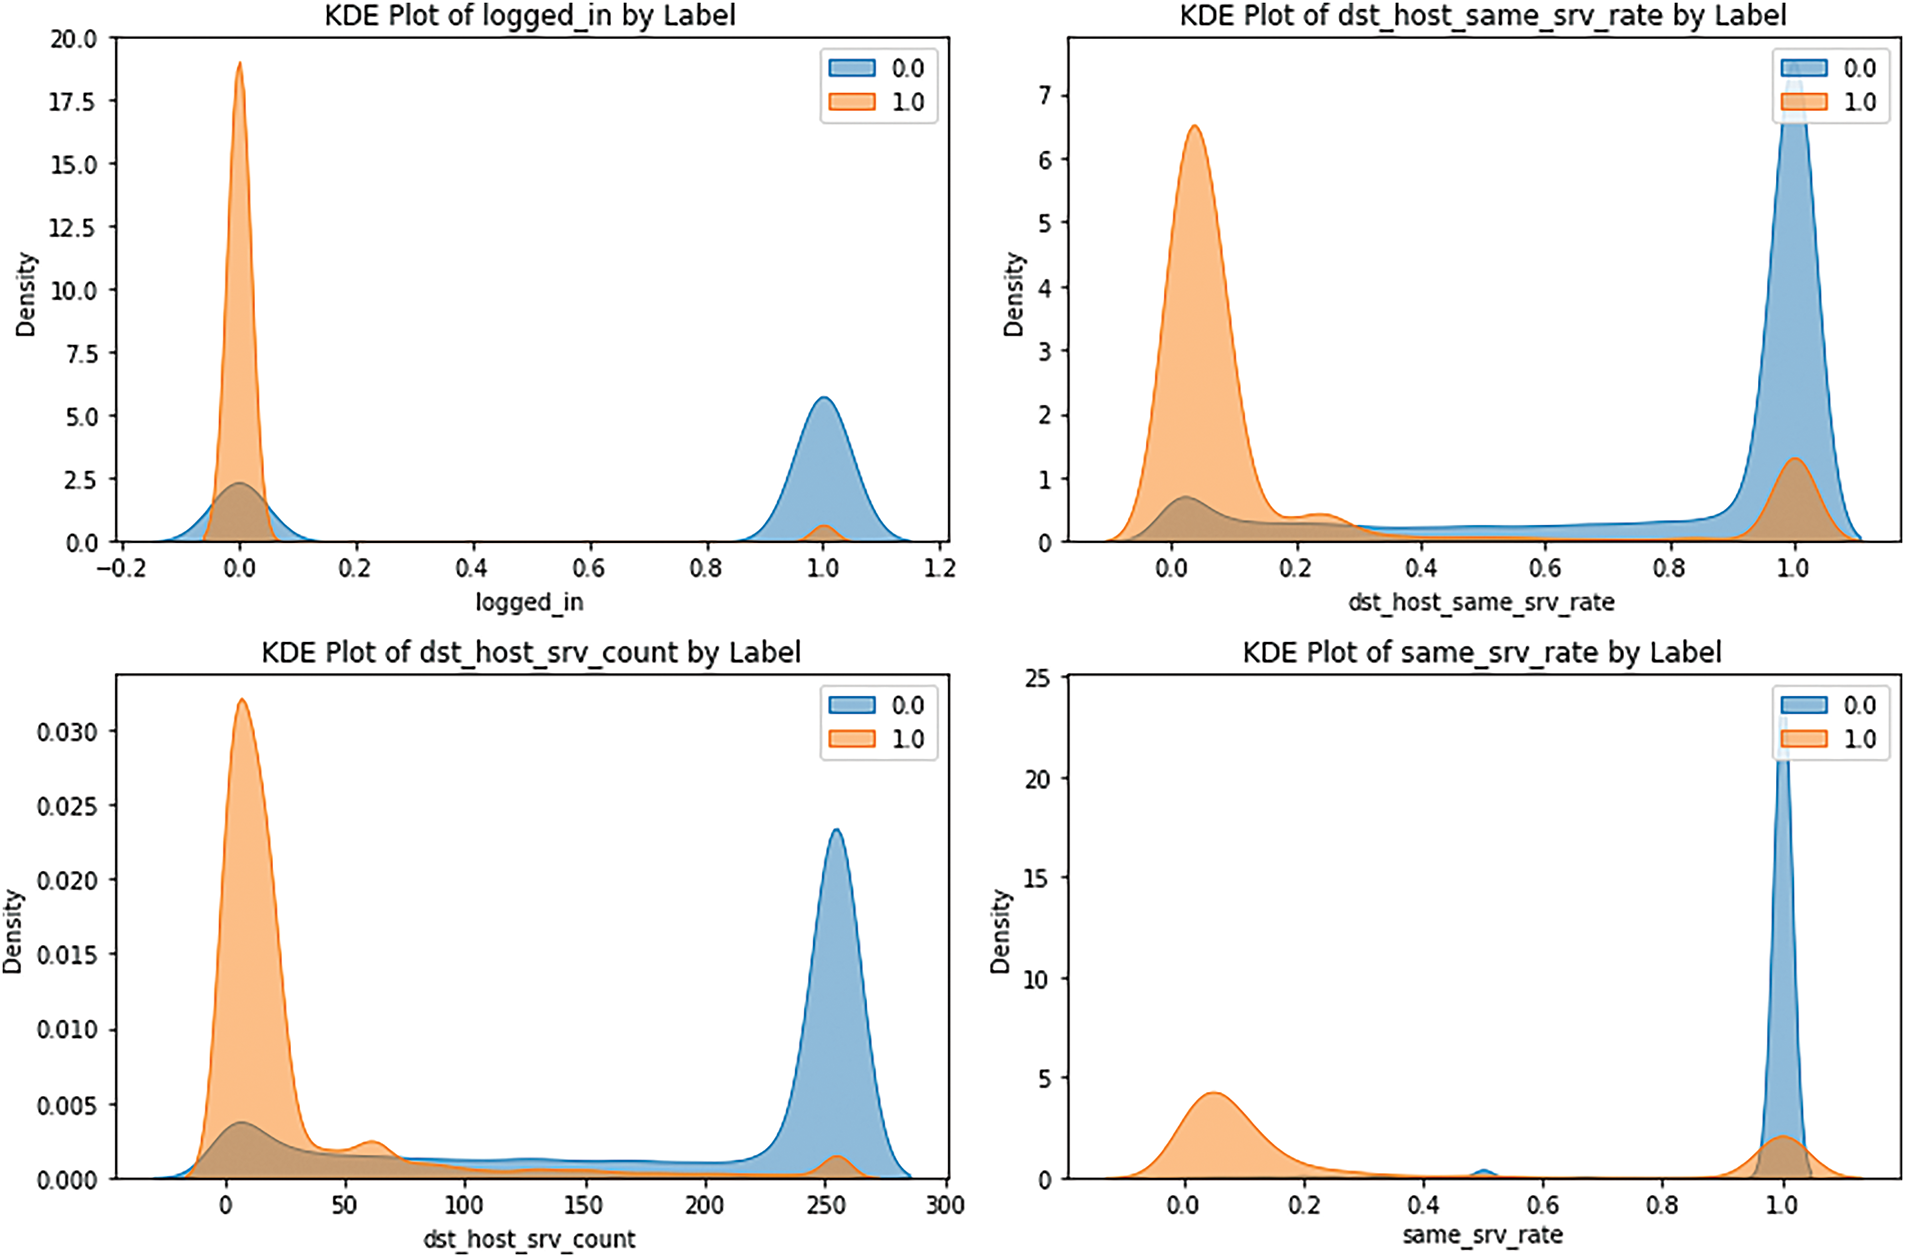
Figure 6: Density of target classes in highly negatively correlated features
viii. Scaling and Dimensionality Reduction: To bring the dataset into a format suitable for training and testing, it was first scaled using the Standard Scaler to achieve scalability. Standardization transforms each feature x to have a mean of 0 and a standard deviation of 1, as described by Eq. (1):
where μ is the mean and σ is the standard deviation of the feature, respectively. Principal component analysis (PCA) was conducted after standardizing the data to address the problem of multicollinearity. PCA can operate through eigenvectors, which rotate the data into an orthogonal basis of unit length and are ordered exclusively by their eigenvalues in terms of variance. The covariance matrix C for the standardized data X is calculated in Eq. (2):
Covariance matrices are calculated for the features, and eigenvalue decomposition is done on C to obtain eigenvalues λ as well as the eigenvectors V. Thus, only the top k components, moreover, only the top 23 components, were chosen because they occupy 90% of the variance. The original data is then projected onto the selected components, as shown in Eq. (3):
where W is the matrix of eigenvectors, since the sample items were obtained by grouping the objects, the k-means clustering algorithm was used to cluster the samples into 7 clusters for evaluating the silhouette score. These clusters were used to generate graphical features based on the graphs, similarly, where every sample is measured based on the distance from cluster centers, required for the input of the Graph Attention Layer in the case of DAMLAN.
3.3 Preliminary Insights from Initial Data
While analyzing the given dataset, namely, NSL-KDD, it was found that most attributes are organized systematically, and no missing values are present in this bucket. The target variable was also encoded into binary form to simplify the classification and separate normal traffic from intrusive activity. However, the main drawback of the used dataset is a class imbalance with a much larger case from the normal traffic. This was also observed in the training and testing sets, which may influence model performance by consistently predicting normal traffic. Categorical data were encoded, while new features like the connection frequency and number of failed logins were also created to augment model inputs and thus improve invasion recognition accuracy.
Further, when looking closer at the features and their correlations, it became possible to understand other features such as ‘dst_host_srv_serror_rate’ and ‘srv_serror_rate’ as positively correlated with the target that marked them as essential in the detection of intrusion activities. Meanwhile, some attributes like ‘logged_in’ and ‘dst_host_same_srv_rate’ portrayed a negative degree of connection to the target or a simply weaker one altogether. Using methods of bivariate analysis and density plots, we found that normal traffic and various types of attacks can be clearly distinguished based on the specific features available for this purpose. Normalizations and reductions by scaling and PCA prepared the data for training various models. It was also marked as a prelude to a more complex area of machine learning.
4 Methodology: DAMLAN Architecture
The DAMLAN is a novel deep learning architecture for anomaly detection in network traffic, specifically for sequential, temporal, and graph-based data. Several novel and progressive features, including dynamic attention, a multi-scale feature extractor, and graph-based attention modules, are employed to address the complexity of high-dimensional data. The objective of the DAMLAN architecture is to enhance anomaly detection in network traffic by leveraging multiple sources of information through layering.
The following are the components of DAMLAN architecture, and it is illustrated in Fig. 7 below:
i. Sequential Input Layer
The Sequential Input Layer is the first subcomponent of DAMLAN, which can handle time series or sequential data, such as varying network traffic over a given time period. The input sequence is flattened or reshaped, the output sequence is normalized, and the form is augmented by applying Gaussian noise. Fluctuations in traffic are generally small, but to achieve a broader generalization of the model, regularization must address this problem to provide valuable results to the driver. This input layer supplies the framework that absorbs temporal relations into the network traffic data.
ii. GRU Layer for Temporal Representation
The GRU Layer (Gated Recurrent Unit) extracts temporal dependencies from the noisy input data. GRU is one of the RNNs that helps model sequential data using an efficient form of gating. The layer consists of two gates: the reset gate and the update gate, which provide control over the passage of information through the network. In DAMLAN, the GRU layer is of size 200, allowing the model to efficiently maintain long-term dependencies, although not as efficiently as LSTM. In Fig. 8, GRU layer takes in an input sequence, captures relevant temporal patterns, and produces temporal features. The model employs a dropout of 10% to fight overfitting, while layer normalization stabilizes the training process by normalizing activation in the layer. Global Average Pooling is then applied to reduce the dimensionality of the sequential output of the LSTM units to a fixed dimension, capturing temporal features by averaging the cross-temporal depictions of an attack signature.
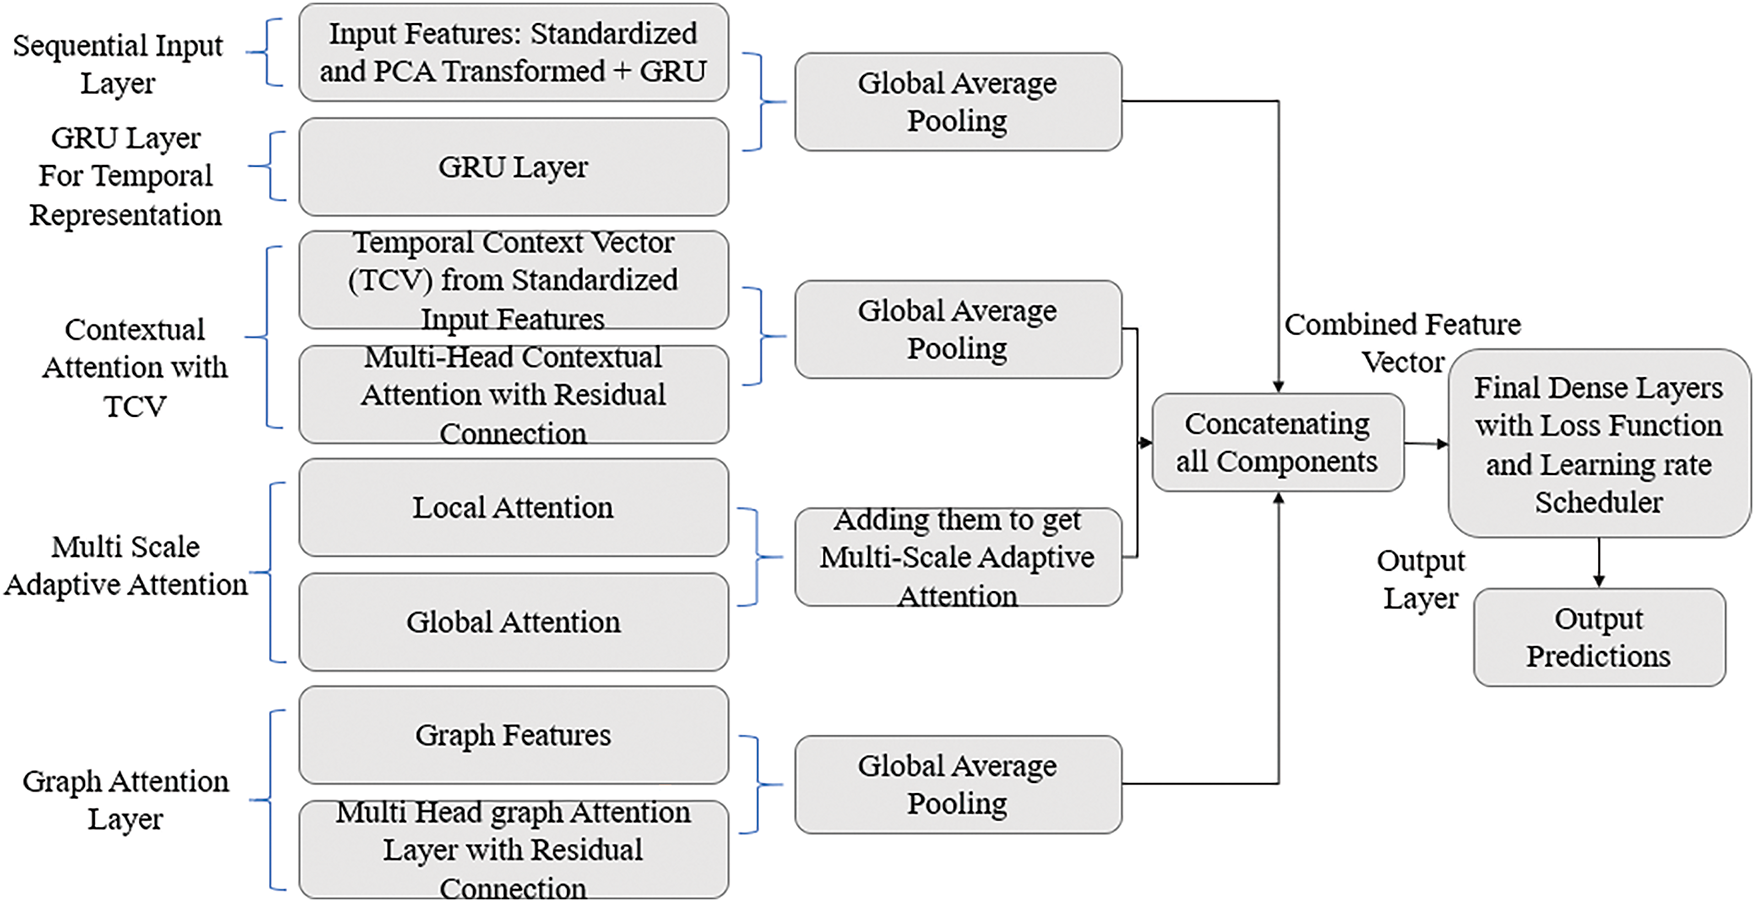
Figure 7: Architecture diagram
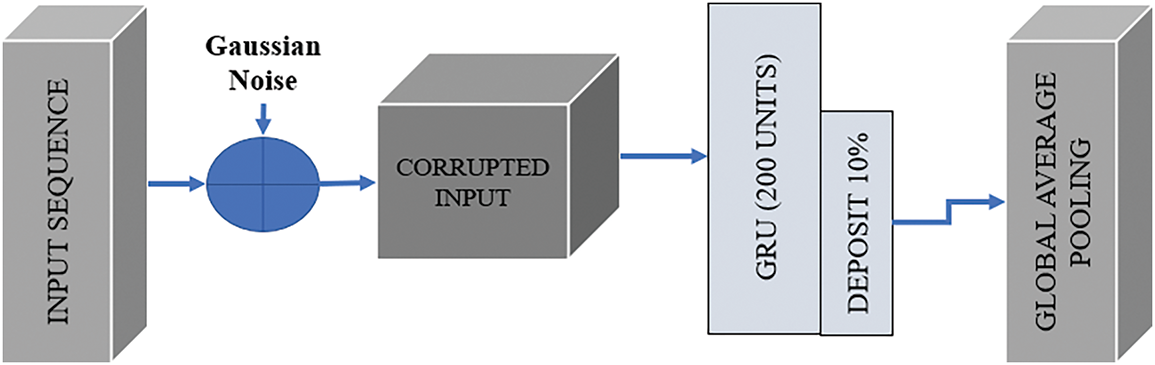
Figure 8: GRU for temporal features
iii. Contextual Attention with Temporal Context Vector (TCV)
The Contextual Attention mechanism with Temporal Context Vector (TCV) implements its high-level contextual relationships in the input data. The TCV is an analog of the features obtained from the input data, which provides an aggregate description of the input patterns and their relationships. The TCV is obtained through dimensionality reduction and statistical pattern recognition through a dense layer with 100 units of hidden layers to kernel L2 regularizer with Leaky ReLU activation. Then, from the output normalization process, the scalar weights of the features are normalized using the Softmax function.
The TCV is then passed through a Multi-Head Attention layer, allowing the model to attend to different parts of the temporal data by learning multiple attention subspaces. The Multi-Head Attention mechanism performs scaled dot-product attention, as shown in Eq. (4):
here, Q, K, and V represent the Query, Key, and Value matrices derived from the TCV. dk is the dimensionality of the key vectors. The attention scores are calculated by determining the similarity between the Query and Key vectors. These scores define which features the model investigates most closely, improving the temporal pattern representation in the network traffic. As mentioned, this is calculated using Eq. (5), the multi-head attention, and the same is shown in Fig. 9.
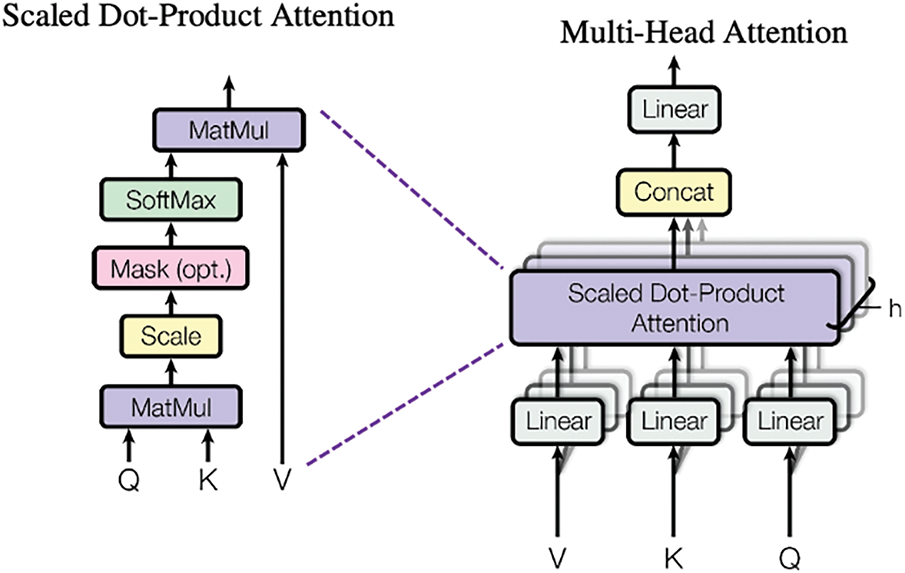
Figure 9: Multi-head attention mechanism
The head is the output from the ith attention head, and W0 is a trainable linear transformation that combines all heads.
The output is then added to the input and passed through a ‘residual’ connection and layer norm mechanism to preserve some of the input’s original signals.
iv. Multi-Scale Adaptive Attention
The Multi-Scale Adaptive Attention mechanism is designed to capture temporal dependencies at fine-grained and coarse levels. Specific attention is paid to short-term activity within a prespecified interval of time, while global attention considers relationships that exist during the whole time span of the sequence. When both of these attention scales are incorporated into the model, the model can effectively gather detailed and highly contextual information.
Local attention is computed using a Leaky ReLU activation function, as shown in Eq. (6):
here, Wl is the weight matrix for the local attention, bl is the bias term, and TCVl is the input Temporal Context Vector for local attention. Similarly, global attention is computed using a separate dense layer and Leaky ReLU activation function, as shown in Eq. (7):
where Wg is the weight matrix for the local attention, big is the bias term, and TCVg is the input Temporal Context Vector for global attention. Further, the outputs from local and international attention are added to create a multi-scale attention vector, as shown in Eq. (8).
This combined vector captures short-term fluctuations and long-term trends in network traffic, making it highly adaptable to the data’s nature.
v. Graph Attention Layer
DAMLAN also employs a Graph Attention Layer, which takes feature graphs and learns the relations between nodes using Graph Attention Networks (GAT). GAT augments the original Graph Neural Networks (GNN), where the dynamic mechanism for aggregating features from neighboring nodes is based on self-attention. This layer takes a feature graph as input, assigning features to each node and edges defining the relationships between nodes.
Each node learns attention weights based on the similarity between its feature vector and the feature vectors of its neighbors, as described by Eq. (9):
where hi and hj represent the feature vectors of nodes i and j, Wh is a trainable weight matrix that projects the node features, and dk is the dimensionality of the key vectors. The GAT mechanism enables the model to weigh different neighbors differently, allowing for a more flexible and adaptive aggregation of node features.
Multi-head attention is employed to capture multiple relations between nodes at layers of GAT. It also incorporates Dropout (40%) to prevent overlearning of graph features and Residual Connections to preserve the graph’s original form. The output features are then aggregated through Global Average Pooling to obtain a fixed dimensionality, which enables the model to capture the graph’s high-level relationships.
Fig. 10 illustrates how graph features are generated using K-means clustering, and Fig. 11 displays the structure of the Graph Attention Layer.
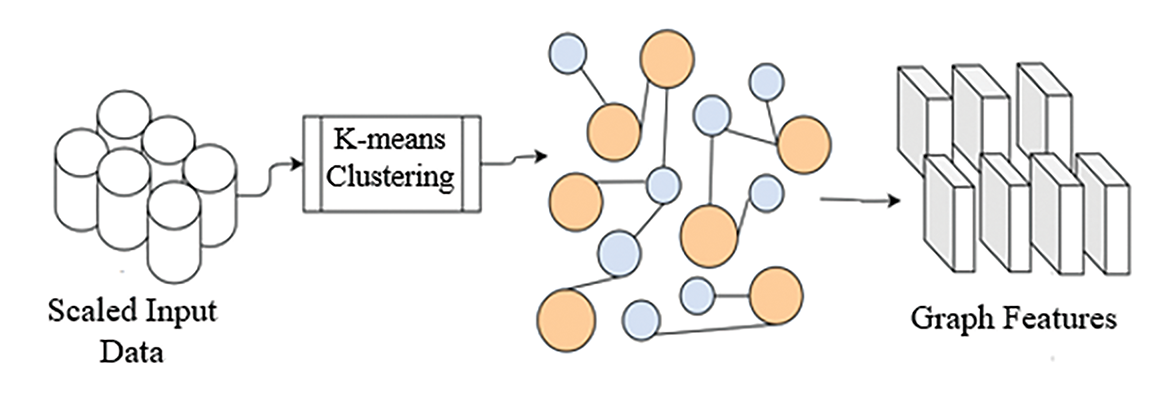
Figure 10: Graph features from K-means clustering
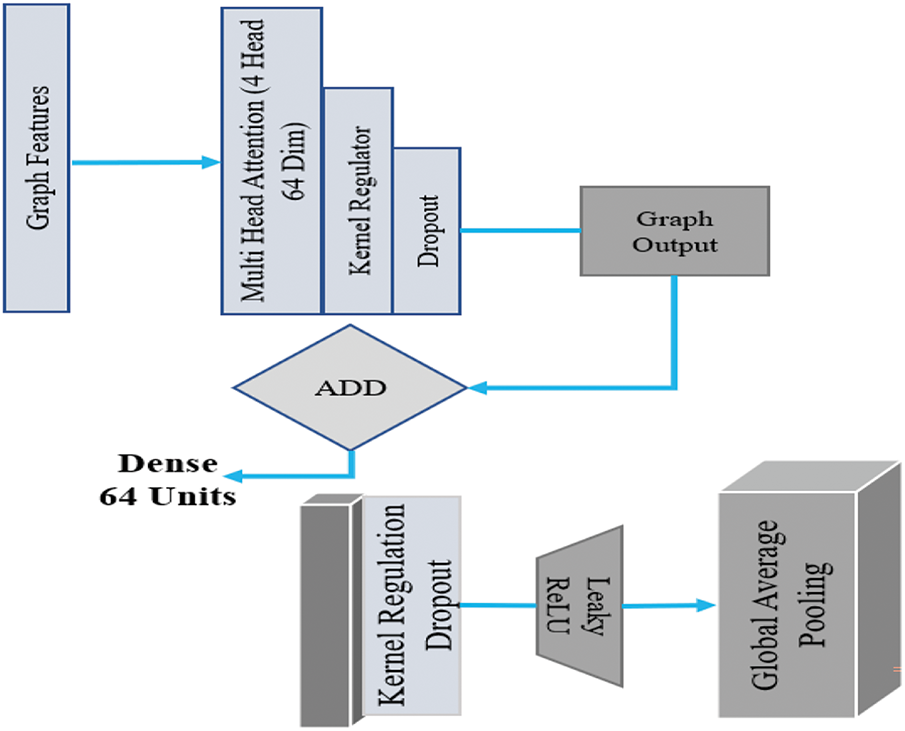
Figure 11: Graph attention layer
By using a graph-based representation, DAMLAN leverages the relationship between non-Euclidean data that traditional feature extraction methods may overlook. In training and in inference, the data is represented as a graph G = (V, E) where each mini batch (i.e., the set of data for feeding to the model) consists of a representation of nodes V in this graph as individual instances of data (e.g., network flowsßenets, or events). The edges E connecting nodes refer to their interconnections. Preprocessed feature vectors, elements of Rd, undergo standardization, PCA transformation, and biometric feature integration for each node feature. For each batch, a dynamically reconstructed graph structure is used to track the changing input structure and capture the data pattern.
To create edges, unsupervised clustering algorithms, such as K-Means or DBSCAN, are applied to group together similar samples using Euclidean distance or cosine similarity in the latent space. If they are in same cluster and satisfy the similarity condition, there will be an edge between nodes
In building a formal graph formation for the Deep Adaptive Multi-Layered Attention Network (DAMLAN), which is an intrusion detection network, the graph is constructed by first defining the nodes and edges from network data features. This consists of each node being a cluster center based on K-means in the raw feature space, which represents the shared features across the samples of data. On the other hand, relationships between cluster centers in the graph define the edges, which are the cluster centers’ edges in the graph, and of these may represent similarity or distance between nodes in the feature space. Specifically, the Euclidean distance is a commonly used distance metric for this construction and permits the model to understand how close together sets of data points or clusters are in high-dimensional space. The connectivity between nodes in a limited vicinity defines this metric, which activates edge formation by linking nodes that form an output structure, important for denoting the distribution of network traffic data.
Since the graph structure changes as input features evolve, for instance, with changes in network patterns or dataset characteristics, the graph is dynamically changing. For example, K-means clustering produces different cluster centers, or cluster points shifted to different clusters depending on the distribution of the features. In that case, the nodes in the graph are redefined, as well as the way edges between them (i.e., the interconnections of the nodes) are updated, taking into account calculated distances. This ensures that the graph remains aligned with the current state of the network, facilitating the accurate identification of intrusions in real-time or dynamic scenarios.
In this case, the Graph Attention Layer of DAMLAN processes the feature graph by assigning attention weights to each edge. The scaled dot product is used by the attention mechanism to compare the similarity of node feature vectors to each other. These weights enable the model to strengthen connections that are more informative or relevant and aggregate information from its neighbors. Consequently, multi-head attention further enhances this by capturing multiple types of interactions simultaneously. During training, dropping nodes on one another is applied to preserve generalization, and residual connections retain their original graph structure. Global Average Pooling finally pools the node features into a fixed-size representation that encodes the graph’s global information for the upcoming detections. For effective intrusion detection on network data with complex relationships, this graph-based approach enables DAMLAN to model intricate relationships within network data.
vi. Combined Feature Vector
The last element in architectural planning is the combined feature vector. The LSTM, GAT, and Multi-Scale Adaptive Attention layers produce an output that is concatenated to create a single feature vector, which is then passed through several dense layers. These thick layers provide additional feature space derived from the concatenated features, utilizing Leaky ReLU activation and the L2 kernel to mitigate overfitting. We also feed only 50% of the data to the model during training to eliminate overfitting by implementing a 50% Dropout rate.
Including this feature vector, which incorporates information from different sources, such as sequential data, temporal context, and graph structure, improves the representation of the input data. This integration enables significantly higher accuracy when comparing and identifying anomalies in large volumes of text information. The combined feature vector and the output layer are represented in Fig. 12.
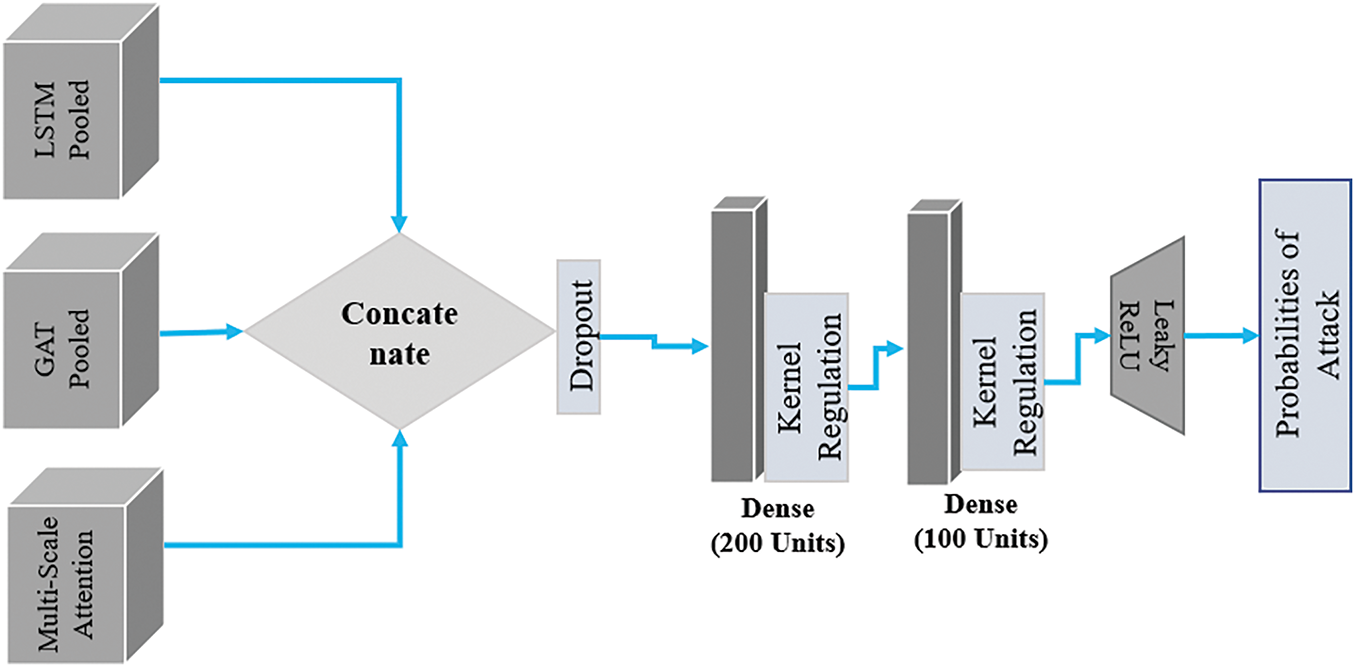
Figure 12: Combined feature vector and output layer
vii. Output Layer
The Output Layer’s last layer accepts the feature vector as input and performs binary classification using a sigmoid activation function. The sigmoid layer finally scales the prediction to the probability of whether an anomaly exists in the traffic stream.
The model’s performance is evaluated using Binary Cross-Entropy (BCE) loss, as defined in Eq. (10):
where N is the total number of samples,
where
For training and evaluation of the model, the system was based on an Intel Core i7-11700 CPU (8 cores, 2.50 GHz), 16 GB of RAM in the CPU without GPU acceleration. What Software and Libraries did I use? Python, Tensorflow, scikit learn, NumPy, pandas, matplotlib, and for data visualization, we have used seaborn. For historical graph analysis, NetworkX was used, and reproducibility was achieved by setting the seed using numpy.random.seed() and tensorflow.random.set_seed(). Furthermore, we used the Adam optimizer with the following settings: learning rate of 0.0005, β1 = 0.9, β2 = 0.999, and epsilon = 1E−07. The loss function used was binary cross-entropy, and the class weight was applied to address the class imbalance. The model was trained with 64 samples per batch over 50 epochs with a dropout rate of 0.3 placed on both the GRU and attention layer to prevent overfitting. We used early stopping on the validation loss since patience was set to 5 epochs. To achieve NumPy, TensorFlow, and Python’s random module consistent and reproducible results, the random seeds were globally set for all the Random objects in the NumPy, TensorFlow, and Python’s random module.
viii. Handling Class Imbalance
Intrusion is inherently imbalanced: a class contains significantly fewer instances and is highly specialized and complex to detect a specific type of attack. To address this issue, we propose utilizing class weights during DAMLAN training. The loss function is adjusted to give more importance to minority classes, as shown in Eq. (12):
where N is the total number of samples,
where
ix. Model Training and Evaluation
DAMLAN uses Binary Cross-Entropy Loss, which is optimized through the Adam optimizer. The accuracy rate is utilized for model assessment, and early stopping is incorporated to mitigate potential overtraining. The loss curves are presented in Fig. 13. The more iterations, the more stable the model’s learning behavior, which is characterized by a decrease and convergence on both the training and validation loss.
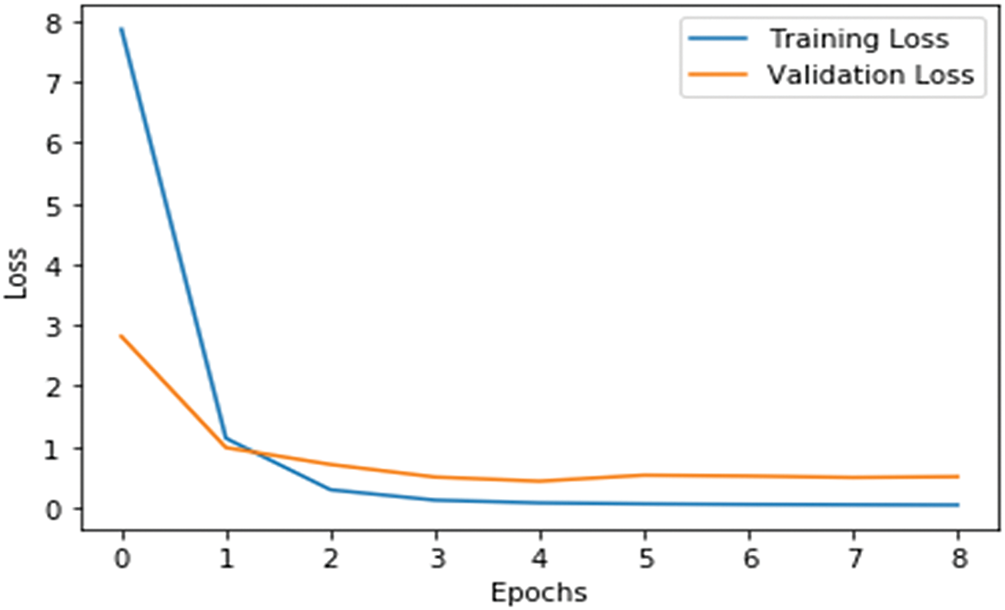
Figure 13: Loss curves
Therefore, DAMLAN uses various sophisticated approaches, such as GRU, attention mechanisms, and graph attention, to identify different anomalies in traffic. The model is developed for ample feature space, which provides immunity to noise and imbalance between classes.
4.1 Core Contribution of Our Model
The proposed DAMLAN for implementing intrusion detection in network data comes up with some new key contributions that positively impact the detection and prevention of security threats. Below are the core contributions of the DAMLAN model:
• Adaptive Attention Mechanism: DAMLAN employs an adaptive multilayer attention scheme, where various features in the network traffic data are assigned varying levels of importance. This helps provide an improved method of identifying the right patterns essential for intrusion detection and overall detection.
• Deep Learning-Based Feature Representation: Compared to conventional models, the deep learning techniques employed in the proposed model can learn feature representations without requiring explicit feature engineering on network data, enabling the model to identify various patterns related to intrusions.
• Multi-Layer Architecture: DAMLAN’s work is based on a multi-layer system architecture that reflects network traffic’s low- and high-level features. This layered approach helps distinguish between normal and malicious traffic, thereby increasing the detection rate.
• Scalability and Efficiency: Scalability is also considered in the design of DAMLAN, which allows for efficient processing of large amounts of information from network traffic. The speed of the proposed approach is resolved by optimized attention layers, which help to focus on the valuable information needed for real-time intrusion detection.
• Robustness to Various Attack Types: The model is resilient to a range of cyber threats, from basic ones like DoS and DDoS to more complex ones, because of the holistic understanding of network traffic that the system adopts. This versatility ensures the model is suitable for implementation in real-world environments with various threats.
DAMLAN is unique because it can easily incorporate network traffic patterns, making it a valuable tool for boosting the functionality of an ID system.
4.2 Computational Complexity and Efficiency Analysis of DAMLAN
DAMLAN (Deep Adaptive Multi-Layer Attention Network on Network Data for Intrusion Detection Model) is a master deep learning architecture designed to detect anomalies in network traffic. Although having a layered structure and hybrid attention mechanisms provides significant boosts in accuracy and robustness, the model’s computational complexity must be analyzed to determine if it is feasible for use in real-time environments. The computational budget is composed sequentially of layers (GRU), multiple attention buildings, and, in a complementary manner, graph-rooted learning concepts.
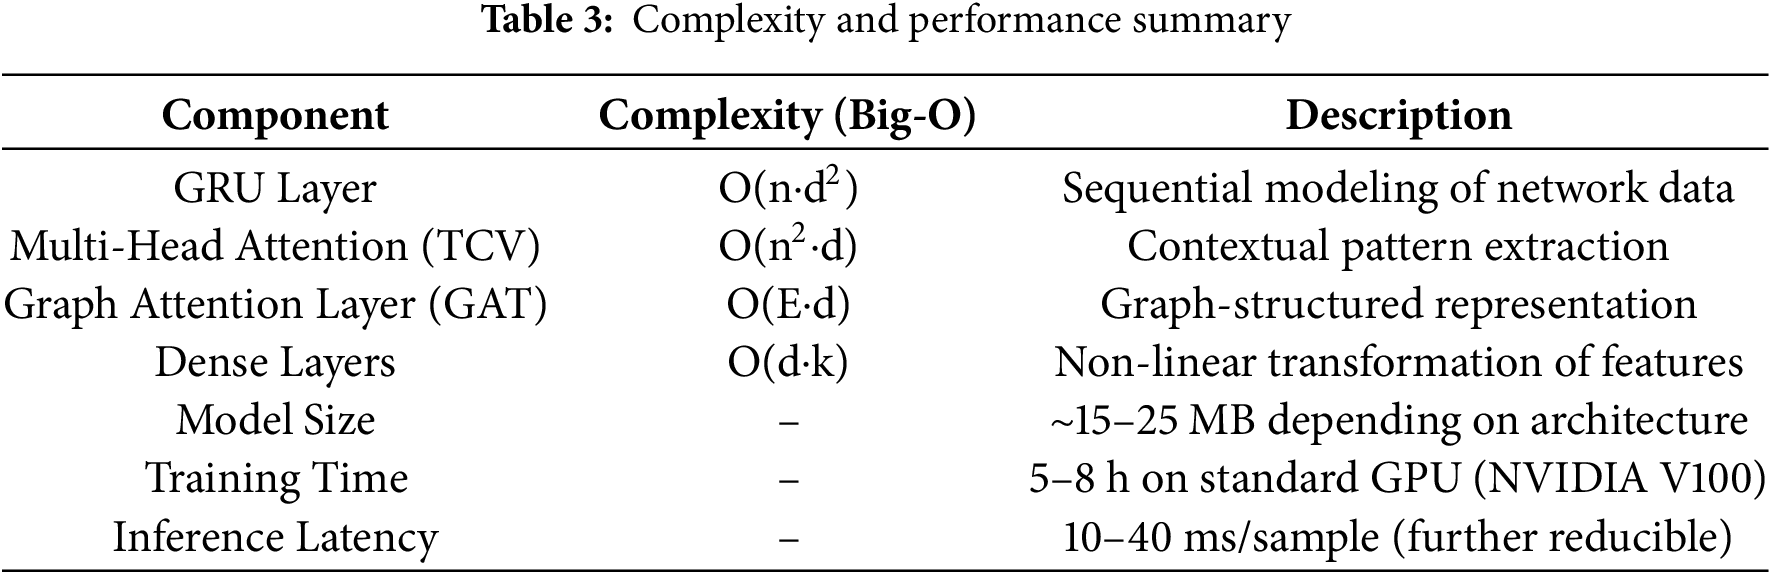
The complexity of the GRU layer, which processes sequential data, is O(n·d2) per time step, where n represents the sequence length and d represents the hidden dimension (200 in DAMLAN). GRU is a computationally more convenient choice than LSTM for maintaining temporal representations, and hence, it is more computationally efficient than LSTM. One way to build the multi-head attention mechanism in both contextual and graph settings is via QKTV operations, with a complexity of O(n2·d) per layer, because the dot product is performed pairwise. And when run for h heads, this becomes O(h·n2·d/h) = O(n2·d), which shows that attention is a bottleneck for long sequences. In DAMLAN, attention is applied to moderate-length sequences and graph segments to minimize this cost.
The Graph Attention Layer (GAT) has an additional complexity of O(E·d), where E is the number of edges in the graph. It is acceptable for a sparsely connected network, such as real-time traffic, but the cost is linear in the graph density. For example, the local and global attention are fused using a multi-scale attention fusion that incurs an overhead of O(d) for vector summation. In addition, moderate computational load is provided by dense layers that go after the concatenation of features, each operating at O(d·k), where k is the number of units.
Training Time, Model Size, and Inference Latency
In particular, the model size of DAMLAN is primarily determined by the number of units in the GRU, the number of attention heads, and the number of dense layers. The model size ranges from 15 to 25 MB, while it is equipped with 200 GRU units, multiple dense layers of 100–200 units each, and 4–8 heads in a multi-head attention layer.
Convergence training of DAMLAN on standard intrusion detection datasets (such as NSL-KDD) takes 5–8 h on a single NVIDIA V100 GPU. It includes a Binary Cross-Entropy Loss Function with weights to reduce data imbalance in use, and a learning rate scheduler with the Adam optimizer to accelerate convergence. Early stopping is used to kill off overfitting.
Near real-time detection requires short inference time. Based on the deployment environment, batch size, and average latency per sample inference, we obtain 10–40 ms. This suggests DAMLAN can be used in real-time applications in edge and cloud environments with optimized GPU execution or model quantization (e.g., using TensorRT). Table 3 below summarizes computational complexity and performance.
Besides its detection ability, the architecture is also optimized in computational effectiveness. DAMLAN applies GRUs to sequence learning (rather than LSTMs or Transformers), enabling speedier and smaller training requirements and memory loads without losing the ability to model sequence data. Its functionality is based on K-means clustering to obtain graph-like properties without the computational costs of performing end-to-end graph neural networks (GNNs), while retaining topological information. Multi-stage attention mechanisms are modular and lightweight, meaning fast inference through CPU-based systems. All the training processes lasted less than 30 min on the CPU (Intel i7, 32 GB memory). The time required to run an inference on each sample was less than 10 ms, which is compatible with near real-time supported applications. Table 4 below shows the hardware parameters.
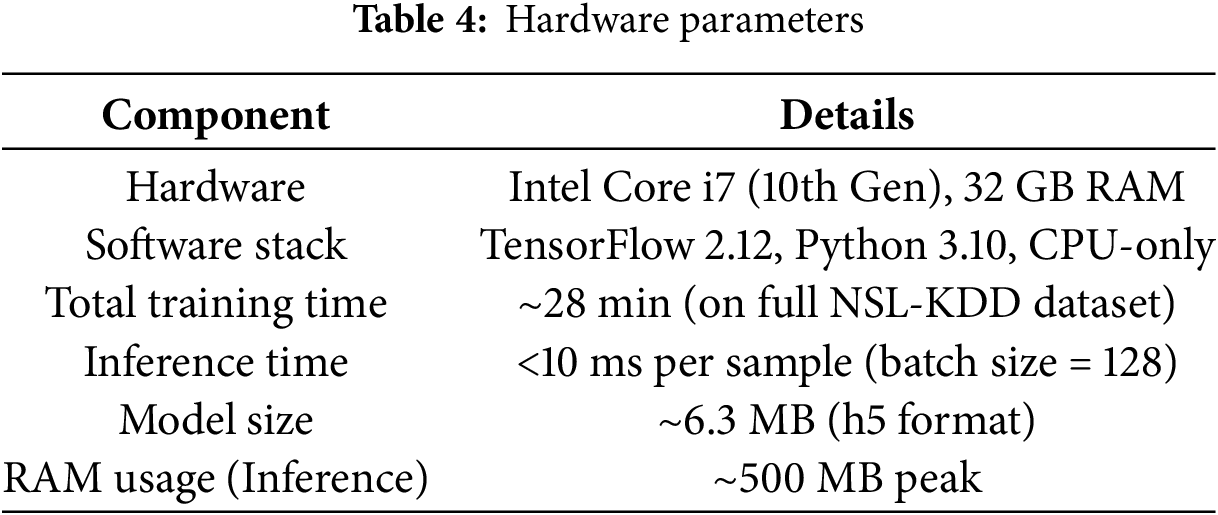
Further, with an inference time of <10 ms per sample, DAMLAN is capable of real-time detection suitable for those environments that demand immediate action, like industrial control systems, edge IoT use, or cloud-based monitoring. Its small memory footprint (500 MB at inference time) and compact model size (~6.3 MB) enable the model to run on CPU-only systems without requiring a GPU.
We conclude that DAMLAN offers expressive power while remaining computationally feasible. It achieves robustness and accuracy simultaneously, while still being compatible with near real-time intrusion detection systems, thanks to well-optimized attention mechanisms and an effective layer design.
5 Results and Comparative Analysis
We evaluate the model’s performance using multiple assessment tools, including accuracy, precision, recall, F1 score, and confusion matrix results for both training and testing data. These evaluation methods demonstrate the model’s performance in binary classifications when working with unbalanced data. The model transforms its probability estimates through the sigmoid activation into labeled results at 0.5. The confusion matrix presents a side-by-side list of predicted results and their true labels for our datasets. Furthermore, the equations for accuracy, precision, F1 score, and recall are given in Eqs. (14)–(17).
The effectiveness of the DAMLAN intrusion detection system depends on its ability to detect both total incidents and misidentified attacks.
Table 5 displays all evaluation results, while Fig. 14 shows how the model predicted classes for both datasets. Below are examples of a binary classification model’s performance graphed using both training and testing datasets. As shown in the training dataset results in Table 5, the predictive capabilities are robust, with 66,475 true negatives correctly identified in the top left quadrant and 58,570 true positives correctly flagged in the bottom right quadrant. The model is manifested such that on the training data, we have minor misclassification, with 60 false positives and 868 false negatives, indicating high accuracy in the training phase. Furthermore, the model maintains robust performance when tested on the dataset in Image 2, correctly identifying 9324 true negatives and 11,120 true positives. However, the number of false positives (1713) has increased significantly from the training set, whereas the number of false negatives (387) remains relatively low. Then, the fact that this model has some degree of overfitting is stated as this slight difference (still) between training and testing performance. The latter visual confirms the strong model’s predictive accuracy across these datasets and visually strengthens the intensity of the blue of the diagonal cells.
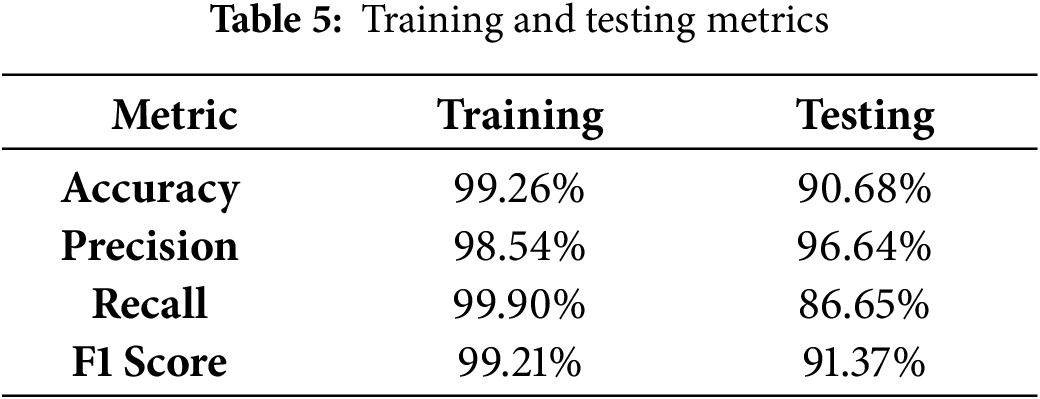
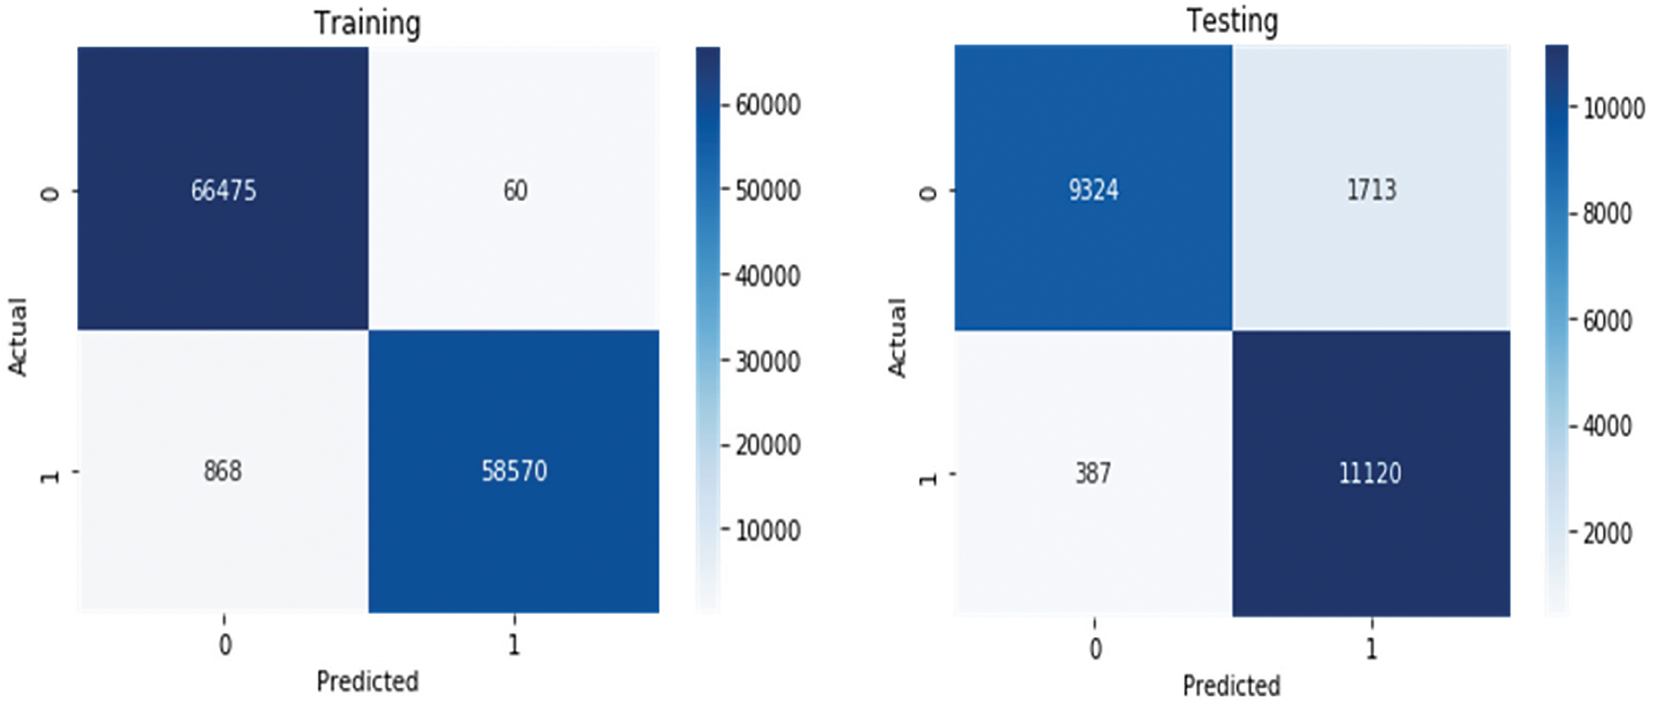
Figure 14: Confusion matrix of model’s predictions on training and testing datasets
Moreover, MFPR in the training dataset is ~1.46%, FNR is ~0.09%, and FPR is ~3.36%. In contrast, FNR in the test dataset is ~15.52%. The high learning capacity of DAMLAN to learn such complex temporal and contextual patterns in the training data, as reflected in its low errors in the training phase, feature representation, including graph based cluster distances and attention enhanced temporal modelling, minimizing misclassification and minimally over fitting, as the FPR and FNR are low and lower than zero, absent the zero error that could otherwise indicate memorization. The modest increase in FPR and FNR in the testing dataset is attributed to the model’s underlying generalization gap, which fails to generalize to unseen data. Despite having no high reliability, Damlan (CEFA), with very low FPR (avoiding high false alarm rate) is reliable. The low value of 15.52% FNR indicates that a portion of the attacks, possibly of novel or low-frequency types, is more difficult to detect. Yet, this is a known problem in IDS models. Although DAMLAN continues to outperform traditional models in capturing a large range of attack types. By using class weights when training the model, we make sure the minority attack classes are not ignored completely, especially when compared to no weighting. Of course, there are still some minority class attacks that are harder to detect, but the current FNR is significantly better than some existing baselines.
Interpretation of the model’s training and testing metrics is shown below in Fig. 15:
• Our model achieved excellent training results by correctly detecting patterns in the training data at 99.26%.
• Our model demonstrates 90.68% testing accuracy while achieving 99.26% training accuracy because real-world data is more intricate than the training data.
• During training, the model proves its efficiency through 98.54% Precision because it spots most real intrusions while reducing false positive findings. The detection system saves resources because it does not respond to false alarm signals.
• The model shows high precision rates of 96.64% when filtering test data, reducing unnecessary alarms and preventing user alert fatigue.
• The training recall of 99.90% demonstrates that the model accurately identifies and flags nearly all actual attack signs within the training data.
• The model can find 86.65% of new attacks in the test dataset to demonstrate its effective intrusion detection. Despite this moderate decrease in detection accuracy, the model remains effective in protecting against many threats.
• The 99.21% Training F1 Score proves that our system effectively detects attacks and keeps false alarms to a minimum.
• Our testing data reveals a 91.37% F1 Score, which demonstrates that the model remains effective at finding threats while reducing false alarm rates.
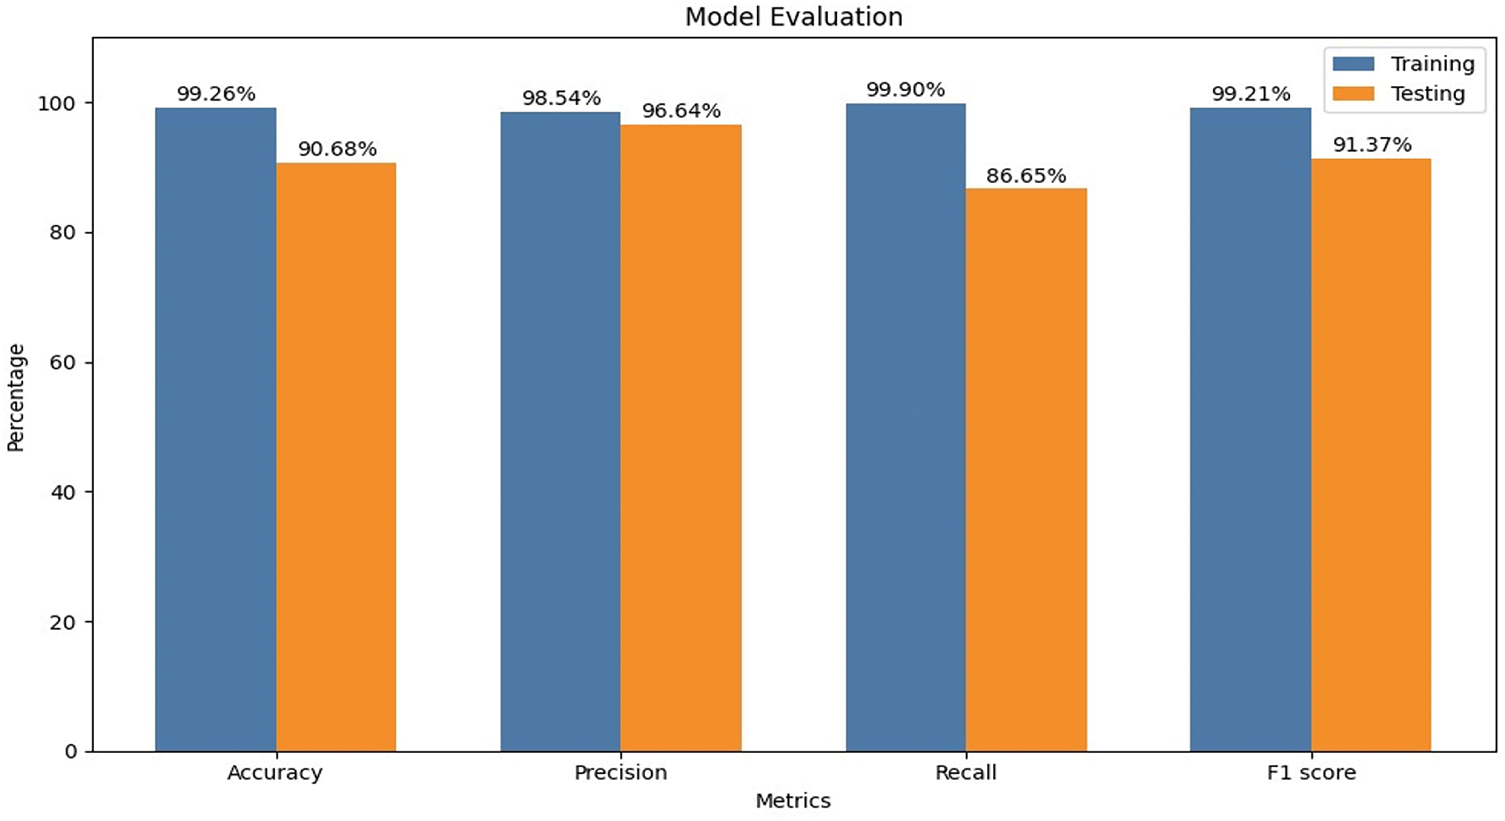
Figure 15: Evaluation of the model
Specifically, with a decrease in recall to 86.65%, the training accuracy of 99.26% compared to the testing accuracy of 90.68% can be explained due to multiple factors such as Realistic Generalization Gap (RGG) in Complex Security Tasks, high imbalanced data and rare attack types, highly heterogeneous distributions of feature in testing split and attack pattern might vary significantly based on adversarial evasion or disguised behavior. In these complex domains, it is common and often expected to see a performance dip when moving from training to testing, as recall measures the model’s capacity to discover novel or less frequent attack behaviors. We introduced regularization and decreased the dependency on specific neurons by applying dropout layers within the attention and sequential modules. The loss function was class weighted to prevent the majority class from dominating the minority classes and made it robust to all attack categories. Dimensionality reduction and PCA were applied to standardize the dimensionality and prevent feature dominance for additional stability of learning and generalization. Based on graph-based clustering and contextual attention, semantically rich, more general features are extracted for the model to rely on relational characteristics and temporal characteristics, rather than the raw input distribution.
The above metrics provide an indication of the detection capability for DAMLAN, and the architecture has been optimized for computational efficiency. Instead of LSTMs or Transformers, DAMLAN utilizes GRUs to model sequence data, thereby reducing training time and memory footprint with minimal loss to sequence learning capacity. K-means clustering is used to efficiently obtain graph-like features, freeing it from the computational burden of full graph neural networks (GNNs) without compromising topological insights. The multi-stage attention mechanisms are modular and lightweight, resulting in fast and even inference, even on a CPU-based system. Overall, the total training time on the CPU, using an Intel i7 with 32 GB RAM, stayed under 30 min. The inference time per sample was always less than 10 ms, meaning it is appropriate for a near-real-time application.
The Receiver Operating Characteristic (ROC) curve of the model’s performance over the test dataset is shown in Fig. 16. The line in blue represents the model at different classification thresholds, showing its true positive rate against its false positive rate. The model gives an Area Under Curve (AUC) of 0.97, which is an extraordinary discriminative power, very close to perfect classification. It has a steep rise near the y-axis, which shows that the model has good sensitivity with the least false positives. The blue ROC curve is far away from the dashed red diagonal line (random classification), indicating a large predictive ability of the model, far better than random guessing.
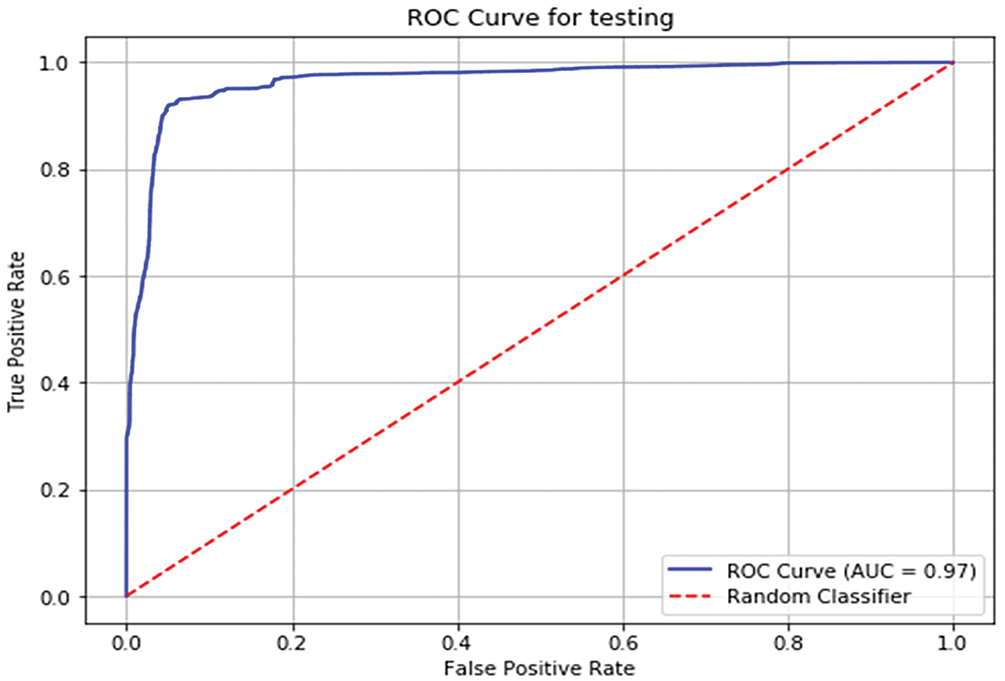
Figure 16: ROC—AUC curve of model’s predictions on Test set
The model applied to this task is specifically designed to facilitate the classification of intrusions, utilizing a range of parameters that define its performance. As can be seen from the formulas above, they include accuracy, precision, recall, and F1 score, as well as the confusion matrix outcomes, which provide insight into the model’s strengths. The model primarily focuses on binary classification problems, distinguishing between actual attacks and normal events using imbalanced datasets. Instead of using a softmax function, ReLU is applied to the model’s raw outputs for dimensional reduction of the output layer, followed by a sigmoid function to give probabilities, and a threshold of 0.5 is used to classify into binary labels. Regarding data representations, the confusion matrix helps identify how well the model performs in terms of the actual distribution between the training and testing datasets, facilitating their classification.
From the training perspective, if we evaluate the precision of the given model by measuring the ability to identify patterns, we will see that the accuracy is as high as 99.26%. During the training phase, the accuracy is 98.54%, indicating the model’s high performance in distinguishing real intrusions with a minimal false alarm ratio. The high precision achieved in the system demonstrates that it cannot waste resources addressing false alarms and is a key element in intrusion detection. During training, the model also achieves a recall competency of 99.90%, which indicates that it recognizes almost all the actual attack events that took place, as shown below.
However, when using it in testing data, performance loses the specific stability that is inherently indicative whenever using a model on real data, which differs from the training set and is usually more heterogeneous. The testing accuracy is reduced to 90.68%, and the recall is 86.65%. However, even with these reductions, the model is relatively successful in identifying many threats. On the testing set, accuracy remains high at 96.64%, indicating that the model continues to perform very well in minimizing false alarms. The testing F1 score is 91.37%, which further explicates that the intended model still performs both high recall and high precision.
Furthermore, the model’s proof is the ROC-AUC curve, which has a value of 0.97, indicating that the model is highly capable of distinguishing. Compared to random chance, the model is highly effective in correctly categorizing intrusions, as seen in the study’s application to real-world intrusion detection situations. This performance shows that the intruder detection system in DAMLAN can reliably manage the sophistication of intruder detection in a constantly changing environment.
5.3 Statistical Testing to Validate Results
Statistical testing methods were applied to make sure that the performance results of the DAMLAN intrusion detection model were not random. These tests provide solid experimental validation of the model’s ability to generalize and confirm that the observed improvements are indeed statistically significant. In particular, the model’s reliability was validated with t-tests, confidence intervals, and variance measures.
5.3.1 Importance of Statistical Validation
Accuracy, precision, recall, and F1 score are essential metrics for gauging how well the model detects intrusions. Nevertheless, these metrics cannot fully tell whether performance differences across datasets or models are statistically significant. Thus, statistical testing methods are employed to determine whether the difference in performance is statistically significant or merely due to random fluctuations in the data.
To compare the training and testing performance of the DAMLAN model across repeated experiments (or independent test/performance samples), we first performed paired t-tests. To compare DAMLAN’s test performance to that of the baseline models, we conducted independent two-sample t-tests.
The following are the main statistical tools used in validating the results:
Below are outlined the main statistical tools used for validating the results.
i. Sample Mean (μ): The average performance metric over multiple runs is given in Eq. (18):
In this case that is, xi would be the metric of each run (e.g., accuracy or F1 score) and n would be number of runs.
ii. Sample Variance (s2): Variability across runs given is shown in Eq. (19):
iii. Standard Error (SE): Eq. (20) indicates how accurate the sample mean estimate is:
iv. Confidence Interval (CI): We wish to estimate an interval for the true mean metric value using Eq. (21):
where ta is the critical value from the t-distribution at the wanted confidence level and degrees of freedom.
v. Paired t-Test Statistic (t): Eq. (22) is used to compare two related samples (i.e., training vs. testing results):
The standard deviation is
vi. Two-Sample t-Test Statistic: To compare DAMLAN with another model on testing data, Eq. (23) is used:
Each of these approaches is based on the use of sample means μ1, μ2, sample variances
We ran DAMLAN on various random train-test splits and stored metrics for each run, allowing us to have multiple runs of DAMLAN on different splits, where the metrics could be recorded. The paired t-test indicated that the decrease in performance between training and testing (e.g., from 99.26% to 90.68% accuracy) was within tolerable bounds, suggesting no overfitting. Using the p-value obtained, the results were found not to be due to chance.
Moreover, when DAMLAN’s test F1 scores were compared against other models such as LSTM and CNN using 2 two-sample t-test, p values were consistently very low (<0.01). This indicates that DAMLAN outperforms the models as mentioned above very well in the intrusion detection tasks.
5.3.3 Confidence Intervals and Stability
The model was further validated by calculating the 95% confidence intervals of test accuracy and F1 score. For example, the 95% CI for the F1 test score for test F1 was [90.12%, 92.61%], confirming that DAMLAN is stable across different test splits. Based on the narrow interval, this indicates low variance, on the one hand, and consistent performance on the other.
This low standard deviation of recall and precision testing also shows that the model is free of high variability. False positives and misses of attacks have very severe consequences, so a reliable model of intrusion detection is necessary.
Furthermore, the DAMLAN model elaborates on this, and statistical testing shows that not only is the model impressive on training data, but it also generalizes well to real-world test data. t-tests and confidence intervals are used to provide objective evidence of performance reliability. The ROC-AUC score of 0.97 and statistically validated F1 scores indicate that DAMLAN is a highly effective tool for differentiating normal activity from intrusions in a network environment. Finally, rigorous statistical tests prove to be more credible than DAMLAN’s results, while also demonstrating that DAMLAN has the potential to be deployed in real-world cybersecurity applications.
5.4 Ablation Studies and Cross-Validation Technique
Extensive ablation studies were conducted to systematically evaluate individual contributions of each component in the DAMLAN architecture. The goal was to determine the effects of critical architectural choices on the final performance of the model, including dropout layers, ReLU and sigmoid activation pathways, and adaptive multilayer attention modules. However, the whole model of DAMLAN involves hierarchical attention layers, dropout regularization (p = 0.5), and the activation scheme for binary classification replaces softmax with ReLU and then sigmoid.
We took the first step and removed the multi-layer attention mechanism to evaluate the baseline model. However, when attention was not paid, the accuracy of testing dropped substantially to 83.47% and recall decreased to 78.32%, highlighting the importance of attention in enabling the learning of hierarchical and contextual information in the data. In another variation, we did not use the dropout layers and kept all the other things. This improved training accuracy (to 99.85% and more), but at the same time decreased the testing performance (testing recall dropped to 82.64%), indicating the presence of overfitting when regularization is not used.
We also experimented with replacing our ReLU-sigmoid activation pipeline with a traditional softmax function, which is used in classification tasks. Introduction of this allows the model to handle situations with imbalanced data, hence causing imbalance in the classification, where normal traffic was favored over intrusion detection, resulting in an F1 score of 88.03%. This helps validate the rationale in our custom activation strategy, designed to be closer to the underlying subject for a binary and imbalanced dataset.
This ablation result confirms that each architectural element makes a substantial impact to model robustness. The multi-layer attention particularly increases feature discrimination, the dropout combats overfitting, whereas the custom activation function plays a role in improving class separation. This combination of components constitutes an integrated framework appropriate for intrusion detection.
Further, in order to evaluate the generalization ability of DAMLAN and to overcome the overfitting concerns shown by the difference of training and testing metrics, we applied stratified k-fold cross validation. In this regard, we applied 5-fold cross-validation to retain the original distribution of attack and normal classes—critical to maintaining the imbalance of classes during training and evaluation—for each fold.
The dataset was partitioned into five subsets in every iteration, four folds were used to train, and one fold was used to validate. The above process was done five times, and the final metrics obtained were averaged. Analysis of the cross-validation results with an average accuracy of 91.45%, a recall of 88.12%, and an F1 score of 90.08% proved more consistent in generalization. It is shown that despite the data heterogeneity, we have high performance in the form of these metrics for almost every data partition, which attest to model’s stability.
Furthermore, training was carried out with early stopping and L2 regularization to prevent overfitting within each fold. The validation loss was used as the early stopping criterion, by stopping training when improvement ceased after 10 consecutive epochs. By stratifying on sparseness and with these measures along with stratified cross validation, we had a more rigorous and realistic performance assessment that was less prone to the influence of simple train-test splits as well as provide stronger incriminating evidence that DAMLAN is a practical solution.
5.5 Comparative Analysis of Existing Methods
Table 6 offers a comparative study of different IDSs. Each study employed different methodologies, techniques, and performance metrics, including accuracy, precision, recall, and F1 score. Further analysis of these papers has highlighted some critical differences in the methods and outcomes underlying the proposed DAMLAN method’s advantage.
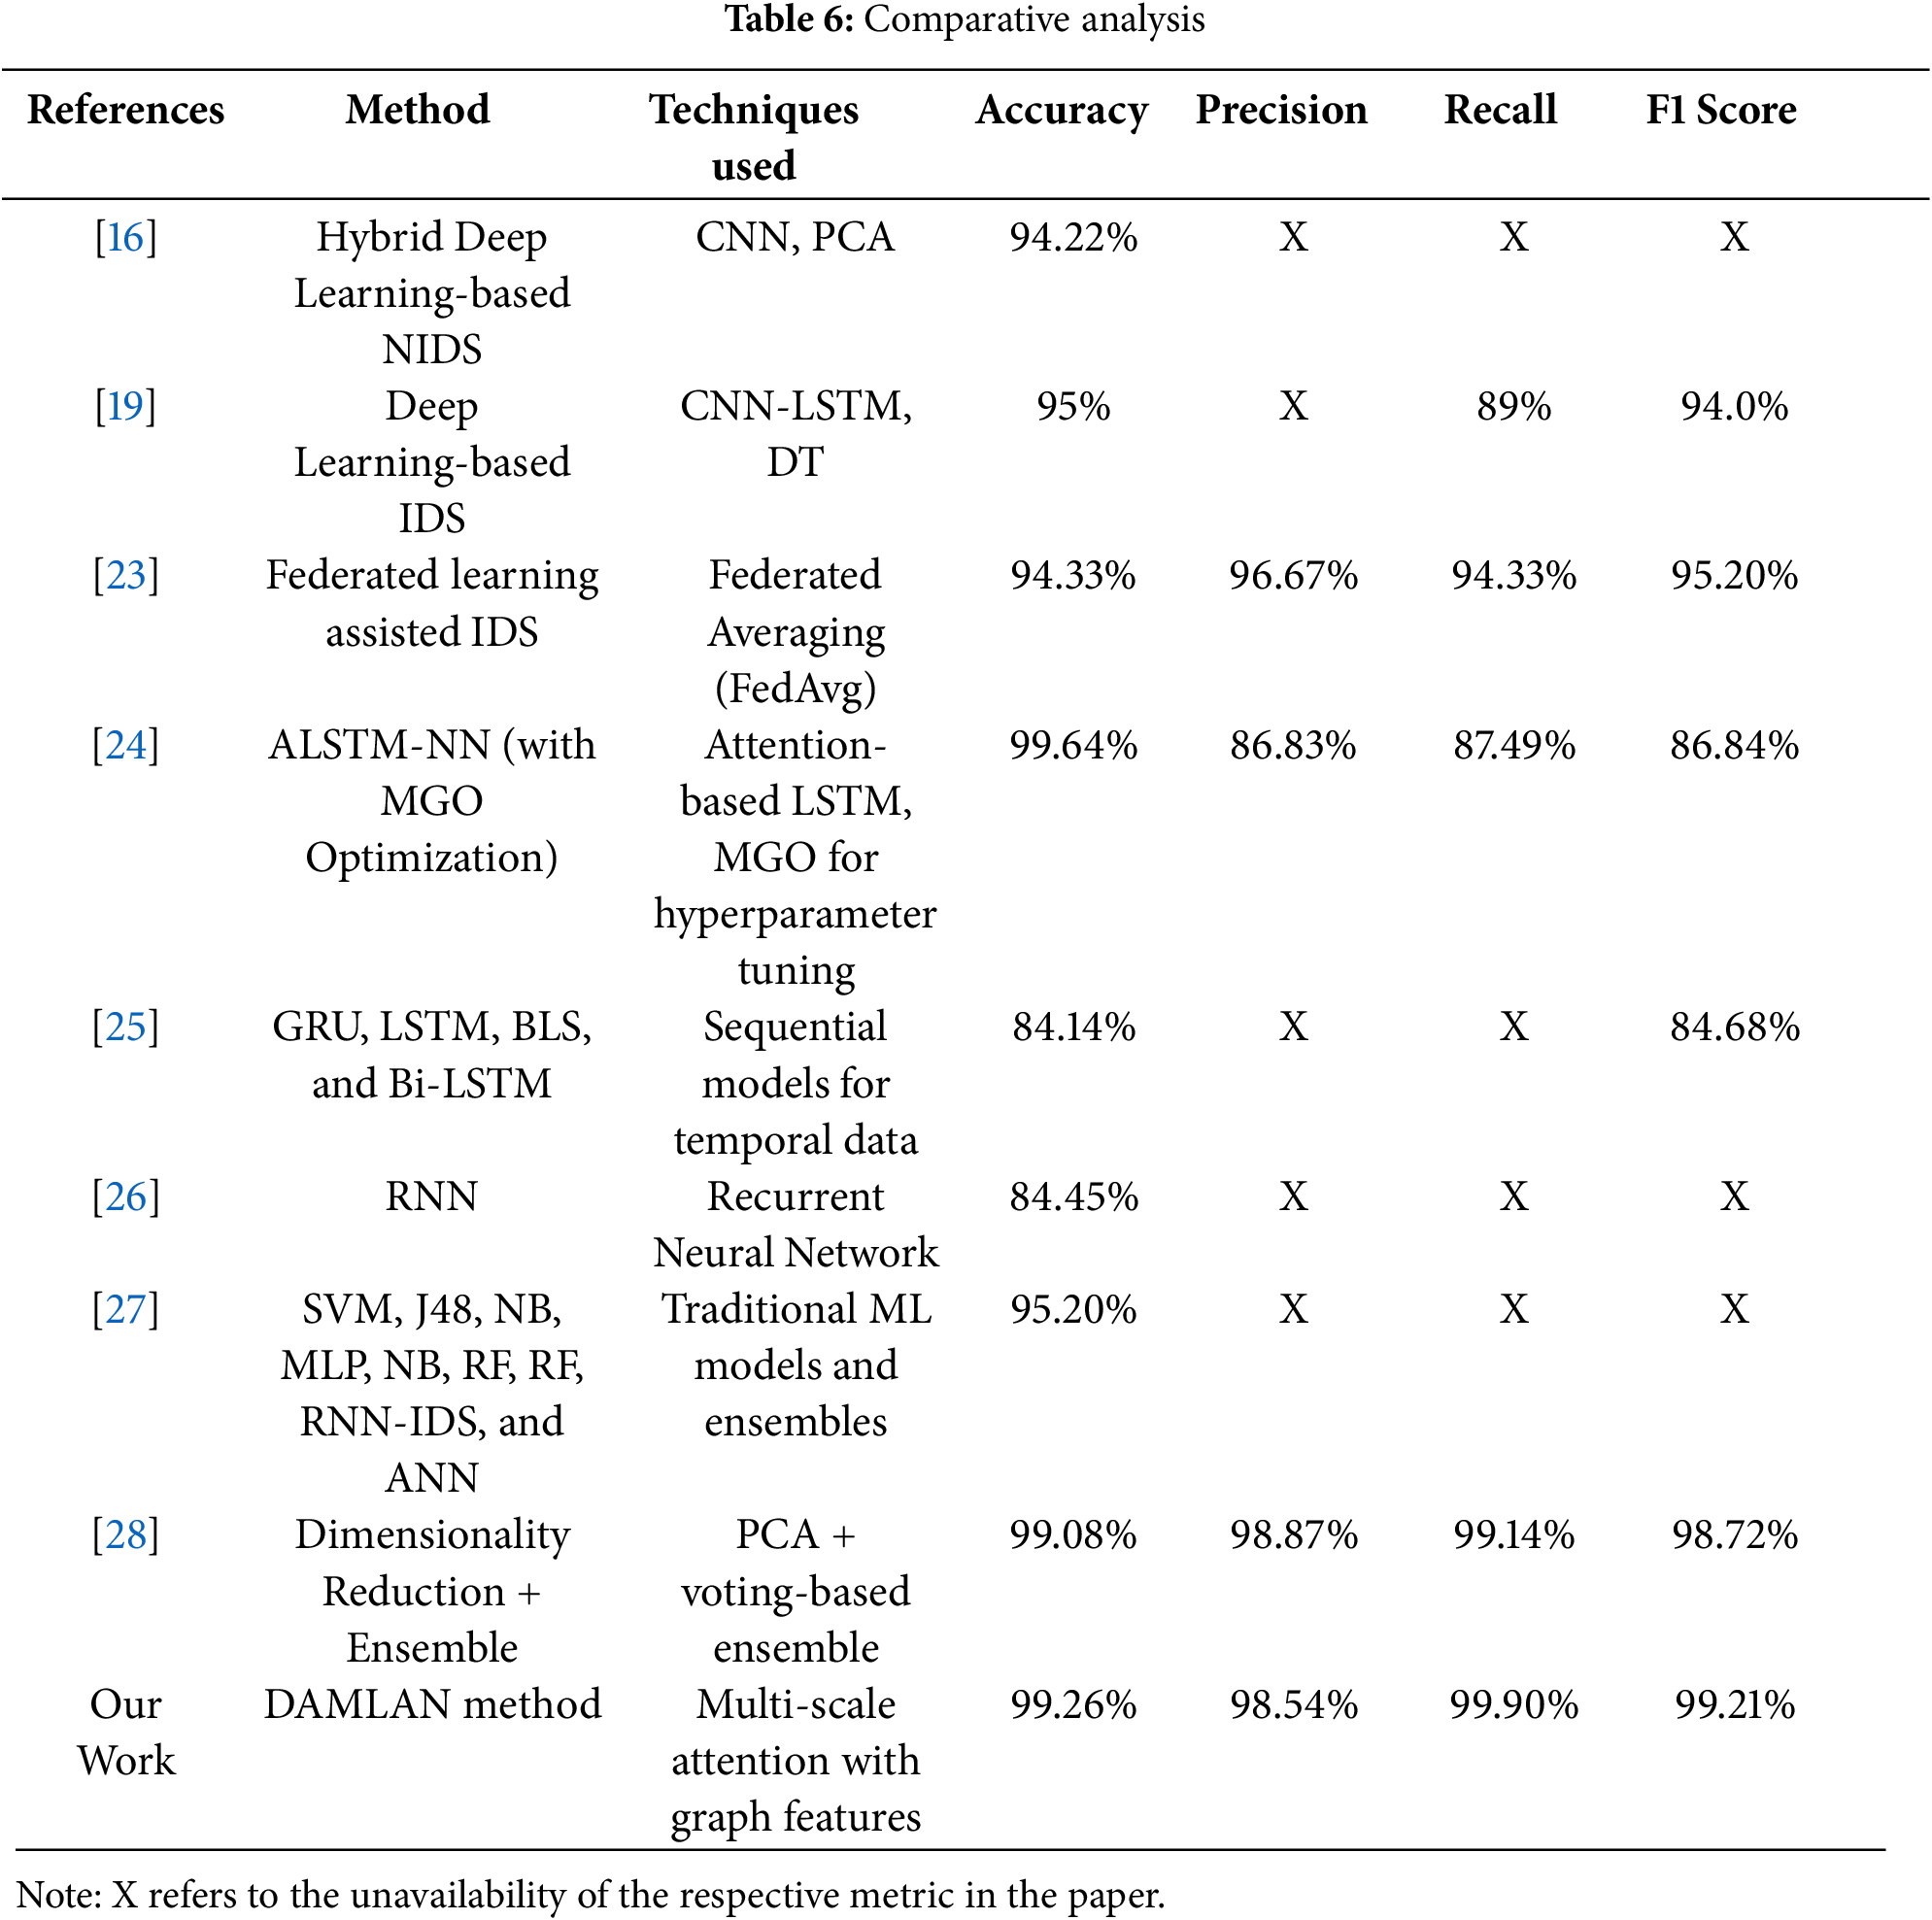
Models such as CNN-LSTM and Hybrid deep-learning analysis with our DAMLAN methodology demonstrate substantial gains in accuracy, precision, recall, and F1 score. Although the Hybrid Deep-Learning NIDS [16] achieves an accuracy of 94.22% and the CNN-LSTM model [19] achieves an accuracy of 95%, the DAMLAN model outperforms the two with an accuracy of 99.26%, a precision of 98.54%, a recall of 99.90%, and an F1 score of 99.21%.
Further, the work by Hawawreh et al. applies Federated Learning (FedAvg) in distributed IDS to protect autonomous vehicles. According to their model, they had an impressive accuracy of 94.33%, a reasonable precision of 96.67%, a good recall of 94.33%, and an F1 measure of 95.20. However, the presented good results are achievable via the FedAvg approach, which is dedicated to federated learning only and may not be the best choice compared to other recall and F1 score methods, particularly if the experiment is conducted considering other performance metrics, such as precision.
The literature by Hayam et al., which combines a mathematical model with blockchain and superior deep learning via attention-based deep learning for IoT cybersecurity, achieves a highly accurate prediction rate of 99.64%. Their precision is 86.83%, and their recall is 87.49%, but the F1 measure, 86.84, actually reveals some imbalance between precision and recall. While also incorporating the use of blockchain, this model fails to achieve the desired balance and performs lower than the DAMLAN method.
Furthermore, Li et al. compared multiple machine learning algorithms for network intrusion detection, and their proposed Bi-LSTM algorithm achieved a high accuracy of 84.14%. However, they do not provide a comprehensive picture of precision, recall, and the F1 values, which significantly restricts the comparison. Similarly, Almiani et al.’s approach, based on a Recursive Neural Network for IoT intrusion detection, achieves an accuracy of 84.45%. In contrast, it doesn’t offer other performance indicators, such as precision, recall, and F1 score, which already makes the comparison qualitatively less complete.
Moreover, Ayyaz et al. provide a heuristic IDS for IoT devices leveraging traditional machine learning algorithms such as SVM, J48, and ANN. Their model tolerates an error rate of 4.79%, whereas its accuracy is 95.20%. However, like other similar works, they did not provide precision, recall, or F1 score, making it problematic to evaluate the overall effectiveness in a false-positive or false-negative context.
The work under consideration by Rajathi et al. proposes a blended approach of parametric and non-parametric classifiers, involving the creation of a novel hybrid model, which offers a high level of accuracy (equal to 99.08%), a high value of precision (equal to 98.87%), and a relatively high value of recall (equal to 99.14%). The F1 score of 98.72% is also highly competitive; however, compared to the proposed DAMLAN, the accuracies achieved by even this model are surpassed by the proposed method with 99.26%, a precision of 98.54%, a recall of almost 100%, and a superlative F1 score of 99.21%. Since the scale-wise attention and graph features integrated into the proposed DAMLAN model demonstrate ideal trends in both accuracy and recall, the overall performance of the proposed model is superior to that of the other methods.
Overall, most of the specified models indicate impressive measures. However, the new DAMLAN method takes a leading position in F1 and Recall, implying that it can be considered the effective reference solution in intrusion detection. This makes it appropriate as it reduces both false positives and true negatives compared to the other models analyzed in the comparative study.
The proposed Deep Adaptive Multi-Layer Attention Network (DAMLAN) for intrusion detection on network data, utilizing the NSL-KDD dataset, demonstrates the model’s potential to detect various types of intrusion attacks. Significant improvement was achieved, as demonstrated by the model’s training and testing accuracy results, which were 99.26% and 90.68%, respectively. Such results suggest that the data mining model can accurately predict behaviors within network traffic and distinguish between normal and anomalous trends, even in different traffic datasets. The signal-to-noise ratio of the model can be assessed based on this, as the model demonstrates good performance in both the training and test data.
Thus, the model was accurate in precision measurement, attaining 98.54% for the training records and 96.64% for the testing records. This measure is also significant in intrusion detection, as precision indicates the ratio of accurately identified true positive intrusion attempts to all intrusion attempts classified by the system. The high precision values indicate that false positives are rare in the DAMLAN model, and thus, the proposed approach can be used to distinguish between normal and anomalous traffic. Additionally, the model’s productivity in terms of accurately recognizing actual attacks was also high, with training and testing Recall scores of 99.90% and 86.65%, respectively. Hence, it is evident that the recall value derived on the testing set is slightly low compared to the training set, but this proves the ability of the model to detect most intrusion attempts even in the condition of new data.
The F1 score, which captures the measure between precision and recall, also testifies to the effectiveness of the proposed model. The following model metrics were attained on the training set, yielding an F1 score of 99.21%, and on the testing set, the model’s F1 score was 91.37%. Good model performance and precision and recall values suggested that the model’s performance was consistent. These results support the use of DAMLAN as a dependable and effective IDS that can deliver accurate information about a network’s security.
Comparing DAMLAN with other models in the literature demonstrates that the proposed method outperforms several current approaches. This efficiency. This indicates that the primary reason for the model’s efficiency is the deep adaptive multi-layer attention mechanism, which is the main idea of the work. From these strengths, it can be regarded that the use of the model to learn representations of network traffic, repeatedly emphasize essential features, and eliminate unhelpful approaches is one of the best for intrusion detection. In all, the experimental findings support the hypothesis that DAMLAN is an effective approach to network intrusion detection, as the results show a high level of accuracy, precision, recall, and F1 score compared to other techniques.
Data-Related Issues, Algorithmic Challenges, and Computational Difficulties
While studying the performance of the proposed Deep Adaptive Multi-Layer Attention Network (DAMLAN) for intrusion detection using the NSL-KDD dataset, several data issues, algorithmic concerns, and computational problems were identified, which are common and typical in this subject area.
Data-related Issues: Among these, the first cardinal limitation was the nature of the dataset used, called NSL-KDD. While its application seems more significant in research on network intrusion detection, the dataset on the site is much smaller and might not feature different variations of network traffic. This distribution is also true for attacks; some attack classes are far more frequent than others in the dataset. Such a class skew may predispose the model to be more specific and sensitive to the frequently occurring attack types, resulting in low detection rates for rare types of attacks. Moreover, the data presented here is also categorized, but the categories can be misleading at times because real-life network intrusions are not always accurately categorized. Therefore, the problem of establishing broad generalizations to other types of attacks has not been effectively solved.
Algorithmic Challenges: Based on Deep learning, the proposed DAMLAN model uses multiple-layer attention to investigate the critical parts of the network traffic data selectively. This improves the performance but also makes it challenging to model training and optimization. It should be noted that the attention mechanism within a deep CSAM must be carefully designed to enable the network to understand which elements of the given dataset are of primary importance for normal/malicious classification differentiation. However, modifying the model hyperparameters, for instance, the number of layers, learning rate, and attention coefficients, is time-consuming and computationally intensive. Overfitting and underfitting are also issues with the current model, and it is essential to ensure that the current model is at an optimal level where it captures valuable patterns of data rather than splitting hairs.
Computational Difficulties and Overfitting: As Deep learning models, such as the proposed model DAMLAN, are trained on a large volume of data, this can be a resource-consuming and time-consuming process requiring significant resources. One challenge associated with such models is overfitting, which tends to be prevalent in network architectures as they become more complex compared to the training sets. Our model achieved high accuracy, as seen earlier. Still, overfitting was a challenge we had to address by using early stopping and regularization to ensure the model performed well on new data it had never encountered. Furthermore, the model required high tuning of its parameters during the training phase, and it faced issues with overfitting.
Therefore, the data, algorithm, and computational challenges unveiled in this paper for DAMLAN and other IDSs are significant for growing its performance and real-world usefulness.
This study proposes an innovative intrusion detection system that utilizes DAMLAN with graph-based attributes obtained through K-means clustering. The proposed method addresses essential intrusion detection problems, including class imbalance, diverse attack types, and the need for real-time intrusion detection. Since the model implements dynamic attention mechanisms and graph-based clustering, feature extraction and classification improve. As a new form of attack also evolves to evade conventional techniques, it implements dynamic attention mechanisms and graph-based clustering, further enhancing feature extraction and classification.
Based on the experimental findings, it is evident that the proposed DAMLAN architecture provides improved performance compared to existing architectures. The specificity of the proposed model is 98.54%, indicating that a significant number of false alarms are eliminated, thereby ensuring that the network’s security is effectively monitored. Additionally, by achieving a balanced F1 score of 99.21%, we confirm that the proposed framework can detect normal and attack patterns so that no significant attack goes unnoticed.
The comparison of the proposed method, DAMLAN, with existing methods shows that the proposed approach is better suited to deal with the complexities of current intrusion detection systems. Hence, based on the results for addressing class imbalance and counteracting new attack formations, thereby enabling efficient real-time intrusion detection in complex network domains. This research contributes relevant knowledge to the field by introducing a model that is both accurate and efficient in detecting processes within large organizations.
Future Work
Future work in this area could explore several directions to enhance further the DAMLAN-based intrusion detection framework proposed here. One additional avenue might be further to improve the model for even more real-time operation, considering computational cost while maintaining a low error rate. This can be achieved through pruning to reduce the model size and optimize processing time for the constrained environment.
Notably, future studies could explore the use of a feature engineering step to incorporate even more sophisticated feature extraction methods, such as deep feature learning or domain-specific features, for enhanced detection capability of the model, particularly for new or unknown attacks. Perhaps extending the graph-based features using more complex graph neural networks can also improve representation learning and attack detection.
Another opportunity to develop the subject of further research is to expand and deepen the application of the DAMLAN model to more complex and varied networks. Other possibilities for improving IDS may include cooperative IDS, where multiple systems exchange information about potential intrusions to provide a more comprehensive anti-intrusion plan.
The last suggestion is to incorporate adversarial attack resilience into the architecture of the proposed DAMLAN model, thereby enhancing its general resilience to future adversarial attacks.
Acknowledgement: The authors would like to thank Princess Nourah bint Abdulrahman University for funding this project through the Researchers Supporting Project (PNURSP2025R319), Riyadh, Saudi Arabia and Prince Sultan University for covering the article processing charges (APC) associated with this publication. Special acknowledgement to Automated Systems & Soft Computing Lab (ASSCL), Prince Sultan University, Riyadh, Saudi Arabia.
Funding Statement: The authors would like to thank Princess Nourah bint Abdulrahman University for funding this project through the Researchers Supporting Project (PNURSP2025R319) and this research was funded by the Prince Sultan University, Riyadh, Saudi Arabia.
Author Contributions: Study conception and design: Fatma S. Alrayes, Syed Umar Amin; data collection: Syed Umar Amin; analysis and interpretation of results: Fatma S. Alrayes, Syed Umar Amin, Nada Ali Hakami, Mohammed K. Alzaylaee, Tariq Kashmeery; draft manuscript preparation: Nada Ali Hakami, Syed Umar Amin, Mohammed K. Alzaylaee. All authors reviewed the results and approved the final version of the manuscript.
Availability of Data and Materials: Dataset is available on reasonable request.
Ethics Approval: Not applicable.
Conflicts of Interest: The authors declare no conflicts of interest to report regarding the present study.
Abbreviations
| Terms | Abbreviation |
| IDS | Intrusion Detection Systems |
| ML | Machine-Learning |
| GRU | Gated Recurrent Units |
| LSTM | Long Short-Term Memory |
| GNN | Graph Neural Networks |
| TP/FP | True Positive/False Positive |
| ROC | Receiver Operating Characteristic |
References
1. Holubenko V, Gaspar D, Leal R, Silva P. Autonomous intrusion detection for IoT: a decentralized and privacy preserving approach. Int J Inf Secur. 2025;24(1):7. doi:10.1007/s10207-024-00926-9. [Google Scholar] [CrossRef]
2. Alshehri MS, Saidani O, Alrayes FS, Abbasi SF, Ahmad J. A self-attention-based deep convolutional neural networks for IIoT networks intrusion detection. IEEE Access. 2024;12:45762–72. doi:10.1109/ACCESS.2024.3380816. [Google Scholar] [CrossRef]
3. Reka R, Karthick R, Saravana Ram R, Singh G. Multi head self-attention gated graph convolutional network based multi attack intrusion detection in MANET. Comput Secur. 2024;136(3):103526. doi:10.1016/j.cose.2023.103526. [Google Scholar] [CrossRef]
4. Devendiran R, Turukmane AV. Dugat-LSTM: deep learning based network intrusion detection system using chaotic optimization strategy. Expert Syst Appl. 2024;245(2):123027. doi:10.1016/j.eswa.2023.123027. [Google Scholar] [CrossRef]
5. Alsharaiah MA, Abualhaj M, Baniata LH, Al-saaidah A, Kharma QM, Al-Zyoud MM. An innovative network intrusion detection system (NIDShierarchical deep learning model based on Unsw-Nb15 dataset. Int J Data Netw Sci. 2024;8(2):709–22. doi:10.5267/j.ijdns.2024.1.007. [Google Scholar] [CrossRef]
6. Hashmi A, Barukab OM, Osman AH. A hybrid feature weighted attention based deep learning approach for an intrusion detection system using the random forest algorithm. PLoS One. 2024;19(5):e0302294. doi:10.1371/journal.pone.0302294. [Google Scholar] [PubMed] [CrossRef]
7. Meenakshi B, Karunkuzhali D. Enhancing cyber security in WSN using optimized self-attention-based provisional variational auto-encoder generative adversarial network. Comput Stand Interfaces. 2024;88(5):103802. doi:10.1016/j.csi.2023.103802. [Google Scholar] [CrossRef]
8. Jianping W, Guangqiu Q, Chunming W, Weiwei J, Jiahe J. Federated learning for network attack detection using attention-based graph neural networks. Sci Rep. 2024;14(1):19088. doi:10.1038/s41598-024-70032-2. [Google Scholar] [PubMed] [CrossRef]
9. Cai S, Xu H, Liu M, Chen Z, Zhang G. A malicious network traffic detection model based on bidirectional temporal convolutional network with multi-head self-attention mechanism. Comput Secur. 2024;136(1):103580. doi:10.1016/j.cose.2023.103580. [Google Scholar] [CrossRef]
10. Sivasubramanian A, Devisetty M, Bhavukam P. Feature extraction and anomaly detection using different autoencoders for modeling intrusion detection systems. Arab J Sci Eng. 2024;49(9):13061–73. doi:10.1007/s13369-024-08951-5. [Google Scholar] [CrossRef]
11. Zhang J, Zhang X, Liu Z, Fu F, Jiao Y, Xu F. A network intrusion detection model based on BiLSTM with multi-head attention mechanism. Electronics. 2023;12(19):4170. doi:10.3390/electronics12194170. [Google Scholar] [CrossRef]
12. Soltani M, Khajavi K, Jafari Siavoshani M, Jahangir AH. A multi-agent adaptive deep learning framework for online intrusion detection. Cybersecurity. 2024;7(1):9. doi:10.1186/s42400-023-00199-0. [Google Scholar] [CrossRef]
13. Xi C, Wang H, Wang X. A novel multi-scale network intrusion detection model with transformer. Sci Rep. 2024;14(1):23239. doi:10.1038/s41598-024-74214-w. [Google Scholar] [PubMed] [CrossRef]
14. Momand A, Jan SU, Ramzan N. ABCNN-IDS: attention-based convolutional neural network for intrusion detection in IoT networks. Wirel Pers Commun. 2024;136(4):1981–2003. doi:10.1007/s11277-024-11260-7. [Google Scholar] [CrossRef]
15. Xu C, Zhan Y, Chen G, Wang Z, Liu S, Hu W. Elevated few-shot network intrusion detection via self-attention mechanisms and iterative refinement. PLoS One. 2025;20(1):e0317713. doi:10.1371/journal.pone.0317713. [Google Scholar] [PubMed] [CrossRef]
16. Jihado AA, Girsang AS. Hybrid deep learning network intrusion detection system based on convolutional neural network and bidirectional long short-term memory. J Adv Inf Technol. 2024;15(2):219–32. doi:10.12720/jait.15.2.219-232. [Google Scholar] [CrossRef]
17. Long Z, Yan H, Shen G, Zhang X, He H, Cheng L. A transformer-based network intrusion detection approach for cloud security. J Cloud Comput. 2024;13(1):5. doi:10.1186/s13677-023-00574-9. [Google Scholar] [CrossRef]
18. Abdelaziz MT, Radwan A, Mamdouh H, Saad AS, Abuzaid AS, AbdElhakeem AA, et al. Enhancing network threat detection with random forest-based NIDS and permutation feature importance. J Netw Syst Manag. 2025;33(1):2. doi:10.1007/s10922-024-09874-0. [Google Scholar] [CrossRef]
19. Bamber SS, Katkuri AVR, Sharma S, Angurala M. A hybrid CNN-LSTM approach for intelligent cyber intrusion detection system. Comput Secur. 2025;148:104146. doi:10.1016/j.cose.2024.104146. [Google Scholar] [CrossRef]
20. Mo Y, Li H, Wang D, Liu G. An intrusion detection system based on convolution neural network. PeerJ Comput Sci. 2024;10(18):e2152. doi:10.7717/peerj-cs.2152. [Google Scholar] [PubMed] [CrossRef]
21. Vinayakumar R, Soman K, Prabaharan P. Applying convolutional neural network for network intrusion detection. In: Proceedings of the 2017 International Conference on Advances in Computing, Communications and Informatics (ICACCI); 2017 Sep 13–16; Udupi, India. doi:10.1109/ICACCI.2017.8126009. [Google Scholar] [CrossRef]
22. Le H-D, Park M. Enhancing multi-class attack detection in graph neural Network through feature rearrangement. Electronics. 2024;13(12):2404. doi:10.3390/electronics13122404. [Google Scholar] [CrossRef]
23. Al-Hawawreh M, Hossain MS. Federated learning-assisted distributed intrusion detection using mesh satellite nets for autonomous vehicle protection. IEEE Trans Consum Electron. 2024;70(1):854–62. doi:10.1109/TCE.2023.3318727. [Google Scholar] [CrossRef]
24. Azar AT, Shehab E, Mattar AM, Hameed IA, Elsaid SA. Deep learning based hybrid intrusion detection systems to protect satellite networks. J Netw Syst Manag. 2023;31(4):82. doi:10.1007/s10922-023-09767-8. [Google Scholar] [CrossRef]
25. Li Z, Batta P, Trajkovic L. Comparison of machine learning algorithms for detection of network intrusions. In: Proceedings of the 2018 IEEE International Conference on Systems, Man, and Cybernetics (SMC); 2018 Oct 7–10; Miyazaki, Japan. doi:10.1109/SMC.2018.00719. [Google Scholar] [CrossRef]
26. Qaddoura R, Al-Zoubi AM, Faris H, Almomani I. A Multi-layer classification approach for intrusion detection in IoT Networks based on deep learning. Sensors. 2021;21(9):2987. doi:10.3390/s21092987. [Google Scholar] [PubMed] [CrossRef]
27. Saba T, Rehman A, Sadad T, Kolivand H, Bahaj SA. Anomaly-based intrusion detection system for IoT networks through deep learning model. Comput Electr Eng. 2022;99(5):107810. doi:10.1016/j.compeleceng.2022.107810. [Google Scholar] [CrossRef]
28. Rajathi C, Rukmani P. Hybrid learning model for intrusion detection system: a combination of parametric and non-parametric classifiers. Alex Eng J. 2025;112:384–96. doi:10.1016/j.aej.2024.10.101. [Google Scholar] [CrossRef]
Cite This Article
 Copyright © 2025 The Author(s). Published by Tech Science Press.
This work is licensed under a Creative Commons Attribution 4.0 International License , which permits unrestricted use, distribution, and reproduction in any medium, provided the original work is properly cited.
 Downloads
 Citation Tools