
 Submit a Paper
 Propose a Special lssue
 Open Access
ARTICLE

2D Numerical Simulation of Blasting Crater and Breaking Fragmentations
1 Hubei Key Laboratory of Construction and Management in Hydropower Engineering, China Three Gorges University, Yichang, 443002, China
2 College of Hydraulic & Environmental Engineering, China Three Gorges University, Yichang, 443002, China
3 China Gezhouba Group Explosive Co. Ltd., Chongqing, 401121, China
* Corresponding Author: Yong Fan. Email:
Computer Modeling in Engineering & Sciences 2025, 144(1), 811-839. https://doi.org/10.32604/cmes.2025.065632
Received 18 March 2025; Accepted 03 June 2025; Issue published 31 July 2025
 View Full Text
 Download PDF
Abstract
The formation process of blasting craters and blasting fragments is simulated using the continuum-discontinuum element method (CDEM), providing a reference for blasting engineering design. The calculation model of the blasting funnel is established, and the formation and fragmentation effect of the blasting crater under different explosive burial depths and different explosive package masses are numerically simulated. The propagation law of the explosion stress wave and the formation mechanism of the blasting crater are studied, and the relationship between the rock-crushing effect and blasting design parameters is quantitatively evaluated. Comparing the results of numerical simulation with the results of field tests and theoretical calculations indicated that the three are consistent, which proves the accuracy of numerical simulation. The results showed that the area of the blasting crater rises with the increase of explosive package mass and explosive burial depth. Taking the proportion of broken blocks with particle size ranging from 0.01 to 0.1 m as the research object, it can be found that the proportion of broken blocks with an explosive burial depth of 0.62 to 1.12 m is 0.45 to 0.18 times that with an explosive burial depth of 0.5 m. The proportion of broken blocks with an explosive radius of 4 to 12 cm is 1.14 to 3.29 times that with an explosive radius of 2 cm. The quantitative analysis of the blasting effect and blasting design parameters provides guidance for the design of blasting engineering.Keywords
As a basic form of blasting damage, the mechanical mechanism of the blasting crater is the most basic research focus in blasting theory and blasting engineering. Studying the formation of a blasting crater can provide appropriate blasting design parameters for blasting work and improve blasting efficiency. In practical engineering applications, field testing and theoretical analysis have traditionally been utilized to adjust and optimize blasting design parameters. With the rapid advancement of computer science, numerical simulation techniques have emerged as an important tool for investigating the formation and evolution of blasting craters.
In terms of theoretical analysis, studies on the tensile and shear mechanisms during the formation of blasting craters under spherical explosive charges have revealed that crater formation is primarily caused by tensile failure. Based on wave dynamics, Wang et al. [1] derived the governing equations describing the temporal-spatial attenuation, reflection, and superposition propagation characteristics of blasting-induced stress waves. Based on the theory of explosion shock wave and stress wave and their propagation and reflection law in rock medium, the calculation formula of rock blasting crater of spherical explosive package was studied, and the theoretical solution of the parameters of cylindrical explosive package blasting crater was deduced by using Starfield superposition principle [2].
In the field experiment, Jonathan et al. [3] and Lv et al. [4] studied the single-hole blasting crater test under different burial depths and analyzed the influence of the law of explosive package embedding depth on the volume and radius of the blasting crater. Lu et al. [5–7] investigated the propagation of blasting waves in underground geotechnical structures made of porous material using a shock wave propagation test of soil and cemented filler. Through the single-hole blasting crater test, the optimal burial depth, critical burial depth, and optimal explosive consumption of the blasting crater were calculated [8,9]. Through the experimental study on the blasting crater generated at the surface of a model granular bed, Pacheco-Vzquez et al. [10] found that the diameter and depth of the blasting crater do not follow a 1/4-power-law scaling with energy. Abu et al. [11] performed small-scale blasting tests to observe and measure the influence of sandy soil on explosive blasting intensity. Xu et al. [12] conducted systematic blasting crater tests on ore rocks with three distinct lithologies in mining stopes, establishing empirical relationships among critical burial depth, optimal burial depth, optimum blasting crater radius, and rock strength parameters. Li et al. [13] performed field blast experiments in calcareous sand formations to analyze crater typology and dimensional characteristics under varying burial depth scales. Their study revealed the influence of explosive burial depth on crater morphology and dimensions, identifying critical burial depth thresholds for three distinct crater types: ejection-type craters, collapse-type craters, and subsurface explosions. Sugiyama et al. [14] verified the inhibition effect of sand on shock waves through a sand explosion experiment. A series of explosion tests were conducted with varying amounts of explosives placed underground or on the soil surface. Based on the resulting crater sizes, Zhou et al. [15] proposed an inversion method for determining the characteristic parameters of the explosion source. Guan et al. [16] designed and conducted a series of centrifugal model tests on buried explosions in dry sand, revealing that the elastic blast-induced wave velocity in dry sand increases with burial depth. Based on Livingston’s blasting crater theory, Tan et al. [17] performed single-hole blasting crater experiments, plotted correlation curves between crater volume and explosive burial depth, and established quantitative relationships among crater depth, vibration velocity, noise levels, and explosive burial depth.
In terms of numerical simulation, Huang et al. [18] numerically simulated single-hole blasting in soil using a coupled Peridynamics (PD) and Smoothed Particle Hydrodynamics (SPH) model, demonstrating that increased gravitational acceleration significantly reduces both soil ejection height and crater dimensions. An et al. [19] found that the hybrid FEM-DEM is superior to continuous and discontinuous methods in terms of modeling the dynamic fracture of rock under blast loading by studying the fracture mechanism of rock using a hybrid finite-discrete element method (FEM-DEM). The blasting crater was numerically simulated using the three discrete element method (3DEC), and the formation law and course of the blasting crater were further analyzed [20]. Kucewicz et al. [21] developed a fully three-dimensional model of single-hole blasting to investigate the evolution patterns of radial crack geometry, crack population, and crushed zone radius. An et al. [22] studied the effects of blasting-induced stress waves and detonation gases using the particle flow program (PFC) and LS-DYNA (Livermore Software Technology Corporation-DYNA, Livermore, CA, USA) numerical simulation program to analyze the blasting confinement mechanism in narrow-vein mining. Based on the particle flow program (PFC2) in the discrete element method (DEM), Zhang et al. [23,24] analyzed the relationship between the geometric size of the blasting crater and the parameters in the explosive particle expansion method. Xu et al. [25] investigated the formation of blasting craters in concrete materials using the Multi-material Arbitrary Lagrangian-Eulerian (ALE) method, demonstrating the applicability of this analysis technique in simulating blasting craters. Li et al. [26,27] studied the fracture mechanism and failure procedure of rock under wedge compression by DEM. Through simulating the dynamic crack propagation under in-situ stresses with finite element method (FEM), Tao et al. [28] reported that the element deletion method can well describe the formation of crushed zone and the propagation of radial cracks. Wang et al. [29] analyzed the dynamic tensile fracture behavior of rock under explosion load by using Taylor-Chen-Kuszmaul (TCK) continuous damage model to predict the explosion pit in brittle rock caused by underground explosion. LS-DYNA program was utilized to numerically study the explosion crushing of sublevel caving (SLC), and a crushing evaluation method based on damage description was proposed [30–32]. Fan et al. [33,34] investigated the fragmentation characteristics of soil blasting by coupling a state-based Peridynamics (PD) model (for soil) with a modified Smoothed Particle Hydrodynamics (SPH) model (for explosives). Aubertin et al. [35] investigated the formation of blasting craters from single boreholes using the LS-DYNA finite element model, evaluating the effects of key parameters (tangential stress magnitude and damping) on fracture initiation and propagation in low-porosity soft rock. Han et al. [36] and Yu et al. [37] validated that the particle expansion loading algorithm in the Particle Flow Code (PFC) method not only accurately simulates blasting crater formation but also captures blast-induced vibration effects in peripheral rock masses, providing a robust numerical framework for rock blasting simulations. Busch et al. [38] experimentally examined small-scale airblast impacts on clay soils, quantifying soil compaction and crater morphology under varying explosive charges. In addition, Zhang et al. [39] numerically modeled cut blasting processes via a Smoothed Particle Hydrodynamics (SPH)-FEM coupling method, revealing that bottom charge placement in empty holes significantly enhances blasting crater connectivity and overall fragmentation efficiency. Jeon et al. [40] investigated the characteristics of rock fragmentation by using the hydrocode in the platform of AUTODYN. The numerical analysis shows that the dimension of a crater is increased with a decrease in rock quality. Yang et al. [41] simulated the detonation of a column charge and the damage process in a rock mass by the particle flow code method.
Although existing studies have significantly advanced the understanding of stress wave propagation and crater morphology, critical research gaps persist in systematically quantifying the dependencies of fragmentation gradation on explosive burial depth and charge mass. Prior works predominantly relied on empirical or theoretical approaches and focused on simplified geometries, leaving unresolved the role of continuous-discontinuous transition mechanisms in dynamic fracture under blast loading. Conventional numerical methods (FEM, DEM) fail to fully capture the coupled effects of stress wave reflection, crack propagation, and fragmentation gradation. Therefore, this study introduces the continuum-discontinuum element method (CDEM) to simulate the entire formation process of blasting craters, establishing explicit quantitative relationships between fragmentation gradation and design parameters. This framework overcomes the limitations of traditional models and provides actionable insights for optimizing blasting efficiency in practical engineering by integrating fracture energy-based virtual interfaces and validating results against field experiments.
2.1 Formation Mechanism of Blasting Crater
When the explosive detonates inside the rock, the rock near the explosion source is completely destroyed due to the intense compression caused by the shock wave and detonation products, resulting in a crushed zone. In this process, most of the energy of the shock wave is consumed so that the shock wave on the boundary surface of the powder crushed zone is reduced to a stress wave. The outline and radius of the blasting crater are related to the action of the stress wave [2]. Therefore, it is necessary to know the peak pressure and attenuation regularity of the shock wave.
Based on the normal rock equation of state, the relationship between the velocity of the shock wave in rock and the motion velocity of the rock mass point on the wavefront is shown in Eq. (1).
where DC is the velocity of the shock wave in the rock medium; u is the movement velocity of the rock endoplasmic point; a and b are constants determined experimentally.
On the boundary of the crushed zone, the stress wave velocity DC is decayed to the elastic longitudinal wave velocity CP in the rock. Thus, based on the conservation of momentum in the fundamental equation for rock shock waves, the peak pressure can be calculated as shown in Eq. (2).
ur can be obtained using Eq. (3):
Eq. (4) can be derived based on Eqs. (2) and (3):
where Pr is peak pressure on the shock wave front; ρm is the original rock density; ur is the moving speed of rock particles at the interface of the crushed zone.
The attenuation relationship between the peak pressure of the shock wave and distance can be calculated based on Eq. (5).
where P is Shock wave pressure at any point; σr is radial stress peak; R is the distance from any point to the center of the explosion source; R0 is the radius of the crushed zone; δ is the pressure attenuation coefficient. For the shock wave, δ can be taken as three or calculated based on δ = 2 + ν/(1 − ν), ν is Poisson’s ratio.
Based on the fundamental equation of conservation relationship, the calculation formula for the radius of the crushed zone caused by the explosion was derived as Eq. (6).
where rb is the blast hole radius; Pd is the initial maximum detonation pressure; a and b are constants determined experimentally.
The initial maximum detonation pressure of the explosive was calculated by Eq. (7) [42].
where ρ0 is explosive density; D0 is explosive detonation velocity.
The effect of longitudinal waves on rock breaking was mainly considered, and the effect of transverse waves was disregarded. At the edge of the blasting crater, the sum of the tangential tensile stress σθ from the incident wave and the radial tensile stress σi from the reflected wave is equal to the tensile strength ST of the rock.
Fig. 1 depicts the reflection of the longitudinal wave on the free surface.
Figure 1: Reflection of longitudinal wave propagation on the free surface [2]
The reflection angle and incident angle of the reflected wave meet Snell’s law of optical refraction. Based on this law, Eq. (9) can be obtained.
Eq. (10) can be obtained from CP1 = CP2 = CP and Eq. (9) as follows:
The following relationship exists between the incident angle of the longitudinal wave and the reflection angle of the shear wave.
where CP1 and CP2 are longitudinal wave velocity; CS is shear wave velocity; C is apparent velocity; ν is Poisson’s ratio.
Based on the reflection law, the relationship between the incident wave stress σR and the reflected wave stress σI can be obtained:
where σR is the incident wave stress; σI is the reflected wave stress; K is the reflection coefficient; α is the incident angle of the longitudinal wave; β is the shear wave reflection angle.
Eq. (12) exhibits that the radial tensile stress σi generated by reflected wave stress σr has the same relationship with the radial stress of incident wave, namely:
Eq. (15) can be derived using Eqs. (5) and (14) as follows:
There is the following relationship between tangential tensile stress generated by incident wave stress and radial stress of incident wave:
Eq. (17) can be obtained from Eqs. (5) and (16) as follows:
where R is the distance between the edge point of the crater of the free surface and the center of the explosive package; λ is the ratio coefficient of tangential stress to radial stress, λ = ν/(1 − ν).
Tangential tensile stress generated by incident wave σθ and the radial tensile stress caused by the reflected wave σi are decomposed in the rectangular coordinate system and superimposed in different directions, as shown in Fig. 2.
Figure 2: Reflection of longitudinal wave propagation on the free surface [2]
Fig. 2 indicates that if the crater radius is rL and the resistance line length is W, the distance between the crater edge point and the blast hole center can be calculated as shown in Eq. (18):
Tangential tensile stress caused by incident wave σθ and the radial tensile stress caused by the reflected wave σi is decomposed in the rectangular coordinate system and combined with the calculation relations of Eqs. (15), (17), and (18), the following are superimposed in the X and Y directions:
Based on the above calculation equations, the expression of crater radius rL is:
The model size is shown in Fig. 3. The numerical model primarily comprises rock and explosive materials. Through numerical trials with varying mesh densities to analyze the mesh dependency, a non-uniform discretization approach was ultimately adopted for element mesh generation by comprehensively considering computational accuracy and efficiency. All elements in the model were discretized using linear triangular elements. In this study, all computational models employ meshes ranging from 800,000 to 1,000,000 elements, with minimum and maximum mesh sizes of 5 and 100 mm, respectively. The coupling charge structure was adopted between the explosive package and the rock mass, and the coupling between the explosive package and the rock mass was realized by defining the contact surface. The explosive and rock mass grid elements were defined as the contact surface to generate the virtual interface inside the model to realize the subsequent rock fracture calculation. In order to simplify the calculation, non-reflective boundary conditions were applied on both sides and the bottom, while a free boundary condition was used on the top.
Figure 3: Blasting crater element model
This study mainly explored the influence of explosive buried depth and explosive package mass on the formation of blasting craters. Taking the buried depth of the explosive as the research object, six calculation models with the radius of an explosive package of 2.5 cm, the buried depth of the explosive of 0.5, 0.62, 0.75, 0.87, 1.0, and 1.12 m were established. Taking the radius of the explosive package as the research object, six calculation models with the radius of an explosive package of 2, 4, 6, 8, 10, and 12 cm and the buried depth of the explosive of 1.0 m were established.
3.2 The Materials and Parameters of the Calculation Model
3.2.1 The Materials and Parameters of the Rock Model
The rock element was discretized in the numerical simulation calculation by the virtual contact surface, and the fracture energy model was adopted for the contact surface [43].
The incremental method was utilized to calculate the contact force on the virtual interface based on the fracture energy model of the contact surface. The calculation principle of the fracture energy model is Eq. (22).
where Fn is the normal connection force; Fs is the tangential connection force; kn and ks are normal and tangential stiffness per unit area (Pa/m); Ac is the area of virtual interface; Δdun and Δdus are normal and tangential relative displacement increment.
The tensile fracture criterion and shear fracture criterion of the contact surface are described as follows:
Tensile fracture:
Eqs. (24) and (25) are derived using Eqs. (22) and (23).
where σt0, σt(t0), and σt(t1) are the tensile strength on the virtual interface at the initial time, this time and the next time, respectively, Δun is the normal relative displacement on the virtual interface at the current time, Gft is tensile fracture energy (Pa·m).
Shear fracture:
Eqs. (27) and (28) are obtained from Eqs. (22) and (26).
where Φ is the friction angle in the virtual interface, c0, c(t0), and c(t1) are the cohesion on the virtual interface at the initial time, this time and the next time, Δus is the tangential relative displacement on the virtual interface at the current time, Gfs is shear fracture energy (Pa·m).
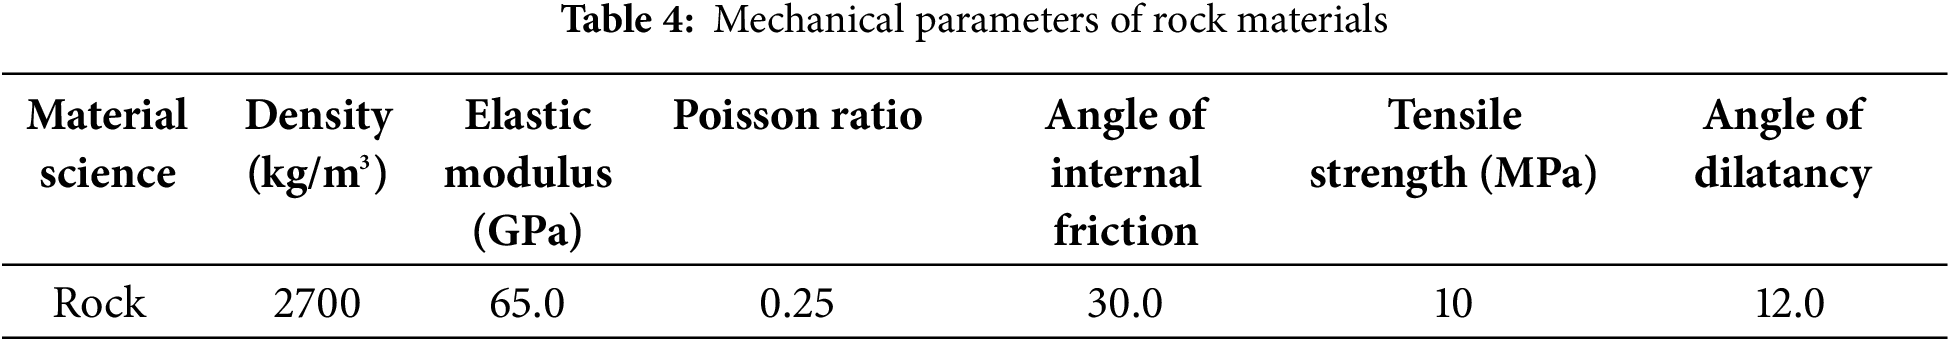
The material parameters of rock are listed in Table 1.
During calculation, the tangential stiffness and normal stiffness of the rock element model were set as 5 × 10¹³ Pa/m.
3.2.2 The Materials and Parameters of the Explosive Model
The explosive was calculated using the Landau explosion source model. The input parameters of the Landau explosion source model include explosive package density, explosive detonation velocity, detonation heat, and ignition point position. The model was mainly based on the Landau-Stanyukovich formula [43].
where the value of γ is 3, and the value of γ1 is 4/3; p and V are the transient pressure and volume of the high-pressure gas ball; p0 and V0 are the pressure of the high-pressure gas ball at the initial time and the volume of the explosive package; pk and Vk are the pressure and volume of the high-pressure gas ball at the boundary of the two-stage adiabatic process, respectively.
The expressions of p0 and pk are Eqs. (30) and (31).
where Qw is the explosion heat of the explosive per unit mass (J/kg); ρw is explosive package density (kg/m3); D is detonation velocity (m/s).
Eq. (32) can be calculated using Eqs. (29)–(31):
The material parameters of the explosive are listed in Table 2:
During practical rock blasting, the explosive gas gradually expands and pushes the rock mass to do work after detonation. After the cracks are formed in the rock and reach the free surface, the gas in the blasting hole escapes, and the pressure in the blasting hole drops sharply. Hence, the equivalent simulation was conducted by setting the action time of the explosive to simulate the whole process of explosive action. When the time elapsed after the detonation of the explosive element exceeded the duration of the explosive action, the explosive element was considered to have failed immediately. Then, the gas pressure was zero, and the explosion pressure was no longer calculated. In this study, the action time of explosive T0 = 0.02 s.
3.3 Numerical Simulation Results of Different Explosive Burial Depths
3.3.1 Propagation Law of Explosion Stress
Explosion pressure in rock blasting plays a crucial role in determining the outcome of rock crushing. Investigating the propagation and reflection of explosion pressure within the rock provides valuable insights and an effective reference for optimizing blasting strategies to break rock efficiently. Taking rock blasting with buried depth H of 0.5 m as an example, the variation law of propagation and reflection of explosion force in rock with time after explosive initiation was given. As shown in Fig. 4 (In the color strip, a positive value indicates compressive stress and a negative value indicates tensile stress.)
Figure 4: Propagation process of explosion stress
Fig. 4 exhibits that after the explosive is detonated, the explosion pressure grows rapidly in a very short time and works on the rock around the explosive package in the form of a shock wave. The explosion stress wave spreads in a circular formation from the explosion source in all directions in the rock. At 0.104 ms after initiation, the explosion compressive stress wave reaches the free surface of the rock in contact with the air and creates a reflected tensile stress wave. Then, the compressive stress wave continues to propagate in all directions within the rock. When the compressional stress wave reaches the free surface, it is reflected back into the rock, generating a reflected tensile stress wave. This reflected wave then circulates from the free surface towards the interior of the rock. The compressive stress wave and reflected tensile stress wave are gradually attenuated by the impedance of the rock.
Taking the numerical simulation calculation results of an explosive buried depth of 0.5 m as an example. Five monitoring points were taken at an interval of 0.1 m on the resistance line, and three columns were taken at an interval of 0.25 m in the horizontal direction. There were three monitoring points in each column, a total of 14 monitoring points. The variation law of stress with time at the above monitoring points was recorded. The variation of explosion pressure with time at different monitoring point positions along the resistance line was compared and analyzed. In addition, the explosion pressure variation over time was examined at three groups of monitoring points, each having the same ordinate but different abscissa values. The recorded time history curve of compressive stress is shown in Fig. 5 (A positive value indicates compressive stress and a negative value indicates tensile stress.)

Figure 5: Compressive stress time history curve
Fig. 5 demonstrates that the stress at each monitoring point increases rapidly to the peak and then gradually attenuates to a specific value. The growth rate of compressive stress is much greater than the attenuation rate, and the closer the points are to the explosion source, the earlier the compressive stress reaches its peak. This phenomenon is also consistent with the explosion stress propagation and reflection law shown in Fig. 4. By viewing the “stress time history” curve in Fig. 5a, comparing the variation law of compressive stress at different monitoring points, it can be found that the closer monitoring points are to the explosion source, the greater the explosion pressure peak and the lower the attenuation rate. The peak explosion pressure at the monitoring points on the free surface was less than 50 MPa, while the maximum peak pressure at the monitoring points located 0.1 m from the explosion source exceeded 350 MPa. The pressure peak value is greater than the compressive strength of the rock itself, resulting in large radial plastic deformation of the rock, destruction of the rock structure, and rock crushing. Fig. 5b–d indicates that in the same horizontal direction, the closer the monitoring points are to the free surface, the smaller the explosion pressure peak, the earlier the moment of the change time from compressive stress to tensile stress, and the greater the tensile stress peak.
The reflected stress wave on the free surface influences the formation of a blasting crater. Studying the propagation behavior of these reflected waves is crucial for understanding the formation process of the blasting crater.
Fig. 5a shows that at 0 and 0.1 m away from the free surface, the peak value of reflected wave tensile stress on the resistance line is higher than 10 MPa. The peak value of tensile stress at these positions is greater than the tensile strength of rock mass. Fig. 5d indicates that at the points 0.25 m away from the resistance line on the free surface, the tensile stress is close to 10 MPa and increases gradually. At the same vertical position, as the distance from the free surface increases, the rock mass is less affected by the tensile stress of the reflected wave. The reflected wave progressively attenuates as it travels through the rock during the reflection transmission process. Similar conclusions can be drawn by comparing the monitoring points with the same distance from the free surface but different horizontal distances from the resistance line.
The crack propagation of rock mass under the action of an explosion is a research hotspot of rock mass blasting at present. The study of the formation and development process of cracks will provide a specific reference for the study of rock fragmentation law. Taking the numerical simulation study of a blasting crater with buried depth H = 0.5 m as an example, the effect of rock crack propagation with time under the action of the explosion is shown in Fig. 6.
Figure 6: Crack growth variation diagram
Fig. 6a reveals that after the explosive is detonated, small and dense cracks appear near the explosive package. Fig. 6b,c indicates that the cracks continue to expand around. The cracks at the bottom and upper part of the explosive package are relatively slender, and the cracks on both sides are relatively short. Fig. 6d–f illustrates the progressive extension of cracks from the bottom of the explosive package into the underlying rock mass. Simultaneously, two additional cracks initiate on either side of the explosive package, propagating toward the free surface, ultimately outlining the shape of the blasting crater. The cracks in the blasting crater also increase significantly and mainly appear in the direction of the resistance line and the rock mass near it. The number of cracks in the rock mass near the blasting source is also more than that in other parts of the rock mass, and some cracks began to appear in the rock mass outside the crater contour. Fig. 6g–l reveals that with the ongoing explosion action, the contour of the blasting crater becomes increasingly distinct. The cracks within the crater continue to expand along the resistance line near the explosion source, eventually reaching and penetrating the free surface. The cracks outside the crater continue to expand and extend to both sides in the horizontal direction, and many independent cracks begin to expand and penetrate each other. In addition, the cracks above the explosion source are more evident than in other parts, indicating that the cracks in this part of the rock mass are larger. The large number of cracks also indicates that this part of the rock mass is broken more seriously.
3.3.3 Formation Process of Blasting Crater
The blasting craters under different explosive buried depths were numerically simulated, and the formation process of the blasting crater was illustrated by taking the numerical simulation results of the blasting crater with buried depth H = 0.5 m as an example. The movement procedure is mainly divided into rock crushing, bulging, throwing, and falling accumulation under the action of explosives. The results are shown in Fig. 7.
Figure 7: Formation process of blasting crater with an explosive buried depth of 0.5 m
Fig. 7 presents the results under the action of an explosive. The rock mass around and above the explosive package is broken. When part of the explosion energy is converted into rock mass kinetic energy, the rock mass has a certain speed and acceleration under the action of kinetic energy and continues to fly upward and on both sides. Fig. 7b demonstrates that when T = 6 ms, the broken rock mass flies upward from the original rock mass to produce a bulging phenomenon. Fig. 7c–e shows that the broken rock mass in the direction of the resistance line basically flies upward along the direction of the resistance line. At T = 250 ms, the broken rock mass reaches the highest point under the action of gravity and begins to fall back.
The main reason for this factor is that the rock mass movement resistance in the direction of the resistance line is the smallest, and the rock particle movement velocity is the largest, causing the broken rock mass to fly upwards along the resistance line and on both sides. In different directions, the rock mass around the resistance line is subjected to shear action due to different velocities of rock particles. When the shear stress in the rock exceeds its intrinsic shear strength, shear failure of the rock mass will occur. At this time, under the action of explosion pressure and explosion products, the rock mass will fly out along the radial direction, and the broken rock around the resistance line will fly away to both sides. As the rock along the radial direction will only be broken when the shear stress is stronger than its shear strength, the rock along the radial direction creates a radial dividing line. The radial demarcation line is the crater edge boundary.
The effect of explosives on rock fragmentation is variable at different explosive buried depths. This study explored the numerical calculation of blasting craters under buried depths of 0.50, 0.62, 0.75, 0.87, 1.00, and 1.12 m. After calculation, the final results were obtained by excavating the rock mass broken into independent blocks. The calculation results mainly focused on the shape, diameter, depth, and area of the blasting crater. The effect diagram is depicted in Fig. 8.
Figure 8: Crater shape under different explosive burial depth
Fig. 8 demonstrates that with the growth of buried depth, the area and depth of the blasting crater gradually increase. Fig. 8a–d reveals that when the explosive buried depth H is less than 0.87 m, the opening angle of the blasting crater is larger. In contrast, Fig. 8e,f shows that as the explosive buried depth H is larger than 0.87 m, the opening angle of the blasting crater is significantly reduced and close to a 90-degree right angle.
3.3.5 Blasting Fragmentation Gradation
Fragmentation gradation is an important index to measure the blasting effect. Therefore, the study of blasting fragmentation gradation has a specific reference value for the evaluation of blasting effect on practical engineering. This study can also provide valuable guidance for stone mining engineering and rock mass excavation. This study numerically simulates the blasting craters with explosive burial depths H of 0.50, 0.62, 0.75, 0.87, 1.00, and 1.12 m, and the blasting fragmentation gradation curves under these different explosive burial depths are obtained, as shown in Fig. 9.
Figure 9: Fragmentation gradation curve under different buried depths of explosive
Based on Fig. 9, under the condition that the buried depth H of the explosive is 0.5 m, the block produced by blasting is relatively small as a whole. The broken blocks with particle sizes less than 0.05 m account for 60% of the whole, while those with particle sizes between 0.01 m and 0.1 m make up 80% of the total. With the growth of explosive buried depth, the particle size of the block produced by blasting increases gradually. The proportion of broken blocks with particle size between 0.01 m and 0.1 m show that when the buried depth of explosive H is 0.62, 0.75, 0.87, 1.0, and 1.12 m, respectively, the proportion is 36%, 28%, 18%, 16%, and 14%, respectively.
3.4 Numerical Simulation Results of Different Explosive Package Masses
The mass of explosives has a great impact on the crushing range and effect of rock mass. The numerical calculation of the blasting crater with an explosive package radius of 2, 4, 6, 8, 10, and 12 cm was studied. The final results were obtained by excavating the rock mass of broken independent blocks. The shape, diameter, depth, and area of the blasting crater were mainly concerned, and the effect diagram is illustrated in Fig. 10.
Figure 10: Shape of blasting crater under different explosive package
Fig. 10 indicates that the depth, diameter, and area of the blasting crater gradually extend with the increase of the explosive package mass. It reveals that when the explosive package radius is 2 cm, the opening angle of the blasting crater is in the shape of a large acute angle. As the explosive package radius increases to 2, 3, 4, 5, and 6 times its original size, the opening angle of the blasting crater expands significantly compared to that at 2 cm.
3.4.2 Blasting Fragmentation Gradation
The following is the numerical simulation of blasting craters with explosive package radius of 2, 4, 6, 8, 10, and 12 cm, respectively, and the blasting fragmentation gradation curves under these different explosive package radius conditions were obtained, as shown in Fig. 11.
Figure 11: Block size grading curve under different explosive package masses
Based on Fig. 11, under the condition that the explosive package radius is 2 cm, the block produced by blasting is relatively large, the broken blocks with a particle size of 0.01 to 0.1 m account for 14% of the whole, and the particle size is between 0.1 and 1.0 m, which accounts for 86% of the whole. With the increase of explosive package mass, the particle size of the block produced by blasting decreases gradually. The proportion of broken blocks with a particle size of 0.01 to 0.1 m is used as a study. When explosive package radius r is 4, 6, 8, 10, and 12 cm individually, the proportion is 16%, 28%, 36%, 39% and 46%, respectively.
4.1 Verification of Experimental Results
This study analyzed the field blasting crater test results of the Baima iron mine located in Baima Town, Miyi County, Panzhihua City, Sichuan Province, China. In the field experiment, #2 rock emulsion explosive (extrusion coupling) was used. The blast hole depth is 2 m, the explosive package volume is 6 kg, and the explosive package density is 1.15 g/cm3. The experimental design is shown in Fig. 12.
Figure 12: Field experiment
The diameter of the blasting crater in the field experiment is 4.4 m by measuring the blasting crater after blasting.
This study compared the field experiment of the #A4 blasting crater. During numerical simulation, a two-dimensional blasting crater model was adopted. The height of the model is 8 m, and the width is 16 m. The round explosive package was adopted, the radius of the cartridge is 10 cm, and the distance from the bottom of the explosive package to the free surface is 2 m. The explosive and rock parameters adopted in the numerical simulation are shown in Tables 3 and 4.
The numerical simulation results were compared to the field experimental results, as shown in Fig. 13.
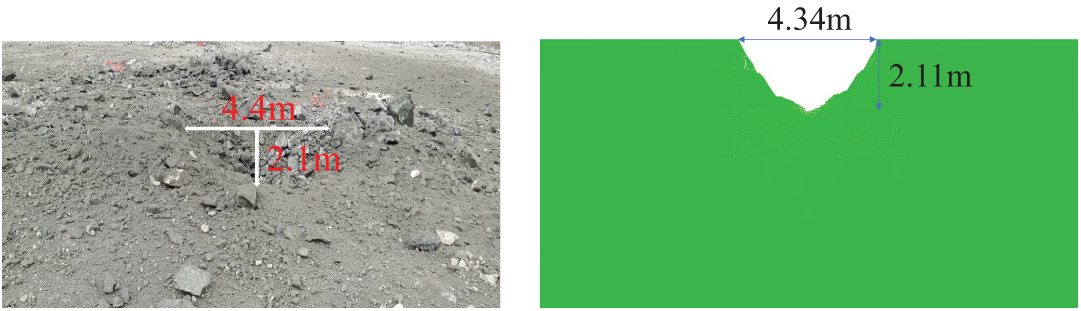
Figure 13: Comparison between numerical calculation and field experimental results
Fig. 13 indicates that the results of the field experiment are close to those of numerical simulation calculation. Therefore, the numerical simulation results are of reference significance to a certain extent.
The fragmentation gradation obtained by field experiment is compared to that obtained by numerical simulation. The results are shown in Fig. 14.
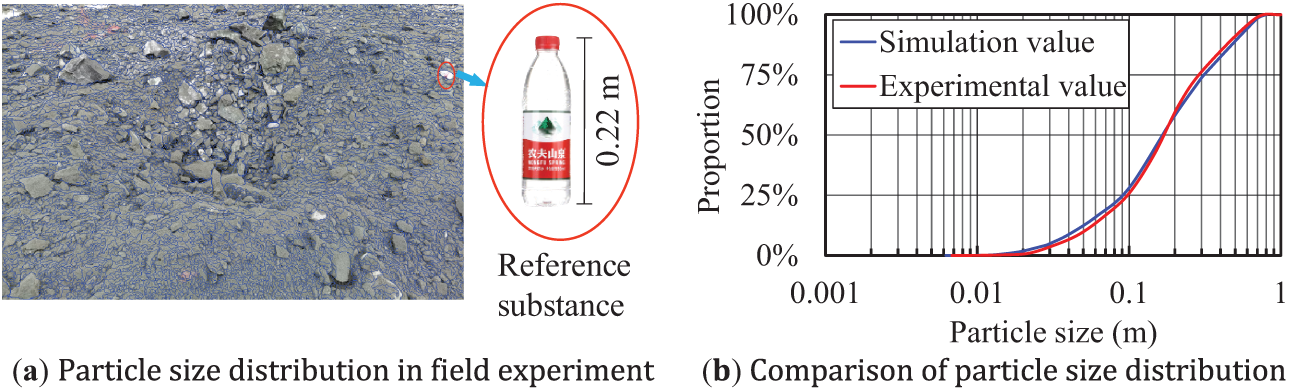
Figure 14: Fragmentation gradation comparison
The experimental results (Fig. 14) are in good agreement with the numerical simulation results. Because the particle size extraction of the field experiment was conducted by image recognition, only the broken rock mass on the surface of the blasting crater can be counted. In addition, in image recognition, blocks with small particle sizes are difficult to identify and count accurately. Therefore, compared to the numerical simulation results, the field experiment results tend to show a lower proportion of small particle sizes and a higher proportion of large particle sizes.
4.2 Theoretical Calculation Results
This study compared theoretically the numerical simulation of blasting craters under different explosive burial depths. Based on the calculation formula deduced in Section 2, the theoretical value of the blasting crater radius can be calculated and compared to the results of numerical simulation. The results are illustrated in Fig. 15.
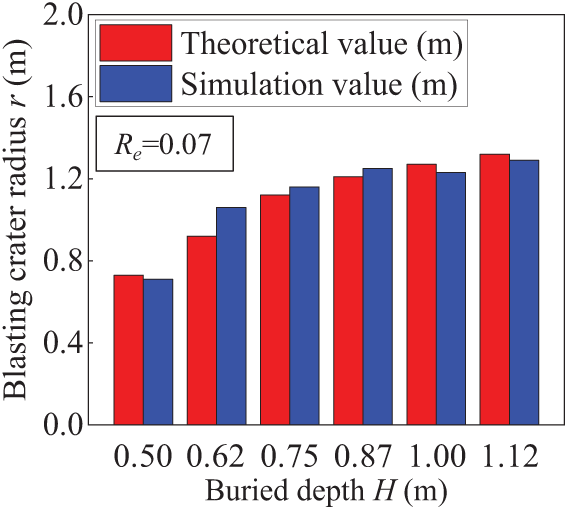
Figure 15: Comparison of theoretical and numerical simulation results
Re was determined to be 0.07 by calculating the root mean square error (Re) between the theoretical value and the numerical simulation results.
Fig. 15 illustrates that there is little difference between the theoretical value and the numerical simulation results, which can be used as an engineering reference within the allowable range.
5.1 Explosion Stress Wave Action and Crack Dynamic Propagation Mechanism
The variation of crack propagation in Fig. 6 shows that the formation of cracks is closely related to the propagation and reflection of explosion stress. The shock wave generated by explosive initiation acts on the rock mass near the explosion source, and the shock wave effect is greater than the compressive strength of the rock, destroying the rock mass structure near the explosion source. Therefore, the rock mass near the explosion source is crushed, and dense cracks are generated. In the process of rock mass crushing, the shock wave decays into the stress wave that continues to act on the rock mass, and the original cracks also continue to expand. The explosive gas generated by the explosion invades the cracks and continues to make the cracks through. The combined action of tangential tensile stress of stress wave and high temperatures and high-pressure gas makes the rock mass have edge cracks of blasting crater.
5.2 Different Explosive Burial Depths
5.2.1 Analysis of Crater Characteristics
The numerical simulation results under varying explosive burial depths are analyzed and organized to obtain the variation curves of the normalized blasting crater diameter ratio versus normalized explosive charge burial depth ratio, normalized blasting crater depth ratio versus normalized explosive charge burial depth ratio, and normalized blasting crater area ratio versus normalized explosive charge burial depth ratio. These results are presented in Fig. 16.
Figure 16: Calculation results of blasting crater under different explosive burial depths
Fig. 16a shows that the blasting crater depth ratio closely approximates the normalized explosive charge burial depth ratio. Similarly, Fig. 16b demonstrates that the normalized blasting crater area ratio progressively increases, with its growth rate transitioning from rapid to gradual. The following functional relationship can be derived through curve fitting of the aforementioned trends:
If the normalized blasting crater depth ratio is hi, the normalized blasting crater area ratio is Ai, and the normalized explosive charge burial depth ratio is Hi, the functional relationships between these parameters are established as follows:
where h is the depth of the blasting crater, A is the area of the blasting crater, and H is the buried depth of the explosive, H0 is 0.5 m.
The fitting function between hi and Hi:
The fitting function between Ai and Hi:
The mathematical function relationship between the above physical quantities is quantitatively analyzed by a function fitting curve, which can be used as a reference for studying the influence of explosive buried depth on the blasting effect.
5.2.2 Analysis of Fragmentation Characteristics
The proportion of broken blocks with particle sizes ranging from 0.01 to 0.1 m under different explosive burial depths is statistically quantified to analyze the relationship between the fragmentation gradation and the normalized explosive burial depth ratio. Then, the functional relationship between the proportion of this particle size range and the normalized explosive charge burial depth ratio is derived through curve fitting. In addition, by selecting the particle size corresponding to the 60% cumulative proportion in Fig. 9 as the research target, a curve describing the relationship between particle size and the normalized explosive charge burial depth ratio under this specific proportion is established, and the corresponding functional relationship is fitted. These results are illustrated in Fig. 17a,b.
Figure 17: Relationship between particle size and explosive burial depth
If the proportion of broken blocks with a particle size of 0.01 to 0.1 m in the whole is C, the relationship between them and the explosive charge burial depth ratio Hi can be fitted using the curve shown in Fig. 17 as follows:
Fig. 17a demonstrates that the proportion of fragmented blocks with particle sizes between 0.01 m and 0.1 m decreases progressively as the normalized explosive charge burial depth ratio increases. After When Hi < 1.2, the decline rate is significantly higher. However, for Hi > 1.2, the decline rate diminishes gradually, and the curve exhibits a flattening trend.
If the particle size corresponding to the 60% cumulative proportion in Fig. 10 is denoted as d, the normalized particle size ratio (di) is defined as di = d/H0, the relationship between the normalized particle size ratio di and the normalized explosive charge burial depth ratio Hi can be fitted based on the curve shown in Fig. 17b, which is as follows:
Fig. 17 indicates that the particle size accounting for 60% gradually expands with the increase of the normalized explosive charge burial depth ratio.
The relation between the velocity of the block and the normalized explosive charge burial depth ratio was obtained by recording the velocity of the broken blocks produced by the explosion, as shown in Fig. 18.
Figure 18: Velocity curves of broken blocks under different buried depths
The velocity of the fragmented blocks is denoted as V, and the normalized velocity ratio (Vi) is defined as Vi = V/V0, where V0 = 27.28 m/s. The relationship between the normalized velocity ratio Vi and the normalized explosive charge burial depth ratio (Hi) can be fitted using the curve illustrated in Fig. 18 as follows:
Fig. 18 exhibits that with the growth of the explosive charge burial depth ratio, the normalized velocity ratio of broken block produced by blasting shows a downward trend. The decline rate is fast at first, then slow, and gradually tends to be flat.
Figs. 9 and 18 exhibit that as the normalized explosive charge burial depth ratio increases, the particle size of fragmented rock post-blasting also increases, while the normalized velocity ratio of the ejected blocks progressively decreases. Analysis of this phenomenon reveals that a significant portion of the explosion energy is converted into the kinetic energy of the rock mass when Hi is relatively low (shallow burial conditions). Therefore, the rock undergoes more intensive fragmentation, resulting in smaller particle sizes. However, under such conditions, the blasting crater exhibits a reduced volume and shallower depth.
5.3 Different Explosive Package Radius
5.3.1 Analysis of Crater Characteristics
In order to accurately describe the depth and diameter of the blasting crater, as well as the relationship between the blasting crater area and explosive package mass. If the normalized crater diameter ratio is Di1, the normalized depth ratio is hi1, the normalized crater area ratio is Ai1, and the normalized charge radius ratio is ri, their functional relationships are established, as shown in Fig. 19.
where D1 is the diameter of the blasting crater, h1 is the depth, A1 is the area of the blasting crater, and r is the explosive package radius, r0 is 2 cm.
Figure 19: Characteristic parameters of blasting crater with different explosive packages
The fitting function for normalized crater area ratio Ai1 and normalized explosive charge radius ratio ri.
The fitting function for normalized crater diameter ratio Di1 and normalized explosive charge radius ratio ri.
The fitting function for normalized crater depth ratio hi1 and normalized explosive charge radius ratio ri.
The mathematical function relationship between the above physical quantities is quantitatively analyzed by a function fitting curve, which can be used as a reference for studying the influence of explosive package mass on the blasting effect.
Fig. 19a shows that when ri is expanded by 2 times, 3 times, 4 times, 5 times, and 6 times, respectively, Ai1 is extended by 1.71 times, 2.49 times, 2.91 times, 3.28 times, and 3.68 times individually; hi1 is increased by 1.12 times, 1.17 times, 1.29 times, 1.35 times and 1.50 times separately. Di1 is raised by 1.47 times, 2.20 times, 2.36 times, 2.67 times, and 3.32 times differently.
5.3.2 Analysis of Fragmentation Characteristics
The proportion of broken blocks with particle sizes of 0.01 to 0.1 m in the whole under different explosive package masses is counted to analyze the relationship between the fragmentation gradation and the explosive package mass. The functional relationship between the proportion of particle size range and normalized explosive charge radius ratio is fitted. At the same time, taking the particle size corresponding to 60% in Fig. 11 as the research object, the curve between the normalized particle size ratio and normalized explosive charge radius ratio under this proportion is established, and the function relationship is fitted. The results are shown in Fig. 20a,b.
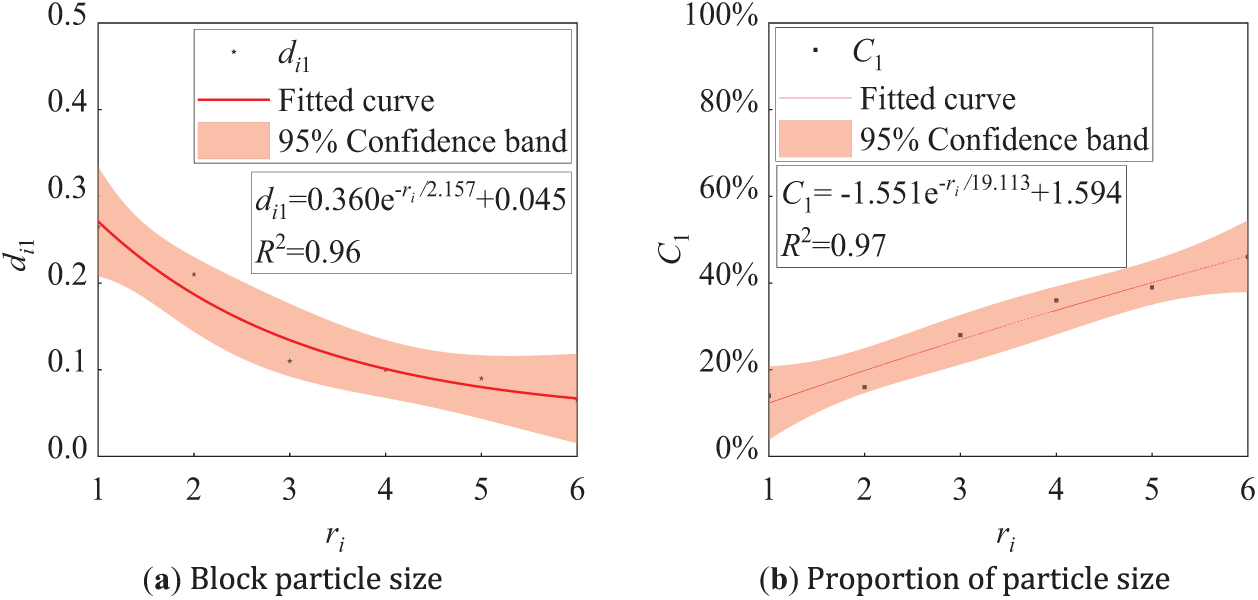
Figure 20: Particle size characteristics under different explosive package masses
The particle size corresponding to the proportion of 60% in Fig. 11 is described as d1. The normalized particle diameter ratio di1 (where di1 = d1/r0) and the normalized charge radius ratio ri can be fitted based on the curve shown in Fig. 20a, which is as Eq. (43).
Fig. 20 indicates that the particle size corresponding to the proportion of 60% gradually decreases with the increase of ri, and when ri is 2, 3, 4, 5, and 6, respectively, the particle size is 0.79 times, 0.42 times, 0.38 times, 0.34 times and 0.25 times of that when the ri is 1 individually.
The proportion of broken blocks with a particle size of 0.01 to 0.1 m in the whole is defined as C1. Based on the curve shown in Fig. 20b, the relationship between C1 and ri is as Eq. (44).
Fig. 20b shows that the proportion of broken blocks with a particle size of 0.01 to 0.1 m in the whole grows gradually with the rise of explosive package radius, and when ri is 2, 3, 4, 5, and 6, respectively, the proportion is 1.14 times, 2.00 times, 2.57 times, 2.79 times and 3.29 times of that when ri is 1 individually.
5.4 Limitations and Future Work
Although this study provides valuable insights into the formation and fragmentation characteristics of blasting craters using the CDEM method, several limitations remain. First, the numerical simulations were conducted in a two-dimensional framework, which can not fully capture the complex three-dimensional fracture and propagation behaviors occurring in actual blasting processes. Future studies should explore three-dimensional simulations to provide more comprehensive insights. Second, the material models used for rock and explosive behavior were simplified and based on idealized parameters; the heterogeneity of rock mass in field conditions can cause deviations from the simulated results. Third, the validation of the numerical model was based on a limited number of field tests. A broader range of experimental validations under varying geological conditions will further support the generalizability of the findings. Lastly, this study does not consider the influence of in-situ stresses, which can significantly affect stress wave propagation and fracture development. Incorporating in-situ stress effects in future models will enhance the applicability of the simulation outcomes in engineering practice.
This study explores the depth, diameter, area, and fragmentation gradation of the blasting crater under the condition of changing the explosive burial depth and the explosive package mass. The following conclusions can be drawn by comparing and analyzing the influence of different explosive burial depths on the effect of blasting craters:
(1) Under the single circular explosive package structure, the depth and area of the blasting crater increase with the growth of explosive burial depth and explosive package mass. When the explosive package mass extends, the diameter of the blasting crater also adds up. As the buried depth of the explosive grows, the diameter of the blasting crater increases first and then decreases.
(2) The fragmentation gradation of the blasting crater is obviously affected by the buried depth of explosives. Taking the proportion of broken blocks with a particle size of 0.01 to 0.1 m as the research object, it can be found that when the buried depth is 0.62, 0.75, 0.87, 1.0, and 1.12 m, respectively, the proportion is 0.45, 0.35, 0.23, 0.2 and 0.18 times that when the buried depth is 0.5 m, respectively. Considering the particle size corresponding to 60% as the research object, it can be found that when the buried depth is 0.62, 0.75, 0.87, 1.0, and 1.12 m, the corresponding particle size is 3.9, 5.5, 6.9, 9.0 and 11.4 times that when the buried depth is 0.5 m, respectively.
(3) The explosive package mass is also an important factor affecting the fragmentation gradation of the blasting crater. Taking the proportion of broken blocks with particle size of 0.01 to 0.1 m as the research object, it can be found that when the explosive package radius of 4, 6, 8, 10, and 12 cm, the proportion is 1.14, 2.00, 2.57, 2.79 and 3.29 times than with the explosive package radius of 2 cm; Taking the particle size corresponding to the proportion of 60% as the research object, as the explosive package radius is 4, 6, 8, 10, and 12 cm, it can be found that the particle size is 0.79, 0.42, 0.38, 0.34 and 0.25 times that when the explosive package radius is 2 cm.
This study provides some reference for studying the influence of explosive buried depth and explosive package mass on the effect of blasting craters.
Acknowledgement: The authors thank the National Natural Science Foundation of China, Natural Science Foundation of Hubei Province of China, Hubei Provincial Key Laboratory of Construction and Management in Hydropower Engineering, Natural Science Research of Jiangsu Higher Education Institutions of China, Educational Commission of Hubei Province of China and the Young Top-Notch Talent Cultivation Program of Hubei Province for supporting this study.
Funding Statement: This study is funded by the National Natural Science Foundation of China (Program Nos. 52379128, 52209162), Natural Science Foundation of Hubei Province of China (Program Nos. 2023AFA048, 2023AFB657), Hubei Provincial Key Laboratory of Construction and Management in Hydropower Engineering (Program Nos. 2023KSD03, 2023KSD04), Natural Science Research of Jiangsu Higher Education Institutions of China (Program No. 21KJB580001), Educational Commission of Hubei Province of China (Program No. T2020005), the Young Top-Notch Talent Cultivation Program of Hubei Province.
Author Contributions: The authors confirm contribution to the paper as follows: Draft manuscript preparation: Jingao Wu; Review the results and approve the final version of the manuscript: Yong Fan; Creation of images and tables: Zhendong Leng; Collection of research concepts and proofreading of article format: Guangdong Yang. All authors reviewed the results and approved the final version of the manuscript.
Availability of Data and Materials: All data generated or analyzed during this study are included in this published article.
Ethics Approval: Not applicable.
Conflicts of Interest: The authors declare no conflicts of interest to report regarding the present study.
References
1. Wang X, Liu C, Liu B, Zhang F, Cui S, Wang X, et al. Mechanism of formation of blasting craters and evolution of its characteristic parameters under in situ stress. Eng Geol. 2025;351:108028. doi:10.1016/j.enggeo.2025.108028. [Google Scholar] [CrossRef]
2. Jin XH, Sha Y, Wang R. Analysis on breakage from blasting crater of column charge. Water Resour Hydropower Eng. 2010;41(11):48–51. doi:10.13928/j.cnki.wrahe.2010.11.013 (In Chinese). [Google Scholar] [CrossRef]
3. Aubertin JD, Wimmer M, Sedghi M. Development of site specific blasting index parameters based on single hole blast test cratering. Min Technol Trans Inst Min Metall. 2023;132(4):253–66. doi:10.1080/25726668.2023.2219128. [Google Scholar] [CrossRef]
4. Lv XP, Lv FP, Li C, Wang HL. Experimental study on blasting funnel under cylindrical uncoupled charge. IOP Conf Ser Earth Environ Sci. 2020;474(4):042033. doi:10.1088/1755-1315/474/4/042033. [Google Scholar] [CrossRef]
5. Lu G, Fall M. Modelling blast wave propagation in a subsurfacegeotechnical structure made of an evolutive porous material. Mech Mater. 2017;108(4):21–39. doi:10.1016/j.mechmat.2017.03.003. [Google Scholar] [CrossRef]
6. Lu G, Fall M. Simulation of blast induced liquefaction susceptibility of subsurface fill mass. Geotech Geol Eng. 2018;36(3):1683–706. doi:10.1007/s10706-017-0423-5. [Google Scholar] [CrossRef]
7. Lu G, Fall M, Cui L. A multiphysics-viscoplastic cap model for simulating blast response of cemented tailings backfill. J Rock Mech Geotech Eng. 2017;9(3):551–64. doi:10.1016/j.jrmge.2017.03.005. [Google Scholar] [CrossRef]
8. Zhang XL, Yi HB, Ma HH, Shen ZW. Blast parameter optimization study based on a blast crater experiment. Shock Vib. 2018;2018(1):8031735. doi:10.1155/2018/8031735. [Google Scholar] [CrossRef]
9. Zhang YP, Luo Y, Wan SP, Tian YX, Ding HC, Zhang XX, et al. Influence of decoupled charge structure and filler on the blasting effect. Shock Vib. 2020;2020(1):8866449. doi:10.1155/2020/8866449. [Google Scholar] [CrossRef]
10. Pacheco-Vázquez F, Tacumá A, Marston JO. Craters produced by explosions in a granular medium. Phys Rev E. 2017;96(3):032904. doi:10.1103/PhysRevE.96.032904. [Google Scholar] [PubMed] [CrossRef]
11. Zulkifli Abu H, Aniza I, Norazman MN. Detonation effects of shallow buried explosive in sandy soil on target plate acceleration in a small-scale blast test. MATEC Web Conf. 2018;192(4):02028. doi:10.1051/matecconf/201819202028. [Google Scholar] [CrossRef]
12. Xu DW, Li W, Zhang K, Peng X, Qian XS. Experimental study on bench blasting crater with different lithology in an open pit. Nonferrous Met Eng. 2023;13(12):129–40. (In Chinese). [Google Scholar]
13. Li C, Chen Y, Yao Y, Gou Y, Wang Q, Guo J, et al. Field test and numerical research on explosion crater in calcareous sand. Sci Rep. 2024;14(1):25626. doi:10.1038/s41598-024-75737-y. [Google Scholar] [PubMed] [CrossRef]
14. Sugiyama Y, Izumo M, Ando H, Matsuo A. Two-dimensional explosion experiments examining the interaction between a blast wave and a sand hill. Shock Waves. 2018;28(3):627–30. doi:10.1007/s00193-018-0813-5. [Google Scholar] [CrossRef]
15. Zhou X, Bai C, Zhang Y, Wang Z. Inverse analysis of explosives based on crater size. Shock Waves. 2017;27(1):27–35. doi:10.1007/s00193-016-0643-2. [Google Scholar] [CrossRef]
16. Guan L, Zhang J, Li J, Ding Y, Wang Y, Lu Q. Ground deformation and blast wave propagation in dry sand subjected to buried explosion: a centrifuge modelling study. Int J Impact Eng. 2024;188(1):104935. doi:10.1016/j.ijimpeng.2024.104935. [Google Scholar] [CrossRef]
17. Tan Z, Zhang W, Cho C, Han X. Failure mechanisms of concrete slab-soil double-layer structure subjected to underground explosion. Shock Waves. 2014;24(5):545–51. doi:10.1007/s00193-014-0518-3. [Google Scholar] [CrossRef]
18. Huang X, Zhu B, Chen Y. A coupled and parallel peridynamics-SPH modeling and simulation of buried explosion induced soil fragmentation and cratering. Comput Geotech. 2025;178(1):106942. doi:10.1016/j.compgeo.2024.106942. [Google Scholar] [CrossRef]
19. An HM, Liu HY, Han H, Zheng X, Wang XG. Hybrid finite-discrete element modelling of dynamic fracture and resultant fragment casting and muck-piling by rock blast. Comput Geotech. 2017;81(3):322–45. doi:10.1016/j.compgeo.2016.09.007. [Google Scholar] [CrossRef]
20. Yan P, Zhou W, Lu W, Chen M, Zhou C. Simulation of bench blasting considering fragmentation size distribution. Int J Impact Eng. 2016;90(2):132–45. doi:10.1016/j.ijimpeng.2015.11.015. [Google Scholar] [CrossRef]
21. Kucewicz M, Łukasz M, Baranowski P, Małachowski J, Fuławka K, Mertuszka P, et al. Numerical modeling of blast-induced rock fragmentation in deep mining with 3D and 2D FEM method approaches. J Rock Mech Geotech Eng. 2024;16(11):4532–53. doi:10.1016/j.jrmge.2024.01.017. [Google Scholar] [CrossRef]
22. An L, Suorineni FT, Xu S, Li YH, Wang ZC. A feasibility study on confinement effect on blasting performance in narrow vein mining through numerical modelling. Int J Rock Mech Min Sci. 2018;112(4):84–94. doi:10.1016/j.ijrmms.2018.10.010. [Google Scholar] [CrossRef]
23. Zhang Z, Gao W, Li K, Li B. Numerical simulation of rock mass blasting using particle flow code and particle expansion loading algorithm. Simul Model Pract Theory. 2020;104(2):102119. doi:10.1016/j.simpat.2020.102119. [Google Scholar] [CrossRef]
24. Gao W, Zhang Z, Li B, Li K. Study on numerical simulation of geometric elements of blasting funnel based on PFC5.0. Shock Vib. 2021;2021(1):8812964. doi:10.1155/2021/8812964. [Google Scholar] [CrossRef]
25. Xu S, Wu P, Li Q, Zhou F, Chen B. Experimental investigation and numerical simulation on the blast resistance of reactive powder concrete subjected to blast by embedded explosive. Cem Concr Compos. 2021;119(2):103989. doi:10.1016/j.cemconcomp.2021.103989. [Google Scholar] [CrossRef]
26. Li XF, Li HB, Liu YQ, Zhou QC, Xia X. Numerical simulation of rock fragmentation mechanisms subject to wedge penetration for TBMs. Tunn Undergr Space Technol. 2016;53(44):96–108. doi:10.1016/j.tust.2015.12.010. [Google Scholar] [CrossRef]
27. Li X, Li XF, Zhang QB, Zhao J. A numerical study of spalling and related rockburst under dynamic disturbance using a particle-based numerical manifold method (PNMM). Tunn Undergr Space Technol. 2018;81:438–49. doi:10.1016/j.tust.2018.08.026. [Google Scholar] [CrossRef]
28. Tao J, Yang XG, Li HT, Zhou JW, Qi SC, Lu GD. Numerical investigation of blast-induced rock fragmentation. Comput Geotech. 2020;128(93):103846. doi:10.1016/j.compgeo.2020.103846. [Google Scholar] [CrossRef]
29. Wang Z, Wang H, Wang J, Tian N. Finite element analyses of constitutive models performance in the simulation of blast-induced rock cracks. Comput Geotech. 2021;135(10):104172. doi:10.1016/j.compgeo.2021.104172. [Google Scholar] [CrossRef]
30. Yi C, Johansson D, Nyberg U, Beyglou A. Stress wave interaction between two adjacent blast holes. Rock Mech Rock Eng. 2016;49(5):1803–12. doi:10.1007/s00603-015-0876-x. [Google Scholar] [CrossRef]
31. Yi C, Johansson D, Greberg J. Effects of in situ stresses on the fracturing of rock by blasting. Comput Geotech. 2018;104(1):321–30. doi:10.1016/j.compgeo.2017.12.004. [Google Scholar] [CrossRef]
32. Yi C, Sjöberg J, Johansson D. Numerical modelling for blast-induced fragmentation in sublevel caving mines. Tunn Undergr Space Technol. 2017;68:167–73. doi:10.1016/j.tust.2017.05.030. [Google Scholar] [CrossRef]
33. Fan H, Li S. A peridynamics-SPH modeling and simulation of blast fragmentation of soil under buried explosive loads. Comput Meth Appl Mech Eng. 2017;318(2):349–81. doi:10.1016/j.cma.2017.01.026. [Google Scholar] [CrossRef]
34. Fan H, Bergel GL, Li S. A hybrid peridynamics-SPH simulation of soil fragmentation by blast loads of buried explosive. Int J Impact Eng. 2016;87(11):14–27. doi:10.1016/j.ijimpeng.2015.08.006. [Google Scholar] [CrossRef]
35. Aubertin JD, Hashemi AS, Diederichs M, Hutchinson DJ. Elliptical blast cratering in low porosity soft rock due to emitted and reflected pressure waves interaction. Rock Mech Rock Eng. 2021;54(11):5517–32. doi:10.1007/s00603-021-02572-2. [Google Scholar] [CrossRef]
36. Han Z, Wang BL, Zhang ZC. Modeling of blast-induced craters by multi-material ALE method. Appl Mech Mater. 2013;368:771–4. doi:10.4028/www.scientific.net/amm.368-370.771. [Google Scholar] [CrossRef]
37. Yu R, Zhang Z, Gao W, Li C, Wu C. Numerical simulation of rock mass blasting vibration using particle flow code and particle expansion loading algorithm. Simul Model Pract Theory. 2023;122(2019):102686. doi:10.1016/j.simpat.2022.102686. [Google Scholar] [CrossRef]
38. Busch CL, Aimone-Martin CT, Tarefder RA. Experimental evaluation and finite-element simulations of explosive airblast tests on clay soils. Int J Geomech. 2016;16(4):04015097. doi:10.1061/(asce)gm.1943-5622.0000629. [Google Scholar] [CrossRef]
39. Zhang X, You S, Yang Y, Li J, Yang Z, Chen S, et al. Cut blasting optimization using 3D laser scanning and numerical simulation. Rock Mech Rock Eng. 2025;58(2):2549–68. doi:10.1007/s00603-024-04237-2. [Google Scholar] [CrossRef]
40. Jeon S, Kim TH, You KH. Characteristics of crater formation due to explosives blasting in rock mass. Geomech Eng. 2015;9(3):329–44. doi:10.12989/gae.2015.9.3.329. [Google Scholar] [CrossRef]
41. Yang J, Shi C, Yang W, Chen X, Zhang Y. Numerical simulation of column charge explosive in rock masses with particle flow code. Granul Matter. 2019;21(4):96. doi:10.1007/s10035-019-0950-2. [Google Scholar] [CrossRef]
42. Zong Q. Calculation of fracture radius of stress wave in rock explosion. Blasting. 1994;11(5):15–7. (In Chinese). [Google Scholar]
43. Feng C, Li SH, Zheng BX, Cui XR, Jia JJ. Numerical simulation on complete process of three-dimensional bench blasting in an open-pit mine based on CDEM. Explos Shock Waves. 2019;39(2):110–20. (In Chinese). [Google Scholar]
Cite This Article
 Copyright © 2025 The Author(s). Published by Tech Science Press.
This work is licensed under a Creative Commons Attribution 4.0 International License , which permits unrestricted use, distribution, and reproduction in any medium, provided the original work is properly cited.
 Downloads
 Citation Tools