
 Submit a Paper
 Propose a Special lssue
 Open Access
ARTICLE

Dynamic Response and Failure Analysis of Steel Sheet Pile Support Structures in Bank Slopes under Pile Driving Impact Loads
1 Faculty of Civil Engineering and Architecture, Anhui University of Science and Technology, Huainan, 232000, China
2 National Center for International Research on Deep Earth Drilling and Resource Development, Faculty of Engineering, China University of Geosciences (Wuhan), Wuhan, 430074, China
3 State Key Laboratory of Precision Blasting, Jianghan University, Wuhan, 430056, China
4 Faculty of Chemical and Blasting Engineering, Anhui University of Science and Technology, Huainan, 232000, China
* Corresponding Author: Ling Ji. Email:
Computer Modeling in Engineering & Sciences 2025, 144(1), 267-288. https://doi.org/10.32604/cmes.2025.066596
Received 12 April 2025; Accepted 02 July 2025; Issue published 31 July 2025
 View Full Text
 Download PDF
Abstract
During the construction of bank slopes involving pile driving, ensuring slope stability is crucial. This requires the design of appropriate support systems and a thorough evaluation of the failure mechanisms of pile structures under dynamic loading conditions. Based on the Huarong Coal Wharf project, various support schemes are analyzed using numerical simulation methods to calculate and compare slope stability coefficients. The optimal scheme is then identified. Under the selected support scheme, a numerical model of double-row suspended steel sheet piles is developed to investigate the dynamic response of the pile structures under pile driving loads. A time-history analysis is performed to assess the slope’s dynamic stability. The results show that the maximum displacements of the upper and lower steel sheet pile rows are 2.51 and 3.14 cm, respectively. The maximum principal stresses remain below 20 MPa in both rows, while the maximum von Mises stresses are 20.85 MPa for the upper row and 25.40 MPa for the lower row. The dominant frequencies of the steel sheet pile structures fall between 30 and 35 Hz, with a frequency bandwidth ranging from 0 to 500 Hz. The stability coefficient of the pile structures varies over time during the pile driving process, ultimately reaching a value of 1.26—exceeding the required safety threshold. This research provides practical guidance for designing support systems in wharf piling projects and offers a reliable basis for evaluating the safety performance of steel sheet piles in bank slopes.Keywords
With the growing demand for coal transportation, intermodal rail–water transport has become a widely adopted solution due to its convenience, efficiency, energy savings, and environmental benefits [1]. This mode of transport is especially advantageous for wharves, which serve as critical nodes in the logistics chain. Ensuring the stability of wharf bank slopes has emerged as a key scientific and engineering challenge [2–5]. Larssen steel sheet piles, renowned for their excellent waterproofing and earth-retaining performance, are widely used in wharf bank slope stabilization, foundation pit construction, and similar applications. Their advantages include low cost, ease of installation, and high safety [6,7]. In wharf bank slope projects, which are typically located adjacent to rivers, steel sheet piles are commonly installed along the riverbank to maintain slope stability during pile driving operations for wharf platform construction. However, the construction loads generated during pile driving on wharf platforms are directly transferred to the steel sheet piles, which may result in their deformation or even failure. Such structural issues pose considerable risks to the stability of the surrounding bank slopes. Therefore, it is essential to develop project-specific support schemes and perform comprehensive safety assessments of both the steel sheet pile structures and the bank slopes to effectively mitigate these risks.
Researchers have conducted extensive studies on the design of support schemes, the dynamic response of steel sheet piles, and the stability analysis of bank slopes. Ullah et al. [8] used a scaled physical model incorporating soil, steel sheet piles, foundations, and superstructures to experimentally investigate the dynamic response characteristics of steel sheet piles and their associated superstructures. Li et al. [9] studied the effects of tides on the stability and availability of seawall-supported steel sheet piles through a three-dimensional finite element model, determining the influence of water level, soil parameters, support stiffness, and construction sequence on the lateral deflection of steel sheet piles. Yuta et al. [10] experimentally investigated the effectiveness of using steel sheet piles to reinforce tsunami overflow embankment slopes and discussed the performance of steel sheet pile-reinforced embankments from the perspective of reducing tsunami energy. Peng et al. [11] studied the erosion, stress, and deformation characteristics of double-row steel sheet pile systems under varying wave heights through large-scale flume experiments. Niu et al. [12] examined the dynamic stability of rock slopes adjacent to small-span tunnels under seismic conditions using a combination of numerical simulations and indoor shake table experiments. Chen et al. [13] proposed a dynamic stability analysis method for rock slopes subjected to blasting vibrations, incorporating equivalent acceleration and limit equilibrium analysis while accounting for the time-history characteristics of dynamic loads. Shao et al. [14] studied the influence of pile platform stability on wharf bank slopes using the limit equilibrium and finite element methods, revealing that pile actions enhance slope safety coefficients. Wang et al. [15] applied limit analysis methods to evaluate the three-dimensional stability of composite soil slopes with dual inclinations. Li et al. [16] analyzed the effects of slope anchor support parameters on the overall support performance using finite element strength reduction techniques. He et al. [17] introduced the principles of the dynamic time-history analysis method, developed finite element models, and conducted a detailed analysis of the displacement and stress response of the Three Gorges Dam under seismic loading.
Previous studies have primarily focused on combining laboratory-scale model experiments with numerical simulations to investigate the dynamic response of steel sheet pile structures and the influence of seismic and tidal forces on slope stability. However, their practical application in specific engineering projects remains limited. Moreover, there are currently no regulatory guidelines addressing the protection of steel sheet pile support structures in bank slopes under the impact loads induced by pile driving. Therefore, it is both necessary and meaningful to conduct research on the dynamic stability of steel sheet pile structures and associated slopes under pile driving loads, particularly in the context of real-world engineering projects.
Based on the Huarong Coal Wharf project, safety coefficients for various support schemes are calculated using numerical simulation methods. Taking into account both construction conditions and cost-effectiveness, the optimal support scheme is identified. A dynamic finite element model is then developed using LS-DYNA software to simulate the selected scheme. In combination with field monitoring data, the study systematically investigates the dynamic response characteristics of steel sheet pile support structures subjected to impact loads from pile driving. Furthermore, a time-history analysis is conducted to assess the effect of pile driving loads on slope stability, generating time-history curves of slope safety coefficients throughout the construction process. The findings aim to provide valuable guidance for the design of support systems in wharf piling projects and support the safety assessment of steel sheet pile structures in bank slope engineering.
2 Engineering Background and Support Scheme Design
The project is situated on the right bank of the Yangtze River, where the wharf platform is designed as a high-pile beam-slab structure, measuring 461 m in length and 23 m in width. On the river-facing side, the front row consists of straight steel pipe piles with an outer diameter of 1200 mm and a wall thickness of 18 mm. On the bank-facing side, forked pile pairs are used, comprising prestressed high-strength concrete piles with a diameter of 1200 mm and a wall thickness of 150 mm, combined with steel pipe piles measuring 940 mm in diameter and 20 mm in wall thickness. These forked piles are installed at an inclination of 6:1. The pile foundations are embedded in fully weathered silty mudstone. The site’s topography includes both the riverbed and the first-level terrace of the Yangtze River. While the natural bank slope is relatively steep, the upper terrace is comparatively flat, with elevations ranging from approximately 30 to 32 m. To ensure construction success and maintain bank slope stability, steel sheet piles are adopted for slope protection. The relative layout of the wharf platform, excavation zones, and steel sheet piles is shown in Fig. 1.

Figure 1: Proposed excavation slope and steel sheet pile support
Based on the actual engineering parameters, an orthogonal experimental design method is employed to develop an optimized steel sheet pile support scheme. Four key factors are considered: the lengths of the front and rear steel sheet piles, the spacing between the piles, and the soil gravity in the front pile zone [18]. The detailed configuration of the four-factor, three-level experimental design is presented in Table 1.

(1) Numerical modeling of support schemes
To investigate the influence of double-row steel sheet pile parameters on slope stability and to identify an optimal support design, a numerical model of a representative slope cross-section is developed based on the construction site layout. In this study, the slope prototype is assumed to satisfy the plane strain condition. Comparative analyses show that both 2D and 3D approaches produce consistent results in evaluating overall slope stability. Given that the 2D method offers significantly higher computational efficiency without compromising accuracy, a two-dimensional numerical model is adopted for the global slope stability analysis.
Using the built-in FISH scripting language in the finite difference software FLAC3D, numerical models of two representative slope cross-section configurations for this project are developed, as shown in Fig. 2. The model dimensions are 65.2 m × 1 m × 32.7 m. The stratigraphy consists of silty clay, muddy silty clay, and fully weathered silty sandstone. Geotechnical parameters for each layer are derived from experimental data obtained through field investigations and laboratory testing of rock and soil samples. The densities of the three layers are 1900, 1900, and 2230 kg/m3, respectively, with corresponding elastic moduli of 11, 11, and 15 GPa, and Poisson’s ratios of 0.2, 0.2, and 0.22. The model incorporates FLAC3D’s embedded liner elements to simulate the bidirectional contact behavior between structural components and surrounding soil. These liner elements are used to represent the Larssen steel sheet piles [19]. To accurately simulate the interaction between the steel sheet piles and the surrounding soil, a separation surface is first defined at the contact interface between the liner elements and the soil. Double-sided liner elements are then applied along this surface. The mechanical behavior at the pile–soil interface is characterized using a Mohr-Coulomb contact model, which has been widely validated in geotechnical engineering applications [20,21]. Given the complex cross-sectional geometry of Larssen steel sheet piles, they are simplified into rectangular sections with equivalent flexural stiffness for computational efficiency. This simplification is achieved using methods such as the equivalent flexural section modulus approach [22–24]. According to Eq. (1), the equivalent height h is calculated to be 227 mm, which is then used as the thickness for the liner elements. The steel sheet piles are modeled with an elastic modulus of 205 GPa and a Poisson’s ratio of 0.3. This approach provides an effective balance between accurately capturing the mechanical behavior of the piles and ensuring computational efficiency.

Figure 2: Numerical model and boundary conditions
The numerical simulation adopts a pseudo-three-dimensional modeling approach under plane strain conditions, with displacement constrained in the vertical direction. Horizontal movement is effectively restricted along the left and right boundaries of the plane model, and no arbitrary movement occurs at the model’s bottom. Accordingly, horizontal displacements are constrained on both sides of the model, while all three directions (X, Y, and Z) are fixed at the bottom. The boundary conditions of the model are illustrated in Fig. 2.
(2) Support schemes comparison
In this study, the slope stability coefficient is calculated using the limit equilibrium method, implemented through the built-in FISH scripting language in FLAC3D software. The main procedures are as follows: 1) A numerical slope model is created using FLAC3D to analyze the stress field of the slope and obtain the element stress data. 2) The FISH language is then used to integrate the anti-sliding and sliding forces along the critical slip surface to compute the slope stability coefficient. The stability coefficients (Fst) for each scheme are presented in Table 2. For Grade I slope engineering, international standards such as Eurocode 7, FHWA (Federal Highway Administration) guidelines (USA), and BS 8006 require a safety factor of 1.30. In contrast, the Chinese slope safety standard (GB 50330-2013) [25] provides more detailed specifications for Grade I slopes under various working conditions, as shown in Table 3. Since the sheet pile support structures in this study are part of a temporary engineering project, the slope stability coefficient is set at 1.25. A comparison of the numerical results indicates that the steel sheet pile support design in Scheme 5 offers several advantages. First, the stability coefficient for Scheme 5 is 1.26, which exceeds the regulatory requirement, ensuring slope stability during construction. Second, with a double-row pile spacing of 5 m, the design meets the width requirements for the construction platform, providing adequate space for personnel and equipment movement. Additionally, Scheme 5 not only satisfies the slope safety requirements but also offers cost savings and a shorter construction timeline. For instance, compared to Scheme 6 and Scheme 7, Scheme 5 can save 6.4 million RMB and 210 thousand RMB, respectively. Considering factors such as slope stability, construction conditions, cost-effectiveness, and technical feasibility, the steel sheet pile support design in Scheme 5 is deemed optimal. The numerical simulation results for the displacement field, horizontal displacement, and maximum shear strain increment under this scheme are presented in Fig. 3.


Figure 3: Slope stability analysis after excavation
Based on the numerical simulation results, the displacement field after slope excavation is shown in Fig. 3a. The maximum deformation is observed at the base of the excavated slope, likely caused by the rebound of the excavated soil and the pushing effect from the rear slope. The rebound occurs due to the loss of constraint in the excavated soil, while the soil pressure from the rear slope exerts a pushing force on the surrounding soil, leading to significant displacement in this area. The maximum displacement in this zone is approximately 17 cm, with the displacement pattern indicating a deep-seated sliding tendency. Horizontal displacement is a key indicator of slope stability. As shown in Fig. 3b, the horizontal displacement reaches its maximum on the excavation side slope, with a peak value of around 10 cm. This horizontal sliding is most pronounced in the surface layer of the slope and decreases with depth. Overall, there is no distinct continuous surface of horizontal sliding. Although minor localized collapses may occur on the excavation side slope, the overall slope deformation remains effectively controlled.
Shear deformation failure is the most common form of slope instability. The maximum shear strain increment after excavation is shown in Fig. 3c. It is observed that shear deformation primarily occurs locally at the foot and bottom of the excavation side slope. In the deeper layers of the slope, a light-colored shear slip band forms along the lower end of the steel sheet piles. However, the shear strain increment in this region is relatively small, and the slip band is not clearly continuous, making overall sliding unlikely. The distribution of plastic zones after excavation is shown in Fig. 3d. The fully weathered silty mudstone remains predominantly in an elastic state, with the shear plastic zone largely confined to localized areas in the deeper layers of the slope. A tension plastic zone is present in the surface layer of the slope.
Fig. 4 illustrates the shear strain increment at the critical failure point of the cross-section. Two primary potential failure zones are identified: the excavation side slope and the deep-seated sliding zone. Localized collapses on the excavation side slope can be effectively managed, minimizing their impact on pile construction. Meanwhile, the deep-seated sliding zone remains confined within the boundaries of the model, indicating that its forward progression is successfully restrained by the steel sheet piles.

Figure 4: Maximum shear strain increment at critical failure
3 Numerical Modeling of Double-Row Steel Sheet Piles Supports under Pile Driving
The on-site construction follows the steel sheet pile support design parameters outlined in Scheme 5, utilizing a double-row steel sheet pile support system. The first row consists of 12-meter-long steel sheet piles, installed along the outer edge of the access road, while the second row features 18-meter-long steel sheet piles positioned 5 m from the first row along the riverbank. At the top outer edge of both rows, steel H20 beams are installed as waling beams. These beams are securely connected into a unified structure by welding 5# channel steel at 3 m intervals. The excavation outside the steel sheet piles slopes down to an elevation of 17.5 m to accommodate the draft requirements of the pile driving vessel. To assess the stability of the double-row steel sheet piles under the load exerted by the wharf platform pile driving and to evaluate potential damage to the structural integrity of the steel sheet piles, field vibration monitoring is conducted during the pile hammering process. The layout of the vibration testing points is shown in Fig. 5.
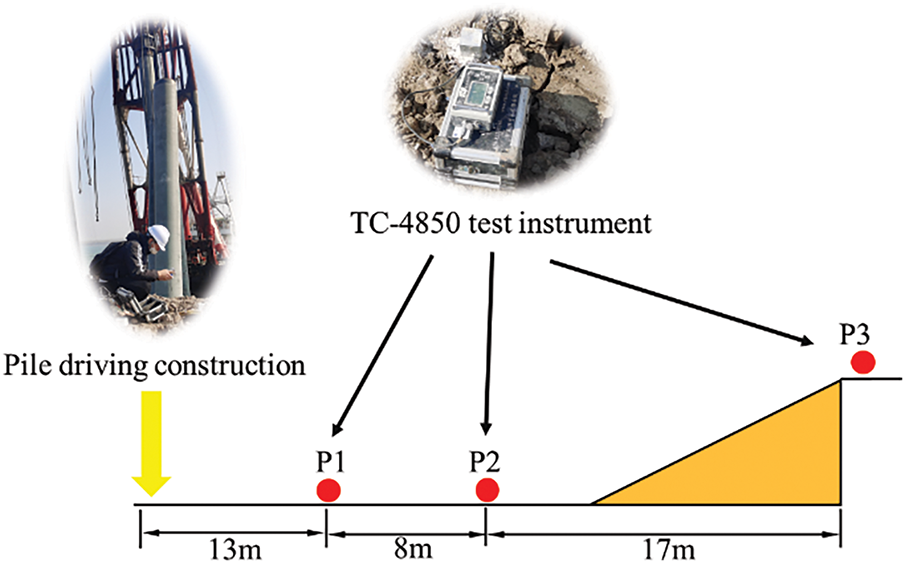
Figure 5: Layout of field vibration monitoring points
A total of 60 monitoring sessions were carried out, each recording the complete construction cycle of hammer-driven pile installation. Representative Peak Particle Velocity (PPV) data are presented in Table 4. The results indicate that PPV values progressively decrease as the monitoring points are located farther from the hammer impact location. Moreover, across all tests, the timing of PPV occurrences at the monitoring points remains highly consistent, with the corresponding number of hammer blows (N) being nearly identical.

3.2 Numerical Model of Double-Row Steel Sheet Pile Structures
To assess the stability of the monitored steel sheet piles under hammering operations, a numerical model is developed using the dynamic finite element software LS-DYNA to investigate their dynamic response characteristics under pile driving loads. The modeling is based on a typical cross-section of the project. A three-dimensional, full-scale (1:1) computational model of the bank slope is constructed using 8-node SOLID164 solid elements. The model dimensions are 65.2 m × 20.0 m × 32.7 m, comprising 3,134,322 elements generated through Lagrangian meshing. Automatic surface-to-surface contact definitions are applied between the steel sheet piles and the surrounding rock-soil layers. To replicate actual site conditions, the top surface of the model is treated as a free boundary, while all other boundaries are defined as non-reflecting. This setup effectively simulates wave propagation in an infinite or semi-infinite medium, thereby minimizing or eliminating artificial wave reflections at the model boundaries [26–28]. The dimensions of the numerical model and the boundary conditions are illustrated in Fig. 6.

Figure 6: Numerical calculation model
Quantifying the complex properties of rock and soil media remains a significant challenge, as no explicit mathematical formulations currently exist to describe them precisely. Therefore, in this study, the rock and soil media are modeled as continuous, isotropic, elastic-plastic materials. The rock is assumed to be fully weathered silty mudstone. To simulate its behavior, the *MAT_PLASTIC_KINEMATIC material model provided by LSTC is employed [29,30]. The specific formulation of this material model is given in Eq. (2).
where p and c are constants from the Cowper-Symonds strain rate model. β represents the hardening parameter. σy is the yield stress. σ0 is the initial yield stress. Ep denotes the plastic hardening modulus.
For the silty clay and muddy silty clay, the *MAT_DRUCKER_PRAGER [31,32] material model is used. This model is commonly applied to granular materials and incorporates options for simulating fracture and crushing. The parameters defined within the model include soil properties related to the yield surface, specifically the friction angle and viscosity coefficient.
The double-row steel sheet piles are influenced solely by soil pressure and pile driving force, with no thermal deformation involved. To model the material behavior of the steel sheet piles, a simplified Johnson-Cook model is employed. This model effectively captures the mechanical properties of the steel used in Larson steel sheet piles without requiring the definition of an equation of state. Consequently, the *MAT_SIMPLIFIED_JOHNSON_COOK material model is selected for both the Larson steel sheet piles and the metal connecting rods between them. The constitutive relationship for the Johnson-Cook model is expressed as:
where σ represents the flow stress. A is the static yield strength. B is the strain hardening modulus. C is the strain rate coefficient. n is the strain hardening exponent. εp is the equivalent plastic strain.
In the numerical simulation, selecting appropriate parameters for rock and soil materials is essential to ensure the accuracy and reliability of the simulated results. In this study, the parameters for rock and soil are primarily derived from field and laboratory tests conducted on slope samples. The parameters for the steel sheet piles are obtained from empirical formulas and established literature [11,12]. The initial specific mechanical parameters are listed in Table 5.

The process of driving a pile into the soil is a highly complex nonlinear dynamic problem, characterized by significant soil deformation. Accurately determining the force exerted by the pile on the soil during the driving process, whether through numerical calculations or experiments, remains a significant challenge. At present, hammer force curves are predominantly estimated using equivalent load methods. By integrating insights from existing literature with numerical simulation results [33–35], the hammer force curve is derived, as illustrated in Fig. 7.

Figure 7: Hammer loading force curve
3.5 Model Reliability Verification
To validate the model parameters and simulation reliability, a parameter sensitivity analysis is conducted by comparing field measured PPV with simulated PPV under various parameter combinations, ultimately identifying the optimal parameter set. In this manuscript, there are several important parameters used for the model including soil parameters (elastic modulus E, Poisson’s ratio μ, initial yield strength σ0), loading parameters (peak value P0, rising duration tr, total duration td) and boundary conditions (non-reflecting boundary, free boundary). Considering the monitoring points arranged on the silty clay layer, this study primarily conducts a sensitivity analysis on the material parameters of silty clay, while the material parameters of other soil layers and rock strata are estimated based on site investigation and design data. According to field survey and design documentation, the elastic modulus E of silty clay at this site ranges approximately from 8 to 15 MPa, Poisson’s ratio μ between 0.15 and 0.2, and yield strength σ0 between 12 and 19 MPa. For the sensitivity analysis, three values are selected for each parameter of the silty clay: E (8, 11, 15 MPa), μ (0.15, 0.18, 0.2), and σ0 (12, 15, 19 MPa). The load parameters are determined based on empirical formulas and relevant literature [33–35]. For the sensitivity analysis, three values are selected for each load-related parameter: peak load (6, 8, 10 MPa), rise time (263, 525, 788 μs), and total duration (1.35, 1.7, 2 ms).
The sensitivity analysis results are presented in Table 6. It is found that No. 2 demonstrates the smallest error between actual and simulated PPV values. The PPV waveforms at monitoring point P1 from the field test and numerical simulation of No. 2 shown in Fig. 8. Within the specified value ranges, variations in peak load significantly affect the PPV simulation results at monitoring points, while total load duration shows negligible influence. When the model boundary condition transitions from non-reflective to free boundary, the PPV waveform exhibits markedly increased oscillations. Furthermore, due to wave reflection at free boundaries, the peak PPV value at monitoring points becomes amplified. According to the simulated results, the parameters of No. 2 are chosen as the model parameters.

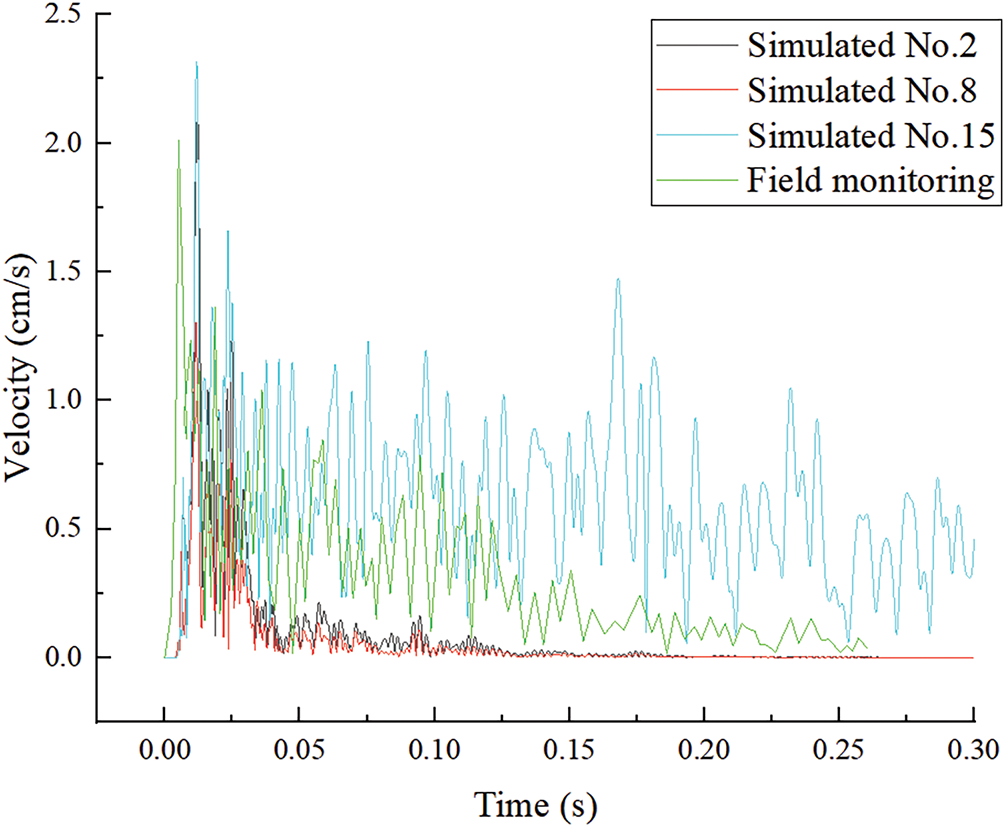
Figure 8: Vibration velocity comparison at monitoring point P1
The results from the three monitoring points (P1, P2, P3) in the numerical simulation are compared with the field monitoring data. This comparison serves as a reliability benchmark for subsequent numerical studies. Table 7 presents the comparison of peak vibration velocity between the numerical simulation results and field measurements at each monitoring point. The field monitoring PPVs are slightly lower than those obtained from the simulations, with a maximum relative error of 9.8% and a minimum of 7.7%. This difference can be attributed to the various structural discontinuities present in the rock, which affect the propagation and frequency attenuation of the blasting stress waves [36]. These discrepancies fall within a reasonable range, confirming the reliability of the model.

4 Dynamic Response and Failure Analysis of Steel Sheet Pile Structures
Under continuous hammering loads, the double-row steel sheet pile structures undergo displacement, which may affect the overall stability of the bank slope. Therefore, analyzing the displacement behavior of the support structures under such dynamic loading is essential [37]. In the numerical model, hammering loads are applied at the midpoint of the soil layer behind the unexcavated slope. Twenty displacement monitoring points are arranged along the horizontal direction for both the upper and lower rows of the double-row sheet pile structures, as illustrated in Fig. 9. The distribution of peak displacements is presented in Fig. 10. Results indicate that horizontal displacement variation is minimal, suggesting uniform deformation across the structures. Some monitoring points near the model boundaries exhibit noticeable differences due to boundary effects, in contrast to those near the center. The peak displacements at central locations in both rows are comparable, demonstrating the effectiveness of the rigid connection between the upper and lower rows in resisting deformation. The high elastic modulus of the steel sheet piles also contributes to their strong deformation resistance. The maximum displacement recorded in the lower row is 3.14 cm, and in the upper row, 2.51 cm-both well within the allowable deflection limits of 30 and 45 mm, respectively. Moreover, the rigid connection enhances the overall deflection capacity beyond the theoretical limits. These results confirm that, under the applied hammering loads, the double-row steel sheet pile structures remain structurally sound and perform safely within acceptable displacement limits.

Figure 9: Layout of displacement and stress measurement points

Figure 10: Peak displacement distribution of steel sheet pile structures
If the stress within a steel sheet pile exceeds its allowable limit, structural failure may occur, potentially compromising the stability of the entire bank slope system. Therefore, analyzing the dynamic stress response of the steel sheet pile is essential for understanding its overall dynamic behavior [38]. An evaluation of several monitoring points located at the midsection of the model reveals that the maximum principal stress in the steel sheet pile remains below 20 MPa. The stress values across these points show minimal variation and are substantially lower than the allowable stress limit of 218.52 MPa for Q239 steel, the material used for the piles. According to the maximum principal stress theory, the steel sheet pile structures remain intact throughout the pile driving process and is considered structurally safe. The maximum principal stress values at representative monitoring points are illustrated in Fig. 11.

Figure 11: Maximum principal stress at typical measuring points
When assessing the allowable stress in steel structures, reliance on maximum principal stress alone is insufficient. In numerical simulations, the von Mises stress is commonly employed to capture the combined effect of multiple principal stresses on the structural integrity of anisotropic materials. This comprehensive approach allows for a more accurate evaluation of the impact of dynamic loading on the stability of steel sheet pile structures by comparing both the maximum principal stress and the von Mises stress.
The von Mises stress accounts for stress components in all directions, offering a comprehensive measure of structural strength. Analyzing the maximum von Mises stress at each horizontal monitoring point provides a systematic understanding of the stress distribution within the structures. The monitoring points used for von Mises stress analysis correspond to the displacement monitoring points shown in Fig. 9, and the horizontal distribution of von Mises stress is illustrated in Fig. 12. Excluding outliers attributed to boundary effects (i.e., the first three and last three points), the von Mises stress is observed to increase as the monitoring points approach the vertical line connecting the hammering location and the steel sheet pile. The maximum von Mises stresses in the upper and lower rows of the steel sheet pile are 20.85 and 25.40 MPa, respectively—both significantly below the allowable stress limit of 218.52 MPa for Q239 steel. Based on the combined evaluation of maximum principal stress and von Mises stress, it can be concluded that the double-row steel sheet pile structures remain intact and operates safely within the allowable stress range under the impact of hammering loads.

Figure 12: Mises stress at the measurement points
In the context of slope-soil-pile system dynamics, time-frequency analysis plays a crucial role in optimizing dynamic slope protection design. Spectral analysis was conducted on vibration signals obtained from 20 monitoring points (Fig. 9) positioned along the upper and lower rows of steel sheet piles. Fig. 13 presents the vibration time histories for three representative monitoring points from each row. Using the Fast Fourier Transform (FFT) method, the vibration signals were processed to identify the dominant frequencies at each monitoring location. The corresponding dominant frequencies for all points are shown in Fig. 14. The results indicate that the dominant frequencies of the sheet piles fall within the range of 30–35 Hz. For the lower row, all monitoring points exhibit a consistent dominant frequency of 35 Hz, except for Point No. 1, which shows the lowest value at 30 Hz. In the upper row, monitoring Points No. 1 through No. 6 display a dominant frequency of 30 Hz, while Points No. 7 through No. 20 consistently register 35 Hz. According to relevant literature [39], the natural frequency of the steel sheet piles is 64 Hz. Therefore, under the current working conditions, resonance does not occur during pile hammering. To further illustrate the frequency characteristics, three representative monitoring points (No. 1, No. 10, and No. 20) were selected from each row for detailed spectral analysis. As shown in Fig. 15, the frequency spectra for all selected points span a bandwidth of 0–500 Hz.
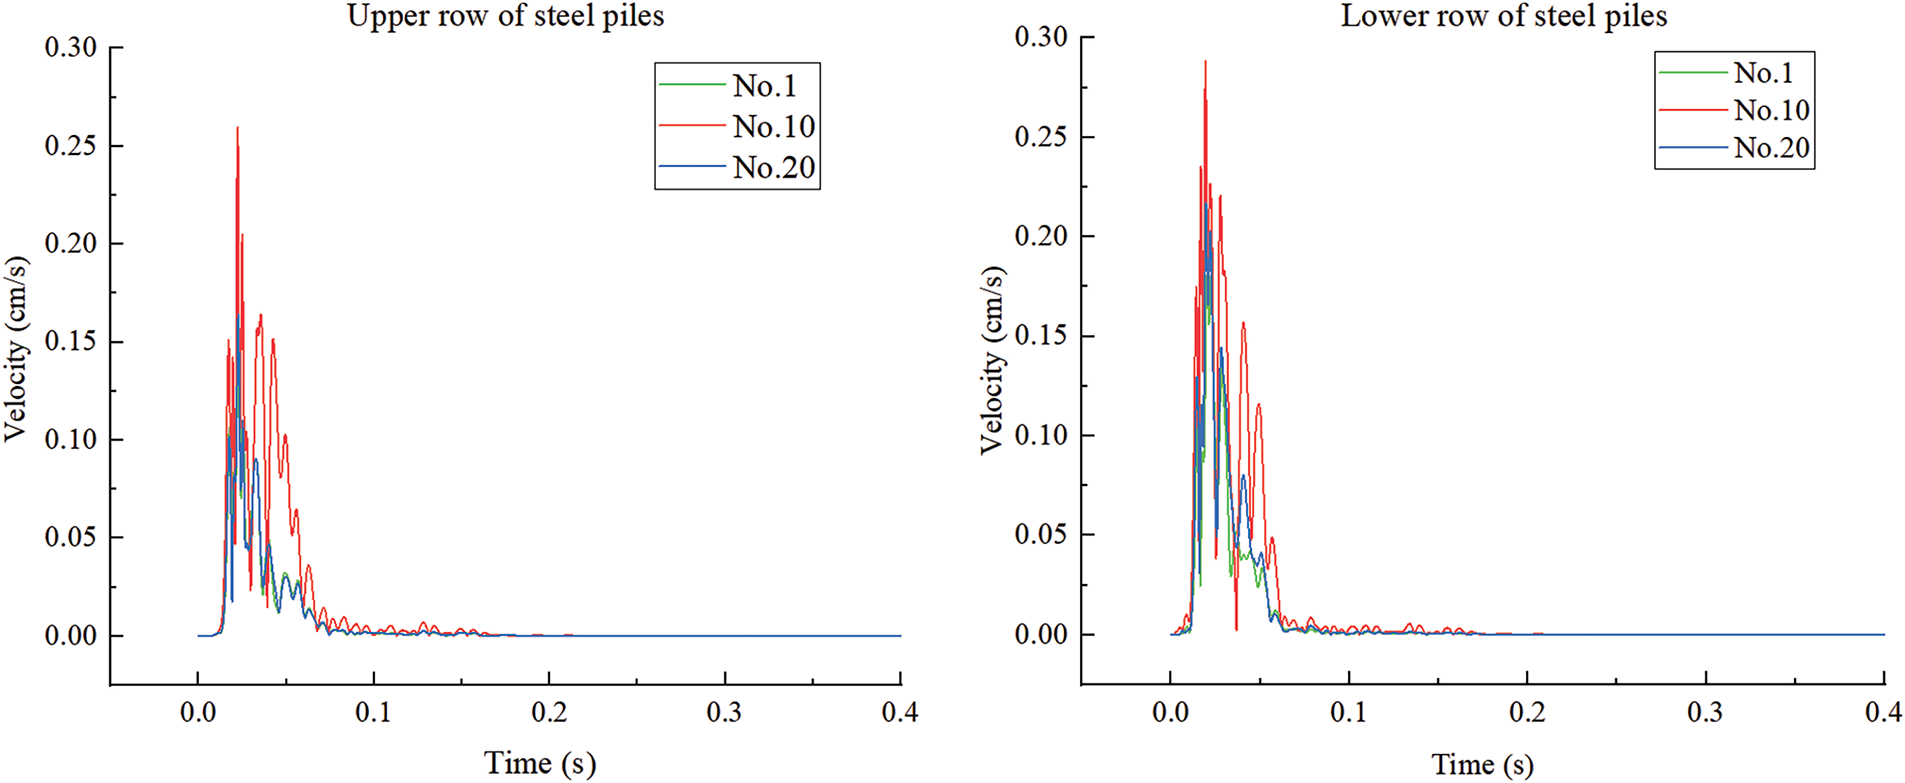
Figure 13: Vibration time histories curves of monitoring points

Figure 14: Main frequency of monitoring points

Figure 15: Frequency spectra of monitoring points
5 Dynamic Stability Assessment of Bank Slope
The time history analysis method is a robust technique for evaluating the stability of soil slopes subjected to seismic or other dynamic loads. By incorporating the dynamic response of the soil mass, this approach enables a more accurate prediction of slope behavior under such conditions [40,41]. As a result, it is particularly suitable for investigating the stability of bank slopes reinforced with steel sheet piles under the influence of pile driving loads.
The determination of the critical slip surface is one of the key steps in calculating the slope stability coefficient. The detailed steps include: 1) Determination of the slope’s limit state: Using the finite element numerical method, the strength parameters of the soil (e.g., internal friction angle and cohesion) are progressively reduced until the slope reaches its limit state. During this process, the stability coefficient of the slope gradually decreases until slope failure occurs. 2) Analysis of equivalent plastic strain contours: When the slope reaches its limit state, an equivalent plastic strain contour is generated. This contour reveals the location of the critical slip surface, with the region of maximum equivalent plastic strain typically identified as the slip surface. 3) Determination of the critical slip surface: By examining the equivalent plastic strain contour, the precise location of the critical slip surface can be determined. This location generally corresponds to the zone of concentrated plastic strain. According to the previous analysis, the potential sliding surface of the bank slope is identified, as shown in Fig. 4. The slope stability analysis is performed with LS-DYNA finite element software. The acceleration curve is applied to the model nodes, enabling the calculation of the stress on any element along the sliding surface under the dynamic pile driving loads at any given moment. The slope’s stability coefficient at each moment is determined using the limit equilibrium analysis algorithm. By incrementally advancing the time step in the calculations, the time history curve of slope stability coefficient throughout the vibration duration is derived.
5.1 The Calculation of Slope Stability Coefficient
The calculation method for slope stability using the limit equilibrium method is as follows [42,43]:
The stability coefficient of the bank slope is defined as the ratio of the resisting force to the sliding force:
where F is the stability coefficient of any element in the bank slope. τf is the ultimate shear strength. τ is the shear stress.
The relationship of the shear stress and normal stress on the sliding surface can be described by the Mohr-Coulomb criterion:
where c is the cohesion of the soil or rock mass. φ is the internal friction angle of the soil or rock mass. α is the angle between the tangent to the sliding surface and the x-axis. σx and σy are the radial forces. τxy is the tangential force.
By substituting Eqs. (6)~(7) into Eq. (5), the stability coefficient of the slope at a certain moment is obtained by integration:
The radial forces (σx and σy) and tangential force (τxy) under the vibration load of the pile hammer vary with time. By substituting these forces into Eq. (8) for the entire bank slope, a time history analysis can be performed to derive the time history curve of the slope stability coefficient.
5.2 Bank Slope Stability Assessment
The acceleration time history curve obtained from field vibration monitoring is shown in Fig. 16. Using LS-DYNA dynamic finite element software, the acceleration time-history curve is applied to the model nodes via the keyword *BOUNDARY_PRESCRIBED_MOTION_SET. The application positions are aligned as closely as possible with the locations of the field monitoring. Stress time history data for model elements are recorded at 500 μs intervals within the time range of 0 to 105 μs, with as many elements as possible selected from the potential sliding surface.
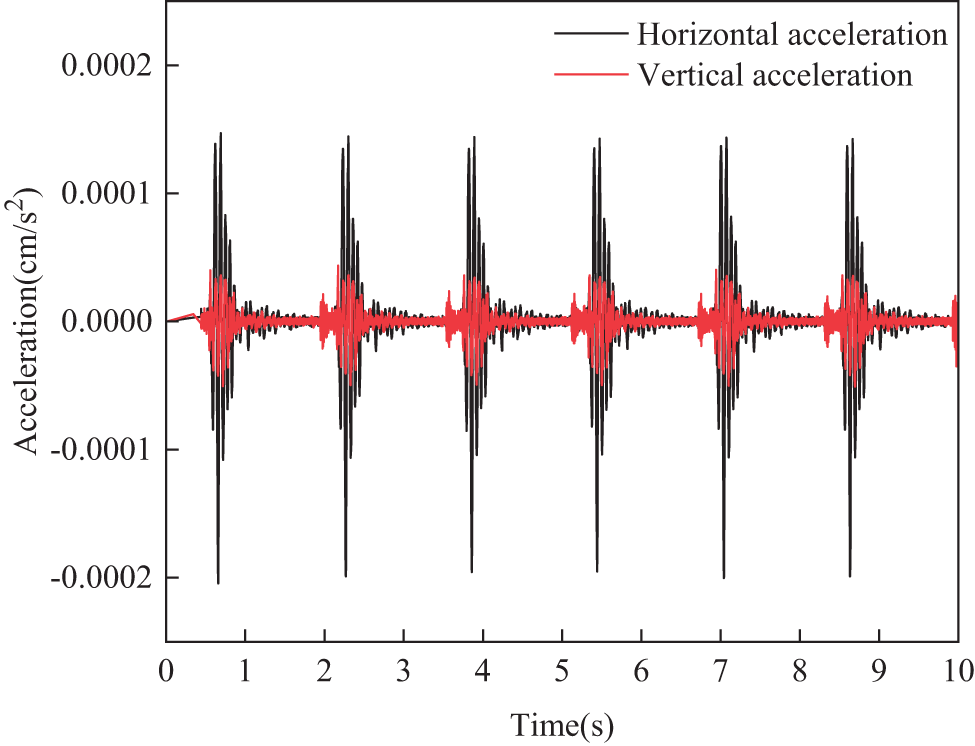
Figure 16: Acceleration-time curve
The stress components (σx, σy and τxy) obtained are substituted into Eq. (4) through (8) for calculation, resulting in the stability coefficient time history curve of the slope, as shown in Fig. 17. In the figure, the red line represents the static stability coefficient of the slope (1.26), and the black curve represents the dynamic stability coefficient of the slope. Under the vibration load from pile driving, the fluctuation pattern of the stability coefficient mirrors the acceleration time history curve. The stability coefficient reaches a maximum value of 2.887 at 7.02 s and a minimum value of 1.011 at 7.29 s. The stability coefficient decreases immediately upon receiving the vibration load, showing an initial decrease, followed by an increase, then another decrease within one oscillation cycle. Finally, it stabilizes with slight fluctuations around 1.26, indicating a relatively stable state. This indicates that although the vibration load from pile driving impacts the slope’s stability, the slope regains stability once the load dissipates.
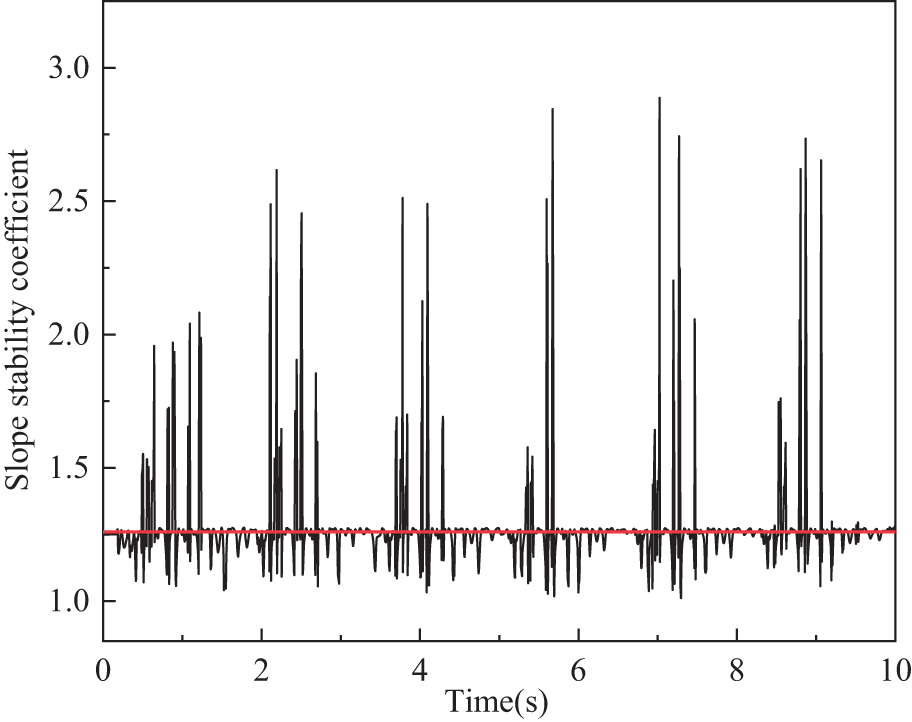
Figure 17: Bank slope stability coefficient
According to the safety evaluation criteria for slope stability outlined in the Technical Code for Building Slope Engineering, the stability coefficient Fst for temporary slope engineering with a safety level of Grade I is 1.25. Based on the above analysis, the slope stability coefficient FE obtained from this time history analysis exceeds Fst. Therefore, it can be concluded that the slope remains in a stable condition.
This paper investigates the design of steel sheet pile support schemes of a bank slope, the dynamic response of steel sheet pile structures, and slope stability under pile driving loads, using a combined approach of numerical simulation and field monitoring. The main conclusions are as follows:
(1) The optimal support scheme for this project consists of using 12 m steel sheet piles for the first (upper) row and 18 m piles for the second (lower) row, with a spacing of 5 m between them. Under this configuration, when a critical failure occurs in the cross-section, the front end of the potential sliding zone is effectively intercepted by the steel sheet piles, thereby preventing deep-seated sliding without pile penetration. A comparison between the combined vibration velocity results obtained from field monitoring and numerical simulation reveals a maximum relative error of 9.8% and a minimum of 7.7%, demonstrating good agreement. These results validate the reliability and accuracy of the numerical model and its associated parameters.
(2) The relative position between the displacement deformation of the steel sheet piles and the hammer impact point shows minimal significance. The maximum displacement in the lower-row sheet piles is 3.14 cm, while the upper-row sheet pile experiences a maximum displacement of 2.51 cm. The displacement deformations of the double-row sheet pile structure remain within the allowable deflection limits and are well within the safe range.
(3) The maximum principal stress in the double-row steel sheet pile structures is not significantly influenced by its relative position to the hammer impact point. The maximum principal stress for both the upper- and lower-row sheet piles remains below 20 MPa. The maximum von Mises stress occurs at the point where the sheet piles intersect with the vertical line passing through the impact point. For the upper-row sheet piles, the maximum von Mises stress is 20.85 MPa, and for the lower-row sheet piles, it is 25.40 MPa—both well below the maximum allowable stress of 218.52 MPa for Q239 steel. The steel sheet pile structures remain intact and have not experienced any failure.
(4) The dominant frequencies of the steel sheet pile structures range from 30 to 35 Hz, indicating that no resonance phenomenon occurs in the piles during hammering. Based on the spectral analysis results, the frequency bandwidth of the steel sheet pile structures spans from 0 to 500 Hz.
(5) During pile driving construction, the fluctuation pattern of the slope stability coefficient aligns with the acceleration time history curve. In a single oscillation cycle, the coefficient initially decreases, then increases, and decreases again. The final stability coefficient is 1.26, exceeding the safety coefficient of the temporary slope required in the Chinese slope safety standard (GB 50330-2013). It proves that the slope is in a safe state according to the standard.
It is should be pointed out that the geometric shape of steel sheet piles is simplified when calculating the stability coefficient of sheet pile support systems in this study. While such simplification in real-world conditions may significantly affect the bending stiffness distribution and stress wave propagation paths of the piles, computational cost considerations necessitated this approach—modeling the actual pile geometry would substantially increase computation time. This study adopts an equivalent stiffness assumption for the steel sheet piles, which may obscure the inertial effects and damping characteristics of the piles under dynamic loading, potentially leading to deviations in resonant frequency predictions. In the future, we will potentially involve higher-fidelity local modeling or experimental validation. The global model developed in this study and its results provide a fundamental basis for such specialized assessments in subsequent research.
Acknowledgement: None.
Funding Statement: This study was sponsored by Natural Science Research Project of Anhui Educational Committee (Grant No. 2022AH050810), National Natural Science Foundation of China (Grant Nos. 42402276, 41972286, 42072309, 42102329), State Key Laboratory of Precision Blasting and Hubei Key Laboratory of Blasting Engineering, Jianghan University (No. PBSKL2023A1), and the Open Fund of National Center for International Research on Deep Earth Drilling and Resource Development (No. DEDRD-2023-02).
Author Contributions: The authors confirm contribution to the paper as follows: Investigation, Methodology, Software, Writing—original draft, Ling Ji; Data curation, Methodology, Supervision, Writing—review & editing, Nan Jiang; Software, Writing—review & editing, Validation, Yingbo Ren; Data curation, Supervision, Tao Yin; Supervision, Writing—review & editing, Haibo Wang; Validation, Writing—review & editing, Bing Cheng. All authors reviewed the results and approved the final version of the manuscript.
Availability of Data and Materials: All data generated or analyzed during this study are included in this published article.
Ethics Approval: Not applicable.
Conflicts of Interest: The authors declare no conflicts of interest to report regarding the present study.
References
1. Moscoloni C, Kwon YW, Didoszak JM, Mattiazzo G. Dynamic response of tube containing water subjected to impact loading. Multis Multidiscip Model, Exper Des. 2019;2(4):281–90. doi:10.1007/s41939-019-00054-1. [Google Scholar] [CrossRef]
2. Bushira KM, Gebregiorgis YB, Verma RK, Sheng Z. Cut soil slope stability analysis along National Highway at Wozeka-Gidole Road, Ethiopia. Model Earth Syst Environ. 2018;4(2):591–600. doi:10.1007/s40808-018-0465-6. [Google Scholar] [CrossRef]
3. Ciotlaus M, Kollo G, Moldovan D, Muntean LE. Slope stability of railway embankments. Procedia Eng. 2017;181:52–9. doi:10.1016/j.proeng.2017.02.362. [Google Scholar] [CrossRef]
4. Gupta G, Sharma SK, Singh GSP, Kishore N. Numerical modelling-based stability analysis of waste dump slope structures in open-pit mines–a review. J Institut Eng (IndiaSer D. 2021;102(2):589–601. doi:10.1007/s40033-021-00277-y. [Google Scholar] [CrossRef]
5. Saeed MS, Maarefvand P, Yaaghubi E. Two and three-dimensional slope stability analyses of final wall for Miduk mine. Int J Geo Eng. 2015;6(1):9. doi:10.1186/s40703-015-0009-0. [Google Scholar] [CrossRef]
6. Chad AM. The use of steel sheet pile as permanent building foundation walls: lessons learned over 15 years of design in minneapolis, Minnesota, USA. In: Geo-Congress 2020: University of Minnesota 68th Annual Geotechnical Engineering Conference; Reston, VA, USA: ASCE; 2020. p. 68–77. doi:10.1061/9780784482841.005. [Google Scholar] [CrossRef]
7. Yang Y, Liu WF, Hu AP, Li F, Yang ZQ. Application of steel sheet pile in deep foundation pit support of collapsible loess regions. IOP Conf Ser Earth Sci. 2020;474(7):072088. doi:10.1088/1755-1315/474/7/072088. [Google Scholar] [CrossRef]
8. Ullah MS, Kajiwara K, Goit CS, Saitoh M. Frequency and intensity dependent dynamic responses of soil-steel pipe sheet pile (SPSP) foundation-superstructure system. Soil Dyn Earthq Eng. 2019;125(2):105730. doi:10.1016/j.soildyn.2019.105730. [Google Scholar] [CrossRef]
9. Li P, Sun XF, Chen JJ, Shi JW. Effects of new construction technology on performance of ultralong steel sheet pile cofferdams under tidal action. Geomech Eng. 2021;27(6):561–71. doi:10.12989/gae.2021.27.6.561. [Google Scholar] [CrossRef]
10. Yuta M, Mohammad BA, Min R, Hitoshi T, Kazutaka O, Tatsuaki K. Experimental study on embankment reinforcement by steel sheet pile structure against Tsunami overflow. Coast Eng J. 2016;58(4):1640018. doi:10.1142/S0578563416400180. [Google Scholar] [CrossRef]
11. Peng M, Liang YY, Zhu Y, Jiang QL, Liu NW. Experimental study on stability of coastal levee with double-row steel sheet piles under extreme storm surge. In: Geo-Extreme 2021: Case Histories and Best Practices; Reston, VA, USA: ASCE; 2021. p. 425–34. doi:10.1061/9780784483688.042. [Google Scholar] [CrossRef]
12. Niu JY, Jiang XL, Wang FF. Stability analysis of rock slope with small spacing tunnel under earthquakes and influence of ground motion parameters. Geotech Geol Eng. 2018;36(4):2437–53. doi:10.1007/s10706-018-0475-1. [Google Scholar] [CrossRef]
13. Chen M, Lu WB, Yan P, Zhou CB. New method for dynamic stability analysis of rock slope under blasting vibration based on equivalent acceleration and Sarma method. Can Geotech J. 2013;51(4):441–8. doi:10.1139/cgj-2012-0475. [Google Scholar] [CrossRef]
14. Shao GT, Tang D, Tan DY, Liu ZZ, Zhu YJ. Effect analysis of steel sheet pile supporting for utility tunnel foundation pit in water-rich soft soil. Adv Civil Eng. 2023;2023(1):9989345. doi:10.1155/2023/9989345. [Google Scholar] [CrossRef]
15. Wang L, Sun DA, Li L. Three-dimensional stability of compound slope using limit analysis method. Can Geotech J. 2019;56(1):116–25. doi:10.1139/cgj-2017-0345. [Google Scholar] [CrossRef]
16. Li HL, Zhang ZQ, Yang W. Stability analysis of slope based on limit equilibrium method and strength reduction method. Int Inform Eng Technol Associat. 2021;45(5):379–84. doi:10.18280/acsm.450503. [Google Scholar] [CrossRef]
17. He YX, Qiang Y, Li L. Research on the dynamic response of dam under rare earthquake through dynamic time history analysis method. Adv Indust Civil Eng. 2012;594–597:1640–4. doi:10.4028/www.scientific.net/AMR.594-597.1640. [Google Scholar] [CrossRef]
18. Huang AP, Ye SH. Sensitivity analysis of stability factors of filling slopes strengthened by frame anchor plates based on orthogonal experimental design. Soil Mech Found Eng. 2023;60(4):330–9. doi:10.1007/s11204-023-09898-9. [Google Scholar] [CrossRef]
19. He JX, He SH, Liu XB, Ma JF, Li YM, Zhang B. Investigating the mechanical responses and construction optimization for shallow super-large span tunnels in weathered tuff stratum based on field monitoring and Flac3D modeling. Int J Civil Eng. 2024;22(3):379–95. doi:10.1007/s40999-023-00891-9. [Google Scholar] [CrossRef]
20. Nde NM, Fokwa D, Mbessa M, Tamo T, Pettang C. Numerical study of the interaction between a reinforced concrete pile and soil. Open J Civil Eng. 2020;10(3):259–69. doi:10.4236/ojce.2020.103022. [Google Scholar] [CrossRef]
21. Jalali MM, Golmaei SH, Jalali MR, Borthwick AGL, Ahmadi MKZ, Moradi R. Using finite element method for pile-soil interface (through PLAXIS and ANSYS). J Civ Eng Constr Technol. 2012;3(10):256–72. doi:10.5897/JCECT12.024. [Google Scholar] [CrossRef]
22. Babu GLS, Basha BM. Optimum design of cantilever sheet pile walls in sandy soils using inverse reliability approach. Comput Geotech. 2008;35(2):134–43. doi:10.1016/j.compgeo.2007.04.001. [Google Scholar] [CrossRef]
23. He XT, Chen SL, Sun JY. Applying the equivalent section method to solve beam subjected to lateral force and bending-compression column with different moduli. Int J Mech Sci. 2007;49(7):919–24. doi:10.1016/j.ijmecsci.2006.11.004. [Google Scholar] [CrossRef]
24. Nourmohammadi N, O’Dowd NP, Weaver PM. Effective bending modulus of thin ply fibre composites with uniform fibre spacing. Int J Solids Struct. 2020;196–197(3):26–40. doi:10.1016/j.ijsolstr.2020.04.004. [Google Scholar] [CrossRef]
25. Technical code for building slope engineering GB 50330-2013. Beijing, China: China Architecture & Building Press; 2014. [Google Scholar]
26. Bao X, Liu JB, Li ST, Wang F. A new viscoelastic artificial boundary with improved numerical stability in explicit calculation of wave propagation problems in infinite domains. Comput Geotech. 2022;145(2):104698. doi:10.1016/j.compgeo.2022.104698. [Google Scholar] [CrossRef]
27. Haider A, Song EX, Li P. Numerical simulation and absorbing boundary conditions for wave propagation in a semi-infinite media with a linear isotropic hardening plastic model. Soil Dyn Earthq Eng. 2019;125(9):105627. doi:10.1016/j.soildyn.2019.04.001. [Google Scholar] [CrossRef]
28. Lyu GP, Zhou CB, Jiang N. Experimental and numerical study on tunnel blasting induced damage characteristics of grouted surrounding rock in fault zones. Rock Mech Rock Eng. 2023;56(1):603–17. doi:10.1007/s00603-022-03055-8. [Google Scholar] [CrossRef]
29. Jiang N, Gao T, Zhou CB, Luo XD. Effect of excavation blasting vibration on adjacent buried gas pipeline in a metro tunnel. Tunnelling Undergr Space Technol. 2018;81(3):590–601. doi:10.1016/j.tust.2018.08.022. [Google Scholar] [CrossRef]
30. Zhao K, Jiang N, Zhou CB, Li HB, Cai ZW, Zhu B. Dynamic behavior and failure of buried gas pipeline considering the pipe connection form subjected to blasting seismic waves. Thin-Walled Struct. 2022;170(2):108495. doi:10.1016/j.tws.2021.108495. [Google Scholar] [CrossRef]
31. Anandarajah A. The drucker-prager model and its integration. In: Computational methods in elasticity and plasticity. New York, NY, USA: Springer; 2021. p. 513–60. doi:10.1007/978-1-4419-6379-6_13. [Google Scholar] [CrossRef]
32. Alejano LR, Bobet A. Drucker-prager criterion. Rock Mech Rock Eng. 2012;45(6):995–9. doi:10.1007/s00603-012-0278-2. [Google Scholar] [CrossRef]
33. Alwalan MF, El Naggar MH. Analytical models of impact force-time response generated from high strain dynamic load test on driven and helical piles. Comput Geotech. 2020;128(1):103834. doi:10.1016/j.compgeo.2020.103834. [Google Scholar] [CrossRef]
34. Qu H, Huo JS, Xu C, Fu F. Numerical studies on dynamic behavior of tubular T-joint subjected to impact loading. Int J Impact Eng. 2014;67(2):12–26. doi:10.1016/j.ijimpeng.2014.01.002. [Google Scholar] [CrossRef]
35. Xu N, Liu YH, Kang YQ, Fu XY, Zhao KJ. Impact force curve feature and failure mode identification method of concrete-filled steel tube members under lateral impact. Constr Build Mater. 2024;421(5):135724. doi:10.1016/j.conbuildmat.2024.135724. [Google Scholar] [CrossRef]
36. Zhao BW, Jiang N, Zhou CB, Yao YK, Zhou WB, Cai ZW. Safety assessment for a ballast railway induced by underground subway tunnel blasting: a case study. Int J Protective Struct. 2024;15(1):166–91. doi:10.1177/20414196221150661. [Google Scholar] [CrossRef]
37. Caputo G, Conti VR, Viggiani GMB, Prum C. Improved method for the seismic design of anchored steel sheet pile walls. J Geotech Geoenviron Eng. 2021;2021(2):147. doi:10.1061/(ASCE)GT.1943-5606.0002429. [Google Scholar] [CrossRef]
38. Yi F, Su J, Zheng G, Cheng XS, Zhang JT, Lei YW. Overturning progressive collapse mechanism and control methods of excavations retained by cantilever piles. Eng Fail Anal. 2022;140(1):106591. doi:10.1016/j.engfailanal.2022.106591. [Google Scholar] [CrossRef]
39. Sakhiah AK, Kunitomo S, Yasuo S. Vibration test on existing steel sheet pile. IOP Conf Ser: Mater Sci Eng. 2020;713(1):012033. doi:10.1088/1757-899X/713/1/012033. [Google Scholar] [CrossRef]
40. Jibson RW. Methods for assessing the stability of slopes during earthquakes—a retrospective. Eng Geol. 2011;122(1–2):43–50. doi:10.1016/j.enggeo.2010.09.017. [Google Scholar] [CrossRef]
41. Zhao T, Sun JZ, Zhang B, Li C. Analysis of slope stability with dynamic overloading from earthquake. J Earth Sci. 2012;23(3):285–96. doi:10.1007/s12583-012-0257-2. [Google Scholar] [CrossRef]
42. Aryanti DE, Eveny ON, Tulus A, Saptono S. Slope stability analysis in Lusi River, Kedungrejo using limit equlibrium method. IOP Conf Ser: Earth Environ Sci 2018;212(1):012034. doi:10.1088/1755-1315/212/1/012034. [Google Scholar] [CrossRef]
43. Babanouri N, Dehghani H. Investigating a potential reservoir landslide and suggesting its treatment using limit-equilibrium and numerical methods. J Mt Sci. 2017;14(3):432–41. doi:10.1007/s11629-016-3898-2. [Google Scholar] [CrossRef]
Cite This Article
 Copyright © 2025 The Author(s). Published by Tech Science Press.
This work is licensed under a Creative Commons Attribution 4.0 International License , which permits unrestricted use, distribution, and reproduction in any medium, provided the original work is properly cited.
 Downloads
 Citation Tools