
 Submit a Paper
 Propose a Special lssue
 Open Access
ARTICLE

Influence of Fractal Dimension on Gas-Driven Two-Phase Flow in Fractal Porous Media: A VOF Model-Based Simulation
State Key Laboratory of Intelligent Construction and Healthy Operation and Maintenance of Deep Underground Engineering, China University of Mining and Technology, Xuzhou, 221116, China
* Corresponding Author: Richeng Liu. Email:
Computer Modeling in Engineering & Sciences 2025, 144(1), 289-307. https://doi.org/10.32604/cmes.2025.066716
Received 15 April 2025; Accepted 30 June 2025; Issue published 31 July 2025
 View Full Text
 Download PDF
Abstract
Gas-liquid two-phase flow in fractal porous media is pivotal for engineering applications, yet it remains challenging to be accurately characterized due to complex microstructure-flow interactions. This study establishes a pore-scale numerical framework integrating Monte Carlo-generated fractal porous media with Volume of Fluid (VOF) simulations to unravel the coupling among pore distribution characterized by fractal dimension (Df), flow dynamics, and displacement efficiency. A pore-scale model based on the computed tomography (CT) microstructure of Berea sandstone is established, and the simulation results are compared with experimental data. Good agreement is found in phase distribution, breakthrough behavior, and flow path morphology, confirming the reliability of the numerical simulation method. Ten fractal porous media models with Df ranging from 1.25~1.7 were constructed using a Monte-Carlo approach. The gas-liquid two-phase flow dynamics was characterized using the VOF solver across gas injection rates of 0.05–5 m/s, in which the time-resolved two-phase distribution patterns were systematically recorded. The results reveal that smaller fractal dimensions (Df = 1.25~1.45) accelerate fingering breakthrough (peak velocity is 1.73 m/s at Df = 1.45) due to a bimodal pore size distribution dominated by narrow channels. Increasing Df amplifies vorticity generation by about 3 times (eddy viscosity is 0.033 Pa·s at Df = 1.7) through reduced interfacial curvature, while tortuosity-driven pressure differentials transition from sharp increases (0.4~6.3 Pa at Df = 1.25~1.3) to inertial plateaus (4.8 Pa at Df = 1.7). A nonlinear increase in equilibrium gas volume fraction (fav = 0.692 at Df = 1.7) emerges from residual gas saturation and turbulence-enhanced dispersion. This behavior is further modulated by flow velocity, with fav peaking at 0.72 under capillary-dominated conditions (0.05 m/s), but decreasing to 0.65 in the inertial regime (0.5 m/s). The work quantitatively links fractal topology to multiphase flow regimes, demonstrating the critical role of Df in governing preferential pathways, energy dissipation, and phase distribution.Keywords
Gas-liquid two-phase flow in porous media is widely encountered in various engineering applications, including oil and gas recovery, geological CO2 sequestration, and groundwater contamination remediation [1–4]. The pore structure of natural porous media exhibits pronounced heterogeneity, making it difficult for conventional Euclidean geometry to capture its complex topological characteristics. Fractal theory, which can be used to quantify the self-similarity of pore structures through fractal dimensions, offers a novel paradigm for constructing microscale models of porous media [5–9]. However, the quantitative relationship between fractal dimensions and key flow characteristics, including vortex evolution dynamics and two-phase distribution patterns, remains poorly characterized [10–12]. A systematic analysis of the impact of fractal dimension on displacement efficiency during gas-driven water processes is still lacking [13–16]. Modeling approaches for fractal porous media evolved from early simplified capillary bundle models to more advanced stochastic generation techniques based on the Monte Carlo method [17–19]. These methods enable the construction of pore networks with statistical similarity by tuning the fractal dimension, thereby significantly enhancing the geometrical realism of the models.
The vast majority of porous media in nature have been shown to exhibit fractal characteristics [20–22], and the fractal geometry theory has been successfully applied to analyze the transfer performance in porous media with random and complex microstructures [18]. Many researchers have studied the flow resistance [23], permeability [24], and threshold pressure gradient [25] in porous media using the fractal theory. Fractal theory provides a mathematical framework for describing the complex pore structures of natural porous media. Early studies generated idealized fractal structures based on statistical fractal models [8,26], but these models failed to capture the topological characteristics of real rocks. The Monte Carlo method, which controls stochastic iterations through probabilistic thresholds, enables the precise generation of two- and three-dimensional porous media with different fractal dimensions (Df), making it a mainstream approach [27].
The two-phase flow behavior in porous media is a core scientific issue in fields such as oil and gas extraction, groundwater contamination remediation, and CO2 geological sequestration. Natural rock and soil media (e.g., sandstone and shale) generally exhibit highly heterogeneous pore structures, where complex branching channels and multi-scale pore distributions directly affect fluid migration paths and displacement efficiency. Traditional homogeneous models (e.g., the spherical particle packing assumption) fail to accurately characterize the microscopic structural heterogeneity of real media, leading to significant deviations in macroscopic flow predictions. Fractal theory provides a mathematical tool for describing the complex pore networks of natural porous media, with the fractal dimension (Df) quantitatively characterizing the geometric complexity and connectivity of the pore structure. This approach has become a key focus in recent multiphase flow research. Based on fractal theory and a fractal capillary bundle model, Huang et al. [28] developed a theoretical model for the non-Darcy coefficient in porous media, establishing quantitative relationships between the non-Darcy coefficient and microstructural parameters such as porosity, permeability, and tortuosity. The model showed good predictive capability in higher-permeable porous media when validated against experimental data. Wu and Yu [23], integrating fractal geometry theory with a pore–throat network model, proposed a fractal model for flow resistance in porous media. Using the Volume of Fluid (VOF) method, Yuan et al. [29] simulated gas-liquid two-phase flow at the pore scale and found that during the invasion of fracturing fluid, the flow predominantly occurred through smaller pore channels, which accounted for over 90% of the flow paths.
However, existing research has mainly focused on relationships between fractal dimensions and static parameters, whereas the coupling mechanisms controlling dynamic flow characteristics still lack a comprehensive analysis. The interaction between flow velocity and fractal structures in gas-driven water displacement processes has yet to be fully understood, limiting the optimization of operational parameters in engineering applications. Therefore, quantifying the impact of fractal dimension on flow paths, phase distribution, and energy dissipation, as well as establishing a quantitative model linking fractal characteristics with flow parameters, holds significant theoretical and engineering value. This study investigates gas-liquid two-phase flow in porous media using a validated numerical approach. A pore-scale model based on the CT microstructure of Berea sandstone is established, and the simulation results are compared with experimental data from Liu et al. [30]. Good agreement is found in phase distribution, breakthrough behavior, and flow path morphology, confirming the reliability of the numerical model. Ten fractal porous media models with Df ranging from 1.25 to 1.7 were constructed using a Monte-Carlo approach. Systematic quantification of porosity and mean pore diameter variations across the fractal series was conducted. Gas-liquid two-phase flow dynamics was characterized using ANSYS Fluent’s VOF solver, with gas injection rates covering 0.05–0.5 m/s in digital. Time-resolved two-phase distribution patterns were recorded throughout the displacement processes. Flow field characteristics, including streamline distributions, velocity vector fields, and localized vorticity patterns, were analyzed at t = 1.2 s of flow development. Temporal evolution of phase volume fractions was continuously monitored. Equilibrium-state eddy viscosity contours were systematically quantified. Pressure differentials across the media were measured as a function of injection velocity. Volumetric gas fraction dependencies on both fractal dimension and flow rate were statistically evaluated, with empirical correlations subsequently established.
2 Modeling Approaches for Fractal Porous Media and Two-Phase Flow Simulation
2.1 Pore Size Calculation Using the Monte Carlo Method
The pore microstructures (including pore sizes and interfaces) in such porous media exhibit fractal characteristics. The Monte Carlo technique for modeling fractal porous media is formulated based on fractal theory and statistical principles. The key equations and implementation steps are described as follows.
The cumulative pore size distribution follows a fractal scaling law [27,31]:
where
where
Dividing Eq. (2) by Eq. (3) gives:
where
The integration of Eq. (5) demonstrates that Eq. (5) holds if and only if
is satisfied. This mathematical constraint implies that
The cumulative distribution function for pore sizes in the interval [λmin, λ] is defined by [18]
This formulation exhibits two essential boundary conditions: (i) R→0 as
From Eq. (7), we can obtain
From Eq. (8),
Eq. (9) is a probability model for pore size distribution in the present simulation. For the
where
where
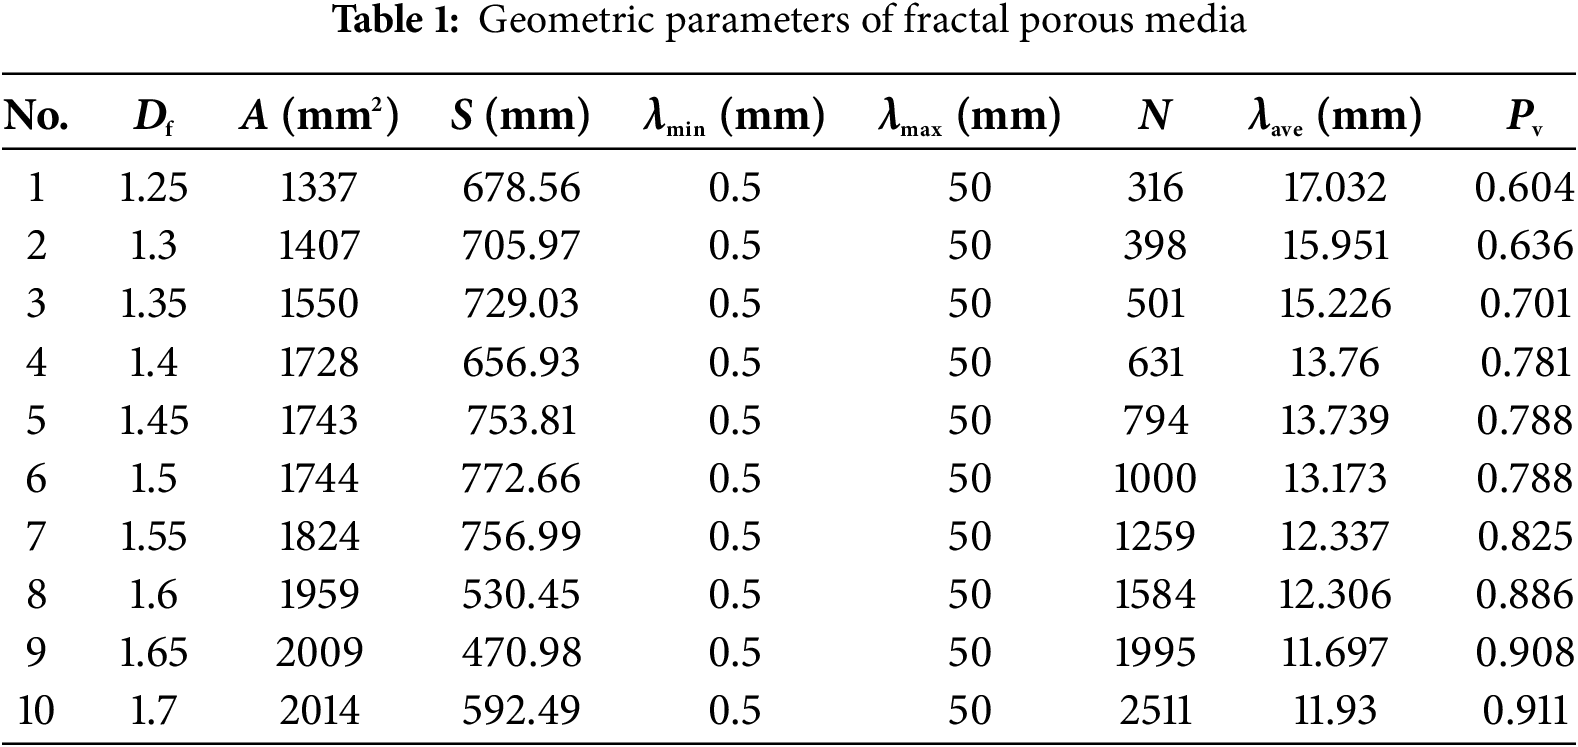
Ten fractal porous media models with 30 mm in width and 60 mm in length were generated using the Monte Carlo method. Each model has a unique Df ranging from 1.25 to 1.70 (See Fig. 1). Geometric parameters include the pore area (A), pore perimeter (S), minimum pore size (λmin = 0.5), and maximum pore size (λmax = 50 mm). The total pore number (N) increases significantly with Df, varying from 316 to 2511. As shown in Fig. 2, the average pore diameter (λave) decreases from 17.03 to 11.93 mm as Df increases. The porosity (Pv) increases from 0.60 to 0.91, demonstrating enhanced void space complexity at higher fractal dimensions. All models maintain fixed λmin and λmax, isolating the influence of Df on structural evolution. Detailed geometric parameters are summarized in Table 1.
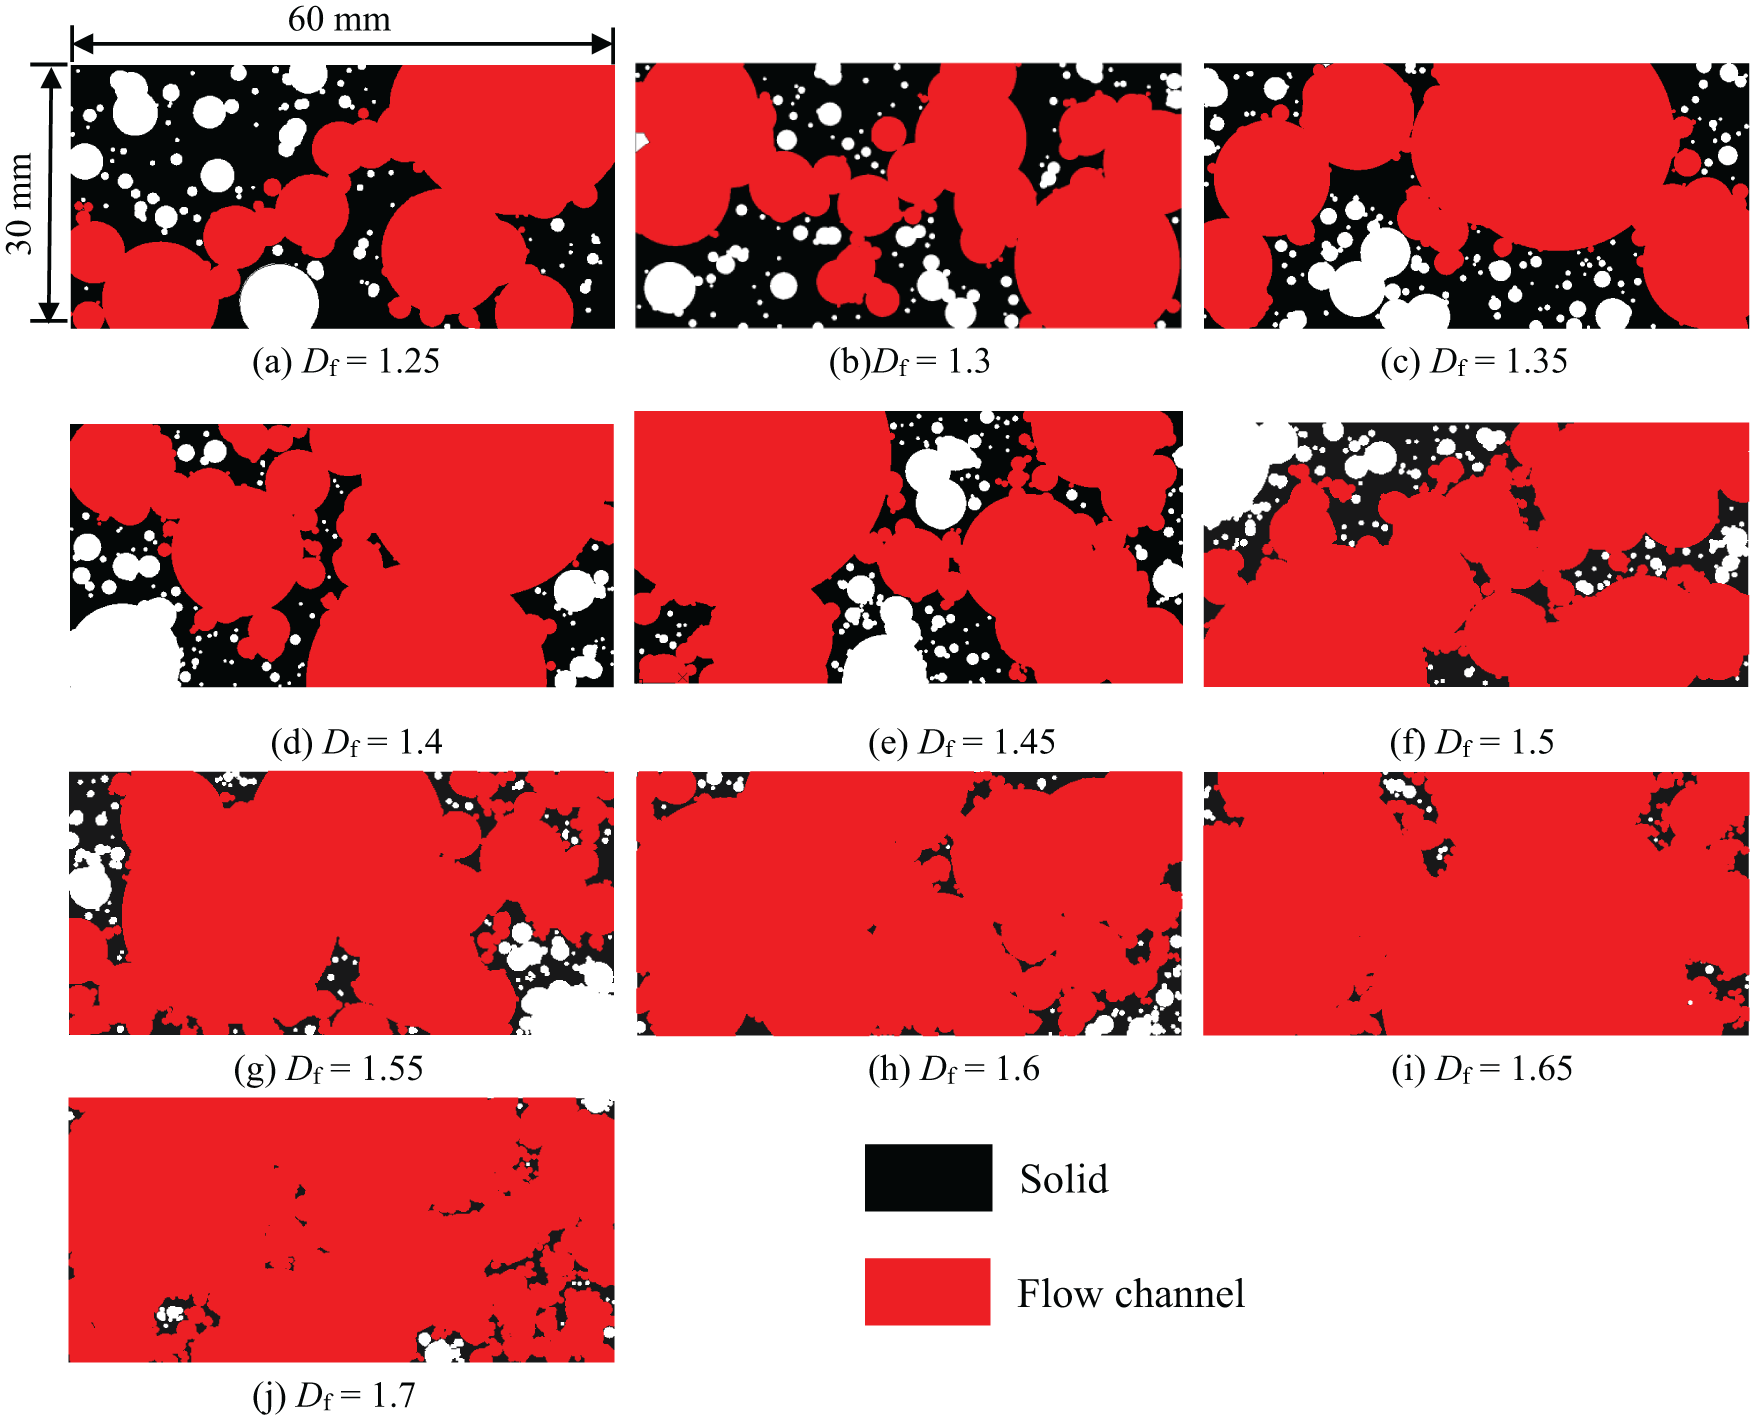
Figure 1: Geometric characteristics of the generated fractal porous media. Df represents fractal dimension of pore distributions
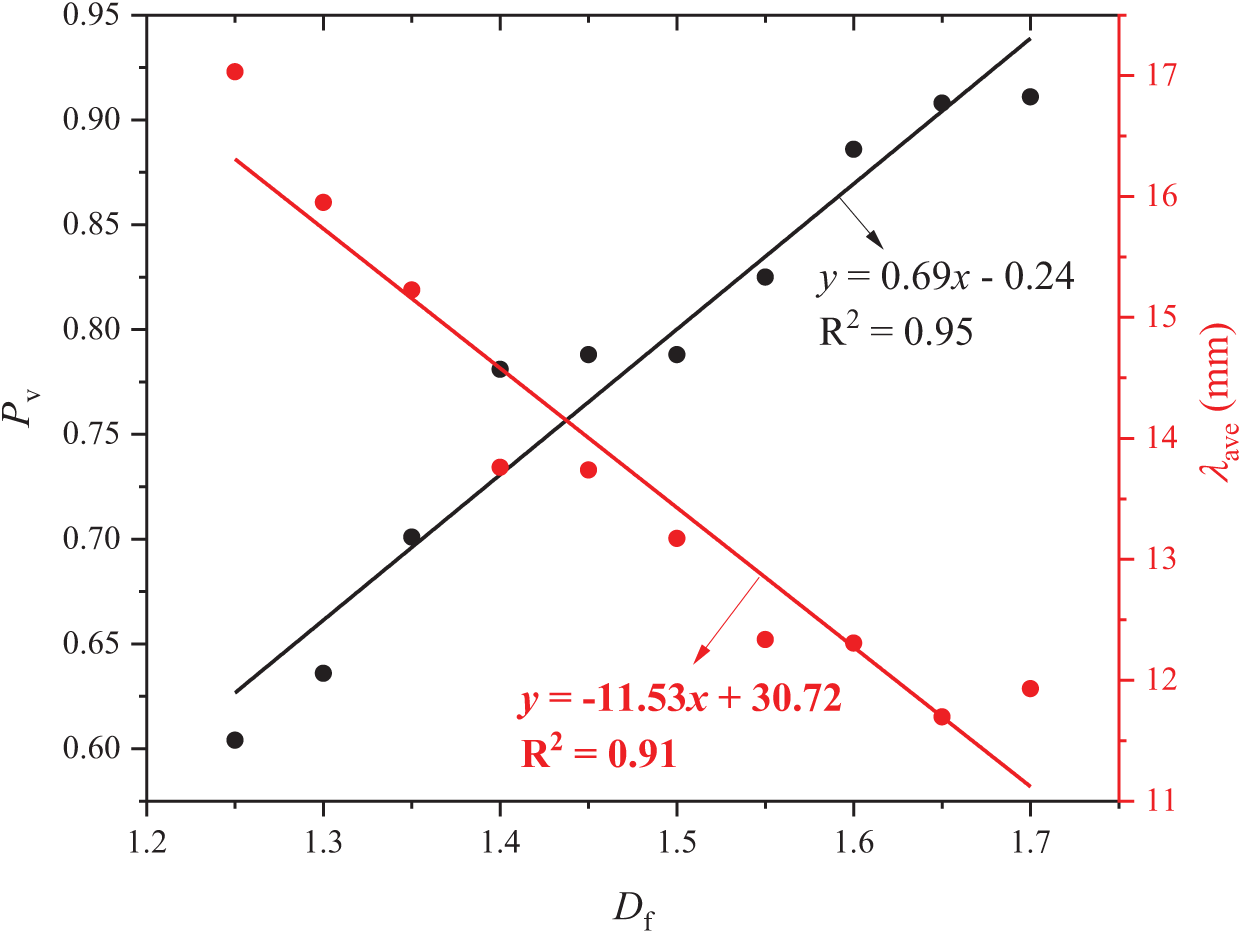
Figure 2: Variations in porosity (Pv) and average pore diameter (λave) with Df ranging from 1.25 to 1.7
2.2 Volume of Fluid (VOF) Model
The VOF method extends conventional single-phase flow equations by introducing a phase fraction field (α) to track interfacial dynamics between immiscible fluids. This formulation solves coupled governing equations for pressure (P), velocity (v), and phase fraction (α), with interface reconstruction achieved through geometric schemes. For two-phase flow in porous media, the continuity and momentum equations incorporating gravitational effects are expressed as:
where
The average density is defined as follows:
When the wetting phase fluid is a Newtonian fluid, the shear stress at the interface between two phases can be calculated as:
where
where
where
where
The value of the phase fraction
Eq. (22) is the phase equation of the VOF model. For incompressible systems, where pressure acts as a relative value and the differential pressure serves as the primary driving force, the cell pressure is defined to simplify the momentum equation, Eq. (13), as follows:
where
Bringing Eqs. (24) and (20) to Eq. (13) for simplification, Eq. (25) can be obtained as follows:
Eqs. (12), (22), and (25) together form the mathematical model for the VOF model of the two-phase flow system.
2.3 Numerical Simulation Method
The gas-liquid two-phase flow in fractal porous media was simulated using the VOF model in ANSYS FLUENT, which is a finite volume method-based computational fluid dynamics (CFD) solver [36,37]. The governing equations for mass and momentum conservation were discretized using a pressure-based transient solver, with the pressure-velocity coupling resolved via the PISO (Pressure-Implicit with Splitting of Operators) algorithm to enhance the stability for multiphase flows [38].
The VOF method was employed to track the gas-liquid interface, in which the volume fraction of air (primary phase) and water (secondary phase) were solved using an explicit geometric reconstruction scheme. The surface tension between phases was modeled via the Continuum Surface Force (CSF) formulation, with a constant interfacial tension coefficient of σ = 0.032 N/m. A sharp interface resolution was ensured by setting the Courant number below 0.25 through a fixed time step of Δt = 1 × 10⁻⁵ s, which is critical for capturing transient phenomena such as bubble breakup and coalescence.
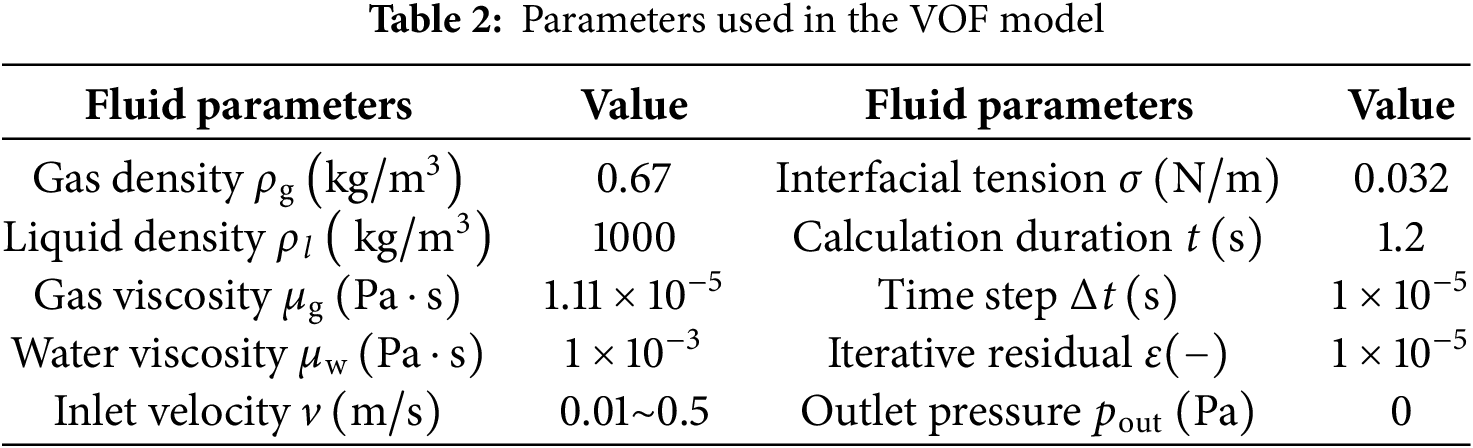
The physical properties of the phases were defined as follows: air density ρg = 0.67 kg/m³, dynamic viscosity μg = 1.11 × 10⁻⁵ Pa·s; water density ρl = 1000 kg/m³, and viscosity μL = 1 × 10−³ Pa·s. As shown in Fig. 3, a velocity inlet boundary condition was applied with a range of v = 0.01–0.5 m/s to investigate flow regime transitions, while the outlet was set to atmospheric pressure (pout = 0 Pa). No-slip conditions were enforced at the pore walls. Spatial discretization utilized the second-order upwind scheme for momentum equations and the PRESTO (Pressure Staggering Option) scheme for pressure to minimize numerical diffusion. The iterative residual convergence criterion was set to ε = 1 × 10⁻⁵ for all equations. Simulations were advanced for t = 1.2 s to achieve quasi-steady flow patterns, with results sampled every 1 × 10−³ s for post-processing. More detailed calculation parameters are listed in Table 2.
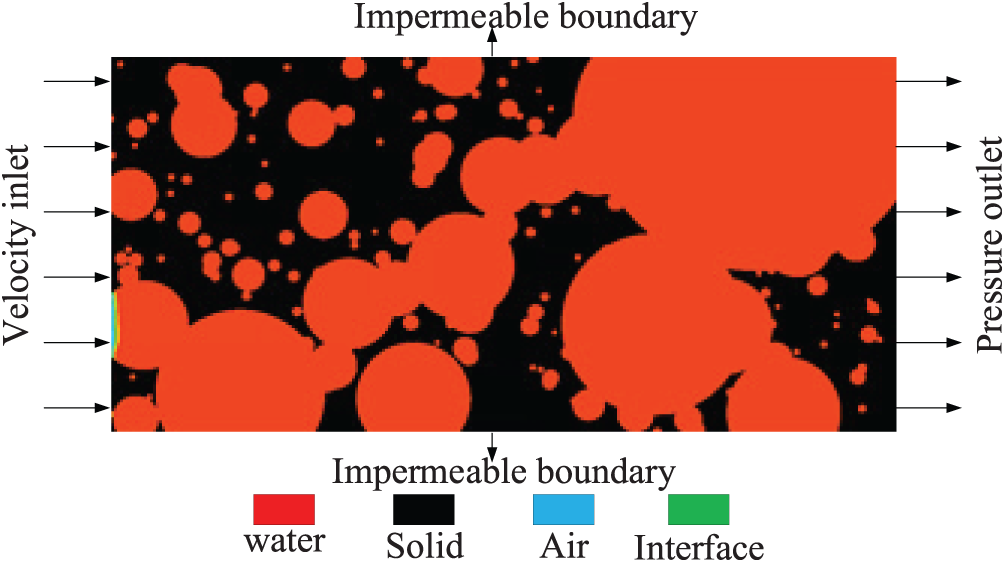
Figure 3: Initial boundary condition setup for the gas-liquid VOF numerical models
3.1 Validation of the Numerical Simulation Method
To validate the accuracy and reliability of the numerical simulation method, the comparison was conducted between the simulation results and the experimental data reported by [30] using the same porous structure (Fig. 4). The porous structure is derived from a series of CT micrographs of a Berea sandstone based on the original work of [26] and [39]. This pore structure is very typical and has been used in published experimental [39] and numerical works [40].
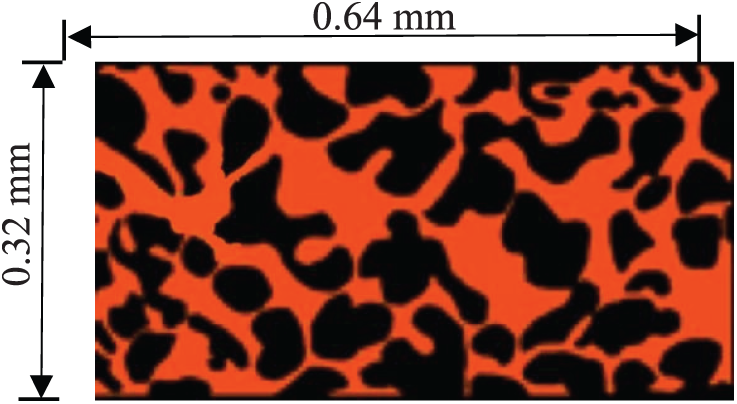
Figure 4: Pore structure reconstructed from CT micrographs of Berea sandstone, adapted from Sirivithayapakorn et al. [26]. The red regions indicate the pore space, while the black regions represent the impermeable solid matrix
The validation focused on the progression of the air invasion front, which is quantified by the breakthrough distance (
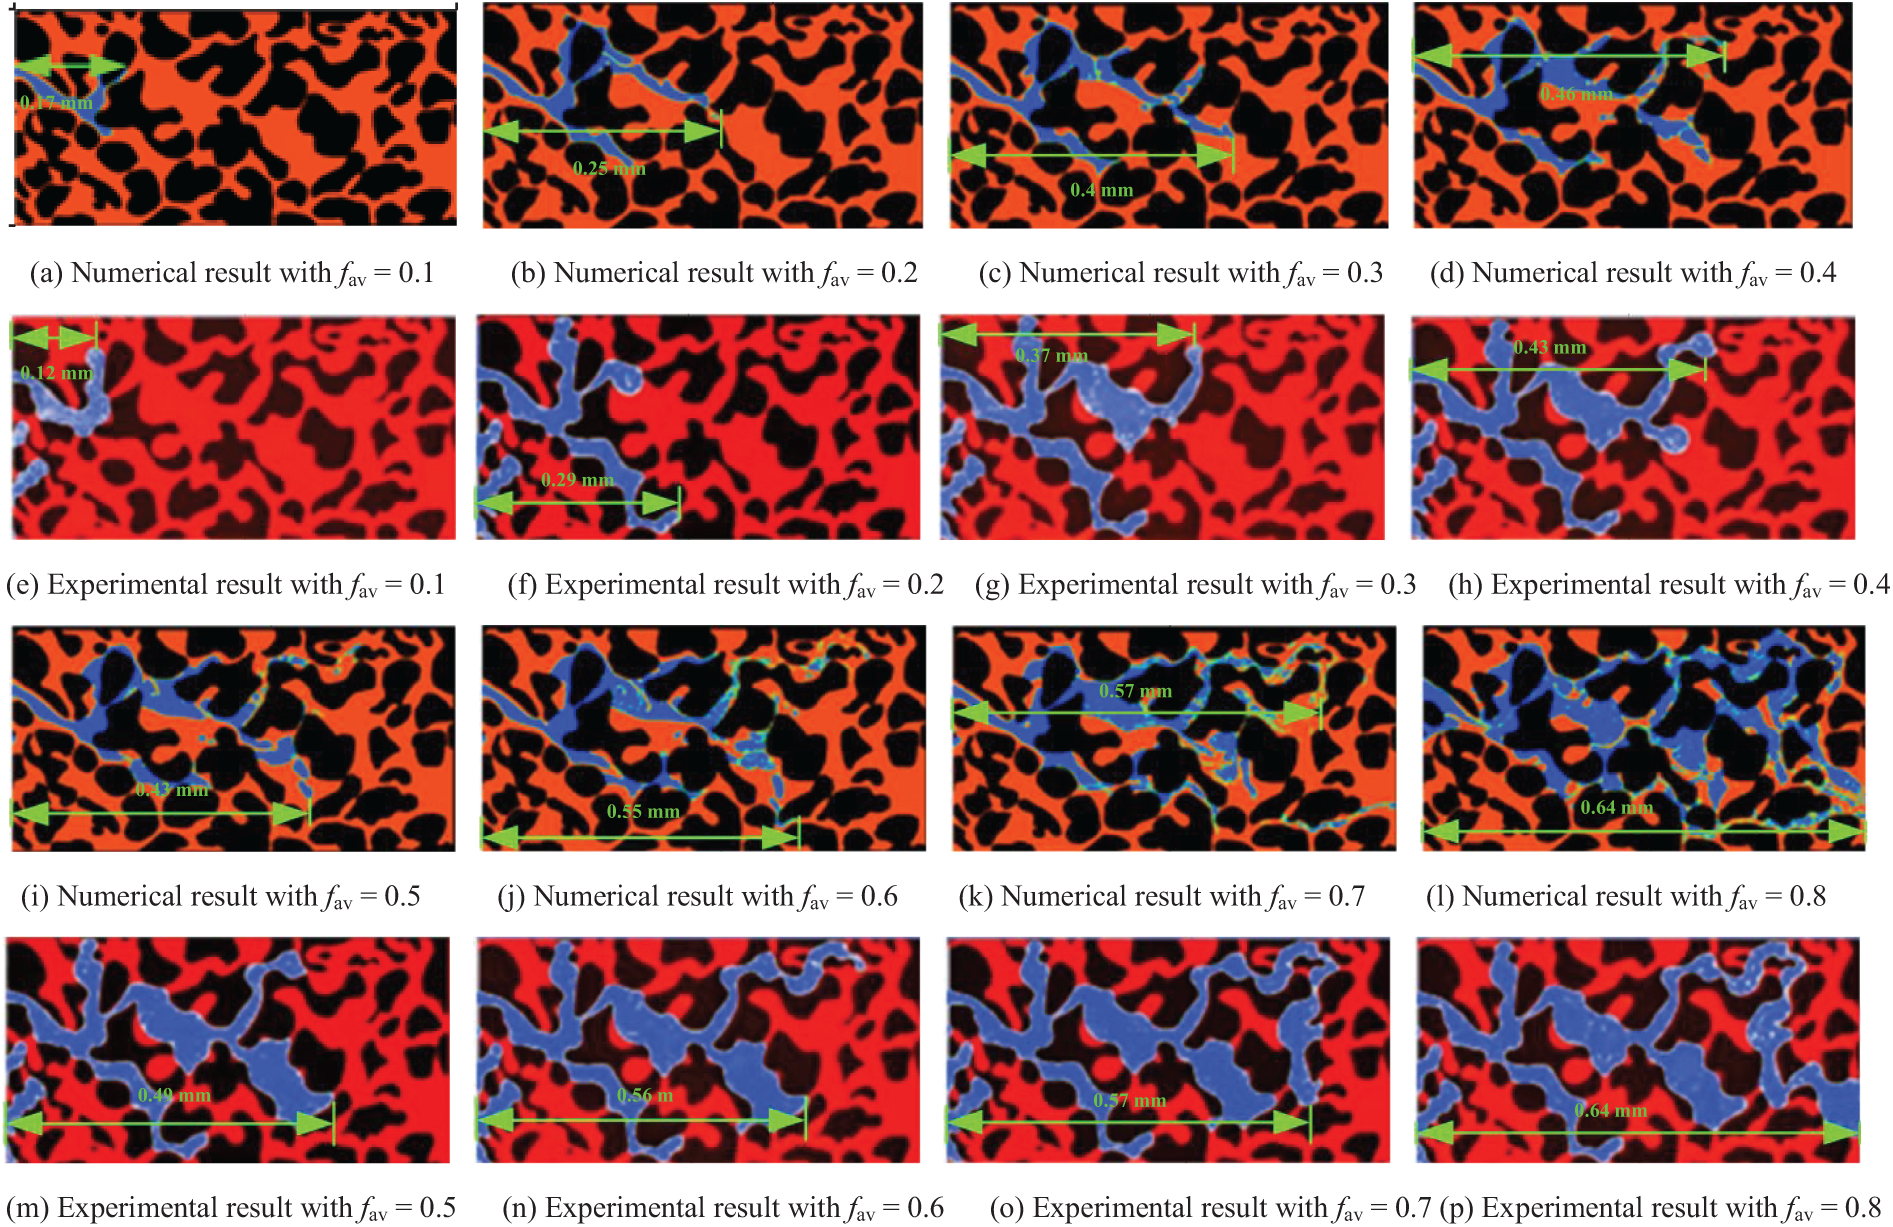
Figure 5: Comparison between numerical simulation results from this study and experimental observations reported by Liu et al. [30]. The red regions represent the liquid phase, the blue regions indicate the gas phase, and the black regions correspond to the solid matrix
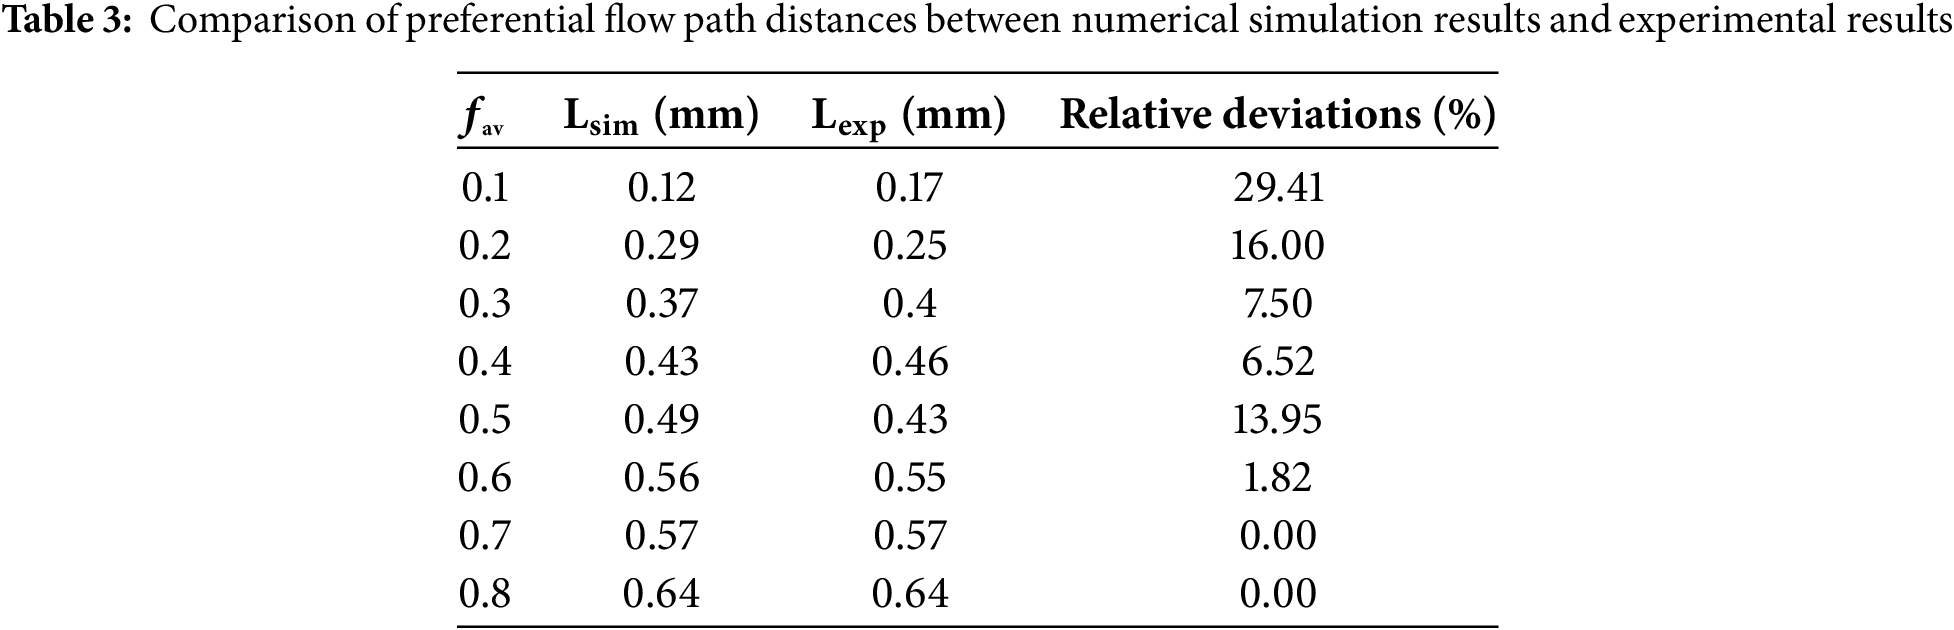
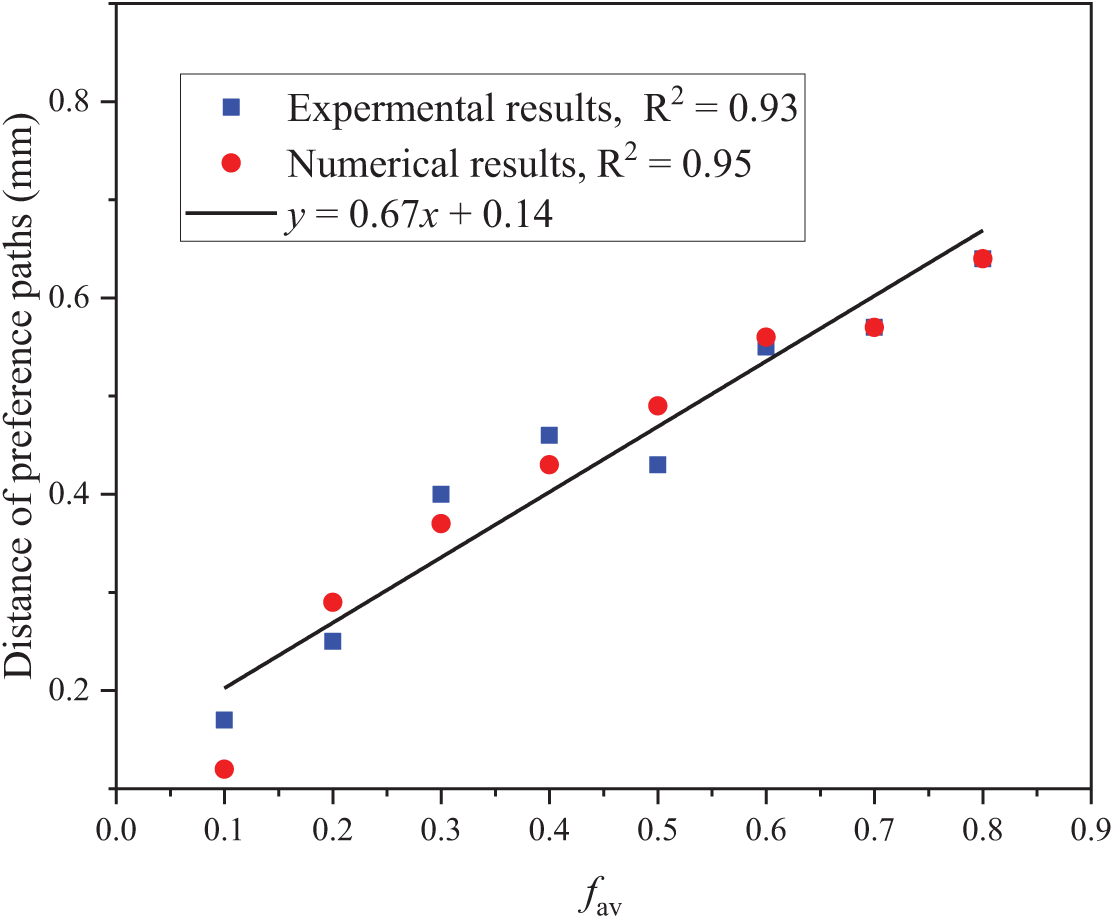
Figure 6: Comparison of preferential flow path distances between numerical simulation results and experimental data. The preferential path refers to the earliest breakthrough route of the gas phase through the porous medium. fav represents air volume fraction
3.2 Preferential Flow Dynamics and Vortex Formation Mechanisms
As shown in Fig. 7, the fluid flow through models with varying Df exhibits pronounced fingering behavior, with low-dimensional models (Df = 1.25–1.45) demonstrating faster finger breakthrough (e.g., 1.73 m/s peak air velocity at Df = 1.45 vs. 2.19 m/s at Df = 1.7, Table 4). This phenomenon increases from the intrinsic relationship between the fractal dimension and the pore network topology. Smaller Df values correspond to pore structures characterized by more pronounced dual-scale features, such as narrower primary flow channels and reduced proportion of secondary pores. This leads to an intensified flow resistance localization effect. The results indicate that as Df increases from 1.25 to 1.7, the tortuosity of preferential flow paths increases. altering the dynamics of the gas-liquid interface due to changes in the underlying geometric features.
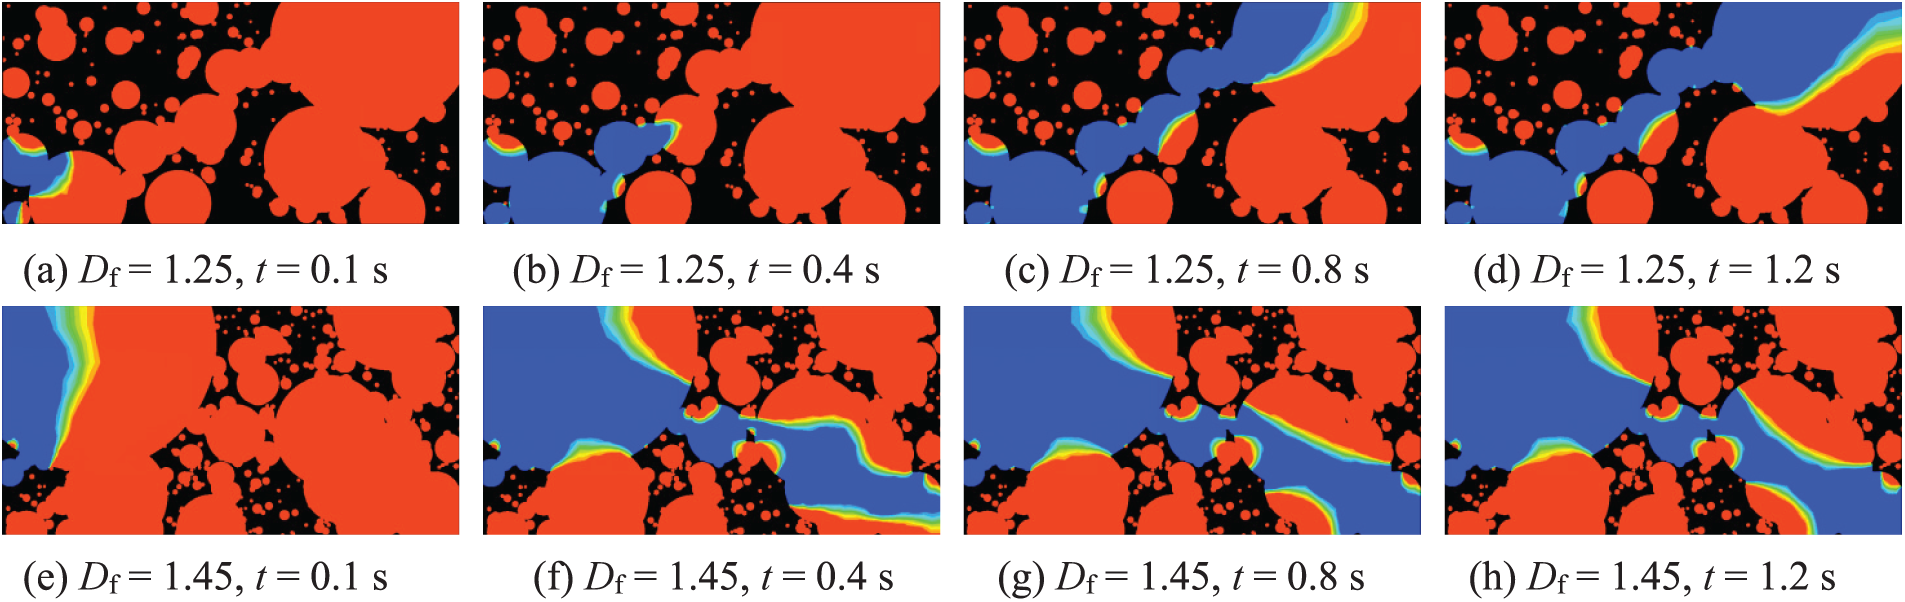
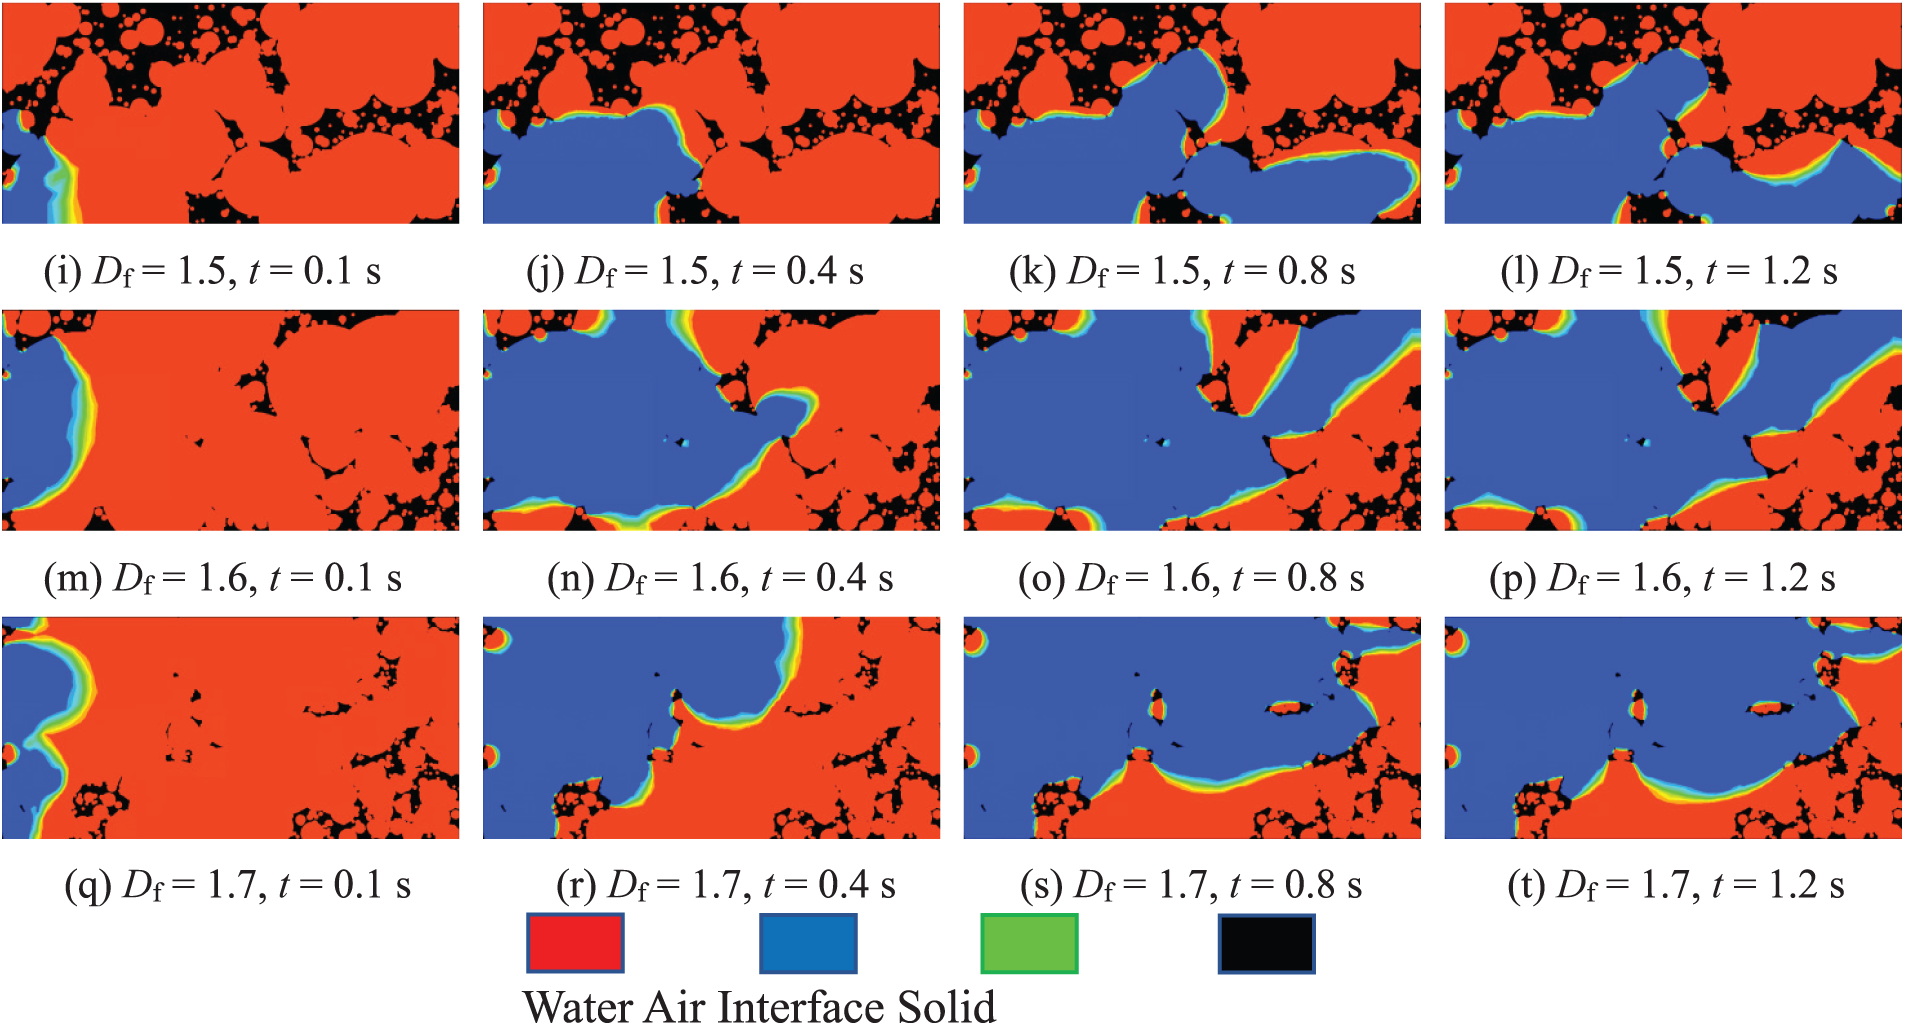
Figure 7: Contour maps of gas-liquid two-phase flow through porous media for v = 0.5 m/s and t = 0.1~1.2 s. Here, v is the flow velocity of fluids, and t is the flow time
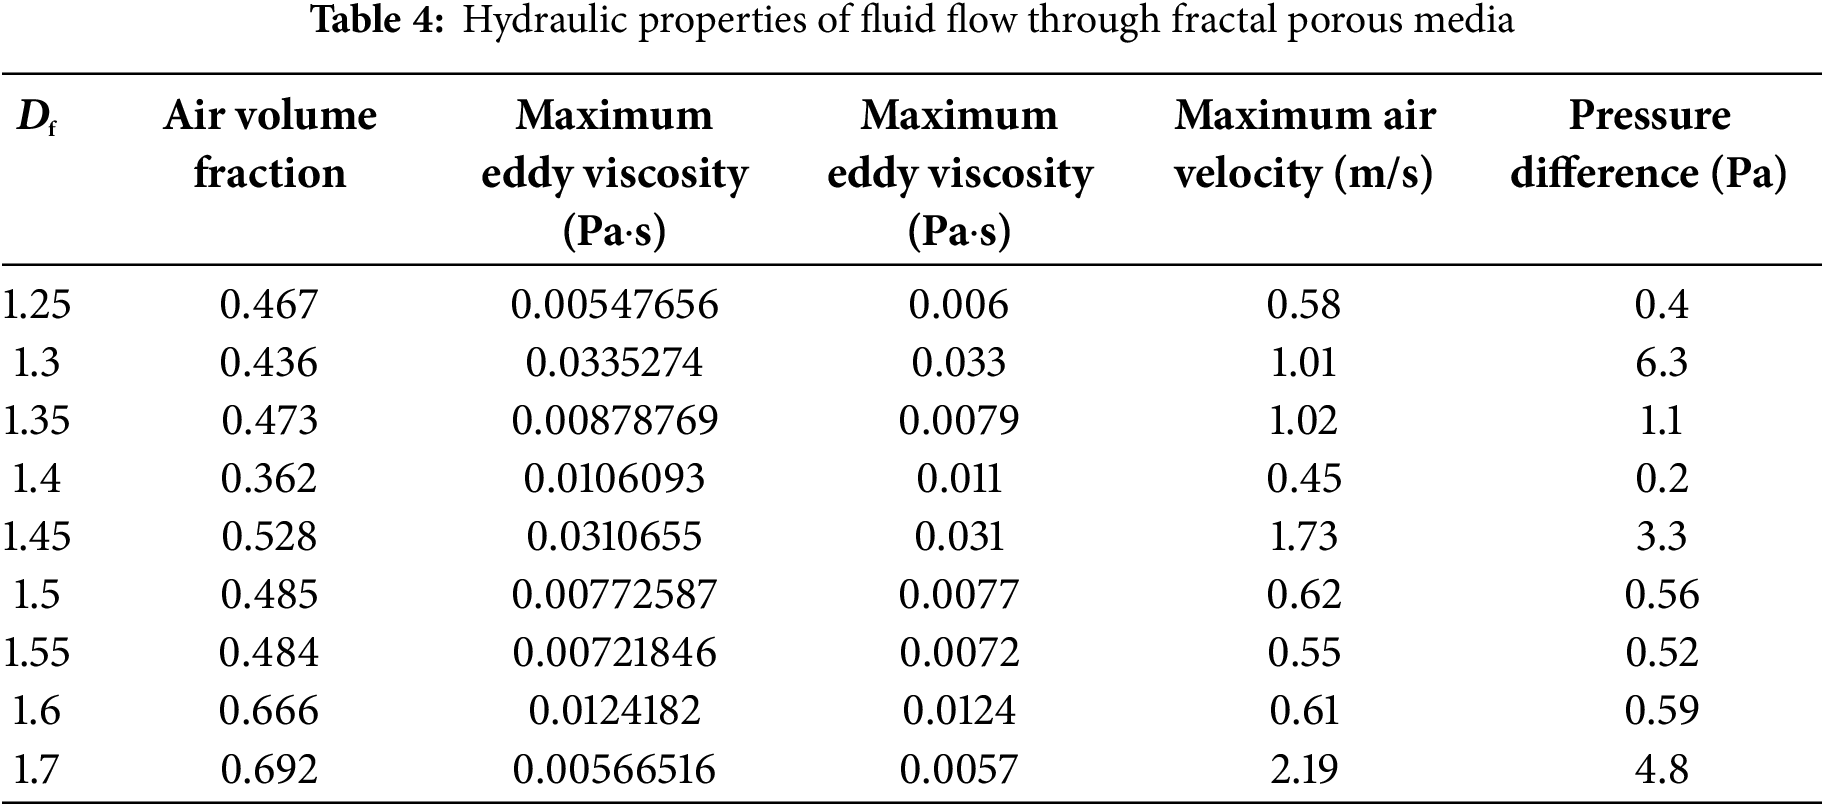
The vortex structures observed near pore throats (Fig. 8) can be interpreted using the vorticity transport Eq. (13), in which enhanced surface complexity at higher Df reduces local curvature radii, amplifying vorticity generation by ~3× (peak eddy viscosity reaches 0.033 Pa·s at Df =1.3 vs. 0.0057 Pa·s at Df = 1.7). The vortices in preferential channels exhibit higher intensity than isolated pores due to shear layer instabilities at higher-velocity/stagnant zone interfaces. In higher-dimensional models (e.g., Df = 1.7), the increased surface complexity reduces the local radius of curvature, thereby enhancing vorticity generation. Notably, vortices are more intense in pores connected to preferential channels than in isolated ones, primarily due to shear layer instabilities at the interface between higher-velocity zones and stagnant regions. These findings align with the phenomena demonstrated in Fig. 9, in which the maximum eddy viscosity increases nonlinearly with Df, confirming the role of complex pore networks in enhancing turbulent kinetic energy dissipation.
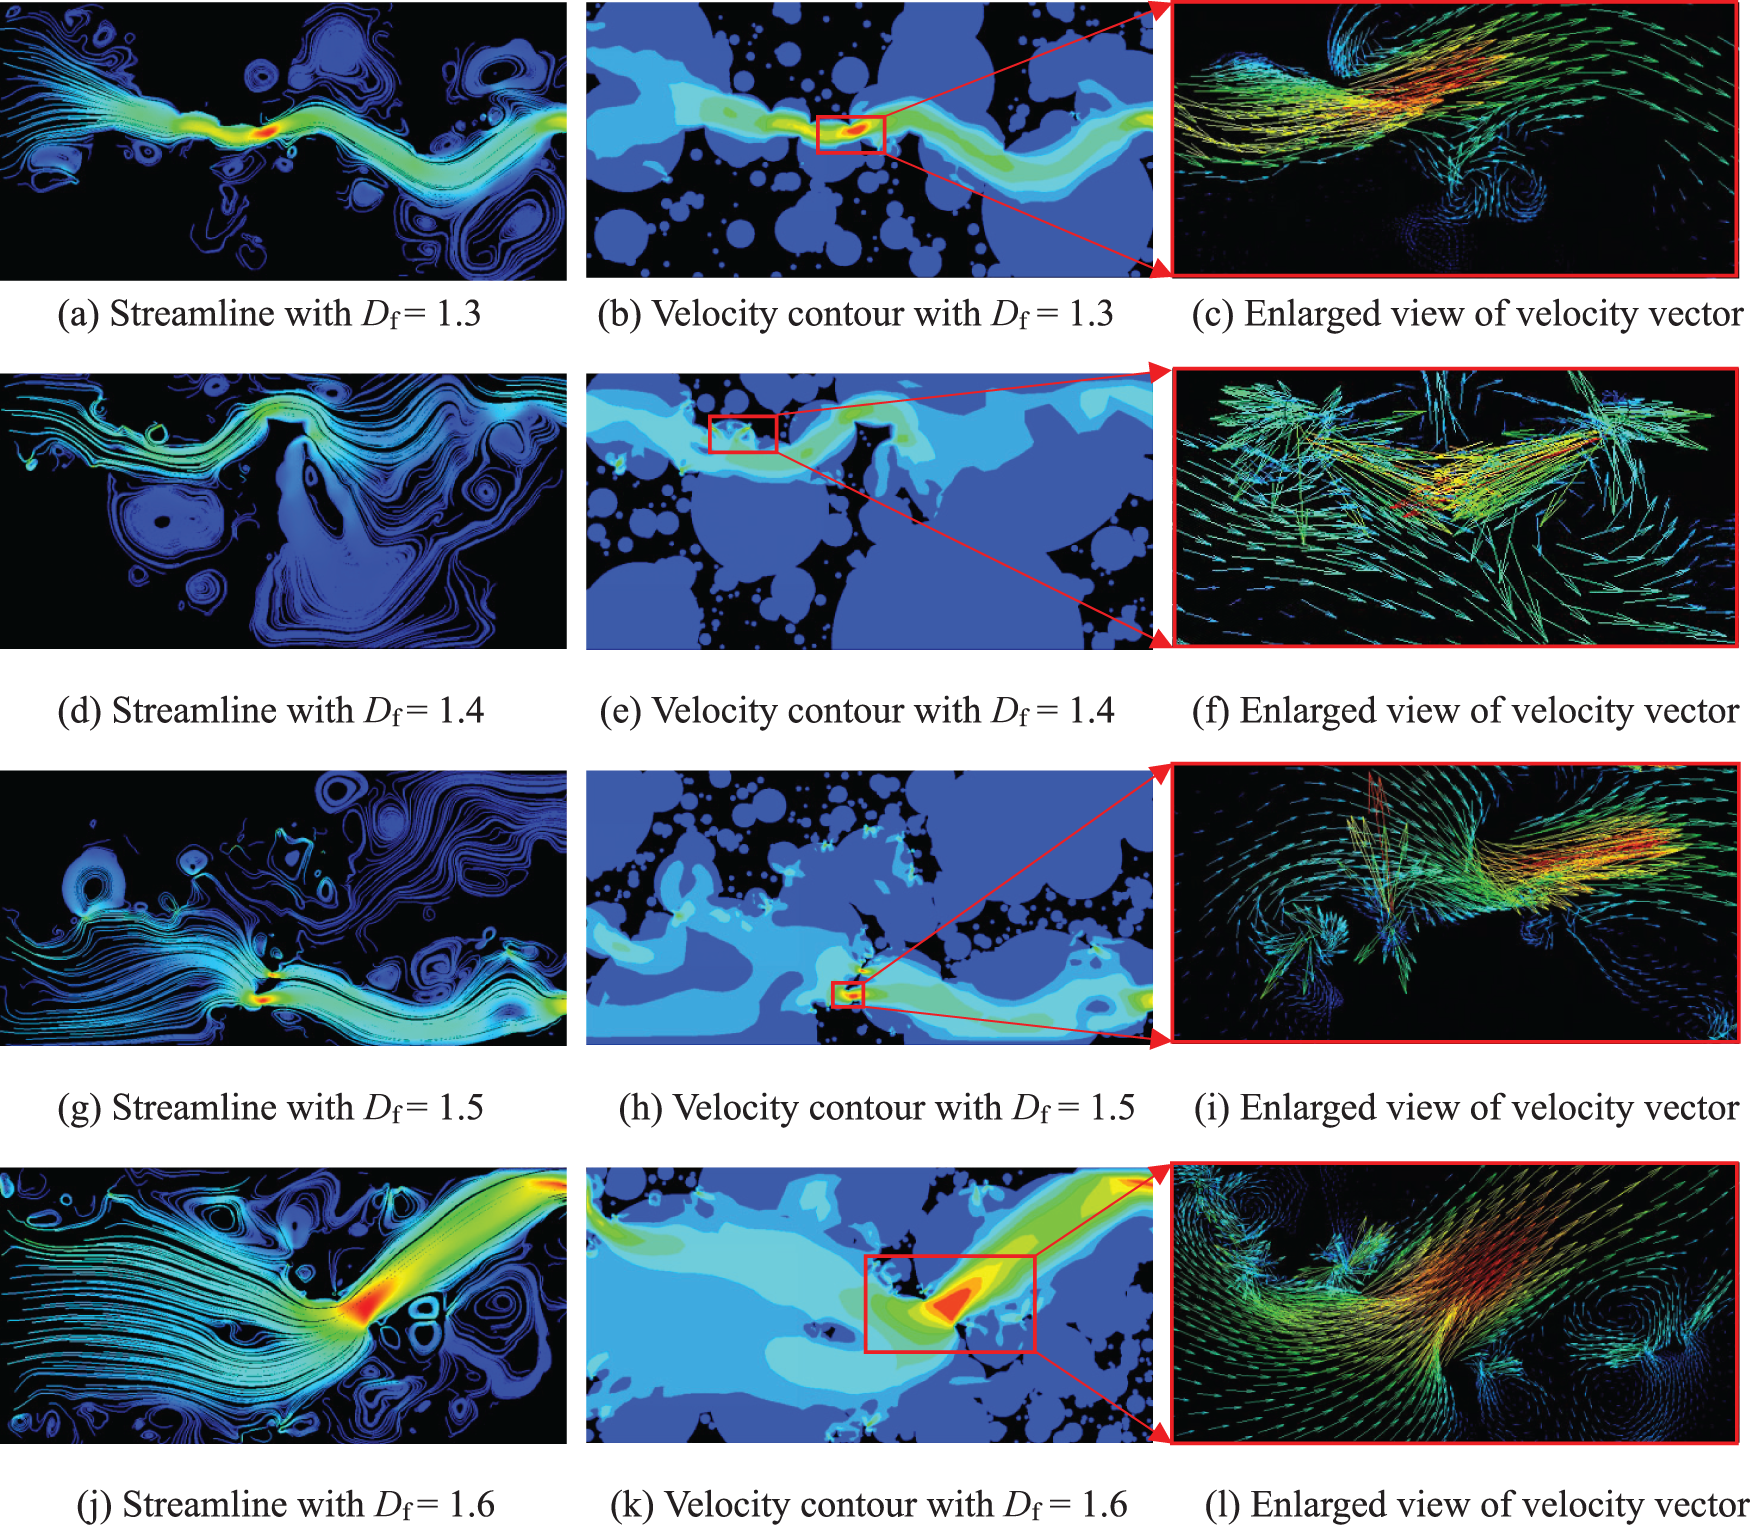
Figure 8: Distribution of streamlines, velocity contours and enlarged view of vector vectors for v = 0.5 m/s at t = 1.2 s
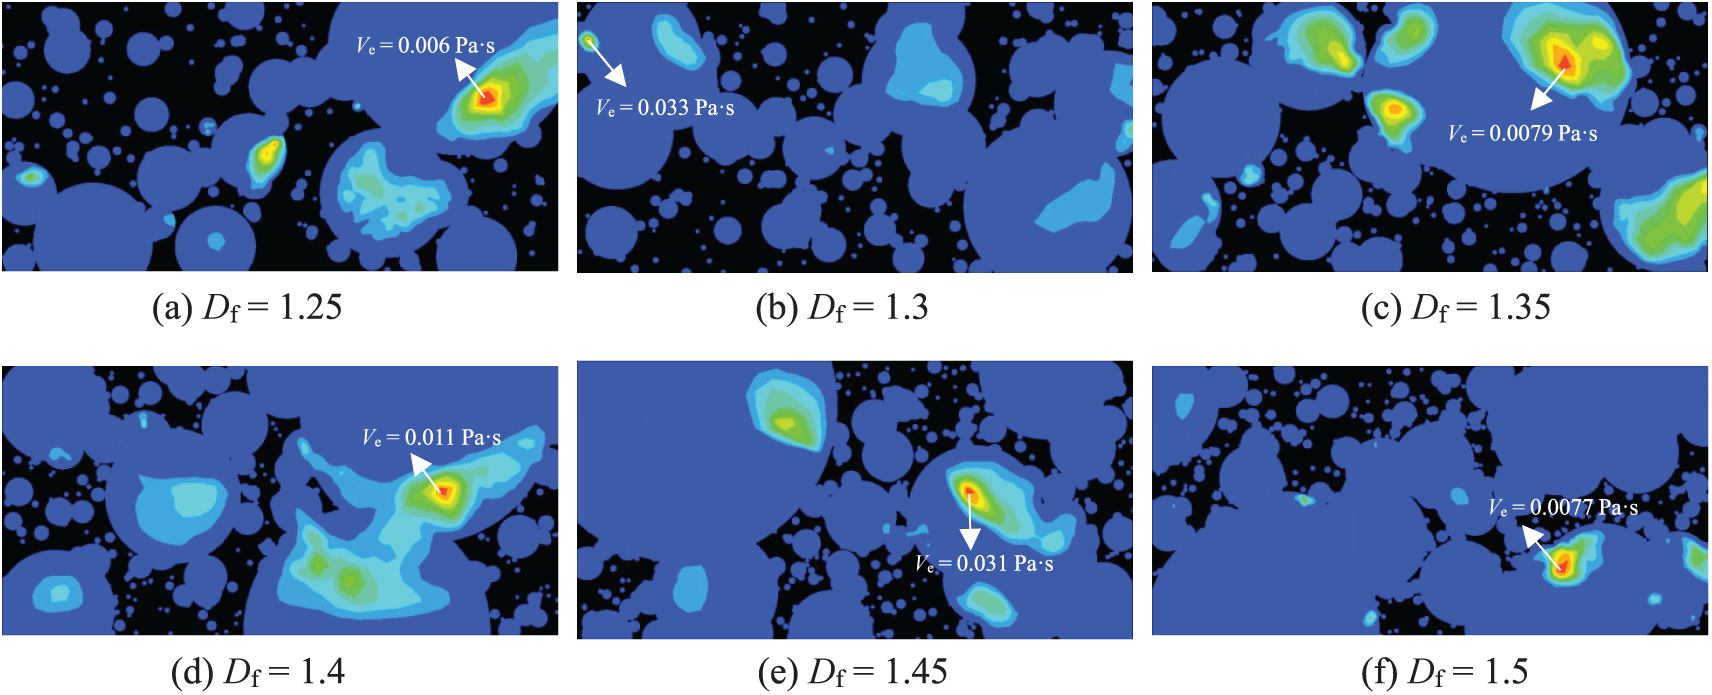
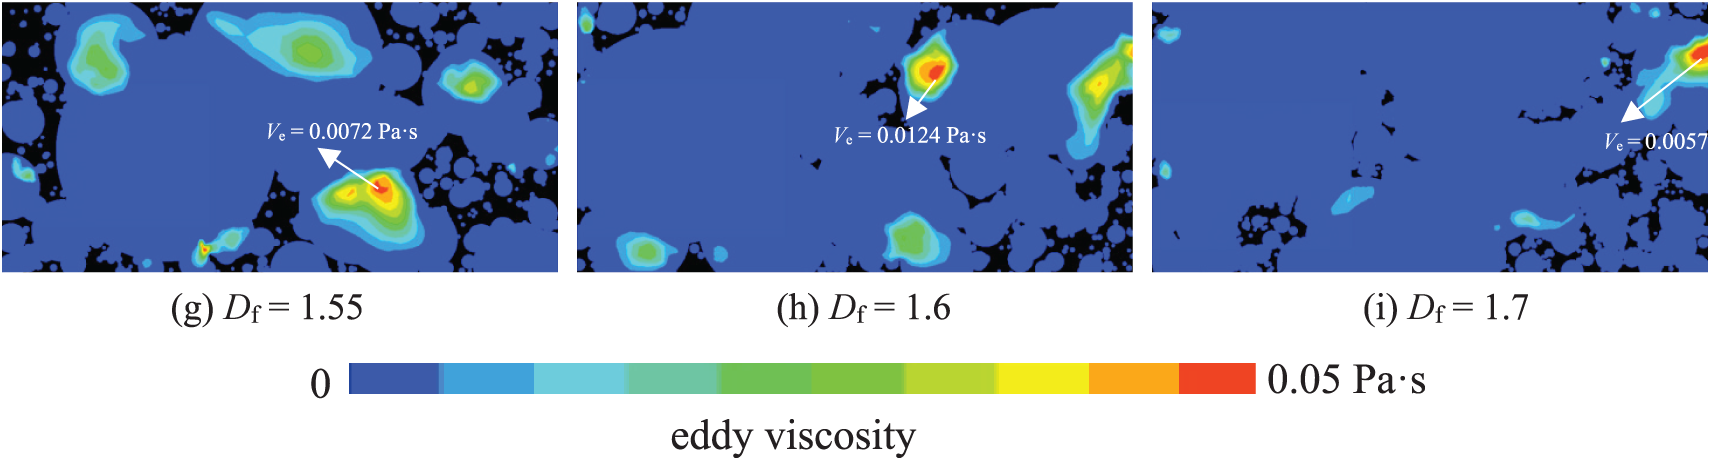
Figure 9: Variations in eddy viscosity (Ve) at v = 0.5 m/s and t = 1.2 s with fractal dimension (Df) ranging from 1.25 to 1.7
The time evolution of the gas volume fraction (Fig. 10) indicates that dynamic equilibrium is reached after approximately 1.1 s. At this stage, higher-dimensional models (Df = 1.7) retain a higher overall gas fraction compared to smaller-dimensional counterparts. This behavior can be attributed to two primary mechanisms: first, the increased fractal dimension leads to a higher specific surface area, which strengthens residual gas saturation; second, turbulence-induced fluctuations within the complex flow pathways (e.g., peak eddy viscosity reaching 0.033 Pa·s in Fig. 9) promote enhanced bubble breakup and dispersion. The combined effects govern the final gas-liquid distribution pattern under dynamic conditions.
Figure 10: Variations in fav over the time range t = 0 to 1.2 s
As illustrated in Fig. 11, the pressure difference exhibits a non-monotonic dependence on Df, with distinct regimes emerging across the tested fractal dimensions. At smaller Df values (1.25–1.3), the pressure difference increases sharply (e.g., from 0.4 Pa at Df = 1.25 to 6.3 Pa at Df =1.3), attributed to localized flow resistance within dual-scale pore structures dominated by narrow primary channels and sparse secondary pores. However, for Df > 1.5, the pressure difference plateaus or slightly decreases (e.g., 4.8 Pa at Df = 1.7), suggesting that enhanced pore connectivity in higher-Df models mitigates localized resistance despite increased energy dissipation from turbulent vortices (peak eddy viscosity: 0.033 Pa·s at Df = 1.3). The flow velocity governs the transition between viscous and inertia-dominated regimes. At v < 0.2 m/s, the linear ΔP-v relationship aligns with Darcy’s law, as seen in the low-Df models (Df = 1.25, ΔP = 0.4 Pa at v = 0.58 m/s).
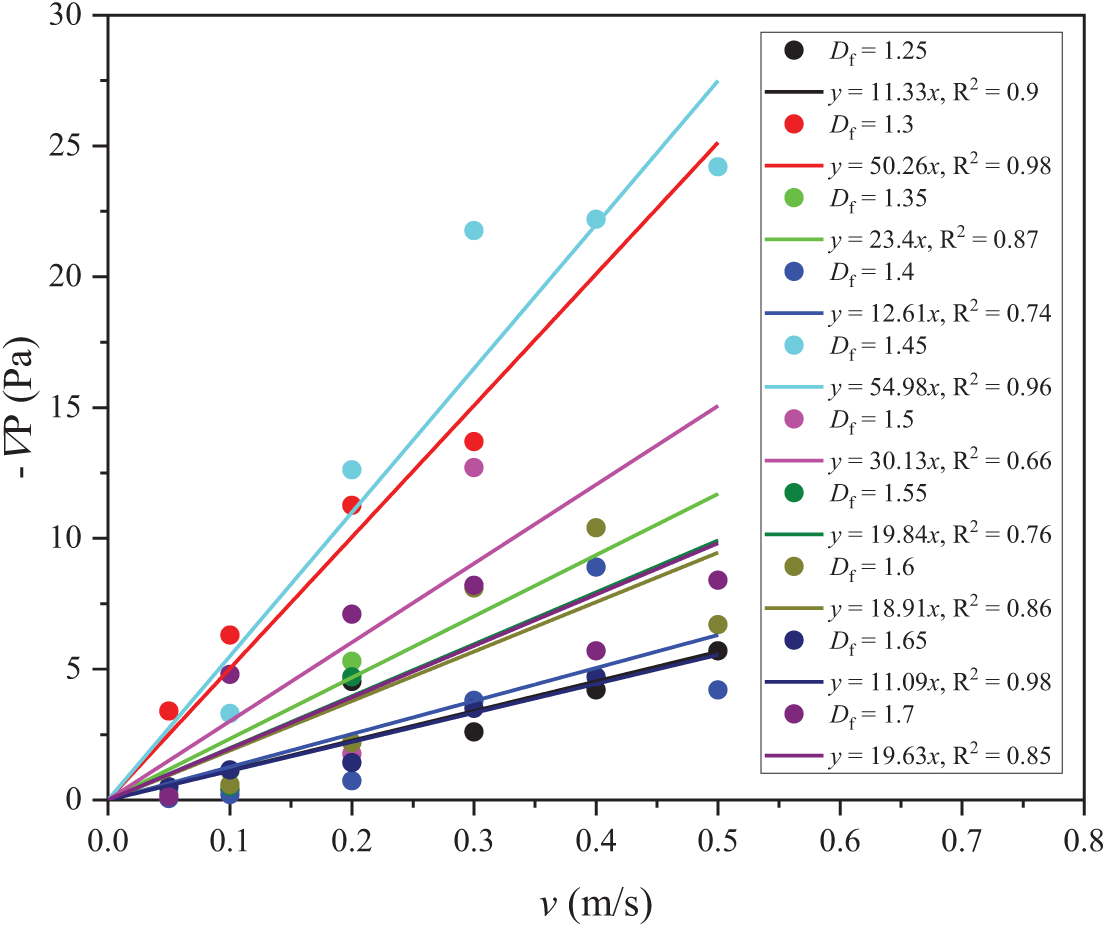
Figure 11: Variations in pressure difference (−∇P) with v ranging from 0.05 to 0.5 m/s and Df from 1.25 to 1.7
The equilibrium air volume fraction (fav) demonstrates a nonlinear increase with rising Df from 1.25 to 1.7, as shown in Fig. 12. At Df = 1.7, fav reaches 0.692, reflecting enhanced air entrapment due to increased pore network complexity. This trend aligns with residual gas saturation effects, in which higher specific surface area promotes air retention in secondary pores. Turbulence-driven dispersion further contributes, as peak eddy viscosity (0.033 Pa·s at Df = 1.3) enhances bubble fragmentation. The v modulates these dynamics. When v is below 0.2 m/s, fav increases monotonically with Df under capillary dominance (e.g., fav = 0.72 at v = 0.05 m/s for Df = 1.7), while when v is above 0.3 m/s, inertial forces reduce fav, though higher-Df models retain greater air retention (e.g., fav =0.65 at v = 0.5 m/s for Df =1.7). The intermediate velocities (0.1–0.3 m/s) exhibit maximal sensitivity, with fav increasing from Df =1.5 to 1.7 despite only 15% pressure difference growth. This highlights microstructure dominance over macroscopic resistance in multiphase systems
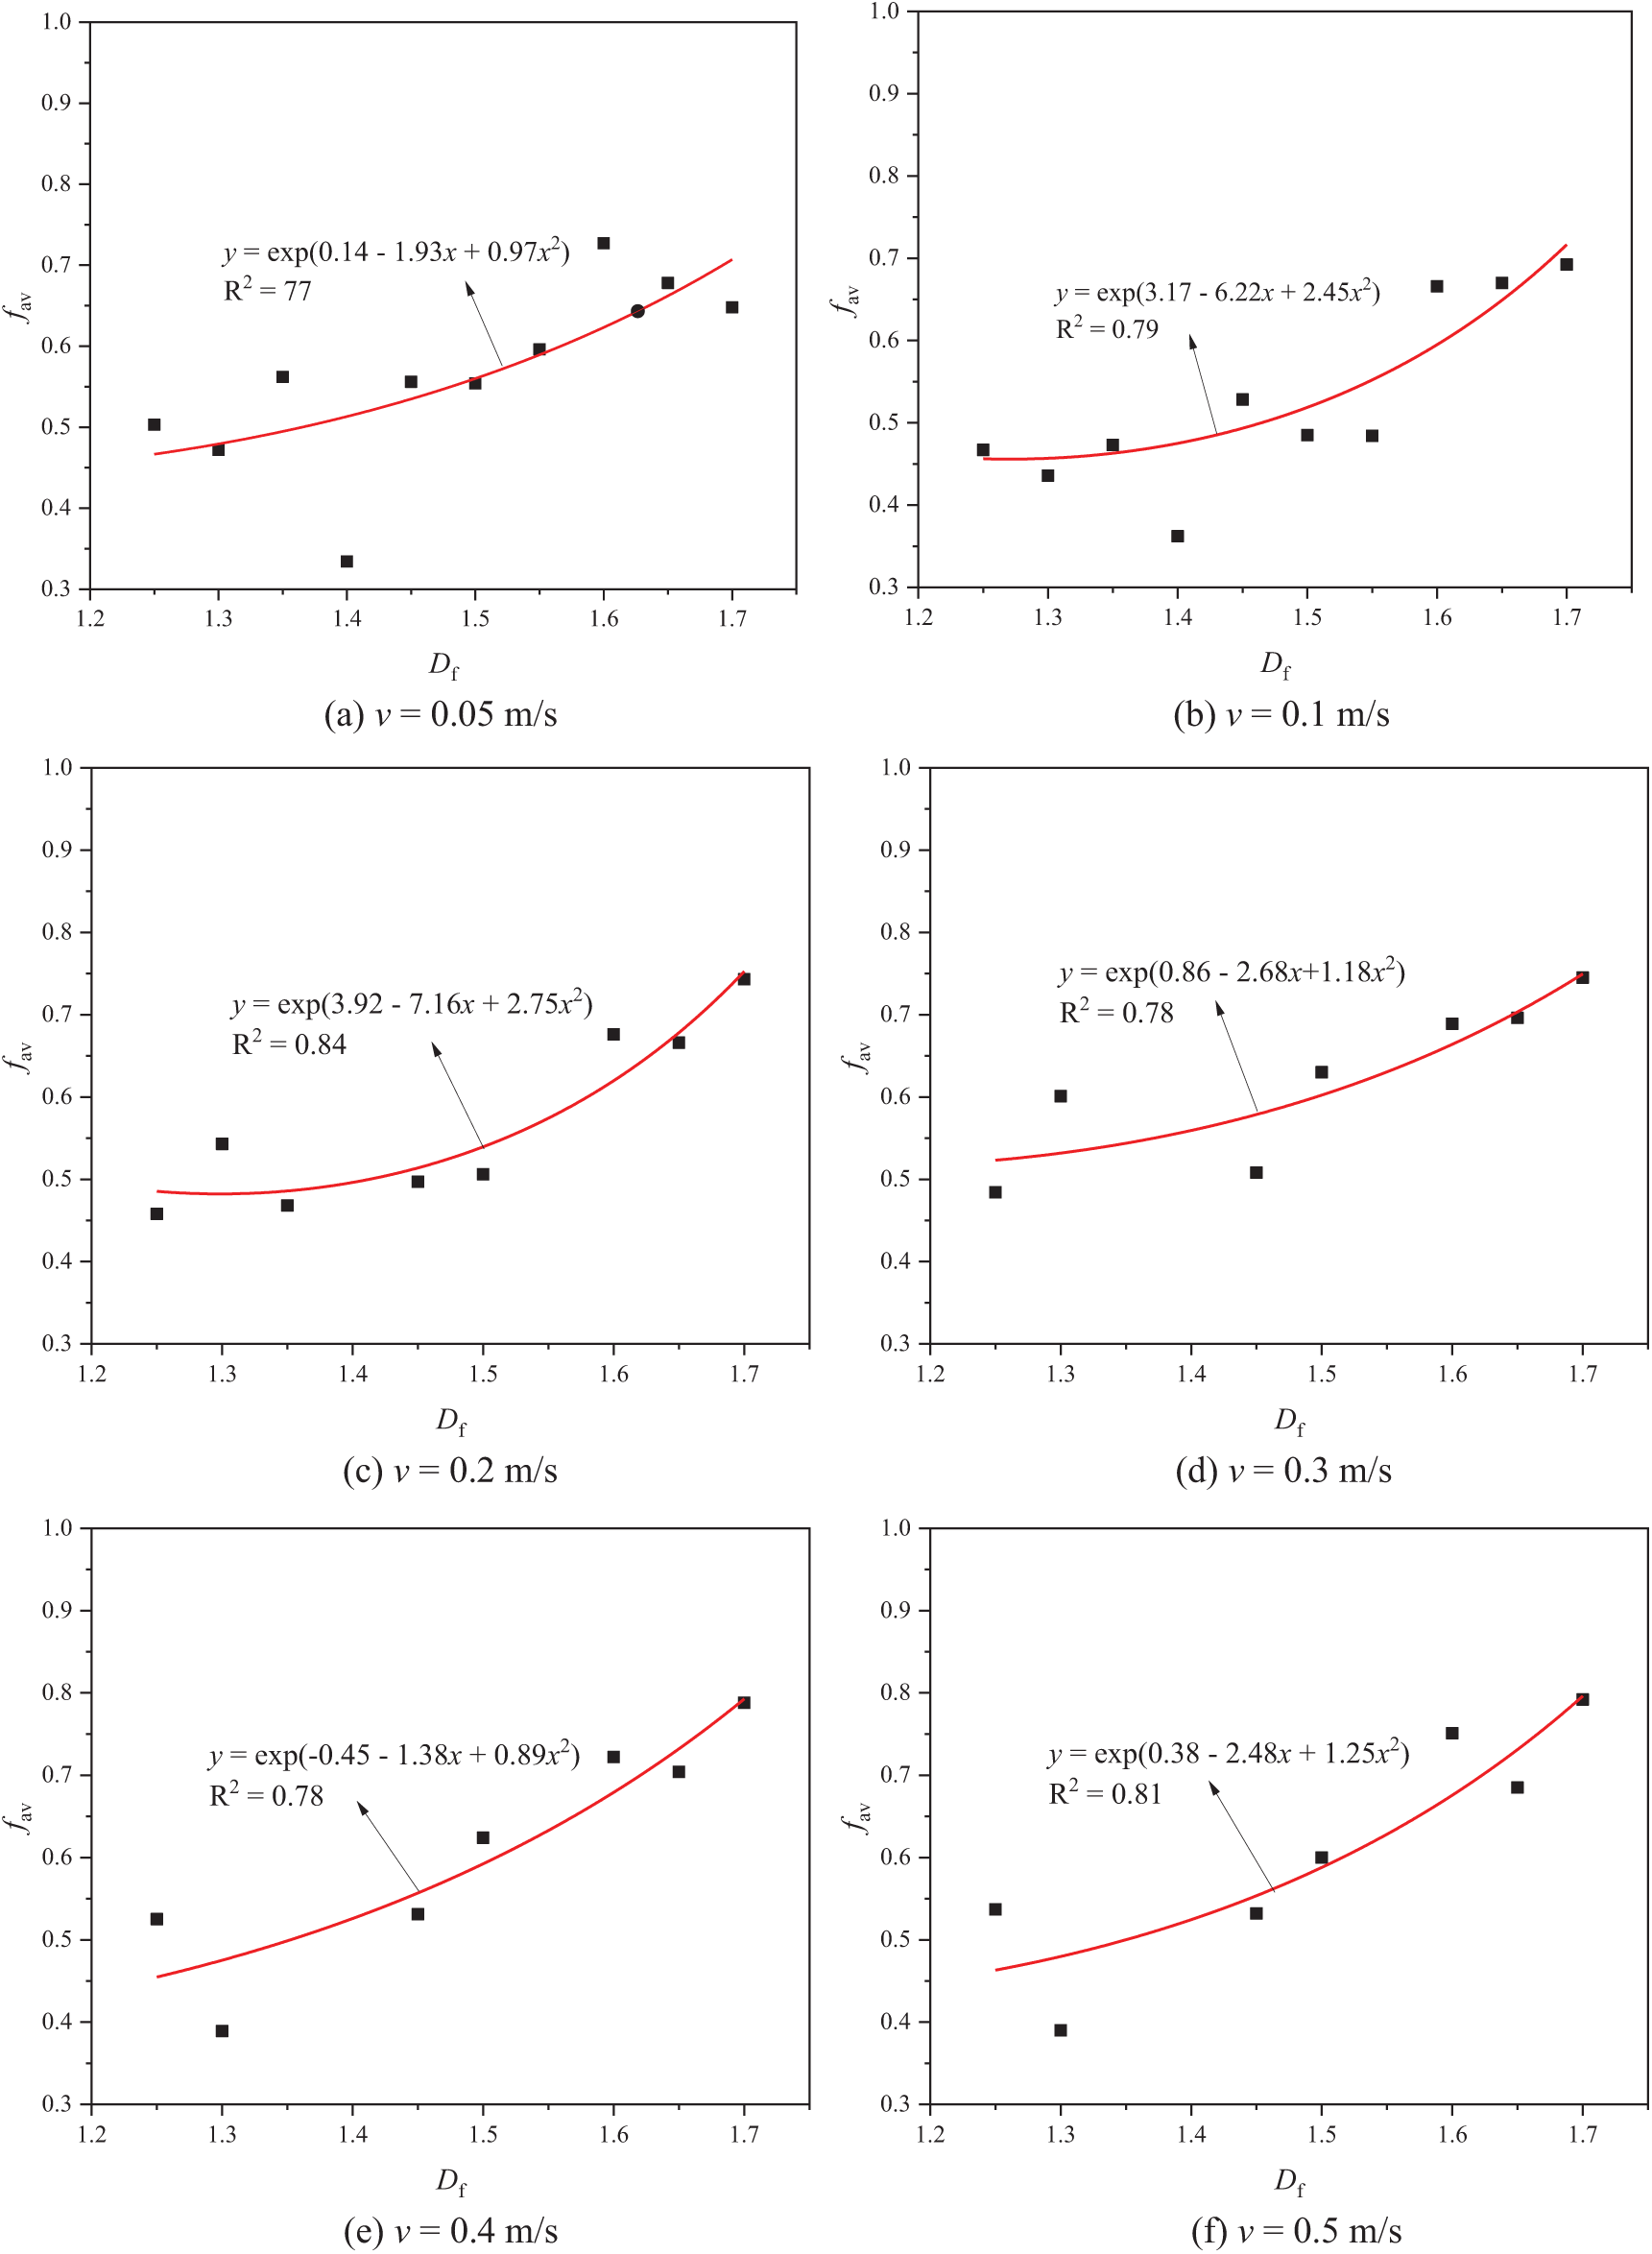
Figure 12: Variations in fav at equilibrium with Df ranging from 1.25 to 1.7 and v ranging from 0.05 to 0.5 m/s
Fractal geometry directly governs energy dissipation and turbulence generation through the self-similarity and multiscale connectivity of pore networks. With increasing
This study systematically investigates the complex mechanisms of gas-driven liquid displacement in ten fractal porous media through a series of pore-scale numerical simulations. The results elucidate the nonlinear regulatory role of fractal dimension in governing both pore structure characteristics and dynamic flow behavior. The main conclusions are summarized as follows.
Smaller Df models (1.25~1.45) exhibit accelerated viscous fingering instability behaviors, with peak air velocities reaching 1.73 m/s at Df = 1.45, compared to 2.19 m/s at Df = 1.7. This disparity stems from simplified dual-scale pore structures in low-Df systems, dominated by narrow primary channels (mean hydraulic diameter that is 17.03 mm at Df = 1.25) and sparse secondary pores. As Df increases from 1.25 to 1.7, the tortuosity increases by 1.8 times, delaying breakthrough time and amplifying localized flow resistance, as evidenced by a pressure difference surge from 0.4 Pa (Df = 1.25) to 6.3 Pa (Df = 1.3). The enhanced surface complexity in higher-Df models reduces local curvature radii, amplifying vorticity generation by about 3 times. The peak eddy viscosity reaches 0.033 Pa·s at Df = 1.7, which is significantly higher than 0.0057 Pa·s at Df = 1.3. The vortices predominantly form at interfaces between higher-velocity zones (e.g., preferential channels) and stagnant regions, driven by shear layer instabilities. These dynamics correlate with nonlinear increases in turbulent kinetic energy dissipation, as confirmed by vorticity transport equation analyses. The pressure difference (ΔP) transits from a sharp increase (0.4–6.3 Pa over Df = 1.25–1.3) to a plateau (4.8 Pa at Df = 1.7), indicating a shift from viscous to inertia-dominated regimes. The equilibrium gas volume fraction (fav) increases nonlinearly with Df, reaching 0.692 at Df = 1.7, driven by residual gas saturation (specific surface area increase) and turbulence-induced bubble dispersion (eddy viscosity that is 0.033 Pa·s). The flow velocity modulates these effects. The fav peaks at 0.72 under low-velocity capillary dominance (v = 0.05 m/s) but declines to 0.65 at v = 0.5 m/s due to inertial forces.
The current model is suitable for two-dimensional simplified structures. Future works will incorporate higher-resolution 3D pore network reconstructions using CT imaging to achieve realistic geometries. Moreover, by coupling the effects between wettability gradients and fractal characteristics, the rheological behavior of non-Newtonian fluids in fractal media, and multi-physics interactions involving thermal and chemical processes will be the key areas of exploration.
Acknowledgement: We gratefully acknowledge the National Key R&D Program of China and the National Natural Science Foundation of China.
Funding Statement: This study has been partially funded by the National Key R&D Program of China, China (Grant No. 2023YFB4005500), National Natural Science Foundation of China, China (Grant Nos. 52379113 and 52379114).
Author Contributions: Xiaolin Wang contributed toward investigation, data curation, methodology, writing—original draft, and writing—review and editing; Richeng Liu contributed toward conceptualization, methodology, and funding acquisition; Kai Qiu contributed toward writing—review and editing; Zhongzhong Liu contributed toward methodology and funding acquisition; Shisen Zhao contributed toward data curation and funding acquisition; Shuchen Li contributed toward conceptualization, and writing—review and editing. All authors reviewed the results and approved the final version of the manuscript.
Availability of Data and Materials: The authors confirm that the data supporting the findings of this study are available within the article.
Ethics Approval: Not applicable.
Conflicts of Interest: The authors declare no conflicts of interest to report regarding the present study.
References
1. Babadagli T. Development of mature oil fields—a review. J Pet Sci Eng. 2007;57(3–4):221–46. doi:10.1016/j.petrol.2006.10.006. [Google Scholar] [CrossRef]
2. Nishikawara M, Matsuda J, Yokoyama H, Yanada H. Visualization study of liquid-vapor phase displacement between wall and porous media in drainage process of two-phase loop. Int J Therm Sci. 2024;195:108652. doi:10.1016/j.ijthermalsci.2023.108652. [Google Scholar] [CrossRef]
3. Li Q, Wu Z, Li X. Prediction of CO2 leakage during sequestration into marine sedimentary strata. Energy Convers Manag. 2009;50(3):503–9. doi:10.1016/j.enconman.2008.11.011. [Google Scholar] [CrossRef]
4. Konopka TF, Carvalho MS. Two-phase flow in heterogeneous porous media based on Brinkman and Darcy models. Comput Geosci. 2025;29(1):4. doi:10.1007/s10596-024-10333-7. [Google Scholar] [CrossRef]
5. Janssen H. A comment on Lattice Boltzmann simulation and fractal analysis of effective thermal conductivity in porous media. Appl Therm Eng. 2024;243:122646. doi:10.1016/j.applthermaleng.2024.122646. [Google Scholar] [CrossRef]
6. Morales FA, Aristizábal LC. A discussion on the transmission conditions for saturated fluid flow through porous media with fractal microstructure. Fractals. 2019;27(3):1950033. doi:10.1142/S0218348X19500336. [Google Scholar] [CrossRef]
7. Tan X-H, Kui M-Q, Li X-P, Mao Z-L, Xiao H. Permeability and porosity models of bi-fractal porous media. Int J Mod Phys B. 2017;31(29):1750219. doi:10.1142/S0217979217502198. [Google Scholar] [CrossRef]
8. Verma A, Pitchumani R. Fractal description of microstructures and properties of dynamically evolving porous media. Int Commun Heat Mass Transf. 2017;81(1):51–5. doi:10.1016/j.icheatmasstransfer.2016.11.008. [Google Scholar] [CrossRef]
9. Xu P. A discussion on fractal models for transport physics of porous media. Fractals. 2015;23(03):1530001. doi:10.1142/S0218348X15300019. [Google Scholar] [CrossRef]
10. Shi H, Ma Q, Chen Z, Su H, Li H, Xu Q. Numerical and experimental study on fractal flow field for improving the performance of non-aqueous redox flow battery. J Energy Storage. 2024;100(8):113460. doi:10.1016/j.est.2024.113460. [Google Scholar] [CrossRef]
11. Ren Z, Dong W, Dong X. Analysis of fractal and erosion characteristics of aeolian sand concrete pore structure under capillary absorption. J Build Eng. 2025;104(4):112258. doi:10.1016/j.jobe.2025.112258. [Google Scholar] [CrossRef]
12. Liu F, Yang M, Wu K, Zong J, Song H, Wang F. Pore structure characterization and permeability prediction with fractal theory considering the tortuosity effect. Fuel. 2025;394(16):134978. doi:10.1016/j.fuel.2025.134978. [Google Scholar] [CrossRef]
13. Gharbi RBC, Qasem F, Peters EJ. A relationship between the fractal dimension and scaling groups of unstable miscible displacements. Exp Fluids. 2001;2001(31):357–66. doi:10.1007/s003480100278. [Google Scholar] [CrossRef]
14. Sheng J, Huang T, Ye Z, Hu B, Liu Y, Fan Q. Evaluation of van Genuchten-Mualem model on the relative permeability for unsaturated flow in aperture-based fractures. J Hydrol. 2019;576(8):315–24. doi:10.1016/j.jhydrol.2019.06.047. [Google Scholar] [CrossRef]
15. Wang D, Qiao J, Zhou H, Li W, Song Y. Numerical analysis of CO2 and water displacement in natural rock cores based on a fully heterogeneous model. J Hydrol Eng. 2016;21(3):04015070. doi:10.1061/(ASCE)HE.1943-5584.0001319. [Google Scholar] [CrossRef]
16. Le Van S, Khishvand M, Akbarabadi M, Piri M, Nagarajan N. Oil recovery from tight reservoirs during natural depletion and cyclic gas injection: an experimental study using live fluids on a fractured reservoir whole core sample. Energy & Fuels. 2025;39(7):3407–21. doi:10.1021/acs.energyfuels.4c05329. [Google Scholar] [CrossRef]
17. Belyi VN, Malevich VL, Shraiber Y, Khilo NA. Monte-Carlo simulation of light scattering in fractal porous media. J Appl Spectrosc. 2008;75(2):199–202. doi:10.1007/s10812-008-9031-8. [Google Scholar] [CrossRef]
18. Yu B, Zou M, Feng Y. Permeability of fractal porous media by Monte Carlo simulations. Int J Heat Mass Transf. 2005;48(13):2787–94. doi:10.1016/j.ijheatmasstransfer.2005.02.008. [Google Scholar] [CrossRef]
19. Lai B, Wang H, Du Y, Xiao G. Reactive direct simulation Monte Carlo modeling of gas reactive transport in three dimensional porous fibrous media across rarefied to continuum regimes. Int Commun Heat Mass Transf. 2024;156(1):107601. doi:10.1016/j.icheatmasstransfer.2024.107601. [Google Scholar] [CrossRef]
20. Maritan A, Cieplak M, Bellini T, Banavar JR. Nematic-isotropic transition in porous media. Phys Rev Lett. 1994;72(26):4113–6. doi:10.1103/PhysRevLett.72.4113. [Google Scholar] [PubMed] [CrossRef]
21. Venu K, Sastry VSS, Murthy KPN. Nematic-isotropic transition in porous media—a Monte Carlo study. Europhys Lett. 2002;58(5):646–52. doi:10.1209/epl/i2002-00398-1. [Google Scholar] [CrossRef]
22. Zheng Q, Li X. Gas diffusion coefficient of fractal porous media by Monte Carlo simulations. Fractals. 2015;23(2):1550012. doi:10.1142/S0218348X15500127. [Google Scholar] [CrossRef]
23. Wu J, Yu B. A fractal resistance model for flow through porous media. Int J Heat Mass Transf. 2007;50(19–20):3925–32. doi:10.1016/j.ijheatmasstransfer.2007.02.009. [Google Scholar] [CrossRef]
24. Yu B, Cheng P. A fractal permeability model for bi-dispersed porous media. Int J Heat Mass Transf. 2002;45(14):2983–93. doi:10.1016/S0017-9310(02)00014-5. [Google Scholar] [CrossRef]
25. Yun M, Yu B, Cai J. A fractal model for the starting pressure gradient for Bingham fluids in porous media. Int J Heat Mass Transf. 2008;51(5–6):1402–8. doi:10.1016/j.ijheatmasstransfer.2007.11.016. [Google Scholar] [CrossRef]
26. Sirivithayapakorn S, Keller A. Transport of colloids in saturated porous media: a pore-scale observation of the size exclusion effect and colloid acceleration. Water Resour Res. 2003;39(4):2002WR001583. doi:10.1029/2002WR001583. [Google Scholar] [CrossRef]
27. Yu B, Li J. Some fractal characteristics of porous media. Fractals. 2001;9(3):365–72. doi:10.1142/s0218348x01000804. [Google Scholar] [CrossRef]
28. Huang T, Du P, Peng X, Wang P, Zou G. Pressure drop and fractal non-Darcy coefficient model for fluid flow through porous media. J Pet Sci Eng. 2020;184(8):106579. doi:10.1016/j.petrol.2019.106579. [Google Scholar] [CrossRef]
29. Yuan S, Zhang L, Li T, Qi T, Hui D. Study of gas-liquid two-phase flow characteristics at the pore scale based on the VOF model. Energies. 2025;18(2):316. doi:10.3390/en18020316. [Google Scholar] [CrossRef]
30. Liu J, Ju Y, Zhang Y, Gong W. Preferential paths of air-water two-phase flow in porous structures with special consideration of channel thickness effects. Sci Rep. 2019;9(1):16204. doi:10.1038/s41598-019-52569-9. [Google Scholar] [PubMed] [CrossRef]
31. Katz AJ, Thompson AH. Fractal sandstone pores: implications for conductivity and pore formation. Phys Rev Lett. 1985;54(12):1325–8. doi:10.1103/PhysRevLett.54.1325. [Google Scholar] [PubMed] [CrossRef]
32. Bao K, Lavrov A, Nilsen HM. Numerical modeling of non-Newtonian fluid flow in fractures and porous media. Comput Geosci. 2017;21(5–6):1313–24. doi:10.1007/s10596-017-9639-y. [Google Scholar] [CrossRef]
33. Sontti SG, Atta A. CFD analysis of microfluidic droplet formation in non-Newtonian liquid. Chem Eng J. 2017;330:245–61. doi:10.1016/j.cej.2017.07.097. [Google Scholar] [CrossRef]
34. Brackbill JU, Kothe DB, Zemach C. A continuum method for modeling surface tension. J Comput Phys. 1992;100(2):335–54. doi:10.1016/0021-9991(92)90240-Y. [Google Scholar] [CrossRef]
35. Liu H, Valocchi AJ, Werth C, Kang Q, Oostrom M. Pore-scale simulation of liquid CO2 displacement of water using a two-phase lattice Boltzmann model. Adv Water Resour. 2014;73(20):144–58. doi:10.1016/j.advwatres.2014.07.010. [Google Scholar] [CrossRef]
36. Blagojevič M, Hočevar M, Bizjan B, Drešar P, Kolbl Repinc S, Rak G. Three-dimensional numerical simulation of a two-phase supercritical open channel junction flow. Water. 2024;16(12):1757. doi:10.3390/w16121757. [Google Scholar] [CrossRef]
37. Bor A, Szabo-Meszaros M, Vereide K, Lia L. Application of three-dimensional CFD model to determination of the capacity of existing Tyrolean intake. Water. 2024;16(5):737. doi:10.3390/w16050737. [Google Scholar] [CrossRef]
38. Garoosi F, Kantzas A, Irani M. Numerical simulation of wave interaction with porous structure using the coupled Volume-Of-Fluid (VOF) and Darcy-Brinkman-Forchheimer model. Eng Anal Bound Elem. 2024;166:105866. doi:10.1016/j.enganabound.2024.105866. [Google Scholar] [CrossRef]
39. Auset M, Keller AA. Pore-scale processes that control dispersion of colloids in saturated porous media. Water Resour Res. 2004;40(3):2003WR002800. doi:10.1029/2003WR002800. [Google Scholar] [CrossRef]
40. Basirat F, Yang Z, Niemi A. Pore-scale modeling of wettability effects on CO2–brine displacement during geological storage. Adv Water Resour. 2017;109(18):181–95. doi:10.1016/j.advwatres.2017.09.004. [Google Scholar] [CrossRef]
Cite This Article
 Copyright © 2025 The Author(s). Published by Tech Science Press.
This work is licensed under a Creative Commons Attribution 4.0 International License , which permits unrestricted use, distribution, and reproduction in any medium, provided the original work is properly cited.
 Downloads
 Citation Tools