
 Submit a Paper
 Propose a Special lssue
 Open Access
ARTICLE

Dynamic Compressive Behavior and Stress Wave Attenuation Characteristics of Ti-6Al-4V Lattice Structure
1 Department of Mechanics and Engineering Science, Wuhan University of Technology, Wuhan, 430070, China
2 Beijing Special Vehicle Research Institute, Beijing, 100072, China
3 State Key Laboratory of Advanced Technology for Materials Synthesis and Processing, Wuhan University of Technology, Wuhan, 430070, China
* Corresponding Author: Xin Lai. Email:
Computer Modeling in Engineering & Sciences 2025, 144(1), 739-762. https://doi.org/10.32604/cmes.2025.067442
Received 03 May 2025; Accepted 27 June 2025; Issue published 31 July 2025
 View Full Text
 Download PDF
Abstract
This study investigates the dynamic compressive behavior of three periodic lattice structures fabricated from Ti-6Al-4V titanium alloy, each with distinct topologies: simple cubic (SC), body-centered cubic (BCC), and face-centered cubic (FCC). Dynamic compression experiments were conducted using a Split Hopkinson Pressure Bar (SHPB) system, complemented by high-speed imaging to capture real-time deformation and failure mechanisms under impact loading. The influence of cell topology, relative density, and strain rate on dynamic mechanical properties, failure behavior, and stress wave propagation was systematically examined. Finite element modeling was performed, and the simulated results showed good agreement with experimental data. The findings reveal that the dynamic mechanical properties of the lattice structures are generally insensitive to strain rate variations, while failure behavior is predominantly governed by structural configuration. The SC structure exhibited strut buckling and instability-induced fracture, whereas the BCC and FCC structures displayed layer-by-layer crushing with lower strain rate sensitivity. Regarding stress wave propagation, all structures demonstrated significant attenuation capabilities, with the BCC structure achieving the greatest reduction in transmitted wave amplitude and energy. Across all configurations, wave reflection was identified as the primary energy dissipation mechanism. These results provide critical insights into the design of lattice structures for impact mitigation and energy absorption applications.Keywords
Traditional metallic materials have been widely used in aerospace, transportation, and protective equipment. However, with the growing demand for lightweight materials offering high specific strength in modern industry, the performance of these homogeneous materials is increasingly approaching their operational limits. As a result, lattice structures have gained significant attention due to their unique geometric configurations and material distribution, along with their high strength, stiffness, and exceptional energy absorption capabilities [1–3]. Lattice structures are classified as artificially designed periodic porous materials, consisting of regularly arranged and ordered unit cells. The core design principle involves manipulating the failure mode through the anisotropic arrangement of internal struts, thereby promoting stress dispersion and shear band offset in areas of stress concentration [4]. This design not only reduces material usage while maintaining high strength but also effectively absorbs impact energy [5–9]. The unique physical properties of lattice structures give them broad application potential across many high-tech fields [10–12], particularly in scenarios demanding resistance to high loads and rapid impacts [13–15]. The fundamental principle behind lattice materials is governed by their specialized, artificially designed geometric configurations. By precisely adjusting lattice parameters, such as strut diameter, spacing, and arrangement, material properties can be fine-tuned. Extensive research has focused on the design of lattice structures and the modulation of their mechanical characteristics [16,17]. These studies have highlighted the distinct advantages of lattice structures, showing that variations in densification strain and specific strength, dependent on factors like porosity, unit cell dimensions, and connectivity, can be achieved by strategically adjusting multiple influencing parameters.
With the advancement of additive manufacturing technology [18–21], lattice structures fabricated through this process in metal forming offer distinct advantages, such as high precision, low cost, and customization. These benefits have fostered increased research and application of various mechanical properties and functional characteristics. Song et al. [22] utilized additive manufacturing to fabricate bionic sponge lattice structures (SLS) and frame lattice structures (FLS), conducting both experimental and numerical simulation studies. They analyzed the static and dynamic mechanical behavior, as well as the deformation process, of these structures. As loading speed increased, the deformation mode of both structures transitioned from global buckling to local buckling. Based on the body-centered cubic periodic structure, Wang et al. [23] proposed a novel hierarchical topological design. By adjusting the diameter ratio between the slave and main units, the hierarchical structure enabled tunability of mechanical and energy absorption properties. Jin et al. [24] investigated the factors influencing the dynamic behavior of four lattice structures and fitted the power law function of their mechanical properties concerning relative density. Cao et al. [25] examined the dynamic compressive properties of an improved rhombic dodecahedron (RD) lattice structure and introduced a structural shape parameter. Their results showed that as the parameter increased from 0 to 0.3, the dynamic strength, platform stress, and energy absorption capacity of the structure significantly improved. Xiao et al. [26] studied the compression behavior of Ti-6Al-4V lattice structures with rhombic dodecahedral unit cells at four different strain rates. They analyzed the collapse behavior using the rigid power-law hardening (R-PLH) model and predicted the critical velocity for deformation mode transition.
The studies mentioned above demonstrate that there is still significant potential for performance control of lattice structures in various fields. Although progress has been made in the design and research of lattice structural materials [27–31], there is still a relatively limited body of work focused on the mechanical behavior of these materials under dynamic loading conditions, as well as their effects on stress wave propagation and energy absorption properties resulting from impact loads.
This study systematically investigates the dynamic mechanical behavior and stress wave attenuation characteristics of three Ti-6Al-4V lattice structures using a combined experimental and numerical approach. In this analysis, relative density and strain rate are considered as key influencing parameters. Section 2 introduces the three lattice structures and the Split Hopkinson Pressure Bar (SHPB) equipment. In Section 3, a validated finite element model incorporating equivalent homogenization methodology is developed to simulate the mechanical response. Section 4 discusses the results from both the experiments and numerical simulations. Finally, the conclusion is presented in Section 5. It is worth mentioning that mesh-based methods may face limitations when simulating large deformations, localized failure, or material fragmentation. Other alternative approaches, such as the continuum particle method (CPM) introduced in [32], have advantages in capturing complex failure modes and are not limited by mesh distortion. In addition, recent advances in machine learning-based modeling techniques [33] provide powerful tools for learning fracture behavior directly from data. These models can solve forward and inverse problems without spatial discretization, can incorporate uncertainties, and can help optimize material design. Future research can explore the integration of these techniques to complement current physics-based methods and improve the generalization and efficiency of the models.
2.1 Lattice Structure Design and Material Composition
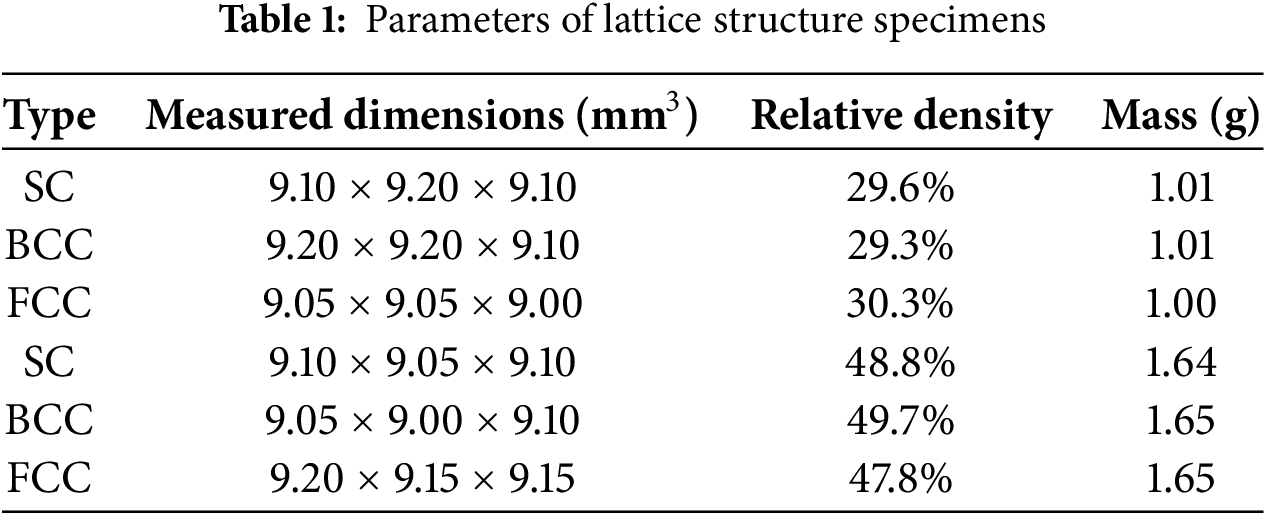
The lattice structure specimens in this experiment are simple cubic structure (SC), body-centered cubic structure (BCC), and face-centered cubic structure (FCC). The size of the lattice structure is determined by the size of the outer space cube. The size of all specimens is 9 mm × 9 mm × 9 mm. Three units are distributed in the X, Y, and Z directions. The ratio of the mass of the lattice structure to the volume of the external space occupied is called apparent density
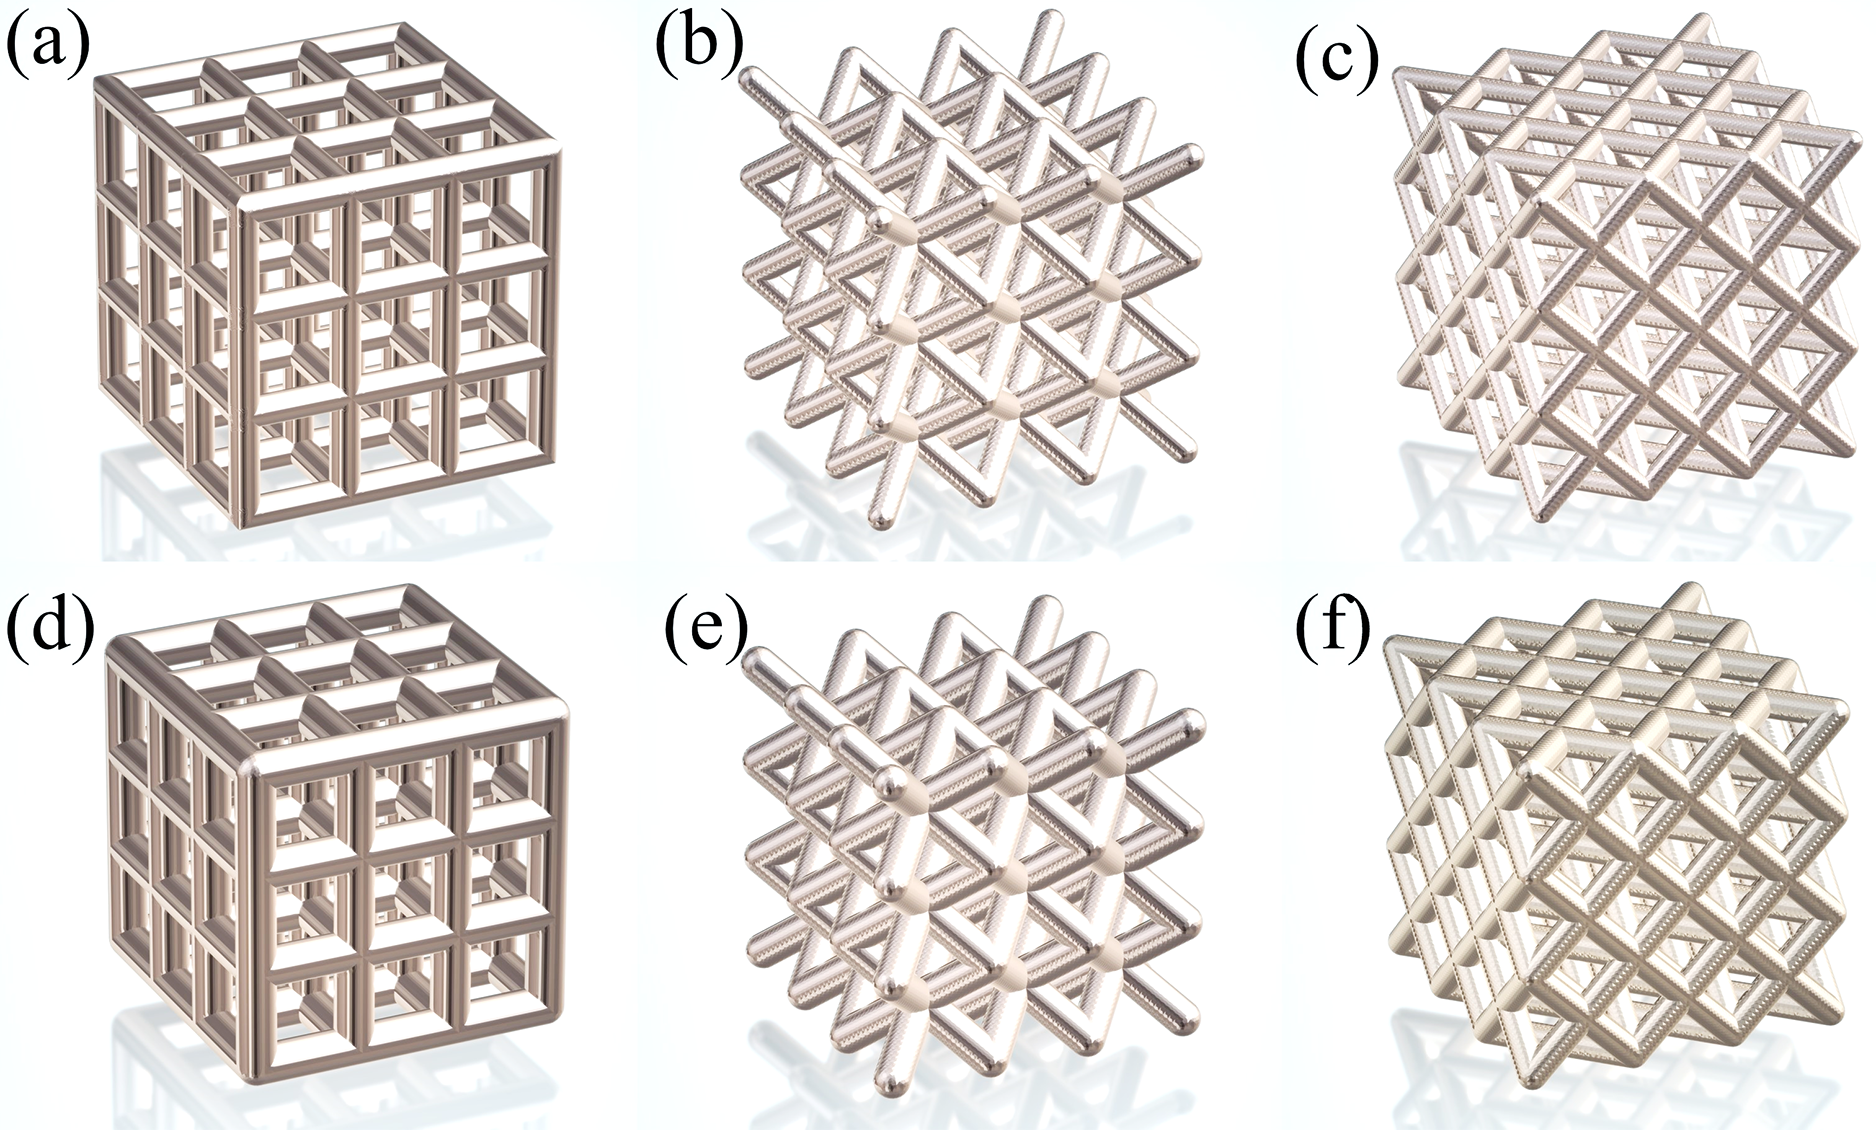
Figure 1: Lattice structure model diagram: (a) SC-30%; (b) BCC-30%; (c) FCC-30%; (d) SC-50%; (e) BCC-50%; (f) FCC-50%
In this experiment, all lattice structure specimens were fabricated from Ti-6Al-4V alloy. Ti-6Al-4V powder with a particle size range of 15–53 μm was used as the raw material for fabricating the lattice structures. The manufacturing process was carried out using a DC035 quasi-continuous CO2 laser system, operating at a laser power between 200 and 320 W and a scanning speed of 600–800 mm/s. The layer thickness and scan spacing were set to 0.05 mm, and the achieved dimensional accuracy was within 0.02 mm. To mitigate the effects of residual stress introduced during the additive manufacturing process, the as-fabricated specimens underwent post-process heat treatment in a vacuum tube furnace with high gas tightness. The heat treatment was performed at temperatures ranging from 700°C to 900°C for durations of 1 to 5 h. The final specimen geometry is illustrated in Fig. 2. The measured parameters of the lattice structure specimens are shown in Table 1.
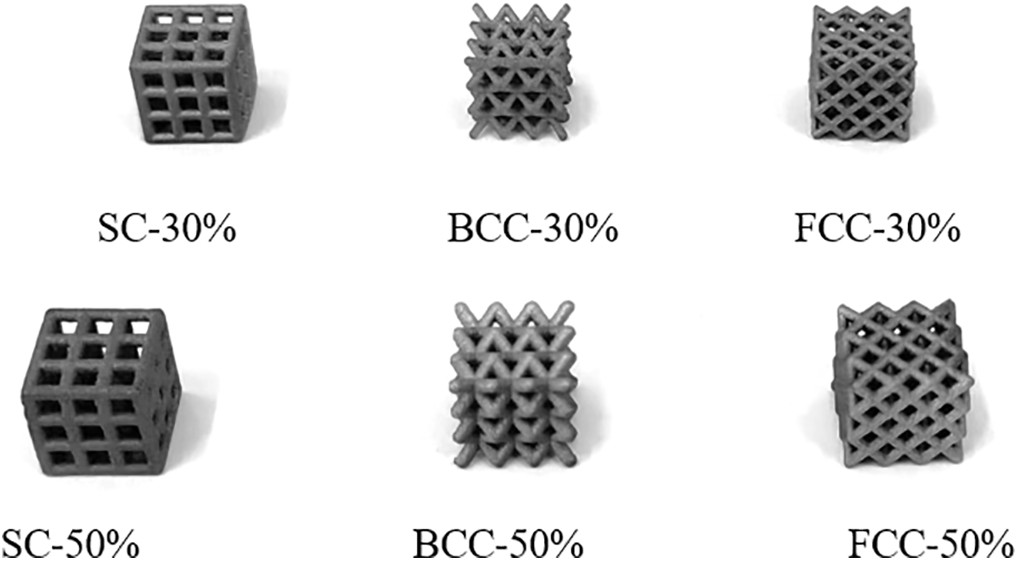
Figure 2: Lattice structure specimen diagram
The Split Hopkinson Pressure Bar (SHPB) system used in this study is illustrated in Fig. 3. It primarily consists of an impact rod, an incident rod, and a transmission rod. The impact rod, housed within a barrel connected to a pressurized air chamber, is propelled by adjusting the gas pressure inside the chamber, thereby generating varying impact velocities and enabling the application of different impact loads. During testing, the specimen is positioned between the incident and transmission rods. All three rods are made of high-strength alloy steel, each with a diameter of 14.5 mm. The impact rod is 300 mm in length, while the incident and transmission rods are each 1500 mm long. Their densities, Young’s modulus, and Poisson’s ratio are 4.47 g/m3, 210 GPa, and 0.3, respectively.
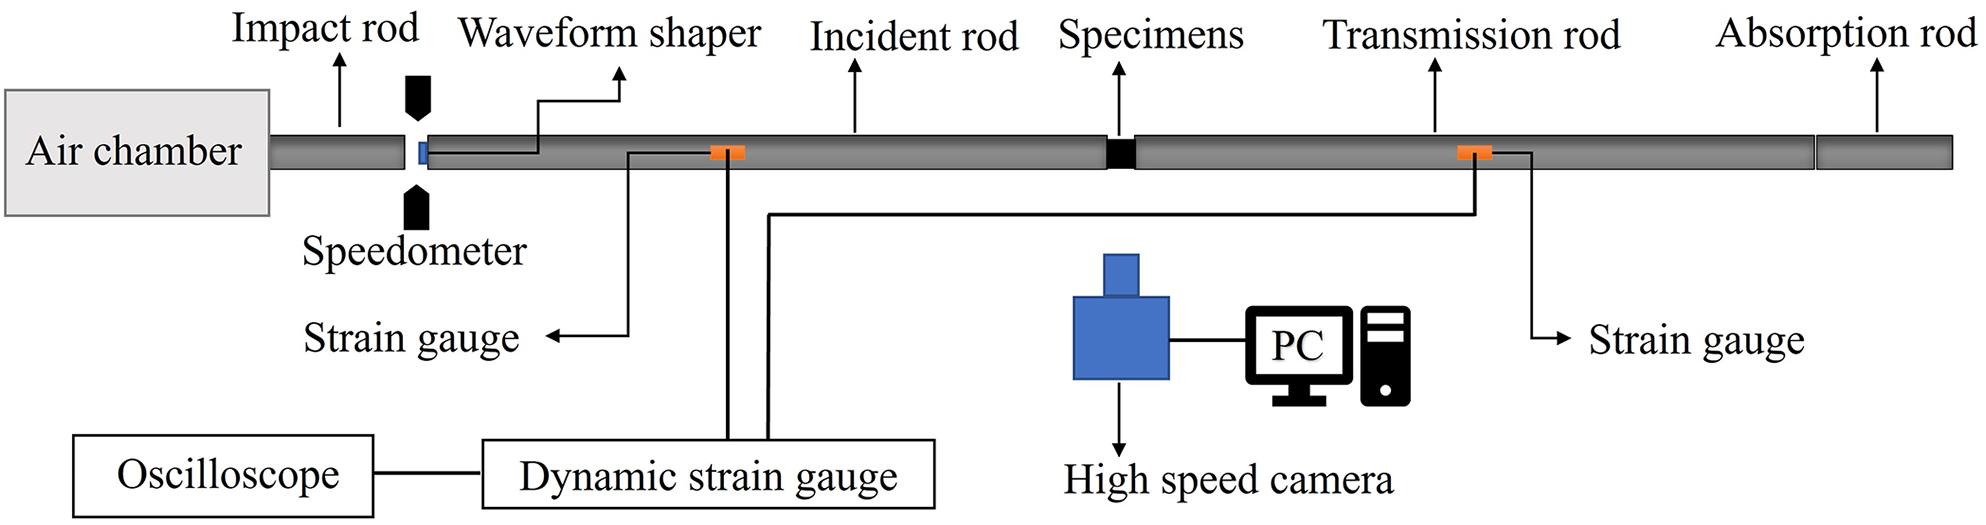
Figure 3: Separate Hopkinson pressure rod system and supporting device schematic diagram
Before each test, the rods are meticulously aligned to ensure one-dimensional stress wave propagation. Two strain gauges, each with a resistance of 120 Ω and a sensitivity coefficient of 2.16, are attached to the mid-span of the incident and transmission rods, respectively. When the impactor strikes the incident rod, an elastic stress wave is generated within it. As the wave propagates through the incident rod and reaches the specimen, a material impedance mismatch causes the generation of a reflected wave, which travels back along the incident rod, and a transmitted wave, which propagates through the specimen into the transmission rod. These waves are recorded by an oscilloscope, converted into voltage signals, and used to calculate the stress values of the incident, reflected, and transmitted waves through appropriate parameter conversions. To capture the deformation and damage behavior of the specimen during the impact event, a high-speed camera (Phantom V2012 model) was used. The camera was set to a frame rate of 100,000 frames per second, corresponding to an image capture interval of 10 μs, with each frame having a resolution of 512 × 320 pixels.
In the current experimental setup, six discrete impact velocities (14.9, 17.3, 19.7, 22.3, 24.5, and 26.3 m/s) were systematically applied to the impact rods to control the strain rate of the lattice structure specimens.
3 Finite Element Modeling and Simulation
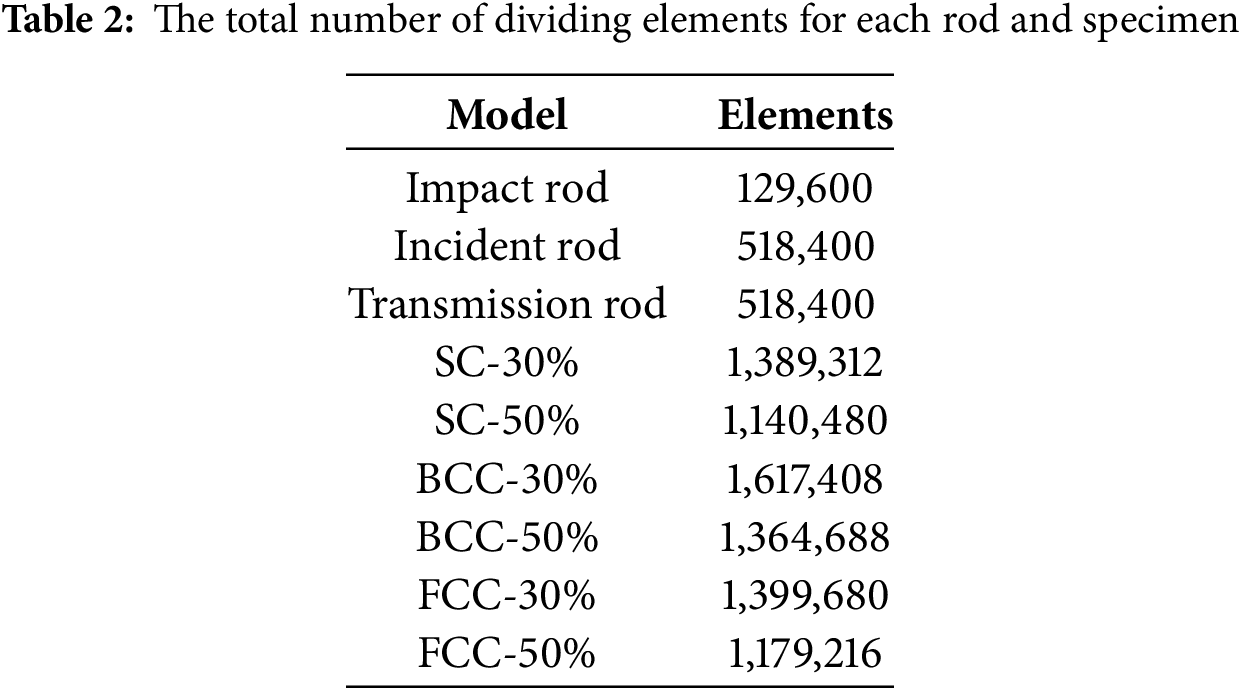
In this section, the commercial finite element software LS-DYNA was used to construct numerical models corresponding to the experimental setup. The impact rod, incident rod, lattice structure specimens, and transmission rod were modeled to replicate the experimental configuration. Among them, the impact rod, incident rod, and transmission rod are cylindrical bodies with lengths of 300, 1500, and 1500 mm, respectively, and their diameters are all 14.5 mm. To accurately simulate the physical impact conditions, all components were discretized using three-dimensional SOLID 164 elements. The element is defined by eight nodes, each node having degrees of freedom with displacement, velocity, and acceleration in the x, y, and z directions. A tangential friction coefficient of 0.2 was applied at the interface between the rods and the specimens. Displacement constraints were enforced on all rods to restrict motion along the Z-axis. The numerical model is shown in Fig. 4. For contact settings, the bidirectional surface-to-surface contact algorithm (*CONTACT_AUTOMATIC_SURFACE_TO_SURFACE) was used for interactions between the impact and incident rods, while the unidirectional point-to-surface contact algorithm (*CONTACT_AUTOMATIC_NODE_TO_SURFACE) was used for the contact between the specimen and the incident and transmission rods.

Figure 4: Finite element model for impacting lattice structure specimen
To ensure computational accuracy and efficiency, a mesh convergence analysis was conducted. As illustrated in Fig. 5, the normalized peak compressive displacement

Figure 5: Mesh convergence analysis results
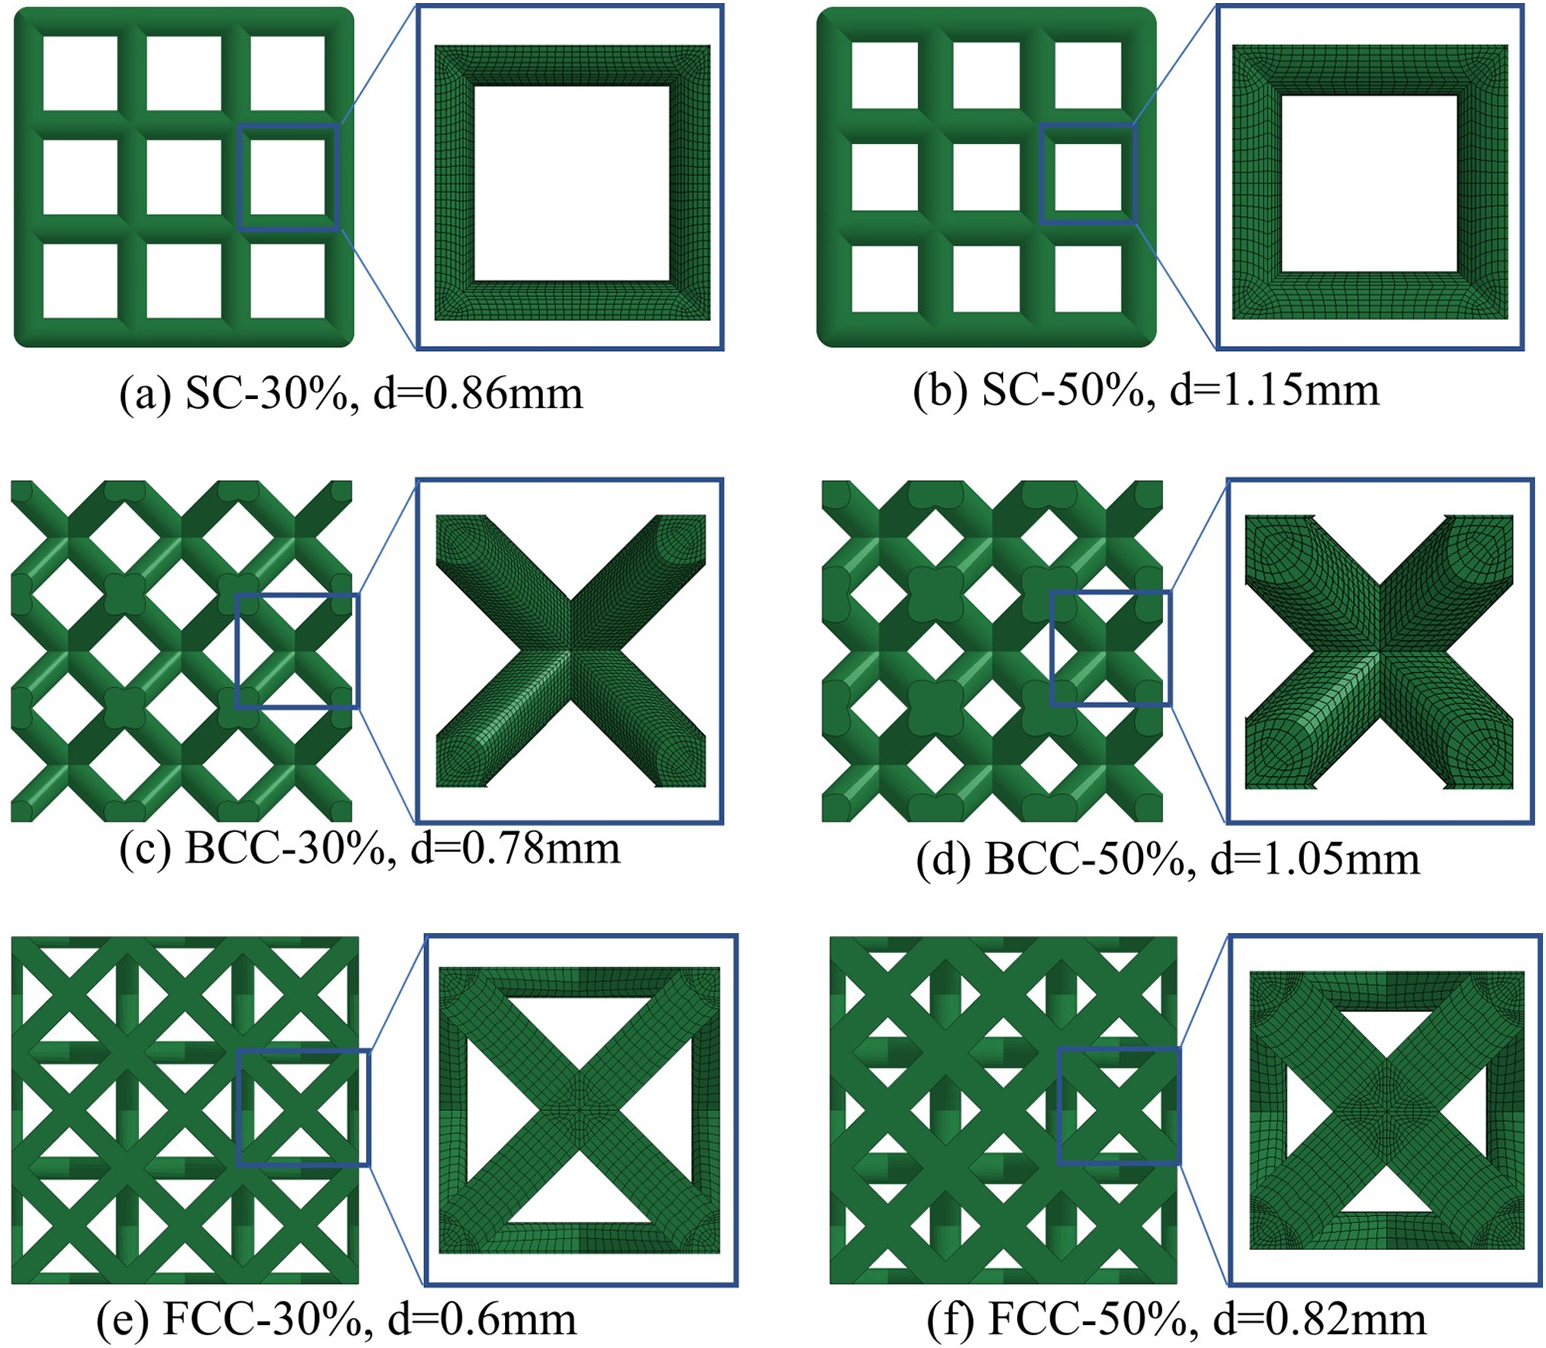
Figure 6: Element models of lattice structures with varying relative densities and diameters of struts: (a) SC-30%; (b) SC-50%; (c) BCC-30%; (d) BCC-50%; (e) FCC-30%; (f) FCC-50%
In the simulation, a step input of constant velocity is applied along the Z-axis to the impact rod to ensure consistency with the experimental conditions. The velocity-time relationship curve is shown in Fig. 7. The velocities were set to 14.9, 17.3, 19.7, 22.3, 24.5, and 26.3 m/s, respectively. The solution time was set to 600 μs, ensuring that the stress wave propagates through the rods, reaches the specimen, reflects, and passes through the specimen into the transmission rod.

Figure 7: Load applied to the impact rod
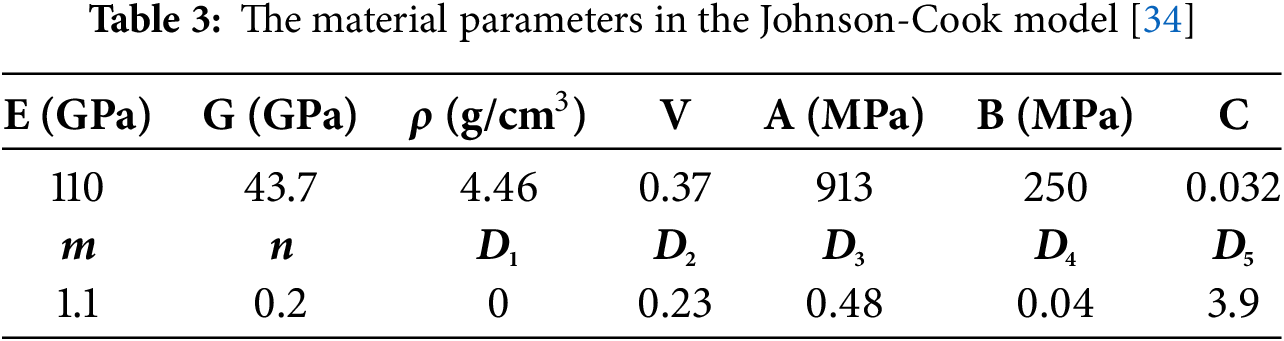
In the analysis of the mechanical properties of the impact rod, incident rod, and transmission rod, it is assumed that these components follow generalized Hooke’s Law and can be accurately modeled as ideal linear elastic materials. Given that the impact velocity is less than 27 m/s, and considering the high-strength materials typically used for the rods, this assumption is valid as the strain rates involved are not high enough to induce significant plastic deformation. For the dynamic compressive behavior of Ti-6Al-4V, the Johnson-Cook (JC) constitutive model is employed, as it effectively accounts for strain rate effects and incorporates failure mechanisms. The yield stress is governed by strain hardening, strain rate hardening, and thermal softening. The yield stress can be calculated using Eq. (1).
where,
where
where
4.1 Stress-Strain Behavior and Strain Rate Effects
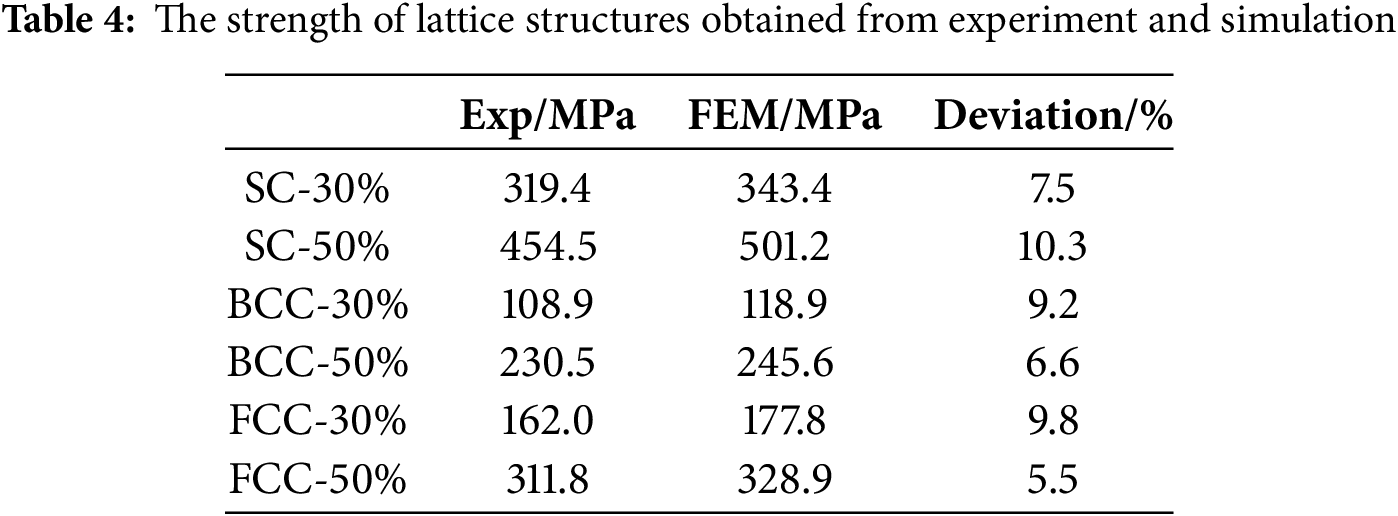
Fig. 8 presents the stress-strain curves obtained from both experiments (EXP) and simulations (Finite Element Method, FEM) at an impact velocity of 17.3 m/s for SC-30%, SC-50%, BCC-30%, BCC-50%, FCC-30%, and FCC-50%. The simulation results consistently show higher specimen strength values compared to the experimental results. The deviation in strength between the simulation and experimental results is within 10.3%, as listed in Table 4. The fabricated lattice structure specimens have rough surfaces, and the struts are non-standard. For instance, in the SC structure, within the strain range of 0.1–0.15, there is a noticeable difference between the experimental and simulation results. These inherent geometric imperfections may affect the mechanical properties of the specimens. Additionally, the idealized boundary and loading conditions in the simulation may contribute to the observed discrepancies between computational predictions and experimental measurements. As a result, differences in strength between the simulation and experimental results are expected. However, judging by the overall trend of the stress-strain curves, there is good consistency between the two, indicating that the simulation is reliable.
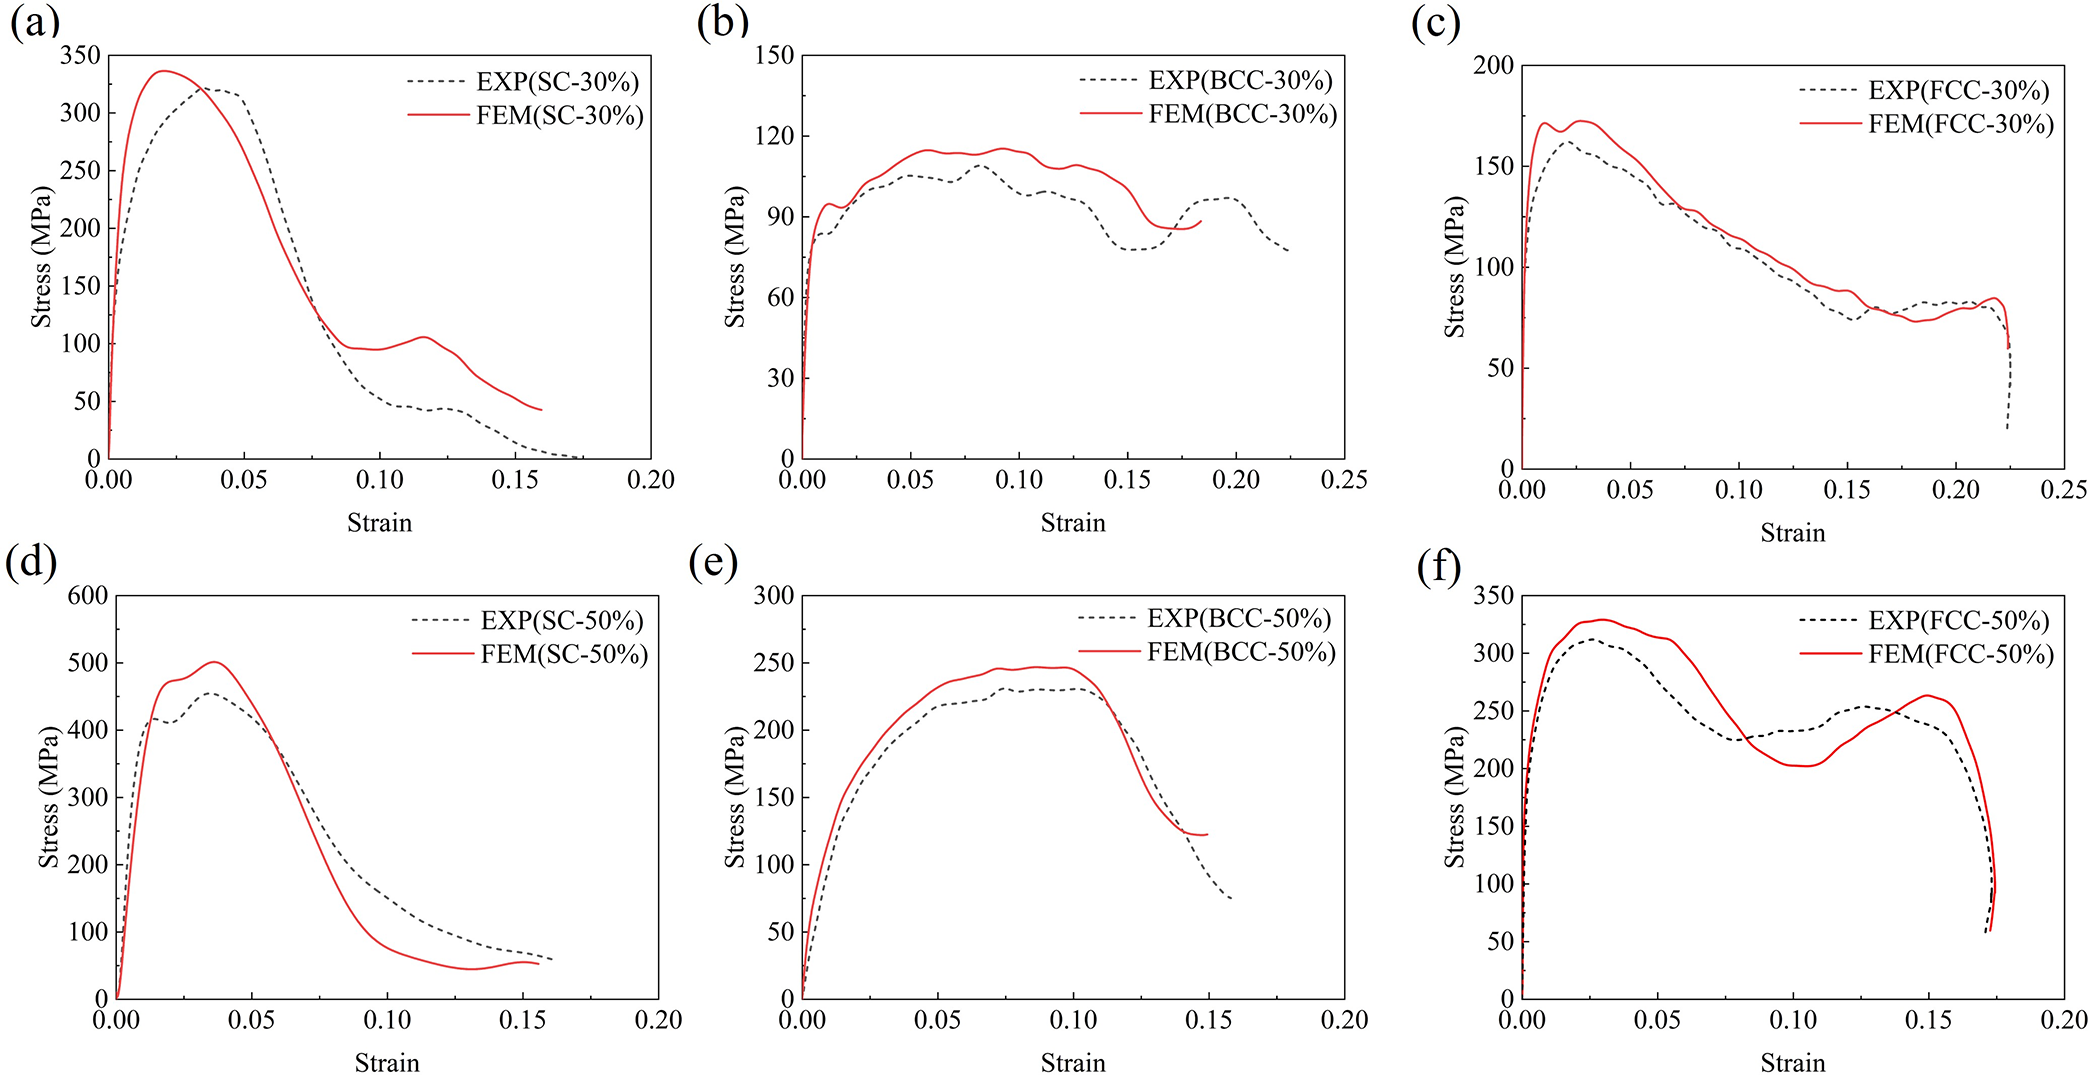
Figure 8: Comparison between simulation (FEM) and experimental (EXP) results for the SHPB experiment: (a) SC-30%; (b) BCC-30%; (c) FCC-30%; (d) SC-50%; (e) BCC-50%; (f) FCC-50%
To investigate the dynamic mechanical response of Ti-6Al-4V titanium alloy lattice structures under varying impact loads, the strain signals
In the formula,
This analysis provided the strain rates and corresponding stress-strain curves for lattice structure specimens under each load condition. Fig. 9 illustrates the stress-strain diagrams for SC, BCC, and FCC structural specimens with two relative densities at six distinct strain rates. The stress-strain curves for these lattice structures exhibit a relatively stable stress plateau at lower strain rates. However, as the strain rate increases, the curves begin to fluctuate and display multiple stress peaks. This phenomenon can be attributed to the fact that, at low impact velocities, the structure does not fail immediately. As the impact velocity increases, initial failure occurs within the specimen, but the impact process continues. Subsequent compression leads to secondary failures. Each failure event produces a stress peak, reflecting the progressive reduction of porosity as the lattice compacts under high-speed impact. Despite significant compaction, the structure retains some strength, which contributes to the observed stress peaks.
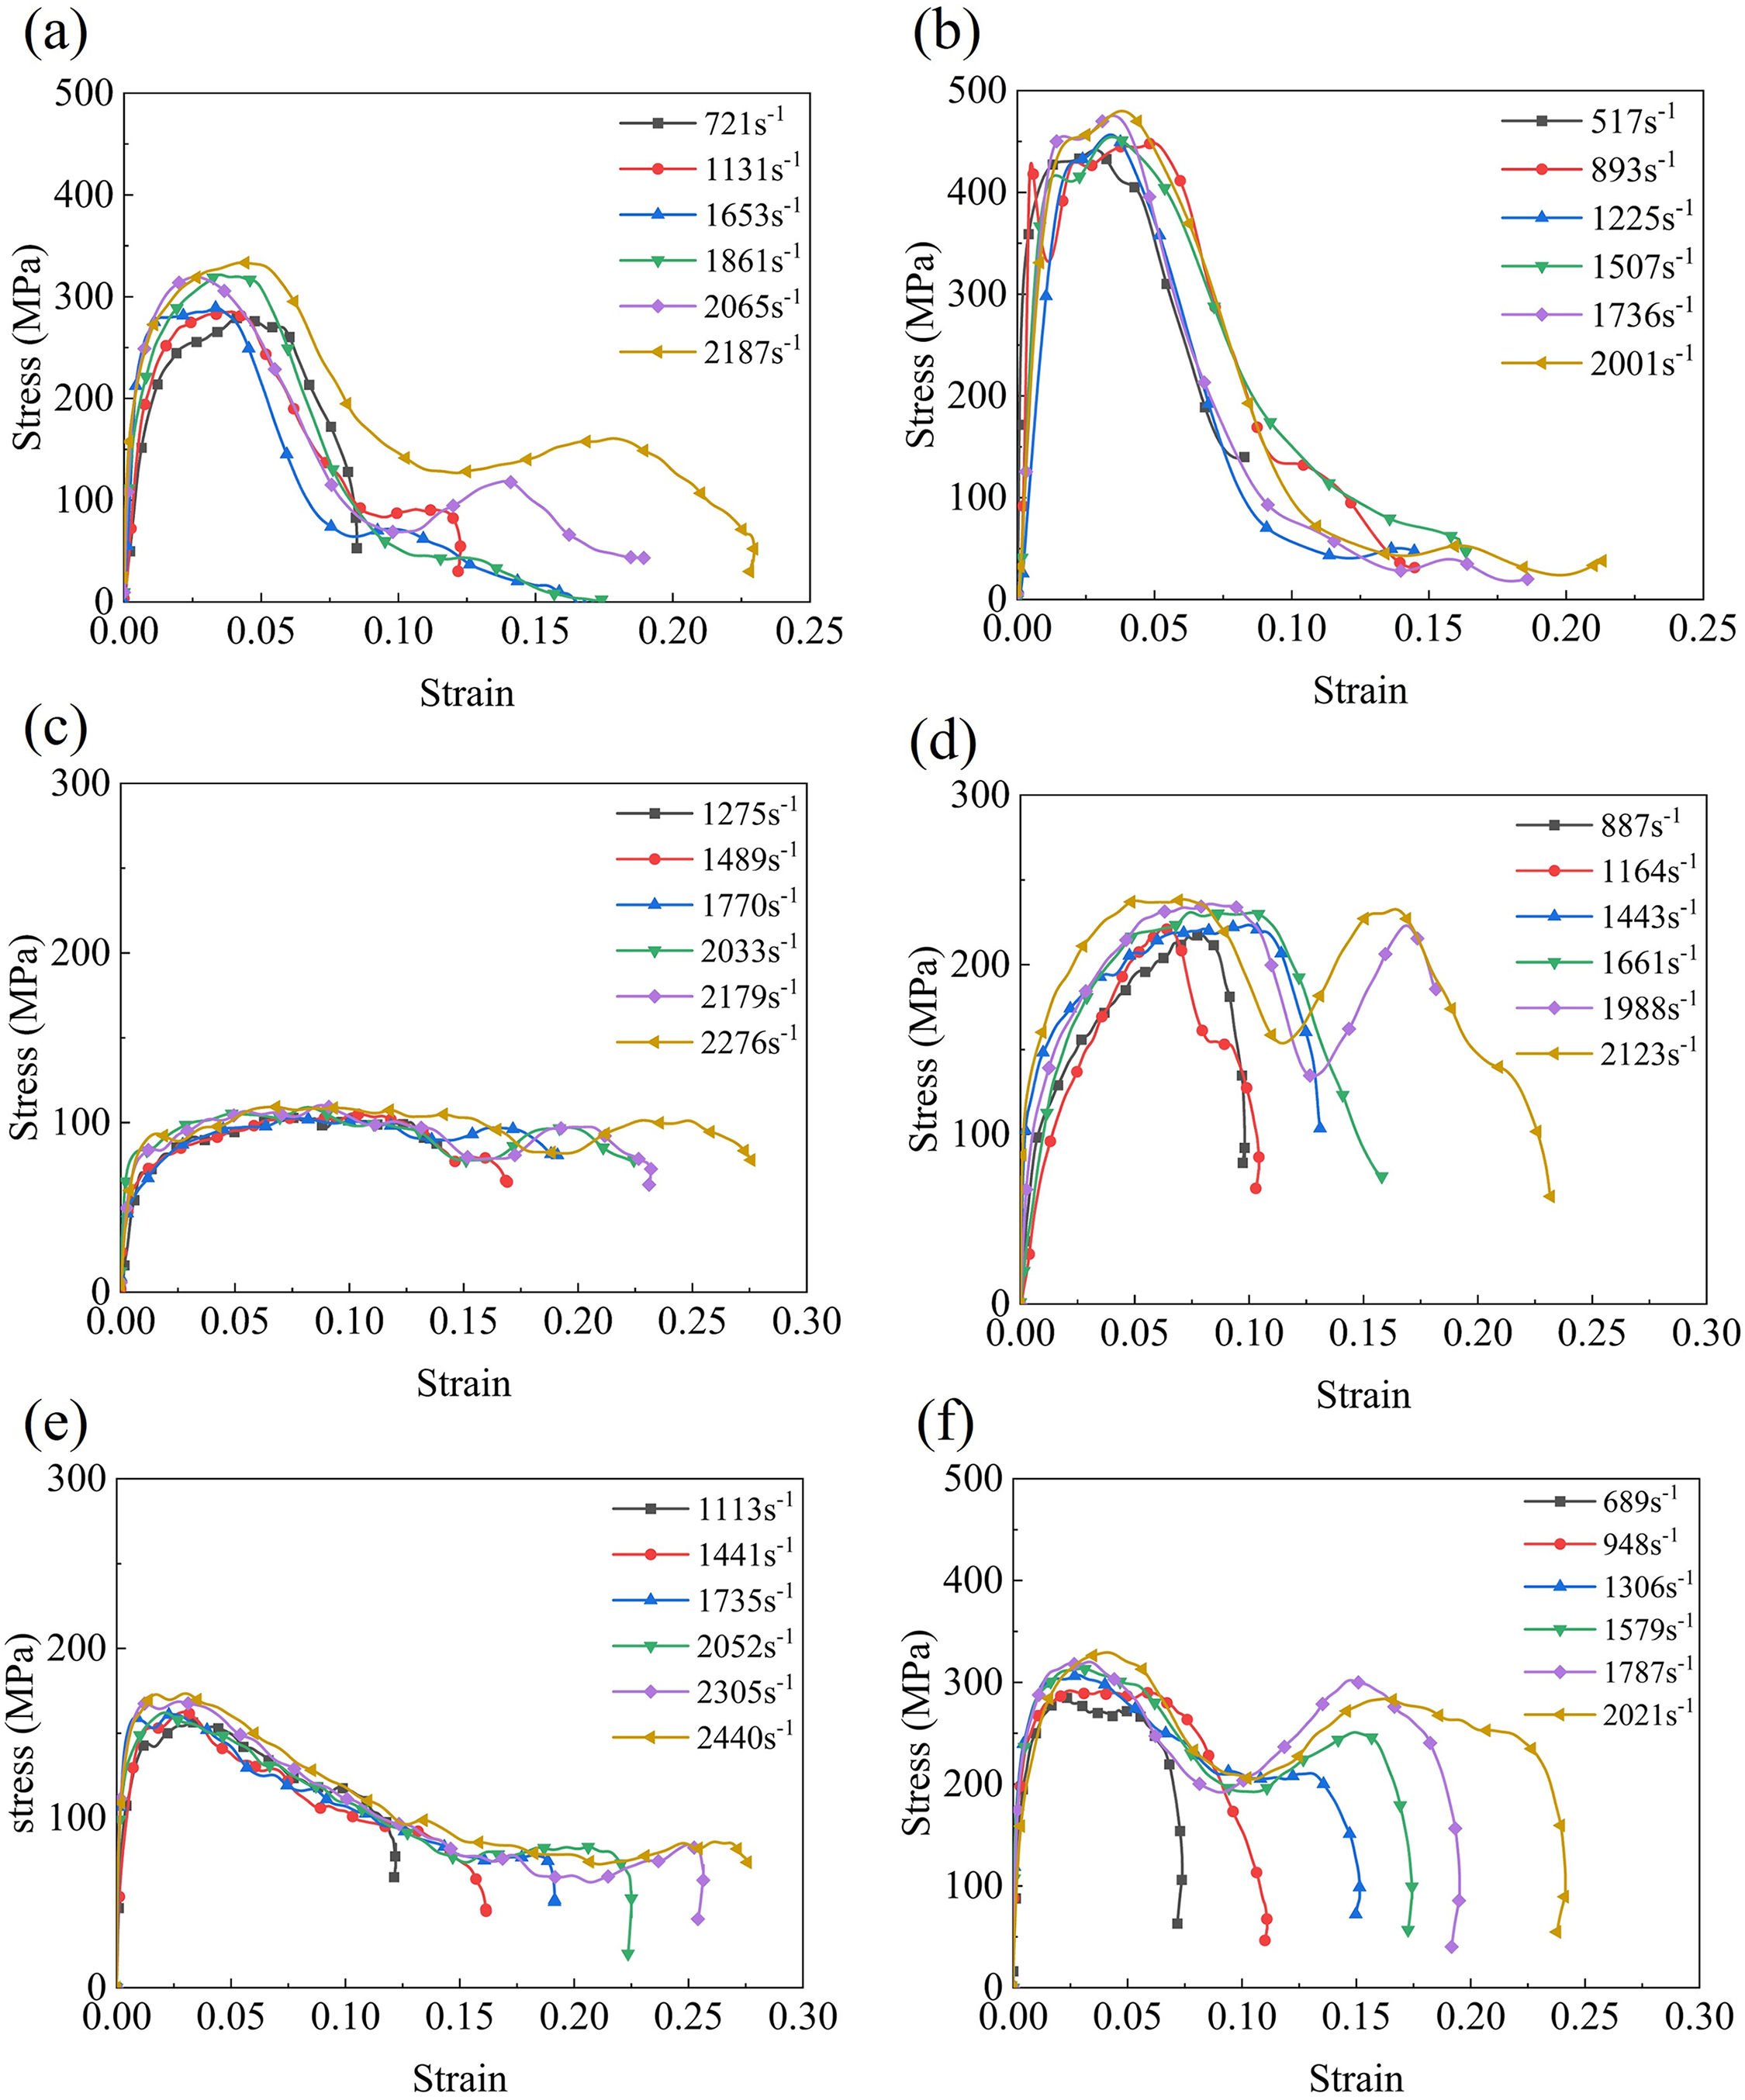
Figure 9: The stress-strain curves of lattice structure specimens under different strain rates are experimented: (a) SC-30%; (b) SC-50%; (c) BCC-30%; (d) BCC-50%; (e) FCC-30%; (f) FCC-50%
The stress evolution patterns and rates of change differ significantly across the investigated lattice structures. Specifically, for the SC structure, the stress plateau phase is brief, with the stress reaching its maximum value at approximately 0.03 strain, followed by a rapid decrease. Notably, in the experimental group with a 50% relative density, no discernible secondary stress peak was observed after the initial stress reduction, irrespective of the applied strain rates. The stress-strain curves for BCC structures exhibit variations depending on relative density. The specimen with a 30% relative density demonstrates a prolonged stress plateau phase and enhanced energy absorption capabilities; however, it also experiences more pronounced stress oscillations. In contrast, for the 50% relative density BCC structure, the secondary stress peak following the initial failure approximates the magnitude of the first peak, which suggests a layer-by-layer failure mechanism for the BCC structure. For the FCC structure, the specimen with a 30% relative density shows a gradual decrease after reaching the stress peak, followed by a plateau phase before unloading. The stress-strain response of the 50% relative density FCC specimen is qualitatively similar to that of the BCC-50% specimen.
Furthermore, to investigate the strain rate sensitivity of lattice structures, Zheng et al. [35] reported that, under high-speed impact, changes in the yield strength of metallic porous materials result from shifts in structural deformation and failure mechanisms. In addition, both the strain rate sensitivity of the matrix material and the micro-inertia effects associated with the structural configuration [36] influence the strength of lattice structures to some extent. Fig. 10 presents the yield strength of all lattice structure specimens across a range of strain rates. Overall, within the experimental strain rate range examined, the variation in yield strength for the BCC and FCC lattice structures is relatively minor.

Figure 10: The strength of lattice structure specimens under different strain rates
4.2 Deformation and Failure Modes
To elucidate the failure modes of the three lattice structures under impact loading, a high-speed camera was employed to capture the full deformation process in real time. Figs. 11–13 present the deformation behavior of SC, BCC, and FCC specimens with a relative density of 30% at impact velocities of 17.3 and 26.3 m/s, respectively. As shown in Fig. 11, in the SC specimens, dynamic compression initiates with compression-induced bending of the horizontal strut (aligned with the impact direction) in the first cell at the incident end. This local bending progresses into instability and plastic deformation as the compressive wave propagates, leading to transverse slip deformation of the lattice. Consequently, crushing fractures and lateral displacement occur, accompanied by a sharp stress drop, signifying sudden structural failure. As shown in Fig. 9a, when the strain reaches approximately 0.043, the stress drops sharply, indicating the initiation of fracture and failure in the SC structure, which leads to a rapid unloading of the stress carried by the supporting struts. Following this unloading, the specimen transitions into a densification phase. During this stage, ongoing plastic deformation and fracture generate crushed debris that accumulates within the internal voids, reducing porosity and driving a progressive increase in stress with further strain. As the strain exceeds 0.112, the stress begins to rise again, suggesting secondary contact or densification effects within the damaged structure.

Figure 11: Deformation and failure behavior of the SC structure during the impact process. (a) The impact velocity is 17.3 m/s; (b) The impact velocity is 26.3 m/s
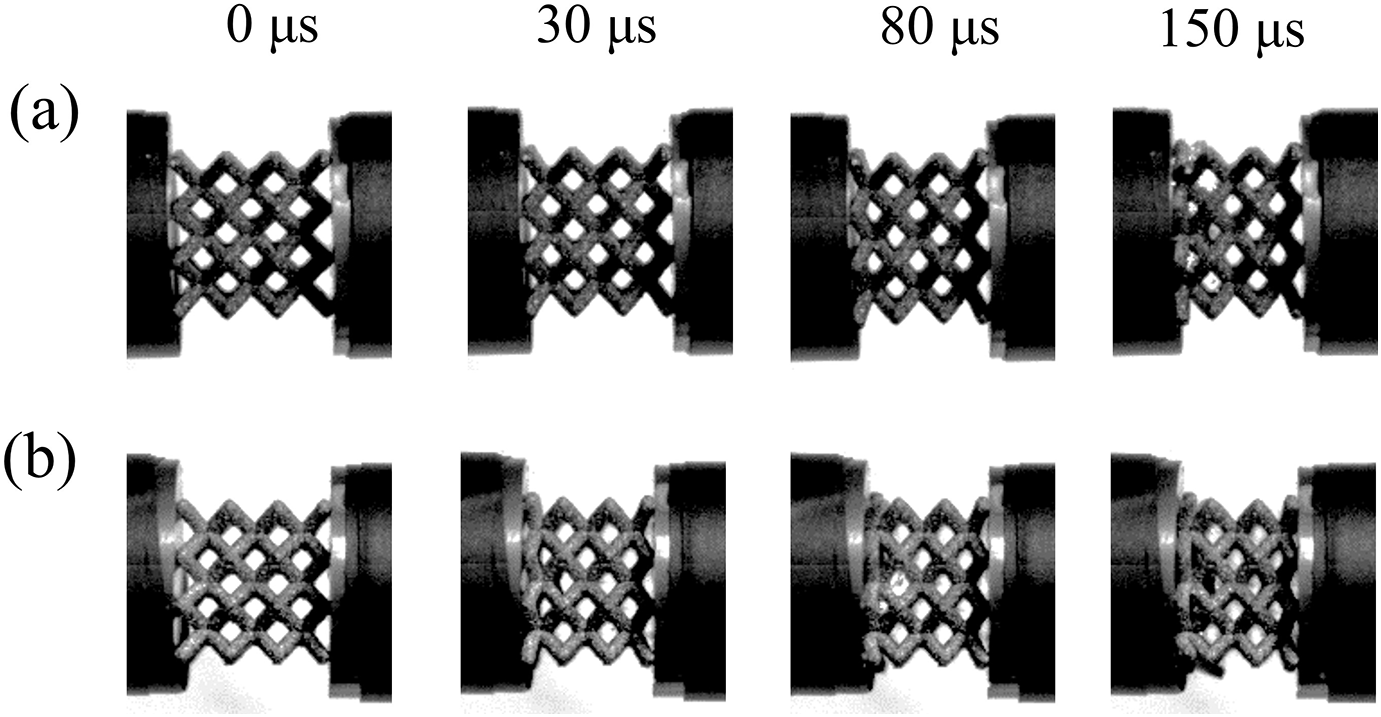
Figure 12: Deformation and failure behavior of the BCC structure during the impact process. (a) The impact velocity is 17.3 m/s; (b) The impact velocity is 26.3 m/s
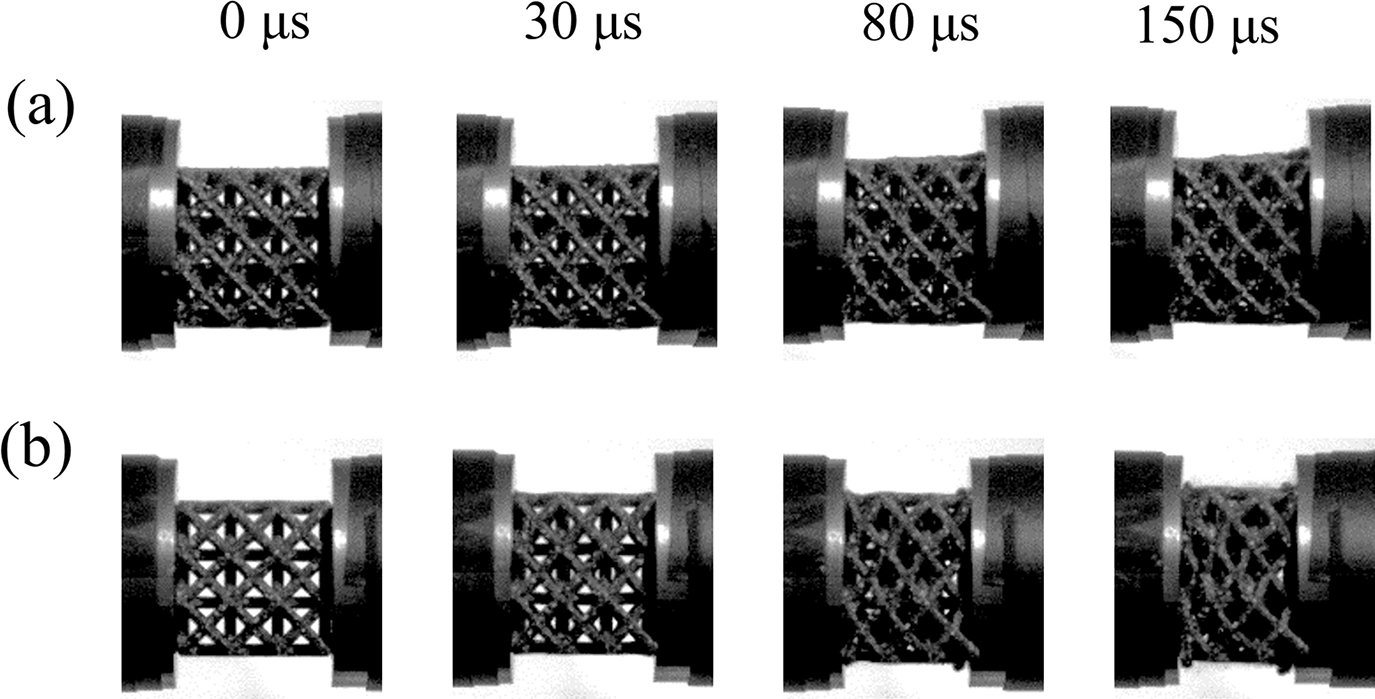
Figure 13: Deformation and failure behavior of the FCC structure during the impact process. (a) The impact velocity is 17.3 m/s; (b) The impact velocity is 26.3 m/s
At the higher impact velocity of 26.3 m/s, the deformation process intensifies. The specimen exhibits increased strain, triggering a reloading and re-unloading sequence as the remaining longitudinal struts undergo fracture. This stage is characterized by higher strain levels and pronounced damage localization, particularly in the first layer near the incident end, where severe structural degradation occurs. As a result, the overall strength of the specimen is substantially reduced. These observations highlight a transition from initial elastic and plastic deformation to progressive crushing and eventual catastrophic failure, governed by the interplay between structural instability, localized fracture, and densification under high strain rates.
As shown in Fig. 12, the BCC specimen exhibits distinctly heterogeneous compressive deformation under impact loading. Initially, the struts near the first layer at the incident end undergo localized bending, primarily concentrated at the nodal connections, leading to substantial compressive displacement along the impact direction. As compaction progresses, deformation initiates in the struts adjacent to the transmission end, marking a sequential collapse mechanism. With increasing impact pressure, deformation within this region intensifies, eventually resembling the pattern observed at the end of the incident. Throughout this process, damage remains predominantly localized at the end regions, while the central portion of the specimen experiences comparatively limited deformation. As shown in Fig. 9c, all curves exhibit a linear elastic region followed by a smooth peak and a gradual stress reduction. Post-yield behavior is characterized by a stable stress plateau with mild fluctuations, reflecting the progressive layer-by-layer crushing mechanism typical of BCC structures. This failure pattern indicates that the BCC lattice absorbs impact energy through progressive end-layer collapse, while maintaining structural integrity in the mid-section during the early and intermediate stages of loading.
Fig. 13 illustrates the dynamic response of the face-centered cubic (FCC) lattice structure under compressive loading. During impact, the angle between the central struts on the observation surface progressively increases, indicating rotational deformation and reorientation of the lattice framework. Concurrently, the struts initially in contact with the incident and transmission rods migrate inward toward the specimen’s interior, driven by axial compressive forces. As the impact duration increases, fracture initiates at the nodal junctions of the struts, reducing the overall porosity and signaling the onset of structural collapse. This accumulation of damage and gradual reduction of void space marks the transition of the specimen. Fig. 9e shows that a significant peak stress occurs at a strain of about 0.04–0.05. After reaching the peak, the stress begins to decrease, and the rate of decrease is lower than that of the SC structure, indicating that the structure has less damage, which may be due to the fracture of the internal strut. A quasi-stable stress platform is observed in the post-peak region, reflecting the typical layer-by-layer collapse behavior of the FCC structure.
The open-source software Ncorr was employed to conduct Digital Image Correlation (DIC) analysis on high-speed camera images, enabling the measurement of compressive strain along the impact direction of the specimens. As illustrated in Fig. 14, the left end of the specimen corresponds to the incident rod, while the right end connects to the transmission rod. The calculation domain covers the entire structural specimen, excluding the pore regions. This method offers efficient and accurate extraction of the strain field during dynamic compression. However, a notable limitation is that image recognition becomes unreliable once the specimen undergoes severe damage, restricting the effective analysis to the earlier stages of deformation. For the SC structure, significant strain localization was observed at the junction between horizontal and vertical struts. This transition region is prone to strain concentration, often leading to instability and buckling of the vertical members. In the BCC structure, elevated strain values were detected at both ends of the specimen, while the central region exhibited relatively lower strain. This distribution pattern is attributed to the geometry of the BCC structure and the spatial arrangement of its struts, which tend to concentrate stress near the boundaries. In the FCC structure, the strain was highest near the transmission end and gradually decreased toward the incident end. This strain gradient suggests progressive stress dispersion throughout the structure, resulting in a relatively uniform strain distribution.
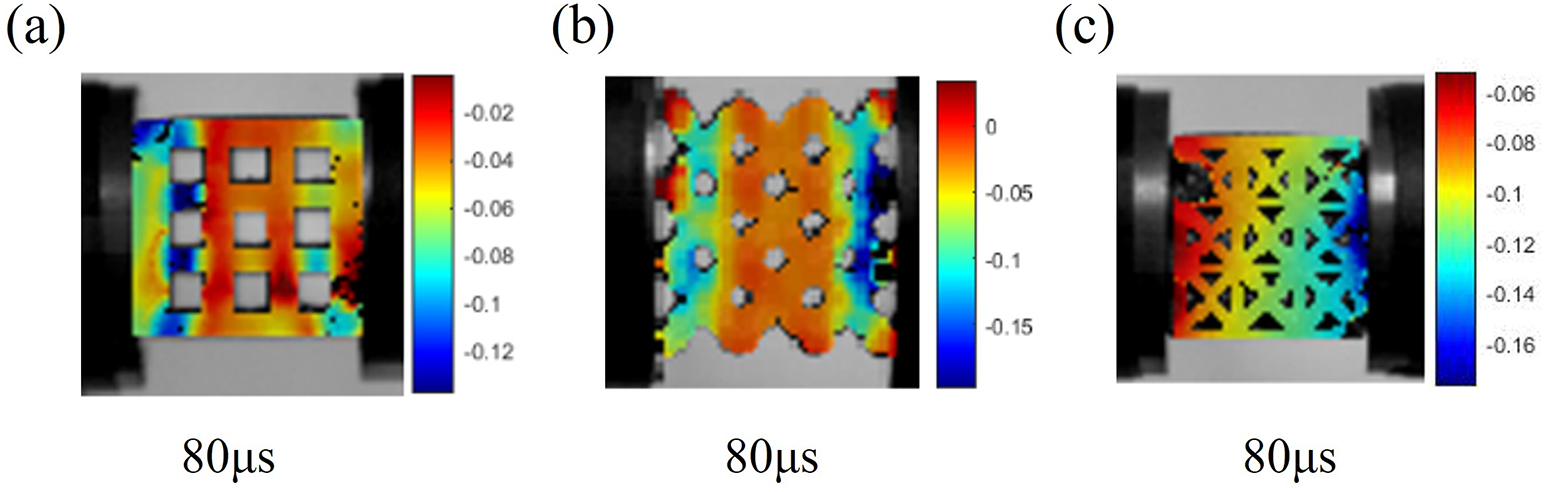
Figure 14: DIC strain field distributions of lattice structures with 30% relative density under an impact velocity of 26.3 m/s: (a) SC; (b) BCC; (c) FCC
To further elucidate the failure process of the lattice structures, numerical simulations replicating the experimental impact velocities of 17.3 and 26.3 m/s were conducted for the three lattice configurations with a relative density of 30%. The resulting von Mises stress distributions are presented in Fig. 15a–f.
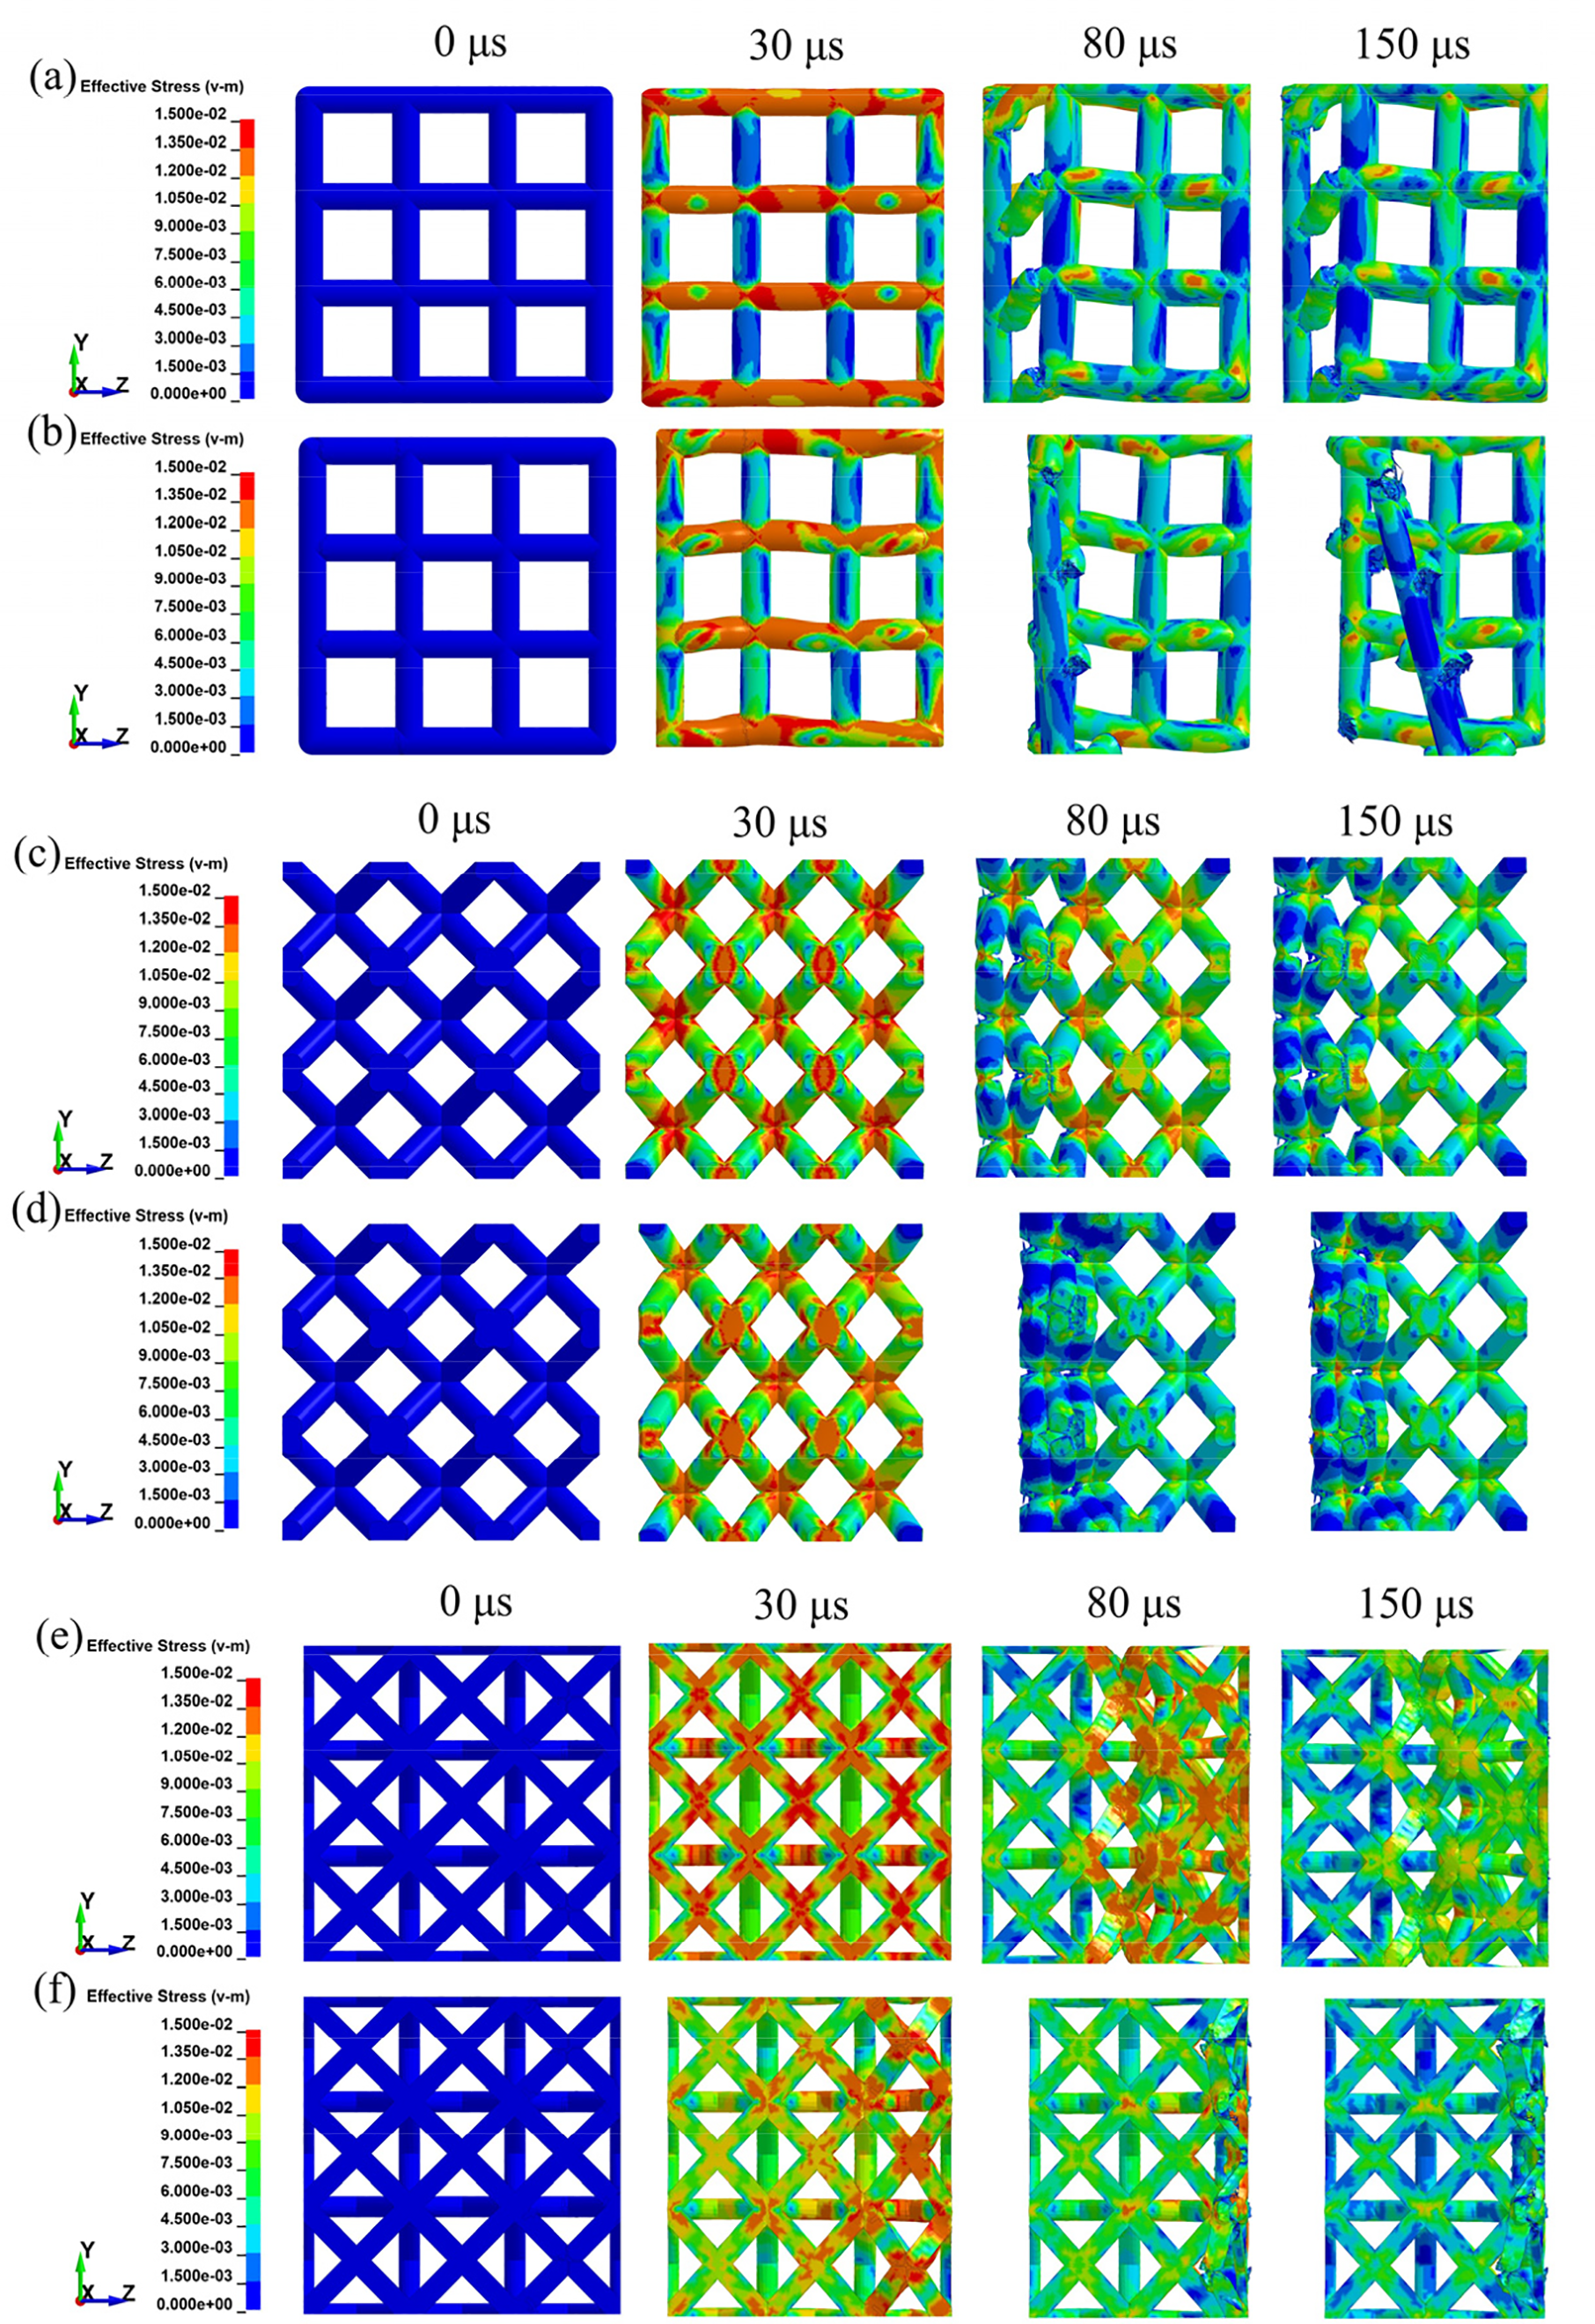
Figure 15: The deformation process of lattice structure under different impact velocities is obtained by numerical simulation: (a) SC-30%; (b) SC-50%; (c) BCC-30%; (d) BCC-50%; (e) FCC-30%; (f) FCC-50%
In Fig. 15a, corresponding to the SC structure, the initial stress concentration appears near the intersection with the incident rod. This is attributed to the abrupt change in wave impedance at the contact interface, where the high-speed impact induces stress wave superposition, generating a local standing wave and a high-stress zone. As shown in Fig. 15b, significant bending of the transverse struts is observed by t = 30 μs, while the longitudinal struts remain subjected to relatively lower loads throughout the process.
Fig. 15c,d depicts the BCC structure. Similar to the SC specimen, stress concentration initially forms near the intersection point. As loading progresses, bending and fracture initiate, interlayer pores are gradually filled, and the stressed regions expand. Notably, as the structure densifies, the stress borne by individual struts decreases progressively, reflecting the redistribution of load during the collapse process.
In Fig. 15e,f, representing the FCC structure, distinct differences emerge between low and high impact velocities. At t = 30 μs under low-speed impact, stress remains concentrated at the intersection point, while the distribution across the remaining areas is relatively uniform. However, under high-speed impact, the stress amplitude progressively increases from left to right across the intersection region. This behavior suggests that inertia effects become increasingly significant at higher velocities, delaying the structural response in certain regions and resulting in uneven stress distribution. Furthermore, local variations in strain rate may contribute to differing mechanical responses across the lattice, further exacerbating stress non-uniformity.
A comparative analysis of the experimental and numerical simulation results reveals distinct deformation and failure patterns among the lattice structures. For the SC structure, failure initiates with bending deformation of the longitudinal struts, which subsequently evolves into shear fracture as loading progresses. In contrast, the deformation in the BCC and FCC structures is primarily localized to a single end layer under impact loading. Specifically, densification in the BCC structure occurs near the incident end, while in the FCC structure, it develops at the transmission end. The remaining portions of both structures exhibit limited deformation and damage, indicative of a typical layer-by-layer compaction failure mechanism.
Notably, a key discrepancy between the simulation and experimental observations lies in the extent of damage at the transmission end. In the experiments, both structures exhibited a certain degree of fracture at the transmission surfaces, whereas the numerical models showed comparatively minor cumulative damage in these regions. This difference is likely attributable to inherent microscopic defects arising from the additive manufacturing process, as well as surface roughness at the specimen–rod interfaces, which may promote localized failure during impact loading.
Despite these differences, the overall deformation and failure behaviors of the lattice structures demonstrate good agreement between the experimental observations and simulation predictions, underscoring the reliability of the numerical model in capturing the fundamental response mechanisms.
4.3 Stress Wave Propagation and Energy Dissipation
Lattice structures demonstrate pronounced attenuation and energy absorption capabilities with respect to stress wave propagation. To investigate the influence of SC, BCC, and FCC lattice configurations on stress wave transmission at varying relative densities and strain rates, experimental analysis was conducted. Fig. 16 presents the amplitude of the rectangular stress waves generated during the collision between the impact rod and the incident rod at various impact velocities. In SHPB experiments, a higher transmission amplitude corresponds to lower attenuation, indicating that the specimen allows greater passage of the pressure wave.
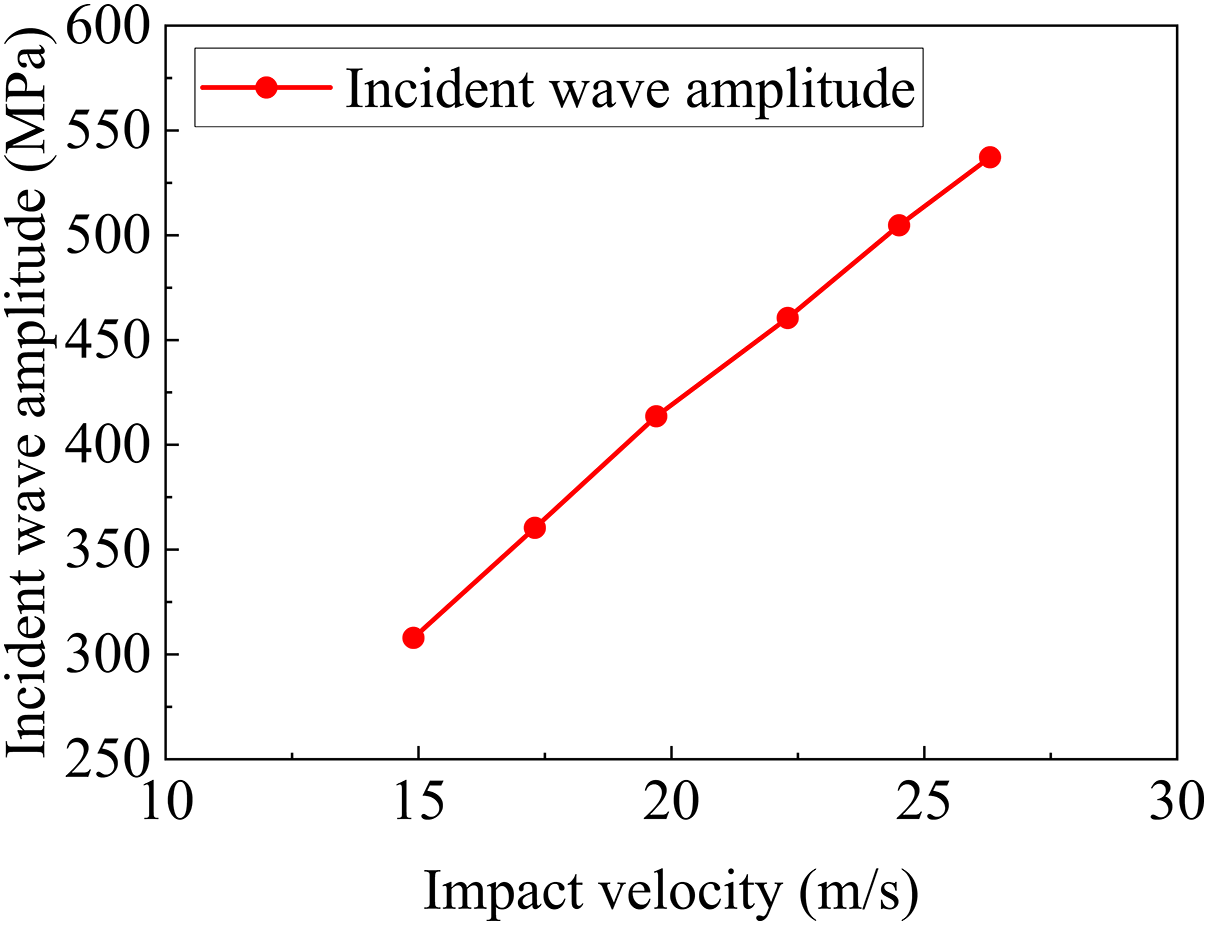
Figure 16: The incident wave amplitude corresponding to different impact velocities
Fig. 17 illustrates the transmitted wave amplitudes after propagation through the different lattice specimens. Among the three structures, the SC lattice exhibits the highest transmission amplitude and displays the greatest sensitivity to strain rate, suggesting a lower capacity for wave attenuation. In contrast, the BCC lattice exhibits the lowest transmission amplitude and is comparatively less affected by changes in strain rate, indicating superior wave attenuation performance. The FCC structure exhibits intermediate behavior between the SC and BCC lattices.

Figure 17: The relationship between the amplitude of the transmitted wave corresponding to different specimens and the strain rate: (a) SC-30%; (b) SC-50%; (c) BCC-30%; (d) BCC-50%; (e) FCC-30%; (f) FCC-50%
Additionally, for all three structures, transmission amplitude increases with both strain rate and relative density, reflecting the reduced porosity and enhanced stiffness of the specimens under these conditions, which facilitate greater wave transmission.
Numerical simulations were conducted to precisely determine the arrival and departure times of stress waves within the lattice specimens. To ensure both accuracy and computational efficiency, a solution time step of 0.5 μs was adopted for tracking stress wave propagation through the lattice structures. Based on these results, the average stress wave propagation velocities were calculated, as shown in Fig. 18.
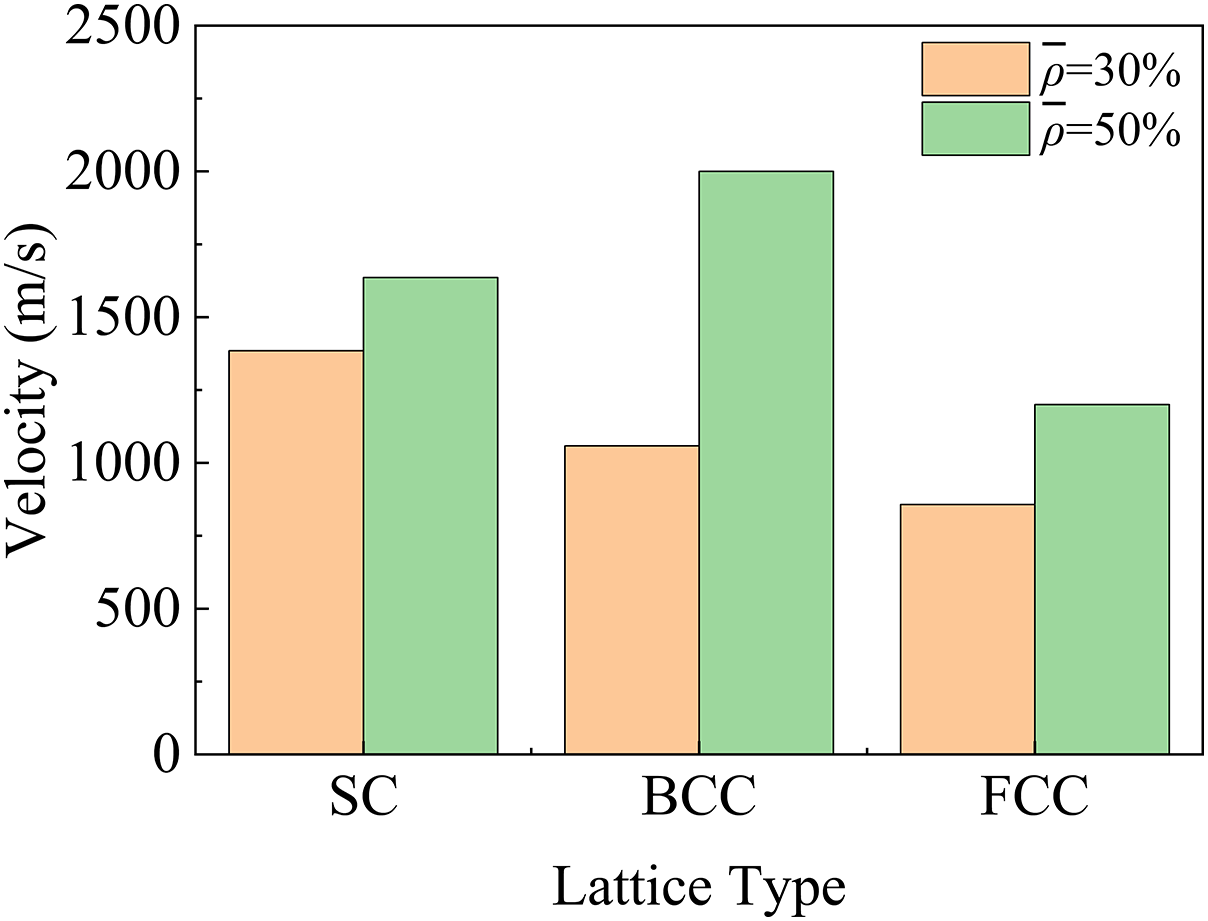
Figure 18: The average velocity of stress wave propagation in the lattice structure
The analysis reveals that stress waves propagate more rapidly in lattice structures with higher relative densities, attributable to reduced porosity and increased stiffness. Among the three lattice configurations, the FCC structure exhibited the lowest propagation velocities, with measured values of 857.1 m/s for FCC-30% and 1200 m/s for FCC-50%, both notably lower than those recorded for the SC and BCC lattices. This indicates that the FCC structure possesses a superior capability to decelerate stress wave transmission at comparable relative densities, highlighting its enhanced wave attenuation potential.
Investigating the energy dissipation characteristics of lattice structures under impact loading is of critical importance, as it provides insight into their ability to mitigate dynamic forces. Energy dissipation occurs through two primary mechanisms: conversion of energy into reflected waves and absorption via structural deformation and failure. According to one-dimensional stress wave theory and the principle of energy conservation, the energies associated with the incident, reflected, and transmitted waves can be expressed as follows:
here,
Fig. 19 illustrates the distribution characteristics of incident wave energy at various impact rod velocities, while Fig. 20a,b presents the reflected and transmitted wave energies of the three lattice structures (BCC, FCC, and SC) with a relative density of 30% under different strain rate conditions. Experimental results indicate that, for all lattice structures, transmitted wave energy under impact loading is substantially lower than reflected wave energy. The proportion of incident energy dissipated through reflection is quantified as follows: SC (73.1%–86.6%), BCC (83.1%–93.3%), and FCC (81.1%–88.1%). These findings confirm that wave reflection serves as the dominant energy dissipation mechanism across all structures.
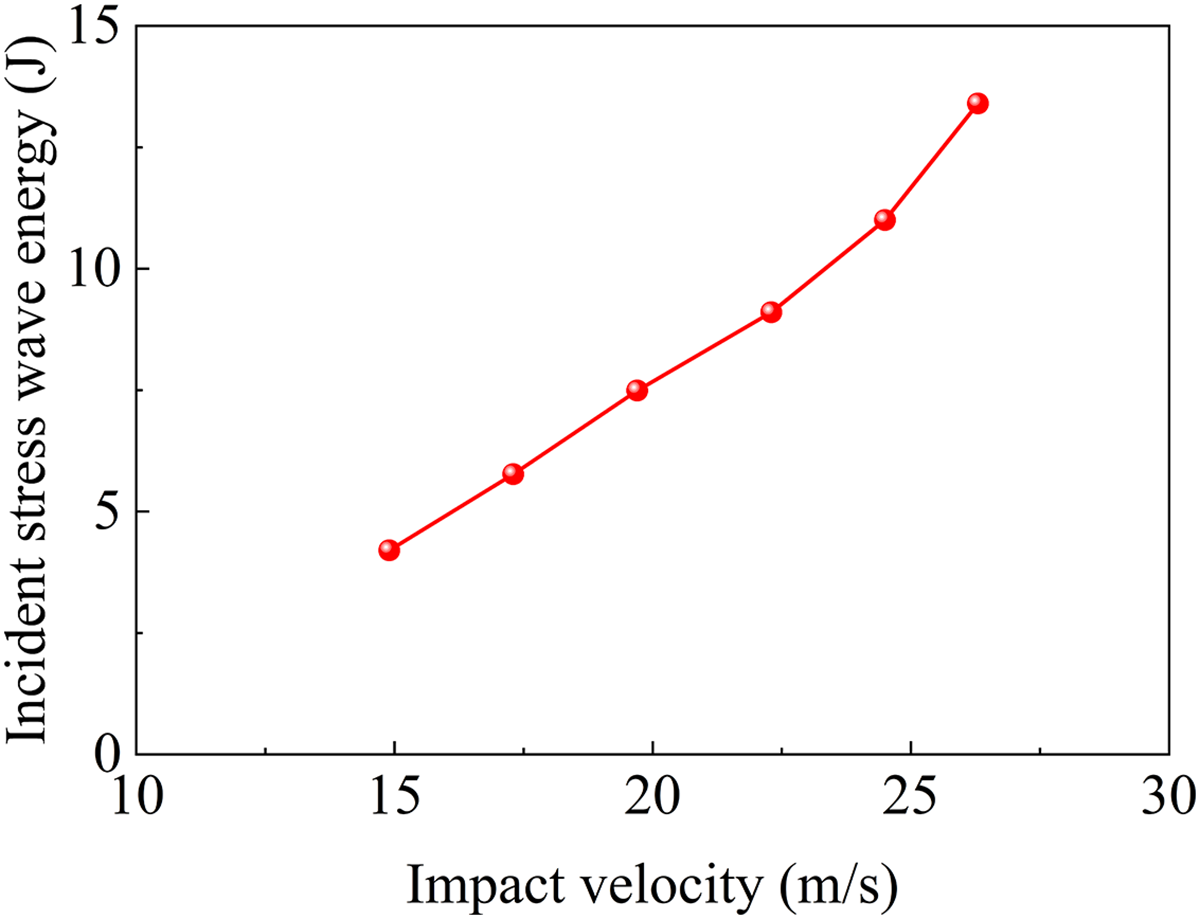
Figure 19: The amplitude of the stress wave corresponding to different impact velocities
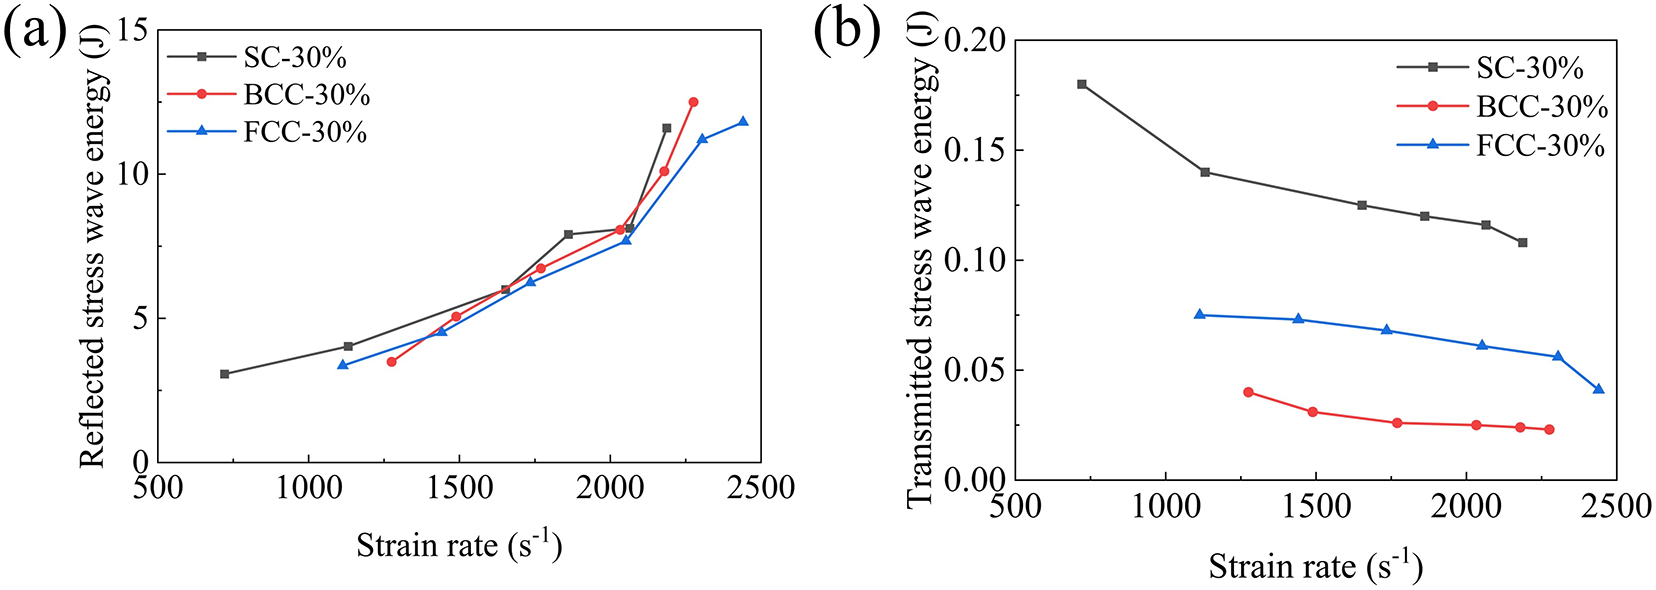
Figure 20: The variation of reflected wave energy and transmitted wave energy with strain rate: (a) reflected wave energy; (b) transmitted wave energy
Furthermore, an increase in strain rate leads to a gradual rise in reflected wave energy, accompanied by a corresponding reduction in transmitted wave energy. Under identical impact conditions, the SC structure consistently exhibits lower reflected wave energy and higher transmitted wave energy compared to the BCC and FCC structures. High-speed imaging of the impact process suggests that the SC structure is more susceptible to severe damage, which likely enhances its ability to absorb part of the reflected wave energy through extensive plastic deformation and fracture.
Among the three configurations, the BCC structure demonstrates the lowest transmitted wave energy, indicating superior energy dissipation capability with respect to one-dimensional stress wave propagation.
In view of the energy absorption characteristics of the lattice structure itself, as shown in Fig. 21a, the kinetic energy of all three lattice structures initially increases rapidly due to the impact loading, reaching a peak before declining sharply as energy is absorbed through deformation and damage. The SC structure exhibits the highest kinetic energy peak and fastest decay rate, consistent with the early onset of buckling and fracture observed in high-speed imaging. This indicates rapid structural instability and energy release. In contrast, the BCC and FCC structures show more moderate peaks and gradual declines, reflecting a layer-by-layer crushing process with delayed failure initiation. These differences in kinetic energy evolution align with the distinct deformation modes captured in high-speed sequences, confirming the influence of topology on dynamic response and energy dissipation behavior. Fig. 21b shows the corresponding internal energy curves. All structures experience a sharp rise in internal energy within the first 100 μs, consistent with energy being absorbed through plastic deformation and fracture.
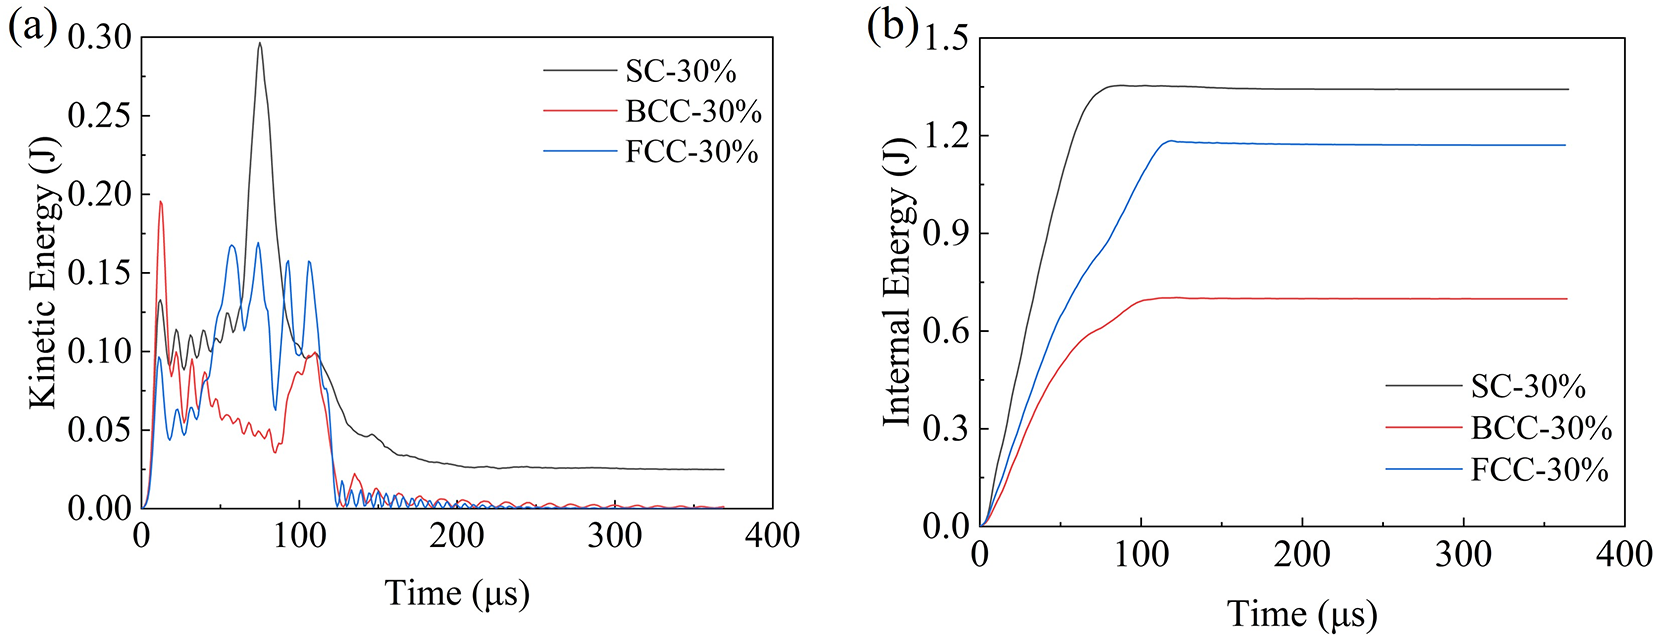
Figure 21: Time histories of (a) kinetic energy and (b) internal energy for SC, BCC, and FCC lattice structures with 30% relative density under an impact velocity of 26.3 m/s
This study comprehensively examined the dynamic mechanical properties, deformation and failure behaviors, and stress wave propagation characteristics of three titanium alloy lattice structures using Split Hopkinson Pressure Bar (SHPB) experiments combined with numerical simulations. The results reveal distinct differences among the structures in their strain rate sensitivity, failure mechanisms, and energy dissipation capabilities.
The Simple Cubic (SC) structure exhibits pronounced strain rate sensitivity, with failure dominated by strut buckling, instability fracture, and subsequent layer-wise slippage. In contrast, the Body-Centered Cubic (BCC) and Face-Centered Cubic (FCC) structures show relatively low strain rate sensitivity, with failure primarily localized at the impact surface and strut nodes, progressing through layer-by-layer crushing.
In terms of stress wave propagation, the BCC structure demonstrates superior attenuation capability, as reflected by its lower transmitted wave amplitudes. Although transmitted wave amplitudes increase with strain rate and relative density across all structures, the FCC configuration effectively reduces wave propagation speed at comparable relative densities, delaying wave transmission.
Energy dissipation analysis further confirms that wave reflection is the dominant mechanism, with reflected wave energy increasing and transmitted wave energy decreasing as strain rate rises. Among the three structures, the BCC lattice consistently exhibits the lowest transmitted wave energy, indicating its superior ability to dissipate stress wave energy and mitigate dynamic loading.
Overall, the combined experimental and numerical results highlight the unique dynamic response characteristics of each lattice configuration. Notably, the BCC structure offers optimal stress wave attenuation and energy dissipation performance, while the FCC structure provides enhanced wave transmission delay capabilities. These insights provide a valuable reference for the design and application of lattice structures in impact mitigation and energy absorption scenarios.
Despite the insightful findings, this study has several limitations. The present study employs a finite element–based approach with explicit modeling of the lattice structures using the Johnson–Cook material model. While this method enables a direct comparison with experimental results and provides insights into stress wave propagation and failure mechanisms, several simplifications were adopted. These include assuming homogeneous material properties, idealized boundary conditions, and omitting microstructural heterogeneities. The dynamic deformation analysis focuses primarily on stress wave amplitude attenuation, without considering frequency-domain effects such as dispersion or filtering.
Acknowledgement: Not applicable.
Funding Statement: This work was supported by the National Natural Science Foundations of China (No. 11972267 and 11802214); the Fundamental Research Funds for the Central Universities (No. 104972024JYS0022), and the Open Fund of the Hubei Longzhong Laboratory (No. 2024KF-30).
Author Contributions: The authors confirm contribution to the paper as follows: Conceptualization: Lisheng Liu, Jinyong Zhang; Methodology: Shuai Zhang, Xin Lai; Investigation: Shuai Zhang, Xin Lai, Shifu Wang; Numerical Simulation: Shuai Zhang, Xin Lai; Data Curation: Shuai Zhang, Xin Lai; Formal Analysis: Shuai Zhang, Xin Lai; Visualization: Xin Lai, Shuai Zhang; Writing—Original Draft: Shuai Zhang; Writing—Review & Editing: Xin Lai, Lisheng Liu; Supervision: Lisheng Liu, Jinyong Zhang; Project Administration: Xin Lai, Shifu Wang; Funding Acquisition: Haiyan Niu, Jinyong Zhang. All authors reviewed the results and approved the final version of the manuscript.
Availability of Data and Materials: The data will be made available from the corresponding author upon reasonable request.
Ethics Approval: Not applicable.
Conflicts of Interest: The authors declare no conflicts of interest to report regarding the present study.
References
1. Xiao R, Li X, Jia H, Surjadi JU, Li J, Lin W, et al. 3D printing of dual phase-strengthened microlattices for lightweight micro aerial vehicles. Mater Des. 2021;206(3):109767. doi:10.1016/j.matdes.2021.109767. [Google Scholar] [CrossRef]
2. Isaenkova MG, Yudin AV, Rubanov AE, Osintsev AV, Degadnikova LA. Deformation behavior modelling of lattice structures manufactured by a selective laser melting of 316L steel powder. J Mater Res Technol. 2020;9(6):15177–84. doi:10.1016/j.jmrt.2020.10.089. [Google Scholar] [CrossRef]
3. Gohar S, Hussain G, Ilyas M, Ali A. Performance of 3D printed topologically optimized novel auxetic structures under compressive loading: experimental and FE analyses. J Mater Res Technol. 2021;15:394–408. doi:10.1016/j.jmrt.2021.07.149. [Google Scholar] [CrossRef]
4. Tyagi SA, Manjaiah M. Additive manufacturing of titanium-based lattice structures for medical applications—a review. Bioprinting. 2023;30:e00267. doi:10.1016/j.bprint.2023.e00267. [Google Scholar] [CrossRef]
5. Vrána R, Červinek O, Maňas P, Koutný D, Paloušek D. Dynamic loading of lattice structure made by selective laser melting-numerical model with substitution of geometrical imperfections. Materials. 2018;11(11):2129. doi:10.3390/ma11112129. [Google Scholar] [PubMed] [CrossRef]
6. Marco M, Belda R, Miguélez MH, Giner E. Numerical analysis of mechanical behaviour of lattice and porous structures. Compos Struct. 2021;261:113292. doi:10.1016/j.compstruct.2020.113292. [Google Scholar] [CrossRef]
7. Ripa MD, Paolino DS, Amorese A, Tridello A. Numerical modelling of the mechanical response of lattice structures produced through AM. Procedia Struct Integr. 2021;33:714–23. doi:10.1016/j.prostr.2021.10.079. [Google Scholar] [CrossRef]
8. Alomar Z, Concli F. A review of the selective laser melting lattice structures and their numerical models. Adv Eng Mater. 2020;22(12):2000611. doi:10.1002/adem.202000611. [Google Scholar] [CrossRef]
9. Qiu XM, Zhang J, Yu TX. Collapse of periodic planar lattices under uniaxial compression, part II: dynamic crushing based on finite element simulation. Int J Impact Eng. 2009;36(10):1231–41. doi:10.1016/j.ijimpeng.2009.05.010. [Google Scholar] [CrossRef]
10. Mahbod M, Asgari M. Elastic and plastic characterization of a new developed additively manufactured functionally graded porous lattice structure: analytical and numerical models. Int J Mech Sci. 2019;155(6):248–66. doi:10.1016/j.ijmecsci.2019.02.041. [Google Scholar] [CrossRef]
11. Zhang X, Cheng Q, Xue Z, Ji L. Numerical simulation on lattice structure construction and optimization method for additive manufacturing. Appl Energy. 2022;325:119862. doi:10.1016/j.apenergy.2022.119862. [Google Scholar] [CrossRef]
12. Ge ZH, Chen LY, Zhang YF, Wang ZX, Wu C, Feng D, et al. From AFCC to AFCCX: structural optimization boosting compressive strength of electron beam melted Ti-6Al-4V lattice structures. J Manuf Process. 2025;133:271–84. doi:10.1016/j.jmapro.2024.11.071. [Google Scholar] [CrossRef]
13. Nasrullah AIH, Santosa SP, Dirgantara T. Design and optimization of crashworthy components based on lattice structure configuration. Structures. 2020;26:969–81. doi:10.1016/j.istruc.2020.05.001. [Google Scholar] [CrossRef]
14. Liu J, Pattofatto S, Fang D, Lu F, Zhao H. Impact strength enhancement of aluminum tetrahedral lattice truss core structures. Int J Impact Eng. 2015;79(10):3–13. doi:10.1016/j.ijimpeng.2014.06.013. [Google Scholar] [CrossRef]
15. Ramos H, Santiago R, Soe S, Alives M. Response of gyroid lattice structures to impact loads. Int J Impact Eng. 2022;164(5):104202. doi:10.1016/j.ijimpeng.2022.104202. [Google Scholar] [CrossRef]
16. Alomar Z, Concli F. Compressive behavior assessment of a newly developed circular cell-based lattice structure. Mater Des. 2021;205:109716. doi:10.1016/j.matdes.2021.109716. [Google Scholar] [CrossRef]
17. Yan J, Sui Q, Fan Z, Duan Z. Multi-material and multiscale topology design optimization of thermoelastic lattice structures. Comput Model Eng Sci. 2021;130(2):967–86. doi:10.32604/cmes.2022.017708. [Google Scholar] [CrossRef]
18. Campoli G, Borleffs MS, Yavari SA, Wauthle R, Weinans H, Zadpoor AA. Mechanical properties of open-cell metallic biomaterials manufactured using additive manufacturing. Mater Des. 2013;49:957–65. doi:10.1016/j.matdes.2013.01.071. [Google Scholar] [CrossRef]
19. Chauvet E, Tassin C, Blandin JJ, Dendievel R, Martin G. Producing Ni-base superalloys single crystal by selective electron beam melting. Scr Mater. 2018;152(3):15–9. doi:10.1016/j.scriptamat.2018.03.041. [Google Scholar] [CrossRef]
20. Lu S, Qian M, Tang H, Yan M, Wang J, St John DH. Massive transformation in Ti-6Al-4V additively manufactured by selective electron beam melting. Acta Mater. 2016;104:303–11. doi:10.1016/j.actamat.2015.11.011. [Google Scholar] [CrossRef]
21. Ullah I, Brandt M, Feih S. Failure and energy absorption characteristics of advanced 3D truss core structures. Mater Des. 2016;92:937–48. doi:10.1016/j.matdes.2015.12.058. [Google Scholar] [CrossRef]
22. Song W, Feng G, Yu G, Shi GQ, Xiao LJ. Dynamic mechanical behavior of additively manufactured bio-inspired metallic lattice structure subjected to high strain rate impact loading. Int J Impact Eng. 2023;181:104752. doi:10.1016/j.ijimpeng.2023.104752. [Google Scholar] [CrossRef]
23. Wang M, Zhang J, Wang W, Gao LB. Compression behaviors of the bio-inspired hierarchical lattice structure with improved mechanical properties and energy absorption capacity. J Mater Res Technol. 2022;17(6):2755–71. doi:10.1016/j.jmrt.2022.02.046. [Google Scholar] [CrossRef]
24. Jin N, Wang F, Wang Y, Zhang B, Cheng H, Zhang H. Failure and energy absorption characteristics of four lattice structures under dynamic loading. Mater Des. 2019;169:107655. doi:10.1016/j.matdes.2019.107655. [Google Scholar] [CrossRef]
25. Cao X, Xiao D, Li Y, Wen W, Zhao T. Dynamic compressive behavior of a modified additively manufactured rhombic dodecahedron 316L stainless steel lattice structure. Thin-Walled Struct. 2020;148(4):106586. doi:10.1016/j.tws.2019.106586. [Google Scholar] [CrossRef]
26. Xiao L, Song W, Wang C, Tang H, Fan Q, Liu N, et al. Mechanical properties of open-cell rhombic dodecahedron titanium alloy lattice structure manufactured using electron beam melting under dynamic loading. Int J Impact Eng. 2017;100(4):75–89. doi:10.1016/j.ijimpeng.2016.10.006. [Google Scholar] [CrossRef]
27. Smith M, Cantwell WJ, Guan Z, Tsopanos S, Theobald MD, Nurick GN, et al. Energy absorption in lattice structures in dynamics: nonlinear FE simulations. Int J Impact Eng. 2017;102(6):1–15. doi:10.1016/j.ijimpeng.2016.11.016. [Google Scholar] [CrossRef]
28. Sun ZP, Guo YB, Shim VPW. Characterisation and modeling of additively-manufactured polymeric hybrid lattice structures for energy absorption. Int J Mech Sci. 2021;191(37):106101. doi:10.1016/j.ijmecsci.2020.106101. [Google Scholar] [CrossRef]
29. Weeger O, Boddeti N, Yeung SK, Kaijima S, Dunn ML. Digital design and nonlinear simulation for additive manufacturing of soft lattice structures. Addit Manuf. 2019;25(1):39–49. doi:10.1016/j.addma.2018.11.003. [Google Scholar] [CrossRef]
30. Koeppe A, Hernandez Padilla CA, Voshage M, Schleifenbaum JH, Markert B. Efficient numerical modeling of 3D-printed lattice-cell structures using neural networks. Manuf Lett. 2018;15(5):147–50. doi:10.1016/j.mfglet.2018.01.002. [Google Scholar] [CrossRef]
31. Zhou H, Zhao M, Ma Z, Zhang D, Fu G. Sheet and network based functionally graded lattice structures manufactured by selective laser melting: design, mechanical properties, and simulation. Int J Mech Sci. 2020;175:105480. doi:10.1016/j.ijmecsci.2020.105480. [Google Scholar] [CrossRef]
32. Rabczuk T, Belytschko T. Cracking particles: a simplified meshfree method for arbitrary evolving cracks. Int J Numer Methods Eng. 2004;61(13):2316–43. doi:10.1002/nme.1151. [Google Scholar] [CrossRef]
33. Goswami S, Anitescu C, Chakraborty S, Rabczuk T. Transfer learning enhanced physics informed neural network for phase-field modeling of fracture. Theor Appl Fract Mech. 2020;106:102447. doi:10.1016/j.tafmec.2019.102447. [Google Scholar] [CrossRef]
34. Chen G, Chen ZF, Huang XC. Numerical simulation of truncated cylindroconical projectile penetrating thin target. In: Wang YJ, Huang PG, Li SG, editors. Theory and practice of energetic materials. Vol. 6. Monmouth Junction, NJ, USA: Science Press; 2005. p. 1037–41. [Google Scholar]
35. Zheng Z, Wang C, Yu J, Reid SR, Harrigan JJ. Dynamic stress-strain states for metal foams using a 3D cellular model. J Mech Phys Solids. 2014;72:93–114. doi:10.1016/j.jmps.2014.07.013. [Google Scholar] [CrossRef]
36. Lee S, Barthelat F, Hutchinson JW, Espinosa HD. Dynamic failure of metallic pyramidal truss core materials—experiments and modeling. Int J Plast. 2006;22(11):2118–45. doi:10.1016/j.ijplas.2006.02.006. [Google Scholar] [CrossRef]
Cite This Article
 Copyright © 2025 The Author(s). Published by Tech Science Press.
This work is licensed under a Creative Commons Attribution 4.0 International License , which permits unrestricted use, distribution, and reproduction in any medium, provided the original work is properly cited.
 Downloads
 Citation Tools