
 Submit a Paper
 Propose a Special lssue
 Open Access
ARTICLE

Analytical Modeling and Comparative Analysis of Capillary Imbibition in Shale Pores of Various Geometries
Department of Petroleum Engineering, University of Louisiana at Lafayette, Lafayette, LA 70504, USA
* Corresponding Author: Boyun Guo. Email:
Computer Modeling in Engineering & Sciences 2025, 144(3), 3307-3328. https://doi.org/10.32604/cmes.2025.069909
Received 03 July 2025; Accepted 04 September 2025; Issue published 30 September 2025
 View Full Text
 Download PDF
Abstract
Fluid imbibition from hydraulic fractures into shale formations is mainly affected by a combination of capillary forces and viscous resistance, both of which are closely related to the pore geometry. This study established five self-imbibition models with idealized pore structures and conducted a comparative analysis of these models. These models include circular, square, and equilateral triangular capillaries; a triangular star-shaped cross-section formed by three tangent spherical particles; and a traditional porous medium representation method. All these models are derived based on Newton’s second law, where capillary pressure is described by the Young-Laplace equation and viscous resistance is characterized by the Hagen-Poiret equation and Darcy’s law. All derived models predict that the fluid imbibition distance is proportional to the square root of time, in accordance with the classical Lucas-Washburn law. However, different pore structures exhibit significantly different characteristic imbibition rates. Compared to the single pore model, the conventional Darcy’s law-based model for porous media predicts significantly lower imbibition rates, which is consistent with the relatively slower uptake rates in actual shale nanoscale pore networks. These findings emphasize the important role played by pore geometry in fluid imbibition dynamics and further point to the need for optimizing pore structure to extend fluid imbibition duration in shale reservoirs in practical operations.Keywords
Hydraulic fracturing of shale formations introduces a large volume of fluid into the reservoir, much of which remains imbibed into the rock matrix rather than recovered during flowback. Spontaneous imbibition—the capillary-driven imbibition of a wetting fluid into porous shale—is now recognized as a critical mechanism influencing hydrocarbon recovery in fractured shale gas and oil wells [1]. Field studies show that typically only a small fraction of the injected fracturing water (often <50%) is produced back, with the rest soaking into the low-permeability shale matrix [2]. This imbibed fluid can enhance hydrocarbon production by maintaining fracture conductivity and displacing oil or gas from the nanopores, but an excessive or uncontrolled imbibition may also cause formation damage (swelling, clay reactions) that impedes flow. Post-fracturing fluid soaking (shut-in) has therefore become a common practice to leverage capillary imbibition for improved recovery, yet determining the optimal soaking time remains an open problem in the industry. Recent analytical models demonstrate that imbibition distance grows as the square root of time and suggest diminishing returns for very long soak periods, but identifying the time at which the benefit plateaus is challenging and depends on matrix properties. A deeper understanding of spontaneous imbibition in shale, especially how it is controlled by the pore geometry and other factors, is therefore of both fundamental and practical importance for optimizing hydrocarbon recovery. Therefore, understanding the physical controls on this process is essential for predicting fluid uptake and optimizing shut-in strategies in unconventional reservoirs.
Key controlling factors include pore-scale wettability, pore geometry, and the occurrence of two-phase flow. These factors often act together in shale formations. Unlike traditional reservoir rocks, shale has extremely small pore sizes and complex pore geometries, which are completely different from idealized capillary structures. Additionally, the size of pore openings varies significantly along the length of the pore channels [3], thereby significantly affecting capillary action and flow. Capillary suction pressure is governed by the Yang-Laplace equation, which produces spatially varying curvature and entrance radii in non-circular or rough pores. Additionally, flow resistance follows Hagen-Pearsont behavior, regulated by channel geometry and connectivity. For example, Narrow throats or high curvature pores may generate excess viscous resistance compared to a corresponding straight or cylindrical channel, which has limited uptake rates [4]. Imbibition is further complicated by wettability heterogeneity, which arises from irregular mineral-organic distributions. This heterogeneity creates uneven capillary forces and localized barriers to wetting. Additionally, wettability is complicated by heterogeneity due to non-uniform mineral-organic distributions at the pore scale, which creates uneven capillary forces and localized barriers to wetting [2]. In a similar vein to what was just said, differences in wetting behaviour and capillary continuity between pores suggest that oil-wet pores can only accept water when connected to adjacent water-wet channels, resulting in spatially heterogeneous imbibition. To summarize, spontaneous imbibition in shale is difficult to predict, due to the compounding effects of the pore geometry on the nanoscale, tortuosity, mixed wettability and two-phase counter current flow. These complexities help explain why classical models are often inaccurate, and why the imbibition rates for shale cores in laboratory based experiments are typically less than for more homogenous materials, like sandstone [5].
Lucas (1918) and Washburn (1921) proposed the Lucas-Washburn (LW) equation. It is a classic model of fluid flow driven by capillary forces. The LW equation shows that, in a capillary tube with a circular cross-section, the imbibition depth of the liquid is proportional to the square root of time. This governs the relationship between capillary pressure and viscous resistance. The square-root time dependence is a well-established empirical observation that has been proven to be valid for systems ranging from conventional porous materials to nanoporous materials [6]. However, the shale medium differs significantly from these ideal conditions, which makes it challenging for the LW model to accurately describe the actual spontaneous aspiration behavior in quantitative and qualitative terms. For example, in non-circular capillary structures, the liquid forms a moist crescent-shaped leading edge at the interface, and a single capillary pressure cannot be defined. Conversely, the local capillary pressure varies with the geometric curvature of the channel and the wetting contact Angle, thereby resulting in the actual driving force possibly being lower than that in the circular pipe with the equivalent hydraulic diameter [7]. Likewise, a tortuous or branching pore channel is effectively longer (greater hydraulic resistance) than a straight pore of the same end-to-end displacement, causing imbibition to proceed more slowly than LW predicts unless tortuosity corrections are applied. The classical model also neglects boundary conditions that are important in real systems—for instance, whether imbibition is counter-current (wetting phase entering while non-wetting exits from the same face) or co-current (fluids moving in the same direction), one-ended or two-ended, infinite or limited bulk fluid supply, etc., all of which can alter imbibition rates and ultimate recovery [5]. Similarly, the LW equation does not account for gravity (important in vertical imbibition in cores) or transient wetting effects (e.g., contact angle hysteresis or dynamic contact angle variations as the interface moves). Consequently, a number of extended models have been proposed to overcome these limitations. For example, geometric correction factors and explicit tortuosity terms have been introduced to modify the Hagen–Poiseuille flow resistance in the LW formulation, allowing better matching of experimental imbibition curves in non-cylindrical pores and networks [7]. Fractal models have been identified to represent shale’s multi-scale pore size distribution and convoluted pore pathways: by including fractal dimensions of pore geometry and length, the models can capture decreasing imbibition rates due to nanoscale roughness and pore interconnectivity [8]. Another area of refinement is to include two-phase flow parameters, such as relative permeability and saturation-dependent capillary pressure into analytic solutions of imbibition. For example, imbibition into an initially-oil saturated shale matrix can be modeled by combining the wetting-phase imbibition equation and drainage of the non-wetting phase, providing a more realistic slowing of the imbibition front; recent studies have captured this via an effective wetting-phase permeability that changes with time. Overall, these advanced models still typically provide a square-root-of-time imbibition trend (congruent with the general Lucas–Washburn scaling) but different coefficients based on pore shape, tortuosity, boundary conditions, and fluid properties. Such models demonstrate that the rate of imbibition—and therefore, the amount of time required for a fluid to imbibe to a certain distance, or fill a volume—can differ by orders of magnitude based on factors such as pore geometry and wettability. This occurs even while in terms of overall form, the square-root-of-time scaling law typically could still be valid [3].
Because shales have extremely low permeability and complex pore networks, pore-network modeling provides a practical route to upscale capillary imbibition from the pore to the core scale. Wang and Sheng calibrated a two-phase pore network model to shale microstructure, computed effective capillary-pressure and relative-permeability functions, and coupled them with an analytical solution to predict imbibition-driven oil recovery, highlighting the strong sensitivity to absolute permeability and wettability [9]. Building on this, Wang and Sheng developed a dynamic pore-scale network model (Barnett shale-based) and showed that wettability exerts first-order control on spontaneous imbibition, while pore-geometry parameters modulate kinetics and trapping [10].
While developing analytical models, important advances have also been reported in simulating and experimenting with spontaneous wetting under actual shale conditions. For example, the lattice Boltzmann method (LBM) can accurately simulate two-phase flow in multi-phase structures. By utilizing mesoscale fluid particle interactions, LBM can capture capillary action, wetting, and viscous effects in arbitrary pore structures in micro-CT images or synthetic models. Using a stable pseudo-potential LBM for two-phase flow [6], simulated imbibition in irregular channels, demonstrating how pore geometry and curvature govern fluid dynamics. Gong et al. (2022) [4] also adopted a two-phase LBM method based on color gradients. They analyzed capillaries with diameter variations along the length to study the throat contraction phenomenon during self-wetting. Advances in lattice Boltzmann modeling (LBM) have clarified how pore geometry and surface features govern imbibition. Using a free-energy LBM, Wiklund and Uesaka showed that corners and micro-topography can pin the advancing meniscus. This causes nonuniform front motion and slower uptake than in smooth, circular tubes. Corner films may bypass the nonwetting phase and promote snap-off under strongly wetting conditions [11]. These mechanistic insights are consistent with subsequent LBM studies on variable-diameter channels, which quantify the additional capillary resistance imposed by pore-throat constrictions and tortuosity, and which can isolate residual nonwetting pockets [4].
Recent analytical models have made this concrete by deriving imbibition expressions for noncylindrical pores and angular corners. Yu et al. [12] derived coupled equations for imbibition in a square capillary. They showed that the bulk meniscus and corner films both grow as t1/2, and coupling modifies the rate coefficients. Zhao et al. [13,14] developed an interacting capillary-bundle formulation for square tubes and demonstrated that viscous coupling governs the competition between the main meniscus and corner film pathways, which can limit the corner film’s contribution. Zhou and Doi [15] developed an energy-variational theory for corner rise and found that height scales as t1/3, with only weak dependence of the prefactor on corner geometry.
In this study, I developed five analytical models for spontaneous imbibition in idealized pore structures: circular capillaries, square capillaries, equilateral triangular capillaries, a novel triangular star-shaped channel formed by three tangent spheres, and a conventional porous media model. By balancing the capillary suction (based on the Young-Laplace equation) with the viscous resistance (according to the Hagen-Poiseuille flow or Darcy flow theory) in the framework of Newton’s second law, analytical expressions for the fluid imbibition distance vs. time are derived for each geometric condition. Subsequently, we compared these models to quantify the effect of pore shape on imbibition kinetics.
By balancing the capillary force with the viscous resistance (while considering the inertial effect of the fluid), we derived analytical expressions for the spontaneous fluid imbibition distance under five typical pore shape conditions, including (1) circular capillaries, (2) square capillaries, (3) equilateral triangular capillaries, (4) triangular star-shaped pores formed by three spheres tangent to each other (to represent the pore with concave cross-section), (5) a blocky porous medium model used to represent the shale matrix (as illustrated in Fig. 1). Among them, the characteristic dimensions of the first three idealized pore shapes are set to be the same to enable a fair comparative analysis; the fourth pore structure specifically introduces a concave cross-section to allow the wettability of the grain surfaces on the three sides of the pore to be different from each other; and the porous media model serves as a benchmark for a continuous medium, using Darcy’s law and typical permeability, porosity, and relative permeability parameters found in shale reservoirs.
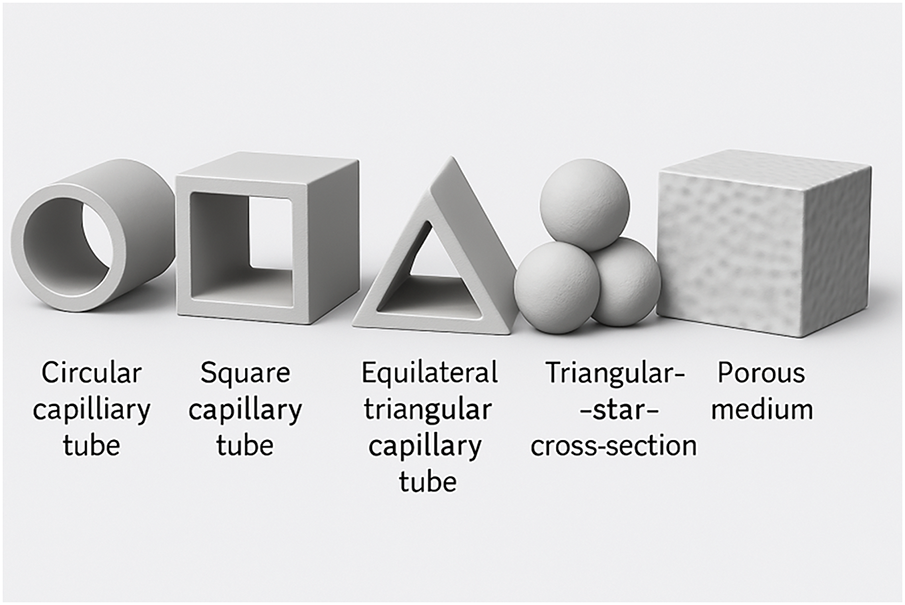
Figure 1: Five idealized pore geometries for capillary-driven flow analysis: circular, square, triangular, triangular-star, and porous medium
By examining these five different scenarios, we aim to unambiguously reveal variations in wetting behavior caused purely by differences in geometry (rather than pore size). The main assumptions used in the modeling include the consideration of horizontal imbibition processes (neglecting gravity effects) and the assumption of uniform wetting conditions within each model. The analytical solution of the model is obtained by solving the equations of motion at the front of the infiltrating fluid. After a very short initial phase of entry into the pore, the effect of inertial acceleration rapidly becomes negligible, and thereafter all pore-shape models exhibit the law that the imbibition distance is proportional to the square root of time. This result is in high agreement with the classical Lucas-Washburn theory as well as recently published analytical results. Practical experimental studies have extensively verified the applicability of this relationship between the imbibition distance and the square root of time, especially in the field of research on spontaneous imbibition in porous media and fractures.
The subsequent sections of this paper will show in detail the modeling process of each pore geometry, including the core equations in the literature and the self-developed part of this study, and will systematically compare and deeply analyze the results of these models.
We created a lightweight computational model in the form of an Excel workbook to numerically evaluate the analytical relations employed in this study. For each geometry, the front position is computed as x(t) =
The pore geometries selected for this study—circular, square, equilateral triangular, and triangular star—represent a range of simple to complex cross-sectional shapes commonly observed in shale reservoirs. Circular pores emulate equant or rounded pores, which may be found in organic matter domains or dissolution features. While idealized, the triangular-star geometry contains multiple concave corners and serves as a proxy for highly irregular pore outlines or the intersection of multiple microfractures. This geometry captures the combined effects of sharp angles and increased solid–liquid contact perimeter on imbibition. Elliptical or slit-shaped pores were excluded from this initial comparison because they can be approximated by circular models with adjusted aspect ratios. The focus here is contrasting angular versus smooth-walled geometries, where corner effects are most pronounced. Future work could incorporate these additional geometries for a broader parametric analysis.
In our model, we assume that gravitational and inertial forces are negligible during imbibition. This assumption is justified at the nanometer-micrometer pore scale, where capillary pressure dominates and the flow remains in the creeping regime. The classical Lucas–Washburn equation was originally derived for capillary rise in the absence of gravitational and inertial effects, when the driving capillary pressure is balanced solely by viscous resistance [16]. Additionally, studies that extend the Washburn framework to porous media explicitly omit inertial terms as negligible beyond the initial stage of imbibition [17]. Furthermore, the process is assumed to be both capillary-driven and viscous-controlled, which is consistent with ultra-tight shale conditions. Fluid compressibility and saturation-change effects are considered negligible since imbibition times are short, pressure variations are small compared to the liquid bulk modulus, and the rock matrix is treated as incompressible. The analysis focuses on the early-time regime with piston-like displacement of the non-wetting phase. Therefore, changes in relative permeability are not explicitly modeled. Consequently, we model wetting front advance using Darcy-type viscous-dominated flow without inertial terms.
Cylindrical, square, and equilateral triangular capillaries can all be analyzed using a generalized form of the Young–Laplace equation for capillary pressure. This unified expression incorporates the geometric characteristics of the pore cross-section via a dimensionless correction factor α:
where σ is the surface tension of the liquid−gas interface, θ is the contact angle, and
The capillary-driven imbibition process in pores of arbitrary cross-sectional geometry can be described by the following general expression for the fluid imbibition distance x as a function of time t (see Appendix A for full derivation):
where A is the capillary inner area (cm2), and rh is the hydraulic radius (cm).
Fig. 2 shows the geometry of an idealized circular capillary tube used for analytical modeling.
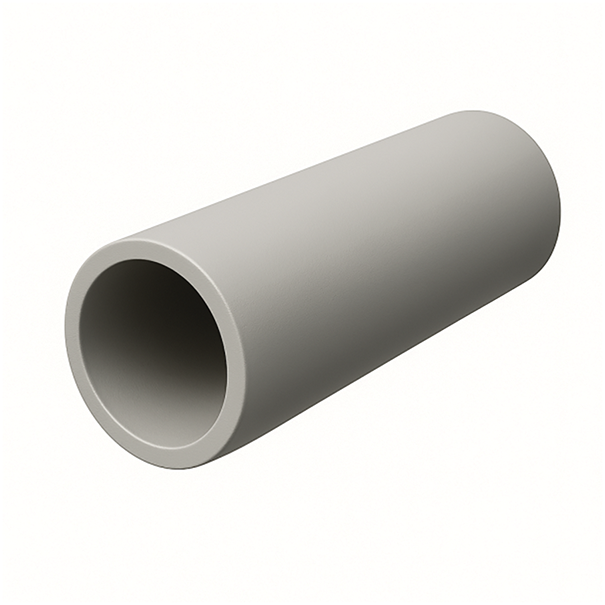
Figure 2: Circular capillary tube used as the reference geometry for imbibition modeling
For a capillary with a circular cross section, and D is the diameter of the circular cross-section. The hydraulic radius is:
where
Fig. 3 shows the geometry of an idealized square capillary tube used for comparative imbibition analysis.
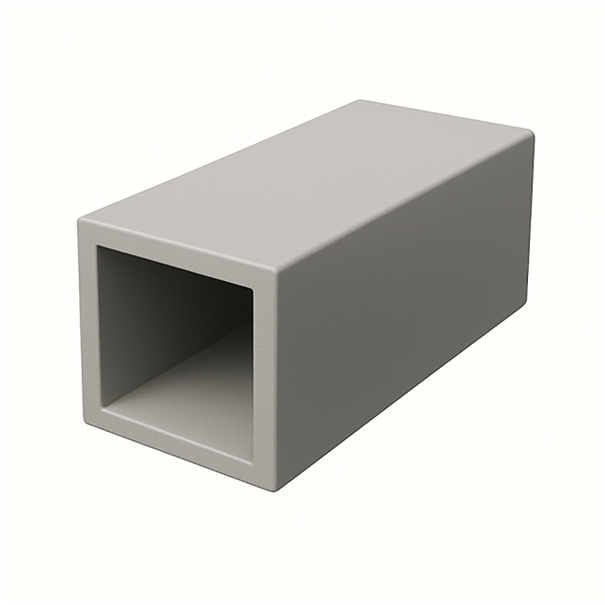
Figure 3: Square capillary tube representing angular pore channels
For a square, and a is the side length. The hydraulic radius is:
Fig. 4 shows the geometry of an idealized equilateral triangular capillary tube used for imbibition modeling.
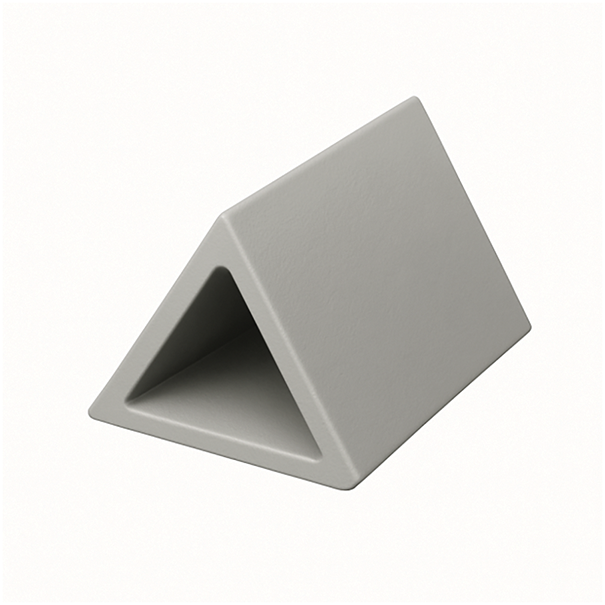
Figure 4: Equilateral triangular capillary tube representing three-sided pore channels
For an equilateral triangle, and s is the side length. The hydraulic radius is
2.2.2 Novel Triangular-Star Cross-Section Formed by Three Tangent Spherical Grains
This model represents a triangular star-shaped pore, constructed by arranging three identical spherical particles in a manner such that each sphere is tangent to the other two spheres. The centers of the three spheres form an equilateral triangle, where the three interior angles between adjacent sphere centers are all 60 degrees. This configuration is commonly observed at triple grain contacts in dense rocks and reduces capillary suction by lowering concave surface curvature. It increases the solid-liquid contact perimeter to enhance viscous resistance and utilizes asymmetric wettability to achieve heterogeneous contact angles. This simulates spontaneous imbibition behavior under complex wetting conditions. This structure is particularly well-suited for simulating capillary-driven spontaneous wetting in dense rocks, where irregular and angled pore shapes are prevalent. Fig. 5 shows the geometry of the triangular star-shaped pore formed by three tangent spheres.
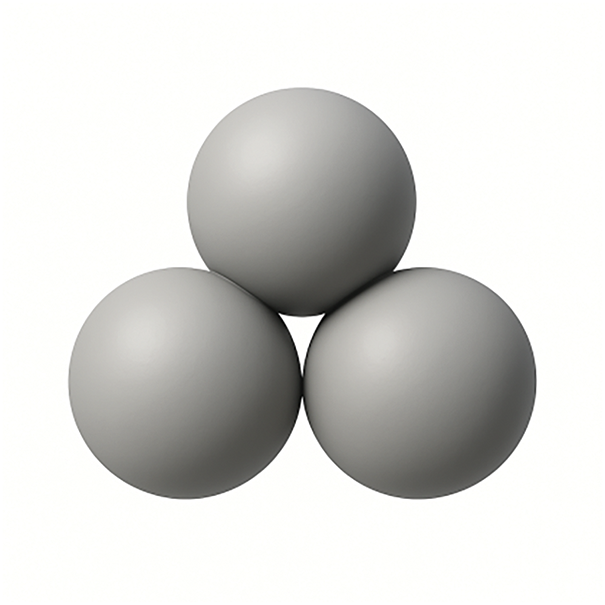
Figure 5: Triangular star-shaped pore formed by three tangent spheres, representing irregular concave pore throats in shale
Fig. 6 shows the 2D cross-sectional view of the triangular star-shaped pore formed between three tangent spheres, illustrating the curved fluid interface and central void region.
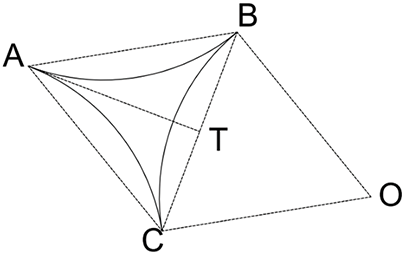
Figure 6: Geometric construction of the triangular star-shaped pore from three tangent circles, with arcs defining the concave boundaries
The area of the central void formed between the triangular star-shaped pore can be calculated by the following expression:
where D is the diameter of the sphere. The total arc length P of the three semicircular side walls of the pore is
The imbibition of the wetting phase is driven by capillary pressure and opposed by viscous resistance. By applying Newton’s second law of motion and balancing these two forces, the following analytical expression for the fluid imbibition distance x as a function of time t was derived for the triangular star-shaped pore geometry (see Appendix A for full derivation):
Fig. 7 shows a schematic representation of a porous medium used to model capillary-driven imbibition in shale, incorporating effective permeability, porosity, and relative permeability.
Figure 7: Porous medium model with randomly distributed spherical pores
Capillary force acting on a fluid in a porous medium can be defined in terms of interfacial tension, contact angle, capillary perimeter, and porosity of the medium. It is commonly expressed in terms of capillary pressure applied across the bulk cross-sectional area.
where
In porous media, the capillary pressure can be approximated by considering an equivalent circular cross-section for the pore channels. Under this assumption, the capillary pressure is expressed as:
The following expression for imbibition depth in porous media was derived based on Darcy’s law and capillary pressure principles (see Appendix A for details):
where
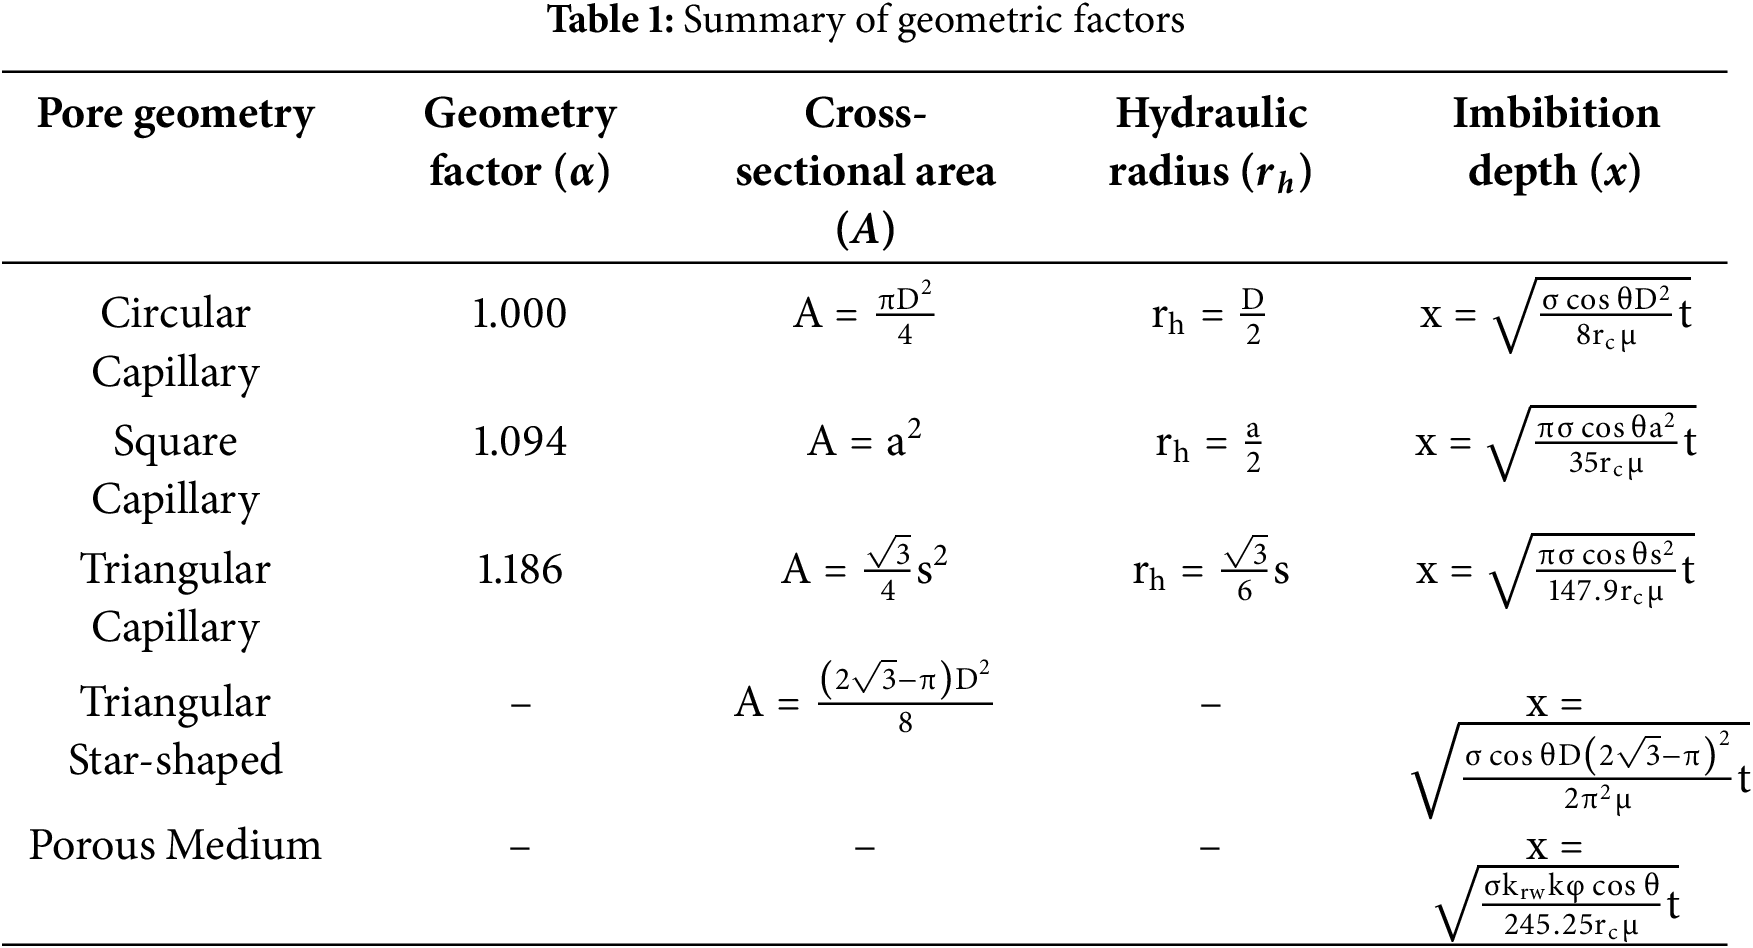
Table 1 summarizes the key geometric parameters and corresponding analytical expressions used in this study for five representative pore geometries.
Of the five models tested, the circular capillary tube had the fastest imbibition rate because it had the lowest viscous resistance and the highest capillary pressure. In contrast, the triangular star-shaped geometry greatly reduced the imbibition efficiency because of the concave surface and the larger solid-liquid contact perimeter. The square and triangular shapes were intermediate between the two extremes, due to lower capillary driving forces and increased viscous resistance. The porous medium model was the slowest imbibition rate, despite having macroscale properties representative of real formations (permeability, porosity, and relative permeability).
To quantitatively compare the performance of the five models under consistent conditions, we further calculated the imbibition distance x(t) using a unified set of physical parameters. These assumed values are representative of typical shale formations and are listed in Table 2.
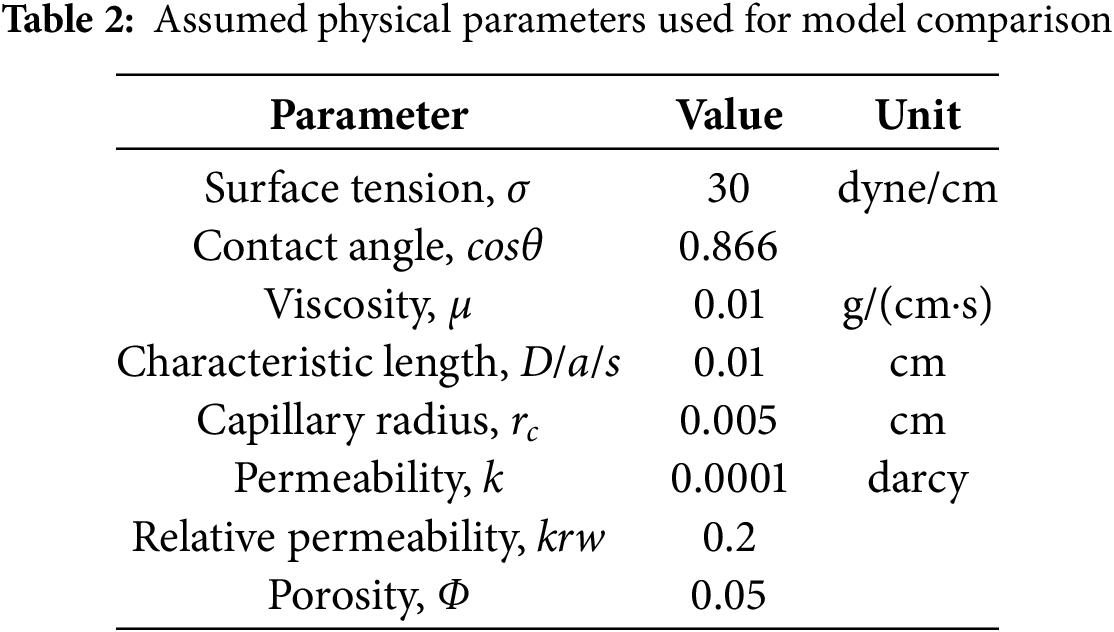
Fig. 8 provides a prediction of imbibition distance x(t) for all five models, based on the parameter set identified in Table 3, over a period of 500 s. As expected, the circular capillary had the fastest imbibition rate, followed by square and triangular geometries. The triangular star-shape geometry had a much lower imbibition rate because of its concave wall shape and larger contribution of viscous dissipation. The porous medium model had the slowest imbibition rate overall, like experimental results on tight shale formations.
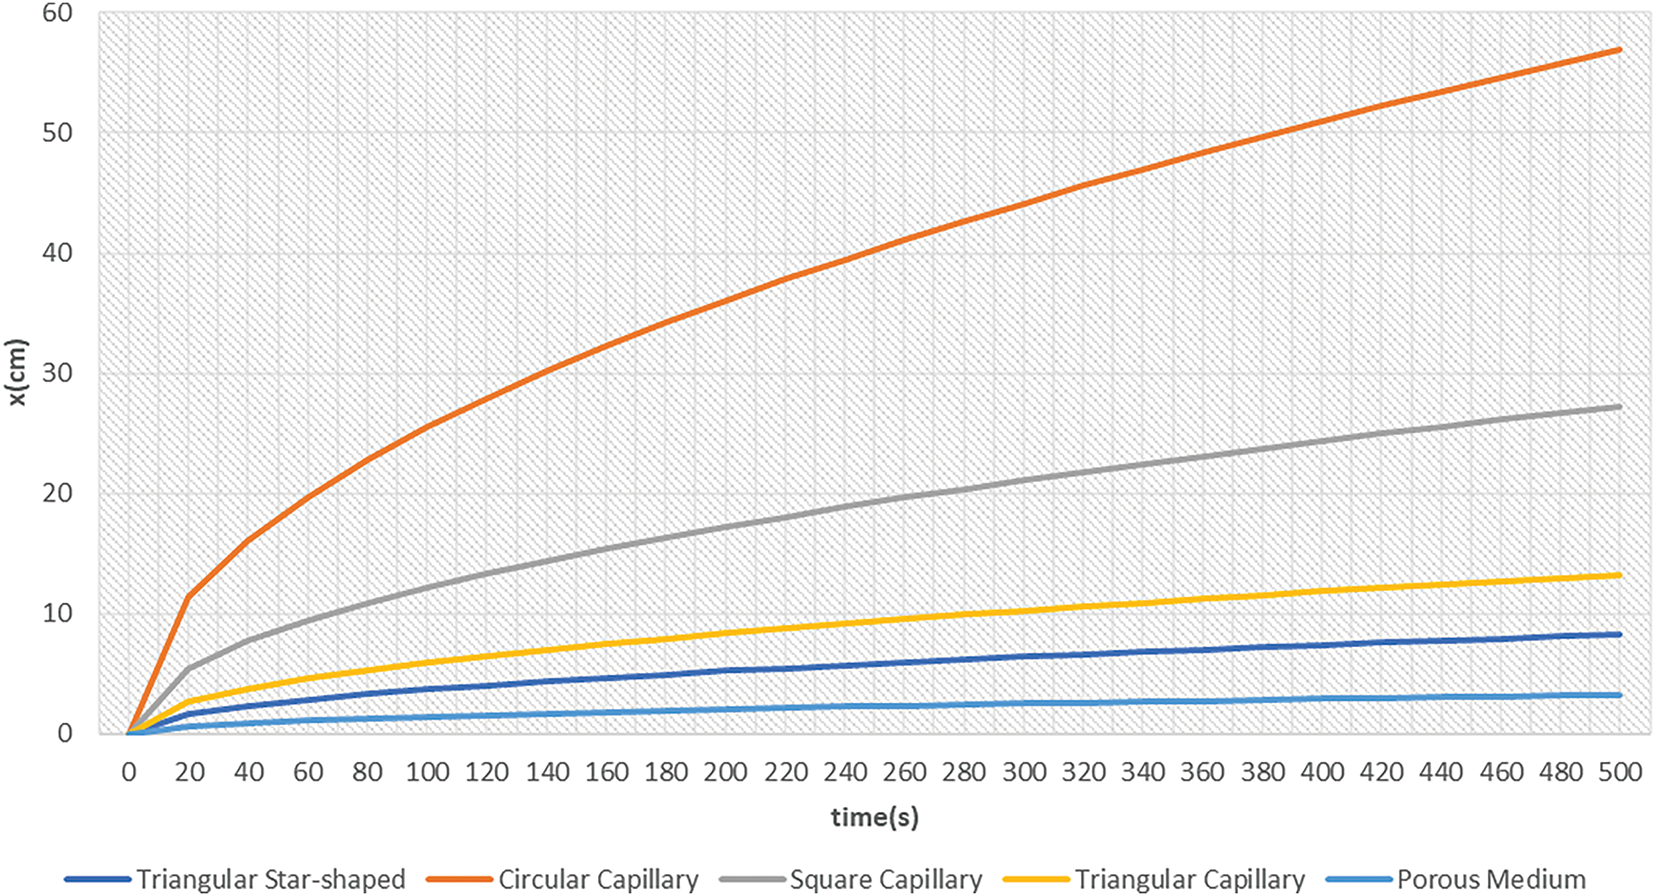
Figure 8: Comparison of imbibition distance over time for five pore geometries
To provide a clearer, more quantitative assessment of the effect of geometry on capillary imbibition, we calculated the predicted imbibition distances for all five pore geometries at a representative time of t = 500 s. As shown in Table 3, there are significant reductions in imbibition distance for geometries with sharper corners compared to the circular pore geometry.
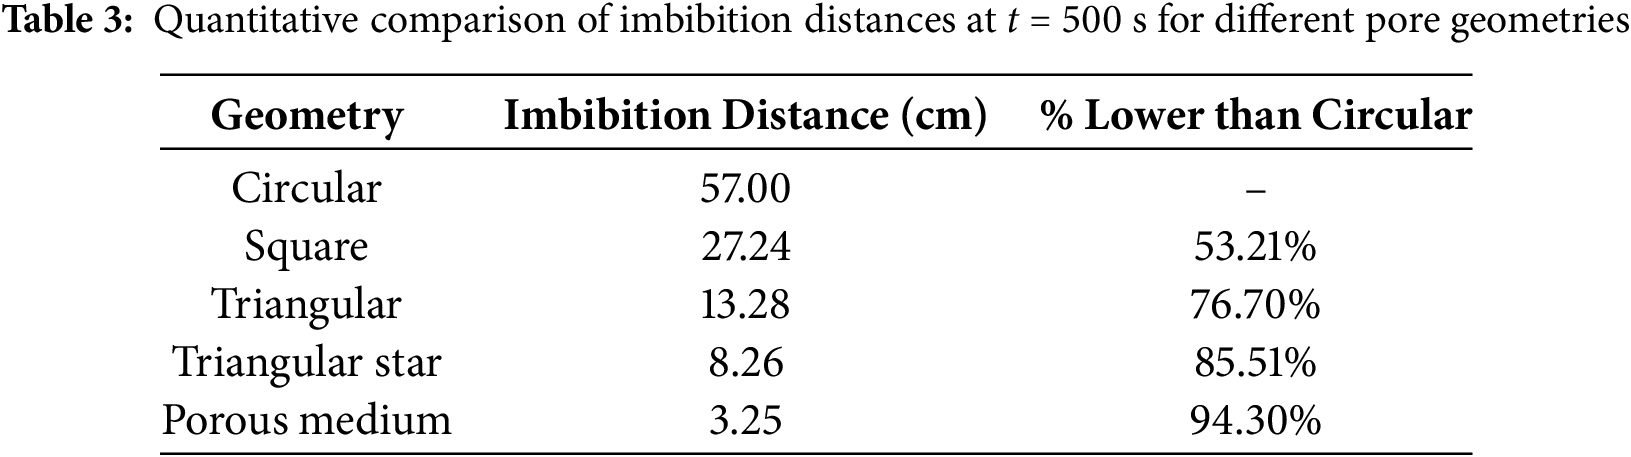
To isolate the effect of geometry, we express each case using the same time law: x(t) = Kg·
To visualize the effect of geometry at a glance, we plot a unitless, normalized rate for each shape. The normalized rate is defined as Knorm = K/Kcirc (where Kcirc = 1.0 for a circular shape). Fig. 9 summarizes these results.
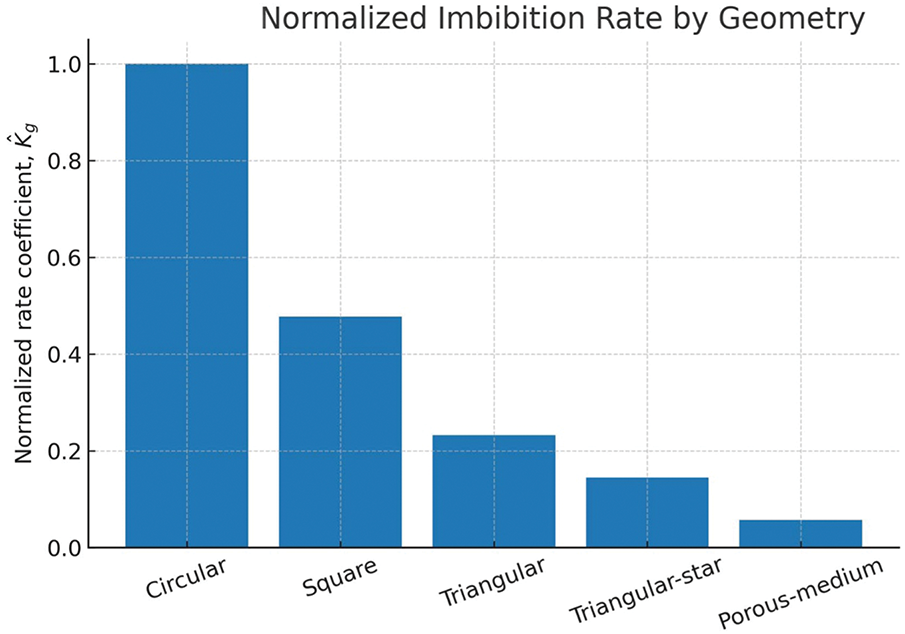
Figure 9: Normalized imbibition rate by geometry. Bars show Knorm = K/Kcirc (Circular = 1.0) computed from x (500 s). Lower values indicate slower imbibition relative to circular
To relate the above comparisons to shale-relevant pore sizes, we rescale the models from a 100-μm reference to a diameter (D) of 0.5 μm. We use 0.5 μm because shale pore throats typically range from tens of nanometers to about 1 μm, so 0.5 μm is representative. This yields a clear and readable contrast: reducing D from 100 to 0.5 μm increases the predicted times by about 200x. According to Lucas–Washburn scaling, the rate coefficient, K, increases with the square root of D; thus, the time required to reach a target distance is t = (x/K)2. Using the K values derived earlier, we estimate the time required to reach x = 1 mm for each geometry at D = 0.5 μm. Table 5 reports these numbers, and Fig. 10 plots them on a logarithmic scale to demonstrate the differences in order of magnitude. Results at other sizes follow the same rule: time scales approximately as 1/D.
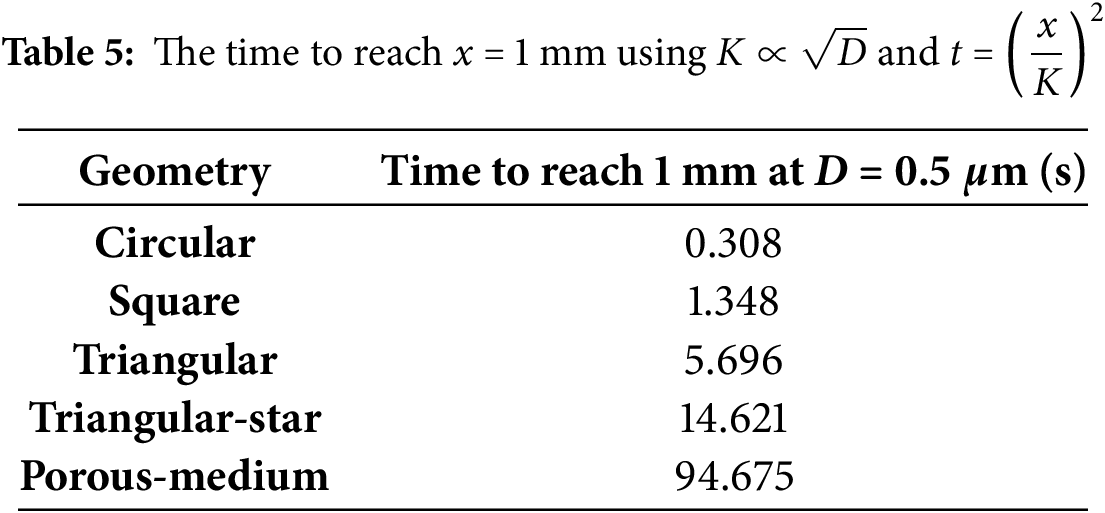
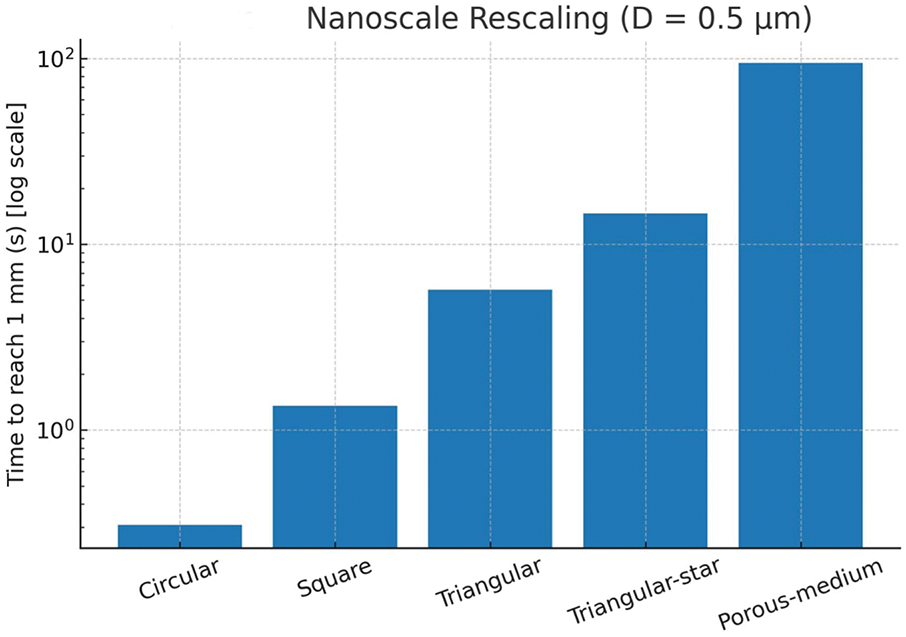
Figure 10: Nanoscale rescaling (D = 0.5 μm): time to reach 1 mm
The analytical solutions for different pore geometries reveal the following laws:
First, the liquid imbibition distances of all models follow the time law of x(t), which is consistent with the classical Lucas-Washburn law. This suggests that the capillary-driven spontaneous imbibition process generally exhibits diffusion-like kinetics, regardless of variations in pore geometry. As summarized in Table 4 and Fig. 9, this common square-root-of-time trend allows a like-for-like comparison in which differences are captured entirely by the rate coefficient rather than the time exponent.
Second, pore shape has a decisive influence on the imbibition rate under the same conditions of feature size. Circular capillary models have the fastest imbibition rate, followed by square pores, equilateral triangular pores are even slower, and triangular star-shaped channels with concave interfaces have the slowest imbibition rate. The shape characteristics directly determine the coupling effect of capillary suction and flow resistance, which in turn leads to significant differences in imbibition rates. Quantitatively, the unitless normalized rates are 1.00 (circular), 0.478 (square), 0.233 (triangular), 0.145 (triangular-star), and 0.057 (porous-medium) (see Table 4; visualized in Fig. 9), indicating a drop of 52%, 77%, 85%, and 94% relative to the circular case.
Further analysis shows that sharp edges and concave geometries jointly inhibit liquid imbibition through two mechanisms: on the one hand, sharp edges or concave regions reduce the mean curvature of the meniscus interface, thus weakening capillary suction; on the other hand, such complex interfaces increase the contact perimeter between the wetting liquid and the solid, leading to an increase in viscous resistance. The dual effect of weakened capillary suction and enhanced flow resistance results in significantly lower liquid imbibition rates in pores with sharp corners or concave structures than in circular pores with the same feature size. These two effects—lower meniscus curvature and a longer wetting perimeter—explain the monotonic decrease observed in Fig. 9 and the values reported in Table 4.
In a porous media model simulating an actual shale matrix (introducing the effects of porosity, tortuosity, and partial oil-phase saturation and using Darcy’s law to describe seepage), the imbibition rate is further reduced and is significantly lower than that predicted by various types of single-ideal pore models. When the relative permeability effect in two-phase flow is introduced, the decrease in imbibition rate is even more pronounced, which is highly consistent with the slow imbibition of shale matrix commonly observed in experiments.
These findings have important guiding significance for engineering practice. First, the ideal cylindrical pore model commonly used in the past can significantly overestimate the fluid absorption rate in shale reservoirs, which can easily lead to insufficient time to shut-in the well after fracturing. Second, the design of fracturing programs and operating parameters should focus on the differences in pore shapes (especially those with sharp corners or depressions), as well as the interaction between fluids and gases, which require additional shut-in time to allow for full fluid imbibition in such reservoirs. Third, the use of additives that reduce surface tension or change the hydrophilicity of the material can improve the imbibition of fluids in complex pores, which can lead to more recovery of fracturing fluids as well as higher hydrocarbon production. Practically, to reach the same penetration depth, the required soak time scales as (1/Knorm)2; relative to the circular case, square, triangular, triangular-star, and porous-medium geometries increase the required time by factors of approximately 4.4, 18, 48, and 300, respectively (Fig. 10; Table 5).
We develop a theoretical framework for quantifying the effect of pore geometry on the spontaneous capillary imbibition process in shale. By deriving analytical solutions for five representative pore geometries (circular, square, equilateral triangle, delta-star, and porous media), we find that the imbibition distance follows x(t) in all cases, validating the Lucas-Washburn behavior. However, the calculated imbibition rate coefficients differ significantly between geometries: pores with sharp corners or concave wall structures absorb fluid at a much lower rate than cylindrical pores, provided that the characteristic dimensions are the same. This difference arises because sharp corners increase viscous dissipation by enlarging the solid-liquid contact perimeter. In contrast, concave wall structures reduce effective capillary pressure by lowering the mean curvature of the liquid-air interface. In contrast, circular capillaries maintain maximum curvature and minimum flow resistance, resulting in the fastest imbibition rates. For porous media, factors such as tortuosity and restricted connectivity further slow fluid advance. In addition, a porous media model that considers network connectivity with initial oil saturation predicts lower overall imbibition rates, which is consistent with the slow absorption observed in actual shales. The above results suggest that pore geometry has an important influence on the imbibition behavior and that neglecting angular effects or multiphase flow properties can lead to significant overestimation of imbibition rates.
Overall, this study provides a theoretical basis for hydraulic fracturing design in unconventional reservoirs, emphasizing the critical role of real pore geometry characteristics and fluid properties (e.g., interfacial tension and wettability) in accurately predicting the wetting behavior and optimizing post-fracturing well shut-in operations. As a result, by adjusting pore-scale parameters or optimizing fracturing fluid formulations, engineers are able to more accurately control fluid wetting during post-fracturing operations, thereby enhancing oil and gas recovery.
Nevertheless, this work has limitations that may affect its applicability. The current models assume uniform wettability and single-phase, capillary-dominated flow. Therefore, mixed wettability and two-phase countercurrent displacement are not explicitly represented. Mineral-organic heterogeneity can modify local capillary pressure. Displacement of a non-wetting phase introduces viscous coupling and relative-permeability effects that may reduce imbibition rates compared to our estimates. As immediate next steps, we will: Measure static and dynamic (advancing–receding) contact angles, as well as interfacial and surface tensions, using a KRÜSS DSA100S. We will then update the Young–Laplace term using the measured σ and a hysteresis-aware effective θ. Second, we will recompute the models and report uncertainty bands based on the measured wettability range. Finally, we will perform a sensitivity study of two-phase countercurrent imbibition using standard Pc (Sw) and kr (Sw) functions from the literature and benchmark trends against published microfluidic/core imbibition data.
Acknowledgement: The authors would like to thank the Department of Petroleum Engineering at the University of Louisiana at Lafayette for providing academic support and resources for this research.
Funding Statement: The authors received no specific funding for this study.
Author Contributions: Jin Xue: Methodology, Formal Analysis, Writing—Original Draft, Writing—Review & Editing. Boyun Guo: Supervision, Validation. All authors reviewed the results and approved the final version of the manuscript.
Availability of Data and Materials: All data generated or analyzed during this study are included in this published article. Additional datasets related to this article are available from the corresponding author on reasonable request.
Ethics Approval: Not applicable.
Conflicts of Interest: The authors declare no conflicts of interest to report regarding the present study.
Appendix A Derivation of Analytical Models for Capillary Imbibition in Various Pore Geometries
Appendix A.1 Novel Triangular-Star Cross-Section Formed by Three Tangent Spherical Grains
The geometry referenced in this is illustrated in Fig. 6 of the main text.
D is the diameter of the sphere.
Conditions: ∠BOC = 60°,
We know that:
Because △BOC is equilateral,
Because △BOC is all equal to the △ABC,
As
where Fc is the capillary force in Dyne, A is the capillary inner area in cm2, and
As
The viscous friction force Ff acting on the inner cross-sectional area of the capillary is expressed as:
The volumetric flow rate q in a pipe (m3/s) is given by the following Hagen-Poiseuille equation:
where q is approximated by:
Substituting Eq. (A12) into Eq. (A11) yields:
The hydraulic radius
Substitutions of Eqs. (A4) and (A5) into Eq. (A14) yield:
Substituting Eqs. (A4) and (A15) into Eq. (A13) yields:
For horizontal imbibition processes where gravitational effects are negligible, Newton’s second law of motion can be applied to the fluid flow as follows (
Substitutions of Eqs. (A6), (A8), (A9), (A16) and (A10) into Eq. (A17) yield:
Because
or:
where:
The following initial conditions:
If the second order derivative term in Eq. (A20) is negligible, the governing equation degenerates to:
which can be expressed in an integral form as follows:
which, upon integration, gives:
Substitutions of Eqs. (A4) and (A28) into Eq. (A27) leads to a general solution for capillary-driven imbibition in pore throat geometries.
Appendix A.2 Cylindrical Capillary
The capillary pressure pc is determined by the L−Y equation:
where σ is the surface tension of the liquid−gas interface, θ is the contact angle, and
Substituting Eqs. (A6) and (A9) into Eq. (A17) yields:
Substituting Eqs. (A30) and (A31) into Eq. (A17) yields:
Eq. (A33) is rearranged to give:
or:
where:
Substituting Eqs. (A36) and (A37) into Eq. (A28) leads to a general solution for capillary-driven imbibition in pore throat geometries.
For a capillary with a circular cross section:
D is the diameter of the circular cross-section.
Substituting Eqs. (A39) and (A40) into Eq. (A14) yields:
Substituting Eqs. (A39) and (A41) into Eq. (A38) and α = 1, we obtain:
For a square:
a is the side length.
Substituting Eqs. (A43) and (A44) into Eq. (A14) yields:
Substituting Eqs. (A43) and (A45) into Eq. (A38) and α = 1.094, we obtain:
For an equilateral triangle:
s is the side length.
Substituting Eqs. (A47) and (A48) into Eq. (A14) yields:
Substituting Eqs. (A47) and (A49) into Eq. (A38) and α = 1.186, we obtain:
Appendix A.3 Porous Media: The capillary force exerted on a fluid in a porous medium can be characterized by parameters such as interfacial tension, contact angle, capillary perimeter, and the medium’s porosity. It is commonly expressed in terms of capillary pressure applied across the bulk cross-sectional area.
where
where σ is the interfacial tension in Dyne/cm,
The frictional pressure within porous media is governed by Darcy’s law and can be written as:
where
Substitutions of Eqs. (A51)–(A54) into Eq. (A55) gives:
Because
or:
where:
Substitutions of Eqs. (A59) and (A60) into Eq. (A28) gives:
References
1. Guo B, Wortman P. Understanding the post-frac soaking process in multi-fractured shale gas-oil wells. Capillarity. 2024;12(1):6–16. doi:10.46690/capi.2024.07.02. [Google Scholar] [CrossRef]
2. Li C, Singh H, Cai J. Spontaneous imbibition in shale: a review of recent advances. Capillarity. 2019;2(2):17–32. doi:10.26804/capi.2019.02.01. [Google Scholar] [CrossRef]
3. Cai J, Chen Y, Liu Y, Li S, Sun C. Capillary imbibition and flow of wetting liquid in irregular capillaries: a 100-year review. Adv Colloid Interface Sci. 2022;304(5398):102654. doi:10.1016/j.cis.2022.102654. [Google Scholar] [PubMed] [CrossRef]
4. Gong R, Wang X, Li L, Li K, An R, Xian C. Lattice Boltzmann modeling of spontaneous imbibition in variable-diameter capillaries. Energies. 2022;15(12):4254. doi:10.3390/en15124254. [Google Scholar] [CrossRef]
5. Meng Q, Liu H, Wang J. A critical review on fundamental mechanisms of spontaneous imbibition and the impact of boundary condition, fluid viscosity and wettability. Adv Geo-Energy Res. 2017;1(1):1–17. doi:10.26804/ager.2017.01.01. [Google Scholar] [CrossRef]
6. Zheng J, Chen Z, Xie C, Wang Z, Lei Z, Ju Y, et al. Characterization of spontaneous imbibition dynamics in irregular channels by mesoscopic modeling. Comput Fluids. 2018;168:21–31. doi:10.1016/j.compfluid.2018.01.024. [Google Scholar] [CrossRef]
7. Cai J, Perfect E, Cheng C-L, Hu X. Generalized modeling of spontaneous imbibition based on Hagen-Poiseuille flow in tortuous capillaries with variably shaped apertures. Langmuir. 2014;30(17):5142–51. doi:10.1021/la5007204. [Google Scholar] [PubMed] [CrossRef]
8. Shen W, Gao Z, Hu Q. A fractal model of water transport in shale reservoirs considering the effect of nano-pore connectivity and liquid slippage. Fuel. 2018;223:83–95. doi:10.1016/j.fuel.2018.03.039. [Google Scholar] [CrossRef]
9. Wang X, Sheng JJ. Spontaneous imbibition analysis in shale reservoirs based on pore network modeling. J Pet Sci Eng. 2018;169(1):663–72. doi:10.1016/j.petrol.2018.06.028. [Google Scholar] [CrossRef]
10. Wang X, Sheng JJ. Dynamic pore-scale network modeling of spontaneous water imbibition in shale and tight reservoirs. Energies. 2020;13(18):4709. doi:10.3390/en13184709. [Google Scholar] [CrossRef]
11. Wiklund HS, Uesaka T. Microfluidics of imbibition in random porous media. Phys Rev E. 2013;87(2):023006. doi:10.1103/PhysRevE.87.023006. [Google Scholar] [PubMed] [CrossRef]
12. Yu T, Zhou J, Doi M. Capillary imbibition in a square tube. Soft Matter. 2018;14(45):9263–70. doi:10.1039/C8SM01494A. [Google Scholar] [PubMed] [CrossRef]
13. Zhao J, Qin F, Fischer R, Kang Q, Derome D, Carmeliet J. Spontaneous imbibition in a square tube with corner films: theoretical model and numerical simulation. Water Resour Res. 2021;57(2):e2020WR029190. doi:10.1029/2020WR029190. [Google Scholar] [CrossRef]
14. Zhao J, Qin F, Fei L, Qin C, Kang Q, Derome D, et al. Competition between main meniscus and corner film flow during imbibition in a strongly wetting square tube. J Hydrol. 2022;615(12):128695. doi:10.1016/j.jhydrol.2022.128695. [Google Scholar] [CrossRef]
15. Zhou J, Doi M. Universality of capillary rising in corners. J Fluid Mech. 2020;900:A29. doi:10.1017/jfm.2020.531. [Google Scholar] [CrossRef]
16. Washburn EW. The dynamics of capillary flow. Phys Rev. 1921;17(3):273–83. doi:10.1103/PhysRev.17.273. [Google Scholar] [CrossRef]
17. Perré P, Nguyen DM, Almeida G. A macroscopic Washburn approach of liquid imbibition in wood derived from X-ray tomography observations. Scientific Report. 2022;12(1):1750. doi:10.1038/s41598-022-05508-0. [Google Scholar] [PubMed] [CrossRef]
Cite This Article
 Copyright © 2025 The Author(s). Published by Tech Science Press.
This work is licensed under a Creative Commons Attribution 4.0 International License , which permits unrestricted use, distribution, and reproduction in any medium, provided the original work is properly cited.
 Downloads
 Citation Tools