
 Submit a Paper
 Propose a Special lssue
 Open Access
ARTICLE

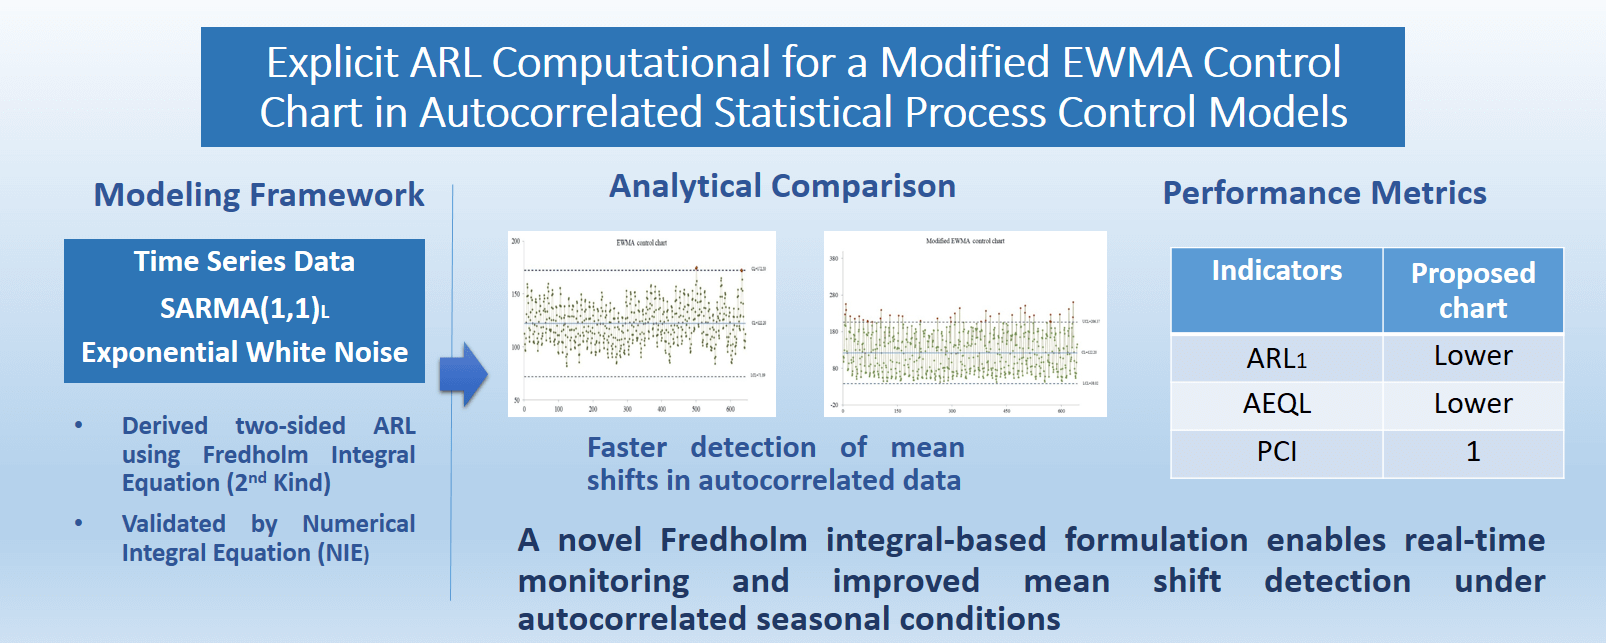
Explicit ARL Computational for a Modified EWMA Control Chart in Autocorrelated Statistical Process Control Models
1 Department of Applied Mathematics and Statistics, Phetchabun Rajabhat University, Phetchabun, 67000, Thailand
2 Department of Applied Statistics, King Mongkut’s University of Technology North Bangkok, Bangkok, 10800, Thailand
3 Department of Educational Testing and Research, Buriram Rajabhat University, Buriram, 31000, Thailand
* Corresponding Author: Korakoch Silpakob. Email:
(This article belongs to the Special Issue: Scientific Computing and Its Application to Engineering Problems)
Computer Modeling in Engineering & Sciences 2025, 145(1), 699-720. https://doi.org/10.32604/cmes.2025.067702
Received 09 May 2025; Accepted 28 September 2025; Issue published 30 October 2025
 View Full Text
 Download PDF
Abstract
This study presents an innovative development of the exponentially weighted moving average (EWMA) control chart, explicitly adapted for the examination of time series data distinguished by seasonal autoregressive moving average behavior—SARMA(1,1)L under exponential white noise. Unlike previous works that rely on simplified models such as AR(1) or assume independence, this research derives for the first time an exact two-sided Average Run Length (ARL) formula for the Modified EWMA chart under SARMA(1,1)L conditions, using a mathematically rigorous Fredholm integral approach. The derived formulas are validated against numerical integral equation (NIE) solutions, showing strong agreement and significantly reduced computational burden. Additionally, a performance comparison index (PCI) is introduced to assess the chart’s detection capability. Results demonstrate that the proposed method exhibits superior sensitivity to mean shifts in autocorrelated environments, outperforming existing approaches. The findings offer a new, efficient framework for real-time quality control in complex seasonal processes, with potential applications in environmental monitoring and intelligent manufacturing systems.Graphic Abstract
Keywords
To guarantee that products and services achieve certain standards, particularly in manufacturing and service industries, quality control is vital. Effective monitoring and control processes are essential for maintaining product consistency and meeting customer expectations. Statistical process control (SPC) provides a robust framework for refining process quality through various analytical tools, of which control charts are an important tool. Many businesses make extensive use of these charts to track procedure performance and ascertain shifts in procedure averages, which are crucial markers of process consistency [1–4]. Initially presented by Shewhart [5], conventional control charts remain the basic tool for identifying large and significant changes in a process. However, their effectiveness is reduced when smaller, more subtle deviations are detected, which are often important for the early detection of process problems. Researchers have developed alternative control charts tailored to pinpoint substantial and minor changes to address the limitations of Shewhart charts. Among these innovations, the Cumulative Sum Control Chart (CUSUM) described by Page [6] has been acknowledged for its exceptional ability to distinguish minor alterations in the process mean compared to the Shewhart chart [7–9]. Similarly, Roberts [10] introduced the Exponential Weighted Moving Average (EWMA) control chart, which has demonstrated its efficiency in perceiving minor changes, especially when dealing with non-independent or non-normally distributed data [11–13]. The EWMA chart offers a more responsive detection mechanism for small changes, complementing existing tools in SPC. Based on the EWMA framework, Khan et al. [14] presented a modified EWMA statistic, integrating supplementary constants to describe past and present process behavior [15]. This modification is particularly useful when the data shows deviations from the assumptions of independence or normality, which are common in many real-world processes [16–19].
Particularly when assessed with the average running length (ARL) in mind, a significant aspect of control chart execution, spotlighting recent data makes the modified EWMA chart outpace long-established approaches [20–22]. The ARL shows the typical number of events that must happen in order for the control chart to alert us that this particular operation is no longer under control. Moreover, it is divided into two main components, ARL0 and ARL1. ARL0 represents the mean time that the process can be considered in control, which should ideally be maximized, while ARL1 measures the rapidity with which the control chart can distinguish processes that are not in control, and ought to be minimized. Many different methodologies have been used to estimate the ARL, comprising Monte Carlo simulations, Markov chain approaches, and numerical integral equations (NIE). Of these, explicit formulas derived from the integral equations have been proven to be particularly effective for estimating the ARL. For example, Crowder [23] used an integral equation procedure for ARL assessment for Gaussian processes on EWMA control charts, while Champ and Rigdon [24] used a similar approach with CUSUM and EWMA charts, comparing the outcomes gained with Markov Chain simulations. Fredholm’s integral equation has also been widely used to estimate the ARL, demonstrating its effectiveness in various control chart setups [25–27]. Despite these advances, standard EWMA charts can sometimes perform sub-optimally when serially correlated data exists [28]. The equal weighting of historical and current data may hinder detection sensitivity.
To overcome this problem, a modified EWMA control chart was presented, incorporating additional constants to focus on recent observations rather than historical ones. This approach has shown superior performance, especially when applied to data violating normality assumptions, with increased ARL performance compared to traditional EWMA control charts [14,29–32]. The revised charts have also shown excellent results when applied to real-world or industrial data sets, highlighting the practical value of the charts [33–36]. Notably, the modified EWMA chart surpasses the customary EWMA chart, according to multiple researchers, in detecting small process shifts, offering lower ARL1 values and enhanced responsiveness in autocorrelated or non-normal environments.
This study proposes a novel modification of the EWMA control chart. We hypothesize that it will exhibit superior properties, especially in its capability to perceive minor deviations in the procedure more efficiently and achieve lower ARL. Using the second-type Fredholm integral equation, we deduce an explicit formula for the two-sided ARL to detect mean changes in seasonal regressive moving average (SARMA(1,1)L) processes with exponential white noise. This particular model is selected because SARMA(1,1)L effectively captures both short-term autocorrelation and seasonal patterns commonly observed in real-world environmental and industrial processes, making it a realistic and practically relevant test case for evaluating control chart performance. The Gauss-Legendre quadrature is used as an efficient and accurate method to compare the proposed formula with the NIE approach. Finally, for the numerical integral, we validate the execution of our proposed control chart by applying it to rainfall data from Thailand, demonstrating its practical utility in monitoring environmental processes.
2 Qualities of Different EWMA Control Charts
Descriptions of the standard and modified Exponentially Weighted Moving Average (EWMA) control chart attributes appear within subsequent subsections. Modified EWMA charts provide increased efficiency by tackling autocorrelation and procedure-specific properties, whereas standard EWMA charts are useful for identifying negligible changes in procedure means.
2.1 The Standard EWMA Control Chart
The standard EWMA control chart allows negligible shifts to be distinguished in the procedure mean, which is described below:
in which
The control chart indicates an out-of-control condition when the upper control limit (UCL) or lower control limit (LCL) is breached by the EWMA statistic. The stopping time
in which here a represents the LCL and b represents the UCL. It is then possible to evaluate the ARL for the SARMA(1,1)L process on the standard EWMA control chart, which has a starting value (Z0
in which the value of T is fixed (preferably large), and E∞(.) represents the probability when it is postulated that the observations εt are distributed as F(yt,
For the standard EWMA control chart, it is possible to express the mean and the variance as follows:
and
In the case of the control limit (
in which
2.2 The Modified EWMA Control Chart
Khan et al. [14] improved an adapted EWMA indicator initially suggested by Patel and Divecha [15] by presenting a modernized EWMA control chart. This improved approach incorporates both historical and current process data, with the modified statistic expressed below:
in which Mt represents the modified EWMA statistic, Mt shows the succession of the SARMA(1,1)L procedure with exponential white noise,
in which the LCL is shown as g and the UCL is given as h. The ARL for the SARMA(1,1)L process on the modified EWMA control chart with an initial value (M0
in which the value of T is fixed, and E∞(.) represents the expected value, assuming that the observations
The modified EWMA control chart has mean and variance expressed as shown below:
and
In the case of the control limit (CL
where L2 is a multiplier that distinguishes the control limits’ width.
3 Analytical Derivation of Two-Sided ARL for SARMA(1,1)L Process on the Modified EWMA Chart
The SARMA(1,1)L procedure is particularly effective for applications where data shows periodicity, such as in climatology and economics, and is commonly used to create control charts that monitor shifts and anomalies in seasonal time series data. It is characterized by
in which
The specific formulae for determining the ARL of the modified EWMA control chart for SARMA(1,1)L process are derived as follows:
At
If
Eq. (14) is a Fredholm integral equation of the second kind [21], so accordingly, it is possible to rewrite G(u) in the form of
Let
By substituting a new variable in the integral, the integral equation acquired is shown as follows:
If
Let function
Let
When solved in the case of constant B from Eq. (17), the result is
By substituting constant B into Eq. (17), we derive
Hence, the Fredholm integral equation of the second kind from Eq. (18) can describe the explicit formulas for the 2-sided ARL of the SARMA(1,1)L processes when examined by the modified EWMA control chart. The formulation can be simplified and expressed in a closed form as:
3.2 Presence and Distinctiveness of Explicit Formula
This study exhibits the presence and distinctiveness of the resolution to the integral equation in Eq. (16). Initially, this is expressed as
Theorem 1. (Banach’s fixed-point theorem [37]) Where C[g, h] is the set comprising all continuous functions on the complete metric (X, d), under the assumption that T: X
Proof of Theorem 1. To demonstrate that T characterized in Eq. (17) is a contraction mapping for
where
Thus, this study confirms the presence and exclusivity of the solution through the application of Banach’s fixed-point theorem. □
4 The NIE for the ARL of SARMA(1,1)L Process on the Modified EWMA Control Chart
Often implemented with a variety of quadrature rules, including midpoint, trapezoidal, Simpson’s rule, and Gauss-Legendre, the NIE technique is frequently engaged to assess the ARL. Each of these methods produces ARL values that are highly similar to one another [38]. The interval is determined when utilizing the midpoint, trapezoidal, and Simpson’s rules to solve the issues involved in integrating a function over the interval. However, it becomes interminable when applying the Gauss-Legendre parameter [39]. Thus, this research assessed the ARL by means of the Gauss-Legendre rule. The quadrature formula can be applied to estimate an integral equation of the second kind to apply to the ARL on the modified EWMA control chart in the case of the SARMA(1,1)L procedure in Eq. (18). The Gauss-Legendre quadrature directive is utilized below:
Given
The calculation for the integral of Eq. (21) is as follows.
in which
By applying the Gauss-Legendre quadrature formula, a numerical approximation
5 Results of Comparing the Accuracy of Explicit Formula and NIE Methods
Specifics are given in this section concerning a simulation assessing the efficacy of the NIE approach and explicit formulas in gauging the ARL for the ARMA(1,1)L procedure for the modified EWMA control chart suggested in this study. The study was performed with parameters set as follows:
in which
Eqs. (18) and (23) were employed to derive the SARMA(1,1)L process ARL with exponential white noise under the modified EWMA control chart. All computations, including both the numerical integration (NIE method with 1000 iterations) and the evaluation of the explicit ARL formulas, were performed using a computer equipped with an Intel(R) Core(TM) i5-8265U CPU @ 1.60 GHz 1.80 GHz and 8.00 GB RAM, using Mathematica, ensuring consistency, precision, and computational efficiency. The resulting ARL values are presented in Tables 1 and 2.


The two-sided evaluation of ARL values calculated by means of the suggested explicit formulas completely corresponds with those acquired by applying the numerical integral equation (NIE) procedure, as shown in Tables 1 and 2. This consistency confirms the mathematical accuracy and validity of the closed-form solutions derived in this study. Specifically, the numerical ARL approximations from both approaches exhibited a 100% match across all test scenarios, ensuring that the explicit formulation introduced no loss in precision.
Although both methods yield identical ARL results, their computational efficiency differs greatly. The NIE method takes about 7–9 s per evaluation due to complex numerical procedures, while the explicit formulas produce results in under 0.001 s—over 7000 times faster. This efficiency makes the proposed method highly suitable for real-time monitoring and large-scale applications in automated statistical process control.
6 Evaluating Control Chart Performance via Explicit ARL Formula
The current research employed an extended analysis to evaluate a number of different control charts to compare their efficiency to that of the original EWMA control chart. To gauge their efficacy, performance metrics including Performance Comparison Index (PCI) and Average Extra Quadratic Loss (AEQL) were employed [40].
in which δ symbolizes a specific alteration to the process and
The PCI metric evaluates the AEQL for a specific chart and compares it to the most suitable chart for which the AEQL value is lowest, so that the control chart efficiency can be determined. The PCI can be mathematically represented as:
where the value for PCI equals 1, this indicates the most efficient control chart, while values above 1 suggest lower efficiency.
For the two-sided ARL comparison of the SARMA(1,1)L process on standard and modified EWMA control charts, parameters were set as follows: target ARL0 = 370, and 500; smoothing parameters


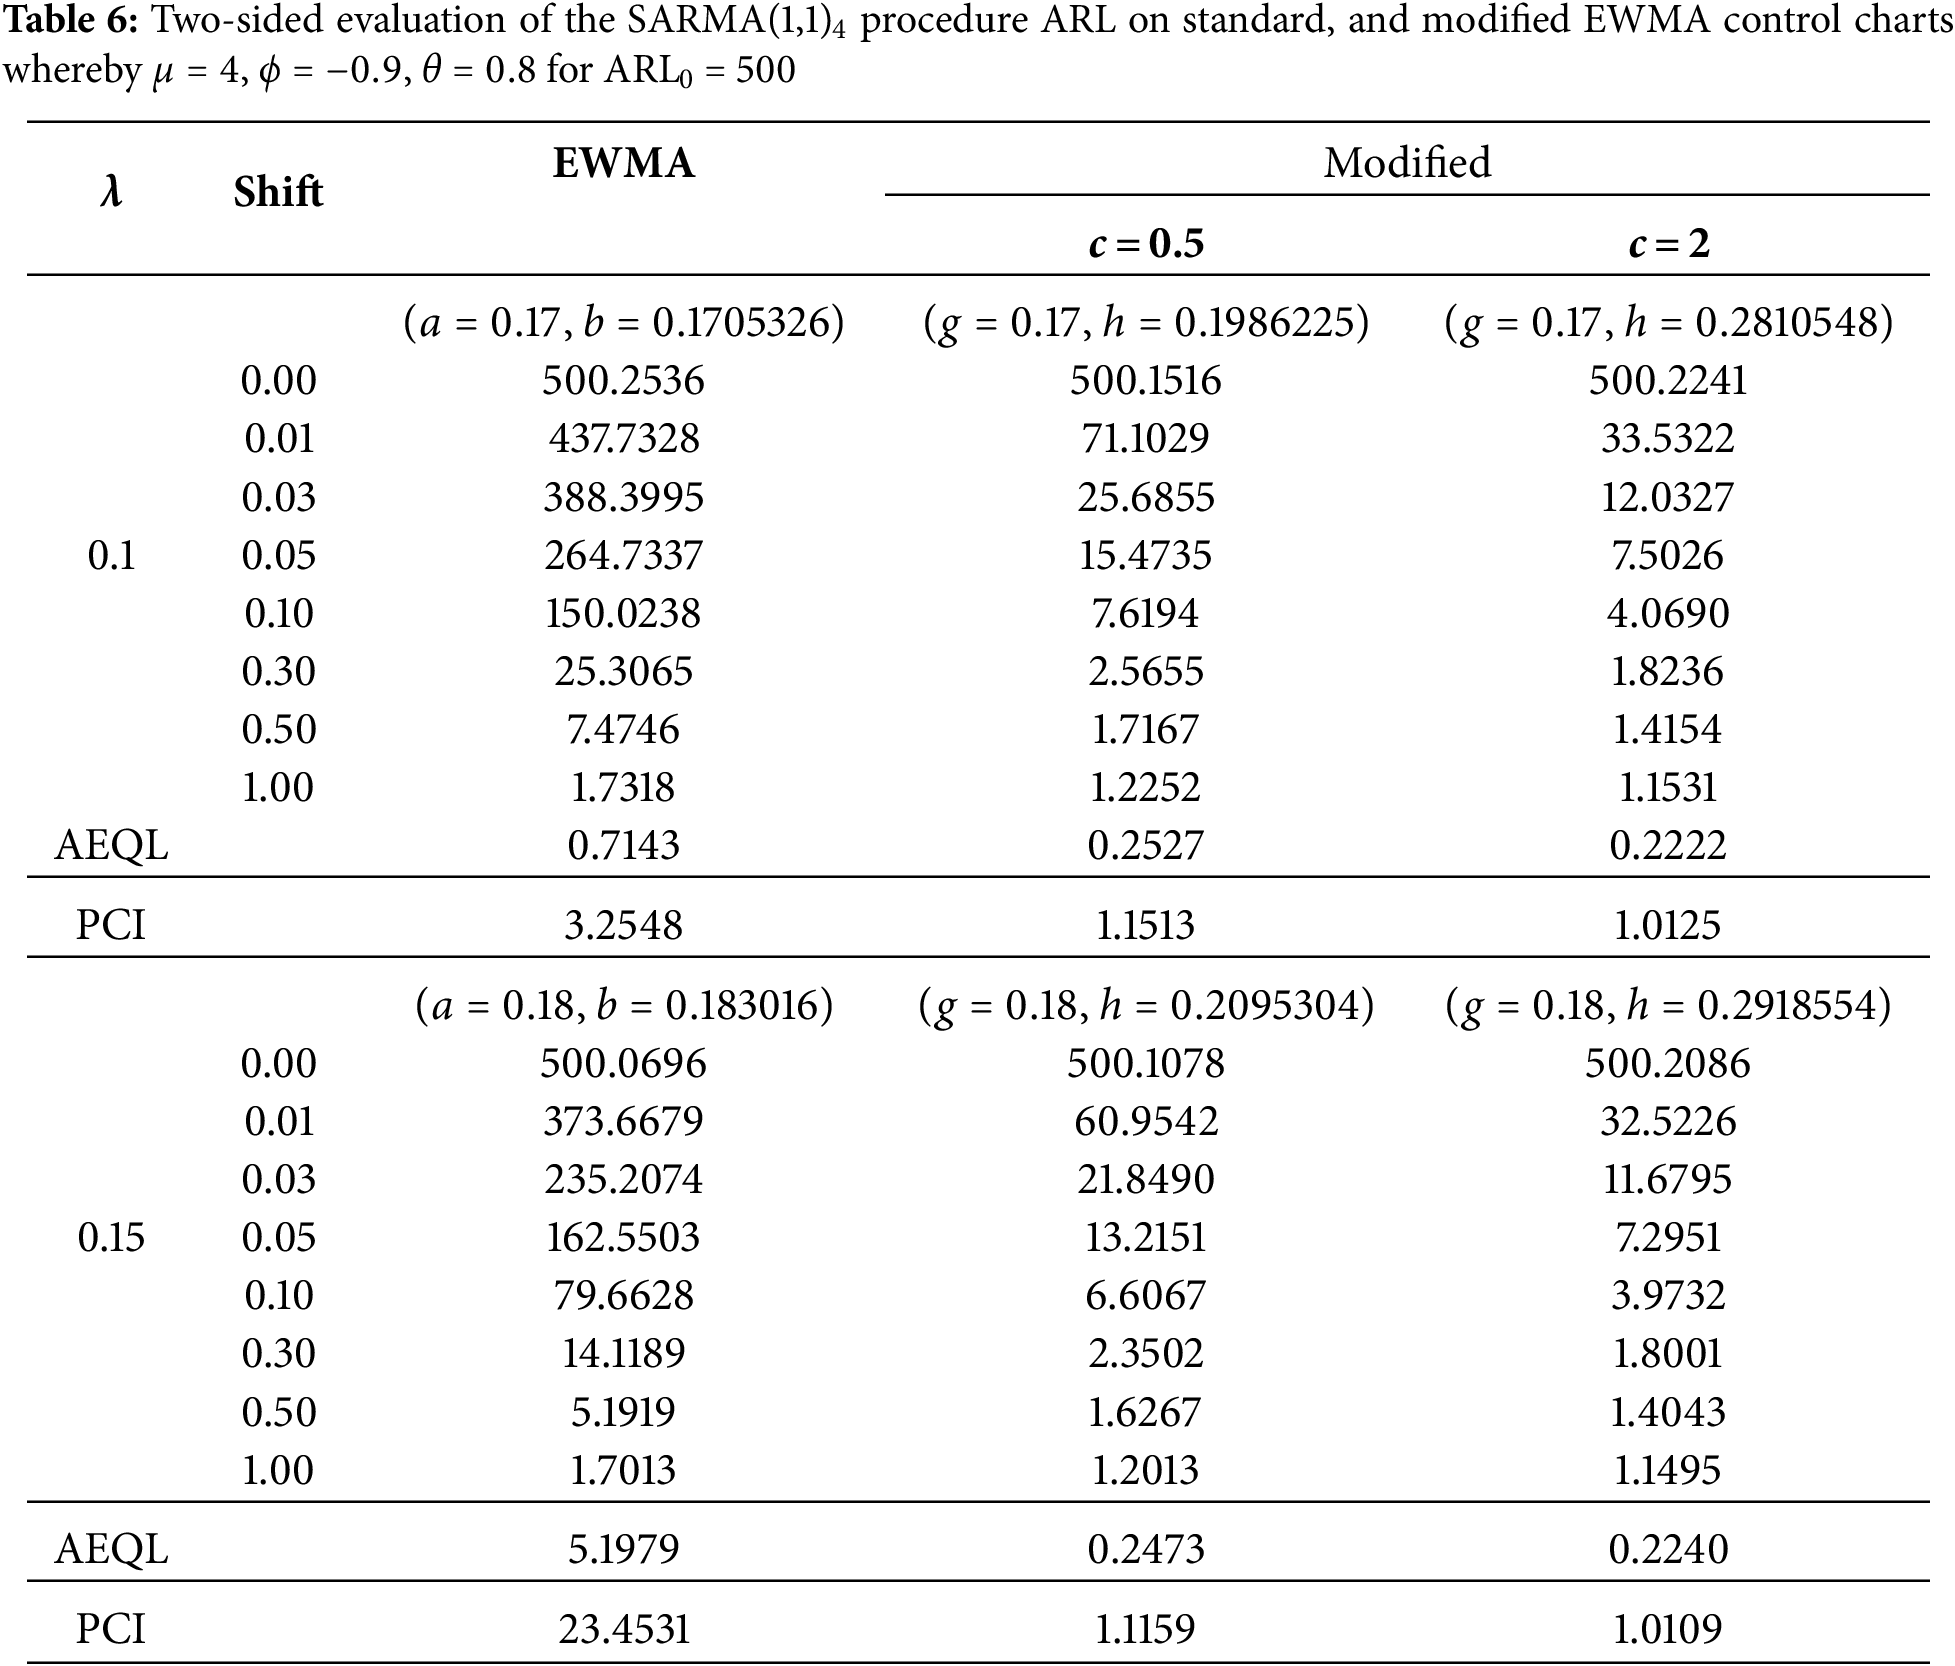
Table 3: For the SARMA(1,1)3 process with parameters
Table 4: The SARMA(1,1)4 process with parameters
Table 5: With the SARMA(1,1)3 process, configured parameters
Table 6: For the SARMA(1,1)4 process, with parameters set as
In analyzing the various configurations, the results showed that a higher constant multiplier value of
The modified chart structure, incorporating both past and present data points through an optimized constant
The advantages are particularly evident when applied to processes with high target ARL0 value, such as ARL0
In summary, the choice of
Climate zones play a crucial role in shaping regional weather patterns, particularly in influencing rainfall distribution and the frequency of extreme weather events, such as flooding. In Thailand, the country’s diverse topography and geographical location create a variety of climate zones, ranging from tropical savanna in the central regions to humid subtropical in the north and southwest. These distinct climate zones not only affect the amount and timing of rainfall but also contribute to the severity of floods, especially during the monsoon season.
Thailand experiences a tropical monsoon climate, with a marked rainy season from May to October. During this time, heavy rainfall often leads to flooding, particularly in low-lying areas and river basins. Monitoring rainfall patterns is therefore essential for effective disaster management and mitigation strategies, as excessive rainfall can have significant social, economic, and environmental impacts.
The objective of this section is to develop and implement an efficient rainfall monitoring system for Thailand, using statistical process control techniques. By analyzing historical rainfall data and applying advanced methods like the modified Exponentially Weighted Moving Average (EWMA) control chart, this investigation intends to distinguish trends and anomalies in rainfall patterns. This proactive approach will enhance understanding of climate variability and provide valuable insights for policymakers and local authorities, helping them improve flood preparedness and response strategies. The dataset used in this study comprises monthly average rainfall data for Thailand, derived from station-level measurements by the Meteorological Department using the Inverse Distance Weighted (IDW) spatial averaging method. The Box-Jenkins method was employed to test for autocorrelation in the data, while the t-statistic confirmed that the time-series data followed an SARMA(1,1)12 process. The dataset spans from January 1970 to July 2023 [41], consisting of 644 observations, which were found to be autocorrelated and appropriate for analysis using the SARMA(1,1)12 model. It is written as follows:
The ARLs for the SARMA(1,1)12 process of Thailand’s average rainfall data were calculated employing both standard EWMA and modified EWMA control charts. The recommended exponential smoothing parameters for the modified EWMA control chart,
As presented in Tables 7 and 8, the findings for ARL are in close alignment with the outcomes of the simulations, confirming that the proposed updated EWMA control chart outshines the original EWMA chart across an array of shift magnitudes and parameter values. Notably, the ability to rapidly detect changes in the means in the modified EWMA chart is particularly evident with larger shifts, underscoring its robust detection capabilities.


This improved performance is particularly marked when using higher values for the constant, with a setting of
Further, the results for
The modified EWMA chart’s effectiveness is also validated through performance indices, including the Performance Comparison Index (PCI) and the Average Extra Quadratic Loss (AEQL). Achieving a PCI of 1.000, the modified chart demonstrates optimal performance, consistently minimizing detection delays and thus reducing potential loss associated with late shift identification. The high PCI scores, coupled with reduced ARLs, further confirm the suitability of the modified EWMA control chart as a reliable, adaptive instrument capable of maintaining rigorous process control across diverse settings.
The modified EWMA control chart performance suggested in this research is further established by applying it to examine and detect variations in average rainfall, showcasing its effectiveness in handling real-world data with seasonal patterns. Fig. 1 shows the control chart plotting average rainfall data over time, with control limits designed to signal potential shifts or anomalies. The efficacy of the modified EWMA chart is unmistakable, as it allows for early detection of deviations in rainfall patterns-whether unusually high, which may indicate potential flooding, or significantly low, which could signal drought conditions.

Figure 1: Mean shift detection of average rainfall from Thailand on the EWMA control chart
Fig. 1 illustrates the standard EWMA control chart in operation, detecting high rainfall anomalies at the 501st to 502nd observations and again at the 633rd observation (331.18 mm, close to the highest recorded average rainfall). However, it fails to capture earlier shifts in rainfall patterns, limiting its effectiveness in timely anomaly detection.
In contrast, Fig. 2 reveals the exceptional execution of the modified EWMA control chart, which detects abnormalities earlier and more accurately. It issues warning signals between the 632nd and 633rd observations for unusually high rainfall and promptly identifies the initial anomaly between the 6th and 8th to 9th observations, where estimated rainfall significantly exceeds the average. Moreover, the modified EWMA control chart effectively flags extremely high and low rainfall values surpassing control limits, including observation 488 (August 2010), which recorded the highest rainfall at 331.78 mm.

Figure 2: Mean shift detection of average rainfall from Thailand on the EWMA control chart
To summarize, utilizing statistical monitoring techniques in assessing rainfall patterns in Thailand is essential for managing the risks associated with climate variability and extreme weather events. By focusing on the relationships between climate zones, rainfall occurrences, and flooding, this study seeks to contribute valuable knowledge that can inform future climate adaptation efforts in the region.
This modified EWMA control chart demonstrated notable improvements in distinguishing minor changes within autocorrelated data, particularly when applied to the SARMA(1,1)L process with exponential white noise. Using an approach of deriving two-sided ARL values via an explicit formula, validated by the NIE approach, this study showcased exceptional accuracy. Both methods yielded nearly identical ARL values, with the explicit formula providing a practical advantage by delivering results instantaneously, whereas the NIE method required 7–9 s per calculation. This efficiency makes the explicit formula highly suitable for real-time monitoring where rapid detection is essential.
When contrasted against the customary EWMA chart, further assessment of the performance of the modified EWMA chart revealed its dominance across various mean shift scenarios under out-of-control conditions, as shown by the consistently lower ARL1 values for SARMA(1,1)3 and SARMA(1,1)4 processes. Tables 3–6 provide detailed comparisons of ARL outcomes, emphasizing the efficacy of the chart in perceiving shifts with an optimal Performance Comparison Index (PCI) of 1.000, achieved at a smoothing parameter (
Several previous studies have highlighted the functional benefits associated with the modified EWMA control chart under different configurations. Paichit and Peerajit [34] reported that with a smoothing parameter (
The application of this model to real-world environmental data, such as average monthly rainfall in Bangkok, Thailand, underscores its practical benefits. By effectively identifying shifts in rainfall patterns, the modified EWMA chart can contribute to early warnings in flood and drought risk management, demonstrating its value in environmental monitoring and disaster preparedness.
Overall, evidence from prior studies [19,32,34,36] reinforces that the modified EWMA statistic—characterized by its reduced variance—reliably outpaces long-established control charts in recognizing minor process shifts, both in simulation and real-world applications.
Nevertheless, this study has certain limitations. The model is extended under the notion that the data follow the SARMA(1,1)L procedure with exponential white noise and known parameters. In practice, parameter estimation may introduce uncertainty, which could influence the performance of the chart. Additionally, the current formulation of the method may not be directly applicable to other time series models with different seasonal or stochastic characteristics. These limitations offer potential directions for future research, including model generalization, adaptive estimation, and broader testing on diverse real-world datasets.
The efficacy of the improved EWMA control chart is clearly confirmed by this research, especially in terms of improving shift detection capabilities for autocorrelated data. The explicit formula derived for the SARMA(1,1)L process delivers rapid and accurate ARL calculations, making it a preferable method over the traditional NIE approach in terms of computational efficiency. Compared to the standard EWMA chart, the modified version demonstrates enhanced sensitivity and robustness, as evidenced by lower ARL1 values and a high PCI score. In particular, the PCI value approaches 1, which indicates optimal performance, reinforcing its suitability for environments requiring quick, precise responses and highlighting the chart’s superior overall performance in detecting process changes. The successful application of this method to rainfall data in Thailand validates its utility for environmental monitoring. The modified EWMA control chart not only facilitates real-time shift detection but also supports disaster management efforts by enabling proactive risk assessment for extreme weather events. Overall, this research highlights the importance of advanced statistical control methods in improving process monitoring and prediction accuracy, offering significant benefits for both industrial quality control and environmental management applications.
Acknowledgement: The study received monetary support from the National Research Council of Thailand (NRCT), which made the completion of this project possible.
Funding Statement: The research was assisted financially by the National Research Council of Thailand (NRCT) under Contract No. N42A670894.
Author Contributions: The authors contributed to this work as follows: study conception and design: Yadpirun Supharakonsakun; data collection: Yadpirun Supharakonsakun, Yupaporn Areepong; analysis and interpretation of results: Yadpirun Supharakonsakun, Yupaporn Areepong, Korakoch Silpakob; manuscript drafting: Yadpirun Supharakonsakun, Korakoch Silpakob. All authors reviewed the results and approved the final version of the manuscript.
Availability of Data and Materials: The datasets generated and analyzed during the current study are available from the corresponding author on reasonable request.
Ethics Approval: Not applicable.
Conflicts of Interest: The authors declare no conflicts of interest to report regarding the present study.
Appendix A Programming Steps for ARL Calculation
Step 1. Initialize the computation by recording the start time and assigning all required input parameters, including the control chart parameters (
Step 2. Determine the upper control limit (
Step 3. Compute the denominator of the explicit ARL formula. For the out-of-control process (ARL1), set
Step 4. Compute the average run length (ARL) using the NIE method based on Eqs. (21)–(23), and record the computational time of the NIE method.
Step 5. Assess the accuracy of the ARL estimates by comparing the explicit formula and the NIE method using the percentage accuracy measure defined in Eq. (24).
Step 6. Evaluate the performance of the control chart using the performance criteria in Eqs. (25) and (26).
Step 7. Summarize the findings and report the results.
References
1. Riaz M, Muhammad F. An application of control charts in manufacturing industry. J Stat Econom Methods. 2012;1(1):77–92. [Google Scholar]
2. Smajdorova T, Noskievicova D. Analysis and application of selected control charts suitable for smart manufacturing. Processes. Appl Sci. 2012;12(11):5410. doi:10.3390/app12115410. [Google Scholar] [CrossRef]
3. Ottenstreuer S, Weiß CH, Testik MC. A review and comparison of control charts for ordinal samples. J Qual Technol. 2023;55(4):422–41. doi:10.1080/00224065.2023.2170839. [Google Scholar] [CrossRef]
4. Madanhire I, Mbohwa C. Statistical process control (SPC) application in a manufacturing firm to improve cost effectiveness: case study. In: Proceedings of the International Conference on Industrial Engineering and Operations Management (IEOM); 2016 Mar 8–10; Kuala Lumpur, Malaysia. p. 2298–305. [Google Scholar]
5. Shewhart WA. Economic control of quality of manufactured product. New York, NY, USA: Van Nostrand Company; 1931 [Internet]. [cited 2025 Sep 1]. Available from: https://dspace.gipe.ac.in/xmlui/bitstream/handle/10973/18338/GIPE-009900.pdf. [Google Scholar]
6. Page ES. Continuous inspection schemes. Biometrika. 1954;41(1/2):100–15. doi:10.1093/biomet/41.1-2.100. [Google Scholar] [CrossRef]
7. Hawkins DM, Olwell DH. Cumulative sum charts and charting for quality improvement. New York, NY, USA: Springer; 1998. [Google Scholar]
8. Prajapati DR. Effectiveness of conventional CUSUM control chart for correlated observations. Int J Model Optim. 2015;5(2):135–9. doi:10.7763/ijmo.2015.v5.449. [Google Scholar] [CrossRef]
9. Abbas N, Abujiya MR, Riaz M, Mahmood T. Cumulative sum chart modeled under the presence of quilters. Mathematics. 2020;8(2):269. doi:10.3390/math8020269. [Google Scholar] [CrossRef]
10. Roberts SW. Control chart test based on geometric moving average. Technometrics. 1959;1(3):239–50. doi:10.1080/00401706.1959.10489860. [Google Scholar] [CrossRef]
11. Lucas JM, Saccucci MS. Exponentially weighted moving average control schemes: properties and enhancements. Technometrics. 1990;32(1):1–12. doi:10.1080/00401706.1990.10484583. [Google Scholar] [CrossRef]
12. Carson PK, Yeh AB. Exponentially weighted moving average (EWMA) control charts for monitoring an analytical process. Ind Eng Chem Res. 2018;47(2):405–11. doi:10.1021/ie070589b. [Google Scholar] [CrossRef]
13. Petcharat K. Explicit formula of ARL for SMA(Q)L with exponential white noise on EWMA chart. Int J Appl Phys Math. 2016;6(4):218–25. doi:10.17706/ijapm.2016.6.4.218-225. [Google Scholar] [CrossRef]
14. Khan N, Aslam M, Jun C-H. Design of a control chart using a modified EWMA statistic. Qual Reliab Eng Int. 2016;33:1095–104. doi:10.1002/qre.2102. [Google Scholar] [CrossRef]
15. Patel AK, Divecha J. Modified exponentially weighted moving average (EWMA) control chart for an analytical process data. J Chem Eng Mater Sci. 2011;2(1):12–20. doi:10.28991/esj-2023-07-03-014. [Google Scholar] [CrossRef]
16. Zainab MJ, Zoramawa AB, Audu A, Tambuwal AI. Performance of modified exponentially weighted moving average (M-EWMA) control charts using transformed F-distribution. Asian J Probab Stat. 2025;27(3):176–87. doi:10.9734/ajpas/2025/v27i3733. [Google Scholar] [CrossRef]
17. Razailee AS, Ali NM, Kiem KS, Ali N. A comparison between modified EWMA control charts using different robust estimators. Adv Math, Sci J. 2021;10(1):37–44. doi:10.37418/amsj.10.1.5. [Google Scholar] [CrossRef]
18. Hyder M, Raza SMM, Mahmood T, Abbas N. Enhanced dispersion monitoring structures based on modified successive sampling: application to fertilizer production process. Symmetry. 2023;15(5):1108. doi:10.3390/sym15051108. [Google Scholar] [CrossRef]
19. Imtiaz A, Khan N, Saleem M, Aslam M. Development and application of a modified EWMA control chart for early detection of process shifts in skewed distributions. J Chin Inst Eng. 2025;48(1):1–11. doi:10.1080/02533839.2025.2479121. [Google Scholar] [CrossRef]
20. Bodnar R, Bodnar T, Schmid W. Control charts for high-dimensional time series with estimated in-control parameters. Seq Anal. 2024;43(1):103–29. doi:10.1080/07474946.2023.2288135. [Google Scholar] [CrossRef]
21. Aslam A, Khan K, Albassam M, Ahmad L. Moving average control chart under neutrosophic statistics. AIMS Math. 2023;8(3):7083–96. doi:10.3934/math.2023357. [Google Scholar] [CrossRef]
22. Khan I, Noor-ul-Amin M, Khalifa NT, Ashad A. EWMA control chart using Bayesian approach under paired ranked set sampling schemes: an application to reliability engineering. AIMS Math. 2023;8(9):20324–50. doi:10.3934/math.20231036. [Google Scholar] [CrossRef]
23. Crowder SV. A simple method for studying run length distributions of exponentially weighted moving average charts. Technometrics. 1987;29(4):401–7. doi:10.1080/00401706.1987.10488267. [Google Scholar] [CrossRef]
24. Champ CW, Rigdon SE. A comparison of the Markov chain and the integral equation approaches for evaluating the run length distribution of quality control charts. Commun Stat Simul Comput. 1991;20(1):191–204. doi:10.1080/03610919108812948. [Google Scholar] [CrossRef]
25. Harris TJ, Ross WH. Statistical process control procedures for correlated observations. Can J Chem Eng. 1991;69(1):48–57. doi:10.1002/cjce.5450690106. [Google Scholar] [CrossRef]
26. VanBrackle L, Reynolds MR. EWMA and CUSUM control charts in the presence of correlation. Commun Stat Simul Comput. 1997;26:979–1008. doi:10.1080/03610919708813421. [Google Scholar] [CrossRef]
27. Paichit P, Areepong Y, Sukparungsee S. Average run length of EWMA chart for SARMA (P, Q)L processes. Int J Appl Math Stat. 2014;80(1):85–103. [Google Scholar]
28. Polyeam D, Phanyaem S. Application of EWMA control chart for analyzing changes in SAR(P)L model with quadratic trend. Math Stat. 2025;13(3):163–74. [Google Scholar]
29. Khan N, Aslam M, Albassam M. Efficiency enhancement of the modified EWMA control method with conditional expected delay for change detection in processes. Front Appl Math Stat. 2023;9:1268340. doi:10.3389/fams.2023.1268340. [Google Scholar] [CrossRef]
30. Alevizakos V, Chatterjee K, Koukouvinos C. Modified EWMA and DEWMA control charts for process monitoring. Commun Stat Theory Methods. 2022;51(21):7390–412. doi:10.1080/03610926.2021.1872642. [Google Scholar] [CrossRef]
31. Haq A, Woodall WH. A critique of the use of modified and moving average-based EWMA control charts. Qual Reliab Eng Int. 2023;39(4):1269–76. doi:10.1002/qre.3290. [Google Scholar] [CrossRef]
32. Supharakonsakun Y, Areepong Y, Sukparungsee S. Monitoring the process mean of a modified EWMA chart for ARMA(1,1) process and its application. Suranaree J Sci Technol. 2020;27(4):1–11. doi:10.7717/peerj.10467. [Google Scholar] [CrossRef]
33. Saghir A, Ahmad L, Aslam M. Modified EWMA control chart for transformed gamma data. Commu Stat Simul Comput. 2021;50(10):3046–59. doi:10.1080/03610918.2019.1619762. [Google Scholar] [CrossRef]
34. Paichit P, Peerajit W. The average run length for continuous distribution process mean shift detection on a modified EWMA control chart. Asia-Pac J Sci Technol. 2022;27:109–18. [Google Scholar]
35. Niaz A, Khan M, Ijaz M. One-sided modified EWMA control charts for monitoring time between events. Qual Reliab Eng Int. 2025;41(4):1293–318. doi:10.1002/qre.3718. [Google Scholar] [CrossRef]
36. Phanthuna P, Areepong Y, Sukparungsee S. Exact run length evaluation on a two-sided modified exponentially weighted moving average chart for monitoring process mean. Comput Model Eng Sci. 2021;127(1):23–41. doi:10.32604/cmes.2021.013810. [Google Scholar] [CrossRef]
37. Richard SP. A simple proof of the Banach contraction principle. J Fixed Point Theory Appl. 2007;2(2):221–3. doi:10.1007/s11784-007-0041-6. [Google Scholar] [CrossRef]
38. Phanthuna P, Areepong Y, Sukparungsee S. Numerical integral equation methods of average run length on modified EWMA control chart for exponential AR(1) process. In: Proceedings of the International MultiConference of Engineers and Computer Scientists (IMECS); 2018 Mar 14–16; Hong Kong, China. p. 845–7. [Google Scholar]
39. Areepong Y. An integral equation approach for analysis of control charts [dissertation]. Sydney, Australia: University of Technology Sydney; 2009. [Google Scholar]
40. Alevizakos V, Chatterjee K, Koukouvinos C. The trip exponentially weighted moving average control chart. Qual Technol Quant Manag. 2021;18(3):326–54. doi:10.1080/16843703.2020.1809063. [Google Scholar] [CrossRef]
41. Monthly rainfall data for all areas of Thailand [Internet]. Bangkok, Thailand: Hydro-Informatics Institute (HII). [cited 2024 Nov 14]. Available from: https://data.hii.or.th/dataset/spatial-rain/resource/be424ef5-be5b-4f62-b147-6a569179e22b. [Google Scholar]
Cite This Article
 Copyright © 2025 The Author(s). Published by Tech Science Press.
This work is licensed under a Creative Commons Attribution 4.0 International License , which permits unrestricted use, distribution, and reproduction in any medium, provided the original work is properly cited.
 Downloads
 Citation Tools