
 Submit a Paper
 Propose a Special lssue
 Open Access
ARTICLE

Use of Scaled Models to Evaluate Reinforcement Efficiency in Damaged Main Gas Pipelines to Prevent Avalanche Failure
1 Department of Architecture and Urban Planning, Mukhtar Auezov South Kazakhstan University, No. 5 Av. Tauke Khan, Shymkent, 160012, Kazakhstan
2 Department of Architecture and Industrial Design, University of Campania “Luigi Vanvitelli”, via San Lorenzo ad Septimum, Aversa, 81031, Italy
3 Department of Reability & Dynamic Strength, A. Pidhornyi Institute of Mechanical Engineering Problems of National Academy of Sciences of Ukraine, No. 2/10, Kharkiv, 61046, Ukraine
4 Department of Building Technologies, Infrastructure and Management International Education Corporation (KazGASA), 28 Ryskulbekov Str., Almaty, 050043, Kazakhstan
* Corresponding Authors: Nurlan Zhangabay. Email: ; Marco Bonopera. Email:
(This article belongs to the Special Issue: Advances in Numerical Modeling of Composite Structures and Repairs)
Computer Modeling in Engineering & Sciences 2025, 145(1), 241-261. https://doi.org/10.32604/cmes.2025.069544
Received 25 June 2025; Accepted 26 September 2025; Issue published 30 October 2025
 View Full Text
 Download PDF
Abstract
This research extends ongoing efforts to develop methods for reinforcing damaged main gas pipelines to prevent catastrophic failure. This study establishes the use of scaled-down experimental models for assessing the dynamic strength of damaged pipeline sections reinforced with wire wrapping or composite sleeves. A generalized dynamic model is introduced for numerical simulation to evaluate the effectiveness of reinforcement techniques. The model incorporates the elastoplastic behavior of pipe and wire materials, the influence of temperature on mechanical properties, the contact interaction between the pipe and the reinforcement components (including pretensioning), and local material failure under transient internal pressure. Based on these parameters, a finite element model was developed using ANSYS 19.2 to enable parametric studies. The accuracy of the proposed model was verified by comparing the simulation results with the experimental findings. Pipeline section samples containing non-penetrating longitudinal cracks were subjected to comparative analyses and transient pressure until critical failure. The unreinforced and steel wire-wrapped sections were investigated. The results confirm the feasibility of applying the computational model to study the dynamic strength of reinforced damaged pipe sections. Furthermore, pipelines with longitudinal cracks reinforced using circular composite overlays with orthotropic mechanical properties were examined, and recommendations are provided for selecting the geometric parameters of such overlays.Keywords
Ensuring the operational reliability and structural stability of defect-containing main steel gas pipelines remains a priority challenge in contemporary engineering mechanics. This issue is particularly critical in seismically active regions and areas subject to substantial temperature fluctuations, where extreme operational conditions can cause localized damage and accelerate the propagation of crack-like defects into penetrating cracks, ultimately resulting in catastrophic failure.
This study continues a series of research initiatives aimed at developing methods for strengthening damaged main gas pipelines to prevent catastrophic failure [1–4]. The authors’ previous investigation included a comprehensive set of numerical and experimental studies on various aspects of pipeline structural integrity. Zhangabay et al. [1] used the finite-element (FE) modeling method to analyze the dynamic behavior of a thin-walled steel pipe with a crack-like defect under internal pressure. This model simulated a section of the Beineu-Bozoy-Shymkent gas pipeline in the Republic of Kazakhstan. This study demonstrated that a longitudinal crack-like defect exceeding half the wall thickness under increasing internal pressure from operating to critical levels leads to the formation of a penetrating crack. This crack propagates longitudinally due to localized material failure induced by plastic deformation at the crack tips. Zhangabay et al. [2] examined the influence of ambient temperature (−40°C to +50°C) on crack growth. The previously developed dynamic model of deformation and failure of a full-scale pipeline section was extended to account for the temperature dependence of the mechanical properties pipe material. Zhangabay et al. [3] proposed methods for preventing longitudinal crack growth by wrapping steel wire. A combined numerical model—building upon the frameworks established in Zhangabay et al. [1] and Zhangabay et al. [2]—was developed and further enhanced with a wire wrapping component. Numerical simulations enabled the evaluation of multiple wrapping parameters, such as wire diameter, pretensioning force, winding method, and pitch. In addition, simulations of catastrophic pipe failure at varying ambient temperatures provided critical insight into the effectiveness of different structural reinforcement strategies. The reliability of the proposed protection methods against catastrophic failure in damaged pipelines was validated through experimental testing. Zhangabay et al. [4] conducted an experimental assessment of various wire wrapping techniques using a 1:5 scaled model developed according to the theory of mechanical similarity and affine modeling of a full-scale gas pipeline. Collectively, the findings from these studies [1–4] provide the foundation for the present research.
Currently, wire wrapping, composite overlays, and steel sleeves are used as reinforcement techniques. Research in this field is generally classified into four categories based on field data: experimental investigations, analytical approaches, numerical simulations, and case studies. Numerous studies have highlighted the critical importance of preventing avalanche-type failure in damaged main gas pipelines. Considerable attention has been devoted to the numerical modeling of defective regions to assess their influence on the structural integrity of pipelines [5,6]. A standard practice is FE analysis of the stress-strain state of pipelines under internal pressure. This approach accounts for complex contact interactions, nonlinear material responses, and dynamic loading conditions [7,8]. Evidence shows that even small defects can trigger catastrophic failure under certain circumstances, leading to extensive damage [9]. Hara et al. [10] and Li et al. [11] reported on the experimental and numerical investigations of pipeline failure, with a particular focus on the effects of temperature. Lowering the temperature significantly reduces the ductility of steel and increases the risk of brittle fracture. For accurate failure modeling, a comprehensive analysis that integrates temperature fields, material microstructure, and defect geometry is essential [12]. A range of structural strengthening techniques has been developed to localize or arrest damage propagation in pipelines, and these approaches are frequently documented in the literature. Common strategies include installing circumferential reinforcement rings on both sides of the defect zone, applying spiral wrapping with high-strength wire [13,14], and using external composite overlays fabricated from glass or carbon fibers [15–17]. These reinforcement methods differ not only in terms of efficiency but also in terms of weight, costs, and implementation complexity. However, their effective use requires numerical validation, particularly to evaluate energy absorption during defect growth [18]. In recent years, considerable advances have been made in composite repair technologies, particularly with the development of fiber-reinforced polymer (FRP) systems and hybrid composite sleeves. These new technologies offer enhanced adhesion, toughness, and resistance to high temperatures. Experimental studies have confirmed that modern FRP composites can effectively restore the structural integrity of corroded pipelines under complex loading conditions, including axial compression and offshore environments [19]. Comprehensive literature reviews further underscore the increasing role of advanced composite materials and modeling techniques in evaluating the residual strength of repaired pipelines [20]. These advancements point to the need for updated numerical methodologies capable of accurately capturing the mechanical behavior of composite reinforcements under dynamic and thermal loading. Studies investigating the use of scaled pipeline models for the numerical analysis of failure and reinforcement processes are of particular interest [21–23]. Scaling allows for a substantial reduction in computational costs while preserving the qualitative behavior of mechanical responses. Studies have shown that appropriately scaled models can closely reproduce the results of full-scale simulations [24]. Moreover, scaled models are particularly valuable for simulating complex reinforcement configurations, which require comprehensive, multilevel validation of computational models through experimental testing [25–27].
This study investigates the use of scaled-down models for the experimental assessment of the dynamic strength of damaged pipeline sections reinforced with wire wrapping or composite sleeves. A dynamic numerical model is specifically developed to evaluate the effectiveness of these strengthening methods. The model accounts for several factors: the elastoplastic behavior of pipe and wire materials, the influence of temperature on material mechanical properties, contact interactions between pipe and reinforcement, including prestressing effects, and local material failure under transient internal pressure. The model’s reliability is verified by comparing it with experimental data obtained from a scaled gas pipeline section [4]. Furthermore, dynamic deformation and failure simulations are qualitatively compared between scaled and full-size numerical models [1–3]. Three reinforcement configurations are considered: circumferential elements on both sides of the defect, spiral wire wrapping with specified pitch, and composite overlays exhibiting orthotropic properties. This study introduces an integrated methodology that combines geometrically scaled physical models with validated FE simulations to evaluate the dynamic strength of reinforced gas pipelines containing longitudinal cracks. Unlike traditional methods relying on full-scale testing or static loading assumptions, this approach provides a more efficient and realistic assessment of failure mechanisms under transient internal pressure. This integrated framework enables the investigation of fracture behavior using reduced-scale specimens, significantly reducing testing costs and complexity. The proposed model incorporates elastoplastic material behavior, pretensioned reinforcement interaction, and localized failure, offering a more realistic and efficient alternative to conventional static or simplified models. This approach is particularly valuable for optimizing reinforcement strategies in safety-critical pipeline applications.
2.1 Mathematical Model of the Dynamic Strength of a Section between Supports of a Main Gas Pipeline with a Non-Penetrating Longitudinal Crack Reinforced with Various Wire Wrapping or Composite Sleeves
The dynamic model is developed based on the principles of deformable solid mechanics and comprises the following components:
– Equations of motion for the pipe and reinforcing elements, coupled via contact interaction conditions, and appropriate initial and boundary conditions;
– Constitutive relations describing the elastoplastic behavior of the pipeline and wire wrapping steels, or linear elastic behavior according to Hooke’s law in the case of composite overlay;
– Relations connecting strains and displacements;
– Strength and failure criteria governing material response;
– Time-dependent internal pressure function representing operational loading conditions.
The pipeline section between the supports is represented as a cylindrical pipe with an inner radius R, a wall thickness h, and a length L. A non-penetrating longitudinal crack is located on the outer surface and is characterized by length l, depth a, and width b = R·ψ. The crack orientation is aligned along the Ox axis. Previous studies [1–4] have shown that cracks of this type constitute the most critical condition for potential catastrophic pipeline failure. A schematic illustration of the pipeline section is shown in Fig. 1.
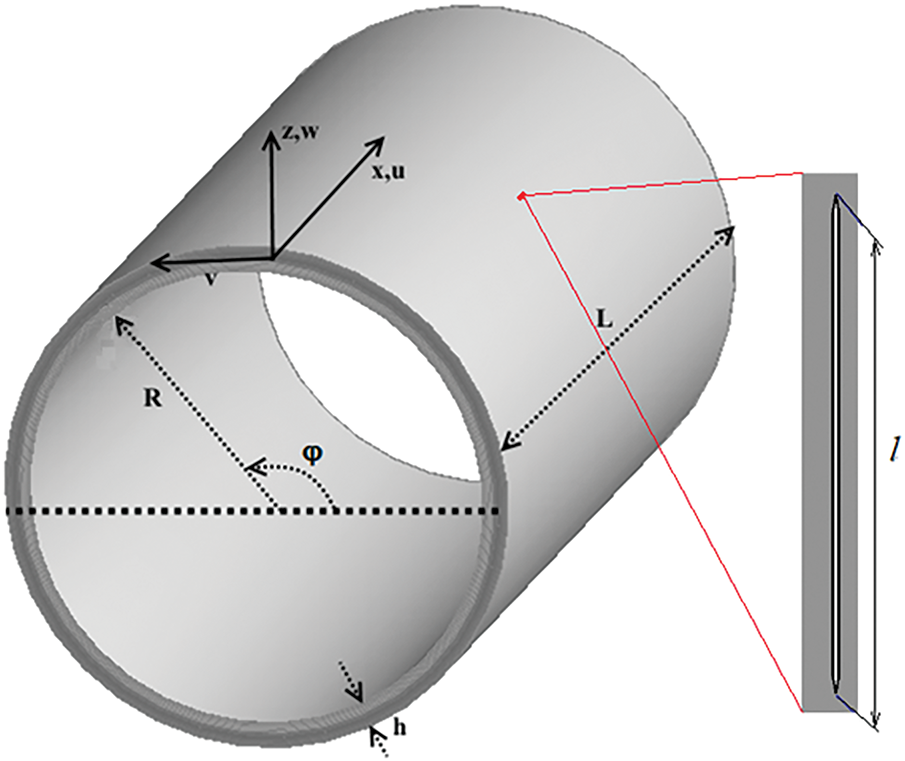
Figure 1: Schematic illustration of the main gas pipeline section
A cylindrical coordinate system
where
In conventional analyses of pipe dynamic expansion under transient internal pressure, gravitational forces are often neglected because their magnitude is negligible compared to the primary loading. However, the relative influence of these forces becomes more significant for scaled-down physical models. Therefore, including gravitational effects in the calculations is essential to ensure accurate results.
The initial conditions for the system of Eq. (1) are specified as follows:
Boundary conditions at the left end of the pipe:
The boundary conditions at the right end of the pipe are as follows:
The nonzero boundary conditions at the inner surface of the pipe account for the transient internal pressure and are expressed as follows:
where
The nonzero boundary conditions at the outer surface of the pipe simulate the initial stresses generated by the wire wrapping tension or by the interference or shrink-fit conditions of the composite overlay.
The boundary conditions at the contact zone for wire wrapping are expressed as follows:
where
At the initial moment,
The equations of motion for the centerline of any wire wrapping segment are expressed as follows—A schematic of the segment is shown in Fig. 2.
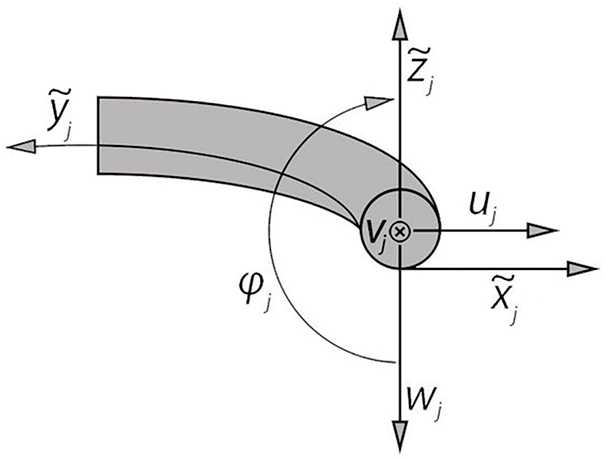
Figure 2: Schematic illustration of the wire wrapping section
The centerline curvature of the j-th wire turn is denoted by
The strains and generalized displacements of the steel wire are expressed as follows:
where
When reinforcing a damaged pipeline section with a circular composite overlay, system (1) governs the equations of motion for the overlay. The overlay is represented as a thin, anisotropic cylindrical shell with inner radius R + h, wall thickness
where
At the initial time,
where
Dynamic stress-strain modeling, as expressed in Eq. (3), is conducted using a hierarchical system of models that represent three physical states of the material: (1) elastic response, (2) plastic deformation, and (3) local failure.
For elastic deformation, the stress tensor components
where
The equivalent von Mises stress
The influence of temperature on elastic deformation is incorporated by selecting the elastic modulus
The transition from elastic and plastic deformation occurs when the equivalent stress
where C, n is the experimentally determined parameter that characterizes the strain-rate sensitivity of the material, and
The use of the dynamic yield strength in Eq. (5) allows the incorporation of the deformation-rate effects on the failure process, which is crucial for modeling avalanche-type failures in pipe structures. Under these conditions, the equivalent stress in the plastic flow region is expressed as
In addition to equal stress, the accumulation of plastic strain
The local failure of the steel pipe and wire wrapping is modeled using the von Mises failure criterion, which is widely applied to plastically deformed isotropic materials:
High-strength composite overlays with orthotropic mechanical properties are considered in this study. Furthermore, the material demonstrates high thermal resistance. To represent orthotropic behavior, a local coordinate system aligned with the material’s orthotropy axes is introduced (Fig. 3). The Ох axis (red) runs along the generatrix of the cylindrical composite overlay, the Оφ axis (green) is tangential to the cylindrical surface; and the Оz axis (blue) is normal to the shell surface.
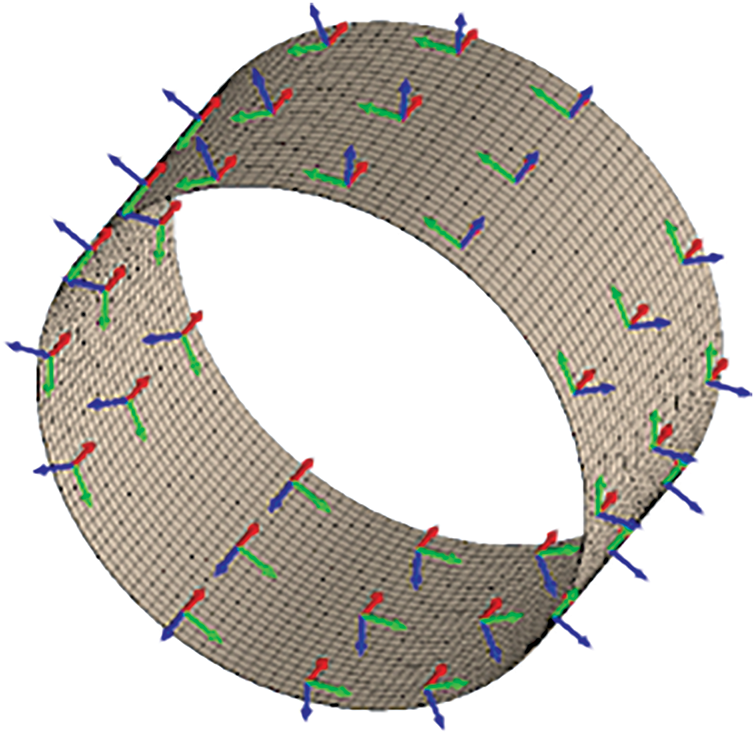
Figure 3: Schematic of the local coordinate system of the composite overlay, showing axes aligned with the material’s orthotropy directions
In the
where
The matrix C represents the material stiffness matrix and is defined as the inverse of C−1, with components expressed as follows [31]:
where
To model the local failure process, the maximum stress criterion, a classical failure criterion for layered orthotropic materials, is expressed as follows [33–35]:
where
In modeling the transient deformation of a pipe reinforced with wire or a composite overlay, the strain-displacement relationships are expressed in nonlinear form [31,35]. Zhangabay et al. [2] provided a detailed presentation of these relationships, which is not reproduced here due to its complexity. The model is analyzed using the time-dependent behavior of the internal pressure.
Pipeline failure occurs due to the growth of the initial microdefects under high internal pressure. The most critical stage in assessing the dynamic strength of a main gas pipeline is the rapid increase in pressure from the operating level to the critical level. During this phase, significant transient loads act on the pipe wall, potentially causing the formation of penetrating cracks and failure in regions already containing non-penetrating cracks. Consequently, the strength analyses of gas pipelines focus on the transient regime, in which the internal pressure rapidly increases from the operating value to the critical level and then decays [36]. Within this interval, the pressure on the pipeline’s inner surface increases to its maximum value at time t*, where it remains until time t**. During this stage, a non-penetrating crack may evolve into a penetrating crack. Propagation of the penetrating crack is accompanied by gas decompression, which manifests as a decrease in pressure over time in the surrounding pipe region. To describe this behavior, an approximate model of the gas-dynamic pressure acting on both the crack faces and the pipe’s inner wall is employed, which has proven effective in simulating dynamic crack propagation [37]. The subsequent pressure decay is represented by an exponential law, consistent with the experimental observations [38]. Based on these considerations, the transient load can be mathematically formulated as follows: the internal pressure acts normally on the pipeline wall as a time-dependent function applied across the entire inner surface of the pipe, including the crack faces.
where Pmax represents the maximum pressure, θ denotes the pressure decay coefficient, t*, t** are the times corresponding to the maximum pressure onset and decay initiation, respectively.
The dynamic model allows for a comprehensive assessment of local initial stresses in the pipe induced by reinforcement elements, the evolution of material properties during deformation, and the distinct characteristics of internal pressure variation along the inner wall during penetrating crack formation.
2.2 Computational Model for the Dynamic Strength of a Section between Supports of a Main Gas Pipeline with a Non-Penetrating Longitudinal Crack Reinforced with Various Wire Wrapping or a Composite Sleeves
The dynamic strength of a defective section of the main gas pipeline was numerically analyzed using the ANSYS 19.2/Explicit Dynamics software package, which applies an explicit time integration scheme to solve the equations of motion. The FE model simulated a steel pipe segment with fixed ends, a non-penetrating longitudinal crack, and external reinforcement with either wire wrapping or a composite sleeve. The pipe’s geometric parameters correspond to typical values for main gas pipelines: outer diameter D, wall thickness h, and segment length L, which were varied according to the model scaling factor [4]. The wire wrapping was characterized by the wire diameter
The FE model was developed using three-dimensional tetrahedral elements (SOLID164), which are suitable for highly nonlinear problems involving large deformations. The contact interactions among the pipe, crack, and reinforcing layer were simulated using an automatic contact detection algorithm that allowed the separation and sliding between surfaces. The structural materials were described using appropriate constitutive models. The steel pipe was modeled as an isotropic elastic-plastic material with strain hardening based on the Cowper-Symonds model [1–3]. The dynamic yield stress in the model was defined as follows [26]:
where
If the constants in the Cowper-Symonds model are expressed using the parameters in Eq. (5), such that
The wire wrapping was represented as an elastic-plastic material with a maximum elongation limit [3,4]. Steel failure was assumed to occur once the critical plastic strain threshold was reached. The composite was modeled as an orthotropic material, and its elastic moduli, strength parameters, and failure behavior were derived from the maximum stress theory [32,33]. In ANSYS Explicit Dynamics, the explicit solver advances the solution without nonlinear iterations at each time step, enabling efficient computation of crack propagation. The governing solution stems from the discretized equation of motion:
where
The simulations used a lumped mass matrix with automatic time-step control governed by stability criteria and allowed the definition of load functions through time-dependent tables. The stepwise data recording enabled the analysis of the evolution of the plastic zone and the damage localization around the crack and reinforcement region.
The time step
3.1 Validation of the Dynamic Strength Model for a Wire-Wrapped Section between Supports of a Main Gas Pipeline with a Non-Penetrating Longitudinal Crack
To verify the accuracy of the numerical results regarding the reinforcement of damaged main gas pipeline sections with wire wrapping or a circumferential composite sleeve, the model described in Section 2 was benchmarked against experimental data reported in Zhangabay et al. [4]. Validation drew on tests conducted with a scaled pipeline span section between supports, containing a non-penetrating longitudinal crack. This defect was examined in specimens reinforced with two types of wire wrapping and reinforced form (scale of 1:5). The similarity conditions were determined according to the theory of mechanical similarity and affine modeling [4]. In total, 12 computational cases were compared with full-scale experimental, using six specimens of varying geometry tested at +20°C and –10°C. The geometric parameters of these specimens are listed in Table 1.
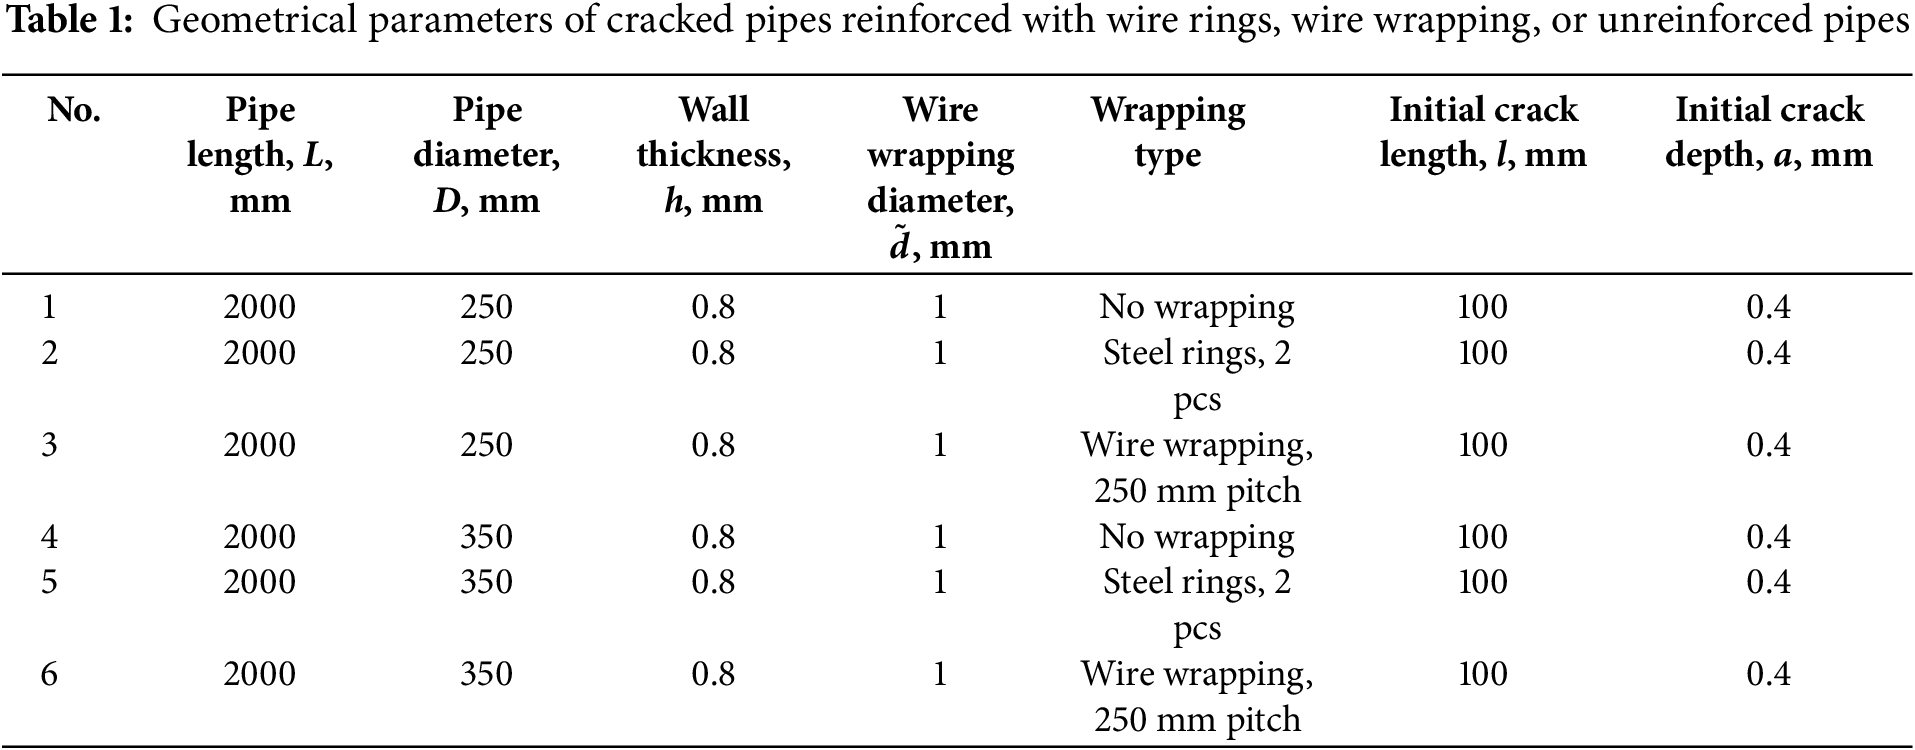
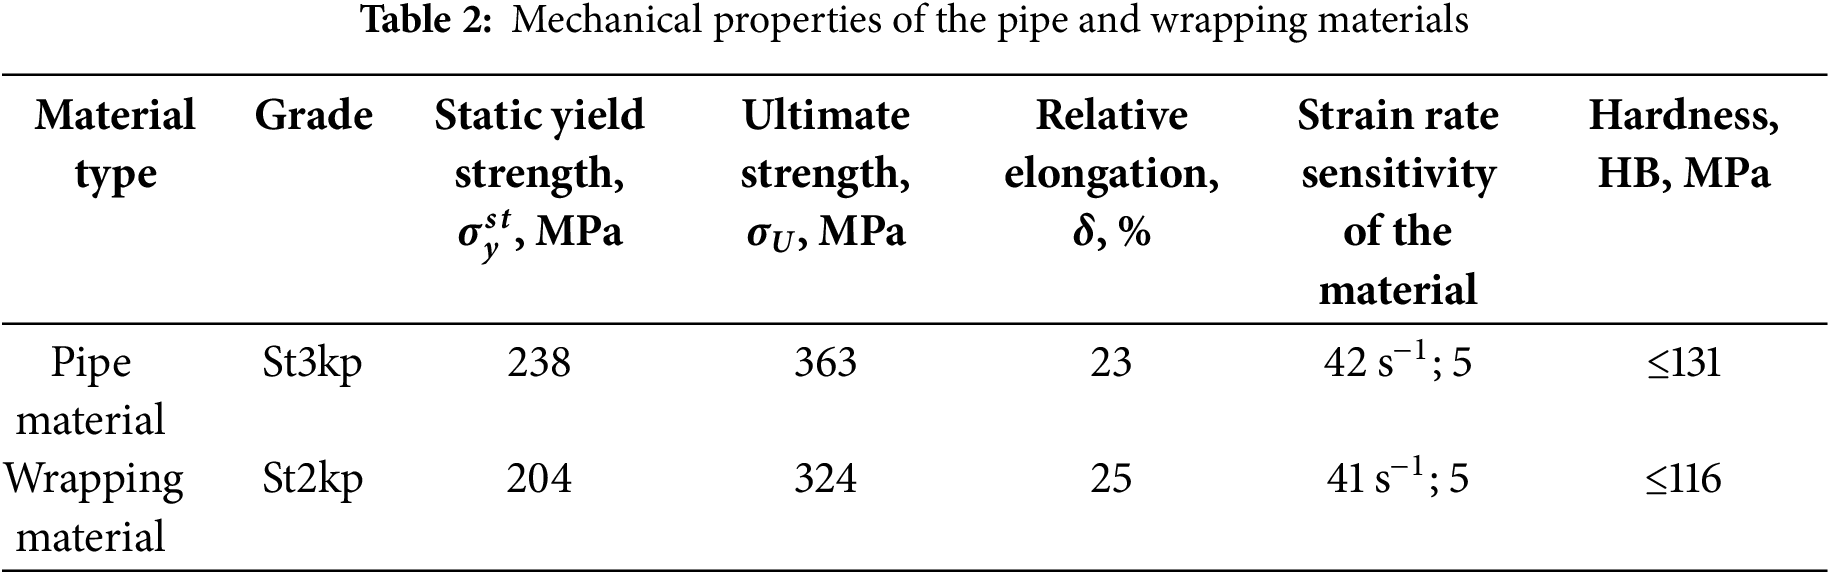
Table 2 summarizes the material properties of the pipe and wrapping materials. The tensile force applied to the steel rings and wire wrapping was set to 0.05
The computational model developed in the ANSYS 19.2 environment accurately replicates the geometry and loading conditions of the physical experiment described by Zhangabay et al. [4]. Table 3 compares the numerical and experimental results for the six specimens described in Table 1, tested at +20°C, whereas Table 4 provides the corresponding results for the experiments conducted at –10°C. The first column lists the specimen identification number, and the second outlines the geometric parameters that distinguish the pipe structures. The third column reports the experimentally determined critical pressure, which was also used in the numerical simulations. The fourth and fifth columns present the crack opening width after rupture, obtained experimentally and through simulation, respectively, with the sixth column showing the relative error between these values. Similarly, the seventh, eighth, and ninth columns present the crack length results, including the experimental values, numerical results, and the relative error, respectively.
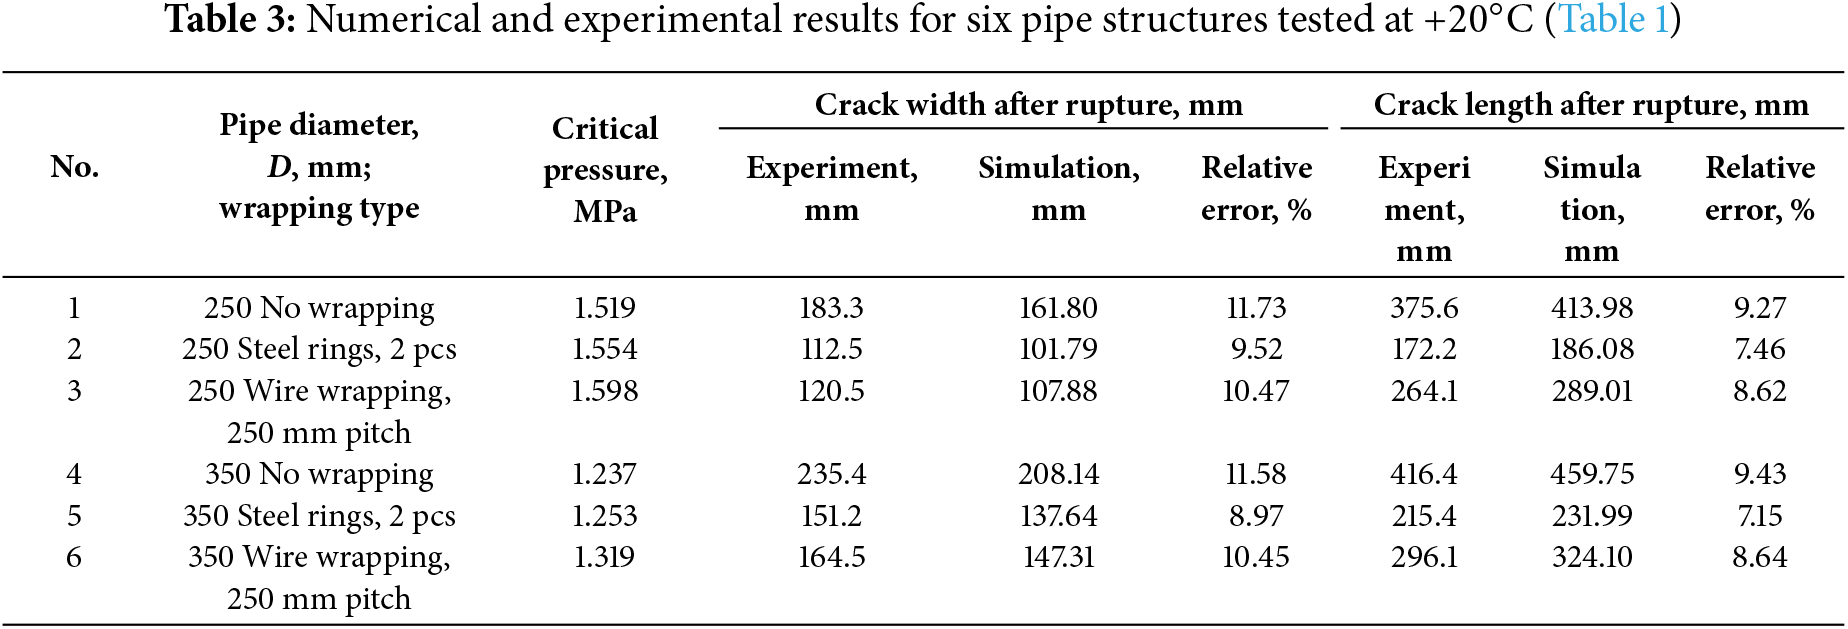
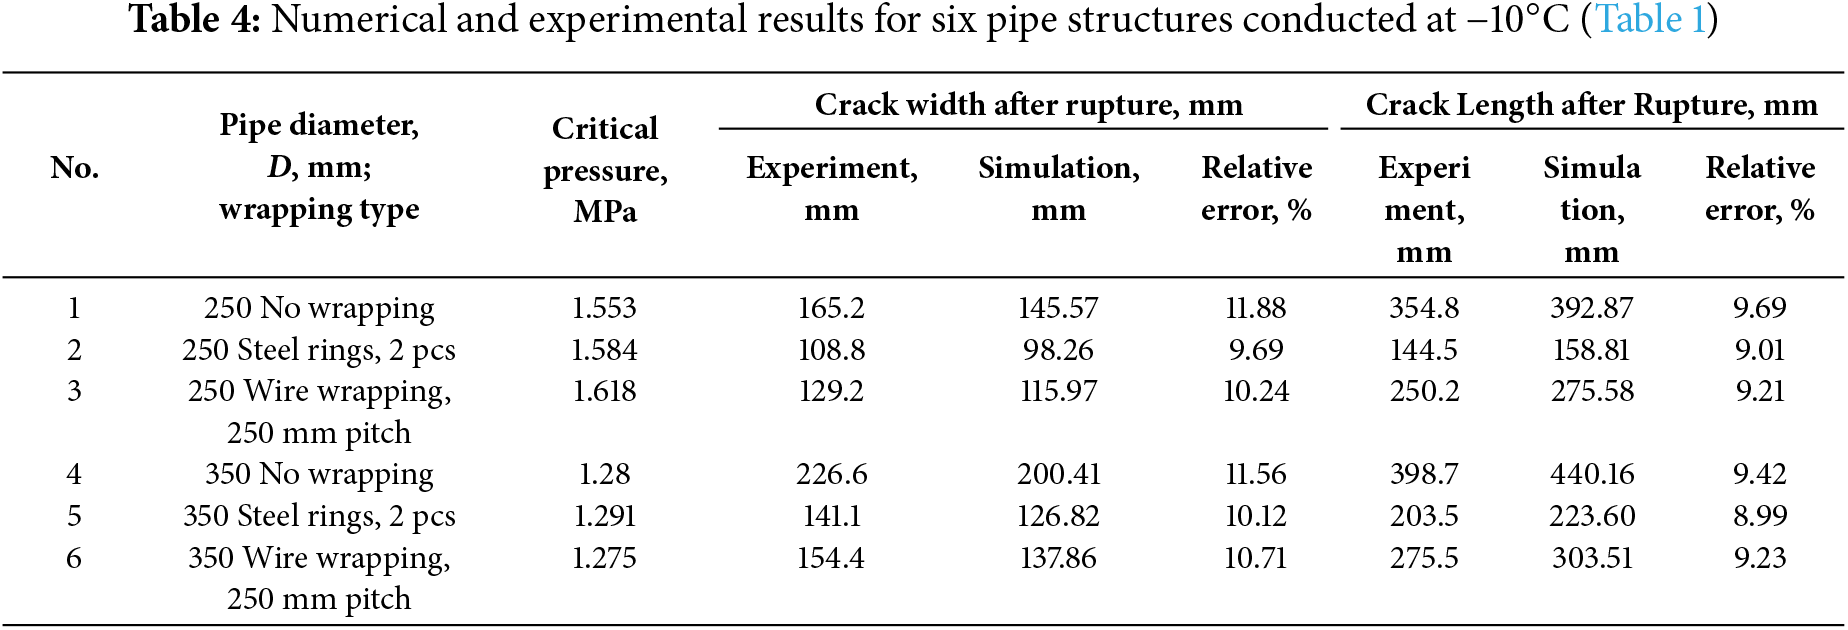
Analysis of the data in Tables 3 and 4 indicates that the numerical simulation results of the pipe failure process correspond closely with the experimental findings. The relative error between the peak displacement values, defined by the longitudinal and transverse crack dimensions, remains under 12%. For this class of problems, an error margin of 10% to 15% is generally acceptable. This range is consistent with the established practices for model validation in computational solid mechanics, as outlined in the ASME V&V 10-2006 guideline [39].
The computed crack lengths are consistently greater than the experimentally measured values, although the relative error remains below 10%. Therefore, the simulations yield a conservative upper-bound estimate of the crack propagation in the longitudinal direction, which supports the application of the result in engineering decisions on structural reinforcement to prevent catastrophic (avalanche-type) failure.
The crack opening width calculated in the numerical models is smaller than that observed experimentally, leading to elevated stress levels in the crack opening zone during the assessment of the defective pipeline section. When modeling a reinforcing sleeve, this provides a safety margin by reducing the likelihood of under-reinforcement under actual operating conditions, making the numerical results a robust basis for engineering decisions. Furthermore, in all 12 numerical cases, the crack shape at the maximum opening closely corresponds to the experimentally observed shape [4]. Fig. 4 illustrates the results for an unreinforced pipe with a diameter of 250 mm at –10°C, showing the crack profile at maximum opening. A comparison between the numerical results (a) and experimental data (b) [4] demonstrates strong agreement in the crack opening configuration, thereby validating the assumptions of the models, the adopted plastic deformation model, and the adequacy of the selected boundary conditions and material parameters.
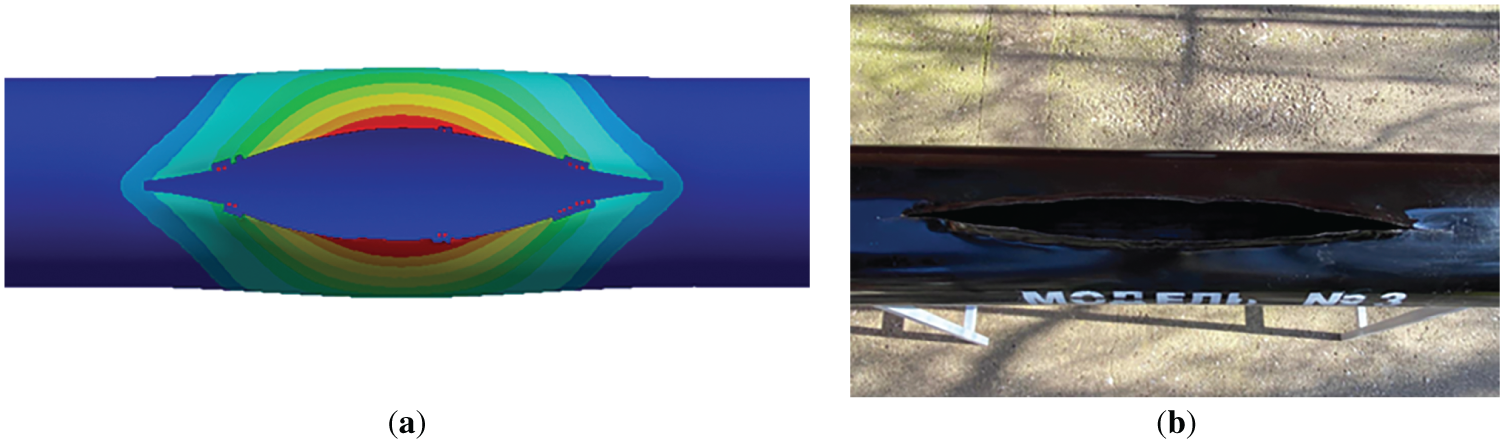
Figure 4: Comparison of crack shapes at the maximum opening for the unreinforced pipe: (a) numerical results and (b) experimental data [4]
Fig. 5 shows the crack profile at the maximum opening in the pipe reinforced with steel rings at the crack edges. Numerical (a) and experimental data (b) [4] indicate good correlation between crack geometry and opening behavior. Steel rings suppress crack growth by redistributing stresses and restricting plastic deformation, confirming their effectiveness in localizing and containing damage.
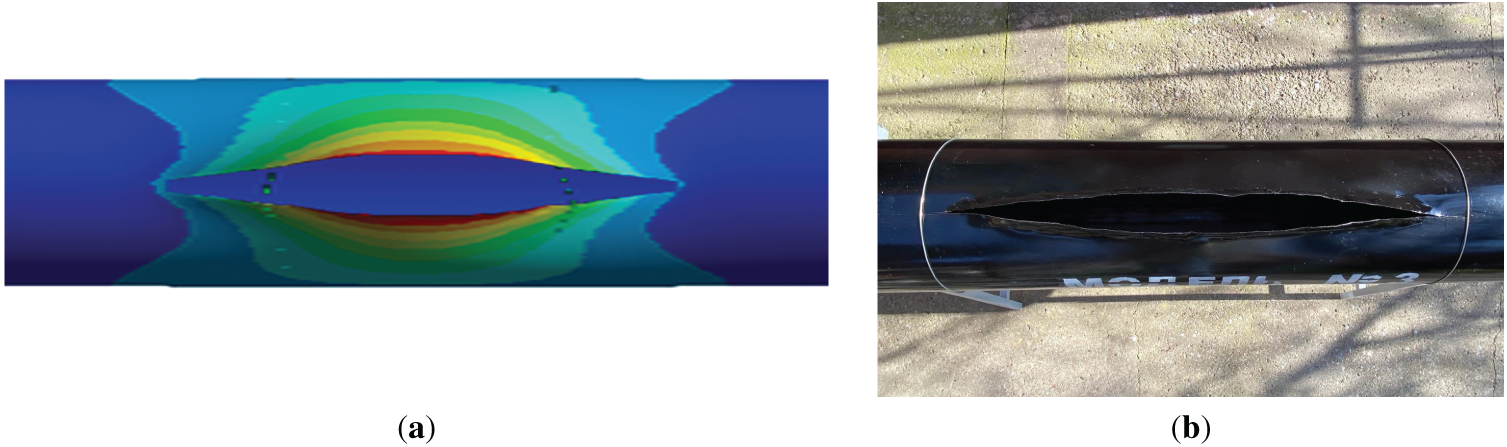
Figure 5: Crack shape at maximum opening in a pipe reinforced with steel rings: (a) numerical results; (b) experimental results [4]
Wire wrapping provides a comparable crack-arrest mechanism by generating circumferential prestressing zones in the pipe, with a similar function as individual steel rings. When a propagating crack encounters a wire turn, the induced compressive stresses counteract the tensile forces driving crack opening, thereby inhibiting further progression. As a result, the prestressed wire wrapping can slow, and in some cases completely arrest, longitudinal crack growth. Experimental studies on scaled models [4] and numerical simulations on full-scale models [3] confirm that regions subjected to wrapping-induced contact stresses exhibit either marked deceleration or complete cessation of crack advances. The choice between steel rings and continuous wire wrapping largely depends on the crack configuration and number. For isolated cracks deeper than half the wall thickness, anchoring with steel rings at the crack edges is recommended. Conversely, continuous wire wrapping is more effective for multiple cracks with depths up to half the wall thickness. In this case, preliminary numerical analysis is essential to optimize the wire turn spacing and tensile force, ensuring uniform stress distribution across the reinforced section. Although wire wrapping effectively limits longitudinal crack propagation and prevents avalanche-like failure, once the opening reaches a critical value, it cannot stop a surface crack from developing into a penetrating crack.
Validation of the proposed numerical model against experimental data confirms its reliability in analyzing the dynamic strength of damaged and reinforced sections of main gas pipelines.
3.2 Comparative Analysis of the Dynamic Strength Calculation Results for a Main Gas Pipeline Section with a Longitudinal Crack Reinforced with a Composite Overlay: Full-Scale vs. Scaled Models
Scaled models used in experimental studies and numerical simulations offer several key advantages over full-scale structures. They reduce material and fabrication costs, shorten testing time, and improve safety when examining failure scenarios. When the principles of physical and geometric similarity are observed, scaled models can accurately reproduce the stress-strain state and failure behavior of real structures. They are effective tools for assessing the dynamic strength of damaged gas pipelines.
A comparative analysis was conducted on the numerical simulations of the dynamic strength of steel main gas pipeline spans containing longitudinal cracks and reinforced with circumferential composite overlays, using scaled and full-scale geometric models. The analysis focuses on the influence of overlay dimensions to evaluate the validity of the scaling approach for modeling deformation and failure behavior in reinforced pipeline sections. The geometric parameters of the scaled model are provided in Table 1. The full-scale geometric model was examined in earlier studies [1–3]. The analyzed pipeline section is 4000 mm in length, with an outer diameter of 1047 mm and a wall thickness of 11.9 mm. The pipe was fabricated from X70 steel, which has the following physical and mechanical properties: density
The composite overlay was fabricated from heat-resistant Carbon-Fiber-Reinforced Plastic (CFRP). The material properties are as follows: elastic moduli
The selection of parameters for composite reinforcement overlays in pipeline strengthening depends on several key factors. The overlay thickness is primarily governed by the stiffness ratio between the composite layer and pipe wall: insufficient thickness does not provide adequate load-bearing capacity, whereas excessive thickness results in material waste and elevated interface stresses. Two thickness options were evaluated in this study: Option 1: One-third of the pipe wall thickness –0.27 mm for scaled models (250 and 350 mm diameters) and 4.0 mm for the full-scale model. Option 2: One-half of the pipe wall thickness –0.4 mm for scaled models and 6.0 mm for the full-scale model.
Overlay length is determined by defect size, the expected plastic deformation zone, and the need for stress redistribution along the pipe axis. To ensure a smooth stress transition from the damaged to the intact region, the overlay length is designed to significantly exceed the crack length. In the numerical simulations, two configurations were evaluated to prevent longitudinal crack propagation. Option 1: The overlay length is equal to three times the crack length –300 mm for the scaled models and 600 mm for the full-scale model. Option 2: The overlay length is equal to five times the crack length –500 mm for the scaled models and 1000 mm for the full-scale model. In all cases, the circumferential overlay edges were symmetrically positioned with respect to the crack.
The computational model treats the overlay as an element in free contact with the pipe’s external surface, without gaps or prestressing, thereby reflecting actual installation conditions. The modeled composite is a carbon fiber-reinforced plastic with an epoxy matrix, characterized by high strength and stable mechanical properties under temperature variations [34]. The analysis considered a temperature range from −40°C to +50°C; since these variations have minimal effect on the composite’s mechanical properties, and were therefore excluded from the simulation. The steel’s mechanical properties within this temperature range and their effect on longitudinal crack propagation are described in Zhangabay et al. [2].
The analysis aimed to evaluate the qualitative agreement between numerical simulation results from scaled and full-scale models. Within the considered temperature range, no qualitative differences were observed; therefore, the results presented correspond to +50°C, the most critical temperature for longitudinal growth of penetrating cracks [2]. A reduction in pipe diameter from 350 to 250 mm also had no qualitative effect on the simulation outcomes, so only the results for the 350 mm diameter are shown.
Table 5 summarizes the simulation results for the dynamic strength of a steel pipe with a longitudinal crack reinforced by a composite overlay. The following parameters are used: h—pipe wall thickness; l—initial length of the longitudinal crack. Figs. 6 and 7 illustrate these results for the full-scale model with a diameter of 350 mm, respectively. Reducing the pipe diameter from 350 to 250 mm did not cause any qualitative changes in the results, indicating that longitudinal and radial displacements predominantly govern the deformation process. The simulation results show complete qualitative agreement between the full-scale and scaled models.
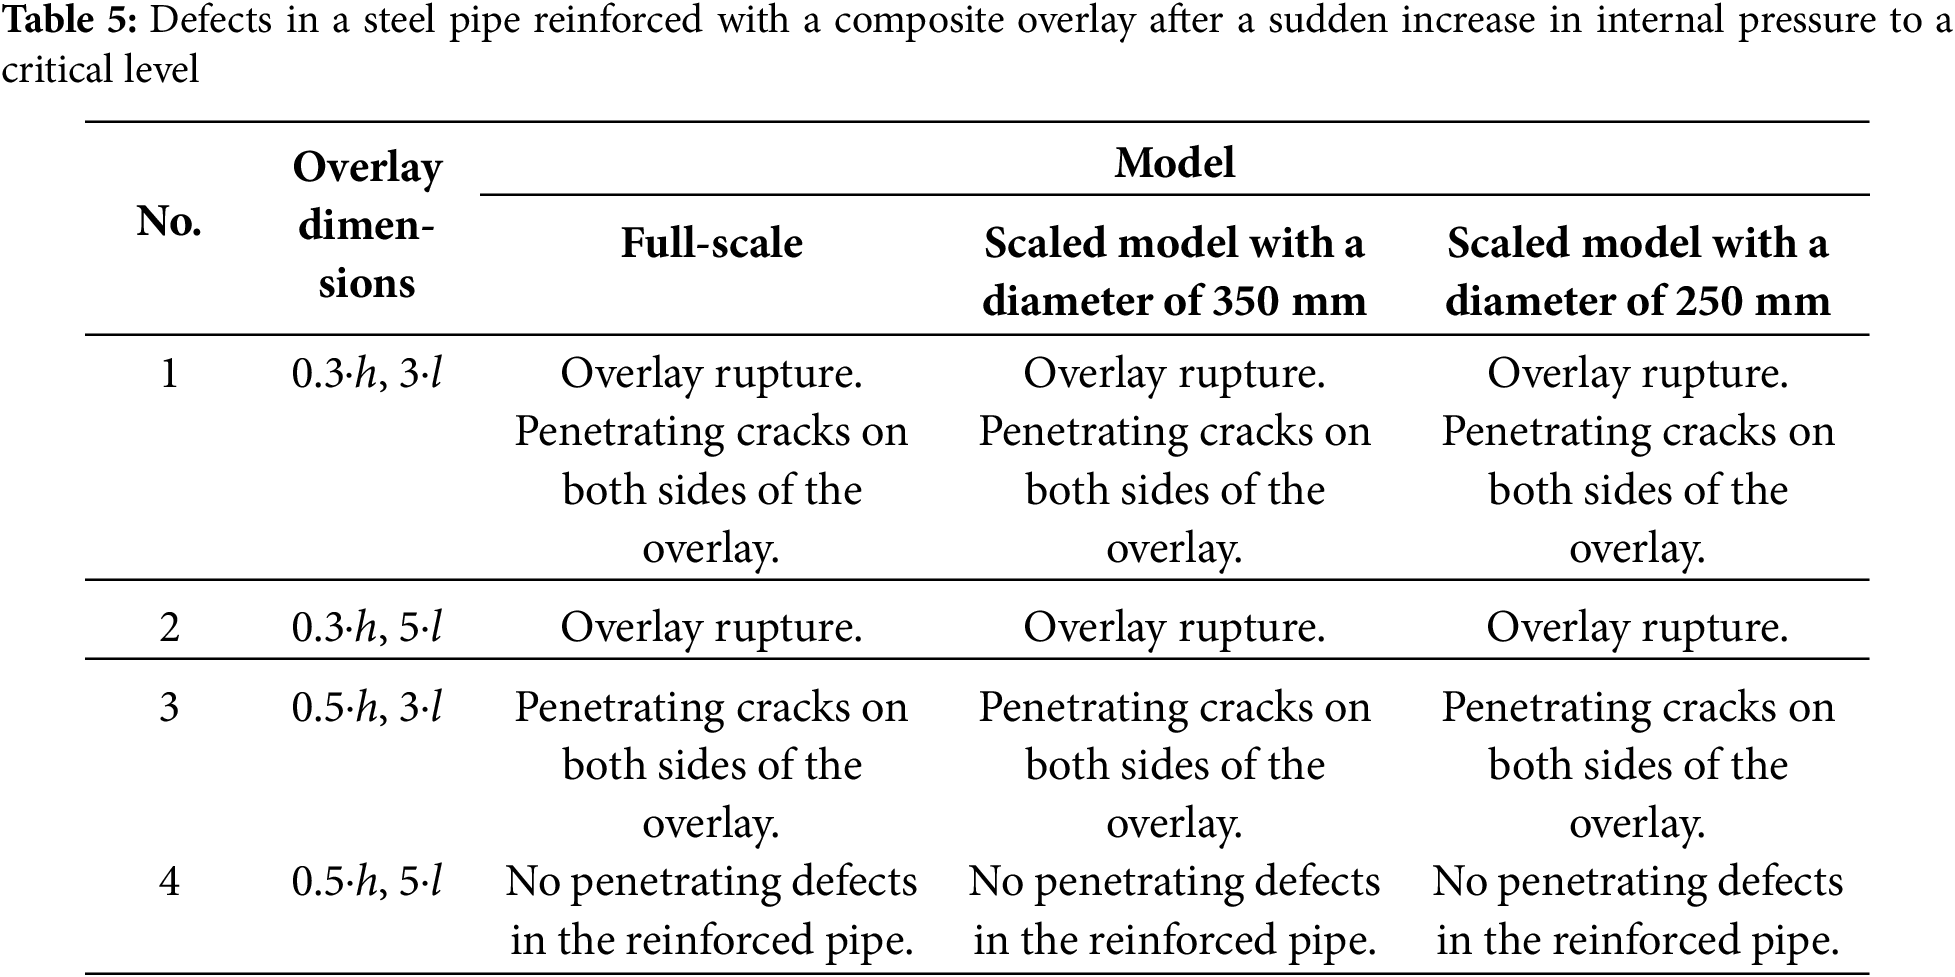
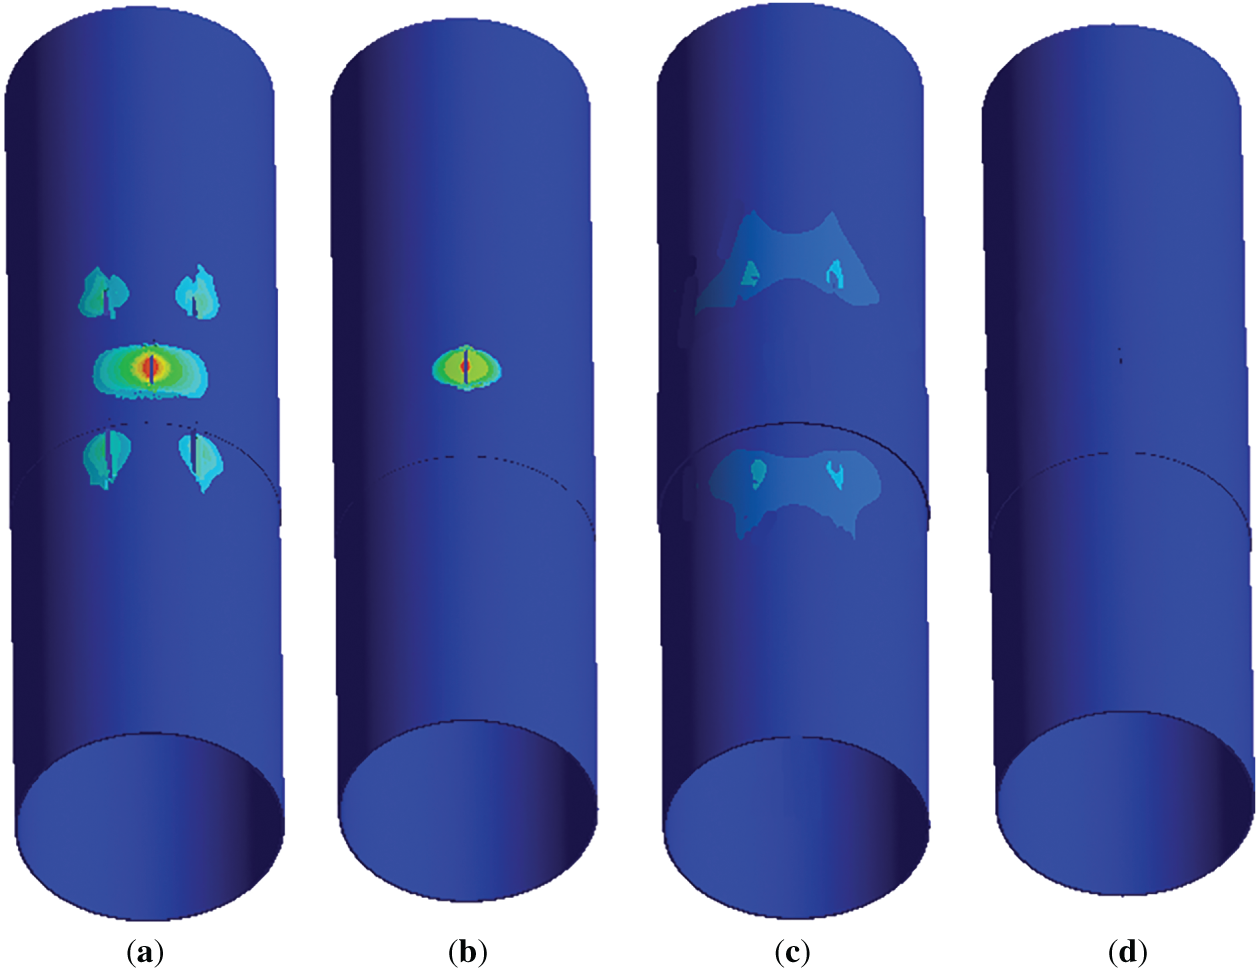
Figure 6: Displacements in the full-scale steel pipe reinforced with the composite overlay under a sudden increase in the internal pressure to the critical value: (a) the overlay with a thickness of 0.3 times the pipe wall thickness and a length of 3 initial crack lengths; (b) the overlay with a thickness of 0.3 times the pipe wall thickness and a length of 5 initial crack lengths; (c) the overlay with a thickness of 0.5 times the pipe wall thickness and a length of 3 initial crack lengths; (d) the overlay with a thickness of 0.5 times the pipe wall thickness and a length of 5 initial crack lengths
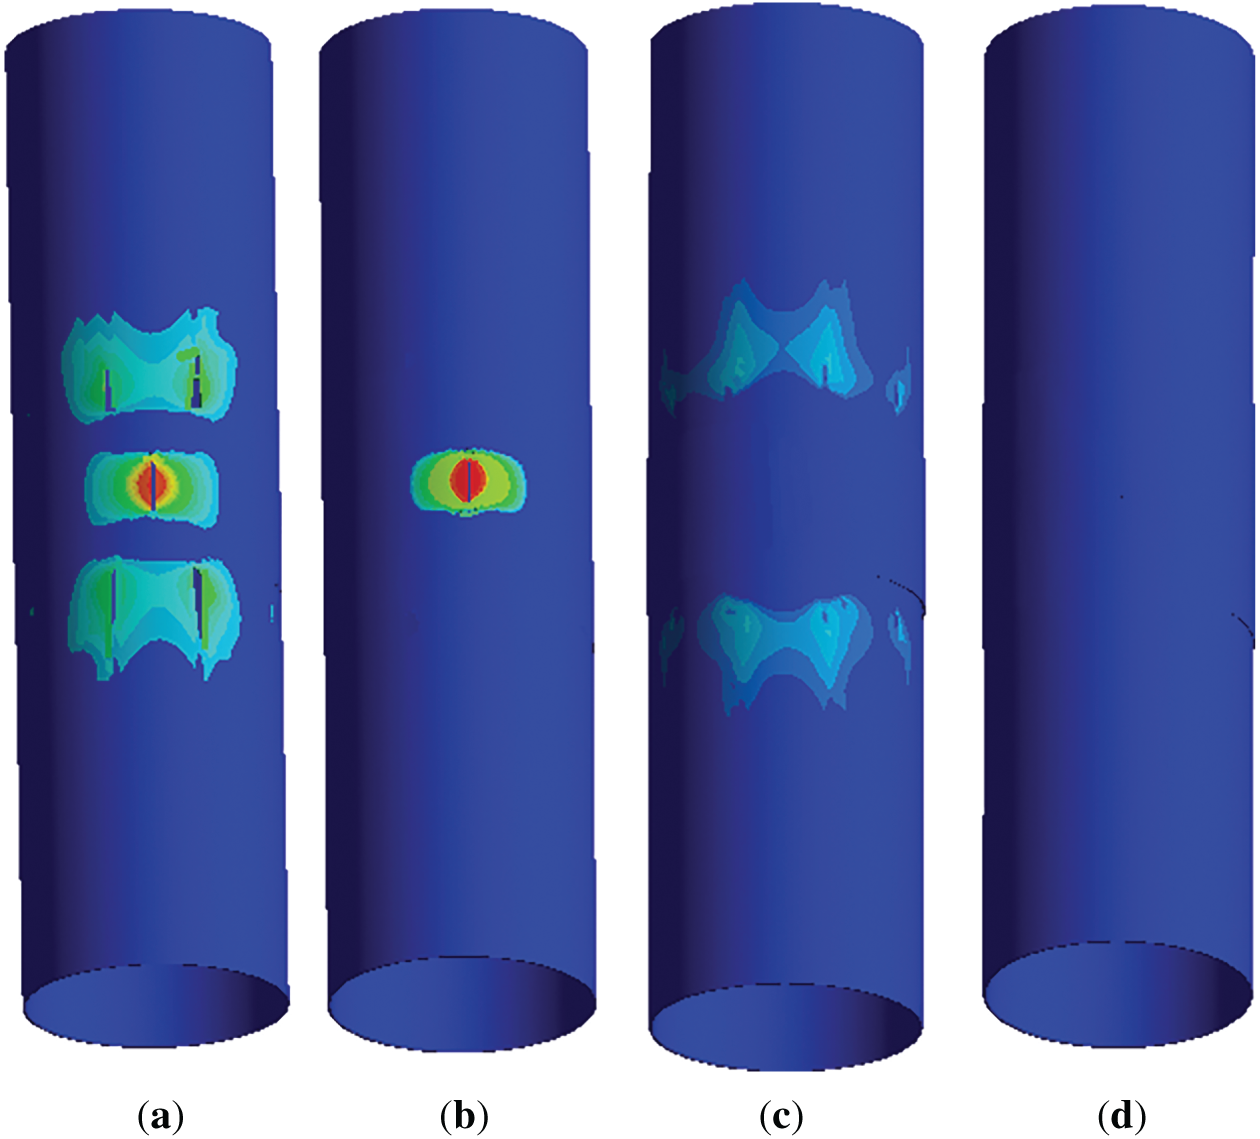
Figure 7: Displacements in the scaled steel pipe reinforced with the composite overlay under a sudden internal pressure increase to the critical value: (a) the overlay thickness equal to 0.3 of the pipe wall thickness and a length equal to 3 initial crack lengths; (b) the overlay thickness equal to 0.3 of the pipe wall thickness and a length equal to 5 initial crack lengths; (c) the overlay thickness equal to 0.5 of the pipe wall thickness and a length equal to 3 initial crack lengths; (d) the overlay thickness equal to 0.5 of the pipe wall thickness and a length equal to 5 initial crack lengths
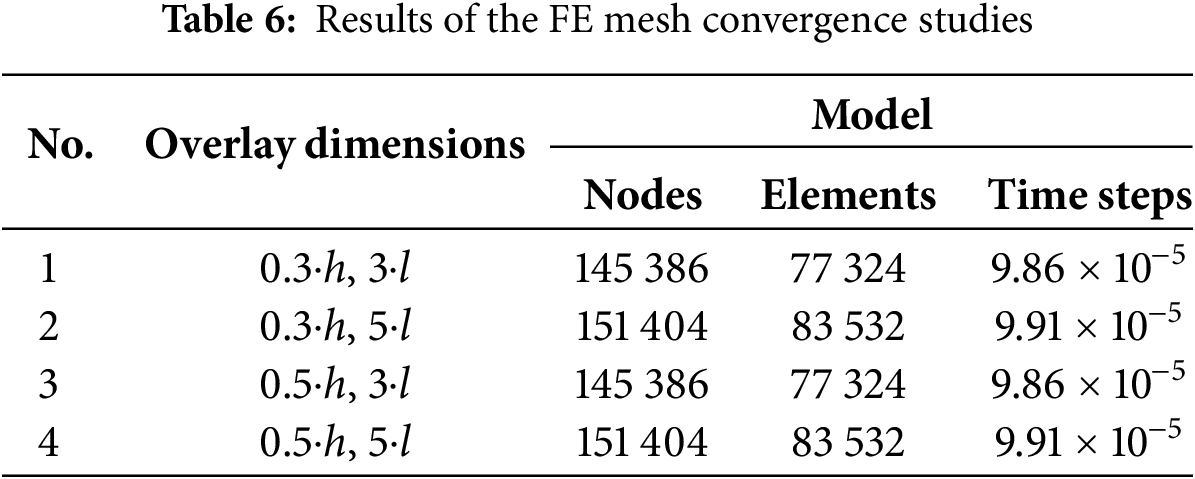
Table 6 summarizes the FE model parameters used to generate the reported results. Two elements were employed through the thickness of both the pipe and the composite wrap, with the mesh generated using the sweep method. Increasing the through-thickness elements from 2 to 4 had a minimal qualitative effect on the results (<5%) but increased the computation time by more than threefold.
For the overlay with dimensions of 0.3⋅h and 3⋅l (Table 5, Row 1; Figs. 6a and 7a), failure occurs through a transverse tension mechanism, indicating insufficient overlay thickness. This is accompanied by the initiation and propagation of penetrating cracks along the pipe and at the reinforced zones. The failure pattern revealed localized stress concentration along the overlay boundaries, indicating that the overlay length was inadequate. In the scaled model, the stress localization zone extends further than in the full-scale model, enabling a conservative (majorant) evaluation of structural strength based on the scaled geometry. The simulation results from both models indicate that an overlay with these dimensions is inadequate for effective reinforcement.
A comparable failure mechanism occurs in the overlay with dimensions of 0.3⋅h and 3⋅l (Table 5, Row 2; Figs. 6b and 7b). Despite the increased length of the overlay, internal forces in the defect area under elevated internal pressure remain insufficiently compensated due to inadequate overlay thickness. Structural failure developed in the reinforced region above the longitudinal crack, accompanied by overlay rupture. Although the increased length allows partial stress redistribution along the pipe axis, reducing edge stress concentration, this configuration does not ensure structural integrity. As in the previous case, the scaled model exhibits a more extended stress localization zone than the full-scale model, providing a conservative (majorant) estimate of structural strength.
Increasing the overlay thickness to 0.5⋅h enhances stiffness and partially compensates for internal forces in the defect area. However, an overlay length of 3⋅l (Table 5, Row 3; Figs. 6c and 7c) remains insufficient for effective axial stress redistribution, particularly in the transition zone between reinforced and unreinforced pipe segments. The local stress concentrations in this zone initiate pipe failure at the overlay boundaries. Although the increased thickness improves strength, it is insufficient to prevent progressive failure with the limited overlay length, rendering this configuration ineffective for structural reinforcement.
Only the overlay with dimensions of 0.3⋅h and 5⋅l (Table 5, Row 4; Figs. 6d and 7d) achieves a stable stress-strain state, preventing macrocrack initiation in the overlay and the body of the pipe. Displacements in the reinforced pipe remain minimal even when the internal pressure reaches critical values. This geometry provides sufficient length for effective stress redistribution and adequate thickness to compensate for axial forces in the longitudinal crack region. These dimensions effectively prevent defect propagation and pipeline integrity.
The results show a strong agreement between the behavior of scaled models and the full-scale pipe. This confirms that the scaling approach reliably evaluates the effectiveness of reinforcement in damaged main gas pipelines, effectively preventing catastrophic (avalanche-like) failure.
This study presents a generalized mathematical model for evaluating the dynamic strength of damaged main gas pipeline sections reinforced with wire wrapping or composite overlays. The model integrates the elastoplastic behavior of pipe and wire steels, temperature-dependent mechanical properties, contact interaction between the pipe and reinforcement, and local material failure under transient internal pressure. Implemented in ANSYS 19.2, the proposed model supports comprehensive parametric numerical investigations. Validation against experimental data showed satisfactory agreement, with discrepancies in crack length and width within 10%–12%, in accordance with ASME V&V 10-2006 guidelines, confirming the FE model as a reliable engineering analysis tool.
A comparative analysis of full-scale and scaled pipe sections reinforced with composite overlay confirmed that scaled models reliably reproduce the essential stress-strain state characteristics and fracture mechanisms. This finding validates their application in experimental investigations and in evaluating reinforcement strategies. This study showed that carbon-fiber composite overlays with a thickness equal to half the pipe wall and a length five times the crack length maintain stable stress-strain conditions in reinforced pipes. Such overlays effectively redistribute stresses and suppress crack propagation even under near-critical internal pressures. Despite these advantages, the approach has certain limitations: the numerical model is confined to axisymmetric reinforcement configurations, and the material models are applicable only within the temperature range of –40°C to +50°C, without accounting for long-term degradation or fatigue. Future studies will address these limitations. Overall, the proposed method provides a practical basis for optimizing reinforcement overlay and wire wrapping parameters and is recommended for designing preventive measures against catastrophic pipeline failures.
Acknowledgement: As a result of the work, we obtained a patent of the Republic of Kazakhstan. Method of localization and stopping avalanche damage of main gas and pipelines. 2024, No. 9009. The authors would like to thank the A. Pidhornyi Institute of Mechanical Engineering Problems of the National Academy of Sciences of Ukraine and the Ministry of University and Research of Italy for providing advisory assistance to this work.
Funding Statement: This research was funded by the Science Committee of the Ministry of Science and Higher Education of the Republic of Kazakhstan (Grant No. AP19680589).
Author Contributions: Conceptualization, Nurlan Zhangabay and Konstantin Avramov; Methodology, Nurlan Zhangabay and Maryna Chernobryvko; Investigation, Nurlan Zhangabay and Konstantin Avramov; Data curation, Nurlan Zhangabay and Svetlana Buganova; Writing—original draft preparation, Nurlan Zhangabay and Maryna Chernobryvko; Writing—review and editing, Nurlan Zhangabay and Marco Bonopera; Supervision, Nurlan Zhangabay, Svetlana Buganova and Marco Bonopera; Project administration, Nurlan Zhangabay; Funding acquisition, Nurlan Zhangabay. All authors reviewed the results and approved the final version of the manuscript.
Availability of Data and Materials: Data sharing is not applicable to this manuscript.
Ethics Approval: Not applicable.
Conflicts of Interest: The authors declare no conflicts of interest to report regarding the present study.
References
1. Zhangabay N, Ibraimova U, Bonopera M, Suleimenov U, Avramov K, Chernobryvko M, et al. Finite-element modeling of the dynamic behavior of a crack-like defect in an internally pressurized thin-walled steel cylinder. Appl Sci. 2024;14(5):1790. doi:10.3390/app14051790. [Google Scholar] [CrossRef]
2. Zhangabay N, Ibraimova U, Ainabekov A, Buganova S, Moldagaliev A. Finite-element modeling of the temperature effect on extended avalanche damage of gas main pipelines. Materials. 2024;17(9):1963. doi:10.3390/ma17091963. [Google Scholar] [PubMed] [CrossRef]
3. Zhangabay N, Ibraimova U, Bonopera M, Suleimenov U, Avramov K, Chernobryvko M, et al. Novel methodologies for preventing crack propagation in steel gas pipelines considering the temperature effect. Struct Durab Health Monit. 2025;19(1):1–23. doi:10.32604/sdhm.2024.053391. [Google Scholar] [CrossRef]
4. Zhangabay N, Ibraimova U, Tursunkululy T, Buganova S, Moldagaliev A, Duissenbekov B. Experimental study of avalanche damage protection methods for main steel gas pipelines. Materials. 2024;17(13):3171. doi:10.3390/ma17133171. [Google Scholar] [PubMed] [CrossRef]
5. Bhardwaj U, Teixeira AP, Guedes Soares C. Failure assessment of corroded ultra-high strength pipelines under combined axial tensile loads and internal pressure. Ocean Eng. 2022;257:111438. doi:10.1016/j.oceaneng.2022.111438. [Google Scholar] [CrossRef]
6. Ren M, Zhang Y, Fan M, Xiao Z. Numerical simulation and ANN prediction of crack problems within corrosion defects. Materials. 2024;17(13):3237. doi:10.3390/ma17133237. [Google Scholar] [PubMed] [CrossRef]
7. Dong F, Bie X, Tian J, Xie X, Du G. Experimental and numerical study on the strain behavior of buried pipelines subjected to an impact load. Appl Sci. 2019;9(16):3284. doi:10.3390/app9163284. [Google Scholar] [CrossRef]
8. Ansari Sadrabadi S, Dadashi A, Yuan S, Giannella V, Citarella R. Experimental-numerical investigation of a steel pipe repaired with a composite sleeve. Appl Sci. 2022;12(15):7536. doi:10.3390/app12157536. [Google Scholar] [CrossRef]
9. Fessler RR, Rapp SC. The effect of shallow cracks on the predicted failure pressure of natural gas pipelines containing stress-corrosion cracks. In: Proceedings of the 2014 10th International Pipeline Conference; 2014 Sep 29–Oct 3; Calgary, AB, Canada. doi:10.1115/ipc2014-33088. [Google Scholar] [CrossRef]
10. Hara T, Shinohara Y, Terada Y, Asahi H, Doi N. Metallurgical design and development of highly deformable high-strength line pipe steels suitable for strain-based design. In: Proceedings of the Nineteenth International Offshore and Polar Engineering Conference; 2009 Jul 21–26; Osaka, Japan. [Google Scholar]
11. Li X, Chen G, Liu X, Ji J, Han L. Analysis and evaluation on residual strength of pipelines with internal corrosion defects in seasonal frozen soil region. Appl Sci. 2021;11(24):12141. doi:10.3390/app112412141. [Google Scholar] [CrossRef]
12. Guo Z, Ren J, Xu X, Lan D, Zhang S, He M, et al. Multiphase Co/Ni metal nitrides with heterointerfaces for enhanced interfacial polarization loss in electromagnetic wave absorption. J Mater Sci Technol. 2025;236:19–27. doi:10.1016/j.jmst.2025.03.020. [Google Scholar] [CrossRef]
13. Liang J, Zhao F, Wu D, Ding A. A numerical method for predicting bursting strength of composite rocket motor case considering filament winding process-induced stress. Chin J Aeronaut. 2025;38(2):103340. doi:10.1016/j.cja.2024.103340. [Google Scholar] [CrossRef]
14. Wang W, Lin F, Zhang L, Wang X. Analysis on the winding process of pre-stressed wire wound orthogonal preload frame on the basis of finite element. In: Proceedings of the 2015 4th International Conference on Computer, Mechatronics, Control and Electronic Engineering; 2015 Nov 28–29; Guangzhou, China. doi:10.2991/iccmcee-15.2015.240. [Google Scholar] [CrossRef]
15. Tafsirojjaman T, Ur Rahman Dogar A, Liu Y, Manalo A, Thambiratnam DP. Performance and design of steel structures reinforced with FRP composites: a state-of-the-art review. Eng Fail Anal. 2022;138:106371. doi:10.1016/j.engfailanal.2022.106371. [Google Scholar] [CrossRef]
16. Ayaz Y, Çitil Ş, Şahan MF. Repair of small damages in steel pipes with composite patches. Mater Und Werkst. 2016;47(5–6):503–11. doi:10.1002/mawe.201600526. [Google Scholar] [CrossRef]
17. Duo Y, Liu X, Liu Y, Tafsirojjaman T, Sabbrojjaman M. Environmental impact on the durability of FRP reinforcing bars. J Build Eng. 2021;43:102909. doi:10.1016/j.jobe.2021.102909. [Google Scholar] [CrossRef]
18. Zhang R, Hao S, Jin L, Du X. Scaling effect on impact responses of steel beams and its energy threshold. Int J Mech Sci. 2025;287:109996. doi:10.1016/j.ijmecsci.2025.109996. [Google Scholar] [CrossRef]
19. Wei CJ, Liang OZ, Jarghouyeh EN. Experimental investigation of effectiveness of FRP composite repair system on offshore pipelines subjected to pitting corrosion under axial compressive load. In: Proceedings of the 2nd International Conference on Innovative Solutions in Hydropower Engineering and Civil Engineering; 22 Dec 25–27; Hangzhou, China. doi:10.1007/978-981-99-1748-8_17. [Google Scholar] [CrossRef]
20. Hocine A, Kara Achira FS, Habbar G, Levent A, Medjdoub SM, Maizia A, et al. Structural integrity assessment of corroded pipelines repaired with composite materials-Literature review. Int J Press Vessels Pip. 2024;210:105253. doi:10.1016/j.ijpvp.2024.105253. [Google Scholar] [CrossRef]
21. Wu X, Du M, Liu H, Song Z, Jia W. Coupled assessment and risk reconfiguration of debris hazards in natural gas pipeline incidents via multi-scale stochastic modeling. Process Saf Environ Prot. 2025;200:107344. doi:10.1016/j.psep.2025.107344. [Google Scholar] [CrossRef]
22. Li Z, Ye F, Wu S. Design and experimental verification of a 1/20 scale model of quayside container crane using distortion theory. Shock Vib. 2019;2019:5893948. doi:10.1155/2019/5893948. [Google Scholar] [CrossRef]
23. Fan Y, Dong H, Zong Z, Long T, Huang Q, Huang G. Numerical simulation of residual strength for corroded pipelines. Struct Durab Health Monit. 2025;19(3):731–69. doi:10.32604/sdhm.2025.061056. [Google Scholar] [CrossRef]
24. Gong H, Zhao T, You X, Wang L, Yun F. Scaled model simulation and experimental verification of submarine flexible pipeline laying system. Appl Sci. 2021;11(21):10292. doi:10.3390/app112110292. [Google Scholar] [CrossRef]
25. Wang C, Xu S, Li W, Wang Y, Shen G, Wang S. Multi-physics coupled simulation and experimental investigation of alternating stray current corrosion of buried gas pipeline adjacent to rail transit system. Mater Des. 2024;247:113394. doi:10.1016/j.matdes.2024.113394. [Google Scholar] [CrossRef]
26. Zhang B, Song X, Xie Q, Xue J. Seismic behavior of looseness-induced inclined mortise and tenon joints in ancient timber structures: experimental tests, multi-scale finite element model, and behavior degradation. Eng Struct. 2024;318:118680. doi:10.1016/j.engstruct.2024.118680. [Google Scholar] [CrossRef]
27. Biazen MA, Woldeyohannes AD, Gebeyehu SG. Simulation models verification and validation: recent development and challenges: a review. Int J Model Simul Sci Comput. 2025;16:2530001. doi:10.1142/s1793962325300018. [Google Scholar] [CrossRef]
28. Anderson TL. Fracture mechanics: fundamentals and applications. 4th ed. Boca Raton, FL, USA: CRC Press; 2017. 684p. doi:10.1201/9781315370293. [Google Scholar] [CrossRef]
29. Chernobryvko MV, Avramov KV, Romanenko VN, Batutina TJ, Suleimenov US. Dynamic instability of ring-stiffened conical thin-walled rocket fairing in supersonic gas stream. Proc Inst Mech Eng Part C J Mech Eng Sci. 2016;230(1):55–68. doi:10.1177/0954406215592171. [Google Scholar] [CrossRef]
30. Lagoudas D, Hartl D, Chemisky Y, Machado L, Popov P. Constitutive model for the numerical analysis of phase transformation in polycrystalline shape memory alloys. Int J Plast. 2012;32:155–83. doi:10.1016/j.ijplas.2011.10.009. [Google Scholar] [CrossRef]
31. Simo JC, Hughes TJR. Computational inelasticity. New York, NY, USA: Springer; 1998. doi:10.1007/b98904. [Google Scholar] [CrossRef]
32. Jana T, Mitra A, Sahoo P. Effect of yield strength on the static and dynamic behaviours of cylindrical contact. Int J Surf Eng Interdiscip Mater Sci. 2022;10(1):1–18. doi:10.4018/ijseims.304806. [Google Scholar] [CrossRef]
33. Lei J, Wu K, Lu Y, Yu H, Wang D. Numerical simulation of crack propagation in orthotropic materials by using PDDO method. Eng Anal Bound Elem. 2025;179:106406. doi:10.1016/j.enganabound.2025.106406. [Google Scholar] [CrossRef]
34. Yao XF, Xu W, Bai SL, Yeh HY. Caustics analysis of the crack initiation and propagation of graded materials. Compos Sci Technol. 2008;68(3–4):953–62. doi:10.1016/j.compscitech.2007.08.007. [Google Scholar] [CrossRef]
35. Daniel IM, Gay D, Hoa SV. Composite materials: design and applications. 2nd ed. Boca Raton, FL, USA: CRC Press; 2007. 568 p. doi:10.1201/9781420045208. [Google Scholar] [CrossRef]
36. Nordhagen HO, Kragset S, Berstad T, Morin A, Dørum C, Munkejord ST. A new coupled fluid–structure modeling methodology for running ductile fracture. Comput Struct. 2012;94-95:13–21. doi:10.1016/j.compstruc.2012.01.004. [Google Scholar] [CrossRef]
37. Yang XB, Zhuang Z, You XC, Feng YR, Huo CY, Zhuang CJ. Dynamic fracture study by an experiment/simulation method for rich gas transmission X80 steel pipelines. Eng Fract Mech. 2008;75(18):5018–28. doi:10.1016/j.engfracmech.2008.06.032. [Google Scholar] [CrossRef]
38. Kruszka L, Vorobiov YS, Ovcharova NY. FEM analysis of cylindrical structural elements under local shock loading. Appl Mech Mater. 2014;566:499–504. doi:10.4028/www.scientific.net/amm.566.499. [Google Scholar] [CrossRef]
39. ASME. Guide for verification and validation in computational solid mechanics (ASME V&V 10-2006). [cited 2025 May 15]. Available from: https://webstore.ansi.org/standards/asme/ansiasme102006. [Google Scholar]
Cite This Article
 Copyright © 2025 The Author(s). Published by Tech Science Press.
This work is licensed under a Creative Commons Attribution 4.0 International License , which permits unrestricted use, distribution, and reproduction in any medium, provided the original work is properly cited.
 Downloads
 Citation Tools