
 Submit a Paper
 Propose a Special lssue
 Open Access
ARTICLE

Wavelet Transform-Based Bayesian Inference Learning with Conditional Variational Autoencoder for Mitigating Injection Attack in 6G Edge Network
1 Department of Professional Services, Axyom.Core, North Andover, MA 01810, USA
2 Department of Network Technology, T-Mobile USA Inc., Bellevue, WA 98006, USA
3 Department of Computer Science and Engineering, Saveetha School of Engineering, Saveetha Institute of Medical and Technical Sciences, Chennai, 602105, India
* Corresponding Author: Surendran Rajendran. Email:
(This article belongs to the Special Issue: Next-Generation Intelligent Networks and Systems: Advances in IoT, Edge Computing, and Secure Cyber-Physical Applications)
Computer Modeling in Engineering & Sciences 2025, 145(1), 1141-1166. https://doi.org/10.32604/cmes.2025.070348
Received 14 July 2025; Accepted 26 September 2025; Issue published 30 October 2025
 View Full Text
 Download PDF
Abstract
Future 6G communications will open up opportunities for innovative applications, including Cyber-Physical Systems, edge computing, supporting Industry 5.0, and digital agriculture. While automation is creating efficiencies, it can also create new cyber threats, such as vulnerabilities in trust and malicious node injection. Denial-of-Service (DoS) attacks can stop many forms of operations by overwhelming networks and systems with data noise. Current anomaly detection methods require extensive software changes and only detect static threats. Data collection is important for being accurate, but it is often a slow, tedious, and sometimes inefficient process. This paper proposes a new wavelet transform assisted Bayesian deep learning based probabilistic (WT-BDLP) approach to mitigate malicious data injection attacks in 6G edge networks. The proposed approach combines outlier detection based on a Bayesian learning conditional variational autoencoder (Bay-LCVariAE) and traffic pattern analysis based on continuous wavelet transform (CWT). The Bay-LCVariAE framework allows for probabilistic modelling of generative features to facilitate capturing how features of interest change over time, spatially, and for recognition of anomalies. Similarly, CWT allows emphasizing the multi-resolution spectral analysis and permits temporally relevant frequency pattern recognition. Experimental testing showed that the flexibility of the Bayesian probabilistic framework offers a vast improvement in anomaly detection accuracy over existing methods, with a maximum accuracy of 98.21% recognizing anomalies.Keywords
New communication services with exceptionally high Quality-of-Service will be offered by future 6G networks [1]. Although mobility is restricted to 350 km/h (roughly) by 4G networks and increased to 500 km/h by 5G networks, 6G technologies are projected to open up new possibilities like extreme mobility, in which mobile devices can travel up to 1000 km/h [2]. Furthermore, where network latencies are less than 100 ms, exceptionally ultra-reliable low-latency communications (eURLLC) are permitted [3]. In contrast to 4G networks, which are predicted to have latency in the hundreds of milliseconds, and 5G networks, which are expected to have latency below one millisecond, this is a significant reduction [4]. Lastly, 6G networks are also estimated to assist ultra-massive machine-type communications (umMTC), in which base stations (BSs) are required to help up to 10 million devices per square kilometer (km2) [5]. Although 5G networks have a maximum density of 1 million devices per km2, 4G networks do not even have this criterion [6]. A wide range of innovative applications will be made by this updated service catalog. The fifth industrial revolution can be expedited by fusing 6G mobile services, edge computing devices, cyber-physical systems, and artificial intelligence [7,8]. To effectively manage anything from digital agriculture and industrial production systems to vital infrastructure like energy or military hardware, real-time feedback control loops can be established. By almost excluding inadequacies brought on by human intercession, this huge automation will greatly boost global efficiency [9,10]. This new revolution is clearly having good social and economic effects, such as greater workplace well-being or intense product personalization. Nevertheless, automated network edge computing devices can also have drawbacks, and this distributed architecture creates new cyberthreats and risks [11,12].
Most systems in a modern economy must remain unattended and unmanaged when networked devices handle the majority of control and monitoring duties. It is not uncommon for isolated deployments to occur in remote locations (for instance, in environmental monitoring or digital agriculture) [13]. The introduction of 6G networks and their predicted ultra-coverage (geographic territory of approximately 98% would be delivered with mobile services) are expected to address unanswered questions regarding communication infrastructure and tackle issues like energy supply, which have been carefully studied [14]. However, networks and devices that are isolated or left unattended are particularly susceptible to manipulation. Actually, the biggest security issues with edge computing and 6G network deployments are trust problems [15]. The development of attacks like false information injection is comparatively simple. Attackers can use a variety of attack vectors with low costs in unattended systems, such as creating aberrant information, introducing malicious nodes into the network, or using noise floods to cause a Denial-of-Service (DoS) [16,17]. However, there can be a significant effect on decision and monitoring software as well as control loops. Existing mitigation strategies to strengthen edge computing deployments and 6G technologies against malicious data rely on richer control loops [18], which can counteract the impact of misleading information and maintain stability in global operations. But there are two main issues with this strategy. Only dangerous data or unusual information that corresponds to a specific model or mathematical function should be identified and eliminated. The enhanced control loop is only resistant to the impacts that a compensation loop is designed to address. There is no correction for the enduring attacks or false data. However, even in cases where the malicious data aligns with the suggested mathematical framework, the complete control software needs to be modified to incorporate any trust protection component. While this is practicable, it restricts the range of applications in which these technologies can be used. Consequently, more broad and transversal defenses against malicious data injections [19,20] are required, and they should be capable of functioning clearly and independently of the form of false data. In contrast to previous studies that heavily rely on static models or focus on excessive data collection, this research proposes a more comprehensive and holistic framework (WT-BDLP) that consists of the Bayesian learning conditional variational autoencoder (Bay-LCVariAE) and CWT for dynamic, probabilistic trust assessment and traffic pattern analysis at varying levels of resolution. This combines the capabilities of detecting malicious data injection robustly into real-time 6G edge environments, and the scalability, accuracy, and adaptability of using learning-based metrics in anomaly detection and trust management. The major contributions of the proposed method are provided below as follows:
• To propose a new wavelet transform assisted Bayesian deep learning based probabilistic (WT-BDLP) approach for mitigating malicious data injection attacks in 6G edge networks.
• To present an outlier detection method based on a Bay-LCVariAE, which combines Conditional Variational Autoencoder (CVariAE) and Bayesian inference-based learning automaton (BayI-LA).
• To introduce traffic pattern analysis using continuous wavelet transform (CWT) for determining the dynamic flow in traffic patterns by permitting multi-resolution analysis.
• To use a hybrid filtering approach for detecting malicious false information attacks in 6G nodes, improving detection performance and reliability.
• To determine the effectiveness and superiority of the proposed WT-BDLP approach in contract to existing trust and anomaly detection methods.
The manuscript’s remaining sections are arranged as follows. The prevailing works in anomaly detection and trust management in 6G edge networks are presented in Section 2. The WT-BDLP approach is included in Section 3. The experimental outcomes are discussed in Section 4, and the proposed work is concluded in Section 5.
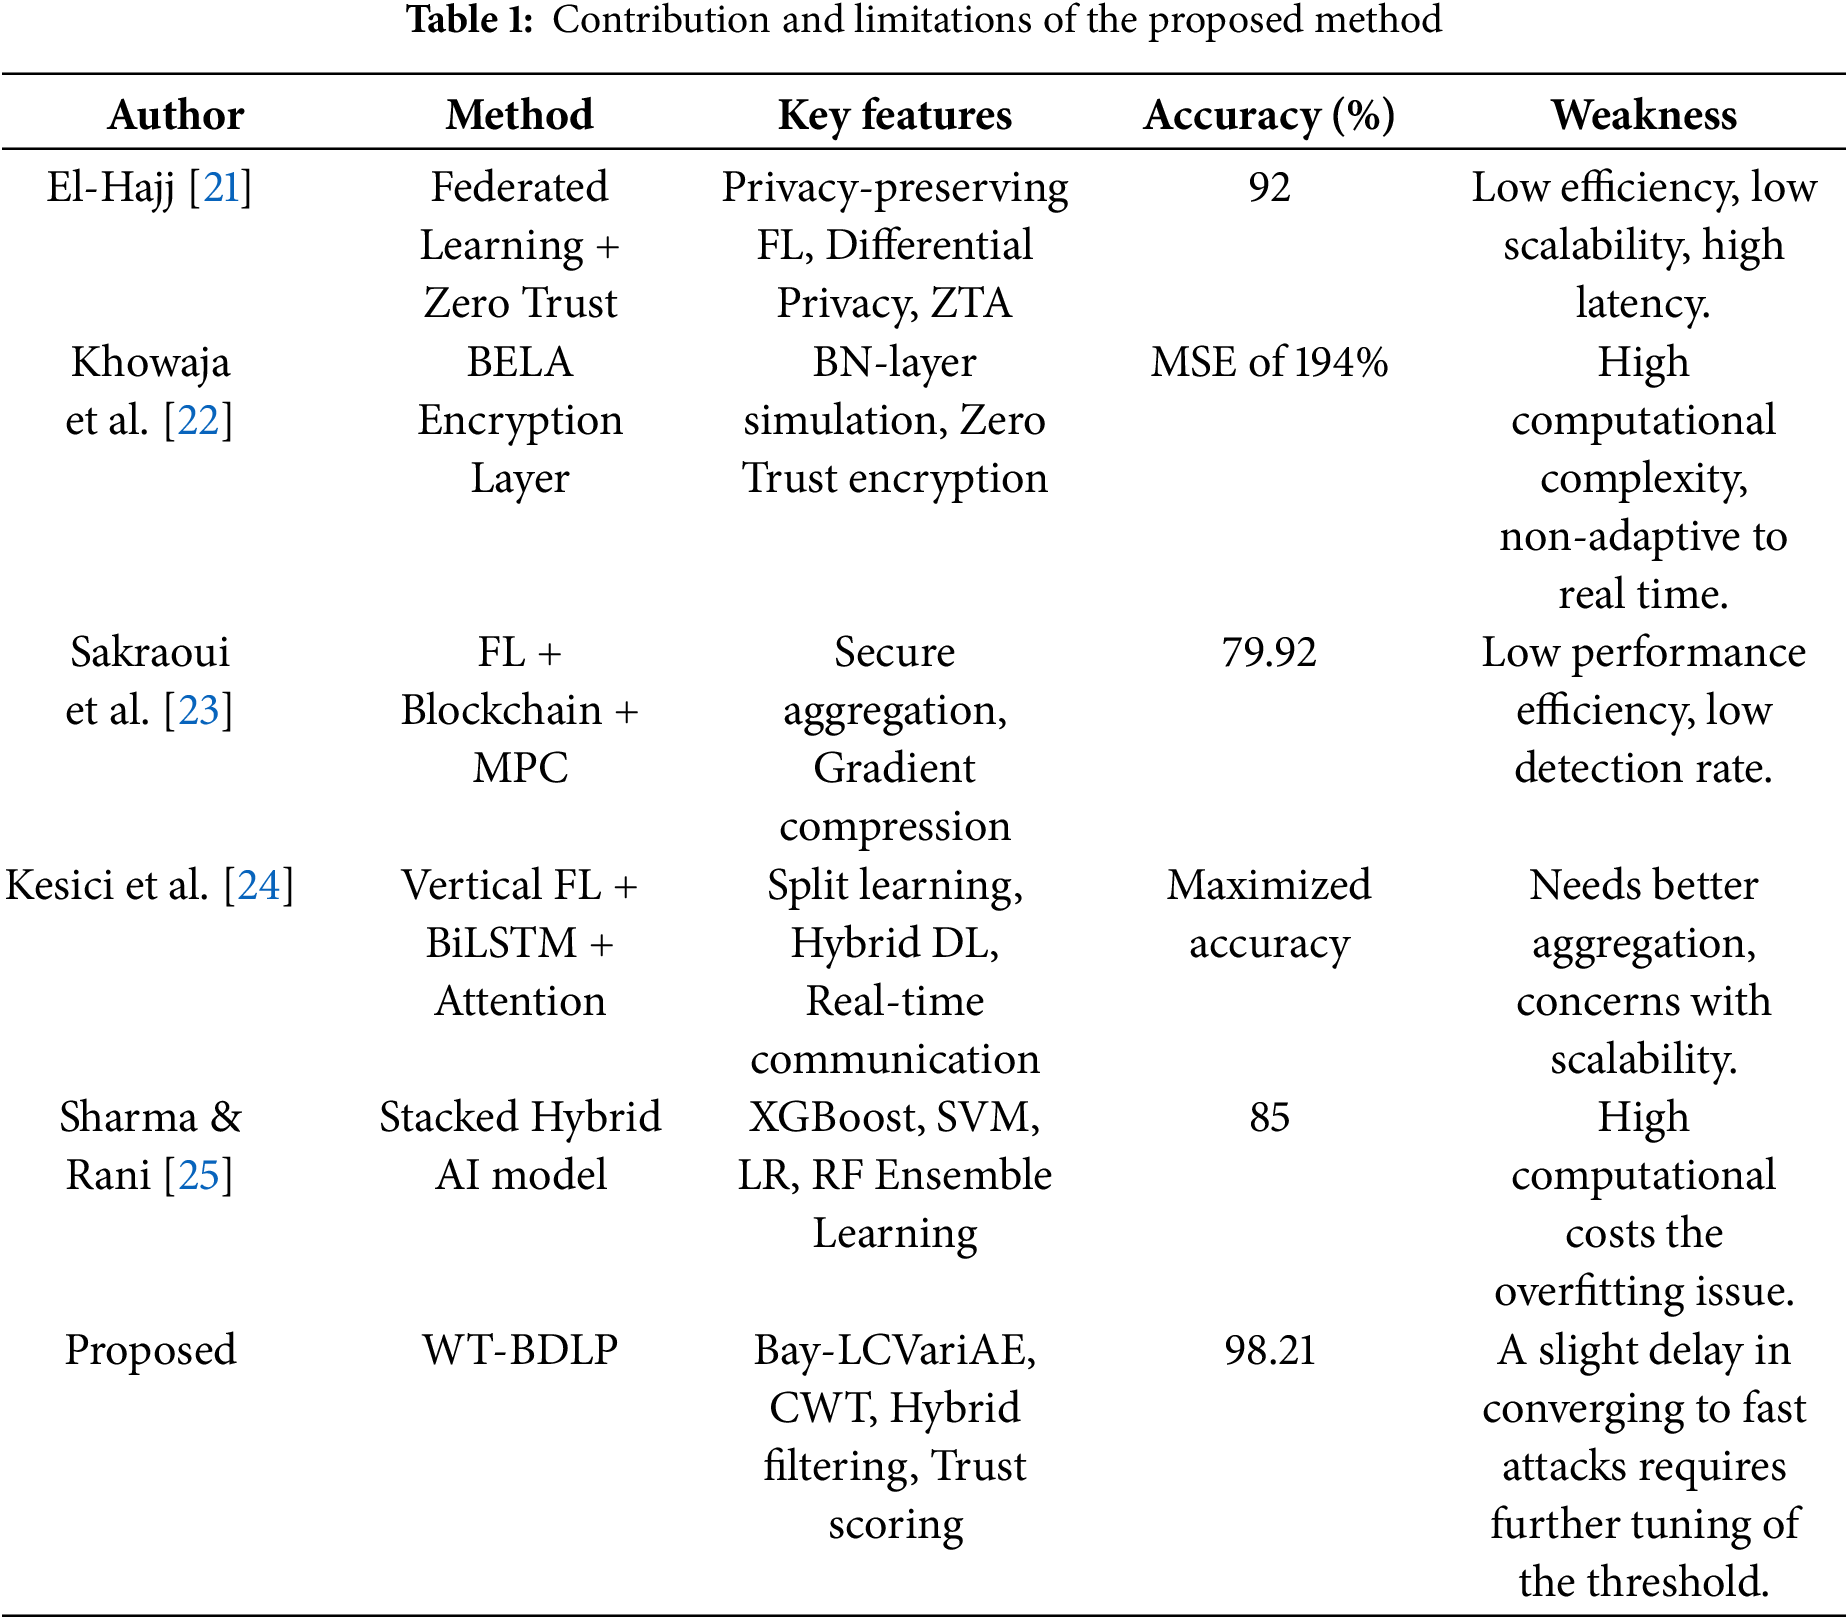
El-Hajj [21] recommended a secure optimization framework that addresses limitations in O-RAN and xApps/rApps by combining privacy-preserving Federated Learning (FL) with zero-trust principles. To identify threats like adversarial Machine Learning (ML) attacks and hacked third-party applications, the threat model that targeted O-RAN’s optimization processes was employed. Further, a FL approach that permits cooperative ML training among operators without disclosing raw network data and a Zero-Trust Architecture (ZTA) that enforces micro-segmentation and constant authentication were used. To protect against inference attacks, a differential privacy (DP) method was used for global model updates. The adaptive DP technique reduced inference risks by 60% while maintaining 92% accuracy. However, the efficiency of this model was very low. A zero-trust based Block Encryption Layer (BELA) module was suggested by Khowaja et al. [22] as a defence against model inversion attacks. The BELA simulated the deep neural network architecture’s Batch Normalization (BN) layer, which reflected the random sequence. Each client had exclusive access to the sequence and parameters, which aided in defending against model inversion attacks. When an adversary attempted reconstruction using current state-of-the-art techniques, the experimental investigation demonstrated that the BELA could raise the mean square error (MSE) to 194%. However, the computational complexity of this work was one of its major drawbacks.
Sakraoui et al. [23] presented a FL-based blockchain-powered lightweight multi-party computation (MPC)-secured intrusion detection system. This approach considered the application of blockchain technology, secure MPC, and FL. By protecting data privacy, this method guaranteed that the parties involved could train intrusion detection models in a safe and cooperative manner. To further reduce computing complexity and communication overhead, gradient compression and adaptive secure aggregation techniques were employed. As a result, this architecture functioned reliably and effectively with maximum data rates and extensive connectivity that 6G networks would offer. It had the lowest false alarm rate (2.55%), the maximum average detection rate (77.41%), and the best average accuracy (79.92%). Even the model was feasible, their performance efficiency was very limited. In distribution networks, a collaborative learning assisted vertical FL was offered by Kesici et al. [24] to identify false data injection attacks. By empowering entities responsible for a sub-network to work collaboratively, this framework successfully resolved data sharing concerns as well as permitted the use of multiple measurements from every sub-network. Moreover, this method allowed real-time communication by assigning the two techniques developed using the split learning technique employed to an attention-assisted hybrid deep learning (DL) approach. The server-side model relied on the bidirectional long-short term memory (BiLSTM), whereas the edge-side model used an attention module built within a DL approach. Even with superior performance, a better aggregation technique was required to maximize the performance.
Sharma and Rani [25] recommended a reliable and conscientious artificial intelligence (AI)-assisted stacked-hybrid model to detect attacks for improving 6G-IoT network security. This method employed a stacked-hybrid model, which used extreme gradient boosting (XGBoost), logistic regression (LR), random forest (RF), and support vector machine (SVM) to increase detection accuracy and robustness. Also, this approach employed a feature selection process and ensemble learning to optimize classification performance while lowering computing costs. The experimental results showed that this hybrid model attained improved performance in terms of different assessment metrics, but the computation complexity was maximized. Table 1 presents the major contributions and limitations of the proposed method.
Problem statement: The emergent field of 6G edge networks will connect millions of autonomous devices, synchronously functioning in real-time in large and often remote areas with enormous examples of smart applications, including smart agriculture, cyber-physical system, and industrial automation. Their operational decisions depend on trust and the data integrity of sensor data. However, the nature of edge deployments operating in a decentralized and unattended capability makes them vulnerable to malicious data injection attacks. For example, in smart agriculture, an attacker can compromise a sensor node or inject a rogue device that misrepresents the soil moisture as being significantly drier (e.g., sensor reporting 12% moisture instead of 14%). If the system believes this is a valid signal, it could cause excessive water usage, crop damage, and financial risk. Unfortunately, traditional anomaly detection systems may be helpless to report such examples because they utilize static methods of modeling and collecting extensive data, which is not scalable or adaptable to these dynamic environments. To assist in the real-time detection of anomalous actions, a robust and probabilistic method is required. This challenge is addressed by the proposed WT-BDLP framework that integrates Bayesian learning-based outlier detection with wavelet-based traffic pattern analysis, allowing for accurate detection and reduction of injection attacks without necessitating extensive software modifications or rigid mathematical assumptions.
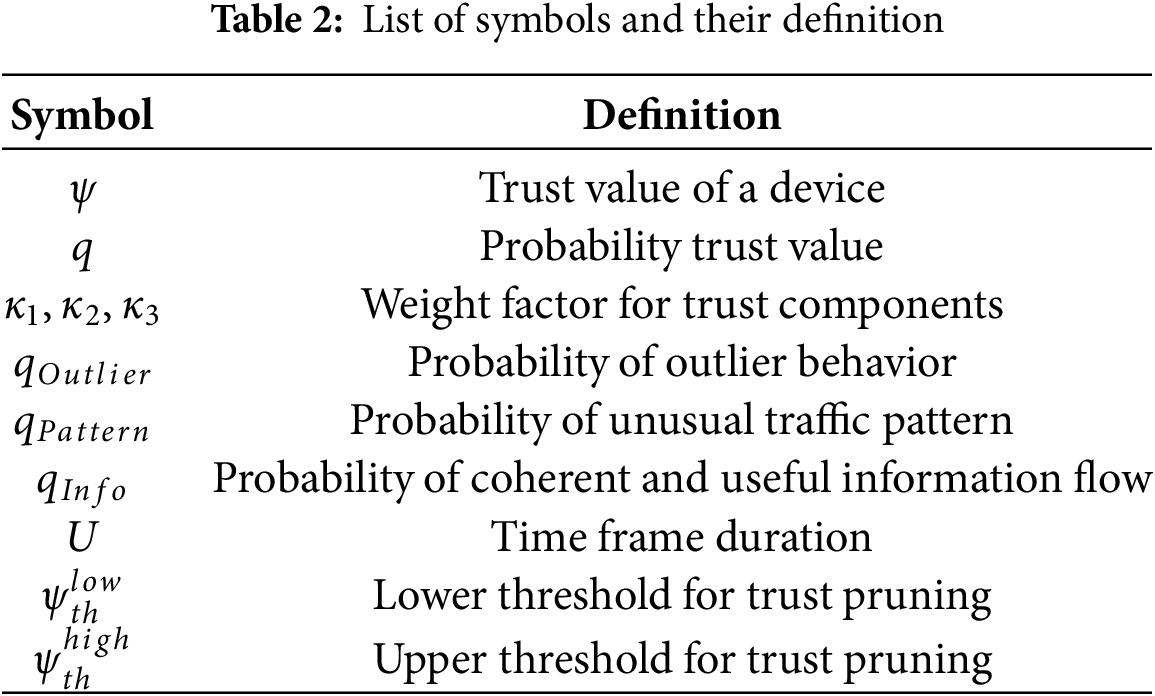
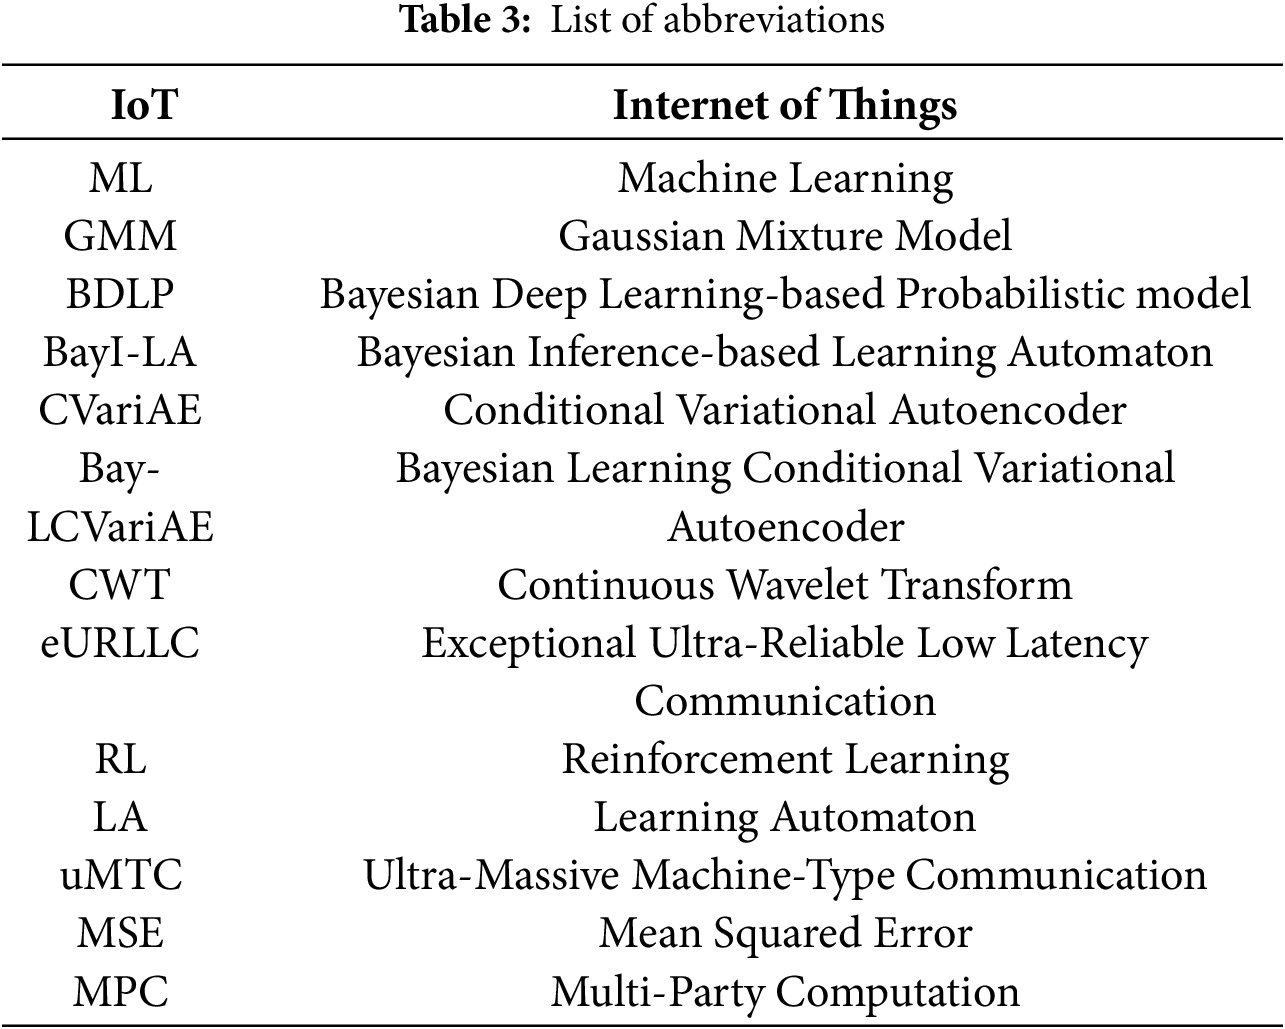
In this section, the proposed WT-BDLP approach is discussed in detail. Here, the Bayesian learning conditional variational autoencoder (Bay-LCVariAE) uses probabilistic inference to recognize key traffic anomalies. Continuous wavelet transform (CWT) uses multi-resolution spectral analysis to identify transients in real-time traffic pattern analysis. Accordingly, a hybrid filtering approach is used for distinguishing malicious false information attacks in 6G nodes with improved performance. Table 2 provides the list of symbols and their definition. Table 3 provides a list of abbreviations.
The Cloud Radio Access Network (C-RAN) topology will be used by future 6G networks. A certain geographic area

Figure 1: Model of proposed scenario
Every time frame, lasting
Devices that have a trust value
Fig. 2 illustrates the hysteresis of the resultant system. It is necessary to modify thresholds for every unique application case. It is possible to employ optimization procedures, experimental measures, or heuristic techniques. Because of natural variations, sensor complexity, or other factors, few data sources are more even or dependable than others. To guarantee excellent performance, thresholds must be adjusted to match the expected scenario’s behavior. Even with this hysteretic nature, trust values can finally change since mobile networks are impacted by a variety of exogenous factors using Eq. (5). The trust value at

Figure 2: Hysteresis of the WT-BDLP model
The weighted addition of three other probabilities, as shown in Eq. (6), and three weighting factors
3.2 Outlier Detection Based on Bayesian Learning Conditional Variational Autoencoder
3.2.1 Conditional Variational Autoencoder
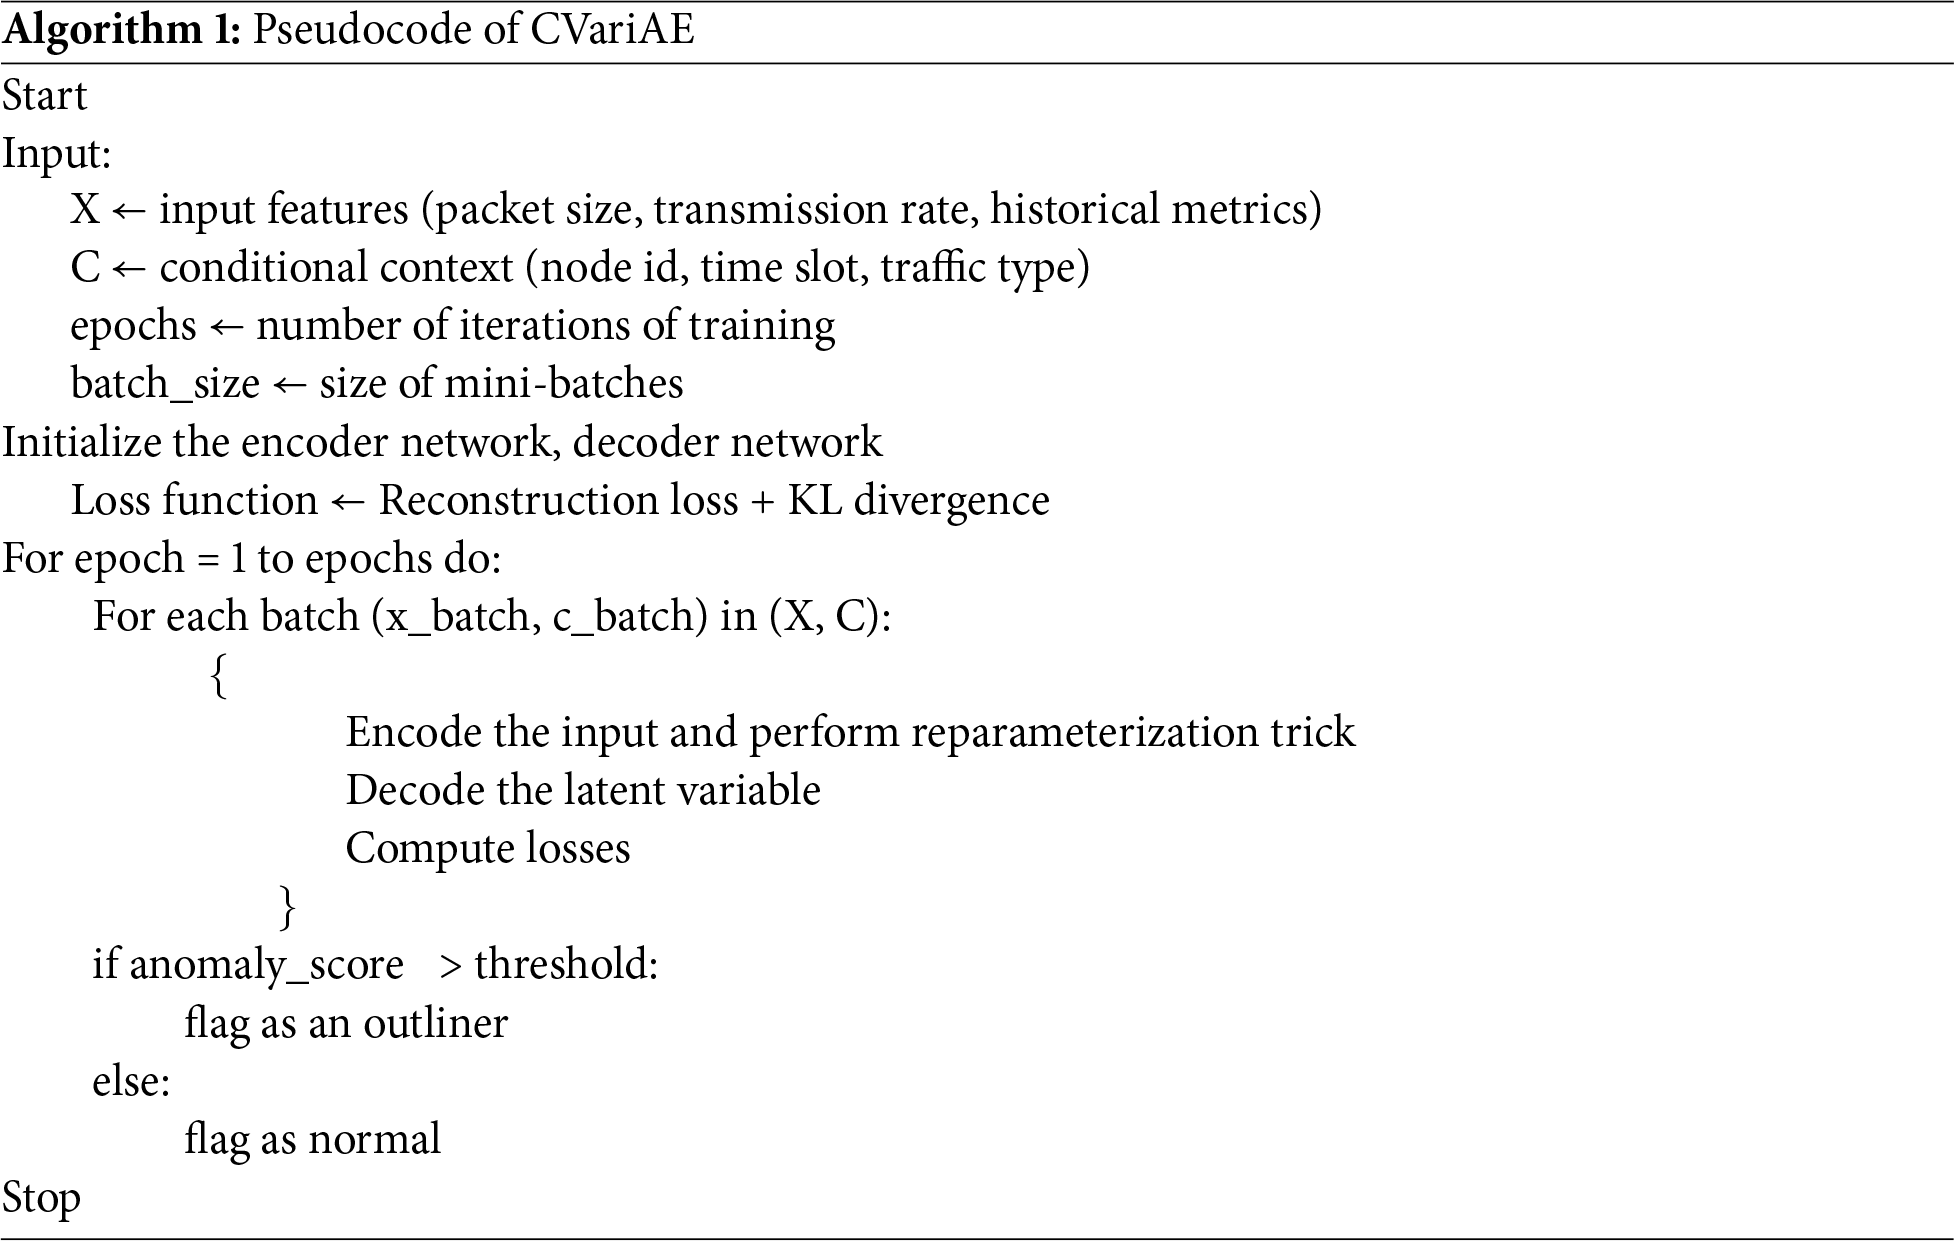
In the proposed method, an advanced neural network model named Conditional Variational Autoencoder (CVariAE) is used to identify outliers, whose behaviour deviates significantly from established patterns. CVariAE uses average packet size, packet transmission rate, historical traffic metrics, and four-dimensional feature representation as input to identify anomalous nodes. CVariAE extends the traditional variational auto-encoder (VariAE) by adding conditional inputs to both decoder and encoder [26]. In CVariAE, the encoder maps the input to a latent space for processing and extracting important features in the compressed form, which results in a latent variable that contains important features of the input. The conditional input ensures that these features are associated with appropriate contexts, which improves the encoder’s capability to differentiate fine-grained patterns. The decoder then rebuilds using the latent variables as well as the conditional inputs. By extracting robust features, CVariAE contributes to an accuracy rate that is particularly helpful for complex data [27]. Thereby, in order to extract characteristics from the input, the proposed method has employed CVariAE. The sampling, encoding, and decoding networks are the three main networks that build CVariAE’s structure for obtaining important information in the proposed technique. The encoding network method is the same as compressing input samples and obtaining their features. The main features of the data are essentially contained in the latent variable. The description of the latent variables is used by the decoding network to generate new samples. A simple conditional probability distribution is found using this technique. Engaging variational inference using Eq. (7),
where,
It makes the assumption that the approach follows the Gaussian distribution because
where,
Algorithm 1 offers the pseudocode of CVariAE.
3.2.2 Bayesian Inference-Based Learning Automaton
After the CVariAE learns the latent representation of anomalous and normal traffic behaviour, Bayesian inference-based learning automaton (BayI-LA) is used to compute confidence/trust score for mode classification by quantifying uncertainty in detection. A finite number of actions have been performed in the unpredictable environment. The environment gives a random response that is either acceptable or not to the solution if a certain action or input from the actions’ finite set or inputs is performed. The main objective of a learning automaton (LA) in BayI-LA is to choose the best course of action by analyzing prior actions and their outcomes. Initially, the odds of every action in LA are the same. After that, one randomly selected action is carried out, and the response to that particular action is observed. This process has been carried out multiple times, with the action probabilities being updated based on the results of the response. Furthermore, the LA can learn to select the best action sets that are likely to provoke positive responses by repeating this process. The tuple
Consider the action
For a non-satisfactory response using Eq. (13) (i.e., if
where,
Furthermore, BayI-LA is distinctly Bayesian in nature, relying on random sampling of the beta distribution and the assessment of rewards or penalties. Thus, Bayesian learning is referred to as a probabilistic inference model that assigns weights to the data supporting the hypotheses. Finding the best solution to the problems is Bayesian learning’s primary goal. Two positive parameters,
where,

Figure 3: Flowchart of BayI-LA
After outlier detection, the traffic pattern analysis is done by using the continuous wavelet transform (CWT).
3.3 Traffic Pattern Analysis Using Continuous Wavelet Transform
In the proposed method, the wavelet transform is employed to analyze traffic patterns in edge computing nodes in 6G networks. They offer multi-resolution analysis and are efficient in detecting anomalies across various time scales. CWT is especially effective in detecting transient patterns and signal deviations that appear in traffic and anomalies, and therefore can be used to detect malicious data injection or traffic bursts. The hidden oscillation pattern in typical time-frequency methods, such as Bessel functions, is substituted by a localized time-frequency representation in the case of the CWT for adaptive spectra at various time scales. This implies that edge computing systems can adapt the resolution of traffic analysis according to the real-time network requirements [29]. In addition, wavelets afford several types of basic functions (e.g., Daubechies, Morlet, Haar wavelets) that can be optimized in a way that they can adapt to the network dynamics more effectively than Bessel functions, which are fixed. Among different wavelet transforms, CWT is engaged because features are retrieved from the wavelet coefficients in the form of a scalogram. Furthermore, the CWT approach can be used together with probabilistic trust models, providing a more resilient intrusion detection system that uses the real-time traffic profile as well as historic information for anomaly detection and trust assessment. The comprehensive accuracy (equally taking account of both true positive and negative rates) and sensitivity regarding detection accuracy by CWT can be much higher than those based on the digital Bessel function case, which can better guarantee 6G edge network protection against the malicious data injection [30]. Thereby, the proposed method employed CWT for analyzing the traffic pattern.
The WT-BDLP framework integrates CWT with a Bayesian deep learning model to enhance anomaly detection by interpreting traffic patterns at different time-frequency resolutions. The Bay-LCVariAE identifies statistical outliers based on latent feature representations, while CWT identifies transient and irregular traffic behaviors through scalogram-based spectral analysis. Anomalies can occur subtly or abruptly, and the dual-layer integration of CWT with a Bayesian model enables the system to detect both anomaly types and enhance the trust assessment of edge nodes in the dynamic 6G environment. Typically, the CWT is a logistic process that uses a mother wavelet function to transform a hyperspectral reflectance spectrum into sets of wavelet coefficients at several scales. The mother wavelet function is scaled and moved using the following Eq. (15):
where,
where,
3.4 Noise Detection and Data Filtering
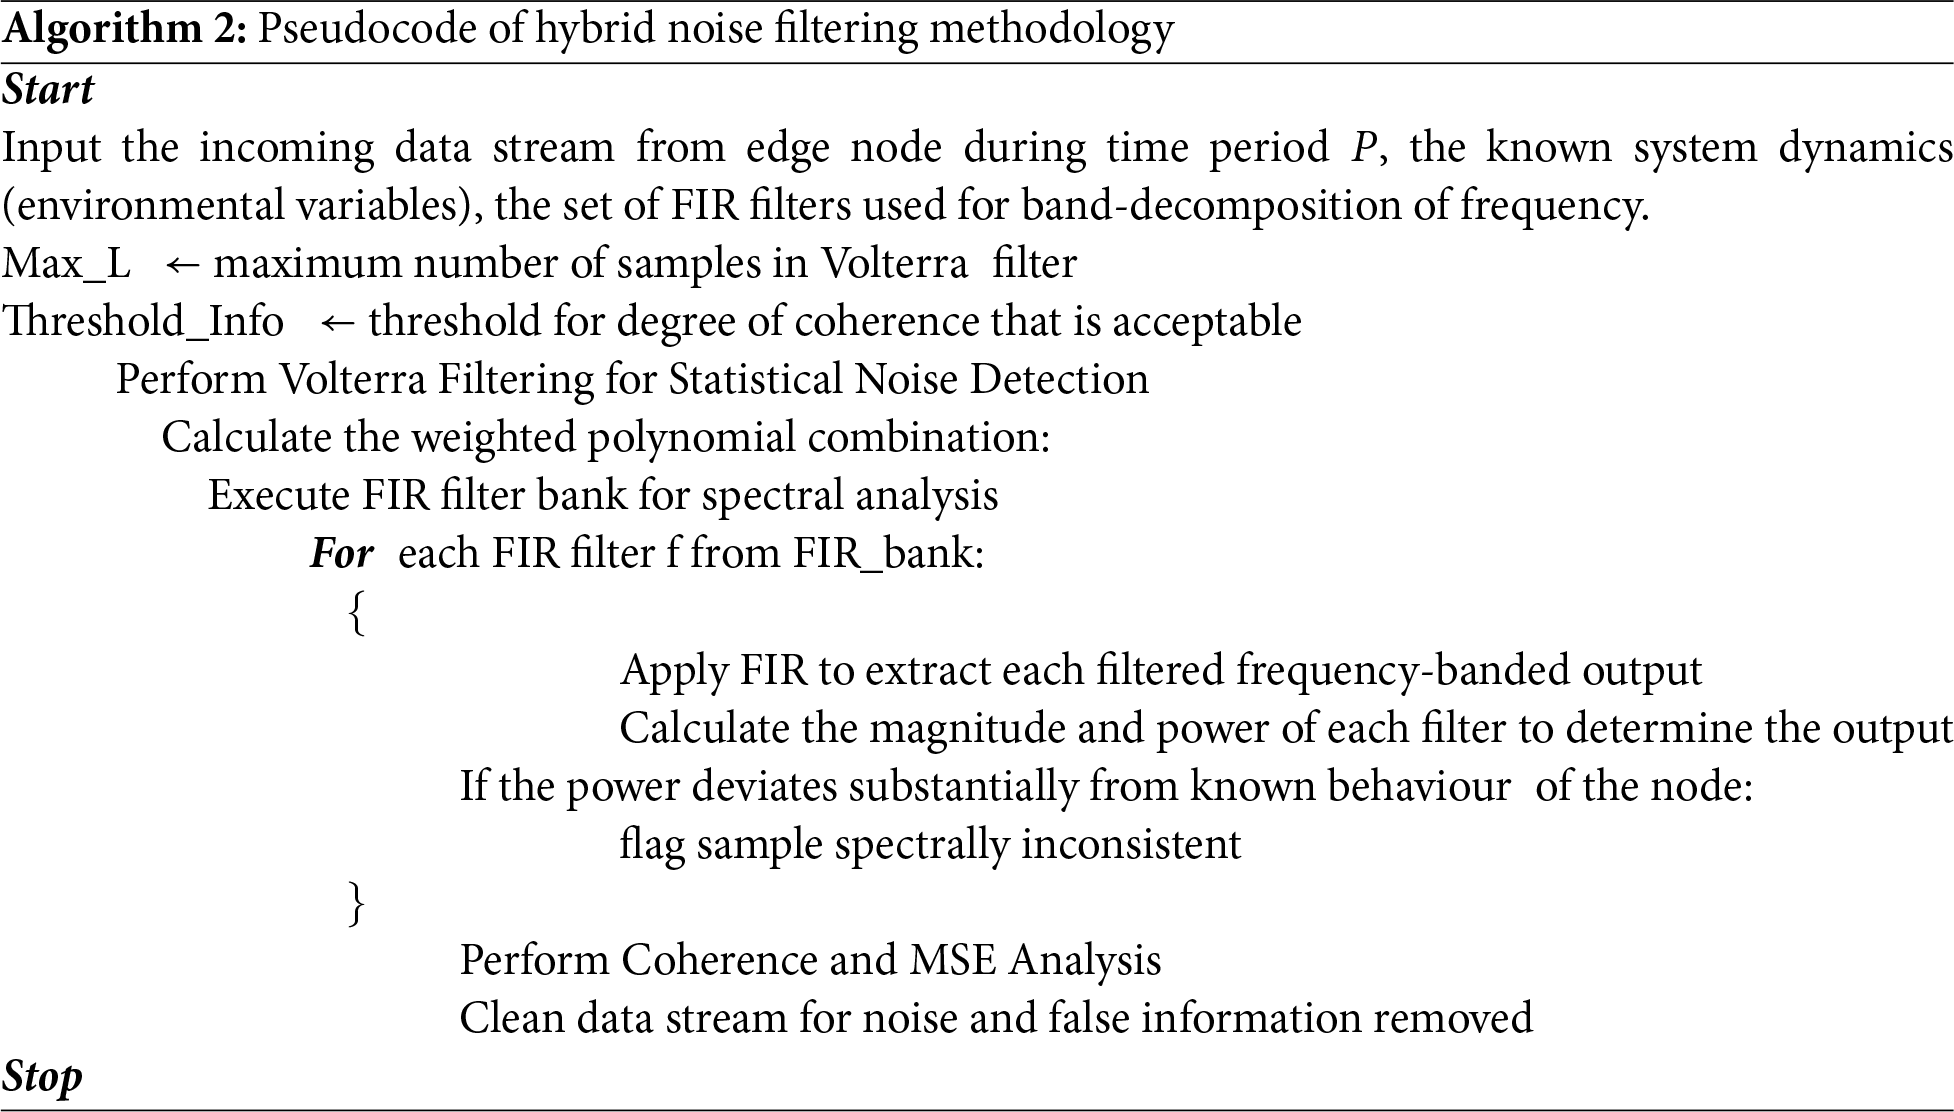
The hybrid filtering strategy to identify and mitigate noise in the WT-BDLP framework combines statistical modeling (Volterra filter), spectral decomposition (FIR filter bank), and trust estimation (input error) to maintain the integrity of data in a 6G edge network. At first, a Volterra filter is a data-driven, adaptive model to modularize and characterize the expected data trajectory based on polynomial expansions, and compares it to ongoing real-time input to discover anomalies. Next, a FIR filter bank separates the stream of incoming data into many different frequency bands, which can then be investigated spectrally using an FFT to expose imperfections in signal power deposition in time. The nominal estimate of noise of a single node is determined through Mean Squared Error (MSE) calculated on the output of filtered data, the desired filtered signal trajectory through decay parameters, and weighted error functions. Finally, the logic to trustworthiness mapped through the errored MSE data onto a probability of trust function using exponential decay functions that eventually end up on the probability that the data coming in from both data paths of the node are consistent. This multi-layered filtering approach will enhance data performance and thereby leverage the WT-BDLP model’s ability to isolate statistical noise in time, while separating and identifying deceptive data injection variables in ongoing data stream inputs.
Here, after traffic pattern analysis, false information can be inserted, such as noise or misleading information, even though the traffic patterns are completely reliable. This risk is measured by the probability
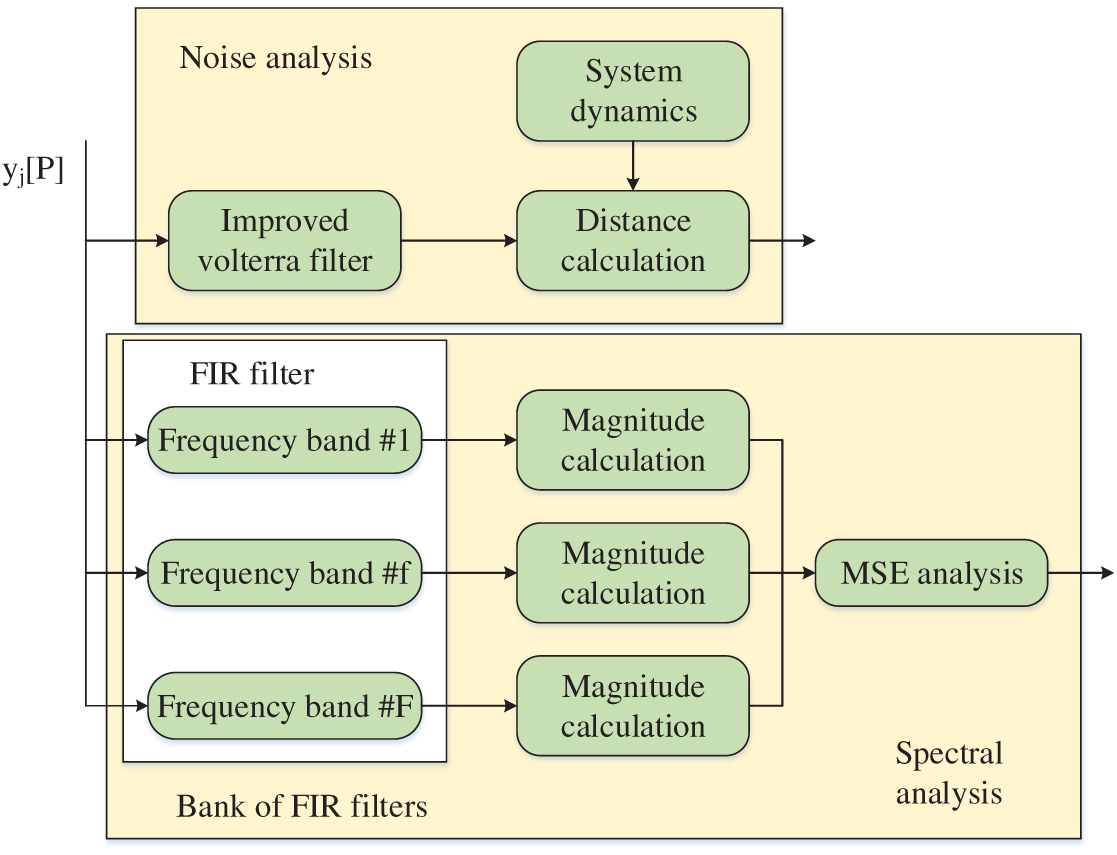
Figure 4: Structure of the noise detection and data filtering process
The Volterra filter uses a linear combination of polynomial functions
This dynamic is formed as the Taylor series, where
The probability
4 Experimental Results and Discussion
To measure the effectiveness of the proposed framework and protection solution, an experimental validation is designed and performed. All simulations are conducted using MATLAB 2022a. The MATLAB 5G Toolbox is used to support simulations of 6G wireless technology. Edge devices are simulated as 16-bit architectures, and their behaviour is modeled through numerical functions executed periodically. The hardware used for simulations was a Dell R534 Rack 2U server running Ubuntu 20.04 LTS with 96 GB RAM and dual Intel Xeon Silver 4114 processors. The data streams are generated by replaying actual data from commercial edge deployments in the industry, with malicious nodes and attacks, such as false information and noise injection, chosen randomly across the simulations. The success rate against false injection attacks is used to assess the degree of security offered by the proposed hybrid trust model. Various attack types (noise injection and fake information) are taken into consideration. Additionally, false positive detections are tracked. However, a second experiment examines the performance in terms of scalability and detection delay. Within the simulation framework, native instruments regulate the necessary processing time. The scenario that has been proposed depicts an industrial circumstance where working conditions and comfort are closely observed. A dense distribution of edge computer nodes is used to monitor humidity, temperature, and carbon dioxide levels. Throughout the course of various simulations, the number of nodes changed from 10 devices to 25,000 devices evenly dispersed throughout 30,000 square meters. A dataset from an actual industrial edge deployment served as the source for the data streams that are produced through a “replay” process. A 16-bit architecture is represented by edge nodes.
For every simulation, malicious nodes as well as the attacks they carry out are chosen at random. A percentage of malicious nodes, ranging from 1% to 10%, is produced in every simulation. Higher percentages (40%) are thought to represent a range of scenarios for the second experiment, from applications with a higher-than-expected number of malicious nodes to those with very minimal risk. Throughout the simulation period, the attacks occur at random and are not continuous. Nevertheless, attacks must last at least 100 time frames. Two distinct 6G base stations (BSs) serve the entire scenario. Numerical methods are used in both attacks, such as false information injection and noise injection. White noise generators are used to support noise injection attacks. The noise power, which is computed offline from datasets, is found to be at least 3 dB higher than the information signals’ power. However, the Runge-Kutta method of solving differential equations in real time permitted fake information injection attacks. The resultant trajectory is a pretense that is introduced into the real system to trick programs used by end users. Data samples are created in both scenarios and transmitted as standard messages to the BSs. The success and false detection rates are tracked for varying numbers of edge devices in the first experiment. Additionally, specific analysis is established for certain attack types. The processing delay needed to finish a successful detection is tracked in the second experiment. The study is repeated with varying malicious node percentages, attack types, and edge device numbers.
The actual dataset of industrial edge deployment in the proposed work comes from a European bakery industry case study, and encompasses edge computing scenarios in industrial environments. The dataset includes environmental monitoring data (humidity, temperature, and CO2) collected with a dense deployment of 16-bit edge computing nodes. The simulations based on this dataset involved between 10 and 25,000 devices over a 30,000 square meter area. Each data instance corresponds to a time frame (composed of 20 measurement slots). The attacks lasted a minimum of 100 time frames, indicating a substantial temporal resolution per instance. The dataset was replayed in MATLAB simulations for trust models and malicious data injection detection, providing an outstanding dataset for testing scalable and resilient edge computing algorithms in 6G environments.
The first experiment’s results can be observed, for edge environments with a sizable number of nodes and for all attack types, the success detection rate exceeds 82%. As the MSE computation and wavelet analysis, along with the clustering method for identifying outliers, the findings are typically more accurate and consistent when considering a sizable number of edge devices based on the nodes’ average behavior. Non-convergent behavior and variability are common in small deployments and have a significant negative influence on overall performance. In general, noise injection attacks yield better outcomes. For these attacks, the success detection rates are typically greater and nearly invariant to the total edge devices because noise can be readily identified by the traffic pattern analysis method and the filter, both of which are independent of edge environment size. Noise injection attacks of 92% can be successfully detected. However, as there are fewer edge devices in the 6G network, the actual detection rate for injection attacks decreases. The BayI-LA-CVariAE-based outlier detection approach is the reason for this, along with two other factors. This Bay-LA-CVariAE’s accuracy and importance rise with the independent samples (data sources) to be examined.
As a result, detection rates increase globally. On the other hand, the outcomes may vary and not be entirely trustworthy for small groups of devices. Secondly, attacks that use false information injection heavily rely on wavelet analysis (which is heavily impacted by the quantity of devices being considered), resulting in a lower level of performance. These attacks have an exponentially growing detection success rate, which starts at extremely low levels (about 9%) and rises to about 86% for larger deployments. With a minimum detection rate of about 39% and a maximum rate of nearly 91%, the global behavior (which considers both types of attacks) also exhibits an exponential-like growth, which is obviously impacted by the inferior performance in distinguishing false information.
Despite the lack of clear data, it is concluded that the proposed model is a workable solution for future edge computing settings because 6G networks will be dense (nearly 10M devices per sq.km). In Fig. 5, the stated true detection rate outperforms the results of other advanced traditional methods. For instance, generative AI techniques claim precision values of about 70%, whereas network-based techniques can only get a success rate of 75% (roughly). The outcomes that have been reported indicate a notable improvement.
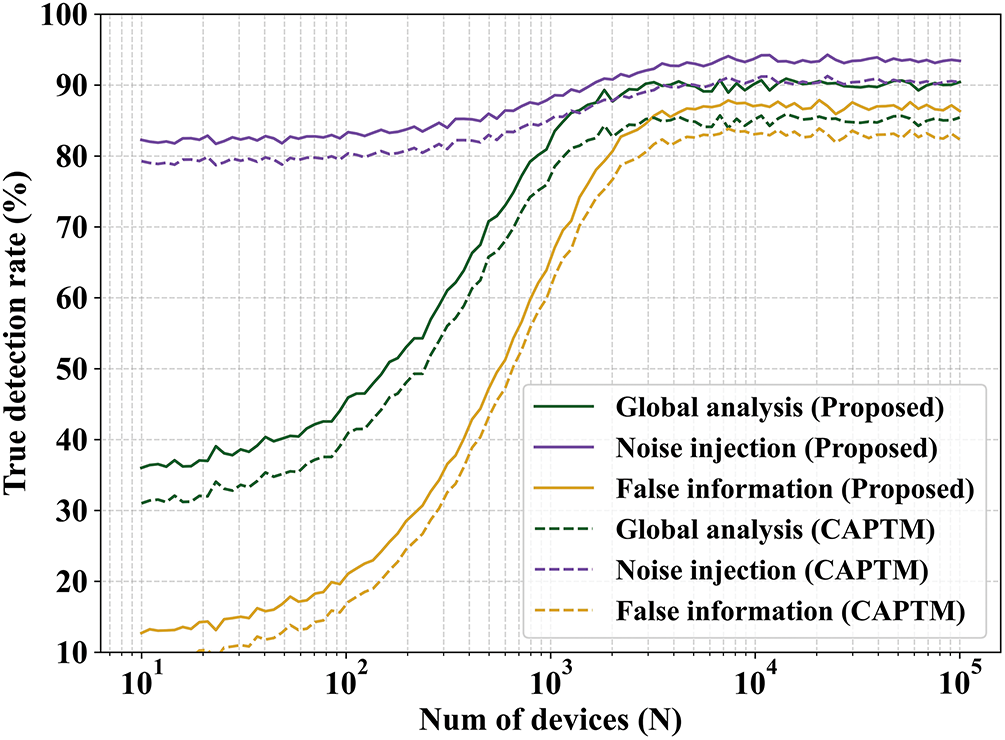
Figure 5: True detection rate across varying edge nodes for the first experiment
The false detection rate exhibits complementary behavior (refer to Fig. 6). As stated, the performance is lower for small edge deployments (the rate is about 10% for extremely small networks) because the injection attacks rely heavily on the computation of an average behavior. In this instance, the false detection rate is kept just at 1%, and for large deployments, all curves converge to a similar result. In any case, the false detection rate is always less than 10%, which is appropriate for the majority of scientific studies and engineered solutions. The outcomes of the second experiment are displayed.
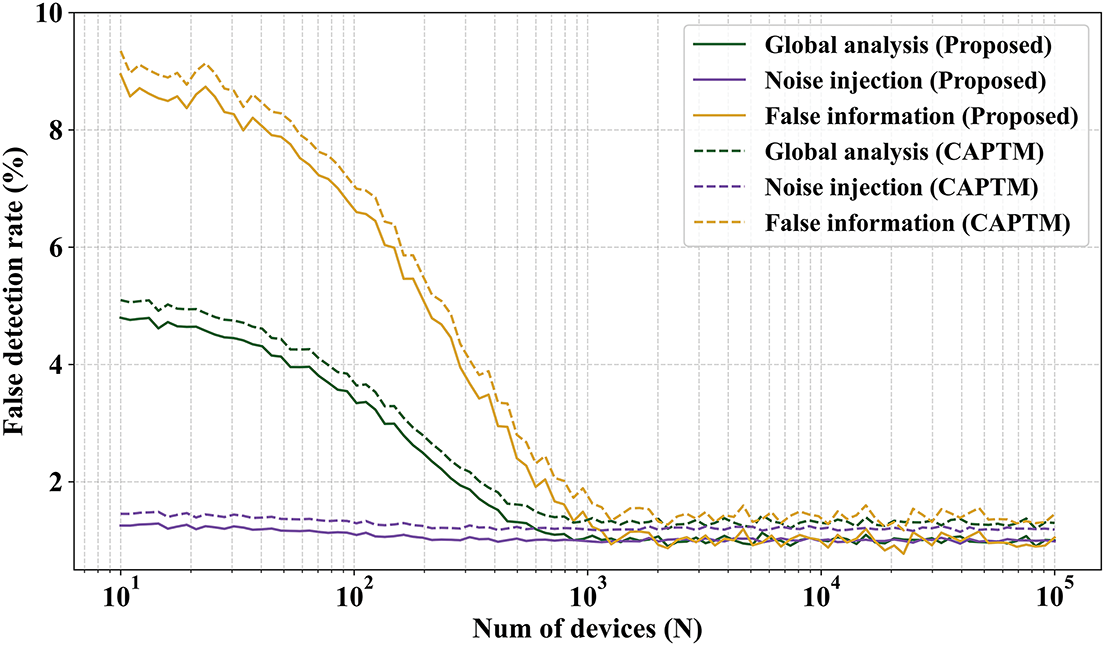
Figure 6: False detection rate across varying edge nodes for the first experiment
Since the number of operations in the proposed method also rises linearly with increasing edge nodes in the deployment that needs to be safeguarded, it is evident that the evolution is roughly linear in any scenario. The processing delay duplicates as the rate increases to 10%, if the rate of malicious node environments between 1% (Fig. 7) and 5% (Fig. 8) displays values in a similar order of magnitude. Likewise, the processing time rises as the rate reaches above 40%, even though it is not as much as the quantity of malicious nodes. As a result, it can be observed that the processing delay rate increase is less than linear evolution. This suggests that scalability with respect to nodes in the edge environment is guaranteed. However, the model requires more time to converge in the event of a big attack, and only slow attacks would be correctly identified. Attacks may succeed if their duration is less than the processing latency. Various trust domains can be formed to minimize processing delay, even though the time frame could be changed to lessen this difficulty.
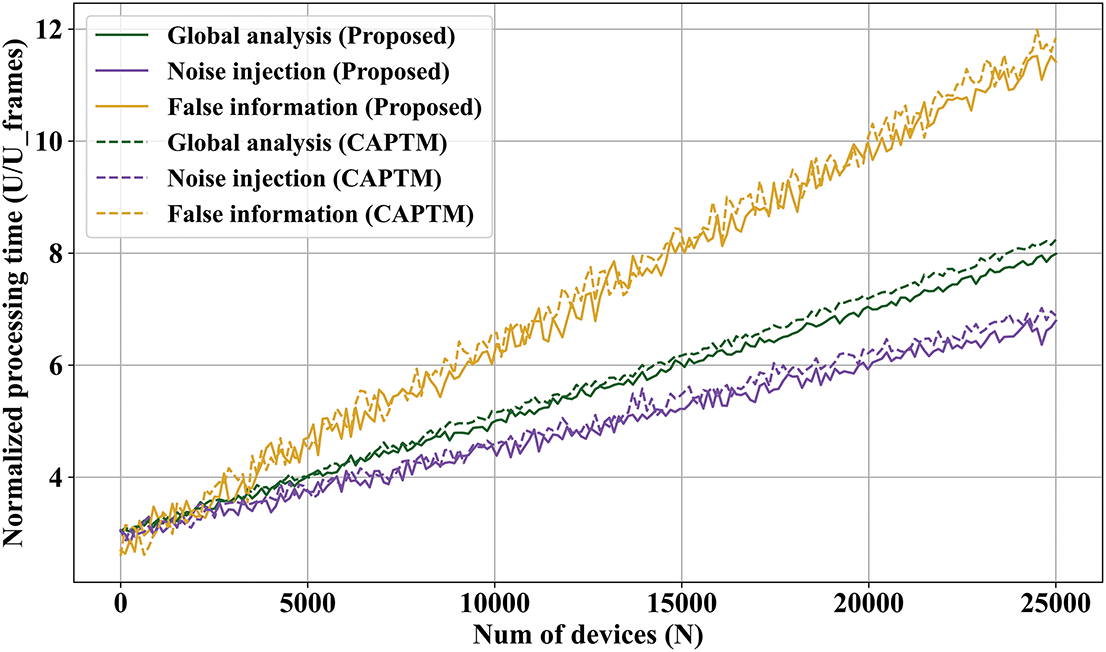
Figure 7: Processing delay with 1% malicious nodes for the second experiment
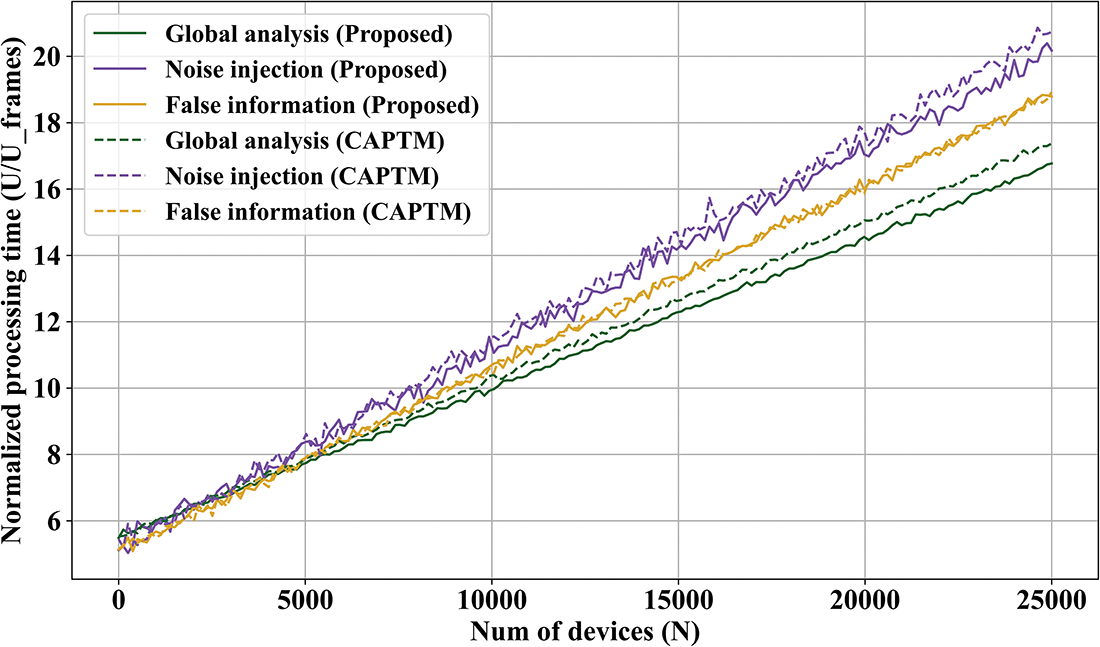
Figure 8: Processing delay with 5% malicious nodes for the second experiment
Fig. 9 displays the Processing delay with 10% malicious nodes for the second experiment. Furthermore, noise injection assaults are always recognized more quickly. Noise injection attack impacts all indications, including malicious traffic patterns, outlier behavior, and anomalous information content. As a result, detection delays are shortened and the ultimate trust value declines more pertinently. But only wavelet analysis can completely identify malicious activity in fake information injection attacks, and trust ratings decline more gradually. Additionally, there are greater processing delays. The discrepancies are highly significant, but they become less significant when malicious edge nodes increase. In these cases, the data structures needed to implement the control method, primarily the CWT, are highly complex, and computational delays begin to weigh more heavily in the final processing delay than the trust model’s convergence delays. Fig. 10 observes this occurrence with 40% malicious nodes for the second experiment.
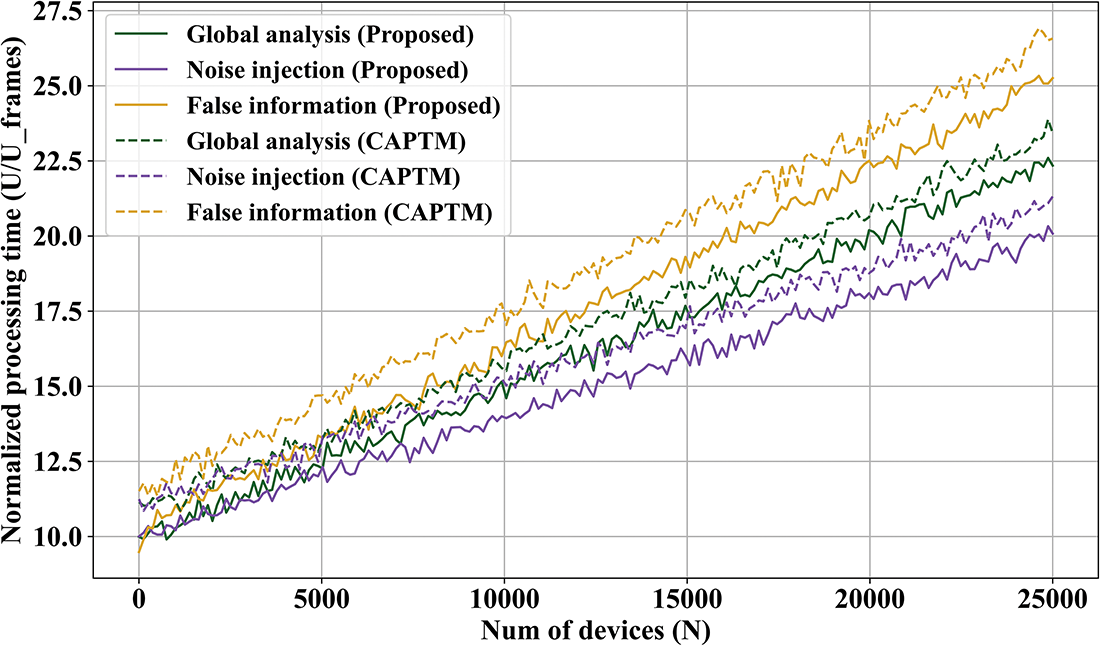
Figure 9: Processing delay with 10% malicious nodes for the second experiment
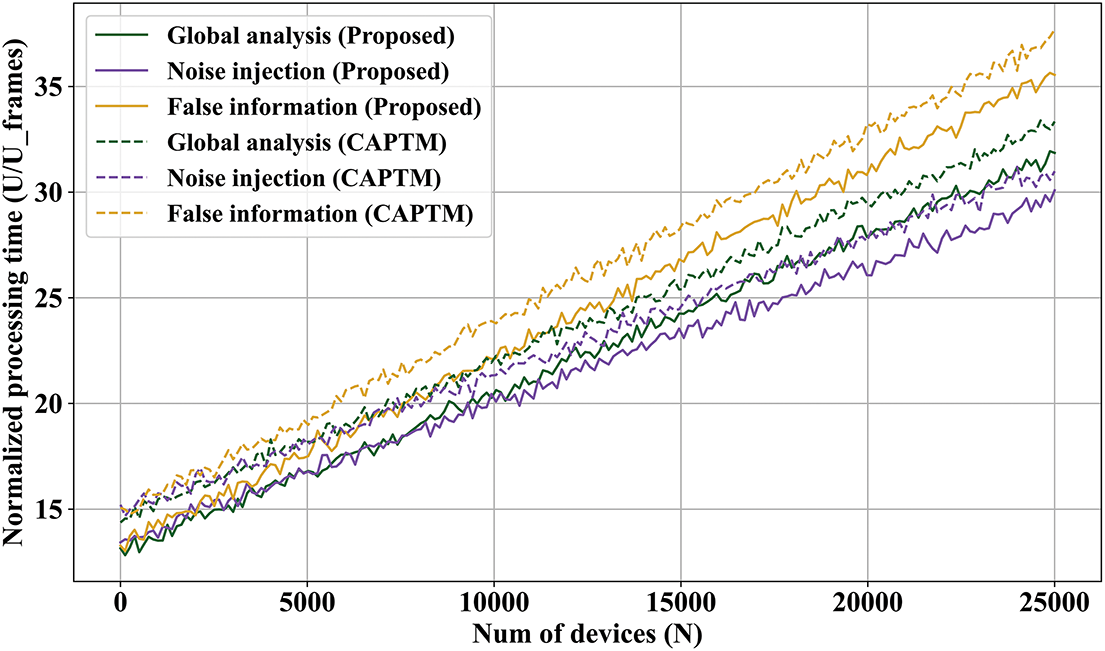
Figure 10: Processing delay with 40% malicious nodes for the second experiment
The given results considerably outperform state-of-the-art systems in spite of all these drawbacks. The convergence or processing time is longer and significantly less ascendable in the majority of methods. For instance, detection delays in current blockchain-enabled technologies can reach 50 days. This is totally inappropriate for situations that happen in real time. In any event, even a linear revolution is usually regarded as a rising order that is scalable. The processing delays (global) vary from 10 (1% malicious nodes) to 20 (10% malicious nodes) and thirty (40% malicious nodes) time periods according to the duration of the most common malicious data injection assaults. Overall, from the experimental analysis, the proposed method can function in any edge context and is scalable.
Fig. 11 provides a comparison of accuracy with proposed and prevailing techniques. For comparison, the existing methods, such as machine learning (ML) based trust, reinforcement learning (RL) based trust, and Bayesian trust models, have been used. According to the experimental findings, the proposed approach has obtained a maximum accuracy of 98.21, whereas the existing ML-based trust, RL-based trust, and Bayesian trust models have attained accuracy of 0.9568, 0.9681, and 0.9743. The method that introduced the concept of outlier detection using BayI-LA-CVariAE outperforms the other methods for complex statistical anomalies with higher accuracy. The probabilistic model and latent space contributed to that accuracy. The traffic pattern analysis method, which utilizes CWT, has been enhanced by giving time-frequency localization, thereby accurately identifying transitory patterns and abrupt shifts in network activity at irregular intervals. The noise detection and data filtering method improved overall reliability and accuracy by filtering out unnecessary or misleading information, which contributed overall to a more reliable basis in the decision-making process. By using these techniques together, the accuracy performance has improved.
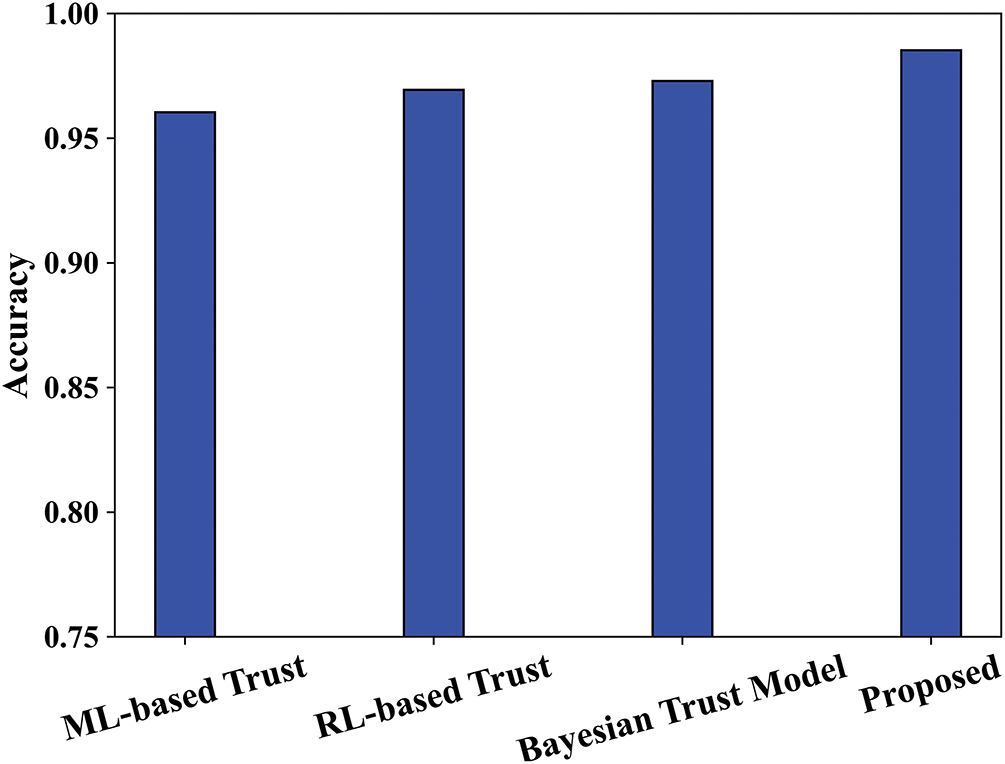
Figure 11: Accuracy comparison with existing trust models
Figs. 12 and 13 offer a comparison of R2 and MSE with proposed and existing methods. The proposed model’s outcomes, by comparing their R² and MSE values with traditional ML-based, RL-based, and Bayesian trust models, show a greater ability to predict with accuracy. The proposed model employs multiple analytic techniques, including BayI-LA-CVariAE to detect anomalies, CWT for network traffic pattern behavior, and Volterra filtering to recognize noise with respect to trust estimation. The amalgamation of these features allows for broader and more flexible detection mechanisms that lead to an improved R² value for the proposed model, which suggests a stronger relationship between the predicted trust scores and the true behavior of the trust model of the entire system. The proposed method has obtained a maximum R² value of 0.9838, whereas the existing ML-based Trust, RL-based Trust, and Bayesian Trust Models have attained accuracy of 0.9168, 0.9481, and 0.9643.
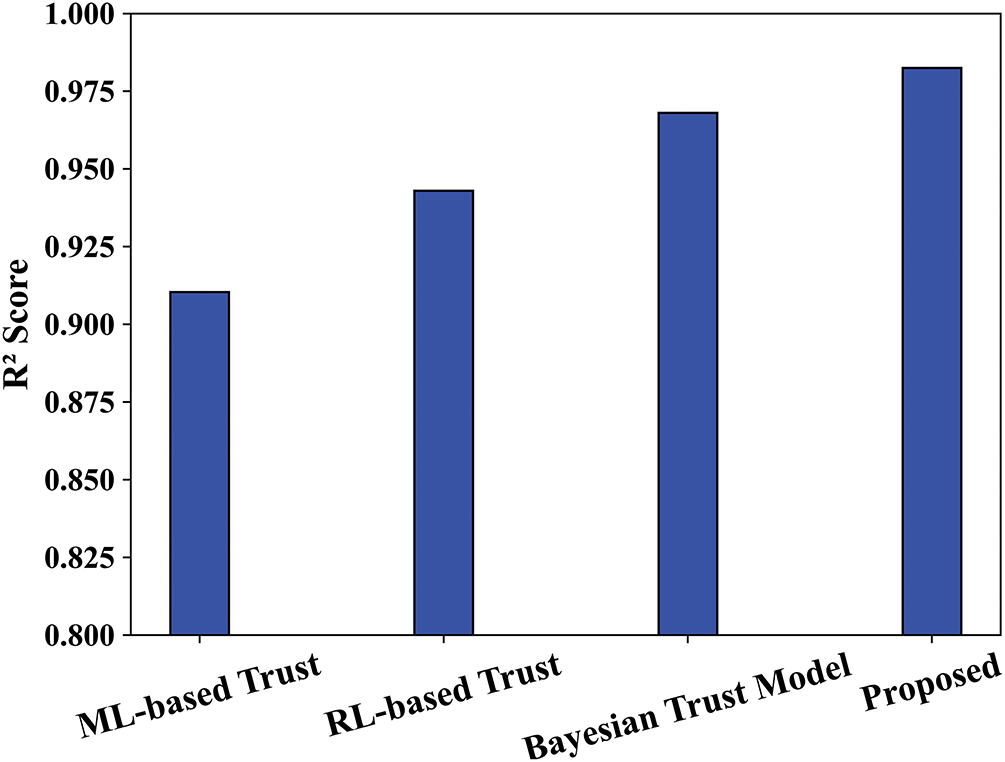
Figure 12: Coefficient of determination (R2) with existing trust models
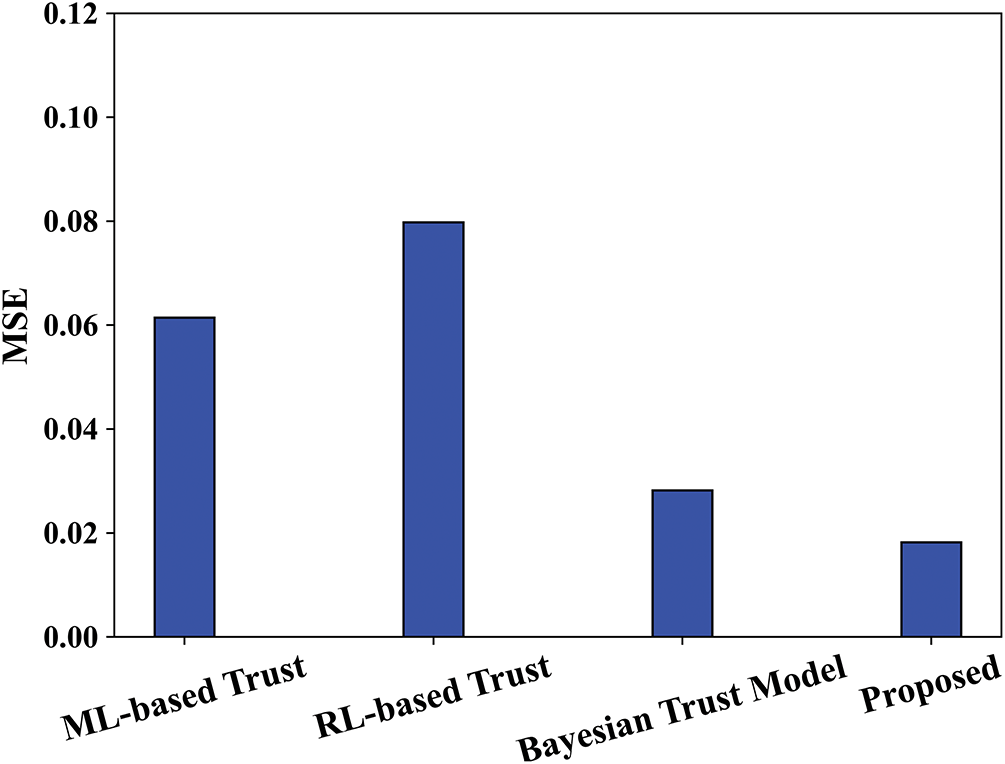
Figure 13: MSE comparison with existing trust models
The MSE value of the proposed method is always less than both ML and RL-based methods because of the tendency of traditional ML and RL methods to overfit to the training data or have a lack of generalizability to changing networks. While Bayesian models offer great probabilistic inference under uncertainty, they also have prohibitive computational demands and rely on priors that limit their ability to adapt to shifting network conditions. Meanwhile, the proposed model has a feature which allows it to reduce MSE because it maintains the ability to estimate trustworthy behavior even when networks change, preserving its inferior performance against data poisoning in edge computing. The proposed method has obtained a lower MSE value of 0.01514, whereas the existing ML-based trust, RL-based trust, and Bayesian trust models have attained accuracy of 0.6768, 0.08, and 0.0343. Fig. 14 specifies the ROC comparison of the proposed framework. Here, the proposed model has shown remarkable performance, having achieved an Area Under the Curve (AUC) of 0.982 in a Receiver Operating Characteristics (ROC) analysis. A maximum AUC indicates strong discriminatory and allows for differentiation between non-trustworthy and trustworthy, malicious nodes. The usage of improved models prevented precision errors. Also, it maintains secure detection with low false positives. This makes the entire experiment demonstrate that this model can be trusted in securing 6G networks from injection attacks.
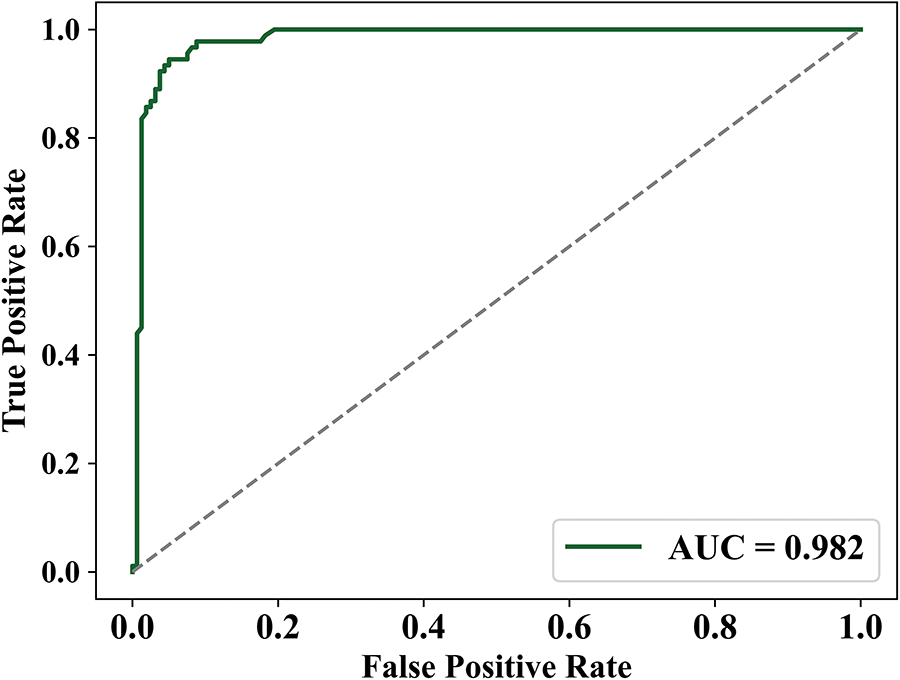
Figure 14: ROC comparison analysis for trust classification
Further, to test the adversarial robustness of the proposed WT-BDLP framework, black-box noise injection attacks and fake information attacks are executed over different densities of edge nodes. For the noise attacks, white noise generators at power levels at least 3 dB above signal power levels are considered, while fake information injection is based on manipulating trajectories using a Runge-Kutta method. The model is highly resilient under these conditions, with detection rates and a low false positive rate, especially in larger deployments. Table 4 analyses the performance metrics under these adversarial conditions:
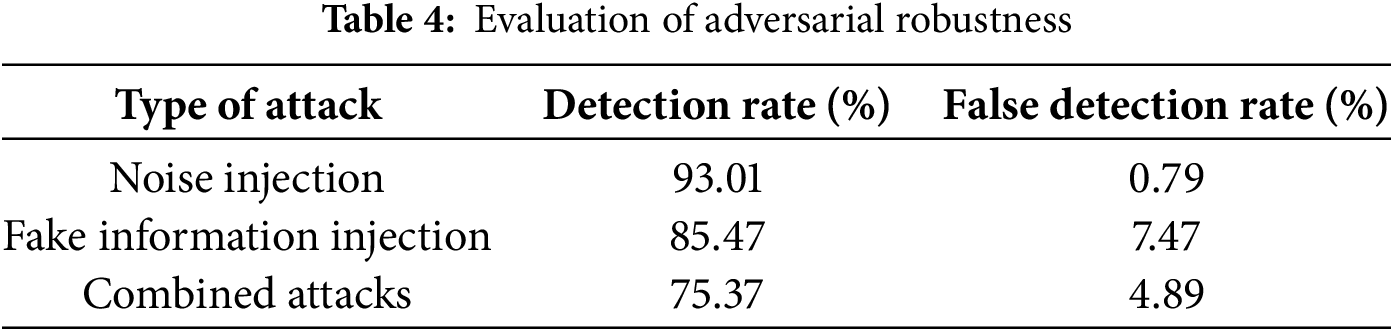
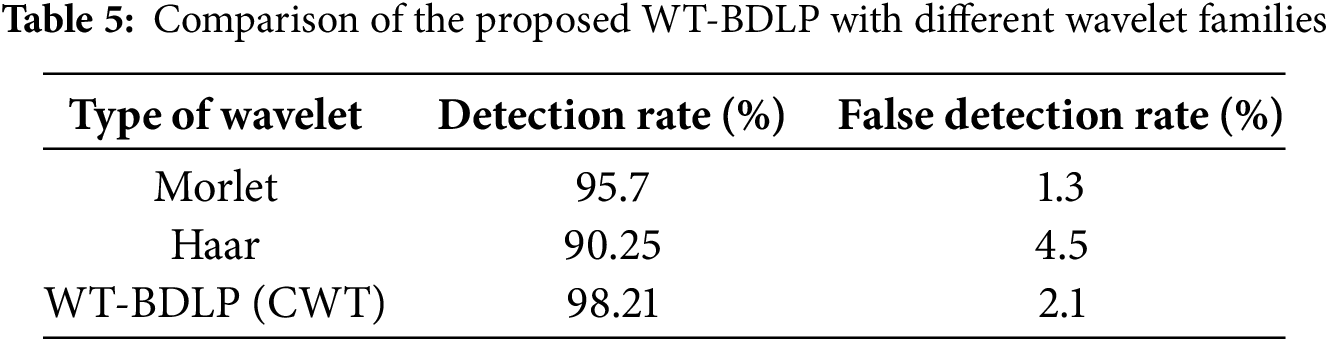
Table 5 provides a comparison of the proposed WT-BDLP framework with different wavelet families. The proposed WT-BDLP framework combines CWT with flexible basis selection, which is overall significantly better at anomaly detection in 6G edge work compared to classical wavelet families (Morlet and Haar). Morlet and Haar both have useful properties in terms of time-frequency localization (Morlet) and computational ease (Haar), but they lack flexibility when it comes to adaptive spatial-temporal traffic characterizations across multiple resolutions of traffic. The combination of CWT, Bayesian inference, and conditional variational autoencoders in WT-BDLP enables it to be more sensitive to transient anomalies against injection attacks.
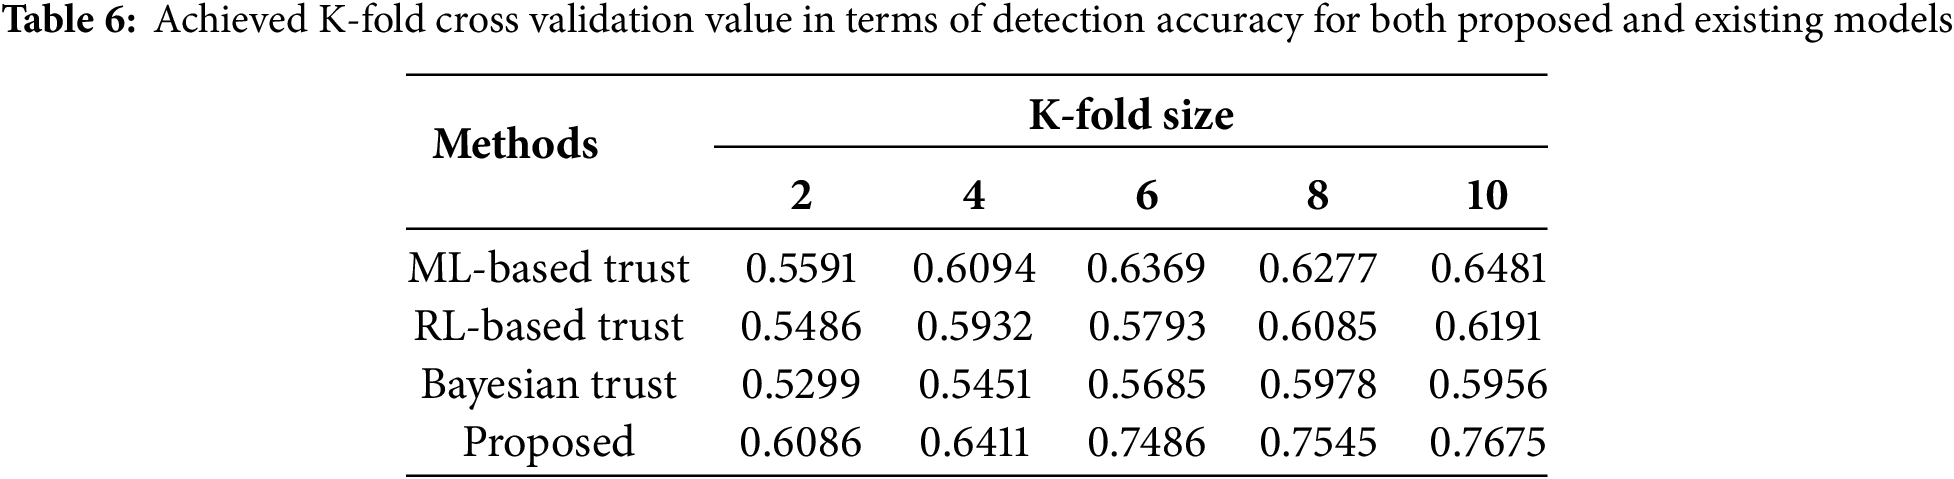
The WT-BDLP framework utilizes a 10-fold cross-validation approach to comprehensively assess the effectiveness of model detection when malicious data is injected into the data stream of edge environments. In this cross-validation approach, the dataset is randomized into 10 folds, with each serving as training, validation, and testing during each fold. For every fold, the model completes the entire learning process to help generalize model performance and eliminate bias. When each fold is performed, the BayI-LA-CVariAE-based classifier is activated in every fold for probabilistic learning and anomaly detection. The folds iteratively validate the functionalities of the model when changing traffic behaviors and trust management, thus improving model reliability. The proposed model demonstrated consistently improved accuracy over traditional models when analyzed over every fold, as seen in Table 6. Thus, this analysis demonstrates the ability of the proposed model to deal with the complexities of edge environments.
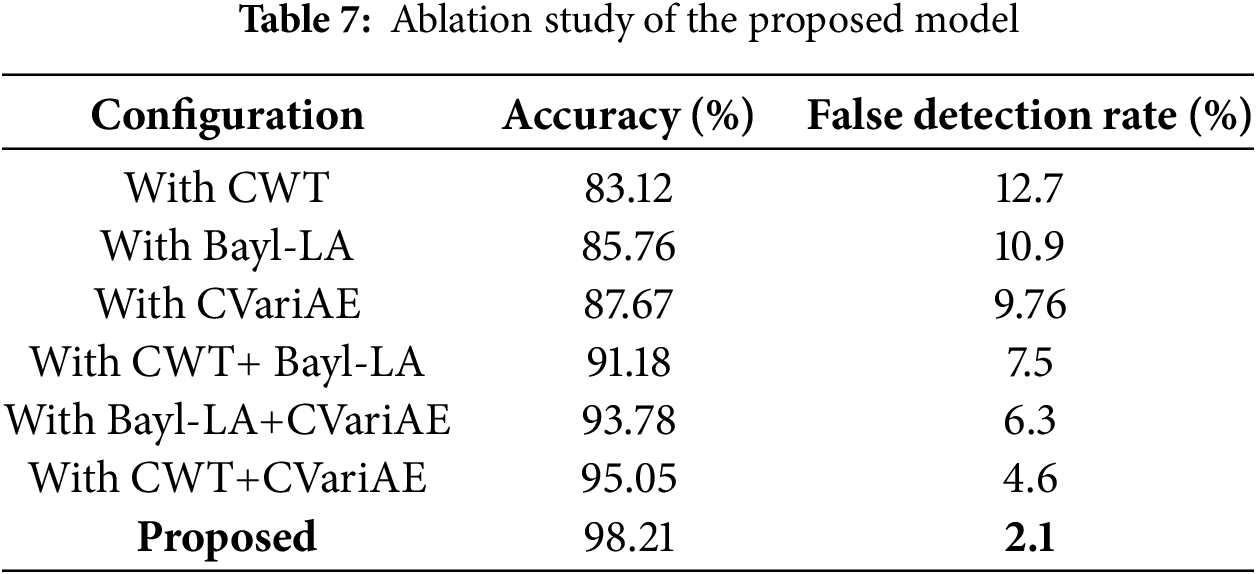
This part provides the ablation study to identify the efficiency of the proposed method. The basic forms of the CWT, BayI-LA, and CVariAE are important contributions to this research. Table 7 provides the ablation-type experiment of the proposed method. CWT is reasonable when used alone, but there is limited depth to the semantics, leading to moderate accuracy because it only addresses transient traffic anomalies and compatible scenarios. BayI-LA has strong probabilistic trust estimation alone, but it is poor at abstracting functionality and requires extra epochs to convergence, due to shallow meaning and information representation. CVariAE performed well when extracting predictors in latents and outlier features, and processed the time-sequence data contextually; however, it is weak on predicting futures. The highest accuracies for the anomaly detection module are when all three are integrated for anomalous traffic prediction. By using all three modules’ outputs, overall exceptional anomaly detection solutions are achieved to perform on the edge on 6G networks, and provide scalability.
4.5 Computational Complexity Analysis
The computational complexity of the combined WT-BDLP method arises from three main modules, particularly, Bay-LCVariAE, CWT, and hybrid filtering modules. In the Bay-LCVariAE, the encoding and decoding outlier detection is conducted over high-dimensional data, sampling the latent variable space for all samples, and producing KL divergence calculations. These aspects depend on the number of samples, or observations, and the number of features or variables, in a linear manner, resulting in a complexity of approximately
The WT-BDLP approach can be integrated into any security architecture as an added anomaly detection layer in edge computing environments. WT-BDLP builds upon existing systems by utilizing Bayesian inference and Conditional Variational Autoencoders to identify outliers, while the Continuous Wavelet Transform can be used to investigate traffic patterns. This modular design permits it to be plugged into existing trust management and intrusion detection systems without needing major architecture changes. Thereby, it provides real-time threat assessment along with enhanced scalability of the 6G network. The simulation used the representation of a malicious node of a varying percentage from 1% to 40%, in order to mimic different levels of threat, and the attacks persisted for at least 100-time frames to ensure robustness. Detection success rates and processing delays are tracked by calculating performance metrics like detection accuracy, false negatives, and false positives. Numerical methods are applied for handling spectral analysis and to model attacks, i.e., wavelet transform and solve differential equations (e.g., Runge-Kutta method). The noise power is estimated offline to significantly reduce the numerical error in real-time Corpuses which outputs a fair level of contamination. To avert experimental biases and errors, outlier simulations are discarded and rerun, and the result outputs are averaged over simulations to minimize variance. The statistical error less than 3.066% with a 99.7% confidence level, shows good internal validity in the findings. Also, by comparing detection rates to baseline techniques and examining consistency across various network sizes and attack kinds, the results were verified.
In addition, the WT-BDLP model provides adversarial robustness using Bayesian uncertainty quantification and multi-dimensional CWT analysis, yielding resilience towards deceiving traffic. Also, the latent encoding implemented through the CVariAE component provides an additional layer of subtle anomaly detection even when adversarial inputs are contrived. Moreover, the internal validity of the proposed method can be threatened by the dependence on synthetic attack scenarios and simulation environments, which might not accurately represent the unpredictability and complexity of real-world edge networks and cyber threats. As the experiments did rely on matlab simulations, with artificially generated data and attacks, the results may overestimate the potential effectiveness and scalability of the trust model in a controlled environment. The practical limitations surrounding real-time processing, physical hardware, and unpredictability in attack behavior may have major implications on the real-world efficacy of the model. On the other hand, the internal validity was potentially diminished based on the experimental setup, specifically the use of homogeneous network parameters, confined attack models, and the absence of actual 6G hardware or a heterogeneous network environment. This limits the findings’ generalizability to actual operating networks with diverse devices, traffic patterns, and attack vectors that may exhibit distinct behaviors from the simulated environments. Consequently, additional validation in real-world or more diverse environments is required to securely apply the inferences to practical deployments, even though the results show promising detection capabilities and scalability. Moreover, the CWT has a significant processing cost, particularly when used on a wide scale, because of its multi-resolution spectrum analysis. As the number of malicious nodes rises, scalability limitations exist, leading to longer convergence and detection times. If processing latency surpasses assault duration during quick, short-duration attacks, real-time responsiveness may be exposed.
In this research, a new probabilistic trust model, WT-BDLP, that combines Bayesian inference and wavelet-based traffic analysis, is proposed to help mitigate malicious data injection attacks in 6G edge networks. The WT-BDLP model calculates the probability that every given node is reliable. Initially, nodes exhibiting unusual behaviors are classified as outliers using the Bay-LCVariAE approach. In the next stage, the CWT is used to examine traffic patterns. Lastly, an analysis of the content and information coherence is conducted. The noise content and the sequences of anomalous information are identified by employing a hybrid filter in conjunction with a set of FIR filters. Simulation scenarios using the MATLAB suite are used to validate the WT-BDLP approach. A detection success rate of 93% with excellent linear scalability is demonstrated in two studies. Although the experiments demonstrated improved detection accuracy (up to 98.21%) and scalability across varying node densities, the implications for this study extend beyond the technical performance. Future work will focus on modifying the WT-BDLP framework for adversarial scenarios using adversarial training and uncertainty-aware defensive measures to protect against crafted attacks. Besides, the proposed method will intent to incorporate federated learning in order to develop decentralized trust modeling on edge nodes while preserving data privacy. Specifically, federated learning enables cooperative anomaly detection without divulging raw data, creating a more secure and scalable system for real-world 6G usage. Overall, these directions enhance robustness, privacy, and adaptability of the deployable framework in a dynamic edge environment.
Acknowledgement: Sincerely thank T-Mobile USA Inc., Axyom.Core, and the Saveetha Institute of Medical and Technical Sciences for providing the necessary support, infrastructure, and collaborative environment that enabled the successful completion of this research.
Funding Statement: The authors received no specific funding for this study.
Author Contributions: Conceptualization, Surendran Rajendran; methodology, Raghavendra Kulkarni; software, Binu Sudhakaran Pillai; validation, and Venkata Satya Suresh kumar Kondeti; formal analysis, Binu Sudhakaran Pillai; investigation, Venkata Satya Suresh kumar Kondeti; resources, Raghavendra Kulkarni; data curation, Surendran Rajendran; writing—original draft preparation, Surendran Rajendran; writing—review and editing, Venkata Satya Suresh kumar Kondeti; visualization, Binu Sudhakaran Pillai; supervision, Raghavendra Kulkarni; project administration, Raghavendra Kulkarni; funding acquisition, Binu Sudhakaran Pillai. All authors reviewed the results and approved the final version of the manuscript.
Availability of Data and Materials: The datasets generated and/or analyzed during the current study are available from the corresponding author upon reasonable request.
Ethics Approval: Not applicable.
Conflicts of Interest: The authors declare no conflicts of interest to report regarding the present study.
References
1. Suresh J, Kumari VS, Pillai NM, Jayarin PJ, David DB. Exploring advancements in 6G wireless networks for the future of high-speed connectivity. In: 2024 Second International Conference Computational and Characterization Techniques in Engineering & Sciences (IC3TES); 2024 Nov 15–16; Lucknow, India. p. 1–15. doi:10.1109/IC3TES62412.2024.10877618. [Google Scholar] [CrossRef]
2. Banafaa M, Shayea I, Din J, Hadri Azmi M, Alashbi A, Ibrahim Daradkeh Y, et al. 6G mobile communication technology: requirements, targets, applications, challenges, advantages, and opportunities. Alex Eng J. 2023;64:245–74. doi:10.1016/j.aej.2022.08.017. [Google Scholar] [CrossRef]
3. Pillai BS, Kulkarni R, Kondeti VSSK, CBW_CRNet RS. Chebyshev Beluga whale optimization based convolutional recurrent network for vehicle positioning and tracking for 6G networks. In: 2025 5th International Conference on Expert Clouds and Applications (ICOECA); 2025 Mar 6–7; Bengaluru, India. p. 269–75. doi:10.1109/ICOECA66273.2025.00053. [Google Scholar] [CrossRef]
4. Nallakaruppan MK, Dhanaraj RK, Shukla S, Krishnamoorthi S, Kaushal RK, Goyal MK, et al. A federated autoencoder framework with explainable AI for intelligent 6G-IoT infrastructure optimization. IEEE Internet Things J. 2025;1. doi:10.1109/JIOT.2025.3606232. [Google Scholar] [CrossRef]
5. Mondal S, Bepari D, Chandra A, Singh K, Li CP, Ding Z. A comprehensive survey on NOMA-based backscatter communication for IoT applications. IEEE Internet Things J. 2025;12(12):18929–53. doi:10.1109/JIOT.2025.3548581. [Google Scholar] [CrossRef]
6. George AS. 5G-Enabled digital transformation: mapping the landscape of possibilities and problems. Partners Universal Innov Res Publ. 2024;2(3):1–37. [Google Scholar]
7. Sharma M, Tomar A, Hazra A. Edge computing for industry 5.0: fundamental, applications, and research challenges. IEEE Internet Things J. 2024;11(11):19070–93. doi:10.1109/JIOT.2024.3359297. [Google Scholar] [CrossRef]
8. Sheraz M, Chuah TC, Lee YL, Alam MM, Al-Habashna A, Han Z. A comprehensive survey on revolutionizing connectivity through artificial intelligence-enabled digital twin network in 6G. IEEE Access. 2024;12(21):49184–215. doi:10.1109/access.2024.3384272. [Google Scholar] [CrossRef]
9. Kuzovkova TA, Sharavova OI, Sharavova MM. The role of 5G and 6G mobile communication technologies for industry 4.0 and the transition to industry 5.0. In: 2024 International Conference on Engineering Management of Communication and Technology (EMCTECH); 2024 Oct 16–18; Vienna, Austria: IEEE; 2024. p. 1–6. doi:10.1109/EMCTECH63049.2024.10741817. [Google Scholar] [CrossRef]
10. kumar Kondeti VSS, Kulkarni R, Pillai BS, Rajendran S. Slice-based 6G network with enhanced Manta ray deep reinforcement learning-driven proactive and robust resource management. Comput Mater Contin. 2025;84(3):4973–95. doi:10.32604/cmc.2025.066428. [Google Scholar] [CrossRef]
11. Suomalainen J, Ahmad I, Shajan A, Savunen T. Cybersecurity for tactical 6G networks: threats, architecture, and ntelligence. Future Gener Comput Syst. 2025;162(4):107500. doi:10.1016/j.future.2024.107500. [Google Scholar] [CrossRef]
12. Butt IN, Shah S. The convergence of artificial intelligence and 6G networks: a trans-formative shift in computing and communications. J Eng Computat Intell Rev. 2025;3(1):68–81. [Google Scholar]
13. Patel P, Rathore N, Naik RR, Patel V, Zuhair M. A review on 6G communication: applications, challenges, use cases, and future prospects. In: Intelligent computing and communication techniques. Boca Raton, FL, USA: CRC Press; 2025. p. 651–6. doi:10.1201/9781003530190-92. [Google Scholar] [CrossRef]
14. Dhanalakshmi S, Devi TA, Agarwal R, Alzubaidi LH, Senthil Kumar S, Prakalya SB. AI-based network traffic prioritization for latency-sensitive applications in 6G networks. In: 2024 International Conference on IoT, Communication and Automation Technology (ICICAT); 2024 Nov 23–24; Gorakhpur, India. p. 947–51. doi:10.1109/ICICAT62666.2024.10922974. [Google Scholar] [CrossRef]
15. Rifa-Pous H, Garcia-Font V, Nunez-Gomez C, Salas J. Security, trust and privacy challenges in AI-driven 6G networks. arXiv:2409.10337. 2024. [Google Scholar]
16. Sangeetha K, Arulanandam K. Adaptive trust-based secure routing protocol with reinforced anomaly detection for IoT networks. Int J Smart Sens Intell Syst. 2025;18(1):20250032. doi:10.2478/ijssis-2025-0032. [Google Scholar] [CrossRef]
17. Devi R, Kumari N, Gill S. Enhancing distributed denial of service cloud security threats using artificial neural networks in 6G networks. In: Network security and data privacy in 6G communication. Boca Raton, FL, USA: CRC Press; 2025. p. 254–75. doi:10.1201/9781003583127-13. [Google Scholar] [CrossRef]
18. Sanjalawe Y, Fraihat S, Al-E’Mari S, Abualhaj M, Makhadmeh S, Alzubi E. A review of 6G and AI convergence: enhancing communication networks with artificial intelligence. IEEE Open J Commun Soc. 2025;6(2):2308–55. doi:10.1109/ojcoms.2025.3553302. [Google Scholar] [CrossRef]
19. Sun Z, Liang J, Yin L, Xu P, Li C, Wan J, et al. A data attack detection framework for cryptography-based secure aggregation methods in 6G intelligent applications. Electronics. 2024;13(11):1999. doi:10.3390/electronics13111999. [Google Scholar] [CrossRef]
20. Chinnasamy P, Samrin R, Ben Sujitha B, Augasthega R, Rajagopal M, Nageswaran A. Integrating intelligent breach detection system into 6g enabled smart grid-based cyber physical systems. Wirel Pers Commun. 2024;11(2):1–16. doi:10.1007/s11277-024-11192-2. [Google Scholar] [CrossRef]
21. El-Hajj M. Secure and trustworthy open radio access network (O-RAN) optimization: a zero-trust and federated learning framework for 6G networks. Fut Internet. 2025;17(6):233. doi:10.3390/fi17060233. [Google Scholar] [CrossRef]
22. Khowaja SA, Khuwaja P, Dev K, Singh K, Li X, Bartzoudis N, et al. Block encryption LAyer (BELAzero-trust defense against model inversion attacks for federated learning in 5G/6G systems. IEEE Open J Commun Soc. 2025;6:807–19. doi:10.1109/ojcoms.2025.3526768. [Google Scholar] [CrossRef]
23. Sakraoui S, Ahmim A, Derdour M, Ahmim M, Namane S, Ben Dhaou I. FBMP-IDS: FL-based blockchain-powered lightweight MPC-secured IDS for 6G networks. IEEE Access. 2024;12:105887–905. doi:10.1109/access.2024.3435920. [Google Scholar] [CrossRef]
24. Kesici M, Pal B, Yang G. Detection of false data injection attacks in distribution networks: a vertical federated learning approach. IEEE Trans Smart Grid. 2024;15(6):5952–64. doi:10.1109/tsg.2024.3399396. [Google Scholar] [CrossRef]
25. Sharma A, Rani S. Enhancing 6G-IoT network security: a trustworthy and responsible AI-driven stacked-hybrid model for attack detection. IEEE Internet Things J. 2025;1. doi:10.1109/JIOT.2025.3566403. [Google Scholar] [CrossRef]
26. Siddique MF, Saleem F, Umar M, Kim CH, Kim JM. A hybrid deep learning approach for bearing fault diagnosis using continuous wavelet transform and attention-enhanced spatiotemporal feature extraction. Sensors. 2025;25(9):2712. doi:10.3390/s25092712. [Google Scholar] [PubMed] [CrossRef]
27. Chang HY, Chang RY, Chung WH, Salahdine F, Han T, Zhang N. Bayesian-based weighted scheme for wireless vital sign estimation in small data conditions, 5G, 6G, and beyond: recent advances and future challenges. IEEE Sens J. 2023;25(10):17782–94. doi:10.1007/s12243-022-00938-3. [Google Scholar] [CrossRef]
28. Ali Haider Z, Zeb A, Rahman T, Singh SK, Akram R, Arishi A, et al. A survey on anomaly detection in IoT: techniques, challenges, and opportunities with the integration of 6G. Comput Netw. 2025;270(7):111484. doi:10.1016/j.comnet.2025.111484. [Google Scholar] [CrossRef]
29. Ullah I, Arishi A, Singh SK, Alharbi F, Ibrahim AH, Islam M, et al. Autonomous network management for 6G communication: a comprehensive survey. Digit Commun Netw. 2025;S2352864825001129. doi:10.1016/j.dcan.2025.07.001. [Google Scholar] [CrossRef]
30. Bharathi PS, Raj MM. Graph neural networks for intrusion detection in next-generation 6G networks: a cybersecurity perspective. In: 2025 6th International Conference on Intelligent Communication Technologies and Virtual Mobile Networks (ICICV); 2025 Jun 17–19; Tirunelveli, India. p. 1306–12. doi:10.1109/ICICV64824.2025.11085785. [Google Scholar] [CrossRef]
Cite This Article
 Copyright © 2025 The Author(s). Published by Tech Science Press.
This work is licensed under a Creative Commons Attribution 4.0 International License , which permits unrestricted use, distribution, and reproduction in any medium, provided the original work is properly cited.
 Downloads
 Citation Tools