
 Submit a Paper
 Propose a Special lssue
 Open Access
ARTICLE

IoT Based Transmission Line Fault Classification Using Regularized RBF-ELM and Virtual PMU in a Smart Grid
1 Department of Electrical and Electronics Engineering, NIST University, Berhampur, 761008, India
2 Department of Computer Science and Engineering, Institute of Technical Education and Research, Siksha-O-Anusandhan University, Bhubaneswar, 751030, India
3 School of Electronics Engineering, Kalinga Institute of Industrial Technology, Bhubaneswar, 751024, India
4 Piteşti University Centre, The National University of Science and Technology POLITEHNICA Bucharest, Pitesti, 110040, Romania
5 ICSI Energy, National Research and Development Institute for Cryogenic and Isotopic Technologies, Râmnicu Vâlcea, 240050, România
* Corresponding Authors: Murthy Cherukuri. Email: ; Bhargav Appasani. Email:
(This article belongs to the Special Issue: Advanced Artificial Intelligence and Machine Learning Methods Applied to Energy Systems)
Computer Modeling in Engineering & Sciences 2025, 145(2), 1993-2015. https://doi.org/10.32604/cmes.2025.067121
Received 25 April 2025; Accepted 15 October 2025; Issue published 26 November 2025
 View Full Text
 Download PDF
Abstract
Transmission line faults pose a significant threat to power system resilience, underscoring the need for accurate and rapid fault identification to facilitate proper resource monitoring, economic loss prevention, and blackout avoidance. Extreme learning machine (ELM) offers a compelling solution for rapid classification, achieving network training in a single epoch. Leveraging the Internet of Things (IoT) and the virtual instrumentation capabilities of LabVIEW, ELM can enable the swift and precise identification of transmission line faults. This paper presents a regularized radial basis function (RBF) ELM-based fault detection and classification system for transmission lines, utilizing a LabVIEW based virtual phasor measurement unit (PMU) and IoT sensors. The transmission line fault is identified using the phaselet algorithm applied to the phase current acquired from the virtual PMU. Classification is then performed using the ELM algorithm. The proposed methodology is validated in real-time on a practical transmission line, achieving an accuracy of 99.46%. This has the potential to significantly influence future fault detection strategies incorporating virtual PMUs and machine learning.Keywords
The power system has transformed its structure, functionality, and complexity over the past century. From a simple network of few entities, it has expanded into a complex system of various devices that share energy and information [1]. This evolved power grid is referred to as the smart grid. The main aim of the smart grid is to deliver reliable power transfer with the aid of emerging communication and computational technologies [2]. Transmission lines play a crucial role in the smart grid as they efficiently deliver a large amount of electric power over long distances, from generating stations to consumers. These transmission lines constitute a significant portion of the smart grid’s infrastructure. Their exposure to environmental conditions makes them susceptible to faults caused by various natural calamities. It is imperative to promptly address these faults to prevent cascading failures and ensure the grid’s stability [3]. Widespread power outages from such failures can severely impact essential services like water supply and communication networks [4–6]. Moreover, they have significant implications for the state’s energy industry and the National Electricity Market. Consequently, there is a growing research interest in analyzing transmission line faults.
Real-time monitoring and fault analysis are crucial for the early detection of transmission line faults and the swift restoration of power following outages. Traditional approaches relied on Supervisory Control and Data Acquisition (SCADA) systems. However, SCADA-based systems are known for their slow response time, with reporting rates typically limited to a few seconds per sample. This sluggishness hinders the efficient analysis of faults. Fortunately, technological advancements and the integration of digital signal processing techniques into real-time processors, such as Phasor Measurement Units (PMUs), have revolutionized fault analysis in a smart grid [7,8]. PMUs offer rapid fault identification by reporting 30–60 samples per second, enabling immediate decision-making for relay switching to protect transmission lines from imminent faults [9].
The utilization of PMU measurements for fault analysis offers notable advantages, primarily due to its high reporting rate. This enables the dynamic visualization of power system behavior, facilitating rapid monitoring and control of power system events [10]. In conventional PMUs, computations are performed using the Discrete Fourier Transform (DFT) algorithm [11], necessitating a minimum data window of one cycle to compute the phasor. Consequently, for AC signals at 50/60 Hz, this corresponds to a minimum time requirement of 20 ms. However, the phaselet algorithm, an alternative approach, computes the phasor using smaller data windows, resulting in reduced computation time compared to the DFT algorithm [12].
Nevertheless, when employing smaller data windows, there is a trade-off between the capability to reject harmonics and DC offset [13]. A data window of ¼ cycle is preferable to strike a balance, ensuring efficient fault detection and classification. Consequently, fault detection and classification based on the phaselet algorithm can be achieved within a minimum time frame of 5 ms, significantly faster than conventional techniques. Machine learning algorithms have garnered significant attention for fault classification across various application domains. Techniques such as k-nearest Neighbors (KNN), fuzzy systems, support vector machines (SVMs), artificial neural networks, decision trees, and mathematical morphology have been integrated with signal processing techniques to provide promising avenues for accurate fault classification [14].
The contemporary power system has evolved into an apex engineering achievement, with many associated units scattered across a vast geographical region. Therefore, PMUs have been developed as analogous power system monitoring devices [15]. PMUs when placed optimally can provide complete observability of the power system [16].
PMUs provide synchronized phasor measurements that can be used to build wide-area severity indices, which are then input into data mining techniques including decision trees, random forests, neural networks, and support vector machines to balance transparency and accuracy [17]. An empirical mode decomposition and SVM-based fault classification for three-phase fault classification is presented in [18]. The empirical mode decomposition and Hilbert Huang Transform are used for feature extraction, and the support vector machine is used for three fault classifications. A multiresolution wavelet and artificial neural network-based method is adopted in [19] for fault detection and localization in DC microgrids. A fuzzy logic-based fault classification of a series compensated transmission line [20] uses the DFT of phase current, phase voltage, and zero-sequence current. A fault diagnosis was presented in [21] using the two-stage evolutionary extreme learning machine and the artificial bee colony optimization algorithm. A transmission line fault detection and classification based on its three-phase current signal using the linear regression coefficient indices of the current values is presented in [22]. Another based on two PMU measurements has been reported in [23], which can accurately classify the fault type.
Ensemble learning and explainable AI (XAI) based transmission line fault detection has been proposed in [24]. A deep learning based fault classification approach using two PMU measurements has been reported in [25]. SVM and random forest algorithms were used for classification of faults in IEEE 14 bus system incorporating PMU measurements [26]. An online fault classification approach based on SVM has been reported based on simulation in [27]. PMU measurements were obtained from a transmission line model and random forest was used to detect the faults in [28]. A transmission line fault classification and localization technique based on extreme learning machine (ELM) has been presented in [29]. The study used PMU data obtained from a simulation. In [30], a kNN based approach has been used to classify different transmission line faults with an accuracy of 98%, based of simulation data. In [31], a ensemble machine learning models were used to identify transmission line faults. The authors have achieved a remarkable accuracy of 99.96%. Using PMU data from a simulated IEEE bus system, fault localization and classification has been performed in [32]. However, these works used data from an experimental setup to validate their methods.
Machine learning-based fault classification approaches were reported in [33,34] based on an experimental setup and experimental data. In [35], ELM was used to detect transmission line faults based on experimental data. However, these approaches did not use Internet of things (IoT) nor did they consider using radial basis function (RBF) to activate the hidden layer in the ELM. In this work, RBF is used for activation along with regularization in addition to the use of ELM. The optimum value of the regularization coefficient and the kernel parameters have been obtained to get the best classification results using the ELM.
Most of the existing research in the literature has primarily focused on applying learning techniques to simulated data, often assuming ideal conditions. However, the applicability of these results to real-time practical scenarios may be limited due to various complexities encountered at the hardware level during data acquisition, the implementation of digital signal processing algorithms on real-time processors, and transmission delays. This study proposes a Laboratory Virtual Instrument Engineering Workbench (LabVIEW)-based virtual instrument to demonstrate fault detection and classification using the extreme learning machine (ELM) algorithm with real-time signals in practical cases. LabVIEW is a graphical programming environment developed by National Instruments (NI). It is widely used for data acquisition, instrument control, developing virtual instruments, and industrial automation. The LabVIEW tool can swiftly acquire measurements, which is particularly advantageous for real-time monitoring. The dataflow architecture of LabVIEW facilitates parallel processing, enabling the simultaneous incorporation of multiple parameters. Furthermore, LabVIEW seamlessly integrates with Field Programmable Gate Array (FPGA) high-speed processors (such as NI-compact RIO) for real-time applications, enhancing the efficiency and ease of transmission line fault monitoring, classification, and protection. Its user-friendly integration with software programming languages like MATLAB, Python, and C programming adds to its flexibility for various programming environments. The proposed work’s unique contributions can be broadly segregated into the following aspects:
i. Virtual PMU based on LabVIEW for the graphical visualization of phasor data. The virtual PMU was implemented using the Compact RIO (c-RIO) FPGA processor, which can be reused for building other instruments. This drastically reduces equipment costs, as the same physical hardware can be reused for developing other instruments, unlike conventional PMUs that use dedicated hardware for phasor measurements. Furthermore, maintenance and installation charges are also reduced.
ii. The phaselet algorithm enables faster fault detection compared to the DFT algorithm, as it computes the phasor using a smaller data window. The phaselet algorithm is embedded into the c-RIO FPGA processor that transfers the phasors to the PDC for visualizations wirelessly. An IoT device is any physical object that can connect to the internet and interact with other devices and systems over the network. These devices are equipped with sensors, software, and other technologies that allow them to collect, exchange, and act upon data. Here the c-RIO can acquire the three-phase current and voltage data, compute the phasors using the phaselet algorithm and communicates the data with the server. In this regard, the setup has been considered an IoT platform.
iii. The use of RBF-ELM with regularization for rapid real-time detection of faults on transmission lines.
The research is the first to use a virtual PMU, IoT, and ELM to detect and classify. This would pave the foundation for future research on virtual PMUs and machine-learning techniques in smart grids.
The following section presents the proposed methodology for faster real-time fault detection and classification. Section 3 presents the proposed system’s experimental setup and the LabVIEW-based virtual PMU. Section 4 presents the experimental results and the classification accuracy achieved using ELM. Also, comparisons are drawn with the latest transmission line fault classification research. Finally, the article ends with the conclusion and future research.
2 Proposed Methodology for Fault Detection and Classification
PMUs are integral components of modern power systems, offering precise, real-time measurements of electrical quantities. They are designed to measure voltage and current phasors (a complex number indicating the magnitude and phase angle of the sinusoidal component of the signal) in real-time, providing synchronized phasor measurements, including magnitude and phase angle. PMUs are strategically installed across the power grid and utilize GPS for precise time synchronization, enabling wide-area monitoring, control, and protection of power systems. This helps in detecting disturbances, maintaining grid stability, and optimizing system operation. The measurements from PMUs are transmitted to a central control center for analysis, visualization, and enhanced situational awareness. By improving reliability and resilience, PMUs contribute to the overall efficiency of the electrical grid. PMUs operate through a series of steps involving voltage and current sensing, analog-to-digital conversion (ADC), time synchronization, phasor computation, and data transmission. Initially, PMUs are equipped with voltage and current sensors that measure electrical quantities at different points in the power grid. These sensors are connected to voltage and current acquisition modules, which capture the analog signals of the electrical quantities. The analog signals are then sampled at high rates to capture the instantaneous values of voltage and current. This high sampling rate ensures accurate representation of the signal, which is then converted into digital form using ADCs, making it ready for further digital processing. A GPS receiver is used to provide precise time synchronization, collecting time tags, coordinates, and a one-pulse-per-second (PPS) signal. The PPS signal is critical for ensuring that all PMUs across the grid are synchronized to a common time reference, usually Coordinated Universal Time (UTC). This allows for the comparison of measurements from different PMUs with high temporal accuracy. The digitized voltage and current signals are then processed using digital signal processing (DSP) techniques to compute the phasors. A common method employed is the Discrete Fourier Transform (DFT) or Fast Fourier Transform (FFT) applied to the sampled data. This technique extracts the fundamental frequency component, which is represented as a phasor. The magnitude represents the RMS value of the signal, and the phase angle indicates its phase relative to the GPS time reference. After computing the phasors, the data, along with time stamps, is transmitted to a central control center using various communication protocols such as Transmission Control Protocol (TCP), User Datagram Protocol (UDP), or specialized power system communication protocols. The data is usually transmitted in real-time or near-real-time, enabling timely analysis and decision-making.
Phasor computation involves several detailed steps. First, the voltage and current waveforms are sampled at a rate much higher than the power system frequency (e.g., 50 Hz or 60 Hz). The sampled data is processed in segments or windows, often consisting of several cycles of the fundamental frequency. For each window, the DFT is computed to extract the fundamental frequency component, decomposing the signal into its constituent frequencies and identifying the amplitude and phase of each frequency component. From the DFT, the fundamental frequency component is isolated, with its amplitude giving the magnitude of the phasor and the phase information providing the phase angle relative to the time reference. To reduce noise and enhance measurement accuracy, filtering techniques such as low-pass filters or moving average filters may be applied to the phasor data. At the central control center, phasor data from multiple PMUs deployed across the power grid is aggregated and visualized using advanced software tools, providing operators with real-time situational awareness of the grid’s state. The data is analyzed to detect disturbances, such as faults or oscillations, and to assess grid stability. Advanced algorithms and analytics are employed to predict potential issues and recommend corrective actions. PMU data is also used to implement wide-area control schemes, such as load shedding, generation adjustments, and islanding operations, to maintain grid stability. Protection systems leverage PMU data for faster and more accurate fault detection and isolation.
2.1 Fault Detection Using Phaselet Coefficient
PMU data can be used for fault detection in transmission lines, and is illustrated in Fig. 1. A three-phase AC generator produces electricity, which is then stepped up in voltage by a step-up transformer at the sending end bus. The electricity continues through the transmission line to the receiving end bus, where a step-down transformer reduces the voltage to a suitable level for the three-phase load. The PMU measures the three-phase voltage and current phasors on the transmission line in a two bus system, and these measurements are processed for fault detection and classification, identifying any anomalies in the system. If a fault is detected, a trip signal is sent to the circuit breaker, interrupting the current flow to prevent damage. This setup enhances the power system’s reliability by enabling real-time monitoring and rapid response to transmission line faults.
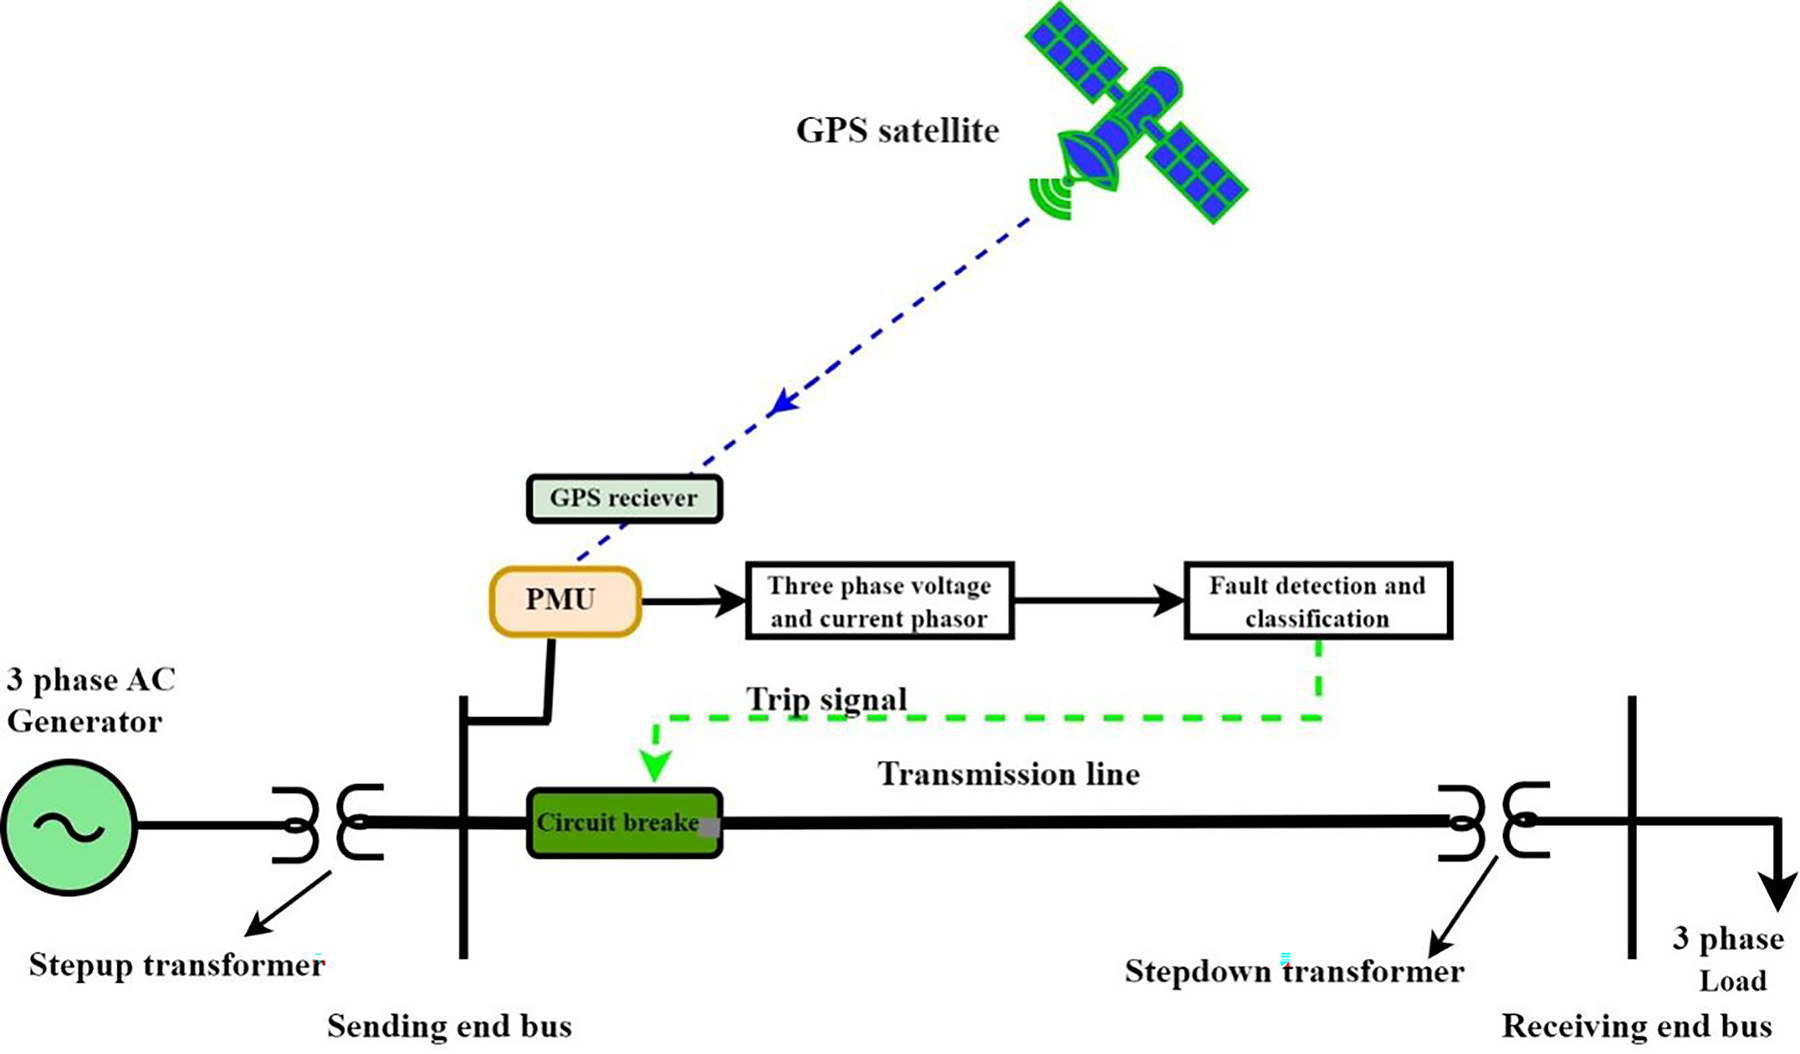
Figure 1: Single-line diagram of a two-bus system
The need for using the Phaselet algorithm rather than the traditional DFT is underscored by its enhanced speed and accuracy in fault detection and situational awareness in power systems. Traditional DFT methods typically operate at 50 frames per second for a 50 Hz AC signal, requiring a full cycle (20 ms) for fault perception. In contrast, the Phaselet algorithm, as depicted in Fig. 2, uses current samples from a quarter-cycle window to rapidly detect and characterize faults within a power system. The figure visually illustrates the core principle of the Phaselet algorithm: the use of a quarter-cycle window for fault detection. It shows a sinusoidal waveform representing the AC current signal, with a specific segment highlighted to represent this quarter-cycle window. This visual emphasizes that only this portion of the signal is being analyzed at a given time, enabling rapid fault detection. The figure reinforces the concept that the Phaselet algorithm uses current samples from just a quarter of the cycle to track instantaneous phase and compute phasors, significantly reducing the time needed for fault detection (to as little as 5 ms) compared to traditional methods that require a full cycle (20 ms). Additionally, the Phaselet transformation operates in the frequency domain, making it less susceptible to variations in fault impedance and inception angles. This robustness allows for more accurate and reliable fault detection, irrespective of the nature and location of the fault within the power grid. The phasor computation performed using the Phaselet algorithm, using three-phase current samples from a quarter-cycle window, are presented in Eq. (1).
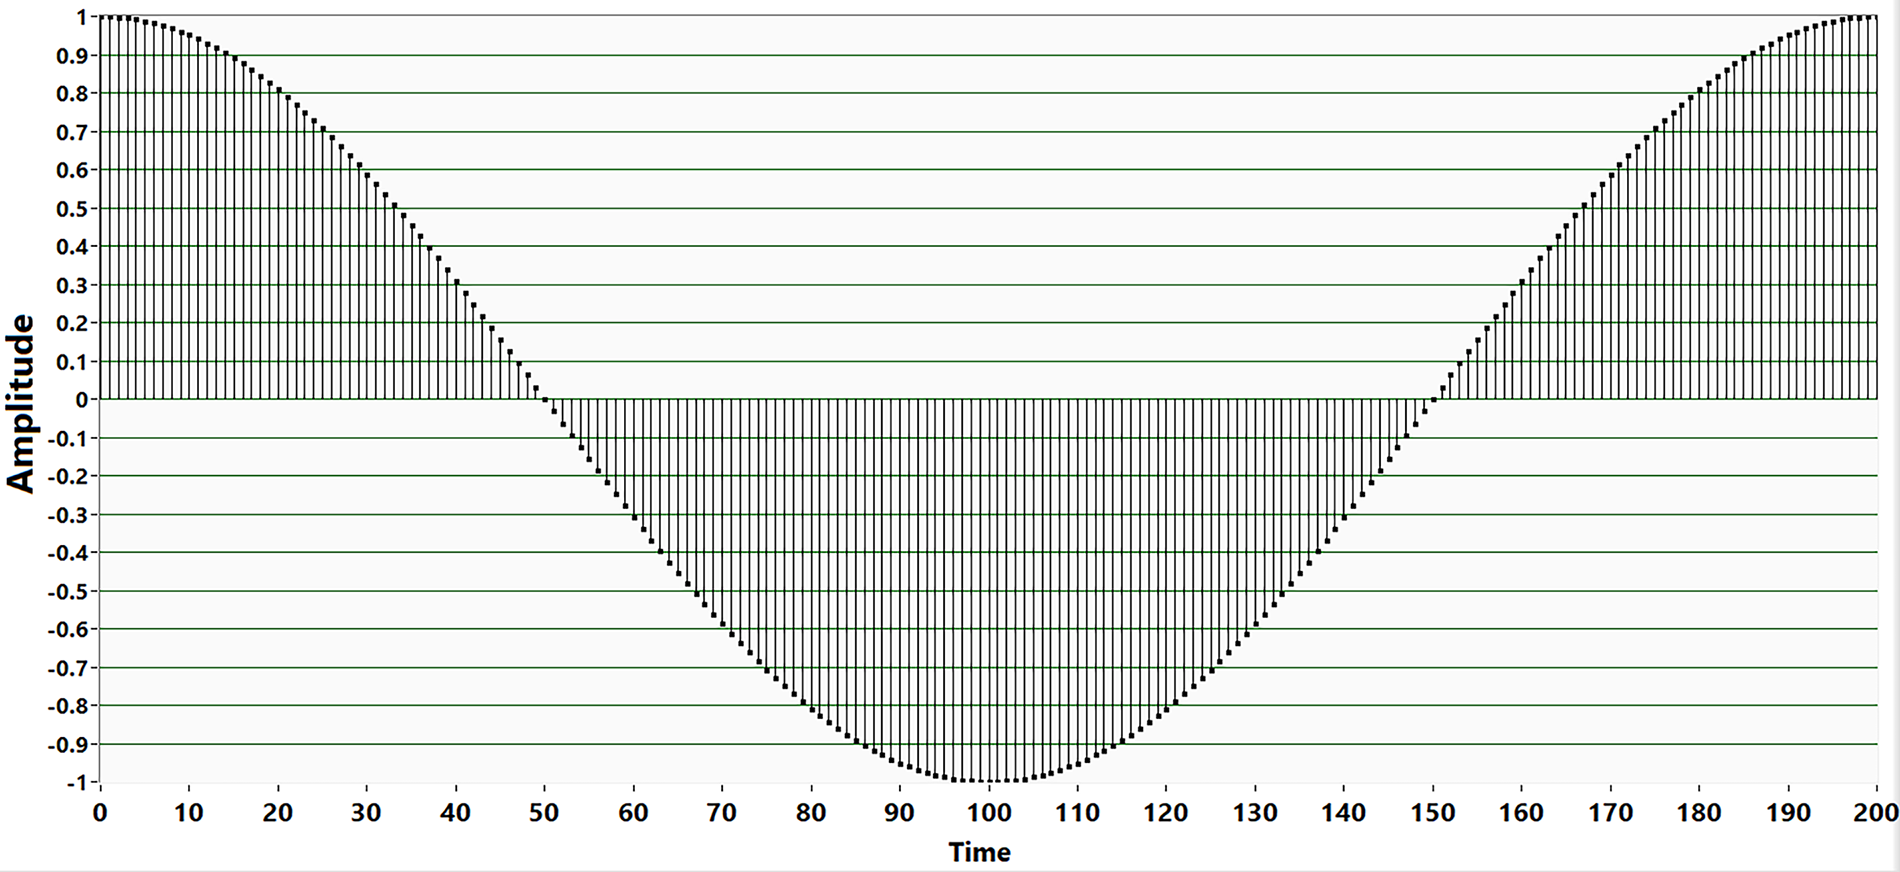
Figure 2: Phaselet computation using a quarter cycle window
where,
It uses only a three-phase current to detect and classify the fault. The fault detection is accomplished based on two consecutive quarter cycles’ phasor magnitude and phase angle difference. When the phasor magnitude and phase angle exceed the threshold value, fault detection is indicated. As the phasor computation uses a quarter cycle, it quickly detects the fault [36]. Once a fault is detected, it is classified using the RBF ELM, and the trip signal is sent to the respective circuit breaker.
2.2 Fault Classification Using Phaselets
The classification is performed based on the features extracted from the three-phase current using the Phaselet coefficients of equivalent current phasor angle (ECPA) form using Eqs. (2)–(4) [30].
where, IA, IB, and IC are the three-phase current obtained from the transmission line. Id(n) and Iq(n) are the direct and quadrature axis current components.
The ECPA (Δei) is computed using Eq. (3):
The phaselet coefficient of ECPA at different frequencies is obtained using Eq. (4).
where, ϕpl(0) is the phaselet coefficient of ECPA for DC (0 Hz).
where, ϕpl(1), ϕpl(2), ϕpl(3), and ϕpl(4) are the phaselet coefficient of the ECPA at fundamental, second harmonics, third harmonics and fourth harmonics. The coefficients are considered up to fourth harmonics because the values of higher harmonics beyond are very negligible [33].
ELM represents a three-layer feed-forward neural network featuring an input layer with ninput neurons, a hidden layer with nhidden neurons, and an output layer with nout neurons, as illustrated in Fig. 3. ELM exhibits a significantly accelerated learning rate in comparison to conventional neural networks. The output function of hidden layer of the ELM is determined using Eq. (5).
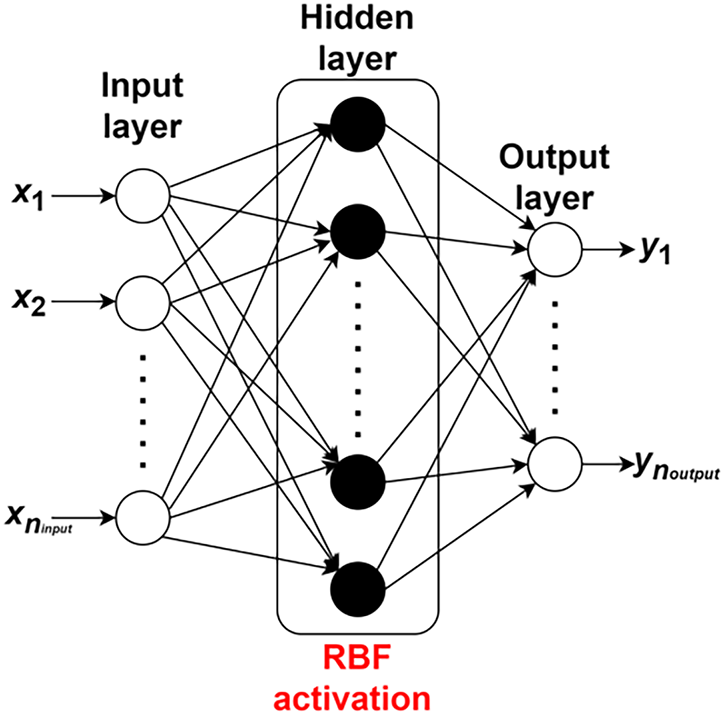
Figure 3: Topology of RBF-ELM
where fh(x) is the hidden layer output for the sample input x, and θh is the weight vector between the input layer and the hidden layer, Gh is the hidden layer’s activation function, θ0h is the bias of the hidden layer. The activation function used in this work is the Gaussian RBF given by Eq. (6) [37].
RBF-ELM is more beneficial than using a standard ELM due to its enhanced learning capabilities and improved performance metrics. The RBF-ELM leverages the radial basis function as its activation function in the hidden layer, which provides better approximation capabilities for non-linear functions. This results in improved accuracy and robustness in classification and regression tasks. Additionally, the localized response of RBF neurons helps in better capturing the patterns within the data, thereby improving the overall generalization ability of the model. The output of the hidden layer is mapped to the targets using the Eq. (7).
where, y denotes the target outputs. Finally, the Eq. (8) is used to calculate the output layer weights:
where,
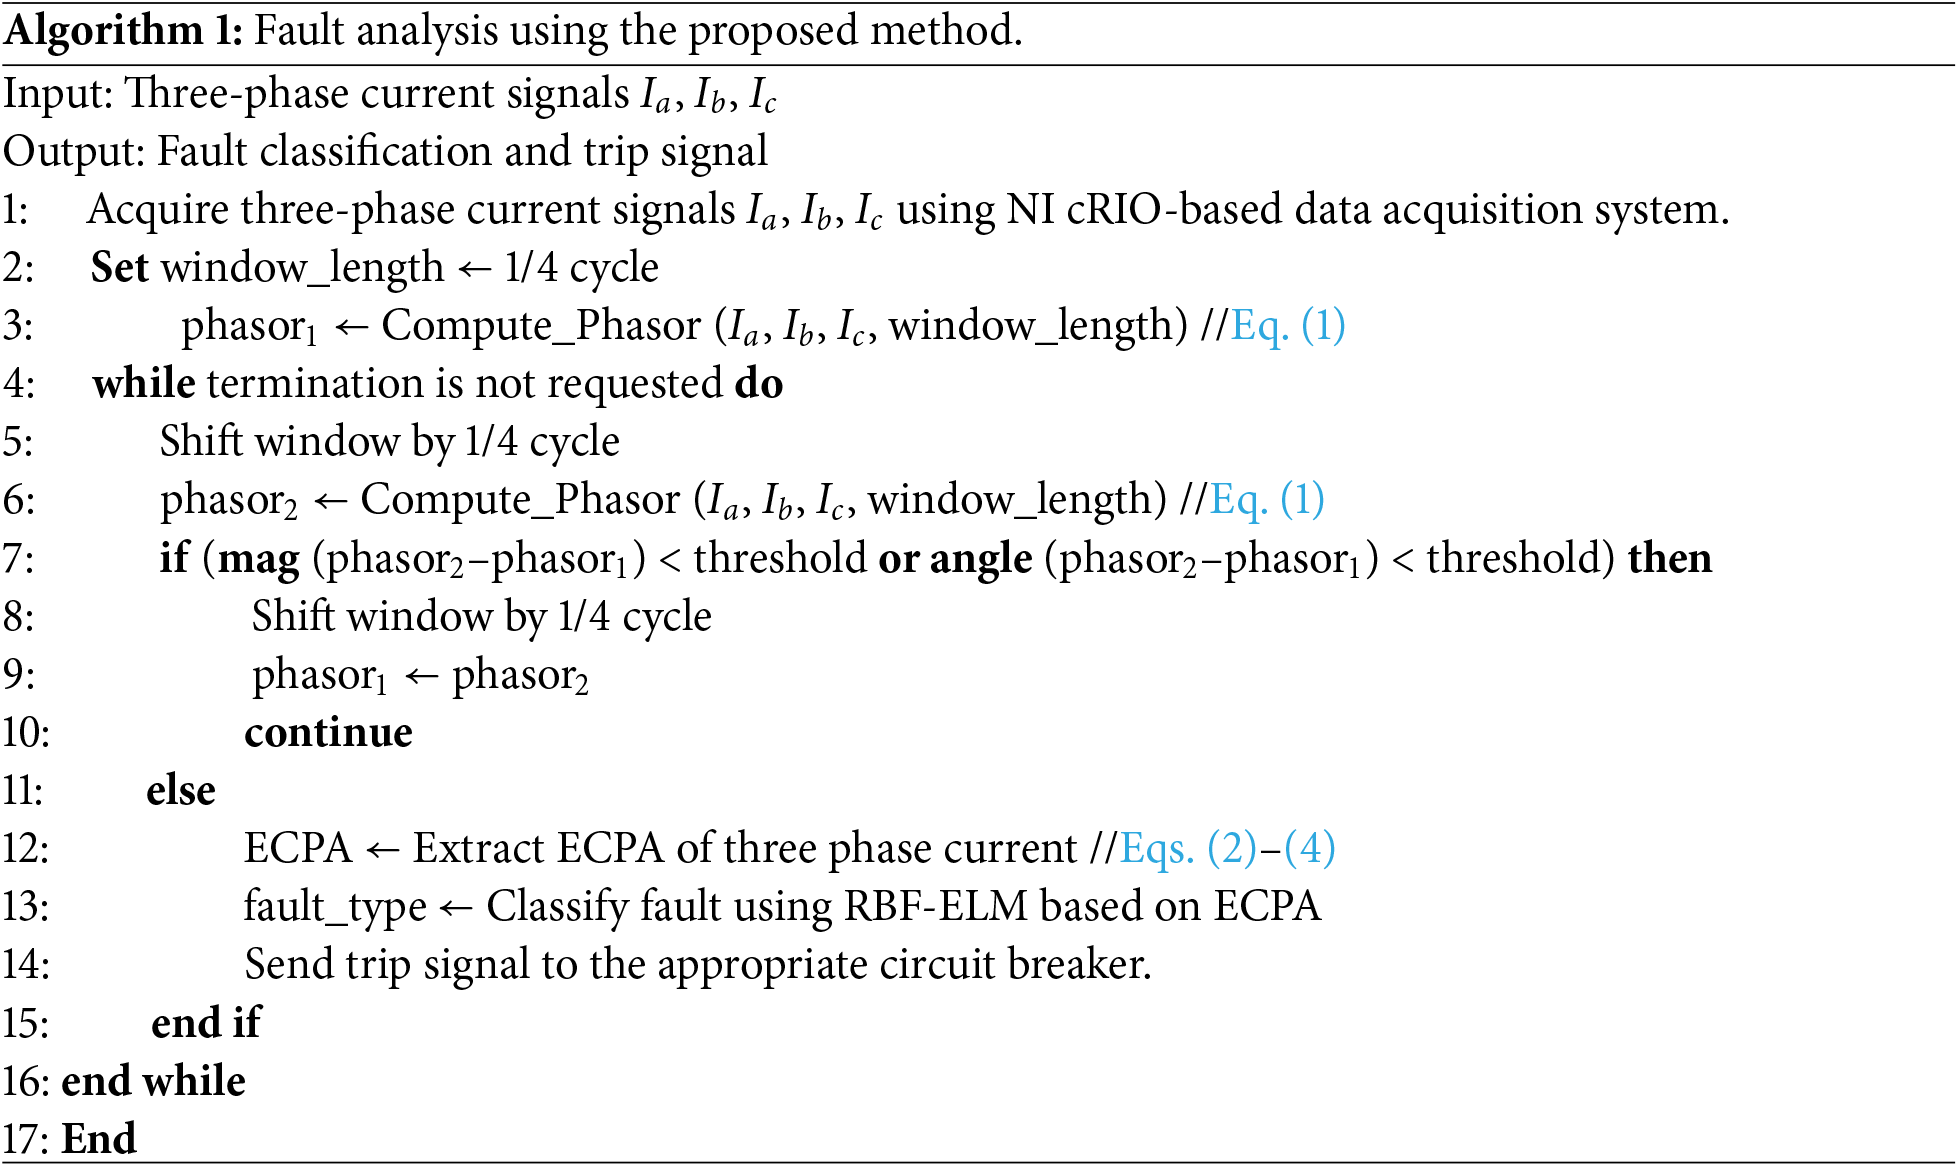
For fault classification in transmission lines, using ELM is more beneficial compared to other techniques due to its significantly faster learning speed and higher accuracy. Unlike traditional neural networks that often rely on iterative tuning processes, ELM assigns random weights to hidden nodes and analytically determines output weights, leading to faster training times. Additionally, ELM exhibits robust performance in classification tasks. The pseudo-code of fault analysis using the RBF ELM technique is shown in Algorithm 1, and the description of RBF ELM is provided in the subsequent sections. The time complexity of the algorithm is O (m), where m is the number of cycles. The flowchart of the algorithm is shown in Fig. 4.
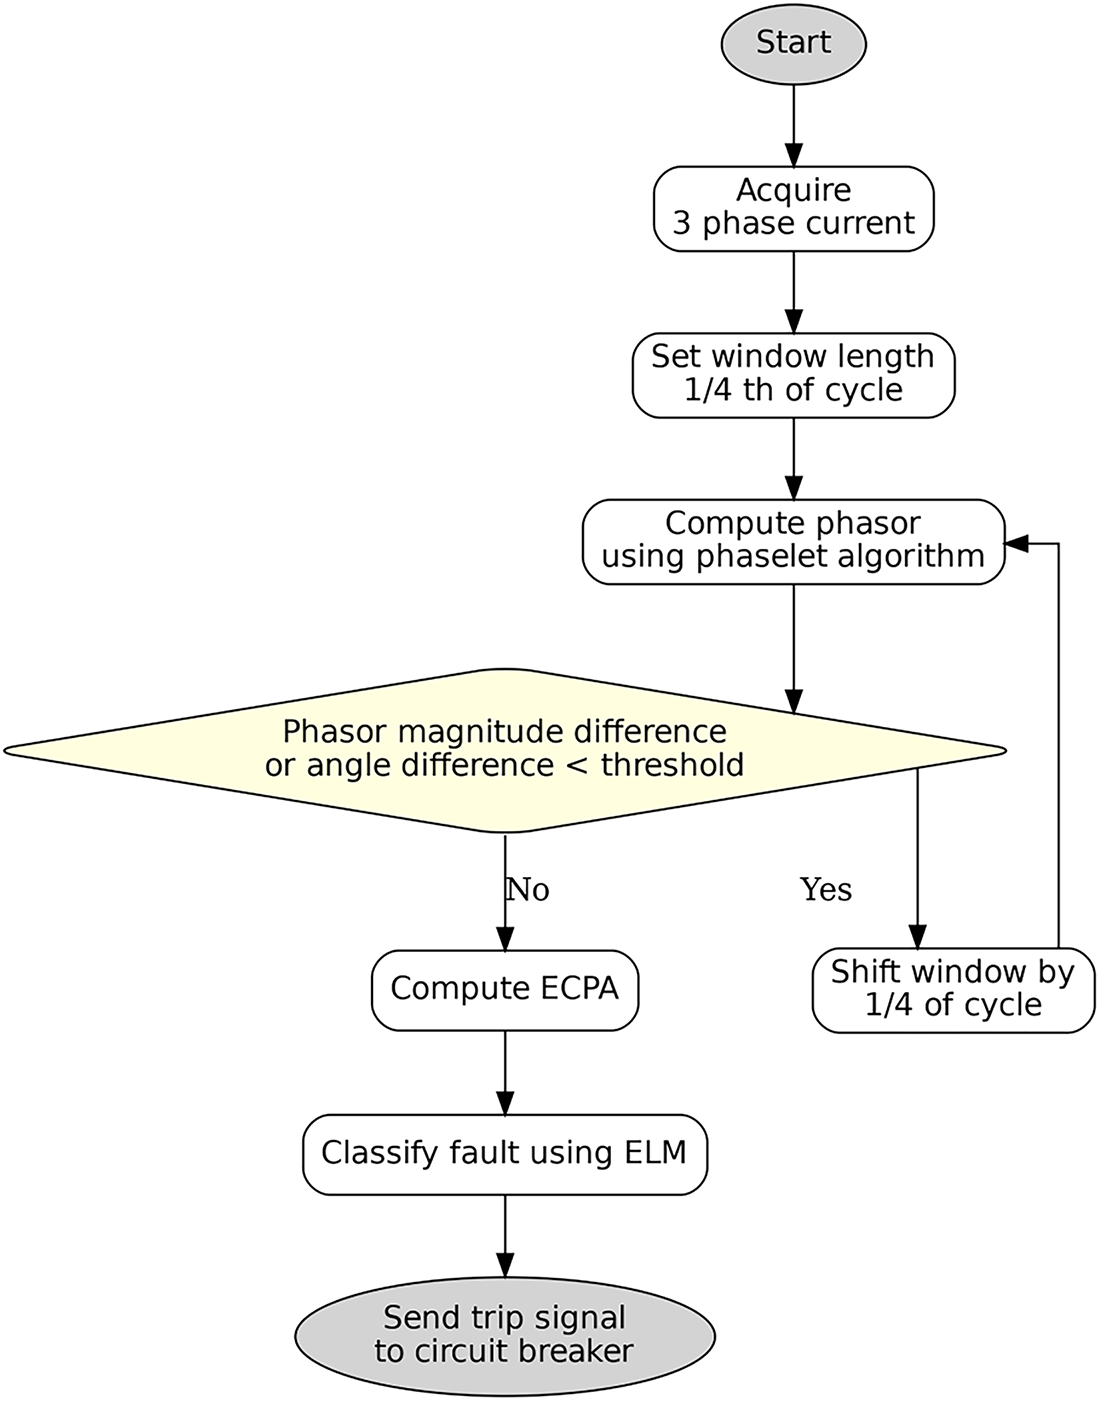
Figure 4: Flowchart for phaselet and RBF-ELM based fault classification using virtual PMU
3 External Setup Using IoT and Virtual PMU
To validate the proposed methodology in a real-time setting, it was deployed on a practical transmission line setup based on an IoT platform, as illustrated in Fig. 5. The connection diagram of the various sections of the practical transmission line setup is depicted in Fig. 6.
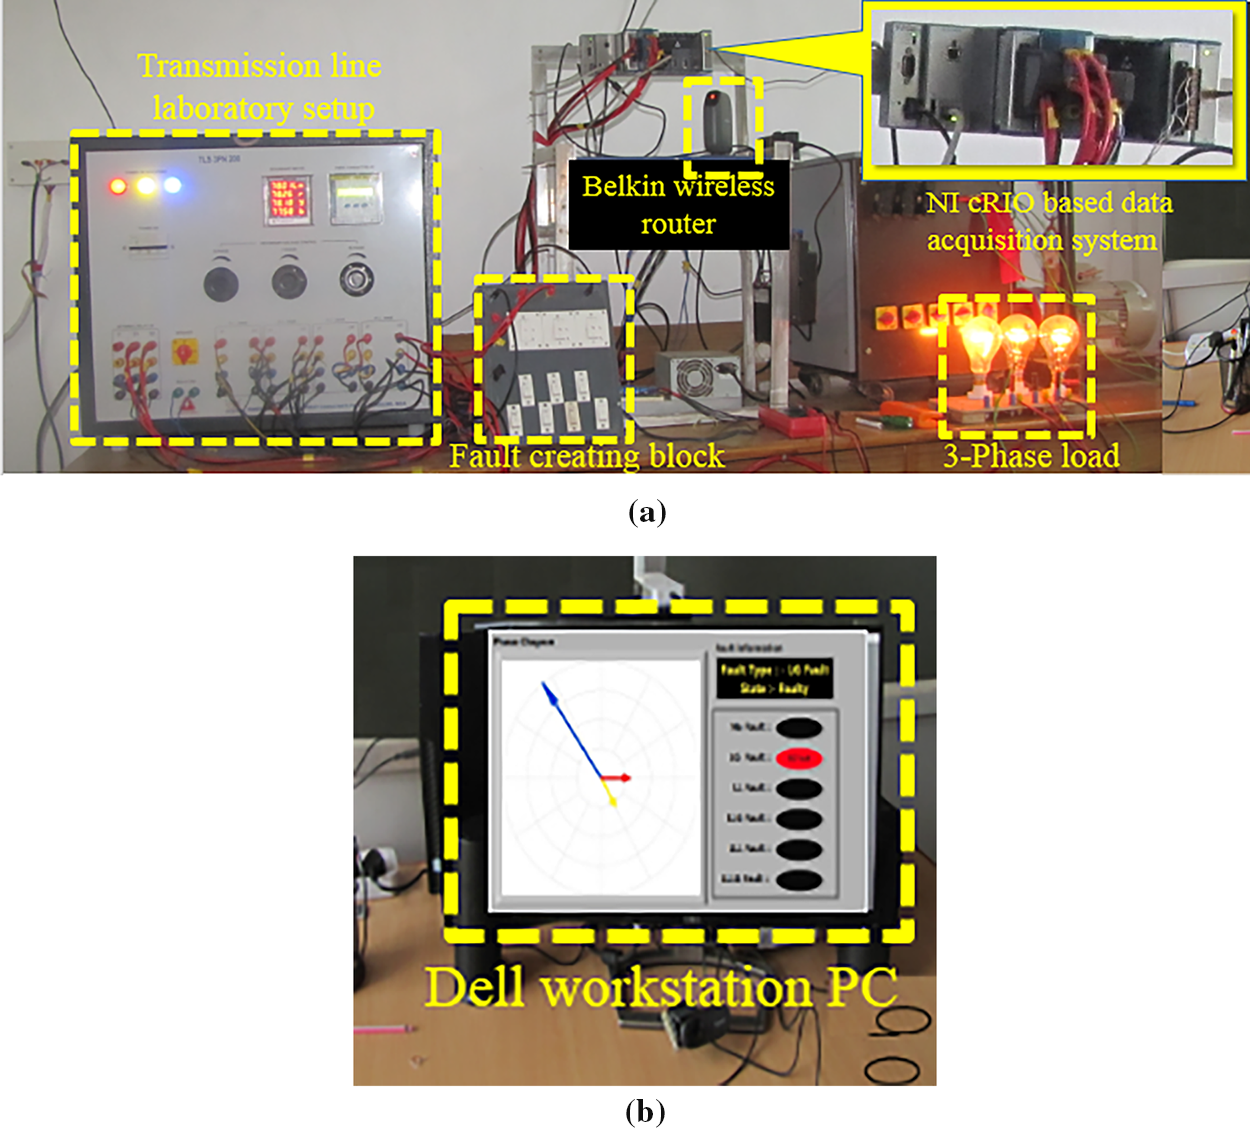
Figure 5: Experimental setup of the proposed methodology (a) cRIO data acquisition system (b) Virtual PMU visualization in Dell workstation
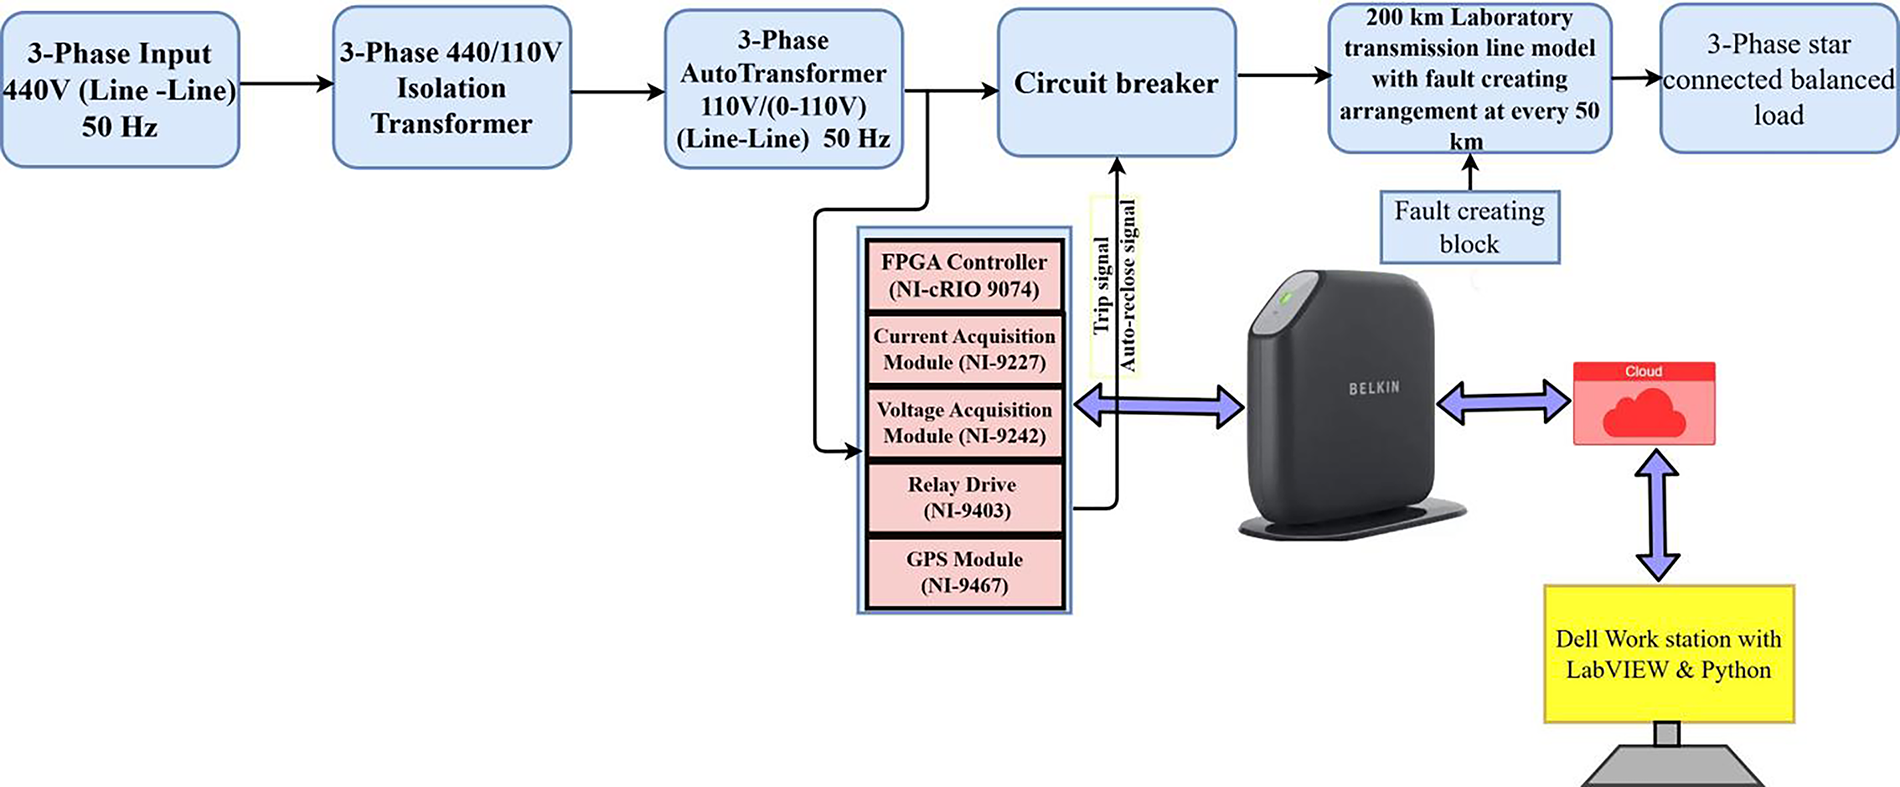
Figure 6: Connection diagram of the experimental setup
The laboratory transmission line setup comprises several components, including a source generating line-to-line three-phase voltage of 440 V at 50 Hz, an isolation transformer, a three-phase autotransformer rated at 110 V/(0–110 V), a Belkin F7D2301 Wireless Surf Router, and a NI FPGA compact RIO-based three-phase current acquisition system interfaced with a Dell Workstation. The compact RIO has a real-time FPGA processor with 128 MB DRAM and 256 MB storage. The phaselet algorithm can be stored in the compact RIO system, allowing for direct computation of the phaselets. The cRIO system is separated from the workstation by 5 m. Other elements include a circuit breaker, a 400 kV level, a 200 km transmission line, a fault creation block capable of simulating various fault types, and a three-phase star-connected load.
The phasor computation is performed in the NI-based controller using LabVIEW software and general purpose cRIO FPGA that can be used to develop other instruments; therefore, it is called a virtual PMU. The current acquisition system incorporates a compact RIO-9467 FPGA controller with eight slots for accommodating application-specific modules [39]. For acquiring three-phase current, an NI 9227, 4-channel, 5 A rms, 24-bit current input module [40] is inserted into the first slot of the compact RIO. A NI-9403, 32-channel digital input/output module [41] is inserted into the second slot to drive the circuit breaker for transmission line protection upon fault detection. Additionally, a NI-9401 GPS receiver module is inserted into the third slot of the compact RIO to obtain location information and UTC for synchronization purposes [42]. The virtual PMU is implemented in LabVIEW and then uploaded to the cRIOs. The LabVIEW block diagram for the virtual PMU is shown in Fig. 7. Fig. 7a shows the sampling and cRIO setup details. Fig. 7b shows the capturing of voltage and current samples from the target FPGA to the host PC using LabVIEW first-in-first-out (FIFO). The phasor computation is shown in Fig. 7c. Fig. 7d presents the fault detection, classification, and isolation of the faulty line from the healthy lines by operating relays connected through the digital I/O module 3 (NI-9401) at ports 5, 6, and 7 for the three phases, respectively. Fig. 7e shows the complete block diagram program for the virtual PMU.
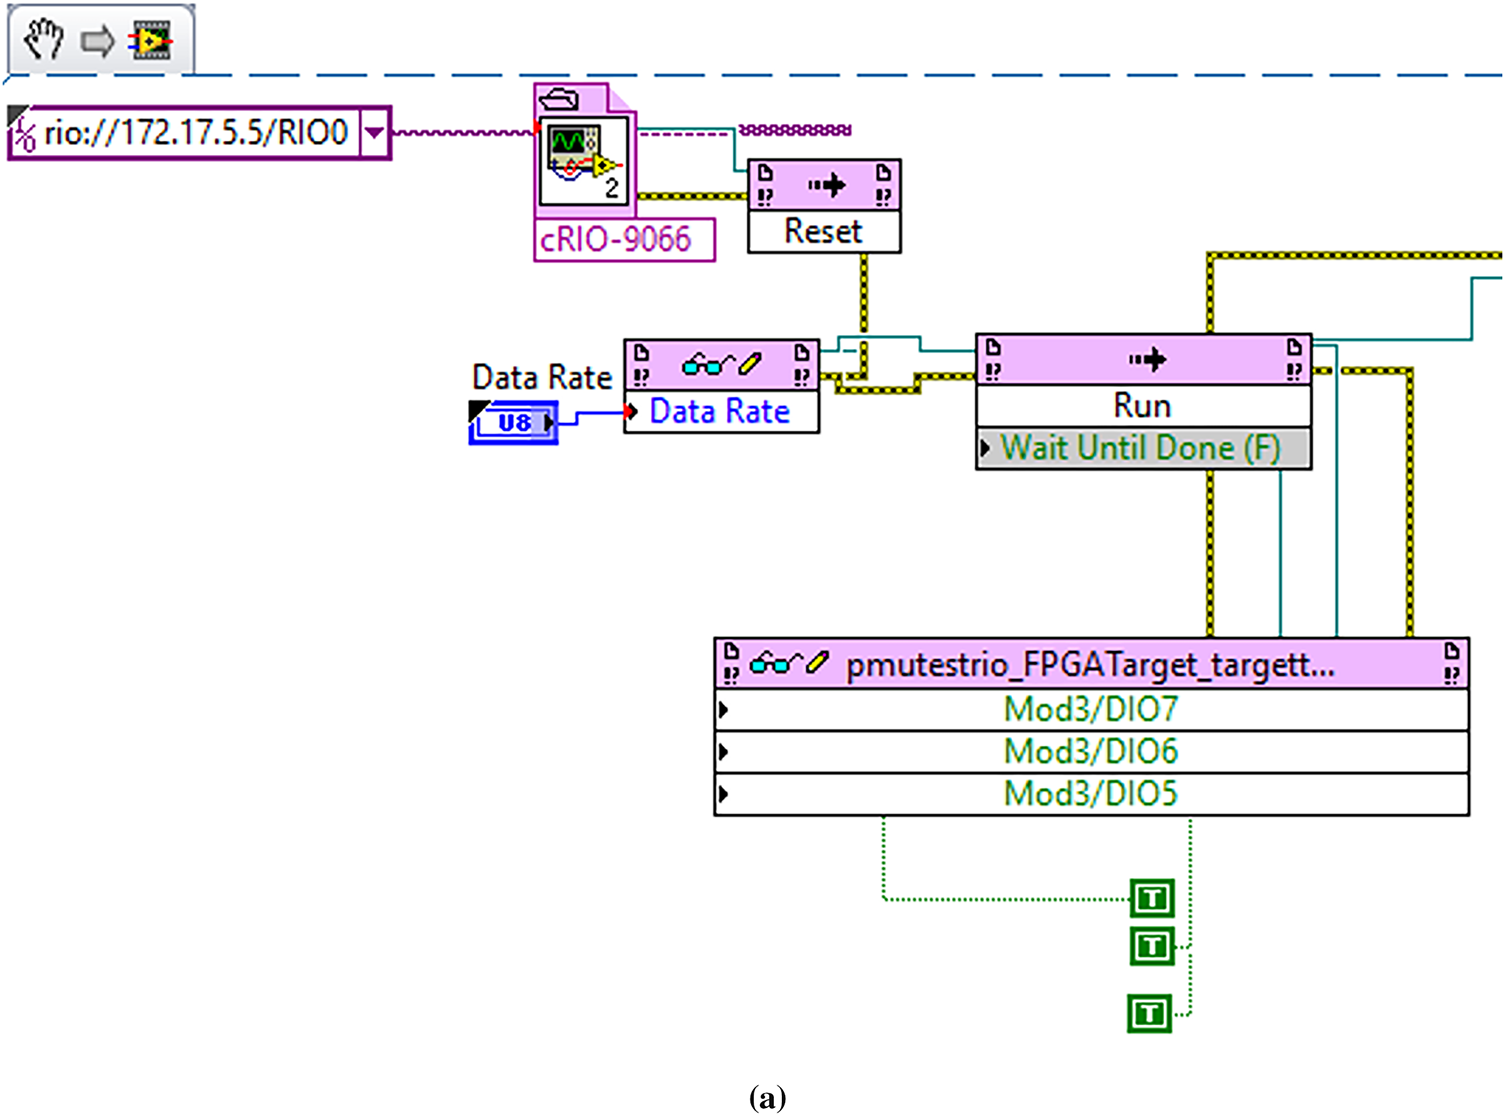
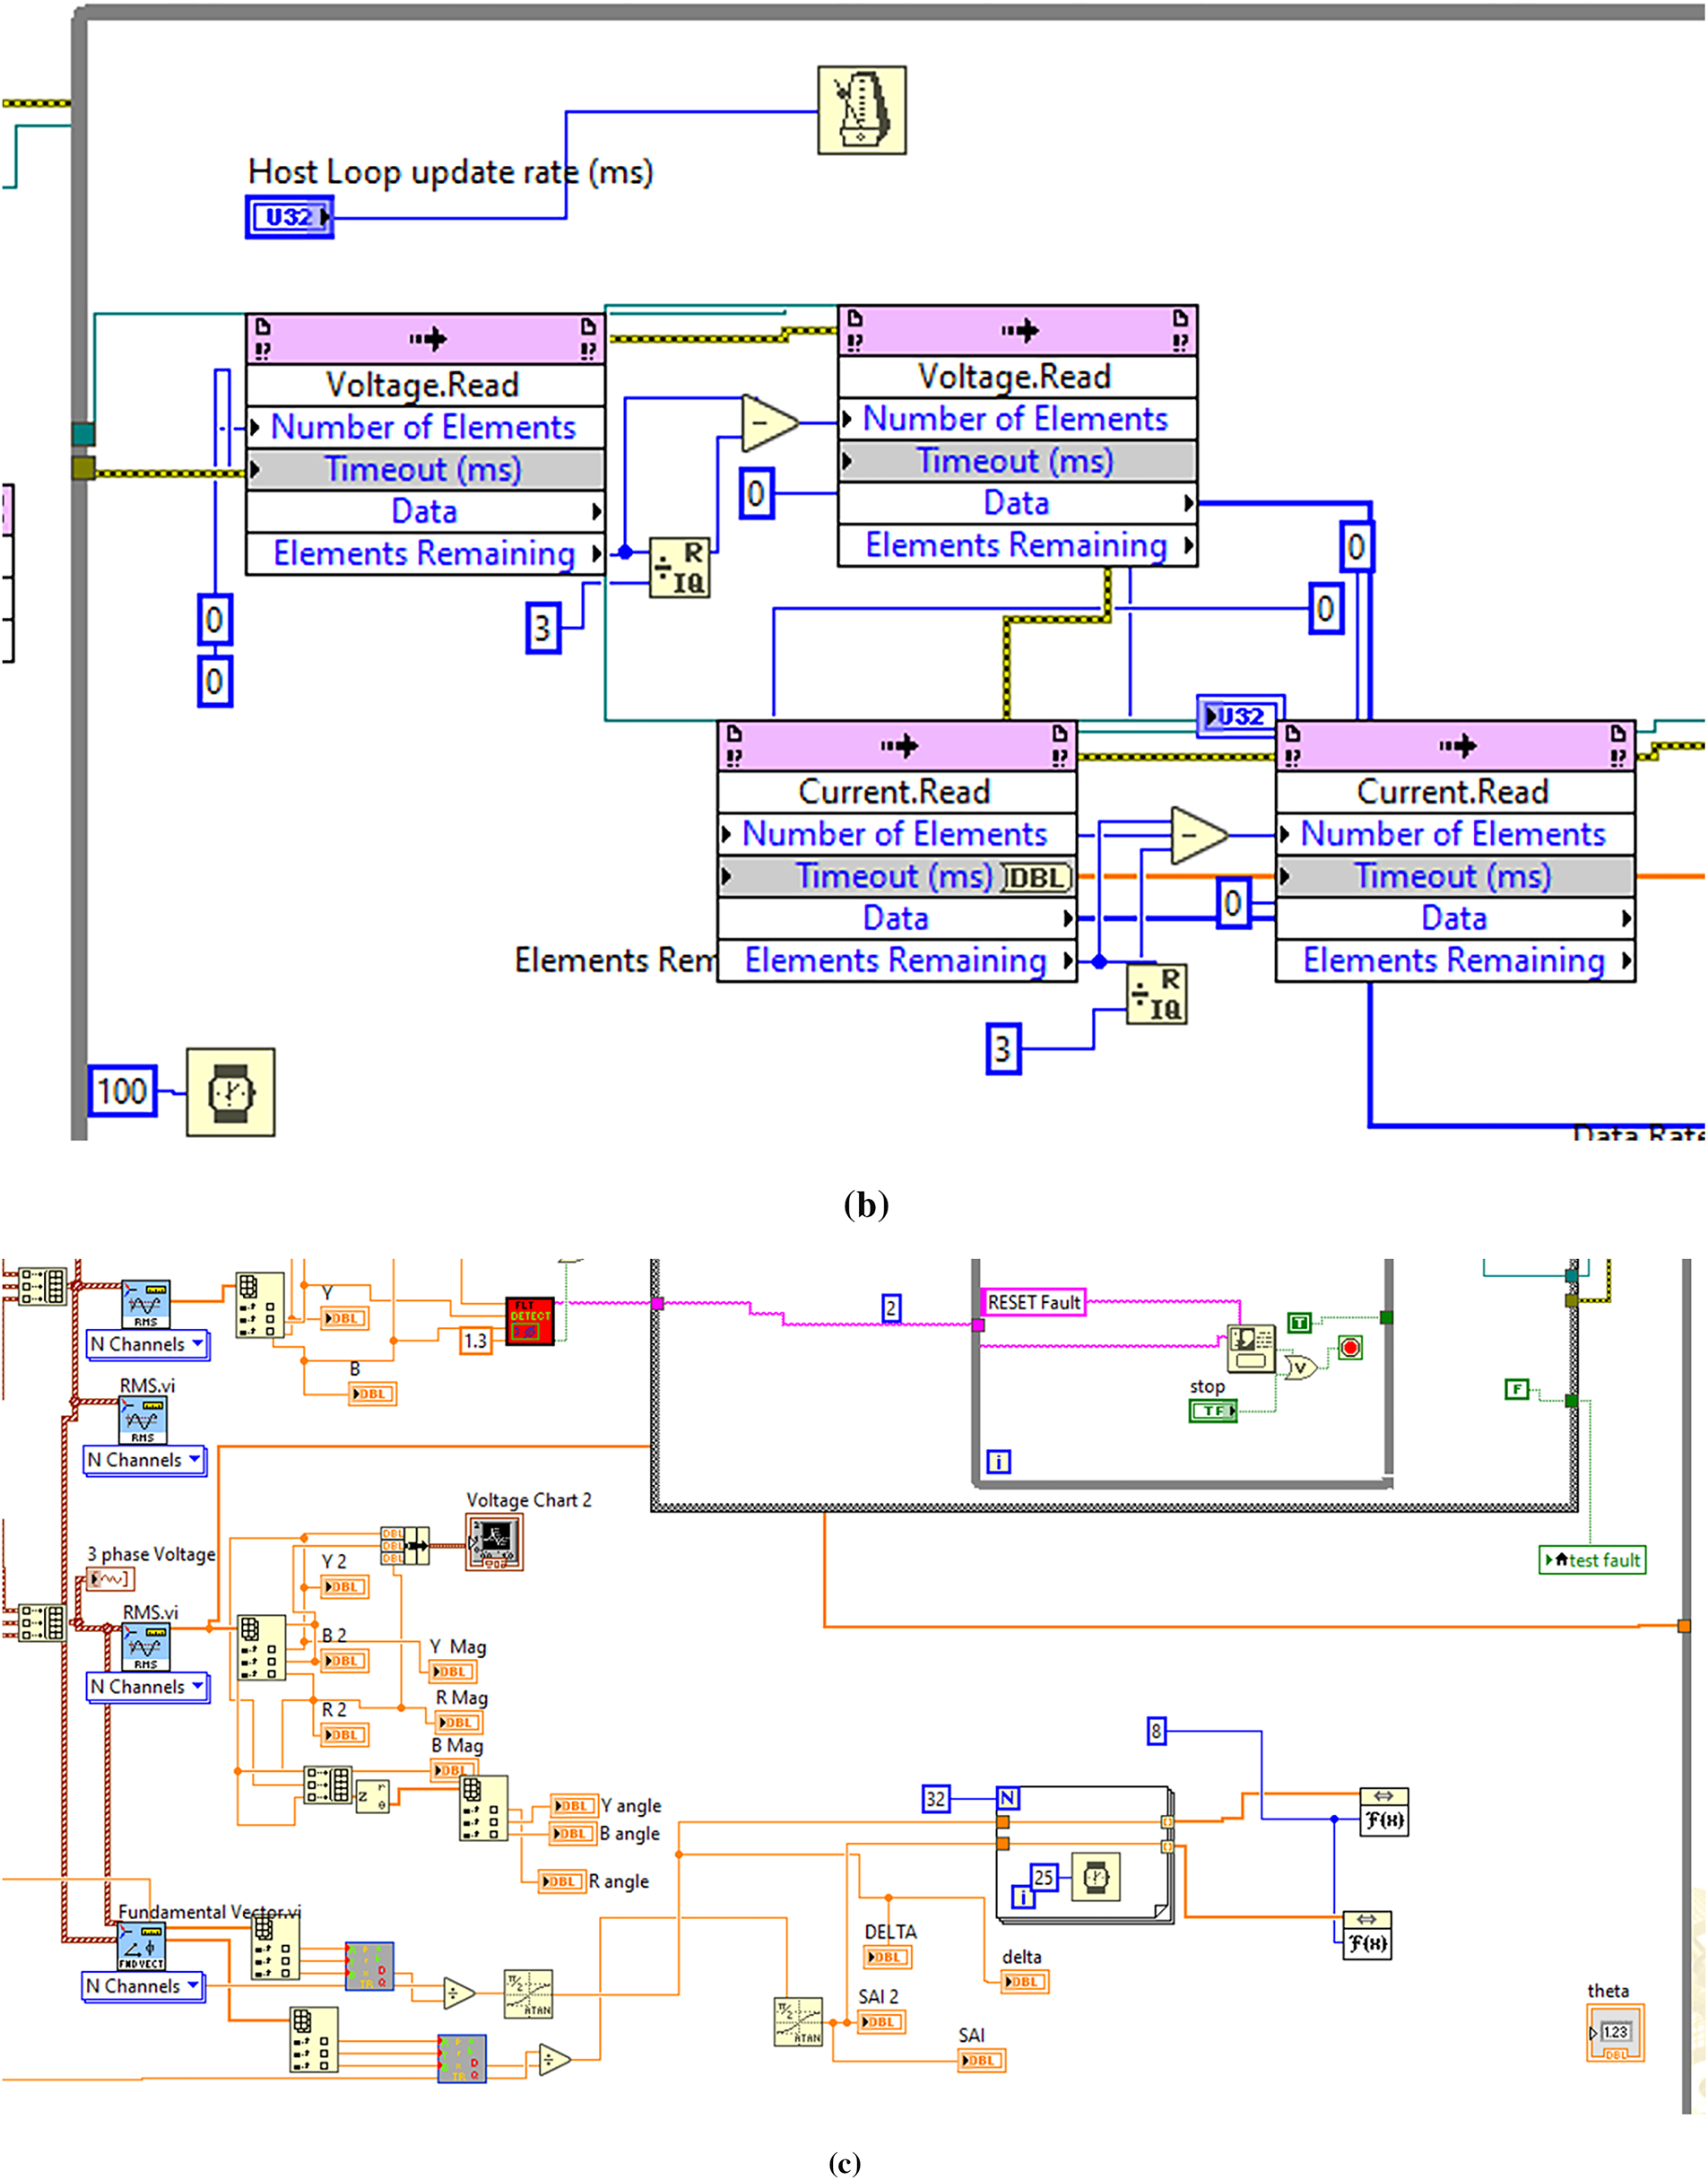
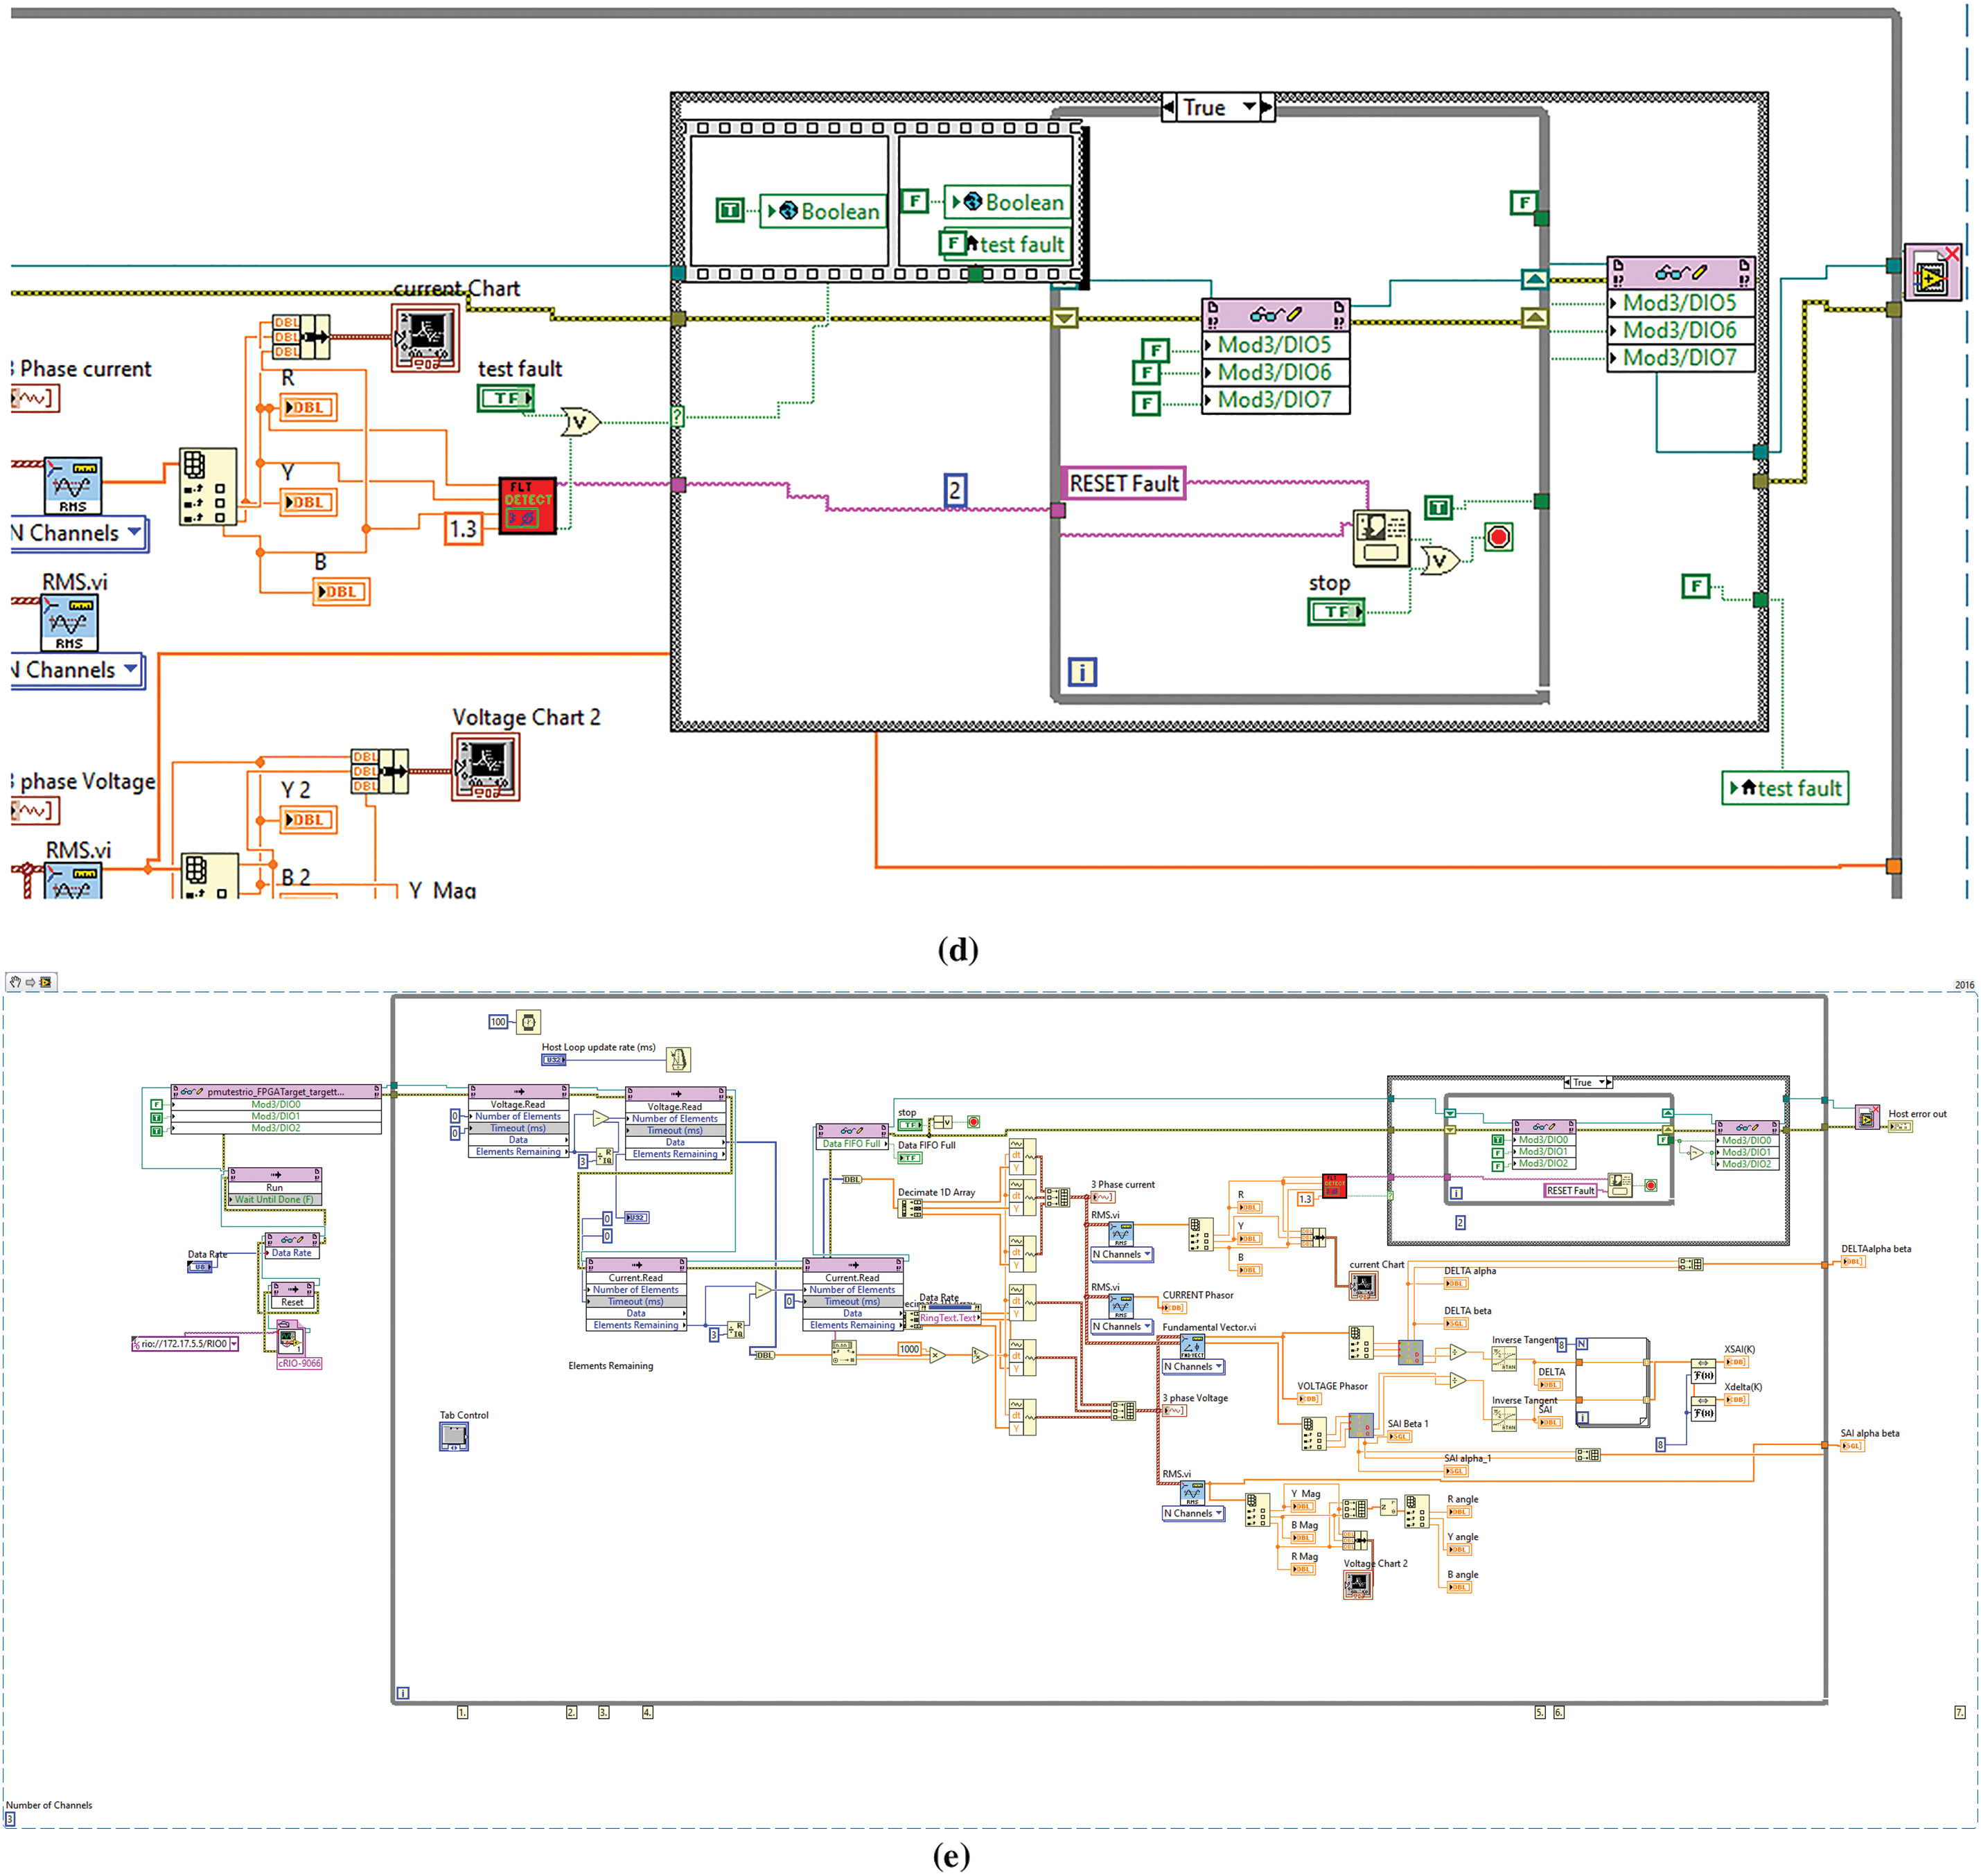
Figure 7: The components of the virtual PMU (a) initial sampling setup of cRIO (b) transferring current and voltage samples from target to host using FIFO (c) Phasor computation (d) Fault detection and classification and line isolation (e) full setup of the virtual PMU
The three-phase current is acquired from the transmission line using the NI compact RIO data acquisition system. The phaselet algorithm, stored on the cRIO FPGA, computes the phaselets, which are then sent to the Belkin F7D2301 Wireless Surf Router through a gigabit Ethernet cable, which then wirelessly transmits them to a server. The server (a Dell Workstation) has the LabVIEW based PDC, where the visualizations are presented. The LabVIEW virtual instrumentation tool installed on the workstation analyzes the received signals from the cRIO and displays the phasors on the screen. To implement the Extreme Learning Machine (ELM) algorithm, Python and the Python Integration Toolkit for LabVIEW are also installed on the workstation. Python provides the implementation of the learning algorithm on real-time signals, while the Python Integration Toolkit facilitates the connectivity between LabVIEW and Python. The combined integration of LabVIEW and Python enhances high-speed data acquisition, learning capabilities, interactive visualization, and quick fault detection and classification. The interactive visual monitoring panel can be accessed through a web browser using the LabVIEW web publishing tool, as shown in Fig. 8.
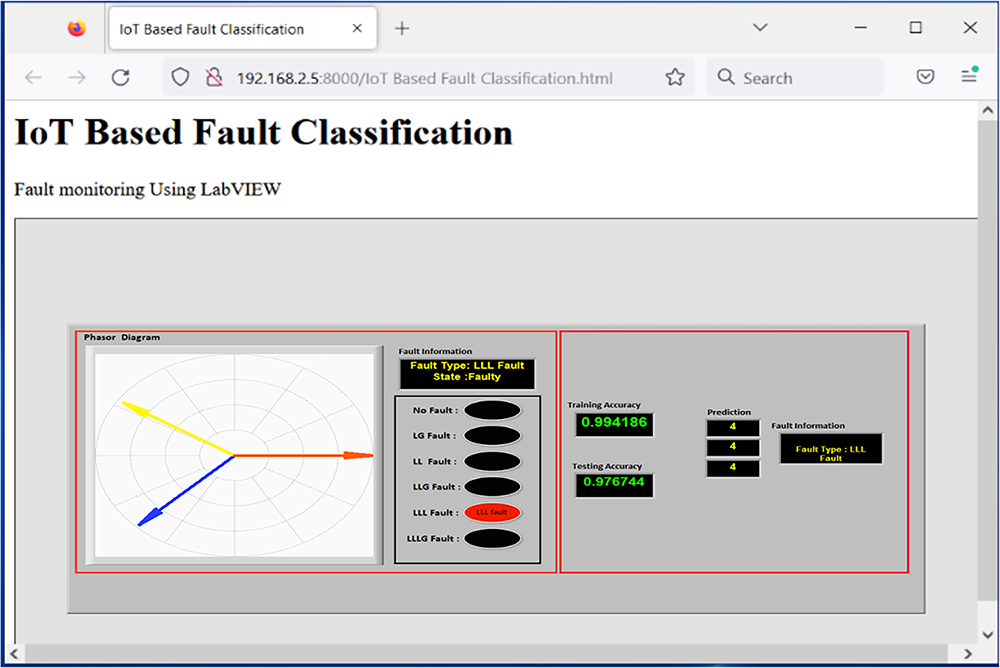
Figure 8: Fault monitoring in LabVIEW
The three-phase current is acquired from the transmission line using NI compact RIO data acquisition system; then, the three-phase current phasor is computed using the phaselet algorithm and these phaselets are then sent to the sent to the workstation (PDC). The fault detection is achieved using the phasor magnitude difference or phase angle difference. The fault detection is achieved if the phasor magnitude or phase angle difference of consecutive phaselets exceeds the threshold values. The fault classification is achieved using the ELM based on the feature extracted from the three-phase current phaselet by the phaselet coefficients of ECPA at DC, fundamental, second and higher frequencies using Eq. (4). The comprehensive dataset needed to train the ELM is generated by introducing different types of faults on the 200 km long transmission line prototype at random locations. Each fault was introduced for 2 s, during which the Phaselet co-efficient of ECPA are continuously computed using Eq. (4) for normal operation (no fault condition), line-to-ground fault (LG), line-to-line fault (LL), double line-to-ground fault (LLG), three-phase short circuit fault (LLL), and three-phase-to-ground fault (LLLG). Table 1, presents the initial three samples of the phaselet coefficients of ECPA for each types of fault. The first five columns presents the ECPA coefficients at DC component (ϕpl(0)), at fundamental frequency 50 Hz (ϕpl(1)), second harmonic at100 Hz (ϕpl(2)), third harmonics 150 Hz (ϕpl(2)) and 4th harmonic at 200 Hz (ϕpl(4)), respectively, for various fault conditions. Fig. 9 shows the details of the data flow and the fault classification and Table 1 shows the first three samples of phaselet coefficient of ECPA for different types of faults recorded when each fault was introduced for 2 s at a randomly chosen distance on the transmission line.
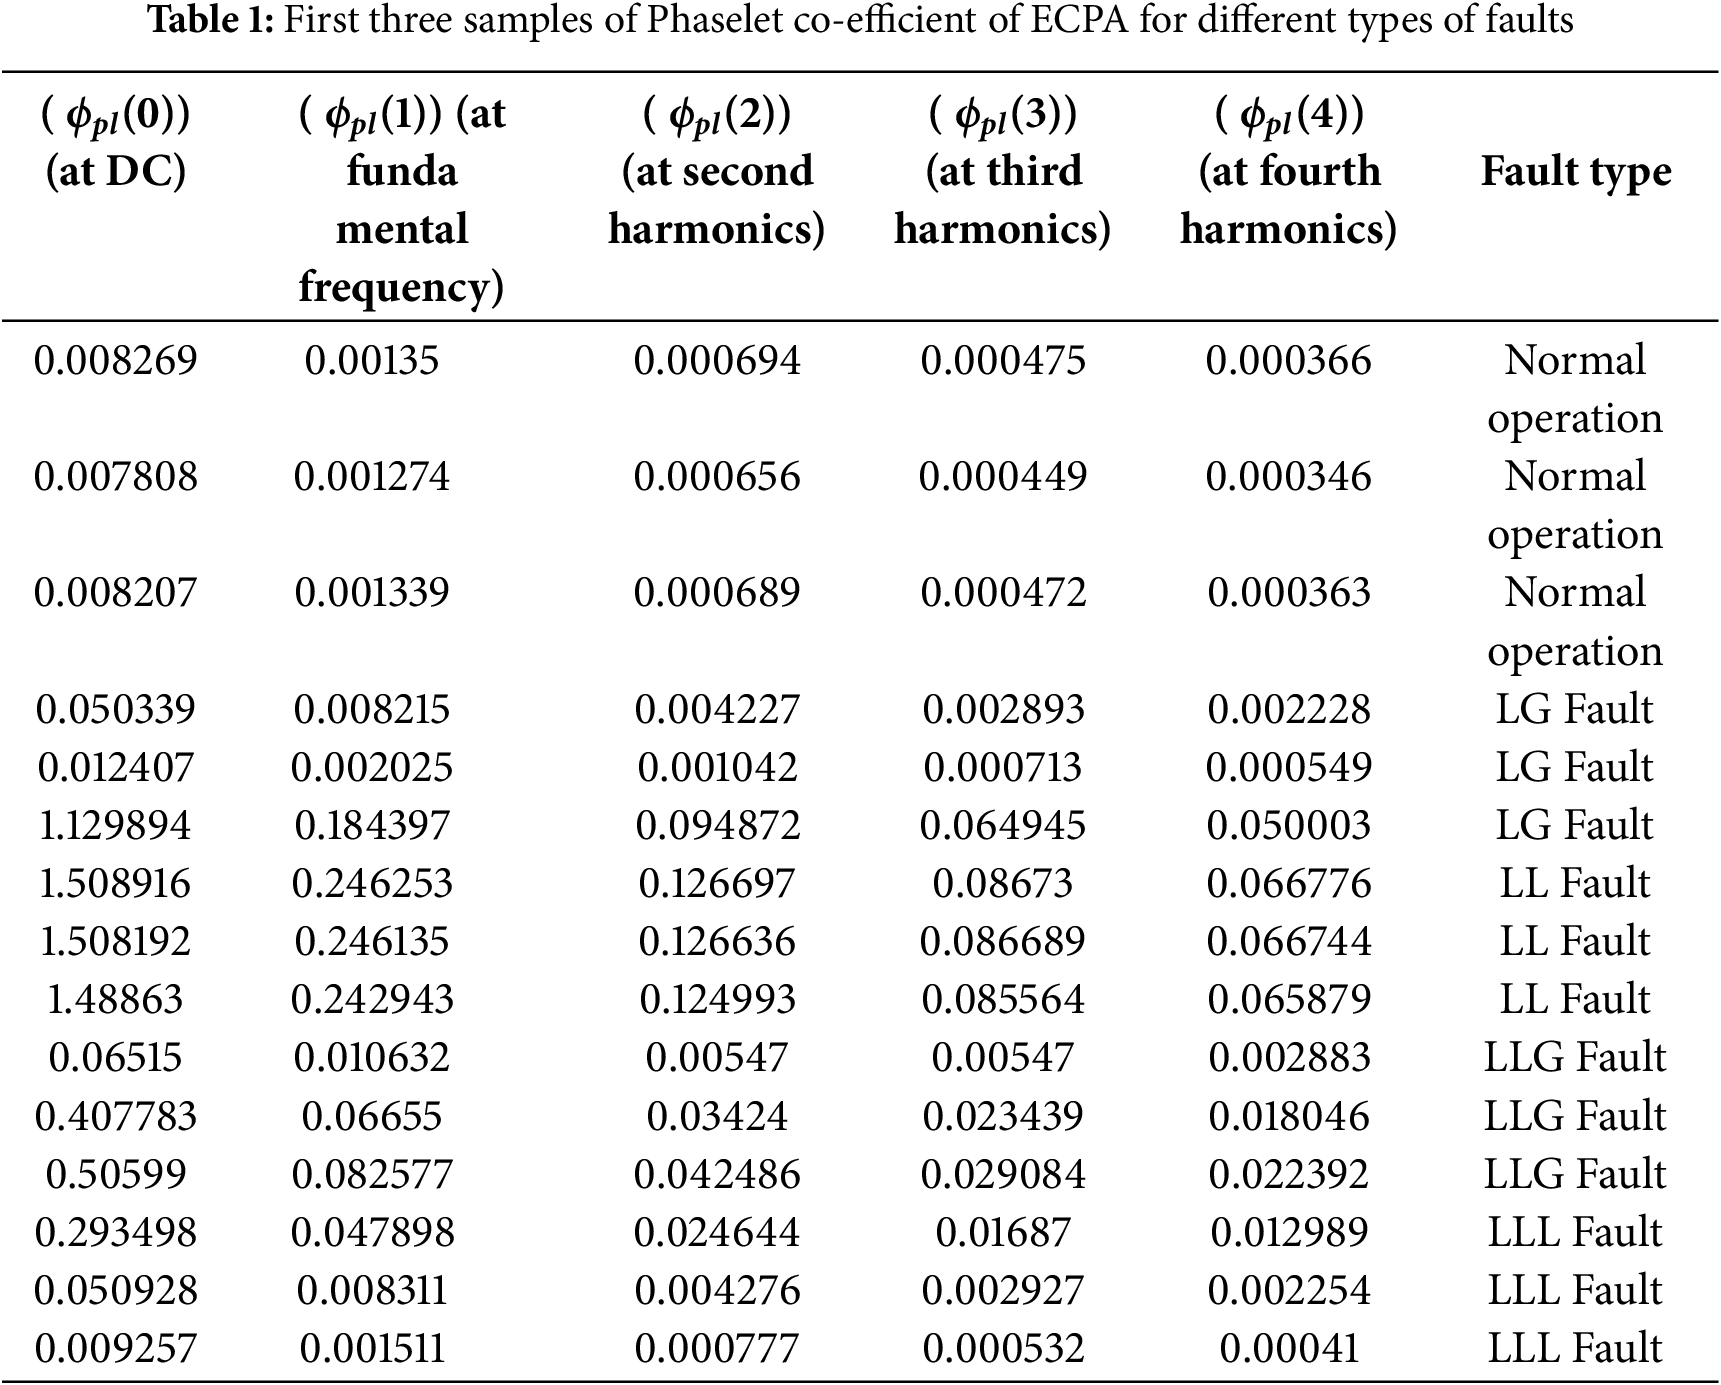
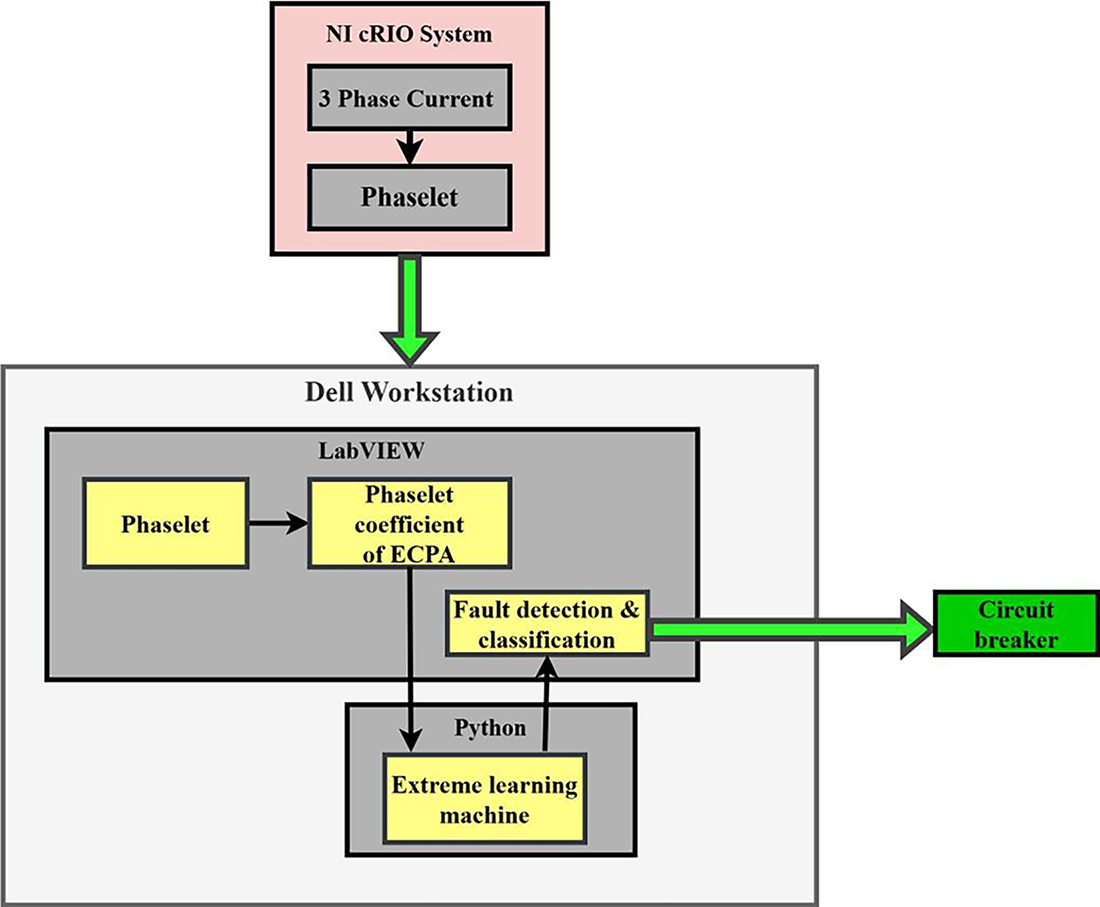
Figure 9: Details of the dataflow and fault analysis
In the proposed work, ELM uses RBF kernel for activation, with the optimum kernel parameter as b = 12.55 and regularization coefficient as 6.84 to achieve the best classification results. Fig. 10 shows the accuracy of the training and testing stages and the training time using the proposed algorithm with the help of LabVIEW and the Python tool. The training and testing accuracy are about 99.42% and 97.68%, respectively, and the training time is 149 ms.
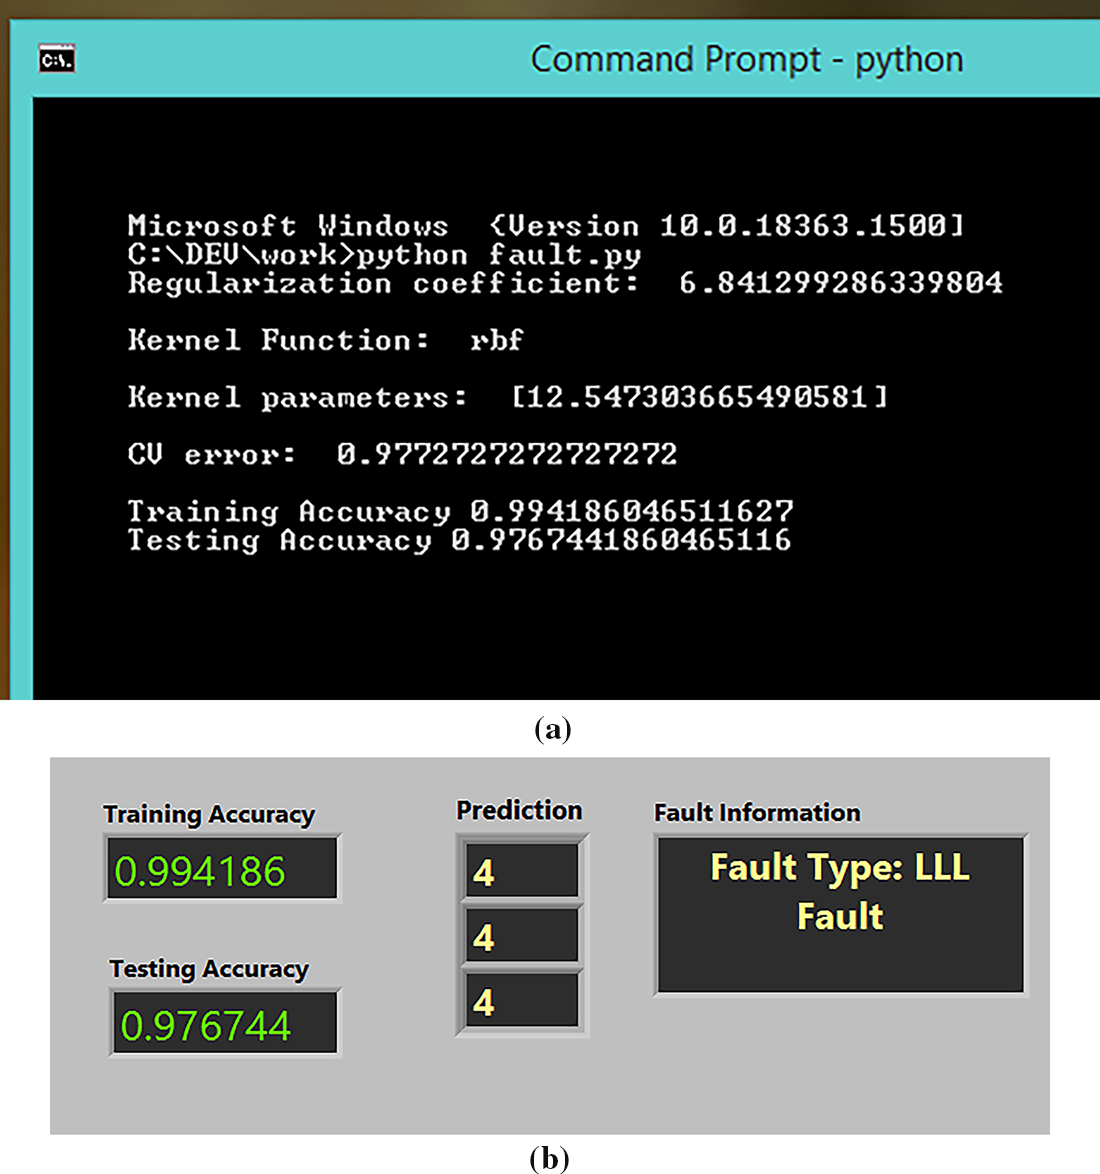
Figure 10: Fault classification accuracy in (a) python output (b) LabVIEW front panel
The confusion matrix for testing and training data are shown in Fig. 11a,b, respectively. There was one misclassification, where an LLG fault has been classified as an LLL fault in both the training and testing phases.
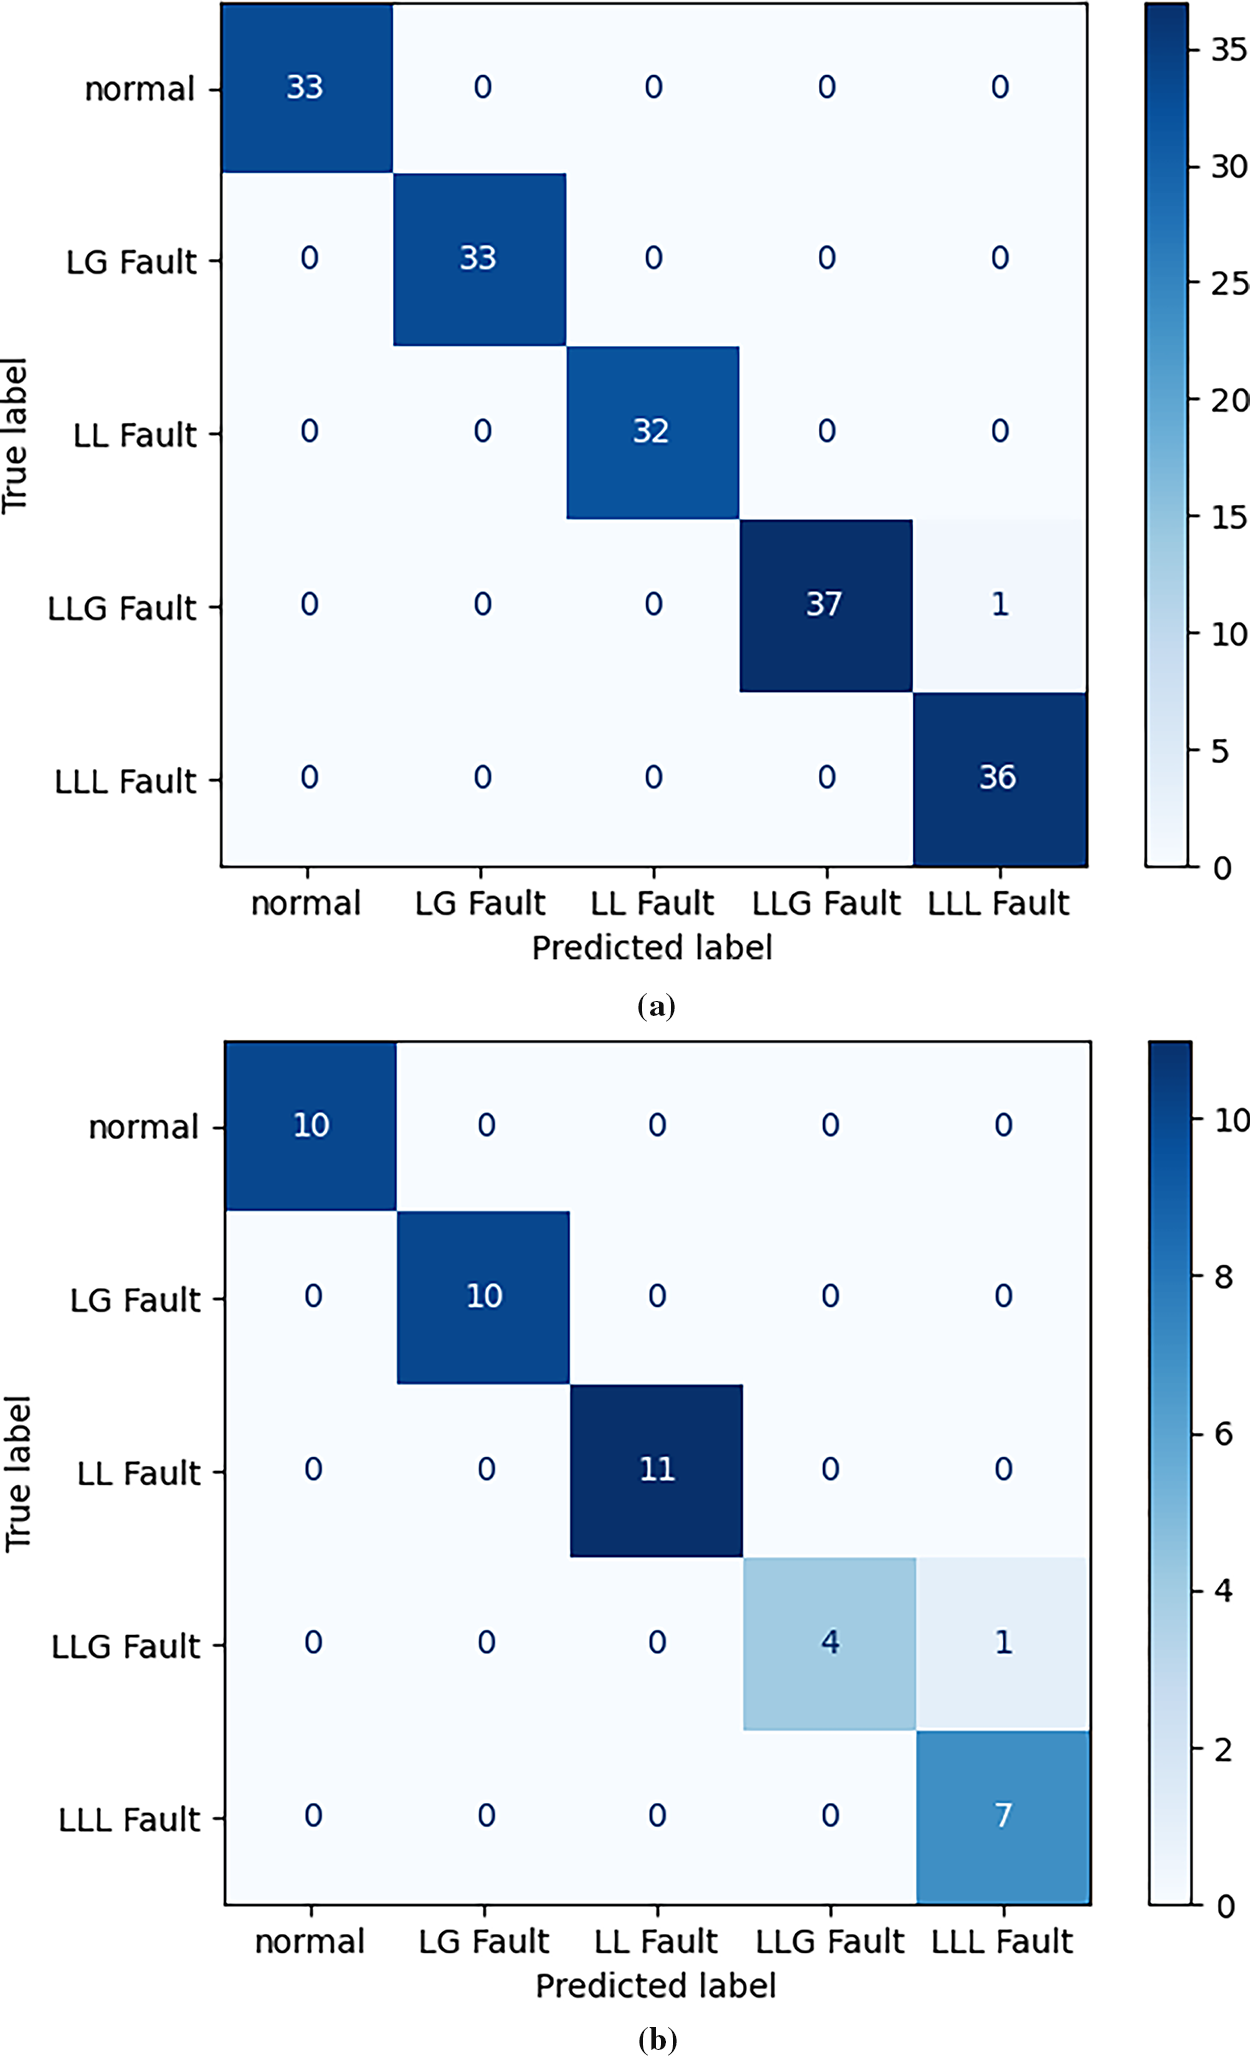
Figure 11: Confusion matrix (a) training dataset (b) testing dataset
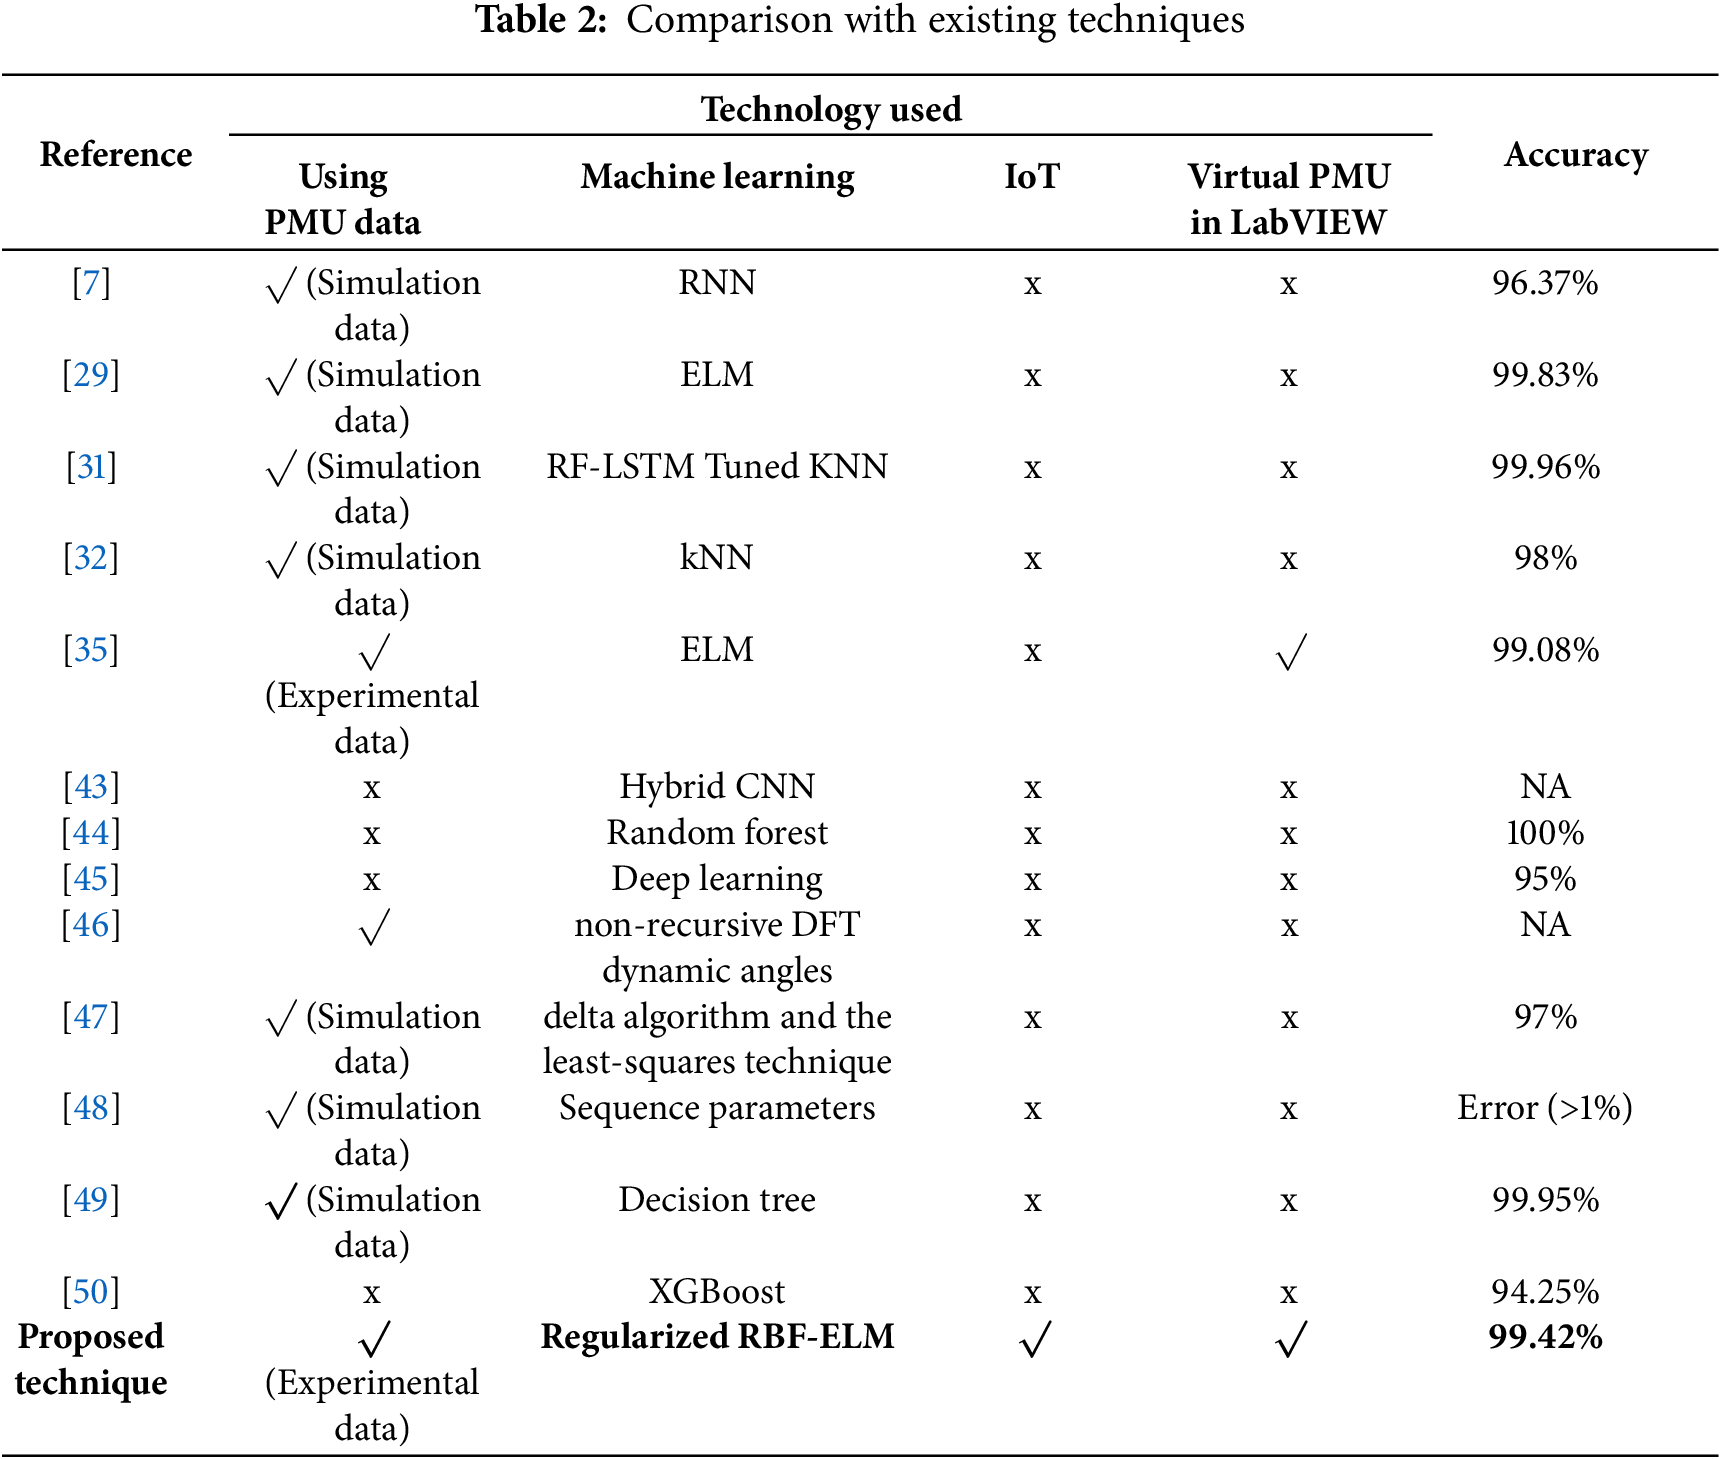
A comparison is shown in Table 2 with the existing transmission-fault detection techniques. Most techniques do not use a virtual PMU, significantly increasing the implementation cost and reducing scalability. Furthermore, the proposed technique is the first to combine ELM and virtual PMU to classify transmission line faults.
5 Conclusions and Future Directions
This paper introduces a real-time fault detection method for transmission lines based on phaselet analysis. The proposed approach utilizes synchronized phasor measurements obtained from PMUs, focusing on the phase current data. The fault classification is accomplished through the application of the ELM. The entire process, including data acquisition and computation, is implemented on an Internet of Things (IoT) platform using LabVIEW and Python. Extensive experiments were conducted to evaluate the effectiveness of the proposed method. The training and testing accuracy of the fault classification model were determined to be 99.42% and 97.68%, respectively, indicating a high level of accuracy in fault identification. Furthermore, interactive visualization capabilities were developed using LabVIEW virtual instrumentation tools, enhancing the interpretability of the results. The results demonstrate the promising potential of the proposed approach in preventing cascade blackouts by enabling timely decision-making through quick and interactive fault detection and classification. By leveraging phaselet analysis, synchronized phasor measurements, and the ELM, the method offers an efficient and accurate solution for enhancing the reliability and stability of transmission line operations.
While the current work demonstrates the use of virtual PMU, IoT, and fault classification using RBF-ELM, several avenues exist for future investigation to enhance the robustness and applicability of the proposed system. Firstly, the current laboratory setup assumes a conservative distance (5 m) between the virtual PMU and the PDC, neglecting the impact of communication latency. To accurately reflect real-world operation, future research will focus on evaluating the performance of the system with significantly increased distances, thereby necessitating the development of algorithms less susceptible to communication delays. One way to achieve this is the direct integration of PMU functionality and machine learning algorithms onto the end devices (cRIO in this case). This would substantially reduce latency in identifying and responding to fault propagation, enabling proactive measures to prevent cascading failures. Future work will explore the feasibility and performance of such an integrated architecture, considering the resource constraints of the IoT devices. Secondly, the current study lacks a demonstration of fault localization capabilities. A critical extension will involve generating a more comprehensive and diverse dataset, encompassing a larger network, a wider range of fault scenarios, and operating conditions. This data will be used to develop and validate fault localization techniques, ensuring the system can accurately pinpoint the origin of faults within the power grid. Finally, the current study utilizes a single virtual PMU in a laboratory environment. Extension of this work will involve a more realistic deployment scenario in the laboratory by considering a larger network but incorporating communication delays. This expanded scenario will allow for a rigorous evaluation of the system’s ability to classify faults in real-time and assess the impact of PMU placement on overall system performance.
Acknowledgement: The research was partially supported by the Experimental—Demonstration project PN-IV-P7-7.1-PED-2024-0567 (Improving the Fuel Cell Hybrid Electric Vehicle Drivetrain by Implementing a Novel Optimal Real-Time Power Management Strategy), contract no. 58PED, 2024-2025. The research was partially supported by Science and Engineering Research Board, India with grant number ECR/2017/000812.
Funding Statement: The research was partially supported by the Experimental—Demonstration project PN-IV-P7-7.1-PED-2024-0567 (Improving the Fuel Cell Hybrid Electric Vehicle Drivetrain by Implementing a Novel Optimal Real-Time Power Management Strategy), contract no. 58PED (N.B.) and the APC was funded by S.C. ECAI CONFERENCE S.R.L.
Author Contributions: Kunjabihari Swain, Bhargav Appasani, and Murthy Cherukuri did the simulations and wrote the original draft; Indu Sekhar Samanta and Nicu Bizon reviewed and revised the original draft; Mihai Oproescu supervised the project. All authors reviewed the results and approved the final version of the manuscript.
Availability of Data and Materials: The data that support the findings of this study are available from the Corresponding Author, Bhargav Appasani, upon reasonable request.
Ethics Approval: Not applicable.
Conflicts of Interest: The authors declare no conflicts of interest to report regarding the present study.
References
1. Jha AV, Appasani B, Ghazali AN, Pattanayak P, Gurjar DS, Kabalci E, et al. Smart grid cyber-physical systems: communication technologies, standards and challenges. Wirel Netw. 2021;27(4):2595–613. doi:10.1007/s11276-021-02579-1. [Google Scholar] [CrossRef]
2. Appasani B. Smart grid 3.0: grid with proactive intelligence. In: Smart grid. Vol. 3. Berlin/Heidelberg, Germany: Springer; 2023. p. 1–22. doi:10.1007/978-3-031-38506-3_1. [Google Scholar] [CrossRef]
3. Wang H, Wei Q, Xie Y. Research on cascading failures of power grid. In: Applied mathematics, modeling and computer simulation. Amsterdam, The Netherlands: IOS Press; 2022. doi: 10.3233/atde220010. [Google Scholar] [CrossRef]
4. Huang T, Baiocchi M, Lei X. An ontological approach for automatic tracking causes of blackouts in power systems. In: 2022 IEEE 21st Mediterranean Electrotechnical Conference (MELECON); 2022 Jun 14–16; Palermo, Italy. IEEE; 2022. p. 813–8. doi:10.1109/MELECON53508.2022.9843078. [Google Scholar] [CrossRef]
5. Hordeski MF. Emergency and backup power sources: preparing for blackouts and brownouts. Copenhagen, Denmark: River Publishers; 2005. [Google Scholar]
6. Yuan P, Zhang Q, Zhang T, Chi C, Zhang X, Li P, et al. Analysis and enlightenment of the blackouts in Argentina and New York. In: 2019 Chinese Automation Congress (CAC); 2029 Nov 22–24; Hangzhou, China. IEEE; 2019. p. 5879–84. doi:10.1109/cac48633.2019.8997461. [Google Scholar] [CrossRef]
7. Shadi MR, Ameli MT, Azad S. A real-time hierarchical framework for fault detection, classification, and location in power systems using PMUs data and deep learning. Int J Electr Power Energy Syst. 2022;134(7):107399. doi:10.1016/j.ijepes.2021.107399. [Google Scholar] [CrossRef]
8. Kavasseri R, Srinivasan SK. Joint placement of phasor and conventional power flow measurements for fault observability of power systems. IET Gener Transm Distrib. 2011;5(10):1019–24. doi:10.1049/iet-gtd.2010.0791. [Google Scholar] [CrossRef]
9. Appasani B, Mohanta DK. A review on synchrophasor communication system: communication technologies, standards and applications. Prot Control Mod Power Syst. 2018;3(1):37. doi:10.1186/s41601-018-0110-4. [Google Scholar] [CrossRef]
10. Appasani B, Mishra SK, Jha AV, Mishra SK, Enescu FM, Sorlei IS, et al. Blockchain-enabled smart grid applications: architecture, challenges, and solutions. Sustainability. 2022;14(14):8801. doi:10.3390/su14148801. [Google Scholar] [CrossRef]
11. Zhou N, Huang Z, Meng D, Elbert ST, Wang S, Diao R. Capturing dynamics in the power grid: formulation of dynamic state estimation through data assimilation. Richland, WA, USA: Pacific Northwest National Lab.; 2014. Report No.: PNNL-23213. [Google Scholar]
12. Phadke AG, Bi T. Phasor measurement units, WAMS, and their applications in protection and control of power systems. J Mod Power Syst Clean Energy. 2018;6(4):619–29. doi:10.1007/s40565-018-0423-3. [Google Scholar] [CrossRef]
13. Reyes JMA, Stern Forgach CE. Evaluation of the minimum size of a window for harmonics signals. J Signal Inf Process. 2016;7(4):175–91. doi:10.4236/jsip.2016.74017. [Google Scholar] [CrossRef]
14. Jin X, Gokaraju R, Wierckx R, Nayak O. High speed digital distance relaying scheme using FPGA and IEC 61850. IEEE Trans Smart Grid. 2018;9(5):4383–93. doi:10.1109/TSG.2017.2655499. [Google Scholar] [CrossRef]
15. Haq EU, Huang J, Li K, Ahmad F, Banjerdpongchai D, Zhang T. Improved performance of detection and classification of 3-phase transmission line faults based on discrete wavelet transform and double-channel extreme learning machine. Electr Eng. 2021;103(2):953–63. doi:10.1007/s00202-020-01133-0. [Google Scholar] [CrossRef]
16. Ahmed MM, Amjad M, Ali Qureshi M, Imran K, Haider ZM, Khan MO. A critical review of state-of-the-art optimal PMU placement techniques. Energies. 2022;15(6):2125. doi:10.3390/en15062125. [Google Scholar] [CrossRef]
17. Kamwa I, Samantaray SR, Joos G. On the accuracy versus transparency trade-off of data-mining models for fast-response PMU-based catastrophe predictors. IEEE Trans Smart Grid. 2012;3(1):152–61. doi:10.1109/TSG.2011.2164948. [Google Scholar] [CrossRef]
18. Ramesh Babu N, Jagan Mohan B. Fault classification in power systems using EMD and SVM. Ain Shams Eng J. 2017;8(2):103–11. doi:10.1016/j.asej.2015.08.005. [Google Scholar] [CrossRef]
19. Jayamaha DKJS, Lidula NWA, Rajapakse AD. Wavelet-multi resolution analysis based ANN architecture for fault detection and localization in DC microgrids. IEEE Access. 2019;7:145371–84. doi:10.1109/access.2019.2945397. [Google Scholar] [CrossRef]
20. Mishra PK, Yadav A. Combined DFT and fuzzy based faulty phase selection and classification in a series compensated transmission line. Model Simul Eng. 2019;2019:3467050. doi:10.1155/2019/3467050. [Google Scholar] [CrossRef]
21. Xiao J, Zhou J, Li C, Xiao H, Zhang W, Zhu W. Multi-fault classification based on the two-stage evolutionary extreme learning machine and improved artificial bee colony algorithm. Proc Inst Mech Eng Part C J Mech Eng Sci. 2014;228(10):1797–807. doi:10.1177/0954406213496968. [Google Scholar] [CrossRef]
22. Musa MHH, He Z, Fu L, Deng Y. Linear regression index-based method for fault detection and classification in power transmission line. IEEJ Trans Electr Electron Eng. 2018;13(7):979–87. doi:10.1002/tee.22654. [Google Scholar] [CrossRef]
23. Tong X, Dong X, Manzoor S, Wang Y, Zhao Z. Robust fault location method for transmission lines using PMUs. IEEE Trans Power Deliv. 2023;38(4):2338–47. doi:10.1109/TPWRD.2023.3240717. [Google Scholar] [CrossRef]
24. Bin Akter S, Pias TS, Deeba SR, Hossain J, Rahman HA. Ensemble learning based transmission line fault classification using phasor measurement unit (PMU) data with explainable AI (XAI). PLoS One. 2024;19(2):e0295144. doi:10.1371/journal.pone.0295144. [Google Scholar] [PubMed] [CrossRef]
25. Yan Z, Yang Y. Deep learning-based fault location using PMU in tapped four-circuit transmission lines. Int J Dyn Control. 2024;12(5):1270–8. doi:10.1007/s40435-023-01296-1. [Google Scholar] [CrossRef]
26. Faza A, Al-Mousa A, Alqudah R. Optimal PMU placement for fault classification and localization using enhanced feature selection in machine learning algorithms. Int J Energy Res. 2024;2024(1):5543160. doi:10.1155/2024/5543160. [Google Scholar] [CrossRef]
27. Sahoo AK, Samal SK. Online fault detection and classification of 3-phase long transmission line using machine learning model. Multiscale Multidiscip Model Exp Des. 2023;6(1):135–46. doi:10.1007/s41939-022-00132-x. [Google Scholar] [CrossRef]
28. Najafzadeh M, Pouladi J, Daghigh A, Beiza J, Abedinzade T. Fault detection, classification and localization along the power grid line using optimized machine learning algorithms. Int J Comput Intell Syst. 2024;17(1):49. doi:10.1007/s44196-024-00434-7. [Google Scholar] [CrossRef]
29. Hassan M, Biswas SP, Chowdhury SAH, Mondal S, Islam MR, Shah R. Fault classification and localization of multi-machine-based ieee benchmark test case power transmission lines using optimizable weighted extreme learning machine. Electr Power Syst Res. 2024;235(155):110857. doi:10.1016/j.epsr.2024.110857. [Google Scholar] [CrossRef]
30. Asadi Majd A, Samet H, Ghanbari T. K-NN based fault detection and classification methods for power transmission systems. Prot Control Mod Power Syst. 2017;2(1):32. doi:10.1186/s41601-017-0063-z. [Google Scholar] [CrossRef]
31. Anwar T, Mu C, Yousaf MZ, Khan W, Khalid S, Hourani AO, et al. Robust fault detection and classification in power transmission lines via ensemble machine learning models. Sci Rep. 2025;15(1):2549. doi:10.1038/s41598-025-86554-2. [Google Scholar] [PubMed] [CrossRef]
32. Yuvaraju V, Thangavel S, Golla M. Applications of artificial intelligence and PMU data: a robust framework for precision fault location in transmission lines. IEEE Access. 2024;12(6):136565–87. doi:10.1109/access.2024.3464088. [Google Scholar] [CrossRef]
33. Swain KB, Mahato SS, Cherukuri M. Expeditious situational awareness-based transmission line fault classification and prediction using synchronized phasor measurements. IEEE Access. 2019;7:168187–200. doi:10.1109/access.2019.2954337. [Google Scholar] [CrossRef]
34. Swain K, Anand A, Samanta IS, Cherukuri M. Machine learning-based approaches for transmission line fault detection using synchrophasor measurements in a smart grid. In: Smart grid. Vol. 3. Cham, Switzerland: Springer International Publishing; 2023. p. 77–92. doi:10.1007/978-3-031-38506-3_4. [Google Scholar] [CrossRef]
35. Swain K, Cherukuri M. Intelligent fault analysis of transmission line using phasor measurement unit incorporating auto-reclosure protection scheme. SN Appl Sci. 2021;3(5):531. doi:10.1007/s42452-021-04510-x. [Google Scholar] [CrossRef]
36. Gopakumar P, Reddy MJB, Mohanta DK. Adaptive fault identification and classification methodology for smart power grids using synchronous phasor angle measurements. IET Gener Transm Distrib. 2015;9(2):133–45. doi:10.1049/iet-gtd.2014.0024. [Google Scholar] [CrossRef]
37. Huang GB, Zhou H, Ding X, Zhang R. Extreme learning machine for regression and multiclass classification. IEEE Trans Syst Man Cybern Part B Cybern. 2012;42(2):513–29. doi:10.1109/TSMCB.2011.2168604. [Google Scholar] [PubMed] [CrossRef]
38. Tang J, Deng C, Huang GB. Extreme learning machine for multilayer perceptron. IEEE Trans Neural Netw Learn Syst. 2016;27(4):809–21. doi:10.1109/TNNLS.2015.2424995. [Google Scholar] [PubMed] [CrossRef]
39. Datasheet NI 9074 [Internet]. [cited 2025 Oct 1]. Available from: https://docs-be.ni.com/bundle/crio-9072-9073-9074-seri/raw/resource/enus/374639f.pdf. [Google Scholar]
40. Datasheet NI 9227 [Internet]. [cited 2025 Oct 1]. Available from: https://www.es-france.com/index.php?controller=attachment&id_attachment=12702&srsltid=AfmBOoqqZ-GWakwFIyIQuBAwVF3d_4xR1VzoCu_iTcOySHai4BIpMT8e. [Google Scholar]
41. Datasheet NI. Datasheet NI 9403 [Internet]. [cited 2025 Oct 1]. Available from: https://ni.nubicom.co.kr/img/pdf/374069a_02.pdf. [Google Scholar]
42. Datasheet NI 9401 [Internet]. [cited 2025 Oct 1]. Available from: https://www.datatec.eu/media/6c/77/01/1682505956/374068a_02.pdf?ts=1691656533&srsltid=AfmBOopJViBfGzhyRrWsfcvLMwwPjQgVOWPtypLyd2ct7vB4f0UND2iI. [Google Scholar]
43. Moradzadeh A, Teimourzadeh H, Mohammadi-Ivatloo B, Pourhossein K. Hybrid CNN-LSTM approaches for identification of type and locations of transmission line faults. Int J Electr Power Energy Syst. 2022;135(1):107563. doi:10.1016/j.ijepes.2021.107563. [Google Scholar] [CrossRef]
44. Wilches-Bernal F, Jiménez-Aparicio M, Reno MJ. A machine learning-based method using the dynamic mode decomposition for fault location and classification. In: 2022 IEEE Power & Energy Society Innovative Smart Grid Technologies Conference (ISGT); 2022 Apr 24–28; New Orleans, LA. USA. doi:10.1109/ISGT50606.2022.9817543. [Google Scholar] [CrossRef]
45. Mukherjee D, Chakraborty S, Ghosh S. Deep learning-based multilabel classification for locational detection of false data injection attack in smart grids. Electr Eng. 2022;104(1):259–82. doi:10.1007/s00202-021-01278-6. [Google Scholar] [CrossRef]
46. Qasim Khan M, Mohamud Ahmed M, Haidar AMA. An accurate algorithm of PMU-based wide area measurements for fault detection using positive-sequence voltage and unwrapped dynamic angles. Measurement. 2022;192(4):110906. doi:10.1016/j.measurement.2022.110906. [Google Scholar] [CrossRef]
47. Chavez JJ, Kumar NV, Azizi S, Guardado JL, Rueda J, Palensky P, et al. PMU-voltage drop based fault locator for transmission backup protection. Electr Power Syst Res. 2021;196(11):107188. doi:10.1016/j.epsr.2021.107188. [Google Scholar] [CrossRef]
48. Badran O, Rizk MEM, Abulanwar S. Comprehensive fault reporting for three-terminal transmission line using adaptive estimation of line parameters. Electr Power Syst Res. 2023;223(1):109536. doi:10.1016/j.epsr.2023.109536. [Google Scholar] [CrossRef]
49. Venkatachalam Y, Subbaiyan T. Intelligent fault diagnosis in power systems: a comparative analysis of machine learning-based algorithms. Expert Syst Appl. 2025;265(4):125945. doi:10.1016/j.eswa.2024.125945. [Google Scholar] [CrossRef]
50. Guo B, Yang B, Wang S, Shi W, Yang F, Wang D. Machine learning-based fault diagnosis and classification of three-phase transmission lines with RFE and domain knowledge. Electr Power Syst Res. 2025;247(2):111777. doi:10.1016/j.epsr.2025.111777. [Google Scholar] [CrossRef]
Cite This Article
 Copyright © 2025 The Author(s). Published by Tech Science Press.
This work is licensed under a Creative Commons Attribution 4.0 International License , which permits unrestricted use, distribution, and reproduction in any medium, provided the original work is properly cited.
 Downloads
 Citation Tools