
 Submit a Paper
 Propose a Special lssue
 Open Access
ARTICLE

An AI/ML Framework-Driven Approach for Malicious Traffic Detection in Open RAN
1 Department of Cyber Security, Kookmin University, Seoul, 02707, Republic of Korea
2 Department of Information Security Cryptography Mathematics, Kookmin University, Seoul, 02707, Republic of Korea
* Corresponding Author: Hwankuk Kim. Email:
(This article belongs to the Special Issue: Cutting-Edge Security and Privacy Solutions for Next-Generation Intelligent Mobile Internet Technologies and Applications)
Computer Modeling in Engineering & Sciences 2025, 145(2), 2657-2682. https://doi.org/10.32604/cmes.2025.070627
Received 20 July 2025; Accepted 20 October 2025; Issue published 26 November 2025
 View Full Text
 Download PDF
Abstract
The open nature and heterogeneous architecture of Open Radio Access Network (Open RAN) undermine the consistency of security policies and broaden the attack surface, thereby increasing the risk of security vulnerabilities. The dynamic nature of network performance and traffic patterns in Open RAN necessitates advanced detection models that can overcome the constraints of traditional techniques and adapt to evolving behaviors. This study presents a methodology for effectively detecting malicious traffic in Open RAN by utilizing an Artificial-Intelligence/Machine-Learning (AI/ML) Framework. A hybrid Transformer–Convolutional-Neural-Network (Transformer-CNN) ensemble model is employed for anomaly detection. The proposed model generates final predictions through a soft-voting technique based on the predictive outputs of the two models with distinct features. This approach improves accuracy by up to 1.06% and F1 score by 1.48% compared with a hard-voting technique to determine the final prediction. Furthermore, the proposed model achieves an average accuracy of approximately 98.3% depending on the time step, exhibiting a 1.43% increase in accuracy over single-model approaches. Unlike single-model approaches, which are prone to overfitting, the ensemble model resolves the overfitting problem by reducing the deviation in validation loss.Keywords
Conventional mobile networks have maintained security through a closed architecture and dependence on a single vendor. In conventional mobile networks, a single vendor designs and operates the system by integrating hardware and software, thereby simplifying security control. Because external access is restricted, the overall attack surface remains relatively narrow. In such single-vendor environments, consistent security policies can be maintained, and security threats within the network are addressed in an integrated manner using that vendor’s security protocols. However, the emergence of the Open Radio Access Network (Open RAN or O-RAN) in 2019, adopting an open architecture, has enhanced network flexibility and efficiency while simultaneously increasing exposure to potential security risks.
O-RAN is designed to accommodate hardware and software from multiple vendors, thereby increasing interoperability among heterogeneous systems within the network while simultaneously weakening the consistency of security policies. The open architecture further accentuates supply chain security issues, and the proliferation of Software-Defined Networking (SDN) and Network Function Virtualization (NFV) has expanded the attack surface even more [1]. Unlike traditional closed RAN system, where a single vendor could exercise centralized control over security and threat mitigation, O-RAN integrates numerous suppliers and diverse software, potentially increasing system vulnerabilities. Adversaries can exploit this complexity by targeting different elements across the O-RAN infrastructure, thereby amplifying security threats. Consequently, the O-RAN environment necessitates more intelligent and sophisticated security solutions capable of addressing its multifaceted and rapidly evolving threat landscape.
Traditional pattern-matching-based detection methods can effectively detect known security threats using predefined attack signatures. However, in O-RAN environments, where new attack types continuously emerge, these methods are insufficient for detecting new threats. Consequently, manually updating detection rules can create security gaps. Machine learning (ML)-based detection methods offer greater adaptability to evolving threats but suffer from reduced efficiency as network complexity increases. Kocher and Kumar [2] reported that in multi-class classification, accuracy often declines due to dynamically expanding dataset. Moreover, shallow learning methods require large training data, making them unsuitable for heterogeneous O-RAN environments. Traditional batch-learning methods are also inadequate for fast-changing conditions. Real-time detection requires models that support online learning and streaming data processing, which demand substantial computational resources and limit practical deployment [3]. Therefore, O-RAN requires advanced adaptive detection models capable of real-time, dynamic responses to continuous changes in network performance and traffic patterns.
This study proposes a methodology for effectively detecting malicious traffic by utilizing the AI/ML Framework within the O-RAN. The proposed approach implements an anomaly detection system optimized for O-RAN, utilizing its framework for automated data preprocessing, model training, and deployment of trained detection models through xApps or rApps. The anomaly detection model integrates a Transformer and a Convolutional Neural Network (CNN). O-RAN monitors, controls, and optimizes E2 Nodes through a near-real-time and non-real-time RAN Intelligent Controller (RIC), from which traffic and radio signal metadata can be collected and used for intelligent analysis. To detect abnormal sequential patterns, the Transformer extracts temporal dependencies through its self-attention mechanism, while the CNN learns spatial representations for refined network pattern analysis. The final prediction output is generated using weighted combinations of both models’ feature representations. This Transformer-CNN ensemble-based hybrid model enables real-time detection and response and is particularly effective in heterogeneous O-RAN.
Currently, O-RAN lacks systematic security mechanisms, rendering its vulnerable to various cyber threats. In particular, attacks such as denial of service (DoS), distributed DoS (DDoS), and port scanning can undermine the integrity and reliability of the network. Owing to its open architecture that supports interoperability among multiple vendors, O-RAN exhibits a broader attack surface compared to traditional closed networks. Consequently, malicious actors can exploit this environment to target a wider range of components within the network. These security vulnerabilities are expected to become even more critical in the context of 5G and 6G. The intelligent malicious traffic detection method proposed in this study aims to address these issues by providing a practical and effective solution for responding to security threats in 5G and 6G. Specifically, the proposed technique incorporates the Transformer-CNN hybrid model to overcome the limitations of conventional ML and pattern-matching-based detection methods discussed earlier. This integration enables high-performance, real-time detection and precise threat analysis. The proposed method is expected to be applicable to a wide range of wireless network environments, including but not limited to O-RAN.
The remainder of this paper is organized as follows. Section 2 presents the background and overall structure of O-RAN and the vulnerabilities that may arise in such systems, along with a review of related studies. Section 3 describes methodologies for detecting malicious traffic in O-RAN by utilizing the AI/ML Framework. Section 4 details the structure of the ensemble-based anomaly detection model and explains how the model’s predictions are derived. Section 5 describes the experimental procedures used to assess the performance of the proposed model; this section includes the O-RAN dataset, preprocessing methods, hyperparameters, and evaluation metrics. Section 6 presents the experimental results and an in-depth analysis. Finally, Section 7 presents conclusions, summarizing the key findings of this study.
2 Background and Related Works
This section introduces the background and architecture of the O-RAN. In traditional mobile networks, the RAN was built and operated in a closed configuration [4]. These legacy RAN systems were usually provided by a single vendor offering an integrated package of hardware and software, which brought advantages in terms of security and performance optimization. However, they also suffered from limitations such as vendor lock-in and high deployment costs. To overcome these issues, O-RAN adopts a network architecture that separates hardware and software and supports interoperability among equipment from various vendors based on open standards. O-RAN separates the traditional RAN into the Open-RAN Radio Unit (O-RU), Open-Distributed Unit (O-DU), and Open-Centralized Unit (O-CU), thereby transitioning from a closed network system to a modular, layered architecture. This modularization enhances both component independence and network flexibility. The O-RAN Alliance, a global standardization group, has defined technical specifications for open interfaces that allow seamless communication between O-RAN components [5,6]. Standardized fronthaul, midhaul, and backhaul interfaces ensure smooth interconnection between O-RU, O-DU, O-CU, and the core network. Fig. 1 compares the traditional RAN and O-RAN. By incorporating SDN, O-RAN reduces hardware dependency and improves operational efficiency. In addition, the use of commercial off-the-shelf (COTS) hardware lowers infrastructure costs and reduces dependence on any single vendor.

Figure 1: Comparison of traditional RAN and O-RAN architectures
O-RAN optimizes RAN performance by incorporating two types of RICs in addition to the O-RU, O-DU, and O-CU. These RICs operate on different time scales to perform policy and control functions. The Near-real-time (Near-RT) RIC operates within a control loop ranging from 10 ms to 1 s, while the Non-real-time (Non-RT) RIC operates on a control loop exceeding 1 s. The Near-RT RIC is typically deployed close to RAN nodes and the network edge, where it manages radio resources through xApps. In contrast, the Non-RT RIC is deployed within the Service Management and Orchestration (SMO) of the Mobile Network Operator (MNO) and is responsible for managing ML models and applying long-term network policies through rApps. These RICs communicate through the A1 interface, with the Non-RT RIC deploying A1 policies that define optimization objectives for the Near-RT RIC.
Fig. 2 shows the overall architecture of the O-RAN. The ML models are managed through the AI/ML Framework. The framework automates data preprocessing and model training, enabling efficient management and utilization of trained models by components such as xApps and rApps. Models trained using the AI/ML Framework are available in xApps and rApps through KServe, which is provided within the framework. The operational workflow of the AI/ML Framework is explained in more detail in Section 3.

Figure 2: Overall architecture of O-RAN
2.2 Problem Statement and Challenges in Open RAN
Despite being designed to complement traditional RAN, O-RAN still faces several challenges in terms of security [7–9]. Its open interfaces and multi-vendor environment broaden the attack surface compared with single-vendor networks, and they have inherent risks related to supply chain security and increased operational complexity. In particular, maintaining consistent security policies across diverse components within O-RAN is difficult, which can lead to a higher likelihood of security vulnerabilities. Therefore, to support the deployment and adoption of O-RAN, it is essential to define new threat models and establish corresponding security policies and countermeasures. The O-RAN Alliance [10] has summarized and organized a range of potential security issues that may arise within O-RAN.
• Security Vulnerabilities in AI/ML Systems Utilized in the Open RAN Architecture: In O-RAN, RIC applications such as xApps and rApps utilize AI/ML to optimize network performance and perform security management. However, AI/ML systems are subject to several security vulnerabilities. Attackers may gain access to the training dataset used by AI/ML models and manipulate the data. If models are learning during operation, they may persistently inject malicious data to distort the model’s behavior. Furthermore, AI/ML training data often contain sensitive or confidential information, which attackers can extract to cause data breaches.
• Security Risks in 5G Wireless Networks: Like other wireless technologies, O-RAN is susceptible to attacks such as jamming, spoofing, and sniffing, which exploit the analysis of physical downlink and uplink control channels and signaling. Attackers can launch jamming or spoofing attacks on various physical channels, including the Physical Broadcast Channel (PBCH), Physical Downlink Control Channel (PDCCH), Physical Uplink Control Channel (PUCCH), and Physical Random Access Channel (PRACH), by targeting synchronization and control signals. These signals can also be intercepted or falsified. In particular, Radio Frequency (RF) spoofing targeting the O-RU presents a security threat because the UE cannot verify whether it is communicating with an operator-owned legitimate device. Cognitive Radio Networks allow unlicensed users to utilize spectrum resources efficiently. Attackers can conduct DoS attacks on Cognitive Radio Network by injecting interference or spoofing Power Unit (PU) signals.
To address these security challenges, an intelligent security model capable of effectively detecting and responding to malicious traffic within O-RAN must be implemented. Traditional security solutions and single ML models have limitations in analyzing O-RAN’s dynamic network environments and complex traffic patterns in real time. Therefore, more advanced detection techniques must be applied to analyze attack behaviors in near-real-time and to accurately identify whether traffic is benign or malicious. In this study, we first examine prior research in which AI was utilized to address security vulnerabilities in O-RAN and then propose an ensemble-based hybrid model to enhance the detection performance of malicious traffic within O-RAN.
This section presents ongoing research efforts aimed at addressing security issues in 5G mobile networks and O-RAN. Since the advent of AI, network management and protection have increasingly depended on AI-based technologies. Table 1 summarizes recent studies that employ AI to mitigate potential security issues within 5G. It details the methodologies proposed in each study, the datasets and models utilized, and the corresponding performance evaluation results.
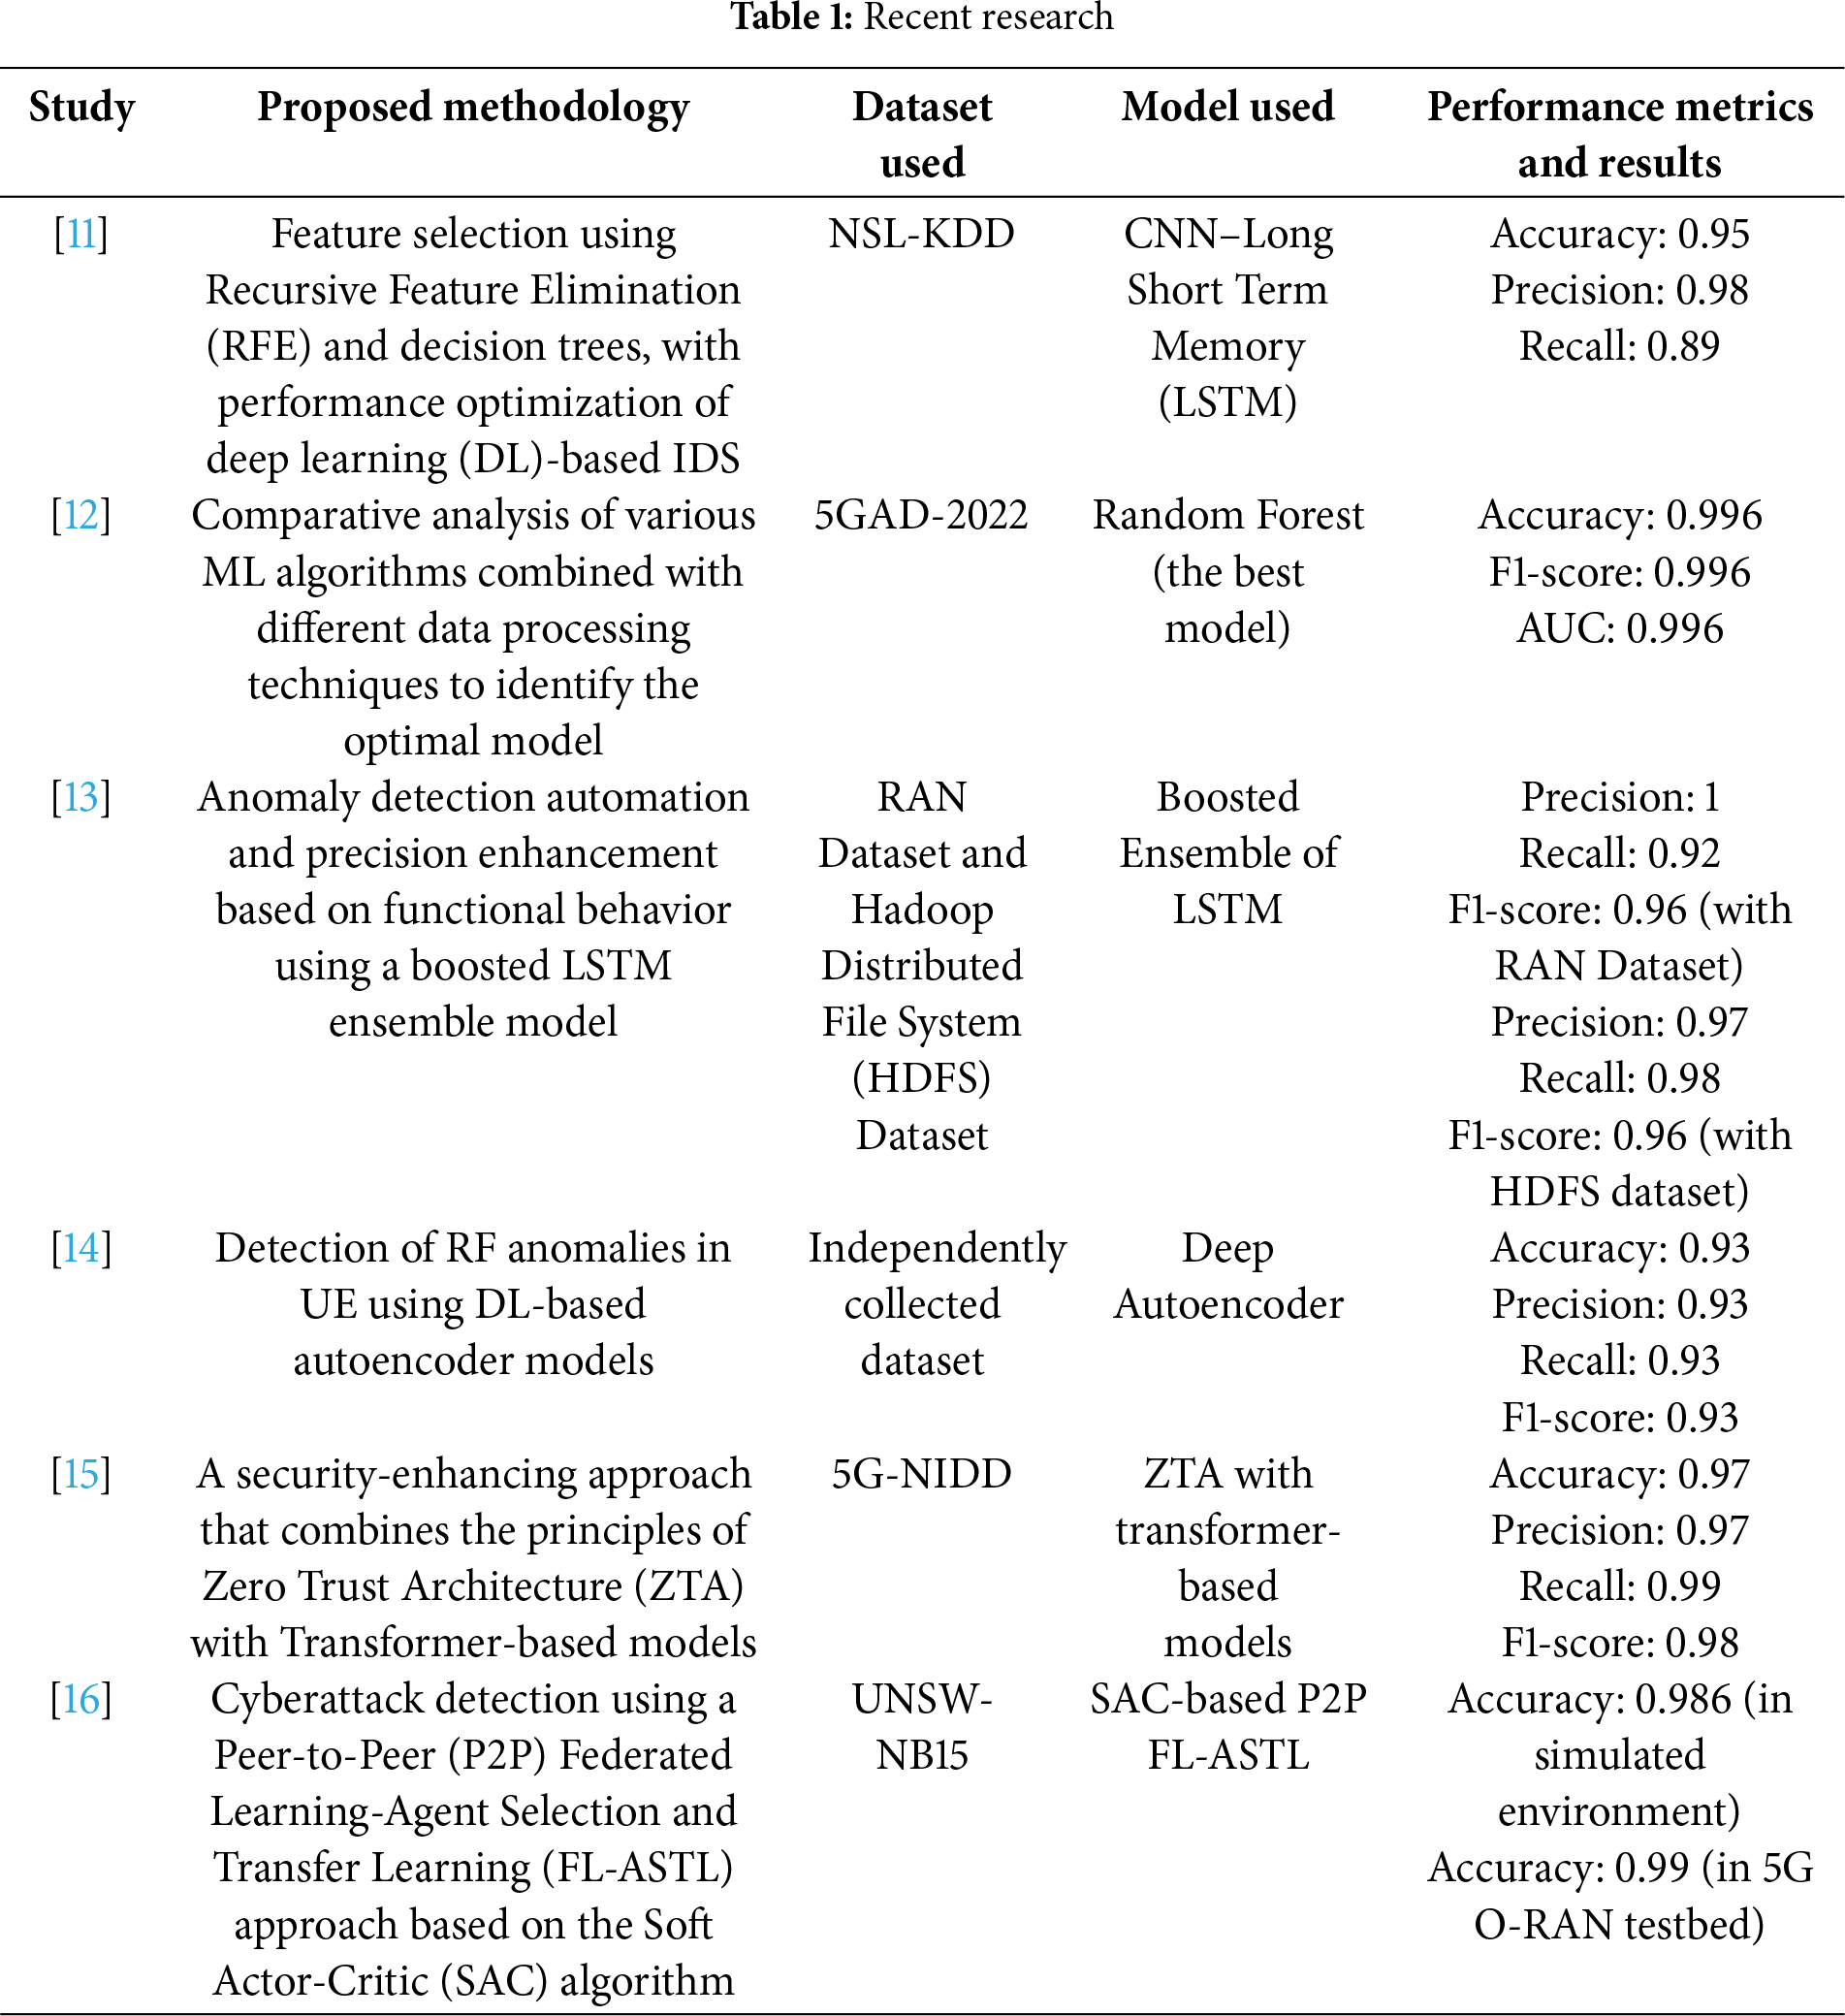
For 5G networks, many researchers use AI technologies to detect malicious traffic linked to cyberattacks. Bamber et al. [11] proposed a DL-based IDS to enhance existing IDS in real-world environments. This system combines RFE and a decision tree classifier for data preprocessing. Using the refined NSL-KDD dataset, their CNN-LSTM model achieved the best results with 95% accuracy, 0.89 recall, and 0.94 F1 score.
Oliveira et al. [12] compared multiple ML algorithms and preprocessing methods for detecting anomalous traffic from reconnaissance, network reconfiguration, and DoS attack. They used 20% of the attack samples from the 5GAD-2022 dataset [17], and among the evaluated model, random forest achieved the highest performance in terms of F1 score, AUC, and accuracy.
Sundqvist et al. [13] proposed a method for anomaly detection in 5G RAN logs using a boosted ensemble of LSTM models from a 5G RAN testbed developed by TietoEvry. The model learned nomal functional behaviour and detected injected anomalies, outperforming a single LSTM with 0.92 recall and 0.96 F1 score. Additional validation using HDFS logs confirmed its generalization capability beyond the RAN environment.
In the field of O-RAN, extensive research has focused on detecting cyberattacks that arise within open interfaces and the RIC, which is closely related to the present study. Başaran et al. [14] proposed a DL-based autoencoder model that detects RF anomalies. The model leverages extended applications operating on a Near-RT RIC within a 5G. By collecting radio quality indicators from various user devices, the model achieved a 10% improvement in overall performance and addressed RF fluctuations, throughput degradation, and handover issues.
Hamhoum et al. [15] proposed a security enhancement approach that combines the principles of ZTA with a Transformer-based model to mitigate vulnerabilities of O-RAN’s open architecture. This method enables real-time analysis of time-series data, boosting anomaly detection performance. The model was validated using the 5G-NIDD [18] dataset, which was collected through User Datagram Protocol (UDP) Flood, HTTP Flood, and DoS attacks in a real-world 5G testbed. This method achieved an 97% accuracy and 0.98 F1 score, outperforming existing benchmark models.
Alalyan et al. [16] proposed a novel SAC-based P2P Federated Learning-Agent Selection and Transfer Learning (FL-ASTL) technique to detect cyberattacks that may occur within the RIC of O-RAN. The proposed method integrated client selection and transfer learning into a P2P FL system built on the RIC framework. The results revealed that the proposed approach could reduce communication costs by up to 74% compared with conventional SAC-based P2P FL methods.
A comprehensive analysis of related studies reveals that research on malicious traffic detection in O-RAN remains limited, even after the emergence of O-RAN. Although some prior works have proposed detection techniques, most are based on speculative assumptions or lack strong integration with the actual O-RAN architecture, thereby reducing their practical applicability. To address these limitations, this study proposes a malicious traffic detection system that leverages the AI/ML Framework, one of the core components of O-RAN, to perform AI-driven training and inference. Distinct from prior research, the proposed approach presents an intrusion detection mechanism that can be directly implemented and applied within the O-RAN architecture, thereby aiming to establish a more practical and feasible security framework.
3 Anomaly Detection Utilizing the AI/ML Framework of Open RAN
To address the emerging security vulnerabilities in O-RAN, we propose a methodology for detecting anomalies in base station signaling. The proposed anomaly detection method is implemented by leveraging the AI/ML Framework provided by the O-RAN. The workflow of the proposed anomaly detection methodology is showed in Fig. 3. This approach consists of the following three key stages: (1) data collection, (2) training of the anomaly detection model, and (3) anomaly detection.

Figure 3: Architecture of an anomaly detection system utilizing the AI/ML framework of O-RAN
Data Collection. The proposed anomaly detection approach utilizes Key Performance Indicator (KPI) data collected from E2 nodes in the base station. Acting as the E2 interface, the E2 Terminator passes the data it received from E2 nodes to the Data Collection xApp. This xApp stores the KPI data in the Influx database of the Near-RT RIC. Influx is a representative database optimized for time-series data. It is optimized for storing continuously collected base station KPI data through a subscription-based model. After storing a sufficient volume of data, the Near-RT RIC database transfers it to Cassandra, the feature storage database within the AI/ML Framework. During this transfer from the Near-RT RIC database to Cassandra, a data collection period is specified, enabling the initial stage of data preprocessing. This process is executed using query commands exchanged between the respective databases.
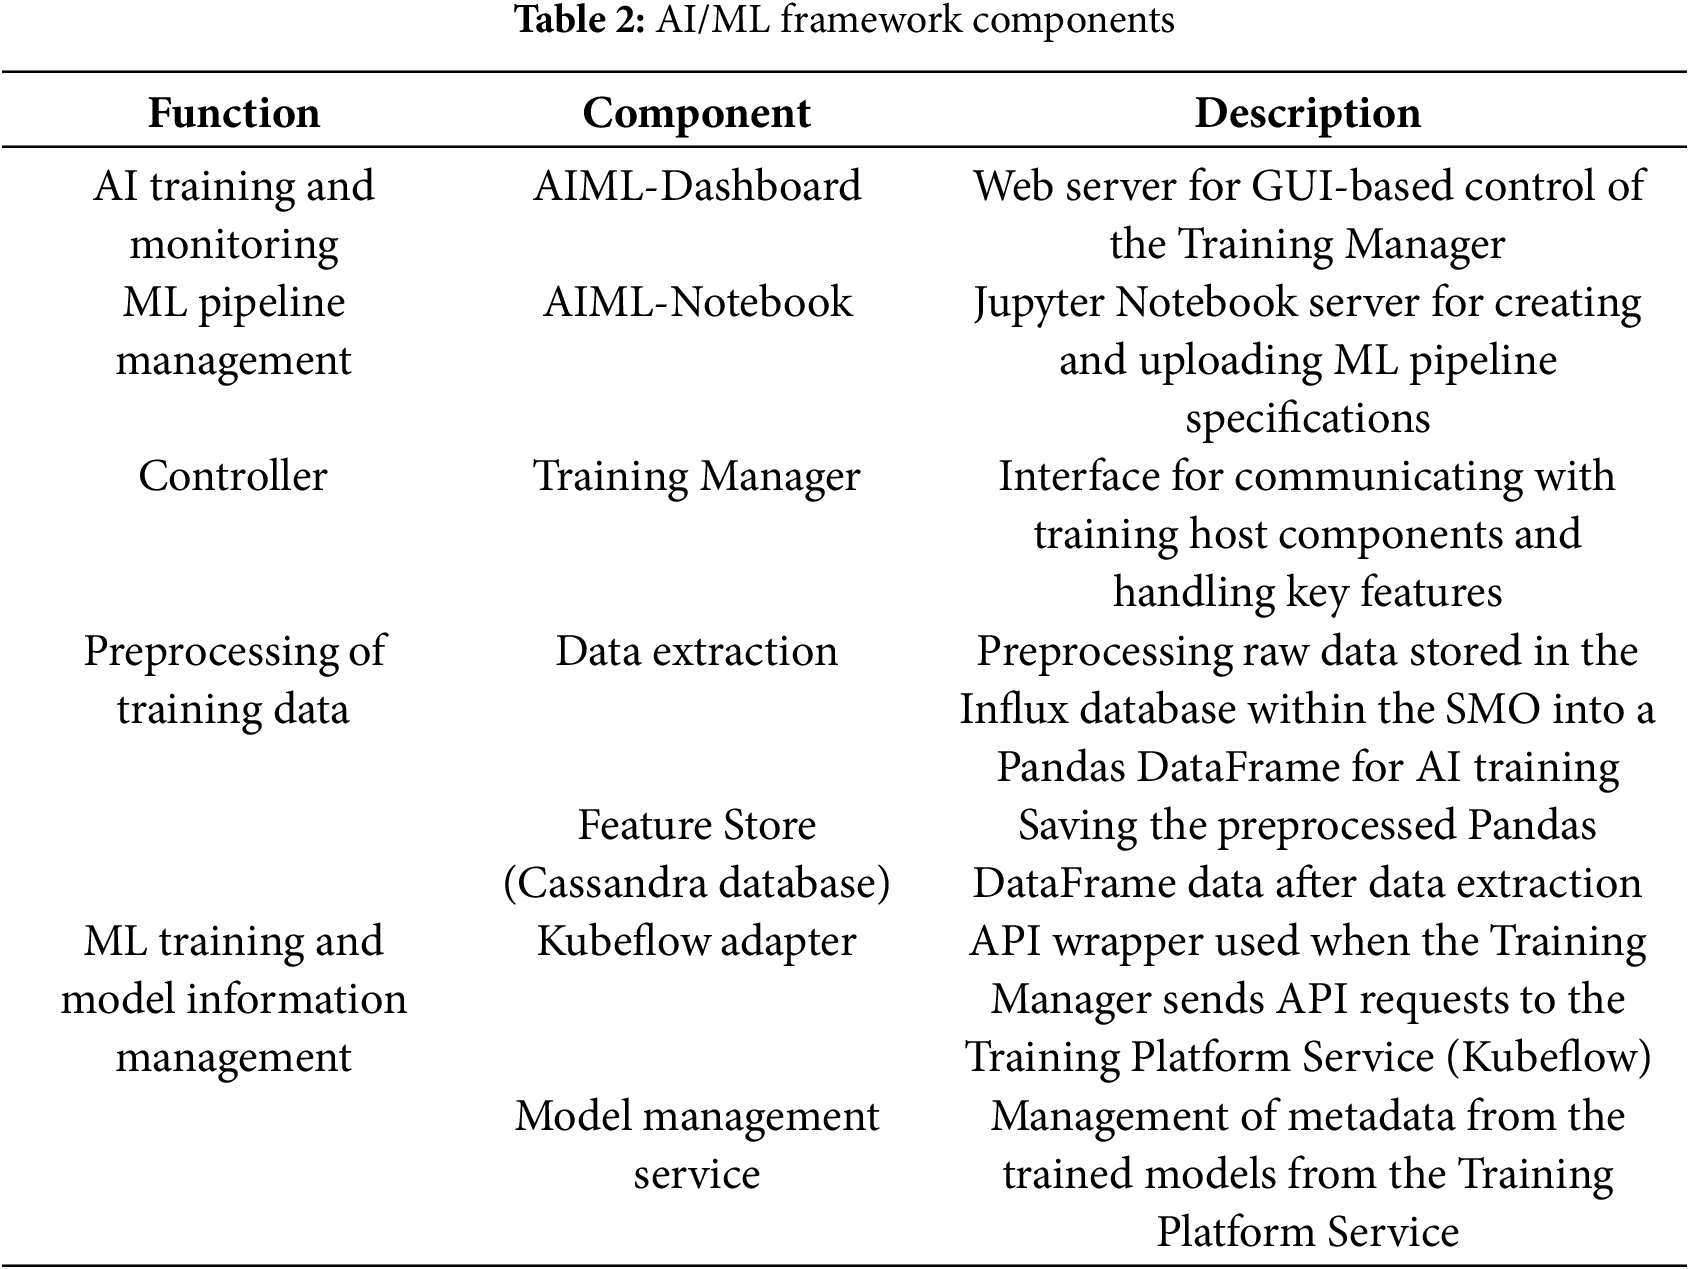
Training of the Anomaly Detection Model. The anomaly detection model is trained within the AI/ML Framework. It utilizes Kubeflow, an open-source platform built on Kubernetes. Kubeflow supports an environment optimized for the efficient training, deployment, and scaling of models. It handles each stage of the ML lifecycle and manages the metadata and models generated during training. Table 2 explains the components of the AI/ML Framework.
The anomaly detection framework extracts training data from the Cassandra database and sends a training request to Kubeflow. The AI/ML pipeline is implemented using the AIML-Notebook component. The AI/ML pipeline is uploaded to the Kubeflow through the Kubeflow adapter and a new pipeline pod is automatically created. During the pipeline execution, the output and corresponding metadata are recorded in the MinIO storage.
Anomaly Detection. The trained anomaly detection model is saved in Leofs, the model storage of the AI/ML Framework. The stored model can be deployed as xApps and rApps, supporting both real-time and non-real-time anomaly detection. The Inference Platform Service (IPS) enables xApps and rApps to conduct inference using trained models.
• The xApp runs in the Near-RT RIC and is optimized for near-real-time anomaly detection, typically within 10 ms to 1 s. In practice, inference execution time has been measured in the range of approximately 3.8 to 5.6 ms, demonstrating the feasibility of real-time anomaly detection.
• The rApp runs in the Non-RT RIC and is used for detection and policy enforcement tasks that allow for response times longer than 1 s. The rApp can process extensive data volumes within the control loop time. Furthermore, rApp can deliver an A1 policy back to the Near-RT RIC, including suggested countermeasures. This allows O-RAN to support intelligent network control, dynamic optimization, and policy-driven operations.
4 Ensemble Transformer–CNN Model
The anomaly detection model proposed in this study is an ensemble Transformer–CNN model. Fig. 4 shows the structure of the proposed model. The main purpose of this model is to determine the final prediction result by applying the soft voting technique to the individual prediction outputs of the Transformer and CNN models. The ensemble Transformer–CNN model integrates two heterogeneous models using a shared deep neural network (DNN) component, thereby forming Transformer–DNN and CNN–DNN architectures. The proposed model operates in the following three stages:
1. Transformer–DNN training: Aimed at extracting sequential features.
2. CNN–DNN training: Designed to capture the representative features of each data.
3. Final prediction value calculation: Computes the average of the predictions from both models to generate the final prediction output.

Figure 4: Proposed transformer–CNN model architecture
The Transformer-DNN model integrates the Transformer and DNN architectures and is designed to process and classify time-series data. Kamal and Mashaly [19] proposed the Transformer-DNN hybrid model to overcome the limitations of traditional ML techniques in feature engineering and data preprocessing. This paper refer to the Transformer block among the models. In the proposed model, the Transformer consists of two main blocks. The first block is the Multi-head Attention block, in which multiple self-attention mechanisms operate in parallel. This block computes attention distributions that capture the relative importance of each input element and assigns distinct significance scores accordingly. The second block is the Feed-forward Network block. It is composed of Dense layers and sequentially receives the input and performs nonlinear transformations. Accordingly, the Feed-forward Network processes the input through forward propagation, following a unidirectional structure without any recurrent connections. Table 3 explains the structural details of the Transformer and DNN model.
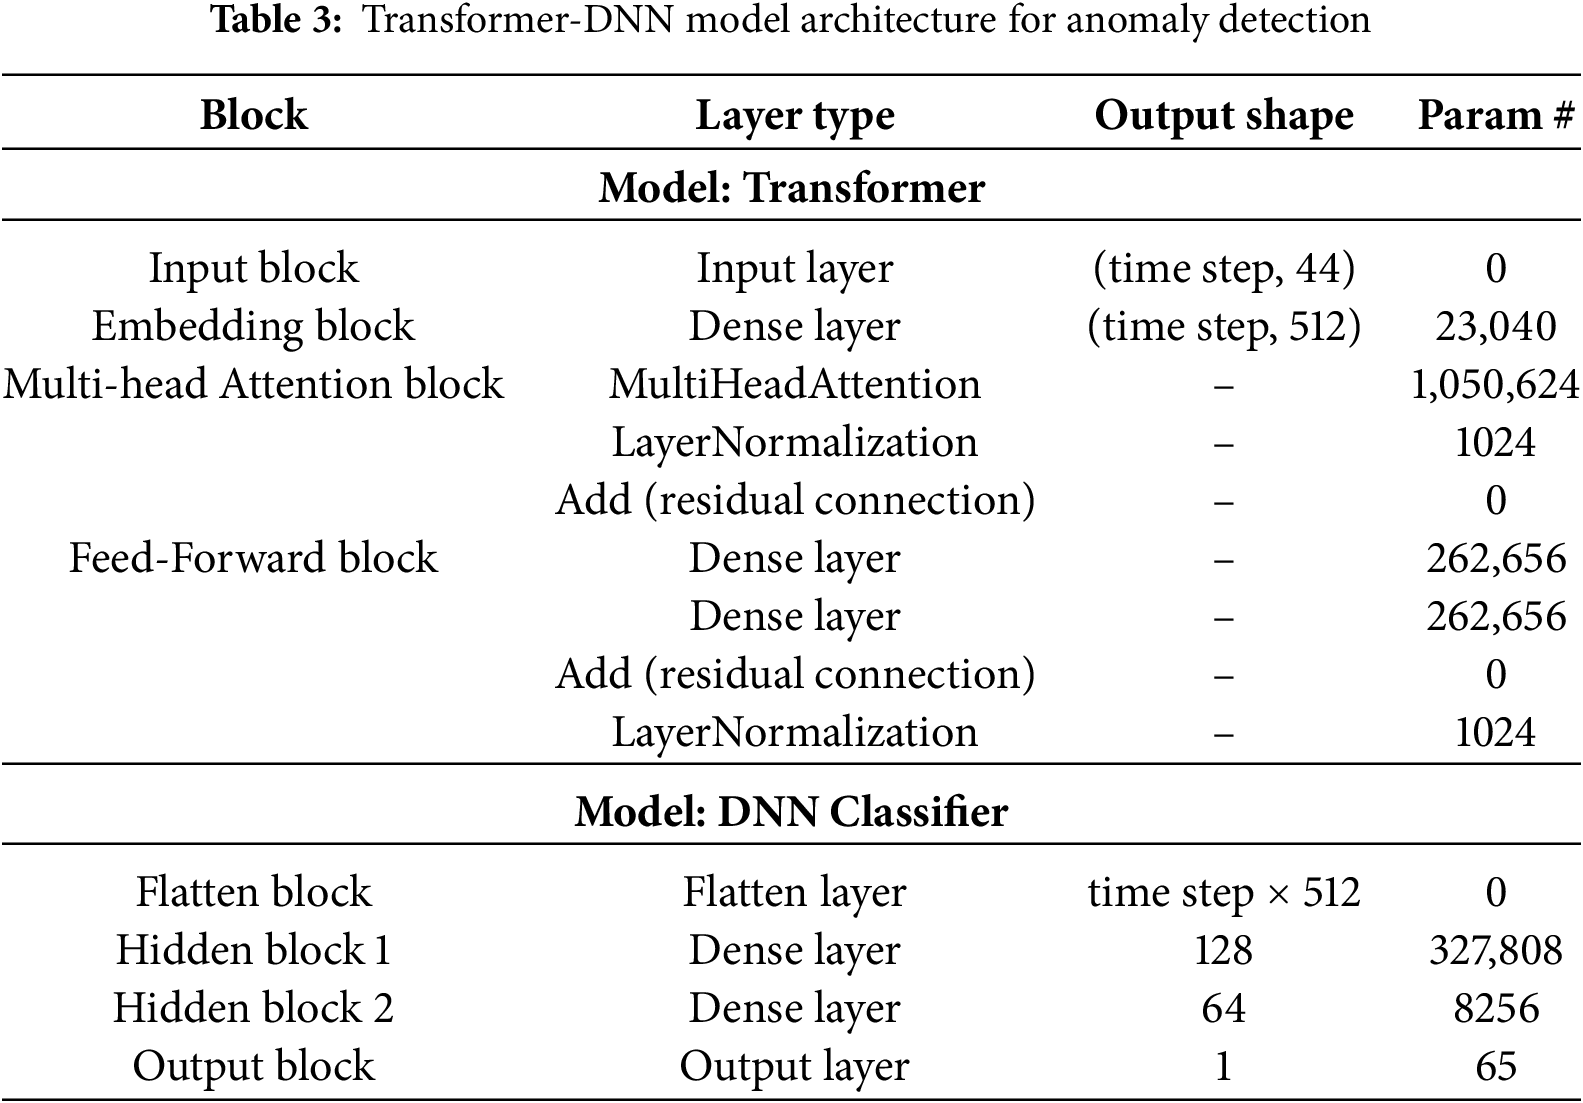
The entire Transformer block is divided into four sub-blocks. The Input block receives input data with dimensions of (5, 44). The Embedding block takes the output from the Input block and expands it into 512 features. The Multi-Head Attention block consists of three layers. First, the Multi-Head Attention layer employs 8 heads and a key dimension of 64. Second, the Layer Normalization layer applies normalization with ε =
The DNN model performs binary classification of normal and malicious classes by utilizing the output of the Transformer model. First, the Flatten block flattens the Transformer output
The CNN–DNN model is designed by integrating the 1D-CNN and DNN architectures to capture and classify diverse patterns and relationships in the input data. Ahmadzadeh et al. [20] proposed a time-distributed 1D-CNN-LSTM hybrid framework for detecting structural damage in raw multi-sensor time-series data. This paper referred to the 1D-CNN’s structure of the model proposed by Ahmadzadeh et al. [20]. The CNN model extracts essential features from input data through convolution operations and is especially well-suited for identifying local patterns in structured datasets such as time-series data. The proposed model consists of two blocks with 1D-CNN layers. The CNN is a neural network architecture that is specifically optimized for handling continuous one-dimensional data. Table 4 explains the architecture of the CNN-DNN model.

CNN model is structured into three primary blocks. The Input block receives input data with (5, 44) dimensions. The first 1D-CNN block includes three layers. The 1D convolutional layer receives input from the Input block and utilizes 16 filters with a kernel size of 3. The output from this 1D convolutional layer is passed to a LeakyReLU activation layer. The LeakyReLU layer is a modified form of the ReLU activation function that permits a small slope for negative inputs to prevent the dead neuron problem. The MaxPooling1D layer, configured with a pool size of 2, reduces the input data dimension to 3. The second 1D-CNN block has the same composition as the first block’s layer. In this case, the filter size is configured to 32 in the 1D convolutional layer.
DNN model that performs binary classification using the output from the CNN model. This is the same as the DNN model described in Section 4.1, which uses the Transformer model’s output as its input. The key difference here is that the input is replaced with the output from the CNN model.
4.3 Final Prediction of Transformer–CNN
We derive the final prediction result by applying the soft voting method to the prediction outputs of the two models. Through this process, the final prediction reflects the performance characteristics of both models. Algorithm 1 provides a detailed explanation of the four algorithms used to compute the final prediction result.

Train Transformer. The Train Transformer algorithm generates a trained Transformer model using the training data and a learning rate. The generated Transformer model is trained using both the training and validation datasets.
Train CNN. The Train CNN algorithm produces a trained CNN model using the training data and learning rate. The CNN model is trained using the same dataset and hyperparameters as the Transformer model.
Predict Test Data. This algorithm performs predictions using the trained Transformer and CNN models on the test dataset. The prediction results are stored in a list format.
Transformer-CNN Prediction. The final algorithm generates the prediction of the Transformer-CNN model by combining the outputs from the previous algorithms. Each model’s prediction is assigned a weight determined by its accuracy measured on the validation dataset during training. The final anomaly detection is performed by averaging the weighted prediction probabilities of the two models: if the resulting value exceeds a predefined threshold, the input is classified as anomalous; otherwise, it is classified as normal. The threshold is configured to maximize the F1 score.
Two experiments were conducted to evaluate model performance. This section provides an in-depth analysis of the dataset characteristics used in each experiment, along with a detailed description of the experimental environment and performance evaluation metrics.
5.1 Dataset: Open RAN KPI Data
The dataset used in this study consisted of RAN KPI data collected through a Near-RT RIC in an O-RAN, as described by Xavier et al. [21]. The experimental environment is composed of three components: (1) the RAN, (2) the Near-RT RIC, and (3) the Performance Metrics (PM) Collector.
The RAN is composed of a single gNB based on srsRAN and four UEs, deployed with a total of five Universal Software Radio Peripherals (USRPs). The UEs were operated under diverse mobility scenarios, including stationary, pedestrian, automobile, bus, and train, thereby generating traffic that realistically reflects actual channel conditions. The dataset was integrated with the RAN through a custom-built Near-RT RIC, which collected PM data from the gNB. The collected data were stored as a single unified file without undergoing data cleaning, preprocessing, or postprocessing. Notably, since the data were gathered in an environment where multiple UEs operated in parallel, they faithfully capture the characteristics of real network operations.
The O-RAN KPI dataset is categorized into normal and attack traffic. The normal traffic consists of web browsing, VoIP, IoT, and YouTube video streaming. This represents legitimate traffic patterns that reflect typical user activity. The attack traffic consists of DDoS Ripper, DoS Hulk, PortScan, and Slowloris. This is designed to simulate cyberattacks targeting network infrastructure. The O-RAN KPI dataset is stored in a public repository and is available through the “RAN Performance Measurements for Security Threats” [22].
Table 5 provides a comprehensive overview of the features that constitute the O-RAN KPI dataset. The dataset is divided into three categories: physical (PHY) layer, medium access control (MAC) layer, and extrinsic layer, containing a total of 44 features. The data are represented as feature vectors, which consist of aggregated performance indicators from the PHY and MAC layers over specific time intervals. The 15 PHY layer features capture information on channel quality and signal interference, enabling the gNB to evaluate and control the radio channel quality based on channel state reports from the UEs. The 23 MAC layer features reflect data and packet exchanges between the UEs and the gNB, including throughput, transmitted and lost packets, and buffer occupancy. Finally, the 6 Extrinsic layer features provide supplementary information used to identify individual traffic flows.

The O-RAN KPI dataset contains 3,175,140 rows. In this study, because the O-RAN KPI data are time-series in nature, the first 150,000 samples based on time were selected for use. Fig. 5 shows the proportion of normal and malicious traffic in the dataset used in this study and the proportion of each traffic type. Normal traffic consists of 59,463 instances, accounting for 39.6% of the dataset. Among the normal traffic types, IoT traffic holds the largest share (13.2%), followed by SIPP (10.2%), YouTube (8.2%), and Web Browsing (8.0%). Malicious traffic comprises 90,537 instances, making up 60.4% of the dataset. Within this category, PortScan has the highest proportion (20.6%), followed by DoS-Hulk (20.5%), DDoS-Ripper (12.9%), and Slowloris (6.4%).

Figure 5: (a) Label distribution of normal and attack traffic. (b) Label distribution based on 8 traffic types
This study was conducted in the following experimental environment: Ubuntu 22.04.4 LTS. AMD Ryzen Threadripper PRO 7965WX 24-Cores, RAM 256 GB. In an O-RAN environments, those up to the operation stage of the AI/ML Framework were implemented and involved extracting the dataset from the Near-RT RIC database and performing comprehensive model training. Model performance was evaluated within the Kubeflow. Fig. 6 shows the entire experimental procedure followed in this study.

Figure 6: Experimental workflow
Data Preprocessing. Data were preprocessed in six distinct steps. The input dataset was scaled using the Standard Scaler, which standardizes each feature to have a mean of 0 and a variance of 1. During this process, the “label” and “mobPattern” features were excluded from scaling as they are string-type values; instead, they are processed through encoding. After scaling and encoding were performed, the dataset was sorted based on the “timestamp” feature. This was to align with the characteristics of time-series models. The dataset was then divided into three subsets: training, validation, and testing. The ratio of the three subsets was 6:2:2. All data features described in Section 5.1 were utilized in the experiments. The proposed model receives input in the form of a three-dimensional structure. To preprocess the time-series data, we applied a sliding-window technique [24], which converts fixed length contiguous segments into windowed inputs. The key hyperparameters are the window size, shift, and stride: the window size specifies the length of each grouped segment; the shift denotes the offset between adjacent windows; and the stride defines the sampling interval within a window. After preprocessing, the
Training Model. The hyperparameter settings used in this study are consistent by Kamal and Mashaly [19]. Table 6 summarizes the principal hyperparameters adopted. The learning rate was set to 0.001 to enable fine-grained weight updates during training. For binary classification, we employed the binary cross-entropy loss, which measures the discrepancy between the true labels and the model’s predicted class probabilities. ReLU activations were applied to the hidden layers to mitigate vanishing gradients and improve computational efficiency, while a Sigmoid activation was used in the output layer to implement logistic regression for binary classification. To optimize the time-step configuration, we explored a range from 1 to 100 using a grid-search procedure and compared model performance across intervals. The same set of hyperparameters defined in Table 6 was applied uniformly to all time-step settings.

Prediction. In Experiment 1, the hard voting technique was used, in which the final prediction was determined by selecting the prediction from one of the two ensemble models. The selection criterion for the final prediction was based on the deviation. Deviation refers to the difference between each model’s prediction and the threshold value. The threshold is defined as the value at which the F1 score is maximized. The final prediction is selected from the model with the smaller deviation from this threshold. Experiment 2 compares the performance of the Transformer-CNN model with that of recent models used in related studies, including Transformer, CNN, CNN-LSTM [11], LSTM [13], and LSTM-Autoencoder [14]. This evaluation is conducted to assess whether proposed multi-model architectures achieve performance improvements over recent models and to validate the relative superiority of the proposed model.
Four performance metrics based on the confusion matrix were employed to evaluate the anomaly detection capabilities. The confusion matrix was composed of four categories: true positive (TP), false positive (FP), true negative (TN), and false negative (FN). These categories serve as the foundation for calculating the accuracy, precision, recall, and F1 score. To assess the extent of overfitting, the experiment also tracked the loss values of the validation dataset during training. Binary cross entropy (BCE) was used as the loss function in this study.
Accuracy refers to the likelihood that the model’s predictions align with real-world outcomes. The formula is provided in Eq. (2). The denominator corresponds to the total number of predictions, and it measures the number of correct predictions. From a data perspective, higher accuracy implies lower bias in the dataset. Therefore, it suggests greater applicability of the data.
Precision measures the likelihood that a sample predicted as anomalous truly represents an anomaly. The formula is defined in Eq. (3). Precision assesses the correctness of anomaly predictions. A high precision score implies that predictions labeled as anomalies were frequently accurate. From a data perspective, higher accuracy implies lower variance in the dataset. Therefore, it suggests greater stability of the data.
Recall represents the probability that an actual anomaly is correctly identified by the model as an anomaly. The formula is expressed as Eq. (4). Recall was evaluated based on the TP cases of anomalies. A high recall value suggests that the model is effective at detecting real anomalies when they occur.
The F1 score is a performance metric that utilizes both precision and recall. The formula is given in Eq. (5). The F1 score is based on the concept of the harmonic mean between precision and recall. Because these two metrics tend to be inversely correlated—where a gain in one may lead to a drop in the other—the F1 score was introduced to achieve a more balanced evaluation [25].
BCE is a loss function commonly used in binary classification problems. It is employed to quantitatively assess the discrepancy between predicted probabilities and actual labels. The formula for BCE is given by Eq. (6). When the model prediction deviates significantly from the ground truth, BCE yields a larger loss value, encouraging the neural network to adjust its weights more aggressively. The model iteratively updates its parameters to minimize this loss, thereby improving its predictive capability. A decreasing loss value and a smaller standard deviation indicate stable convergence and effective learning performance.
6 Experimental Results and Discussion
This section presents the results of the two experiments and discusses their implications.
Experiment 1 results. Experiment 1 demonstrates that the soft voting method outperforms the hard voting method as a technique for generating the final predictions of the proposed ensemble model. Table 7 shows the performance results of anomaly detection using both soft and hard voting methods. Overall, the soft voting method outperforms the hard voting method. When the time step is 1, the soft voting method achieves an accuracy of up to 99%, which is 0.27% higher than the accuracy of the hard voting method. The F1 score for the same time step is approximately 0.99, showing a 0.16% improvement over hard voting. When the time step is 100, the soft voting method outperforms the hard voting method, with a maximum increase of 1.06% in accuracy and 1.48% in F1 score. Overall, the O-RAN KPI dataset demonstrates superior anomaly detection performance when employing soft voting, as it achieves higher accuracy and F1 score compared to hard voting.

Experiment 2 results. The purpose of Experiment 2 is to analyze the performance variations of each model with respect to different input time step sizes and, through this analysis, to validate the superiority of the proposed Transformer-CNN model. Table 8 shows the performance results of both multi-model approaches (Transformer-CNN, CNN-LSTM, LSTM-Autoencoder) and single models (Transformer, CNN, LSTM) across five different time step values. The results are interpreted from two perspectives. First, the performance of the proposed model is directly compared with that of the baseline models for each time step. Second, using the Transformer-CNN model as the reference, the performance variation is analyzed with respect to changes in the time step size.

A detailed analysis of the Transformer–CNN model’s performance across varying time steps indicates that, at a time step of 1, the proposed model achieves the highest accuracy (approximately 0.99) and F1-score (approximately 0.99). Recall is also measured at 0.99, demonstrating that smaller time steps are associated with lower false-positive rates. However, a time step of 1 does not reflect continuous historical temporal variations in the learning process. Taking this into account, the proposed model maintains superior performance at time steps of 5 or 10, exhibiting particular strengths in detecting anomalies over short intervals. Fig. 7 presents the confusion matrices of the Transformer–CNN model for the time steps 5 and 10, which yielded the best performance. Comparing the two time step size, the prediction accuracy for the normal class decreases, whereas that for the malicious class increases slightly. This tendency indicates partial overfitting to the malicious class, which is attributable to the relatively higher proportion of malicious samples in the training dataset. Nevertheless, the precision and recall for the normal and malicious classes are 0.97 and 0.98, respectively, suggesting that the impact of class imbalance on learning performance is limited. As a result, this study identifies 5 to 10 as the optimal time step range.
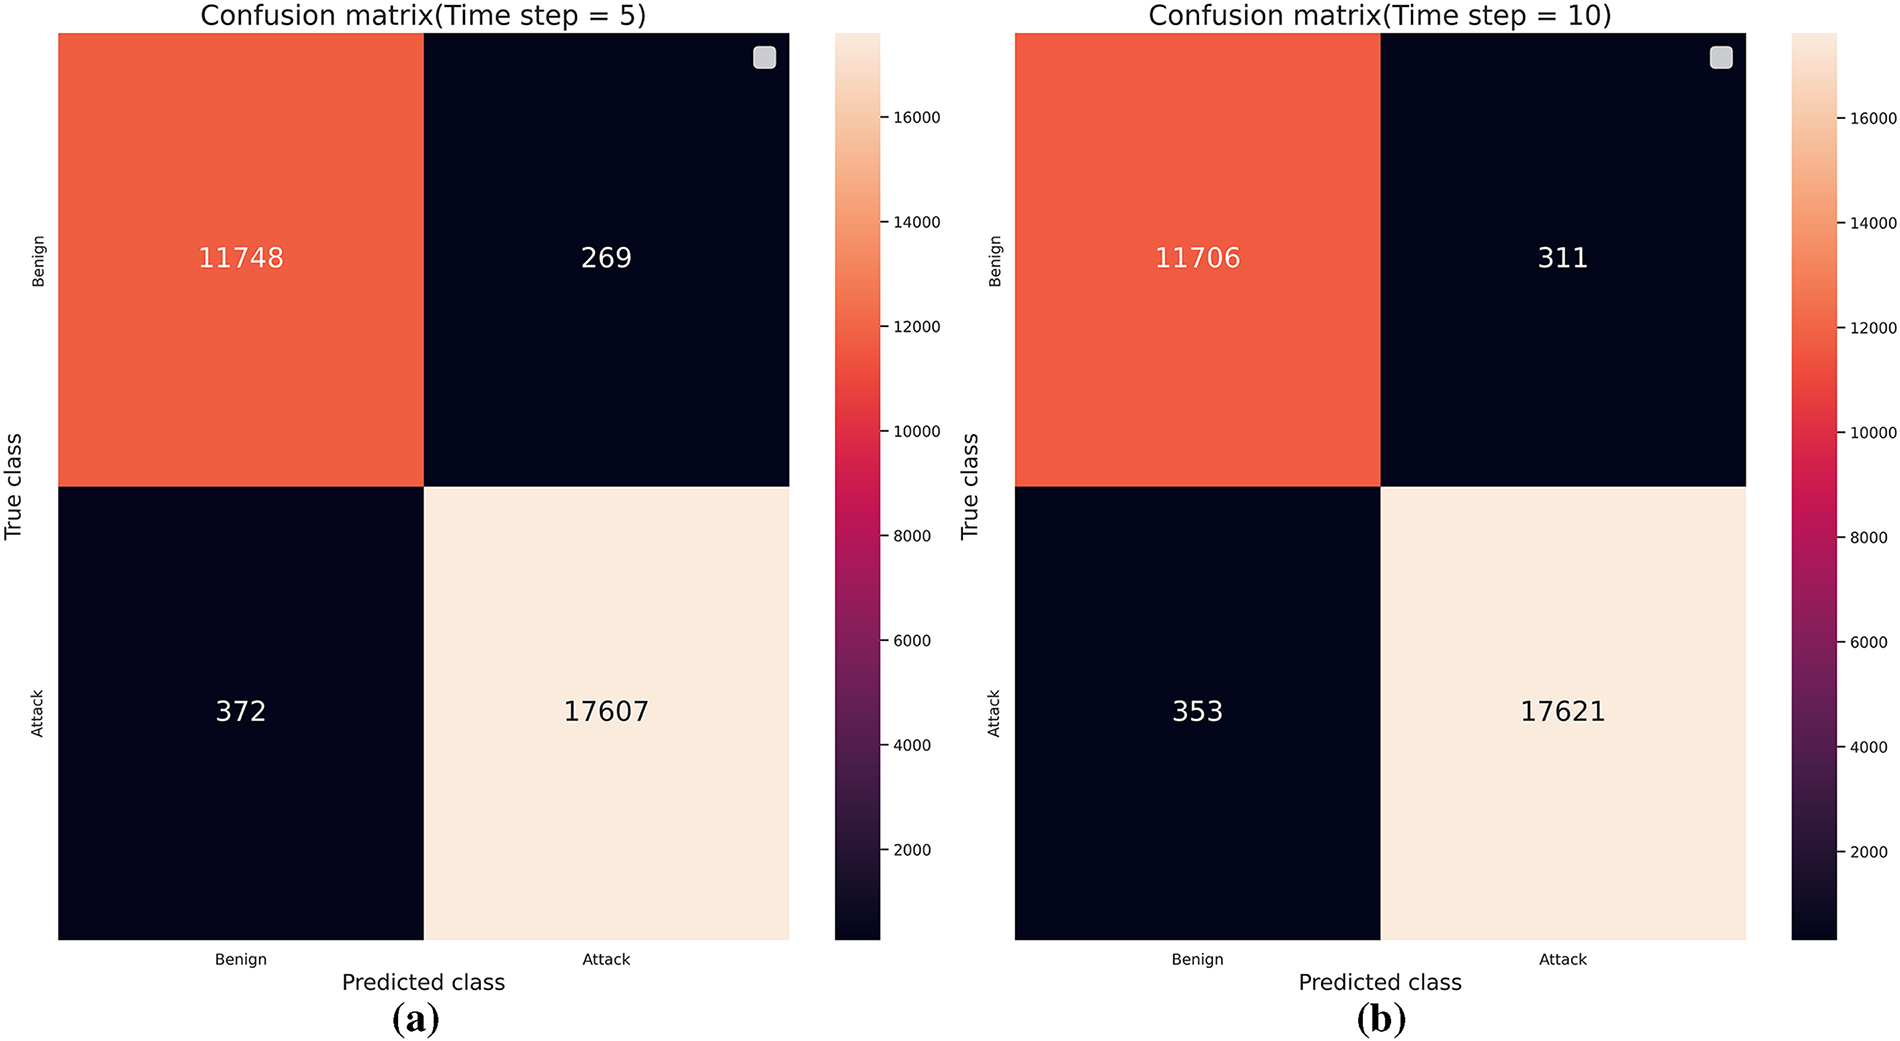
Figure 7: Confusion matrix of transformer-CNN: (a) when the time step is 5, (b) when the time step is 10
In the second analysis, the Transformer–CNN model achieved the highest performance at time steps of 5 and 10, recording accuracies of approximately 98.3% and 98.1%. In particular, at a time step of 5, it outperformed the comparative models by up to 62.22% in accuracy and 30.64% in F1-score. At a time step of 1, the CNN–LSTM model achieved slightly higher accuracy (about 99%) and F1-score (about 0.99) than the proposed model by a margin of 0.07%, but this difference can be regarded as negligible, indicating comparable performance. However, a time step of 1 does not capture the temporal dependencies and is therefore less meaningful in this study. At time steps of 50 and 100, the standalone Transformer marginally surpassed the proposed model, with differences of about 0.02% in both accuracy and F1-score. The proposed model also effectively inherits and the performance of the Transformer and achieves comparable results. Nonetheless, large time steps significantly slow down the training process, limiting their practical applicability.
Fig. 8 shows the validation loss curves of the proposed model and its constituent single models (Transformer and CNN) under varying time steps. The single models exhibit larger oscillations in validation loss, whereas the proposed model maintains relatively stable loss values throughout training. At a time step of 5, the proposed model achieved an average validation loss of 0.47 with a standard deviation of 0.01, while the single models recorded an average of 0.11 and a standard deviation of 0.04. As the time step increased, the standard deviation of the proposed model rose to 0.02, whereas that of the single models increased to 0.08, indicating a higher tendency toward overfitting. Consequently, the Transformer-CNN model effectively mitigated overfitting in shorter time step size through its weight-based averaging prediction mechanism.

Figure 8: Validation loss comparison: (a) when the time step is 1, (b) when the time step is 5, (c) when the time step is 10, (d) when the time step is 50, (e) when the time step is 100
The proposed Transformer-CNN hybrid model, which incorporates a soft voting method, demonstrate superior detection performance compared with single models. Specifically, the accuracy improved by up to 1.43%, and precision increased by 0.51%, leading to a meaningful reduction in false positives. Although recall decreased slightly by 0.18%, the overall F1 score, which represents the harmonic mean of precision and recall, improved by 0.82%, confirming enhanced detection capability.
In addition to detection performance, this study quantitatively evaluates computational efficiency in terms of training time, inference latency, and memory consumption. As shown in Table 9, the Transformer-CNN model requires 10.0 m for training and 0.21 s for inference, both of which remain within the operational bounds of O-RAN control loops. Specifically, the training phase operates stably in the Non-RT control loop (>1 s), whereas the inference phase, with a latency under 0.3 s, satisfies in the Near-RT control loop (>10 ms and <1 s).

However, this improvement in accuracy comes with a trade-off: The memory usage of the proposed model (2.34 GB) increased by approximately 20% compared with the single models (average 1.97 GB). Despite this rise in resource consumption, the performance gain per unit of memory, approximately +0.7% F1 score per 100 MB increase, indicates an efficient balance between accuracy and computational cost. Moreover, these overheads can be mitigated through batch size tuning, hyperparameter optimization, and hardware acceleration in practical deployment environments.
In summary, while cybersecurity prioritizes detection reliability over computational efficiency, the proposed model successfully achieves both reduced false positives and improved overall performance. Leveraging O-RAN’s separated training/inference pipeline and hierarchical control loop design, the Transformer-CNN model enables real-time anomaly detection while maintaining practical deployability within near-real-time operational constraints.
This study targets the detection of malicious traffic in O-RAN by presenting an anomaly-detection methodology built on the AI/ML Framework and proposing an ensemble Transformer–CNN model to identify anomalous indicators in base station RAN KPIs. Leveraging the AI/ML Framework, O-RAN can automate and orchestrate the end-to-end lifecycle of model training, deployment, and management, thereby enabling operational control of the proposed detector. The model integrates the complementary strengths of Transformer (long-range temporal dependencies) and CNN (local pattern extraction) to overcome the limitations of single architectures. In comparative experiments, the proposed model achieved an average accuracy of about 98.3%, improving performance by up to 1.43% over single models and up to 3.47% over multi-model baselines reported in prior work. Moreover, as the time step increases, the variability in validation loss and overfitting observed in single models are effectively mitigated by the proposed approach, indicating not only superior detection performance but also stable generalization. Finally, a voting strategy comparison shows that soft voting outperforms hard voting, yielding gains of up to 1.06% in accuracy and 1.48% in F1-score, thereby establishing soft voting as the preferred strategy for the proposed model.
This study has the following limitations. First, the issue of class imbalance was not addressed. The dataset used in this work contained a higher proportion of malicious classes, which resulted in relatively lower precision for the normal class. Second, the validation loss of the proposed model was observed to be relatively higher than that of single models during the initial training phase. While the validation loss of single models increased exponentially with more epochs, leading to severe overfitting, the proposed model alleviated this problem. Nevertheless, the fact that the proposed model exhibited higher loss values in the early training stage remains an issue to be improved in future work. Third, this study relied on a simulation-based dataset, which does not fully capture the diverse network conditions and unpredictable traffic patterns encountered in real O-RAN. Moreover, as the proposed model is optimized for KPI-based anomaly detection, it cannot directly handle packet-level behavioral detection or other types of security threats. In particular, since the dataset used for the experiments consisted of feature vectors aggregated from performance indicators at the PHY/MAC layers of the wireless RAN, it does not reflect network-level characteristics such as packet header information, flow features, or protocol anomalies.
To address the limitations, this study proposes the following directions for future research. First, two approaches will be considered to mitigate challenges arising from class imbalance. (i) Since relying solely on accuracy may not sufficiently capture model performance under imbalanced conditions, future work will conduct comparative experiments using alternative weighting schemes based on diverse metrics such as F1 score and AUC, thereby verifying the robustness of the ensemble method. (ii) Data preprocessing techniques such as SMOTE and oversampling will be applied to alleviate class imbalance, and the performance differences between balanced and imbalanced datasets will be analyzed. Furthermore, to extend the scope of the study from a practical perspective, future experiments will employ real-time traffic and KPI data collected from operational O-RAN networks to detect various types of attacks. Public benchmark datasets will also be incorporated to evaluate the generalization performance of the proposed model. In addition, subsequent research will focus on the operational and deployment aspects of anomaly detection models. Specifically, the inference latency and computational cost of the proposed model, along with other candidate models, will be quantitatively assessed, and the feasibility of integrating these models into xApps or rApps within real workflow scenarios will be investigated.
Acknowledgement: This work was supported by the Institute of Information & Communications Technology Planning & Evaluation (IITP) grant funded by the Korea government (MSIT).
Funding Statement: This work was supported by the Institute of Information & Communications Technology Planning & Evaluation (IITP) grant funded by the Korea government (MSIT) (RS-2024-00396797, Development of core technology for intelligent O-RAN security platform).
Author Contributions: Conceptualization of background, Suhyeon Lee and Hwankuk Kim; methodology and design, Suhyeon Lee; data collection, Suhyeon Lee; analysis and interpretation of results, Suhyeon Lee and Hwankuk Kim; resources, Suhyeon Lee; writing—original draft preparation, Suhyeon Lee; writing—review and editing, Suhyeon Lee and Hwankuk Kim; visualization, Suhyeon Lee. All authors reviewed the results and approved the final version of the manuscript.
Availability of Data and Materials: The data that support the findings of this study are openly available in “Mendeley Data” at http://data.mendeley.com/datasets/t2rzh9y4mp/1 (accessed on 12 October 2025).
Ethics Approval: Not applicable.
Conflicts of Interest: The authors declare no conflicts of interest to report regarding the present study.
Abbreviations
| 5/6G | 5th/6th Generation |
| AI/ML | Artificial Intelligence/Machine Learning |
| DL | Deep Learning |
| CNN | Convolutional Neural Network |
| COTS | Commercial off-the-shelf |
| DNN | Deep Neural Network |
| (D)DoS | (Distributed) Denial of Service |
| IDS | Intrusion Detection System |
| KPI | Key Performance Indicator |
| LSTM | Long Short-Term Memory |
| MNO | Mobile Network Operator |
| Near-RT RIC | Near-Real Time RIC |
| NFV | Network Function Virtualization |
| (O-) CU | (Open-) Centralized Unit |
| (O-) DU | (Open-) Distributed Unit |
| (O-) RU | (Open-) RAN Radio Unit |
| O-RAN | Open Radio Access Network |
| PUCCH/PDCCH | Physical Uplink Control Channel/Physical Downlink Control Channel |
| RAN | Radio Access Network |
| RF | Radio Frequency |
| RIC | RAN Intelligent Controller |
| SMO | Service Management and Orchestration |
| UE | User Equipment |
References
1. Abdalla AS, Marojevic V. End-to-end O-RAN security architecture, threat surface, coverage, and the case of the open fronthaul. IEEE Commun Stand Mag. 2024;8(1):36–43. doi:10.1109/MCOMSTD.0001.2200047. [Google Scholar] [CrossRef]
2. Kocher G, Kumar G. Machine learning and deep learning methods for intrusion detection systems: recent developments and challenges. Soft Comput. 2021;25(15):9731–63. doi:10.1007/s00500-021-05893-0. [Google Scholar] [CrossRef]
3. Groen J, D’Oro S, Demir U, Bonati L, Polese M, Melodia T. Implementing and evaluating security in O-RAN: interfaces, intelligence, and platforms. IEEE Netw. 2025;39(1):227–34. doi:10.1109/MNET.2024.3434419. [Google Scholar] [CrossRef]
4. Kún G, Varga PJ, Wührl T, Wührl D, Gyányi S, Nádai S, et al. “Opened” or “closed” RAN in 5G. In: Proceedings of the 2022 IEEE 20th Jubilee World Symposium on Applied Machine Intelligence and Informatics (SAMI); 2022 Mar 2–5; Poprad, Slovakia. p. 000347–52. doi:10.1109/SAMI54271.2022.9780667. [Google Scholar] [CrossRef]
5. Polese M, Bonati L, D’Oro S, Basagni S, Melodia T. Understanding O-RAN: architecture, interfaces, algorithms, security, and research challenges. IEEE Commun Surv Tutor. 2023;25(2):1376–411. doi:10.1109/COMST.2023.3239220. [Google Scholar] [CrossRef]
6. Park H, Nguyen T, Park L. An investigation on Open-RAN specifications: use cases, security threats, requirements, discussions. Comput Model Eng Sci. 2024;141(1):13–41. doi:10.32604/cmes.2024.052394. [Google Scholar] [CrossRef]
7. Amachaghi EN, Shojafar M, Foh CH, Moessner K. A survey for intrusion detection systems in open RAN. IEEE Access. 2024;12(3):88146–73. doi:10.1109/ACCESS.2024.3408690. [Google Scholar] [CrossRef]
8. Klement F, Brighente A, Polese M, Conti M, Katzenbeisser S. Securing the open RAN infrastructure: exploring vulnerabilities in kubernetes deployments. In: Proceedings of the 2024 IEEE 10th International Conference on Network Softwarization (NetSoft); 2024 Jun 24–28; Saint Louis, MO, USA. p. 185–9. doi:10.1109/NetSoft60951.2024.10588929. [Google Scholar] [CrossRef]
9. Liyanage M, Braeken A, Shahabuddin S, Ranaweera P. Open RAN security: challenges and opportunities. J Netw Comput Appl. 2023;214:103621. doi:10.1016/j.jnca.2023.103621. [Google Scholar] [CrossRef]
10. O-RAN Working Group 11 (Security Work Group). O-RAN security threat modeling and risk assessment. Germany: O-RAN Alliance 2025 [Internet]. [cited 2025 Oct 12]. Available from: https://orandownloadsweb.azurewebsites.net/specifications. [Google Scholar]
11. Bamber SS, Katkuri AVR, Sharma S, Angurala M. A hybrid CNN-LSTM approach for intelligent cyber intrusion detection system. Comput Secur. 2025;148:104146. doi:10.1016/j.cose.2024.104146. [Google Scholar] [CrossRef]
12. Oliveira JM, Morais C, Macedo D, Nogueira JM. A comparative analysis of feature selection and machine learning algorithms for enhanced anomaly detection in 5G core networks. In: Proceedings of the Global Information Infrastructure and Networking Symposium (GIIS); 2025 Feb 25–27; Dubai, United Arab Emirates. p. 1–6. doi:10.1109/GIIS64151.2025.10921756. [Google Scholar] [CrossRef]
13. Sundqvist T, Bhuyan MH, Forsman J, Elmroth E. Boosted ensemble learning for anomaly detection in 5G RAN. Artif Intell Appl Innov. 2020;583(1):15–30. doi:10.1007/978-3-030-49161-1_2. [Google Scholar] [CrossRef]
14. Başaran OT, Başaran M, Turan D, Bayrak HG, Sandal YS. Deep autoencoder design for RF anomaly detection in 5G O-RAN near-RT RIC via xApps. In: Proceedings of the IEEE International Conference on Communications Workshops (ICC Workshops); 2023 May 28–Jun 1; Rome, Italy. p. 549–55. doi:10.1109/ICCWorkshops57953.2023.10283501. [Google Scholar] [CrossRef]
15. Hamhoum W, Lakhdar H, Cherkaoui S. Fortifying open RAN security with zero trust architecture and transformers. In: Proceedings of the 2024 IEEE International Conference on Communications; 2024 Jun 9–13; Denver, CO, USA. p. 2216–21. doi:10.1109/ICC51166.2024.10622553. [Google Scholar] [CrossRef]
16. Alalyan F, Awad M, Jaafar W, Langar R. Secure distributed federated learning for cyberattacks detection in B5G open radio access networks. IEEE Open J Commun Soc. 2024;6:3067–81. doi:10.1109/OJCOMS.2024.3523468. [Google Scholar] [CrossRef]
17. INL Software (2022). 5GAD-2022: 5G network traffic dataset for machine learning: 5GAD-2022 [Internet]. [cited 2025 Oct 12]. Available from: https://github.com/IdahoLabResearch/5GAD. [Google Scholar]
18. Samarakoon S, Siriwardhana Y, Porambage P, Liyanage M, Chang S-Y, Kim J, et al. 5G-NIDD: a comprehensive network intrusion detection dataset generated over 5G wireless network. arXiv:2212.01298. 2022. doi: 10.48550/arxiv.2212.01298. [Google Scholar] [CrossRef]
19. Kamal H, Mashaly M. Enhanced hybrid deep learning models-based anomaly detection method for two-stage binary and multi-class classification of attacks in intrusion detection systems. Algorithms. 2025;18(2):69. doi:10.3390/a18020069. [Google Scholar] [CrossRef]
20. Ahmadzadeh M, Zahrai SM, Bitaraf M. An integrated deep neural network model combining 1D CNN and LSTM for structural health monitoring utilizing multisensor time-series data. Struct Health Monit. 2024;24(1):447–65. doi:10.1177/14759217241239041. [Google Scholar] [CrossRef]
21. Xavier BM, Dzaferagic M, Martinello M, Ruffini M. Performance measurement dataset for open RAN with user mobility and security threats. Comput Netw. 2024;253:110710. doi:10.1016/j.comnet.2024.110710. [Google Scholar] [CrossRef]
22. Xavier B, Dzaferagic M, Ruffini M, Martinello M. RAN performance measurements for security threats [Internet]. 2024 [cited 2025 Oct 12]. Available from: http://data.mendeley.com/datasets/t2rzh9y4mp/1. [Google Scholar]
23. ShareTechnote. LTE BSR (Buffer Status Report) [Internet]. [cited 2025 Oct 12]. Available from: https://www.sharetechnote.com/html/Handbook_LTE_BSR.html. [Google Scholar]
24. Yin C, Zhang S, Wang J, Xiong NN. Anomaly detection based on convolutional recurrent autoencoder for IoT time series. IEEE Trans Syst Man Cybern Syst. 2022;52(1):112–22. doi:10.1109/TSMC.2020.2968516. [Google Scholar] [CrossRef]
25. Handelman GS, Kok HK, Chandra RV, Razavi AH, Huang S, Brooks M, et al. Peering Into the black box of artificial intelligence: evaluation metrics of machine learning methods. Am J Roentgenol. 2019;212(1):38–43. doi:10.2214/AJR.18.20224. [Google Scholar] [PubMed] [CrossRef]
Cite This Article
 Copyright © 2025 The Author(s). Published by Tech Science Press.
This work is licensed under a Creative Commons Attribution 4.0 International License , which permits unrestricted use, distribution, and reproduction in any medium, provided the original work is properly cited.
 Downloads
 Citation Tools