
 Submit a Paper
 Propose a Special lssue
 Open Access
ARTICLE

Solid Model Generation and Shape Analysis of Human Crystalline Lens Using 3D Digitization and Scanning Techniques
Department of Structures, Construction and Graphical Expression, Technical University of Cartagena, Cartagena, 30202, Spain
* Corresponding Author: Francisco Cavas. Email:
Computer Modeling in Engineering & Sciences 2025, 145(2), 1821-1837. https://doi.org/10.32604/cmes.2025.071131
Received 01 August 2025; Accepted 26 September 2025; Issue published 26 November 2025
 View Full Text
 Download PDF
Abstract
This research establishes a methodological framework for generating geometrically accurate 3D representations of human crystalline lenses through scanning technologies and digital reconstruction. Multiple scanning systems were evaluated to identify optimal approaches for point cloud processing and subsequent development of parameterized solid models, facilitating comprehensive morpho-geometric characterization. Experimental work was performed at the 3D Scanning Laboratory of SEDIC (Industrial Design and Scientific Calculation Service) at the Technical University of Cartagena, employing five distinct scanner types based on structured light, laser, and infrared technologies. Test specimens—including preliminary calibration using a lentil and biological analysis of a human crystalline lens—were digitized under rigorously controlled environmental conditions. Acquired point clouds underwent processing in Rhinoceros software to produce digital surface meshes, which were subsequently converted into solid CAD models via SolidWorks. Model fidelity and biomedical relevance were assessed through quantification of geometric and physical properties. Scanner performance varied significantly in reconstruction precision and resolution, with structured blue light systems (e.g., Artec SPIDER) exhibiting superior capability for capturing lens surface topography compared to infrared or white light alternatives. Resultant models enabled accurate dimensional analysis of clinically relevant parameters including volumetric and surface area measurements. Technology-specific advantages and constraints were rigorously cataloged relative to sample attributes. Findings indicate that structured blue light scanning provides the most effective foundation for crystalline lens digitization and modeling. The presented methodological approach not only ensures high-fidelity solid model generation but also demonstrates translational potential in medical domains, from custom intraocular lens design to refinement of ophthalmic therapeutic interventions.Keywords
The human crystalline lens is a transparent, encapsulated, avascular structure positioned between the iris and vitreous humor. This biconvex optical component features approximately parabolic surfaces [1]. Its inherent elasticity enables accommodation—the process that adjusts light refraction to focus images on the retina at varying distances [1,2]. With aging, the lens loses flexibility, contributing to conditions like presbyopia and cataracts, the latter being a leading cause of global blindness. This deterioration is compounded by age-related changes in ciliary muscles and zonular fibers [2].
Recent advances in medical imaging, particularly optical coherence tomography (OCT) and Scheimpflug systems, have enabled detailed lens characterization [3]. Some authors have focused on studying the crystalline lens once it has been extracted from the eye (ex vivo), either by detailing its geometrical features [2,3] or either its dynamic mechanical properties [4]. In this sense, most recent works of Mohamed et al. [2] compared the three-dimensional shape of isolated human crystalline lenses between Indian and European populations, finding significant geometric differences, and Martínez-Enríquez et al. [3] validated the estimation of the full crystalline lens shape from OCT by comparison with stretched donor lenses, demonstrating the reliability of the method for later in vivo reconstructions. Dahaghin et al. [4] were able to document the phenomenon of lens “overshooting”, confirming its origin through optomechanical simulation.
Alternatively, approaching study from an in vivo perspective allows the lens to be examined under conditions much closer to its natural state. Thus, other authors have focused their work on analyzing the changes induced by accommodation at geometrical [3,5], biomechanical [6,7], or optical level [8,9]. Xiang et al. [5] were able to quantify changes in the internal components of the human crystalline lens during accommodation in adults, while Rich and Reilly [6] have recently reviewed biomechanical contributions of the crystalline lens to presbyopia, highlighting structural and material factors. It is also noticeable the use of Finite Element Method (FEM) that De la Hoz et al. [7] used to estimate crystalline lens material properties from clinical accommodation data. At optical level, Cabeza-Gil et al. [8] performed a numerical investigation of lens shape changes during accommodation, providing a framework to understand geometric deformations, and He [9] reported in vivo measurements of the crystalline lens refractive index, providing experimental values relevant for optical modeling and clinical applications.
Patient-specific geometric models now accurately represent lens curvature, thickness, and other parameters [10], with validation against in vivo data [11]. Gradient refractive index (GRIN) models have further refined lens representation by integrating structural geometry with optical function [12,13]. Navarro et al. [12] pioneered dynamic models using conic surfaces and GRIN distributions to simulate age-dependent morphological changes, providing critical insights into pathological transformations.
Artificial intelligence (AI) is also revolutionizing geometric reconstruction of the lens. Machine learning algorithms process large imaging datasets to automatically segment and model lens structure. Deep Neural Networks, such as those implemented by Zéboulon et al. [14], significantly enhance OCT segmentation efficiency. AI systems also predict geometry changes due to aging or pathology [13,15].
However, these algorithms rely heavily on input data from costly medical equipment (e.g., OCT, Scheimpflug). Acquisition expenses and limited accessibility create barriers for non-clinical researchers and institutions in resource-constrained regions like sub-Saharan Africa. This underscores the need for cost-effective alternatives.
This study evaluates multiple 3D scanners for digitizing human lenses, focusing on morphogeometric fidelity. To the authors knowledge, this is the first study that uses industrial scanners for ex vivo morphogeometrical study and characterization of a human crystalline lens. Volumetric model generation has been also assessed using zonal and modal reconstruction tools applied to point clouds. The main goal is to establish an accessible methodology for lens characterization operable outside clinical settings. We also validate commercial 3D scanners to expand advanced ophthalmic research in underserved regions. This work contributes to extend the authors’ proven expertise in low-cost 3D digitization, which includes biomechanical applications like foot analysis [16].
All measurements for this study were carried out between March and June 2024 in the 3D Modeling and Scanning Laboratory of the Industrial Design and Calculation Service (SEDIC), located in the Research, Development, and Innovation (R&D + i) building at the Technical University of Cartagena (UPCT). The experiments were performed under stable, controlled environmental conditions to guarantee accuracy and reproducibility. Temperature was maintained between 25°C–28°C to prevent deformations or structural changes, relative humidity was kept at 60% to avoid tissue dehydration and preserve its physical composition, and lighting was set at 500 lux to provide optimal visibility and high-quality data capture without causing glare or interference with the optical systems.
For the scanning and subsequent 3D reconstruction of the samples, a series of 3D scanners available at SEDIC were used. These scanners are based on diverse technologies and feature distinct specifications. Table 1 below summarizes their key characteristics:

All measurements were conducted by the same technician (A.S.S.) following a scanner familiarization process involving tests with objects of varying sizes, such as wooden frames, motorcycle helmets, and chess pieces (see Fig. 1).

Figure 1: (a): Frame scanned by Artec EVA; (b): Helmet scanned by Artec SPIDER; (c): Chess piece scanned by Steinbichler Vision COMET 1.4M
Subsequently, trials were performed using a lentil specifically selected for its unique geometric characteristics and its similarity in size and shape to the human lens. The objective was to determine the level of detail achievable by each scanner. To avoid lens deterioration caused by excessive air exposure (which could dehydrate the tissue), final trials were conducted exclusively with the two highest-performing scanners.
A lentil of comparable size to the human lens was selected, ensuring it exhibited sufficient surface details to evaluate the quality and precision of the scanning process. Specifically, the upper face of the lentil featured a region with indentations and protrusions, while the lower face was largely flat and homogeneous except at one end, which exhibited folds resembling the Greek letter lambda (λ) (see Fig. 2).

Figure 2: Lentil used for the scanning testing procedure: (a): Upper side; (b): Lower side
A single crystalline lens coming from a female patient aged 72 and suffering from cataracts was used for this research (see Fig. 3). The participant provided informed consent, and the study, which adhered to the principles of the Declaration of Helsinki (7th revision, October 2013, Fortaleza, Brazil), was approved by the Ethics Committee of the Technical University of Cartagena, Spain (CEI21_001). The lens was put into saline solution right after the extraction and kept refrigerated at 5 Celsius degrees until it was used. Its general dimensions were measured using a calibrated micrometer, obtaining a value of 6.86 × 6.98 × 3.82 mm, and its mass was also measured with an XPR204S (Mettler Toledo, Columbus, OH, USA) precision balance, obtaining a value of 68.20 mg.

Figure 3: Crystalline lens floating in saline solution
The experimental timeline required all measurements to be completed within 72 h post-extraction. Throughout data collection, the lens was maintained under refrigeration while immersed in saline solution except during active manipulation. Surface dehydration using cold air streams preceded each scanning procedure. Nevertheless, moisture emission from the lens interior persisted following removal from storage. Extended environmental exposure consistently induced progressive volumetric reduction and surface folding, as evidenced in Fig. 4.
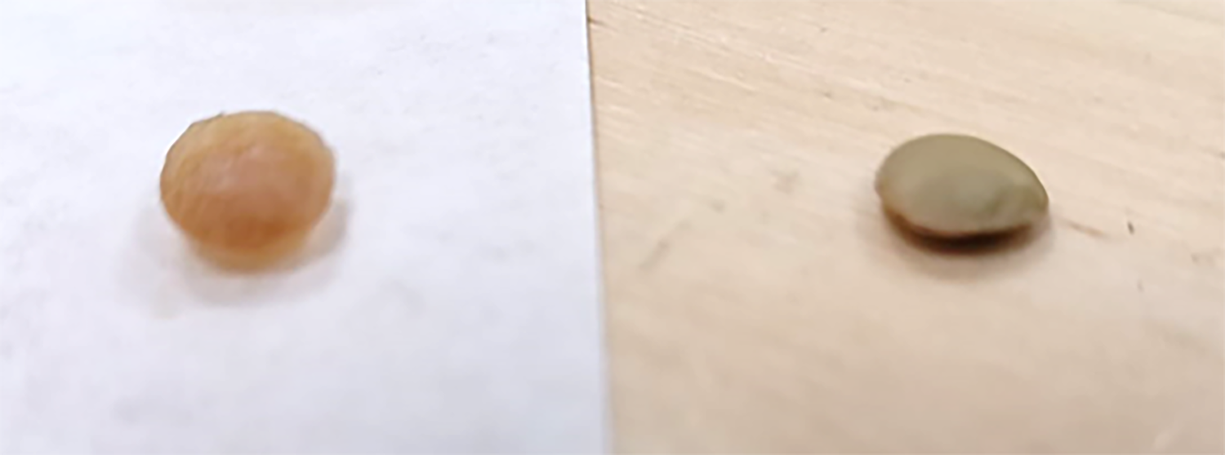
Figure 4: Irregularities caused by dehydration in lens’ surface, and size comparison with lentil
The testing procedure started with confirmation of correct equipment calibration. Afterwards, several measurements of the lentil were taken to assess the scanners’ performance in reproducing three main parameters: geometry, color, and surface texture. Each scanner was tested through repeated trials, capturing data in both horizontal and vertical orientations. Initial scans were performed without applying smoothing algorithms or any post-processing, followed by scans processed with the manufacturer’s software. The configurations delivering the best results were recorded.
To stabilize the lentil or lens during vertical scanning (when this orientation improved scan quality), a soft modeling clay base was employed as a mounting aid (see Fig. 5).

Figure 5: Example of plaster used to fix in vertical position: (a) Lentil; (b) Crystalline lens
A sheet of paper printed with distinctive images (two capital letters and a symbol) was also used as a base for placing the scanned object. This approach facilitated the alignment of the upper and lower faces during post-scan assembly (see Fig. 6).

Figure 6: Lens placed horizontally on the reference support
After testing all equipment, the scanners demonstrating the highest accuracy in geometry and surface quality reproduction were selected to conduct trials with the human lens. Three different aspects were considered here, as shown in Table 2:

• Geometry: The overall size of the model was assessed qualitatively. Borders should closely match the original ones, avoiding rounded edges, and the general dimensions should not deviate significantly from the original model (Regular if dimensions are ok/Good if both dimensions and borders are acceptable/Great if both reflect original model with detail).
• Surface: Surface should present the features previously mentioned (Regular if only features of one surface are covered/Good if features of both faces are included but lack some detail/Great if all details are included).
• Texture/Color: For those devices without color reproduction, it was assessed that the smoothness of the surface was created without abrupt elevations or depressions. For those with color reproduction, it was assessed if it resembled the original one.
From the initial results obtained with the lentil (see Table 2), the two scanners with the highest performance—Artec SPIDER and COMET 5 1.4M—were selected, as they were the only ones achieving surface quality adequate for the study’s requirements, rated as “Good” or “Great” in reproducing the model’s geometric features. The Artec SPIDER detected the lens surface without issues, whereas the COMET 5 1.4M occasionally failed to capture certain areas, producing gaps. This limitation is attributed to the greater sensitivity of white light scanning (used by the COMET 5 1.4M) to ambient lighting and reflections from translucent materials, compared to blue light systems such as the Artec SPIDER. To mitigate this, a white opaque scanning spray (AESUB, Germany), typically used for larger components, was applied to the lens during COMET 5 1.4M scans to ensure complete data capture. The applied layer was mechanically removable, just by running water, and according to the manufacturer’s data, was free of titanium dioxide, and had a thickness of only 7 µm. In the case of the lens, whose thickness generally ranges from 3.5 to 5 mm, its effect can be considered negligible (approximately 0.15% to 0.2% of thickness change).
The measurement uncertainty of the models obtained with the Artec SPIDER scanner was estimated based on the manufacturer’s reported point accuracy (~50 µm) and spatial resolution (~100 µm), combined with repeated scans of the same crystalline lens, alignment of the resulting models, and analysis of point-wise deviations. Using the root-sum-square (RSS) method to combine contributions from scanner precision, systematic errors and sample handling, the resulting uncertainty is in the range of 50–100 µm. This corresponds to approximately 1%–2% of the linear dimensions of the lens, which is considered adequate for morphogeometric characterization and 3D modeling.
For the Steinbichler Vision COMET 5 1.4M, which features higher camera resolution (1.4 MP) and enhanced triangulation stability, the uncertainty was estimated using the same approach. Repeated scans of the same crystalline lens, alignment of models, and point-wise deviation analysis (including the spray coating effect) were combined with the manufacturer’s reported precision (~20 µm) and resolution (~50 µm). Applying the RSS method, the resulting measurement uncertainty is approximately 20–50 µm, representing roughly 0.3%–0.7% of the lens linear dimensions. This indicates substantially higher accuracy than the ARTEC Spider, suitable for detailed morphogeometric analysis and high-fidelity 3D modeling.
In both cases, the scanning process produced a three-dimensional point cloud, which was then processed to generate a 3D solid model for detailed geometric measurements and analyses. The point cloud files were exported in ASCII (.asc) format from the scanner’s proprietary software to Rhinoceros 8.0 (McNeel Associates, Seattle, WA, USA) for high-precision geometric reconstruction. After manually removing artifacts identified during scanning, points were inserted into regions with gaps to guide mesh generation and improve reconstruction accuracy. To minimize bias, a method similar to surgical suturing was applied: a polyline connecting opposite points along the edges of each gap was drawn in a zigzag sequence—first horizontally, then vertically. This served as a framework for placing artificial points, which were subsequently deleted before generating the surface. Fig. 7 shows the COMET 5 1.4M point cloud before and after manual processing, while Fig. 8 illustrates the artificial point insertion procedure.

Figure 7: Point cloud obtained with COMET 5 1.4M scanner: (a) Before; (b) After data treatment

Figure 8: Procedure followed for manual insertion of points to help surface reconstruction
Two distinct reconstruction approaches were tested: modal methods (mesh-based) and zonal methods (NURBS-based), yielding distinct outcomes:
Mesh
The ShrinkWrap command (a tool in Rhinoceros 8.0 that generates a watertight mesh around open or closed meshes or point clouds) was used for reconstruction. According to the official documentation, the operation is intended to create a closed digital surface suitable for subsequent processing, with user-controlled parameters including target edge length, offset, and smoothing iterations [17]. The software developer does not disclose the mathematical details of the implementation. However, the procedure is functionally equivalent to standard volumetric surface reconstruction methods, which typically rely on implicit functions (e.g., signed distance fields) and isosurface extraction algorithms such as marching cubes, often followed by Laplacian smoothing and mesh optimization steps [18,19].
The following parameters were applied:
• Target edge length: Determines the density of the resulting mesh. Minimum values were selected to avoid internal mesh duplication: 0.18 mm for Artec SPIDER and 0.14 mm for COMET 5 1.4M.
• Offset: Returns inflated points to their original state. Set to 0 (no offset applied).
• Smoothing iteration: Controls mesh smoothing intensity. Higher values reduce bumps/cavities. Set to 0 to preserve potential imperfections from the capture process.
• Polygon optimization %: Simplifies the mesh by reducing polygon count. Set to 0 (no optimization).
• Inflate vertices and points: Converts non-mesh objects to meshes and samples vertex positions to improve convergence. Enabled.
• Fill holes: Automatically corrects minor imperfections. Enabled.
NURBS
Rhinoceros’ Patch command, which fits a surface through curves, meshes, or point clouds. The method minimizes the squared distance between the surface and the input data while applying a smoothness regularization term controlled by a stiffness parameter [20]. This is functionally equivalent to least-squares NURBS surface fitting with thin-plate–like regularization, a standard technique in geometric modeling and reverse engineering [21,22].
It was used with the following parameters:
• Sample point spacing: Physical distance between sample points along input curves. Fixed at 1 mm.
• Surface U spans: Number of spans in the U-direction for the generated surface. Fixed at 10.
• Surface V spans: Number of spans in the V-direction for the generated surface. Fixed at 10.
• Stiffness: Controls how much the best-fit plane deforms to match sampled points. Set to 5 (moderate deformation allowance).
The reconstructed models were exported in the open format (.obj) to SolidWorks 2023 (Dassault Systèmes, Vélizy-Villacoublay, France) for mechanical modeling and analysis, enabling the measurement of physical parameters such as volume and surface area. In SolidWorks, the “Mesh Modeling” tab was used, selecting “Convert to Mesh Solid” to generate the solid model. The “Physical Properties” tool under the “Evaluate” menu was then applied, incorporating the lens mass measured in the laboratory with an XPR204S balance (Mettler Toledo, Columbus, OH, USA), which yielded a value of 68.20 mg.
2.4.4 Generative AI Use Acknowledgement
During the preparation of this manuscript, the authors utilized DeepSeek version 3.1, an advanced AI language model, for translating the original Spanish text into American English, to ensure linguistic accuracy and adherence to scientific terminology. The authors have carefully reviewed and revised the output and accept full responsibility for all content.
The results obtained after the lentil’s digitization process can be found in Table 2.
Figs. 9 and 10 present the mesh-based and NURBS-based reconstruction results for the Artec SPIDER scanner, respectively. The NURBS-based reconstruction was discarded due to pronounced surface undulations generated by the lens’s natural folds, which distorted the surface from the fold areas to the edges. Furthermore, the edge geometry showed significant deviations, appearing sharpened instead of reflecting the lens’s typical rounded contours.

Figure 9: Mesh model for the full lens acquired with Artec SPIDER: (a) Without sharpening; (b) With level 5 sharpening
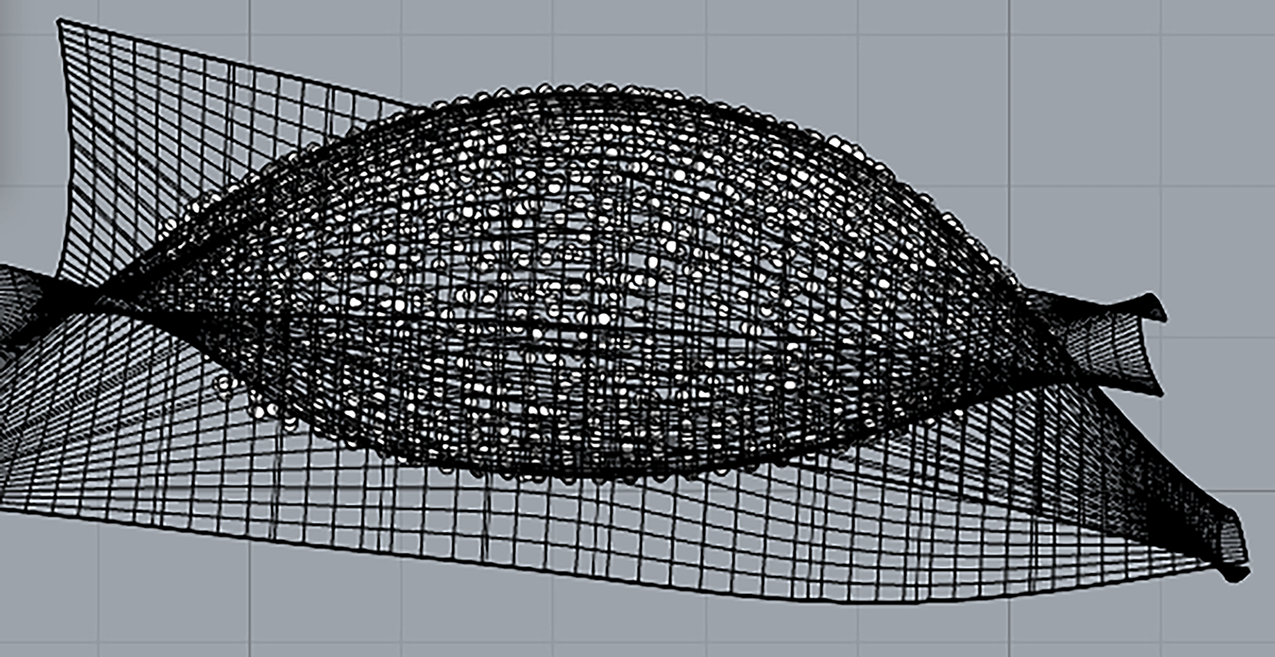
Figure 10: NURBS model for the upper and lower lens surfaces acquired with Artec SPIDER. Borders result sharper than they really are in the real-life model
Table 3 summarizes the results of the digitization process for the crystalline lens with the two scanners that showed better results with the lentil.

Table 4 summarizes quantitative results of the scanning and modelling procedure for both SPIDER and COMET.

Fig. 11 shows heatmaps representing the deviation of each of the points with respect to the final generated mesh, for both scanners, for an easier visual evaluation of the performance in both the center and the borders of the lens.
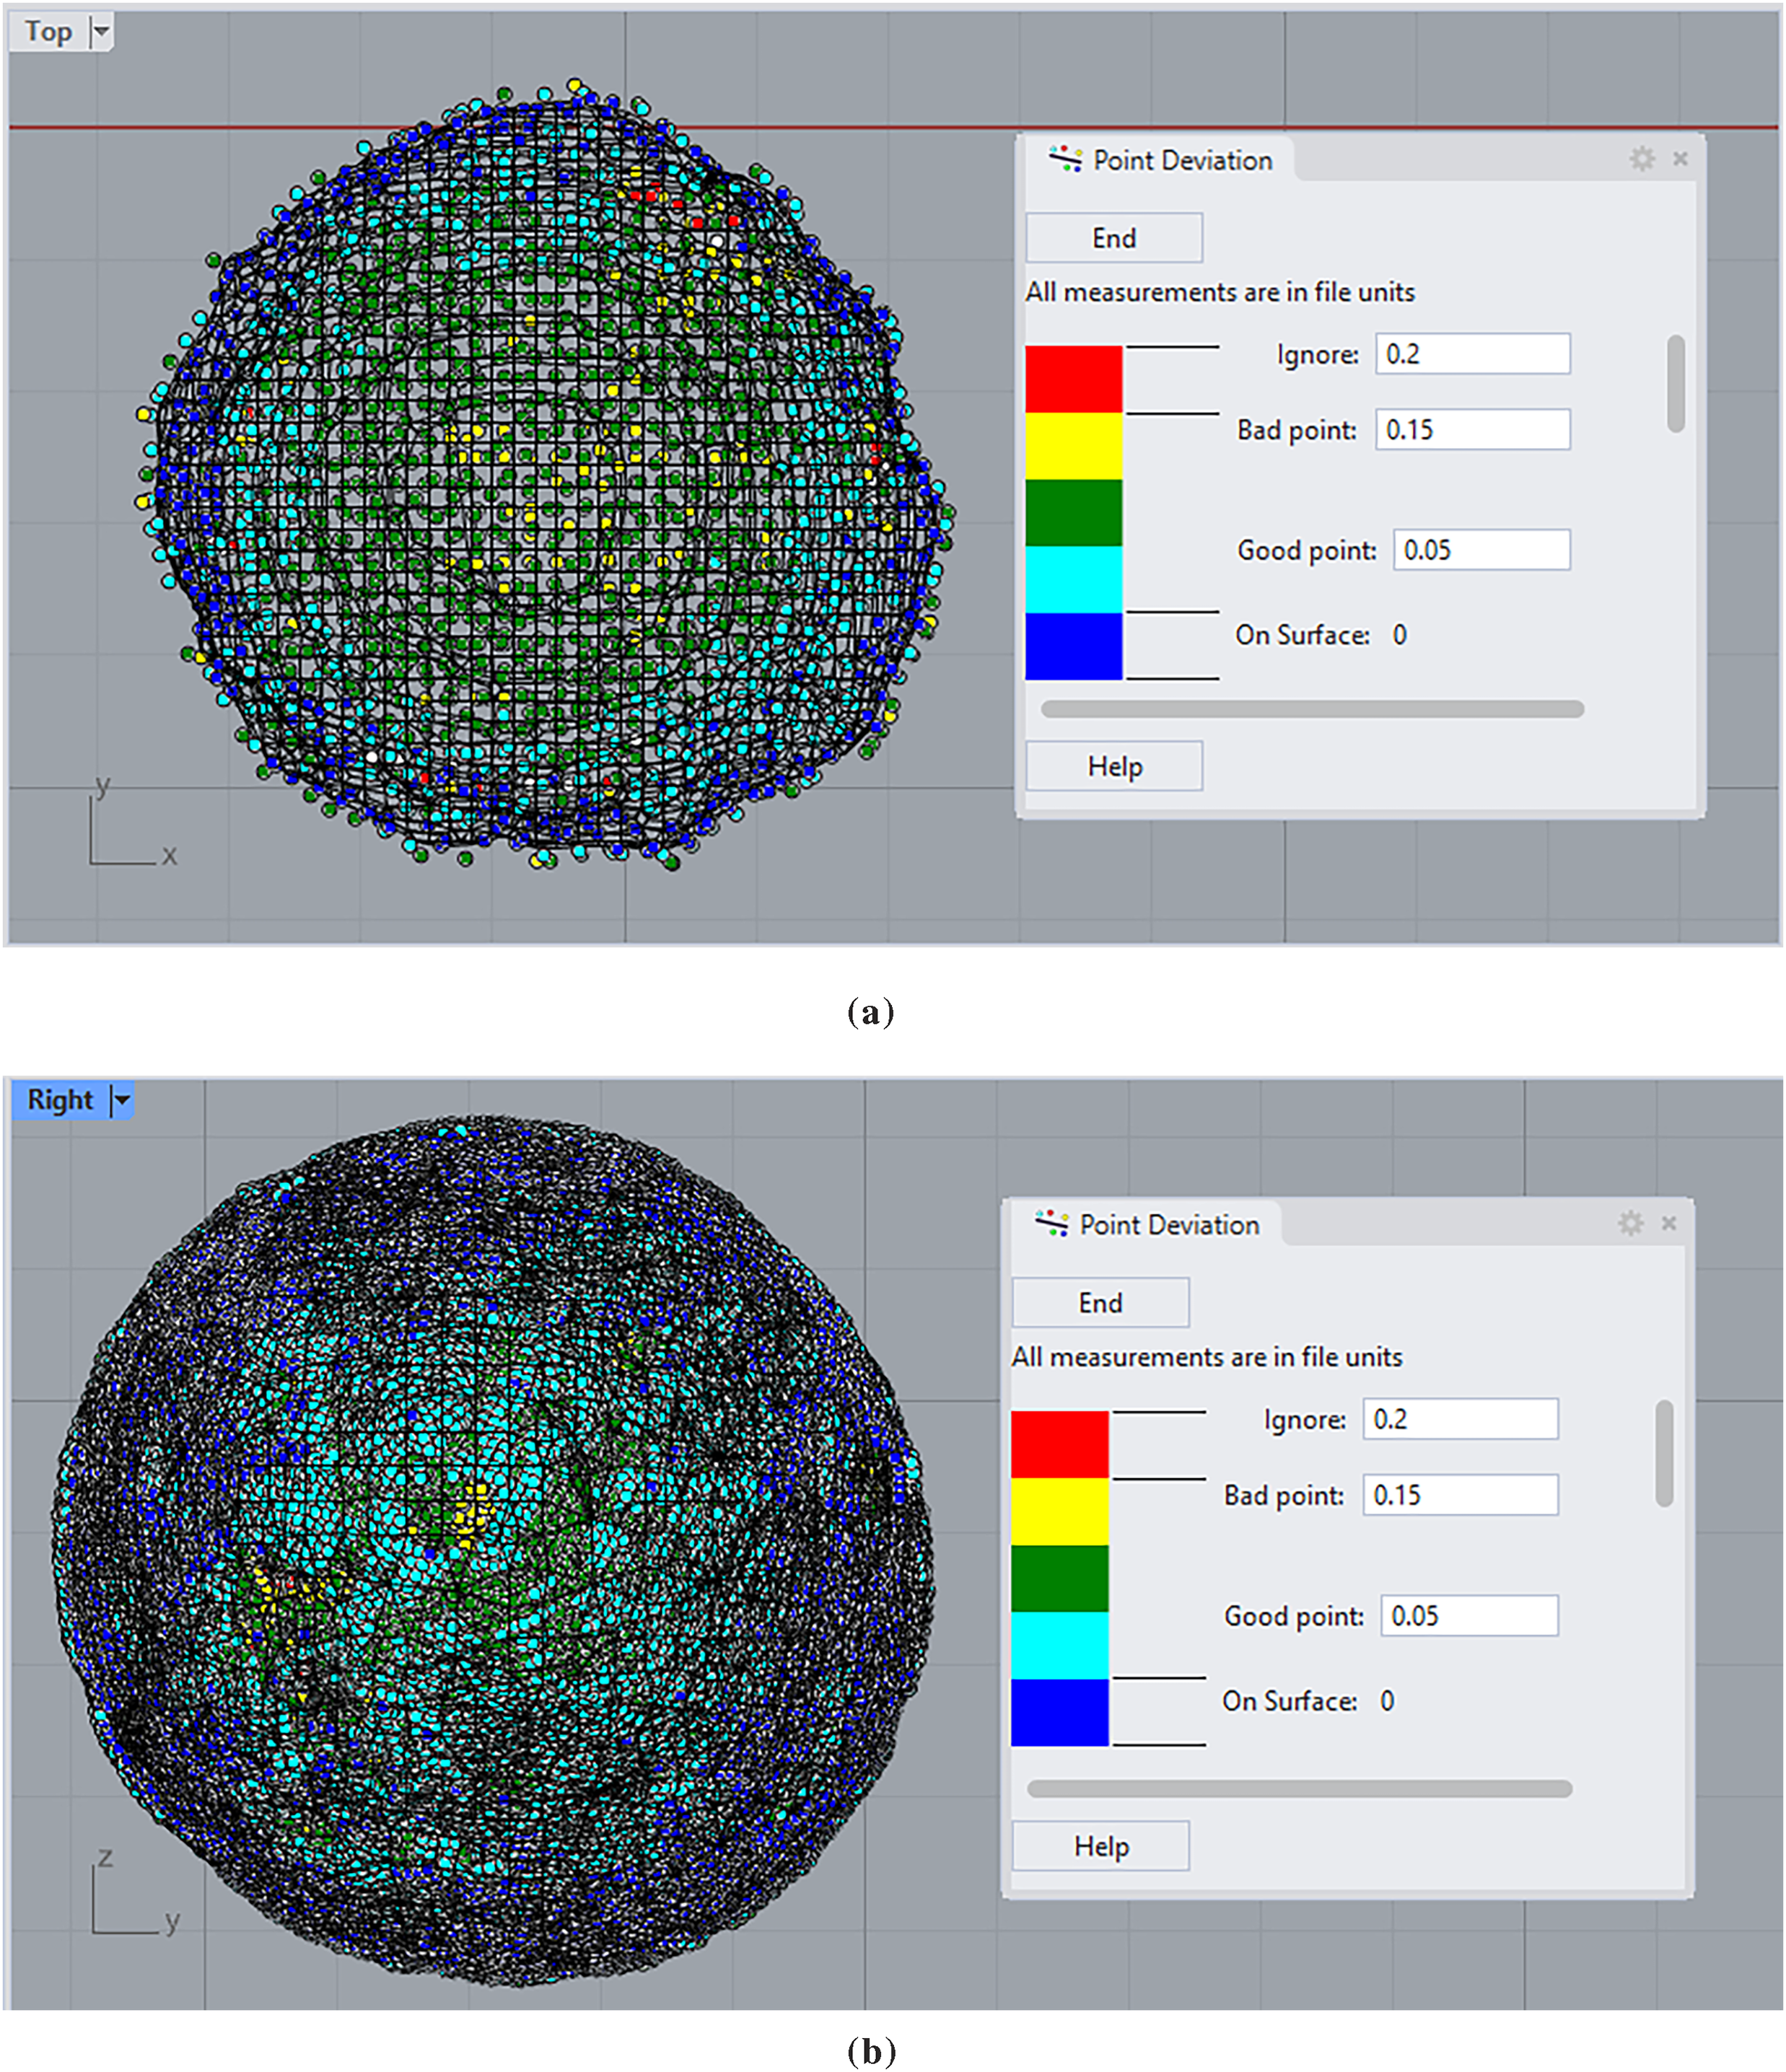
Figure 11: Heatmaps representing the deviation of each of the points with respect to the final generated mesh, for: (a) Artec SPIDER; (b) Steinbichler Vision COMET 5 1.4M
This study focuses on the ex vivo scanning and subsequent 3D modeling of an intact human crystalline lens, which required its removal from the eye in order to be performed. However, it should be noted that the currently established medical standard for lens extraction in cataract surgery involves fragmenting the nucleus prior to removal, thereby allowing extraction through a smaller incision. Only in extremely rare cases (such as very advanced or intumescent cataracts, or eyes with structurally compromised corneas) is complete lens extraction recommended, which accounts for the limited number of cases available to the research team for this study.
The analysis of the reconstructed lentil results highlights the strong dependence of outcomes on the scanner’s point acquisition efficiency, which is closely tied to the underlying technology. The RevoPoint POP 3 delivered the weakest performance, with poor geometric and surface data that prevented the generation of a usable digital model. The Artec EVA produced a model but suffered from major deficiencies in geometry, surface quality, and texture resolution, performing slightly better than the POP 3 but still inadequate. The Artec SPIDER demonstrated superior results in geometry, surface, and texture, producing a detailed and reliable model that outperformed the previous scanners. The HandyScan achieved acceptable geometry and surface quality but lacked the detail and precision of the Artec SPIDER, placing it in an intermediate position. The COMET 5 1.4M achieved the best results, with exceptional geometry, surface quality, and well-defined textures, making it the most suitable for high-precision digitization of objects of this size.
For lens scanning, however, the COMET 5 1.4M encountered difficulties in detecting translucent surfaces due to its sensitivity to ambient lighting, inherent to white structured light technology. Consequently, scanners using blue structured light, such as the Artec SPIDER, are more appropriate for this type of task when precision requirements are equivalent.
For surface texture and color reproduction, both the Artec SPIDER and COMET 5 1.4M provided sufficient detail, accurately replicating the main protrusions, though without achieving high sharpness. The COMET 5 1.4M performed better in capturing lens edge geometry, while the Artec SPIDER was more effective in reproducing the central surface zone with high quality. Edge definition with the Artec SPIDER can be improved using Rhinoceros’ smoothing tool; however, smoothing levels above 5 resulted in partial surface detail loss and a decrease in model volume. The COMET 5 1.4M showed a higher tendency to generate gaps or missing data, often requiring manual point insertion to improve reconstruction.
Regarding reconstruction methods, mesh-based approaches outperformed NURBS-based methods. With NURBS, the natural roughness of the lens surface caused excessive undulations in the patches, distorting the model and deviating from the original point cloud geometry. For key geometric parameters, the reconstructed models yielded values consistent with typical adult lens dimensions, including a thickness of 3.5–4.5 mm and a diameter of 6–9.5 mm, within the standard age-dependent range [23].
4.3 Usability and Cost-Efficiency Analysis
Although clinical OCT systems are designed for human diagnostics, they are limited in spatial resolution and tissue penetration, and therefore their ability to provide a detailed image of the entire crystalline lens is restricted [24]. Industrial 3D scanners, such as the ARTEC Spider and the Steinbichler COMET 5 1.4M, offer significantly higher spatial resolution, enabling detailed reconstruction of the full lens geometry. They provide dense meshes suitable for 3D modeling, finite element analysis, and additive manufacturing of replicas. Surface coating ensures accurate capture of transparent lenses, though its effect must be included in measurement uncertainty. Repeat scans under controlled hydration and temperature allow assessment of precision and reproducibility.
Regarding the cost and technical specifications, Table 4 summarizes them, providing a comparison between the two scanners used in this study, and three of the most commonly used OCT devices.
As can be seen in Table 5, industrial scanners fall within the same range of cost of clinical ones, and although COMET 5 may be slightly more expensive in some cases, both ARTEC and COMET provide cost-effective alternatives for clinical devices for those applications in which 3D reconstruction is more important than diagnosis. Consequently, the choice between these systems will depend on the study objective: human clinical diagnostics or detailed anatomical morphogeometrical model creation.

This study enables a thorough comparison of different scanning techniques for analyzing structures such as the human eye lens. The findings provide guidance for selecting appropriate scanners in future research, applicable not only to the lens but also to objects with similar properties. This approach may also benefit professionals in optics and medicine, as 3D modeling offers an effective means to study the lens, a structure prone to rapid deterioration under environmental conditions.
Several limitations must be considered. Working with a single crystalline lens prevents from reaching general conclusions about its geometry, dimensions, and surface condition. The lens is a highly variable tissue, whose shape, thickness, and curvature change with age, the degree of accommodation, metabolic status, and the presence of opacities or degenerative alterations. When a representative sample cannot be obtained, as happens in this case, any data obtained reflect only the specific condition of that specimen and do not allow for robust extrapolation to general patterns or interindividual comparisons. The comparison of five scanners with differing automation levels and technical specifications introduces variability in model fidelity, as operational differences may be as influential as inherent precision. Additionally, although lighting and temperature were controlled, factors such as internal lens moisture, uneven spray application, or tissue degradation could have subtly affected the reconstructed morphology. These points underscore the need for larger sample sizes, inclusion of lenses with diverse characteristics, and stricter control of experimental variables in future studies.
This work provides a foundation for further research on lens morphogeometry using expanded datasets. The construction of a patient-specific 3D model is the first necessary step toward developing a complete biomechanical model, which, with the incorporation of tools such as the Finite Element Method, can enable the creation of more accurate in vivo models. These models have direct applications in cataract surgery (allowing more precise selection of optical power) and in the design of more efficient systems for restoring accommodation (accommodative intraocular lenses, IOLs).
Future steps may also include generating physical replicas from digital models via customizable 3D printing to match desired properties and using the data to build mathematical models of age-related deformations induced by the ciliary muscle. The methodology could also be applied to other complex anatomical structures, such as knee joints. Moreover, access to high-fidelity digital models supports the design of customized ocular implants, reducing manufacturing costs, improving fit, and offering alternatives to conventional lenses in conditions such as presbyopia.
Acknowledgement: DeepSeek version 3.1 was used for translating original manuscript from Spanish to American English. Authors would also like to thank the Ophthalmology team at the “Hospital General Universitario Santa Lucia” in Cartagena for their support during this research.
Funding Statement: This article was funded by “Programa de Ayuda para la Puesta en Marcha o Mantenimiento de Líneas de Investigación Competitivas (LANZADERA) 2025” of the Technical University of Cartagena. This study was also carried out in collaboration with the Association for the Integration of the Disabled in the Comarca del Mar Menor (AIDEMAR, collaboration protocol UPCT-AIDEMAR).
Author Contributions: The authors confirm contribution to the paper as follows: Conceptualization, Francisco Cavas and Dolores Ojados; Methodology, José Velázquez and Dolores Ojados; Software, Adrián Semitiel and Dolores Ojados; Validation, José Velázquez, Dolores Ojados, and Francisco Cavas; Formal Analysis, Francisco Cavas and José Velázquez; Investigation, Adrián Semitiel and Dolores Ojados; Resources, Dolores Ojados, Francisco Cavas and José Velázquez; Data Curation, Adrián Semitiel and Francisco Cavas; Writing—Original Draft Preparation, Francisco Cavas, Dolores Ojados, José Velázquez, and Adrián Semitiel; Writing—Review & Editing, Francisco Cavas and José Velázquez; Visualization, Adrián Semitiel and José Velázquez; Supervision, Francisco Cavas and Dolores Ojados; Project Administration, Francisco Cavas and José Velázquez; Funding Acquisition, Francisco Cavas and José Velázquez. All authors reviewed the results and approved the final version of the manuscript.
Availability of Data and Materials: Data underlying the results presented in this paper are available in Ref. [25].
Ethics Approval: This study included human biological material and therefore adhered to the principles of the Declaration of Helsinki (7th revision, October 2013, Fortaleza, Brazil), being approved by the Ethics Committee of the Technical University of Cartagena, Spain (CEI21_001).
Informed Consent: Complete written informed consent was obtained from the patient for the publication of this study and accompanying images.
Conflicts of Interest: The authors declare no conflicts of interest to report regarding the present study.
References
1. Martinez-Enriquez E, Sun M, Velasco-Ocana M, Birkenfeld J, Pérez-Merino P, Marcos S. Optical coherence tomography based estimates of crystalline lens volume, equatorial diameter, and plane position. Investig Ophthalmol Vis Sci. 2016;57(9):OCT600–10. doi:10.1167/iovs.15-18933. [Google Scholar] [PubMed] [CrossRef]
2. Mohamed A, Nandyala S, Martinez-Enriquez E, Heilman BM, Augusteyn RC, de Castro A, et al. Isolated human crystalline lens three-dimensional shape: a comparison between Indian and European populations. Exp Eye Res. 2021;205(Suppl. 1):108481. doi:10.1016/j.exer.2021.108481. [Google Scholar] [PubMed] [CrossRef]
3. Martínez-Enríquez E, Maceo Heilman B, de Castro A, Mohamed A, Ruggeri M, Zvietcovich F, et al. Estimation of the full shape of the crystalline lens from OCT: validation using stretched donor lenses. Biomed Opt Express. 2023;14(8):4261–76. doi:10.1364/boe.493795. [Google Scholar] [PubMed] [CrossRef]
4. Dahaghin A, Salimibani M, Boszczyk A, Jóźwik A, Skrok M, Grasa J, et al. Investigation of crystalline lens overshooting: ex vivo experiment and optomechanical simulation results. Front Bioeng Biotechnol. 2024;12:1348774. doi:10.3389/fbioe.2024.1348774. [Google Scholar] [PubMed] [CrossRef]
5. Xiang Y, Fu T, Xu Q, Chen W, Chen Z, Guo J, et al. Quantitative analysis of internal components of the human crystalline lens during accommodation in adults. Sci Rep. 2021;11(1):6688. doi:10.1038/s41598-021-86007-6. [Google Scholar] [PubMed] [CrossRef]
6. Rich W, Reilly MA. A review of lens biomechanical contributions to presbyopia. Curr Eye Res. 2023;48(2):182–94. doi:10.1080/02713683.2022.2088797. [Google Scholar] [PubMed] [CrossRef]
7. de la Hoz A, Martinez-Enriquez E, Marcos S. Estimation of crystalline lens material properties from patient accommodation data and finite element models. Investig Ophthalmol Vis Sci. 2023;64(11):31. doi:10.1167/iovs.64.11.31. [Google Scholar] [PubMed] [CrossRef]
8. Cabeza-Gil I, Grasa J, Calvo B. A numerical investigation of changes in lens shape during accommodation. Sci Rep. 2021;11(1):9639. doi:10.1038/s41598-021-89145-z. [Google Scholar] [PubMed] [CrossRef]
9. He JC. Refractive index measurement of the crystalline lens in vivo. Optom Vis Sci. 2023;100(12):823–32. doi:10.1097/opx.0000000000002081. [Google Scholar] [PubMed] [CrossRef]
10. Bahrami M, Goncharov AV. Geometry-invariant gradient refractive index lens: analytical ray tracing. J Biomed Opt. 2012;17(5):055001. doi:10.1117/1.jbo.17.5.055001. [Google Scholar] [PubMed] [CrossRef]
11. Pan X, Lie AL, White TW, Donaldson PJ, Vaghefi E. Development of an in vivo magnetic resonance imaging and computer modelling platform to investigate the physiological optics of the crystalline lens. Biomed Opt Express. 2019;10(9):4462–78. doi:10.1364/boe.10.004462. [Google Scholar] [PubMed] [CrossRef]
12. Navarro R, Palos F, González L. Adaptive model of the gradient index of the human lens I Formulation and model of aging ex vivo lenses. J Opt Soc Am A. 2007;24(8):2175. doi:10.1364/josaa.24.002175. [Google Scholar] [PubMed] [CrossRef]
13. Navarro R, Palos F, González LM. Adaptive model of the gradient index of the human lens. II. Optics of the accommodating aging lens. J Opt Soc Am A. 2007;24(9):2911–20. doi:10.1364/josaa.24.002911. [Google Scholar] [PubMed] [CrossRef]
14. Zéboulon P, Panthier C, Rouger H, Bijon J, Ghazal W, Gatinel D. Development and validation of a pixel wise deep learning model to detect cataract on swept-source optical coherence tomography images. J Optom. 2022;15(1 Suppl):S43–9. doi:10.1016/j.optom.2022.08.003. [Google Scholar] [PubMed] [CrossRef]
15. Wang K, Pierscionek BK. Biomechanics of the human lens and accommodative system: functional relevance to physiological states. Prog Retin Eye Res. 2019;71:114–31. doi:10.1016/j.preteyeres.2018.11.004. [Google Scholar] [PubMed] [CrossRef]
16. Velázquez JS, Iznaga-Benítez AM, Robau-Porrúa A, Sáez-Gutiérrez FL, Cavas F. New affordable method for measuring angular variations caused by high heels on the sagittal plane of feet joints during gait. Appl Sci. 2021;11(12):5605. doi:10.3390/app11125605. [Google Scholar] [CrossRef]
17. ShrinkWrap | Rhino 3-D modeling. [cited 2025 Sep 25]. Available from: https://docs.mcneel.com/rhino/8/help/en-us/commands/shrinkwrap.htm?utm_source=chatgpt.com. [Google Scholar]
18. Nießner M, Zollhöfer M, Izadi S, Stamminger M. Real-time 3D reconstruction at scale using voxel hashing. ACM Trans Graph. 2013;32(6):1–11. doi:10.1145/2508363.2508374. [Google Scholar] [CrossRef]
19. Kazhdan M, Hoppe H. Screened poisson surface reconstruction. ACM Trans Graph. 2013;32(3):1–13. doi:10.1145/2487228.2487237. [Google Scholar] [CrossRef]
20. Patch | Rhino 3-D modeling. [cited 2025 Sep 25]. Available from: https://docs.mcneel.com/rhino/8/help/en-us/commands/patch.htm. [Google Scholar]
21. Piegl L, Tiller W. B-spline curves and surfaces. In: The NURBS book. Chapter 4. Berlin, Germany: Springer; 1997. p. 81–116 doi:10.1007/978-3-642-59223-2_3. [Google Scholar] [CrossRef]
22. Jüttler B, Felis A. Least-squares fitting of algebraic spline surfaces. Adv Comput Math. 2002;17(1):135–52. doi:10.1023/a:1015200504295. [Google Scholar] [CrossRef]
23. Lanchares E, Navarro R, Calvo B. Hyperelastic modelling of the crystalline lens: accommodation and presbyopia. J Optom. 2012;5(3):110–20. doi:10.1016/j.optom.2012.05.006. [Google Scholar] [CrossRef]
24. Wang L, Jin G, Ruan X, Gu X, Chen X, Wang W, et al. Changes in crystalline lens parameters during accommodation evaluated using swept source anterior segment optical coherence tomography. Ann Eye Sci. 2022;7(1):33. doi:10.21037/aes-21-70. [Google Scholar] [CrossRef]
25. Velázquez J. Procedure for solid modelling and morpho-geometric analysis of a crystalline lens using 3D scanning and digitization techniques. Version 1.0. Cartagena, Murcia, Spain: Comunidad Universidad Politécnica de Cartagena; 2024. doi:10.5281/zenodo.16088204. [Google Scholar] [CrossRef]
Cite This Article
 Copyright © 2025 The Author(s). Published by Tech Science Press.
This work is licensed under a Creative Commons Attribution 4.0 International License , which permits unrestricted use, distribution, and reproduction in any medium, provided the original work is properly cited.
 Downloads
 Citation Tools