
 Submit a Paper
 Propose a Special lssue
 Open Access
ARTICLE

Stress Intensity Factor, Plastic Limit Pressure and Service Life Assessment of a Transportation-Damaged Pipe with a High-Aspect-Ratio Axial Surface Crack
Mechanical Engineering Faculty in Slavonski Brod, University of Slavonski Brod, Slavonski Brod, 35000, Croatia
* Corresponding Author: Božo Damjanović. Email:
(This article belongs to the Special Issue: Advances in Computational Fracture Mechanics: Theories, Techniques, and Applications)
Computer Modeling in Engineering & Sciences 2025, 145(2), 1735-1753. https://doi.org/10.32604/cmes.2025.072256
Received 22 August 2025; Accepted 14 October 2025; Issue published 26 November 2025
 View Full Text
 Download PDF
Abstract
Ensuring the structural integrity of piping systems is crucial in industrial operations to prevent catastrophic failures and minimize shutdown time. This study investigates a transportation-damaged pipe exposed to high-temperature conditions and cyclic loading, representing a realistic challenge in plant operation. The objective was to evaluate the service life and integrity assessment parameters of the damaged pipe, subjected to 22,000 operational cycles under two daily charge and discharge conditions. The flaw size in the damaged pipe was determined based on a failure assessment procedure, ensuring a conservative and reliable input. The damage was characterized as a long axial surface crack with a depth of a = 2 mm and half-length c = 50 mm (c/a = 25), a geometry not well covered by existing Stress Intensity Factor solutions. To address this limitation, a modified magnification factor (M*) was introduced and tested for the present damage case (c/a = 25) and for additional crack geometries (c/a = 28–70), which showed improved agreement with Finite Element Analysis (FEA) than Newman’s original formulation. Stress Intensity Factor and Plastic Limit Pressure, essential parameters for structural integrity assessment, were computed numerically using FEA and validated against analytical predictions. Fatigue crack growth was evaluated using the Paris law with crack propagation simulated numerically by Ansys’s S.M.A.R.T. The Failure Assessment Diagram (FAD) was used to assess service life, incorporating constant working pressure and fracture toughness while considering evolving crack size during propagation. Results showed that analytical predictions with the modified magnification factor matched FEA within 5%, while the original Newman formulation overestimated results. The analytical service life solution predicted approximately 8500 fewer cycles than the numerical, remaining conservative but efficient. These findings are based on the present case of a long axial surface crack with high aspect ratios (c/a = 25–70, depending on crack depth), and while the modified magnification factor may also improve predictions for other geometries, this requires structured validation in future studies.Keywords
Prefabrication as a construction technique brings many benefits and is increasingly applied in plant design and construction. Despite the advantages, this technique requires advanced transportation logistics, skilled labor, and effective project management. Prefabricated piping spools must be delivered to the construction site with caution [1]. After the delivery, spools should be examined to check whether damage occurred during transport. The flaws can contribute to the failure of a single component and a single component can contribute to the shutdown of the entire plant. Since most failures in plants are caused by fatigue, it is important to approach this problem with special attention. In the presence of an undetected flaw, a piping system can fail even when stress is below allowable limits while it is subjected to cyclic loading. With the modern fracture mechanics principles, it is possible to predict the behavior of flaws even shorter than one millimeter. In such scenarios, pipe integrity assessment must be carried out with a detailed stress and strain analysis. Recent reviews have highlighted the wide range of failure mechanisms and integrity assessment strategies for pipelines, including defect evaluation and fatigue life prediction methods [2]. Paris and Erdogan are among the first researchers who investigated fatigue crack growth in the early 1960s which sets the foundations for modern fatigue crack growth analysis [3]. There are many experimental studies that investigate fatigue crack growth in various steel materials [4–7]. Leak Before Break (LBB) is a recently popular practice of piping design based on fracture mechanics principles that ensures that the component will not cause catastrophic failure [8,9]. While piping components are more frequently investigated, there are few studies available on plate specimens with part-through cracks [10–12]. Singh et al. investigated circumferential crack growth in carbon steel pipes with a part-through crack of large aspect ratio 20–50 [13]. Earlier investigations of the influence of crack aspect ratio on fatigue crack growth were conducted by Engle [14] and Wu [15], but crack aspect ratios were moderate compared to those in the present study. Cruse and Besuner [16] have introduced an effective crack driving force parameter KRMS. This parameter represents the average stress intensity factor along the crack front which gives better results of fatigue crack growth life predictions. A recent review highlighted that material properties under impact loading are key parameters affecting fatigue crack growth [17]. Probabilistic approaches have also been developed, such as particle filtering methods for pipeline fatigue crack growth prediction, which provide confidence intervals for remaining life and account for uncertainties in Paris’ law parameters [18]. Prior Stress Intensity Factor solution and ASME Section XI tables mainly cover axial semi-elliptical with aspect ratios a/c > 1 (deep cracks) [19]. In contrast, this paper investigates a transportation-damaged pipe that operates at high temperatures containing a shallow axial surface crack with a high aspect ratio of c/a = 25, representing the damage geometry. This case study is complemented by additional tests for cracks with the same half-length (c = 50 mm), with various crack depths (a/t = 0.1, 0.15, 0.2, and 0.25) corresponding to aspect ratios 70, 47, 35 and 28, respectively in order to assess the applicability of the proposed modification. For Paris law crack growth, analytical (modified Newman solution) and numerical (FEA) approaches were employed. While many prior studies focus on idealized specimens or standard piping components, there is a lack of research on transportation-damaged piping components under high operating temperatures, with high aspect ratio axial cracks coupled with Plastic Limit Pressure analysis The novelty of this work lies in addressing the scarcely explored high crack aspect ratio through a dual-layered methodology, where analytical and numerical approaches are validated at each stage to provide a reliable assessment. A damaged pipe with a defect is shown in Fig. 1.
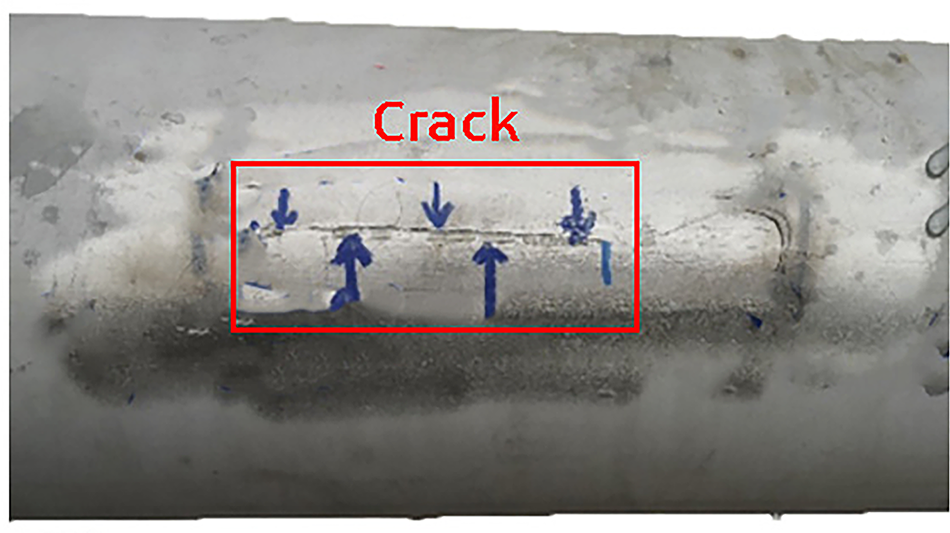
Figure 1: Detected transportation damage on the pipe spool
The observed damaged pipe is part of the steam power plant piping system. Steam pipes are crucial components in power plants exposed to high temperatures, pressure, and even occasional environmental loads such as wind and seismic loads. Therefore, design and maintenance stages are essential to build a sustainable power piping system. While the pipe was damaged during the transportation process, integrity assessment is an inevitable task after the design process [20]. The observed piping system is operating at an internal pressure of 2.2 MPa and 420°C along with 22,000 operational cycles under two daily charge and discharge conditions. The damage is placed longitudinally, parallel to the pipe axis and perpendicular to the hoop stress direction, which indicates mode I crack opening. The stress state of the damaged pipe is shown in Fig. 2.
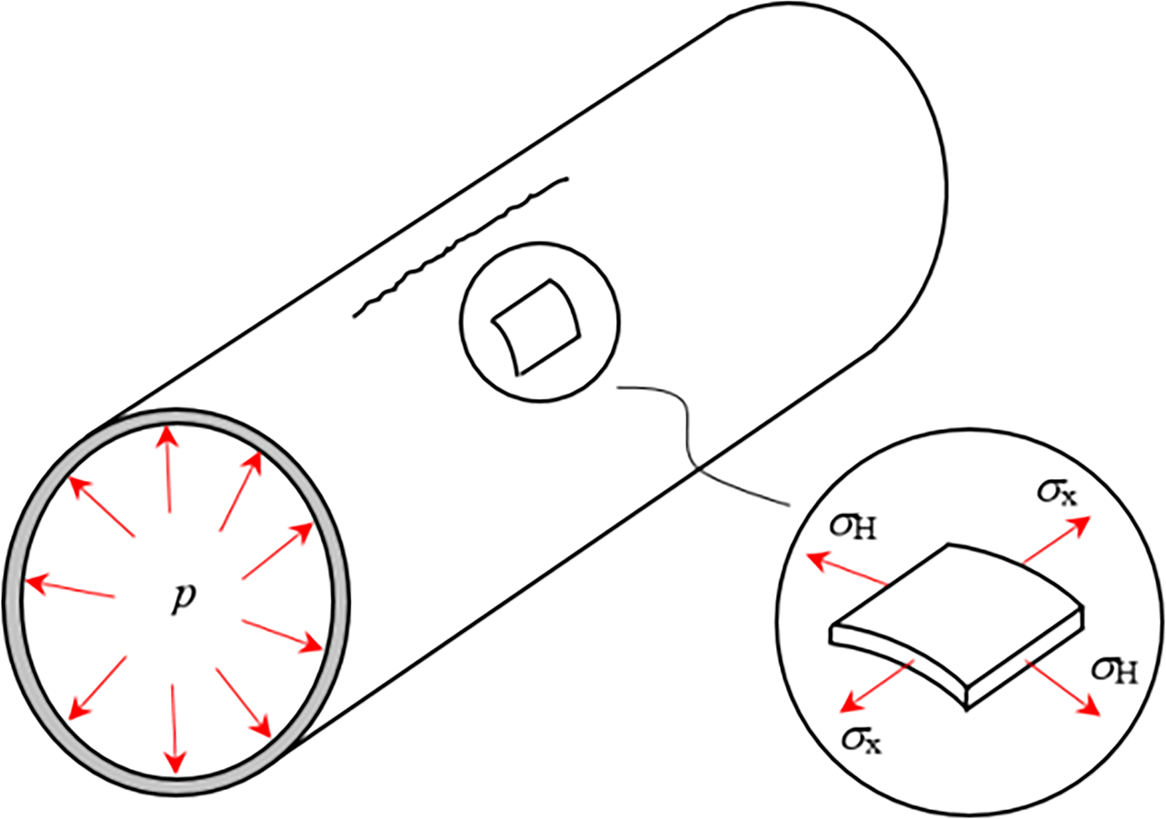
Figure 2: Stress state of damaged pipe loaded with internal pressure
Fig. 2 illustrates directions of the longitudinal (axial) and hoop (circumferential) stress in a thin-walled pipe. These stresses are considered uniform across wall thickness under the thin-wall assumption (t/D < 0.1). Expressions are [21]:
where p is the internal pressure, Ri and Ro are the pipe’s inner and outer radius, and t is the wall thickness. To compensate for the non-uniform hoop stress distribution that appears in reality, the design equation generally uses the outside radius instead of the inside radius. This equation is conservative and primarily used for design purposes, as it slightly overestimates the numerical results in cases where the objective is to obtain the Stress Intensity Factor as a fracture parameter.
In order to simplify the calculation, the actual damage geometry is simplified to a semi-elliptical crack according to [22]. This approximation is shown in Fig. 3.
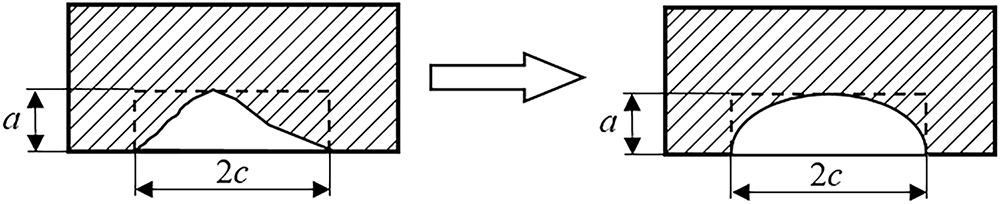
Figure 3: Damage approximation
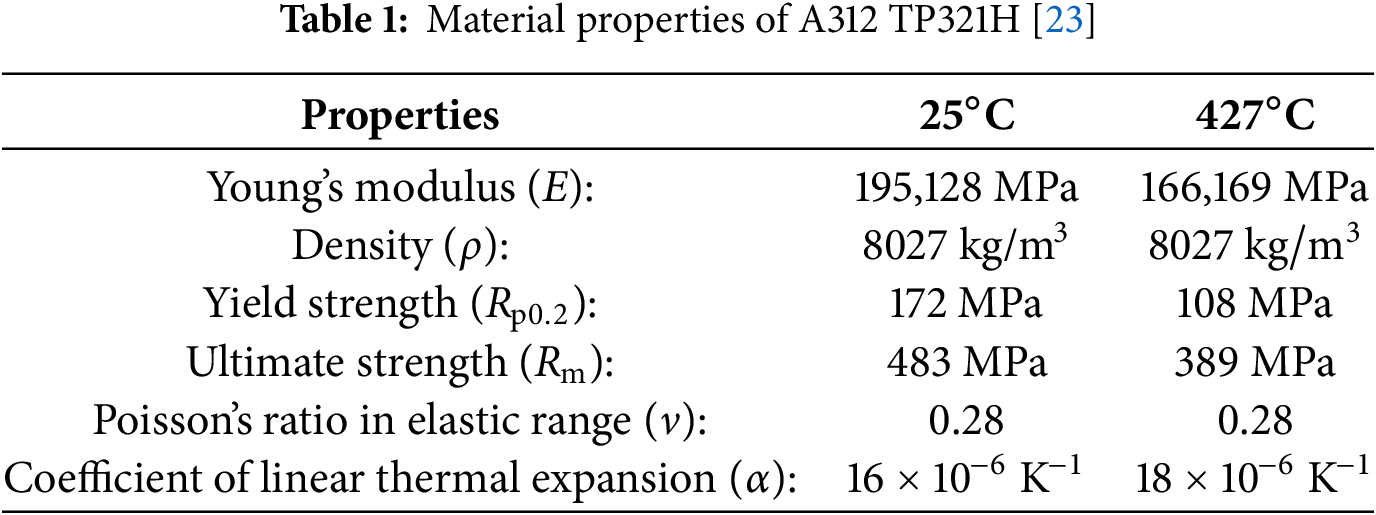
Dimensions of the semi-elliptical crack are a = 2 mm, which represents the depth of the crack, and c = 50 mm, which is half the length of the crack. Pipe diameter is DN150 with a thickness of t = 7.11 mm. Pipe material is austenitic stainless steel A312 TP321H. This type of piping material is suitable and often used for steam piping exposed to high pressures and temperatures. Material properties at room and design temperature (data available on 427°C in standard) are given in Table 1 [23].
3 Analytical Determination of Stress Intensity Factor and Plastic Limit Pressure
In order to assess the integrity of damaged pipe and service life, it is inevitable to determine essential parameters for that matter, Stress Intensity Factor (SIF) and Plastic Limit Pressure (PLP) by considering damage as a crack. The analytical calculation considers the maximum SIF along the crack front. Stress Intensity Factor was obtained by applying Newman’s expression for the cylindrical part of a pressure vessel containing a crack [24,25]:
where σ is the hoop stress (calculated by applying Eq. (1)), a is the crack depth, ϕ is crack shape factor, M is the magnification factor, which consists of the combined front-face and back-face correction factor (Me) and shell-curvature correction factor (fs).
Combined front-face and back-face correction factor [24,25]:
Front-face correction factor [24,25]:
Shell curvature (free-surface) correction factor [24,25]:
where a is a crack depth, c is half crack length, Ri represents inner radius of the pipe.
Eq. (9) shows that Newman’s shell curvature correction factor is defined as 0 < λs < 10, however, it was calibrated for moderate crack aspect ratios. For the damage case (a = 2 mm, c/a = 25, λs = 0.6), the complete magnification factor (M = Mefs) overestimated the Stress Intensity Factor compared to numerical results. The simplified magnification factor (M = Me) matched the numerical predictions with a deviation of less than 5%. This deviation indicates that for very long and shallow cracks, with a very high length-to-depth ratio in thin-walled pipes, the shell curvature (free-surface) correction factor can double-count curvature effects already present in the calculated stress. Considering this, we propose a high-aspect-ratio modification where the surface factor is included or excluded, while delivering analytical predictions consistent with numerical results. Extension of Newman’s cylindrical shell Stress Intensity Factor to a high crack aspect ratio as a modified magnification factor:
where g is a dimensionless attenuation surface factor. Mathematically, g can only collapse to 0 or 1. When g = 1, it recovers Newman’s original magnification factor M = Mefs, which is applicable for ordinary crack aspect ratios. In this case, g = 0, which drops the shell curvature (free-surface) correction factor fs, and the magnification factor is simplified to M* = Me. To further investigate this behavior, validation was extended to cracks of the same length (c = 50 mm) but varying depths (a/t = 0.1–0.25), corresponding to aspect ratios 70 down to 28.
Plastic Limit Pressure (PLP) determination implies finding the pressure at which plastic collapse occurs. This collapse occurs when the equivalent stresses exceed the yield strength of the material through the whole remaining ligament. The expression for calculating PLP for a pipe containing a semi-elliptical axial part-through crack, where the hoop stress is dominant, and based on Tresca and von Mises yield criteria [26]:
where Ro is outside pipe radius, Ri is inside pipe radius, σy is yield strength of the material, t is pipe thickness, a is crack depth and c is half crack length.
4 Numerical Determination of Stress Intensity Factor and Plastic Limit Pressure
The numerical calculation of Stress Intensity Factor and Plastic Limit Pressure was performed in Ansys Workbench 2022 [27]. Numerical calculation of the Stress Intensity Factor implies applying a linear material model at the design temperature. A half-model was adopted with a symmetry plane perpendicular to the axial crack to reduce computational cost. Symmetry mirrors the global field and includes a remote mirror crack. A sensitivity calculation was performed with a single crack on the whole pipe model segment (excluding symmetry). Comparison of the SIF at the deepest point and the ligament-average equivalent stress differs by less than 0.5% relative to the symmetric model. Therefore, crack interaction is neglected for the present geometry and loading, and the symmetric model is preserved. Other applied boundary conditions are set as constraints of the model and as loading conditions. The numerical model with boundary conditions is shown in Fig. 4.
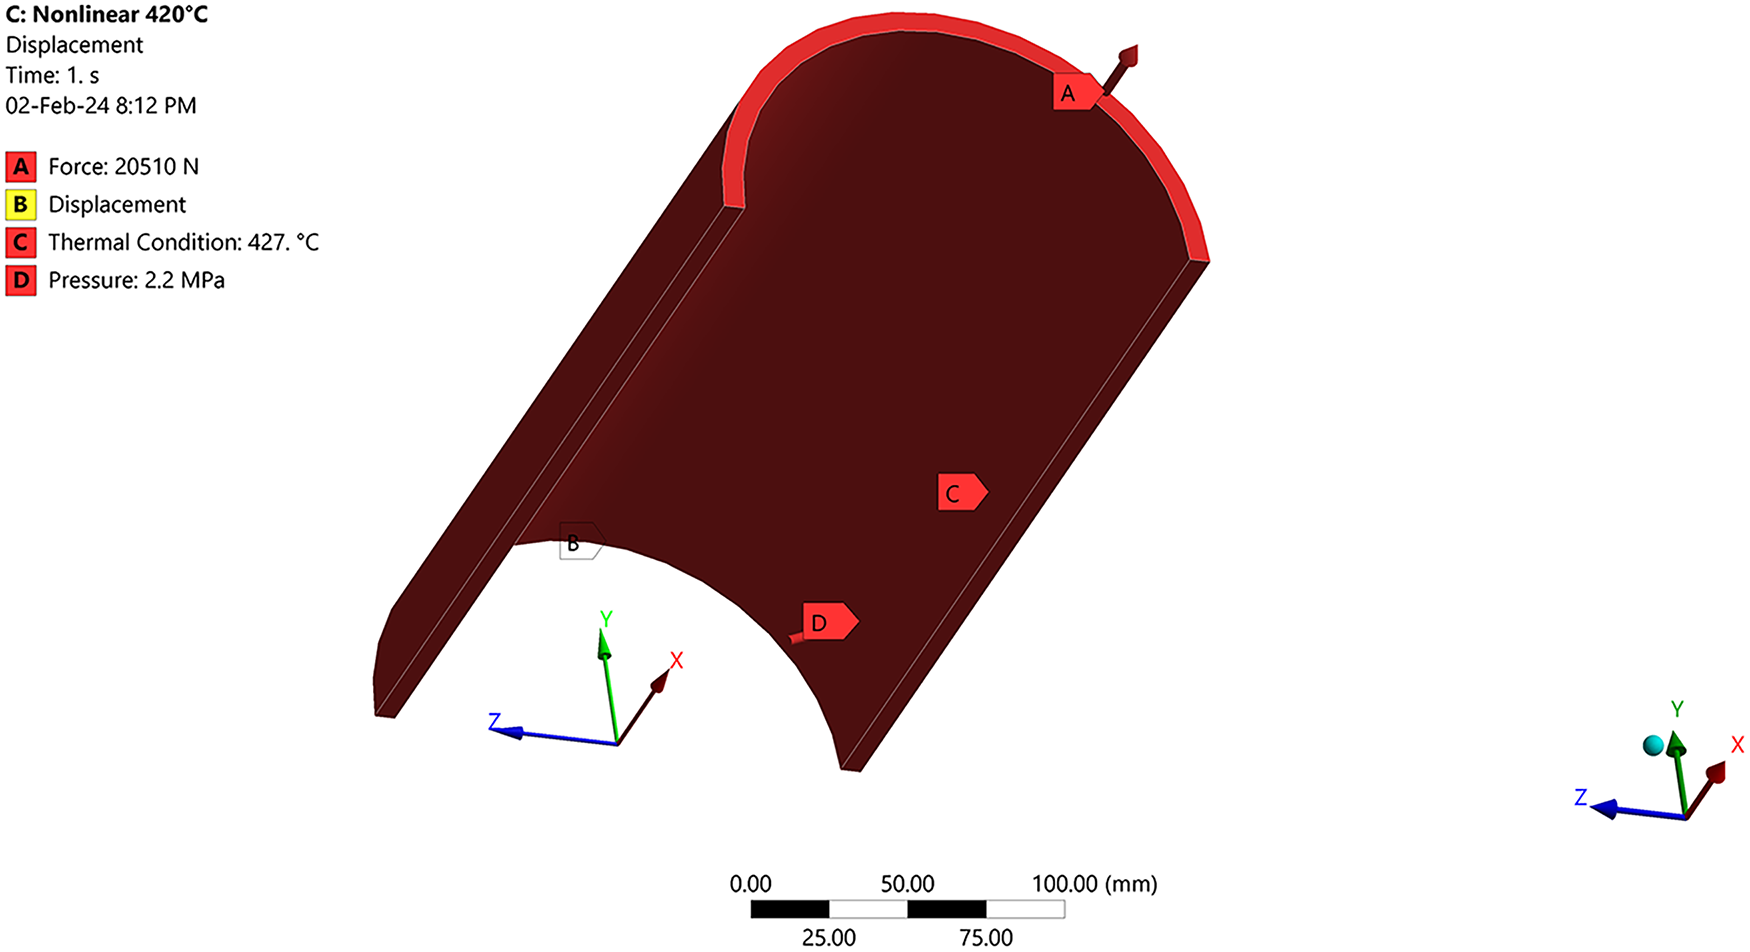
Figure 4: Boundary conditions in numerical model
The compensation force (A) was applied to achieve static equilibrium. Displacement (B) was constrained in the X-direction. The thermal condition (C) was set to the design temperature, and the internal pressure (D) was applied to the inside surface of the pipe.
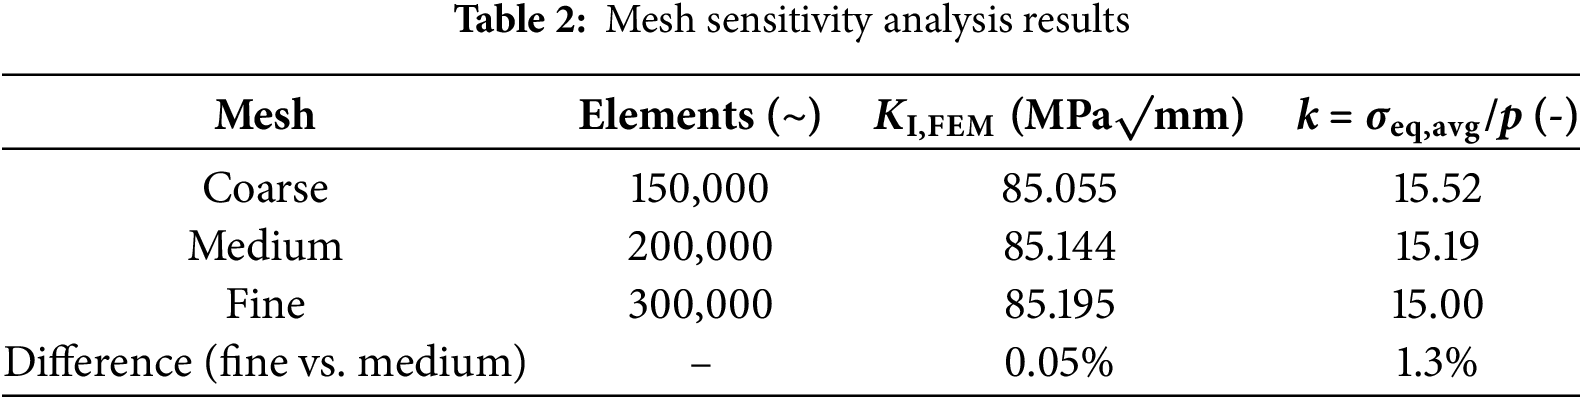
Meshing of the model was performed using second-order tetrahedral finite elements, while the crack was meshed with dominantly second-order hexahedral singular elements to capture the stress singularity. Attention was paid to ensure at least three elements across the thickness of the pipe. The number of elements along the crack front is set to 350, with a largest contour radius of 0.1 mm. To achieve mesh-independent results, a mesh sensitivity analysis was conducted. The mesh size was categorized into three groups: coarse, medium, and fine, using a linear-elastic material model at a working pressure of p = 2.2 MPa with a crack size of a = 2 mm. We report the ligament-average stress per unit pressure, k = σeq,avg, and Stress Intensity Factor KI at the deepest point. Convergence of k at working pressure is load-independent and represents the same mesh trend that would appear in nonlinear Plastic Limit Pressure analysis. Table 2 displays the mesh sensitivity results.
Fine mesh was adopted. Meshed numerical model with crack is shown in Fig. 5.
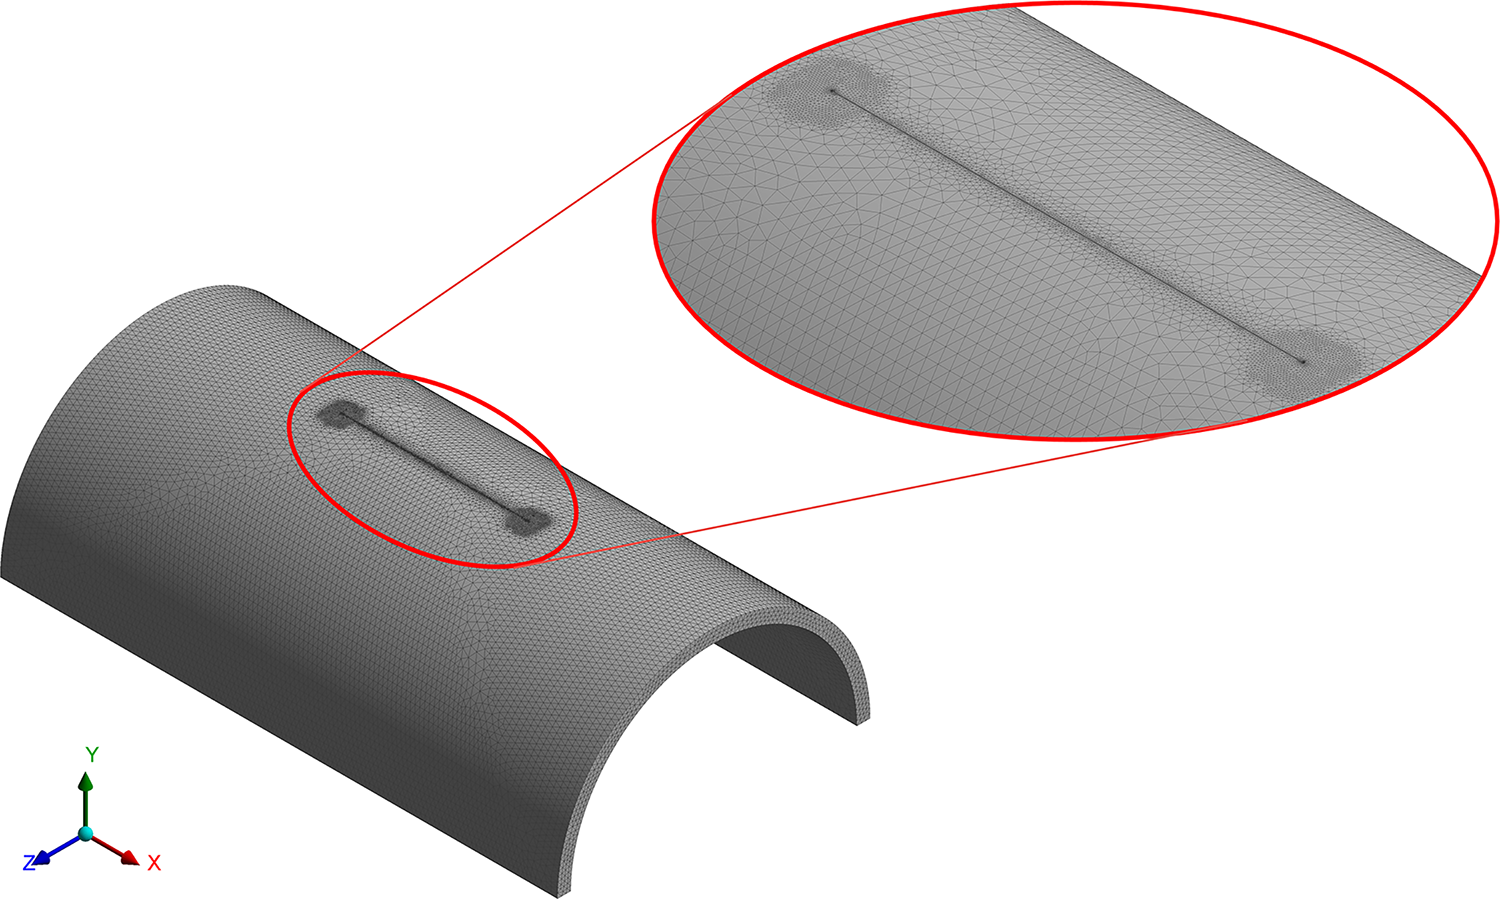
Figure 5: Meshed model with crack
The numerical Stress Intensity Factor was obtained directly from the finite element model by defining a semi-elliptical surface crack in ANSYS Workbench and applying fracture mechanics tools along the crack front. Numerically obtained Stress Intensity Factor (KI,FEM) along the crack contour is given in Fig. 6.
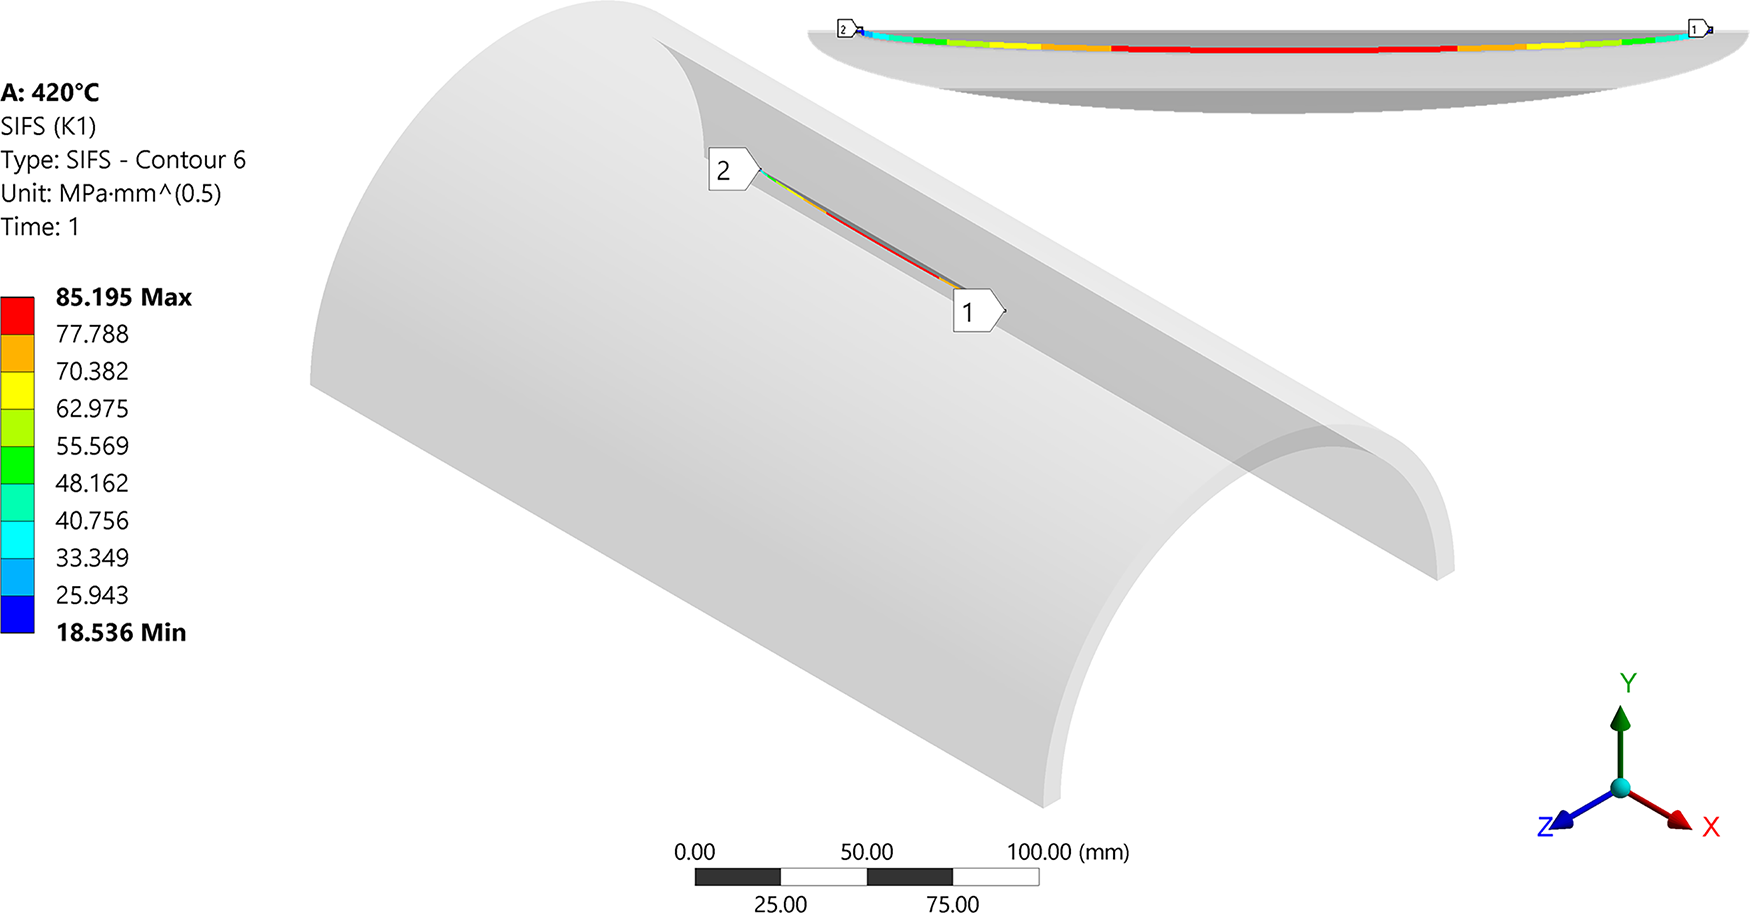
Figure 6: Stress intensity factor along crack shape
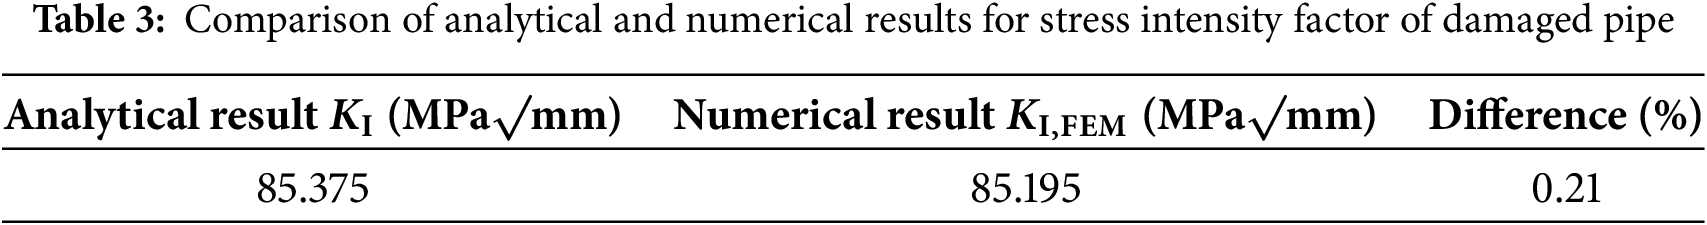
The comparison of results for the damaged case with crack size a = 2 mm is shown in Table 3. It can be concluded that the analytical approach, using a modified magnification factor for SIF, gives accurate results.
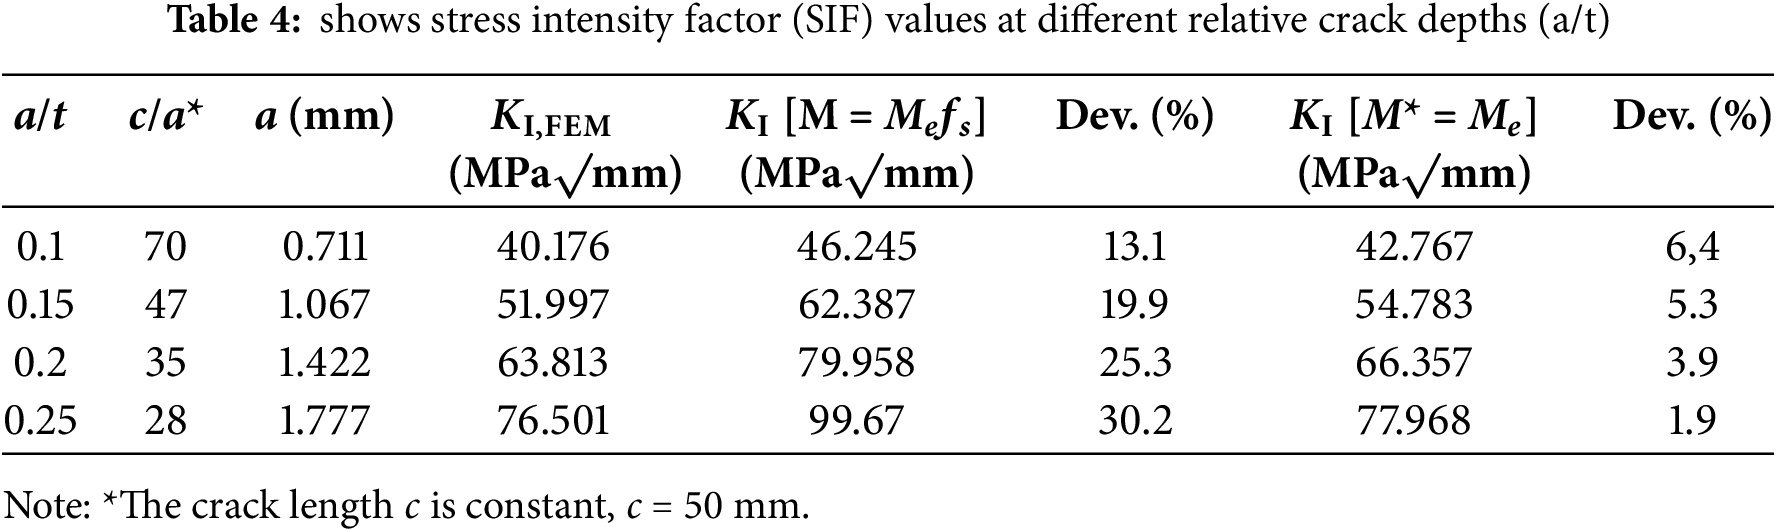
To verify the applicability of the proposed magnification factor, in addition to the damage case (c/a = 25), validation of additional cracks was performed for the same half-length (c = 50 mm). Relative depths of a/t = 0.1, 0.15, 0.2, and 0.25 corresponding to aspect ratios of 70, 47, 35, and 28, respectively. Stress Intensity Factor was extracted at the deepest point of the semi-elliptical crack front for relative crack depths a/t = 0.1, 0.15, 0.2, and 0.25 corresponding to aspect ratios c/a = 28, 35, 47, and 70. For each crack depth, three values were validated, numerical KI,FEM, analytical predictions using the simplified magnification factor (M* = Me), and analytical predictions using the original Newman formulation. The comparison helps quantify the deviation of the analytical solutions from numerical and identifies whether the proposed modification (M* = Me) provides better agreement in the high aspect ratio regime. Fig. 7 and Table 4 show the comparison of SIF for different a/t.
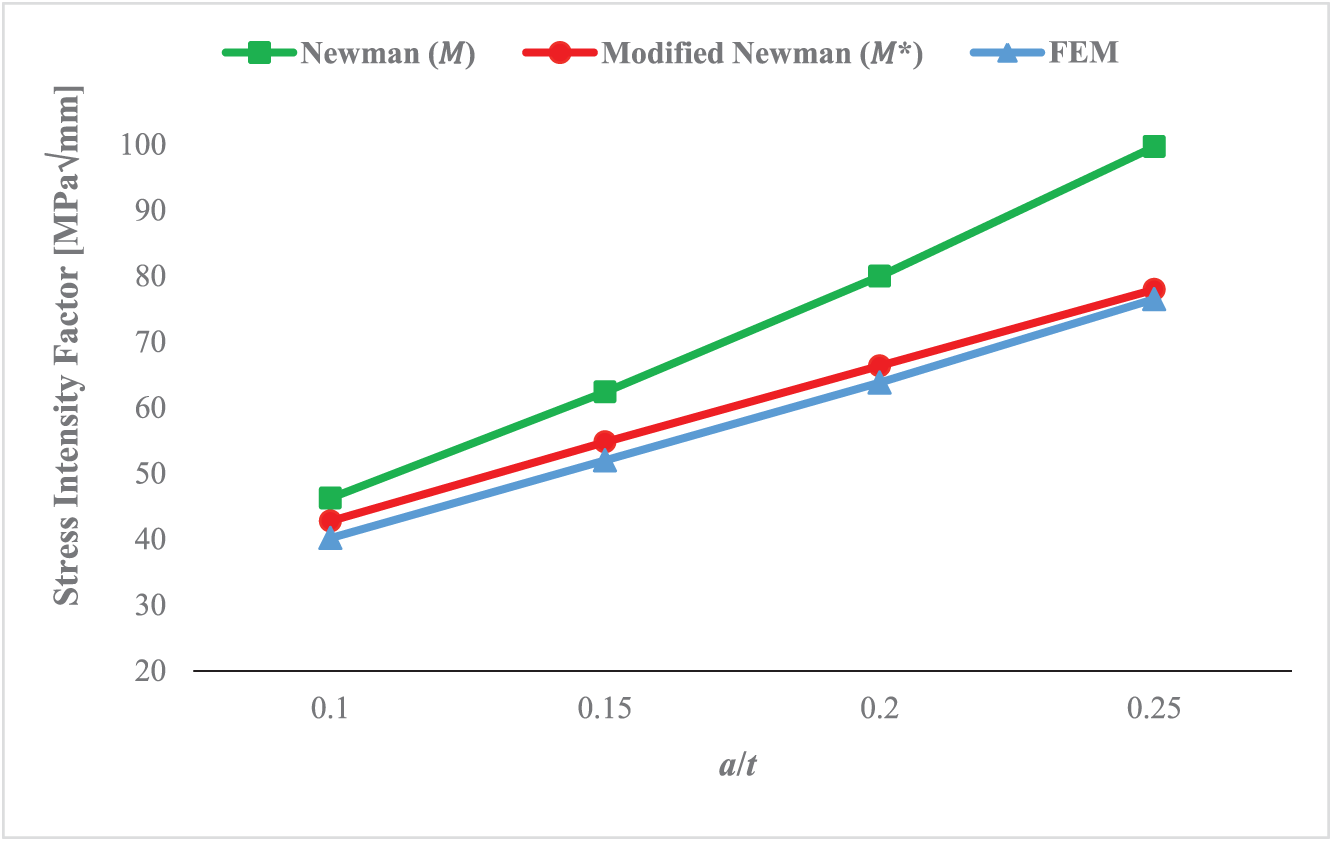
Figure 7: Comparison of stress intensity factor for different relative crack depths
Unlike the determination of SIF, to calculate Plastic Limit Pressure, a nonlinear material model must be taken into account. A bilinear elastic-plastic material model with a low level of isotropic hardening, along with a representative material model (Fig. 8).
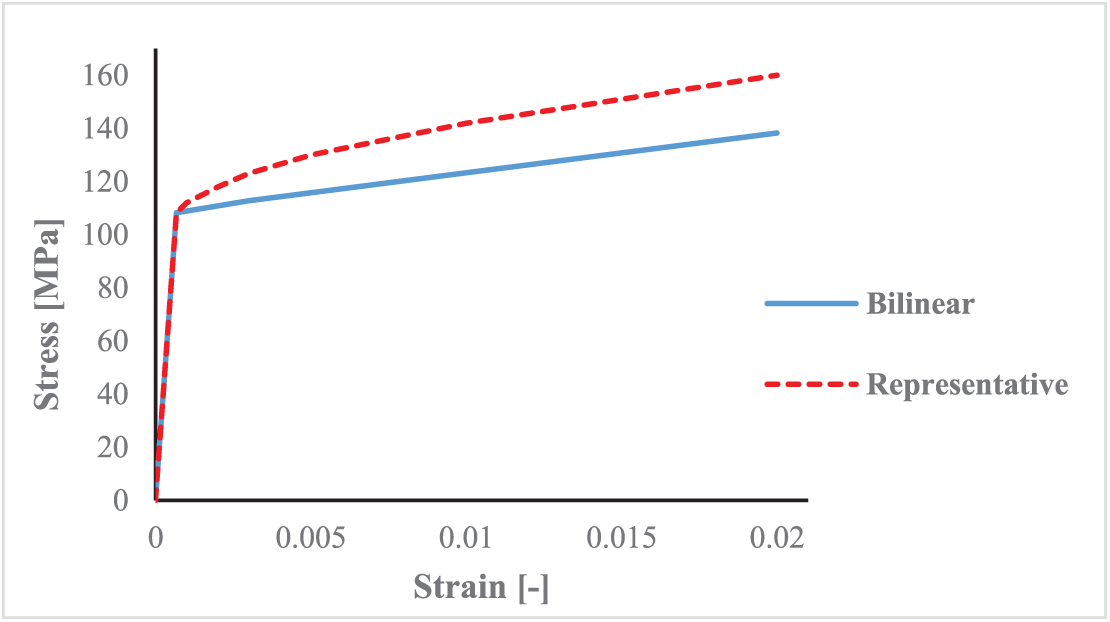
Figure 8: A bilinear material model compared to a representative model of actual plastic hardening
Plot compares the bilinear material model used in calculation with a typical representative high-temperature stress–strain curve for 321/321H stainless steel at ~420°C [28]. The representative model is used explicitly for clarification purposes. The bilinear model introduces the yield point while simplifying post-yield hardening. This approximation is acceptable for plastic Limit Pressure evaluation, since PLP depends on the local ligament yielding rather than the actual plastic hardening response. The simplified law also improves convergence compared to using the full hardening model. Only the region near the yield strength is shown on the plot, as this is the range in the material model relevant for PLP assessment.
In the simulations, the internal pressure was incrementally increased until the local yielding developed in the crack ligament. The Plastic Limit Pressure (PY,FEM) was defined as the pressure at which the von Mises equivalent stress near the crack tip reaches the temperature-dependent yield strength of the material (σy = 108 MPa at 420°C) [29]. For thin pressurized pipes, the multiaxial state of stress can be reduced to the dominant hoop σH, axial σX, and shear (τ) components, while radial stress is neglected [30]:
Plastic Limit Pressure phenomenon is shown in Fig. 9.
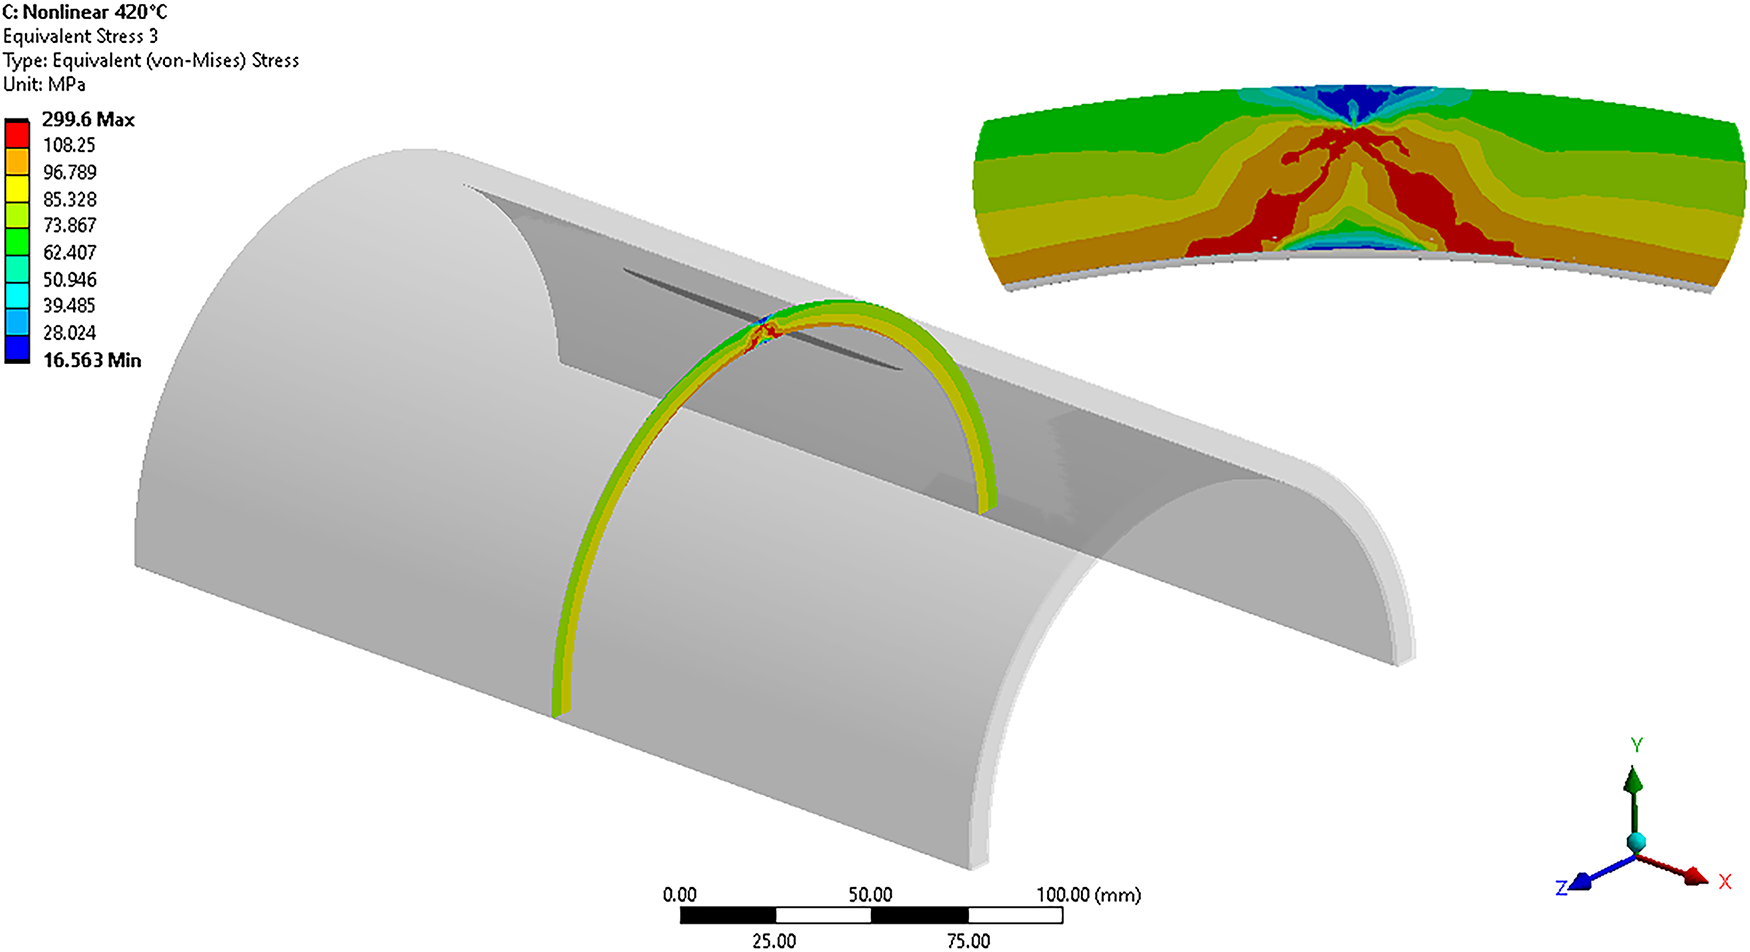
Figure 9: Material yielding due to plastic limit pressure
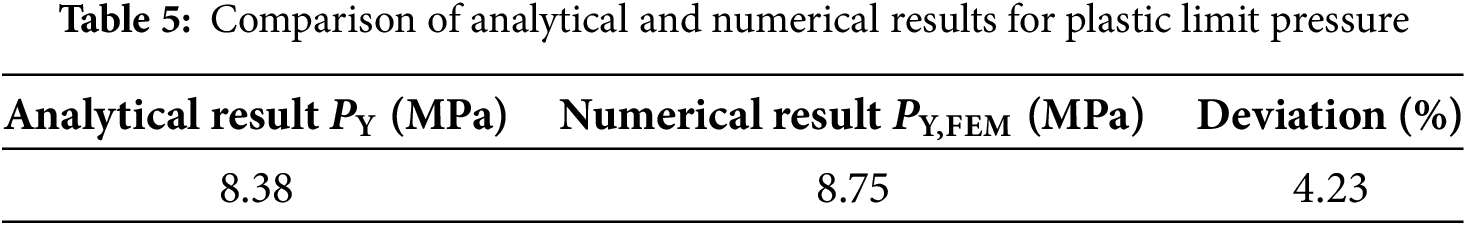
The comparison of results for the damaged pipe with a crack size of a = 2 mm is given in Table 5. It can be concluded that the analytical approach for PLP gives accurate results.
The observed piping system is assumed to undergo 22,000 operational cycles, corresponding to two daily charge and discharge conditions over its operational lifespan. While many forms of crack propagation laws exist, the analytical assessment as a scope of this paper is based on P.C. Paris’s law [3]:
where da represents incremental increase in crack length, dN represents incremental increase in the number of load cycles, ΔK is range of Stress Intensity Factor, C and m are material constants.
From [31] are taken conservative values for material constants, C = 5.6 × 10⁻¹² mm/cycle and m = 3.25. The Paris law constants can vary with temperature, these adopted values from the literature represent the upper-bound crack growth criterion for austenitic steels and are conservative at 420°C. The fracture of a cyclically loaded structural element will occur when the maximum Stress Intensity Factor reaches the critical value—fracture toughness, when the stress in the remaining cross-section weakened by the crack reaches the tensile strength of the material (Kmax = KC). The critical Stress Intensity Factor value was calculated based on the value of Charpy impact toughness [32,33]:
where KV represents the energy required for fracture, and B is the thickness of the pipe.
Although the loading during successive charging and discharging of the pipeline would be best represented by a trapezoidal diagram, a sinusoidal variation in loading can serve as an adequate approximation for the case of cyclic variable loading. Trapezoidal cycles would give similar ΔK results as long as the stress range is preserved. Stress range is calculated similarly for trapezoidal as for sinusoidal cyclic loading [34]:
A sinusoidal approach ensures a smooth transition between load phases, reduces numerical instabilities, and provides a computationally efficient alternative. Many fatigue models, including those based on Paris’ law, are provided under sinusoidal assumptions, making it a more compatible choice for crack propagation analysis. Under cyclic loading, the stresses change periodically with time, as illustrated in Fig. 10. Pulsating cyclic loading is present, as the plant is shut down and restarted twice a day (cycle characteristic R = 0). This approach provides a slightly conservative estimate of crack growth, ensuring safety in fatigue life assessment.
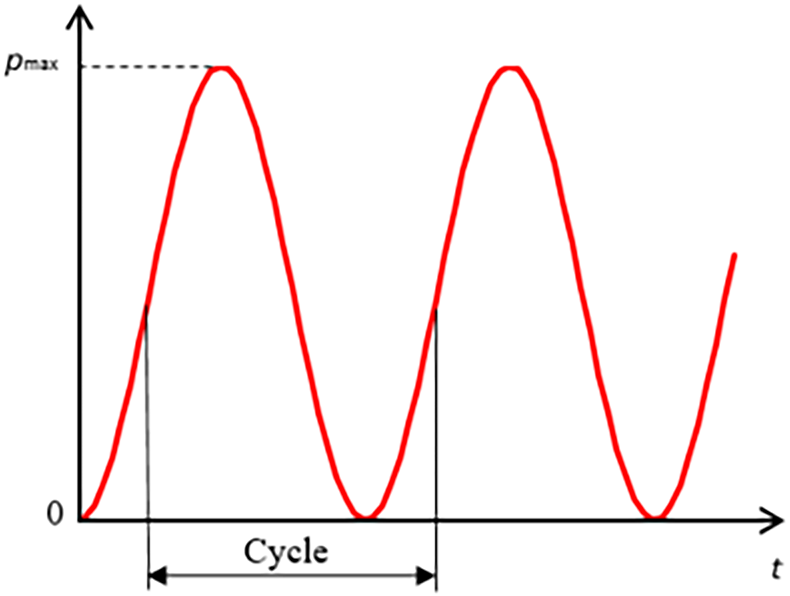
Figure 10: Cyclic loading
To determine the number of cycles until fracture, it is necessary to integrate Paris’ law (Eq. (15)). This area under the Paris’ law curve represents the total amount of crack growth that occurs within a specific range of crack depths. The analytical range of the Stress Intensity Factor (ΔK) was calculated using the modified magnification factor (M*) to assess its compatibility with Paris law and inspect if it aligns with numerical results. Analytically obtained number of cycles for several steps of crack growth are given in Table 6:
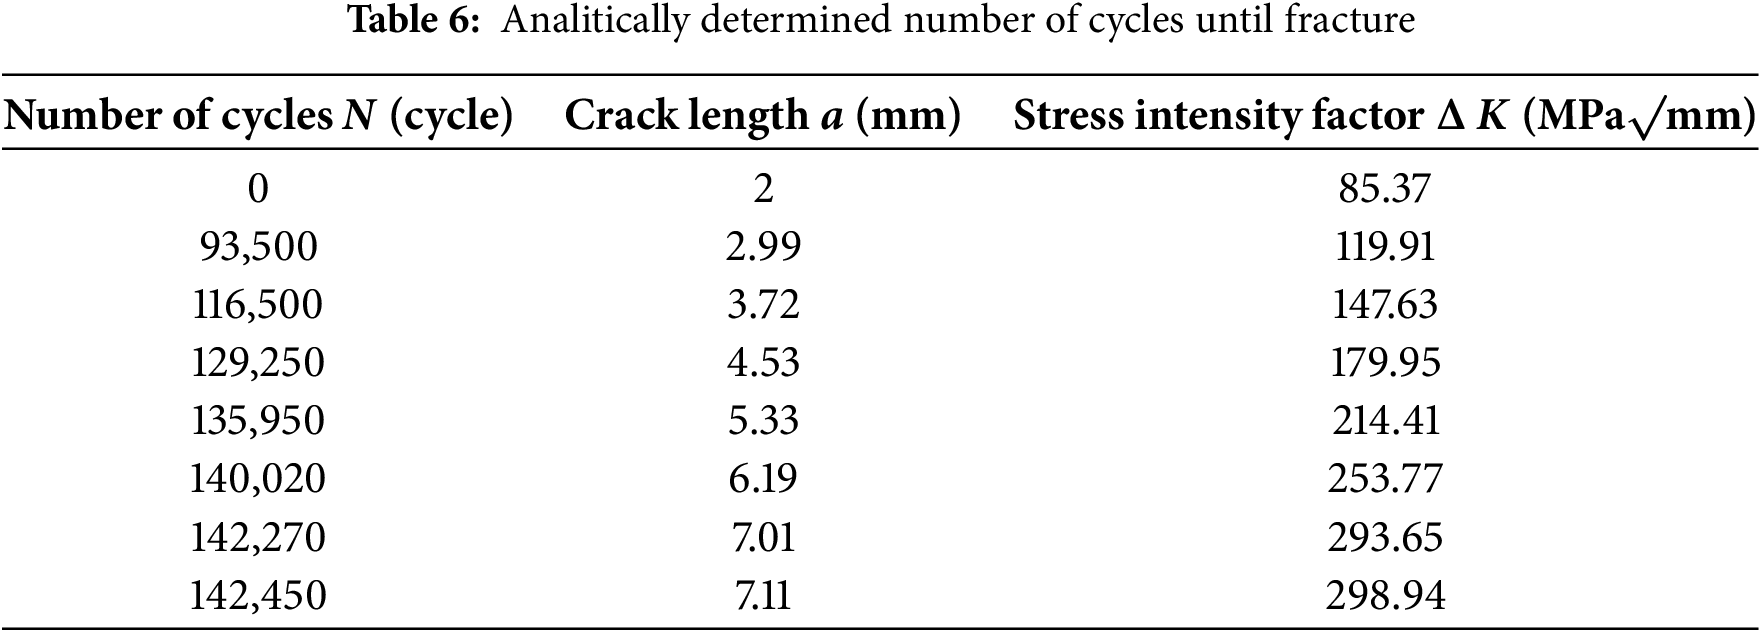
The table shows the values of crack growth in relation to the number of cyclic changes until complete fracture, while assuming the initial crack length a0 = 2 mm, which is the damage depth.
For a numerical service life assessment, Ansys S.M.A.R.T. crack growth has been used. A feature within ANSYS Mechanical that enables automatic prediction of crack propagation paths and velocities based on specific fracture criteria. It is a powerful tool used in fracture mechanics analysis to simulate crack behavior in structural components under various loading conditions. Separating Morphing Adaptive Re-Meshing Technology (S.M.A.R.T.). As the crack propagates, the mesh separates around it, and the surrounding zone is re-meshed [35]. Paris’ law has also been applied in numerical calculation, along with material constants applied in analytical calculation. Fig. 11 shows the shape of the crack front contour with the corresponding Stress Intensity Factor at the moment before fracture, when the propagation through the entire wall thickness of the pipe occurs.
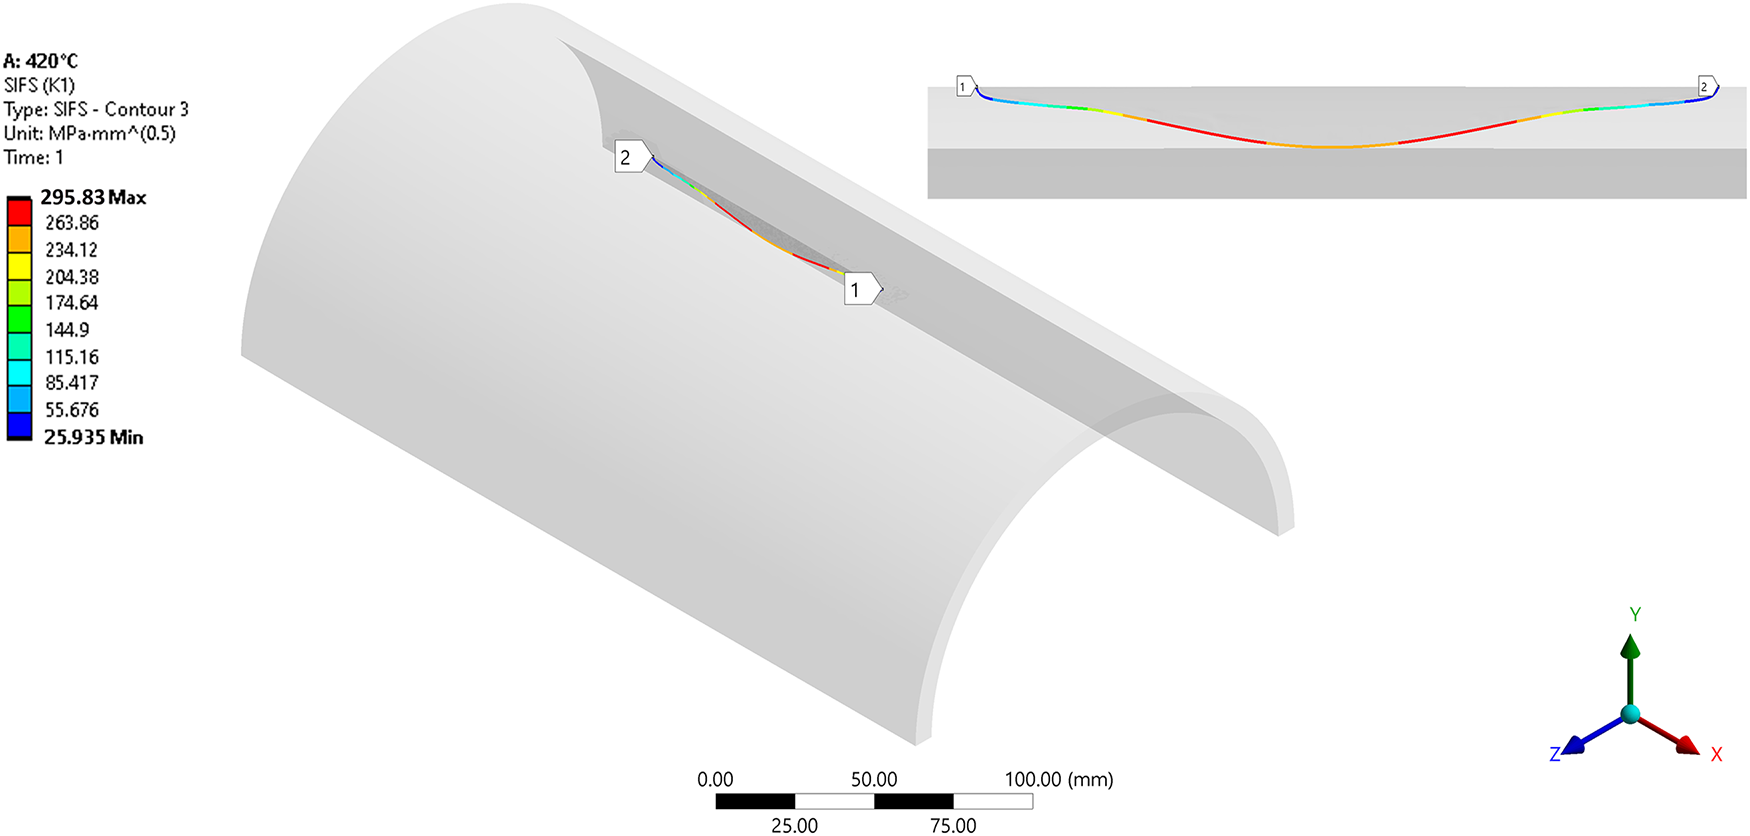
Figure 11: Crack front contour shape in moment before fracture
Numerically obtained number of cycles for several steps of crack growth is given in Table 7:
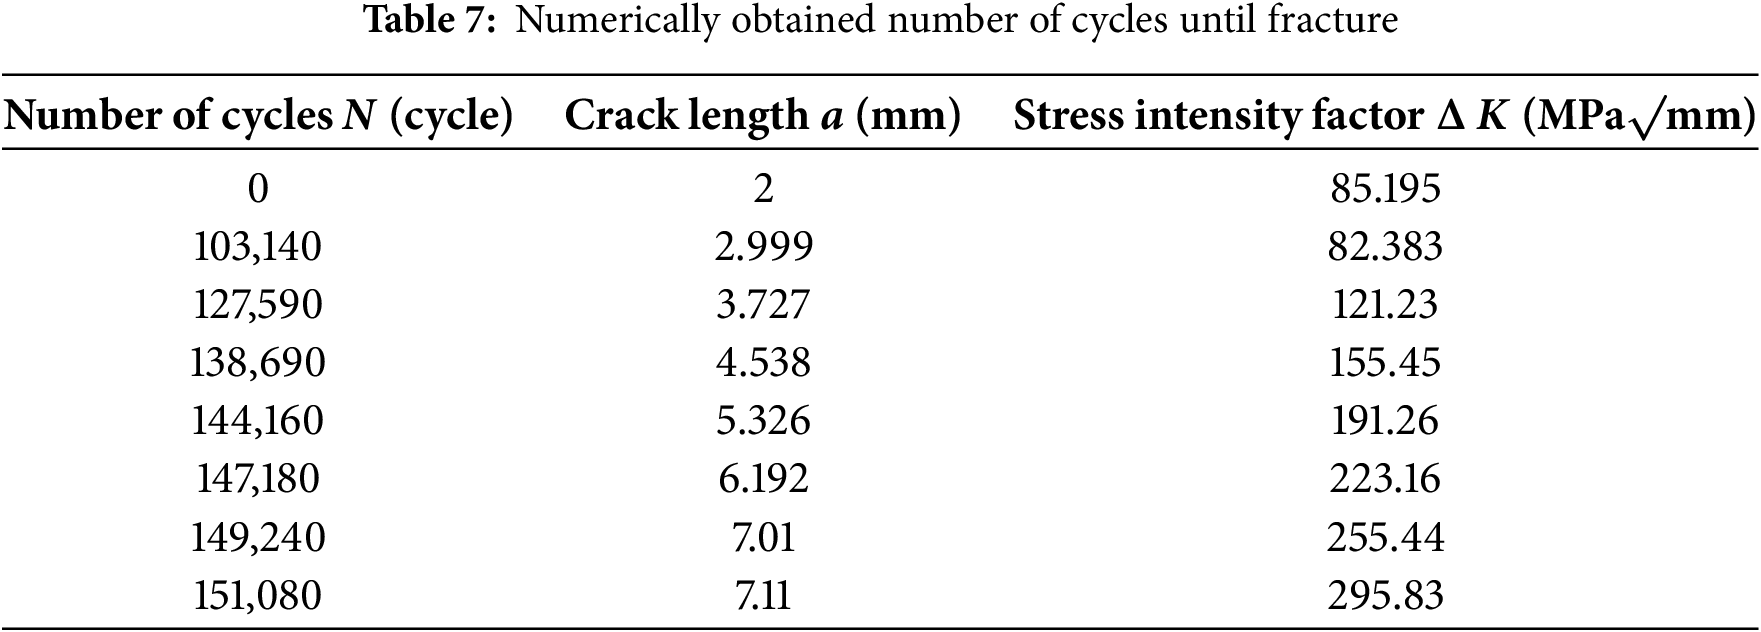
Further, the results comparison of the analytical and numerical approaches for service life assessment is given. The diagram in Fig. 12 shows a comparison of crack propagation under cyclic loading using analytical and numerical approaches.
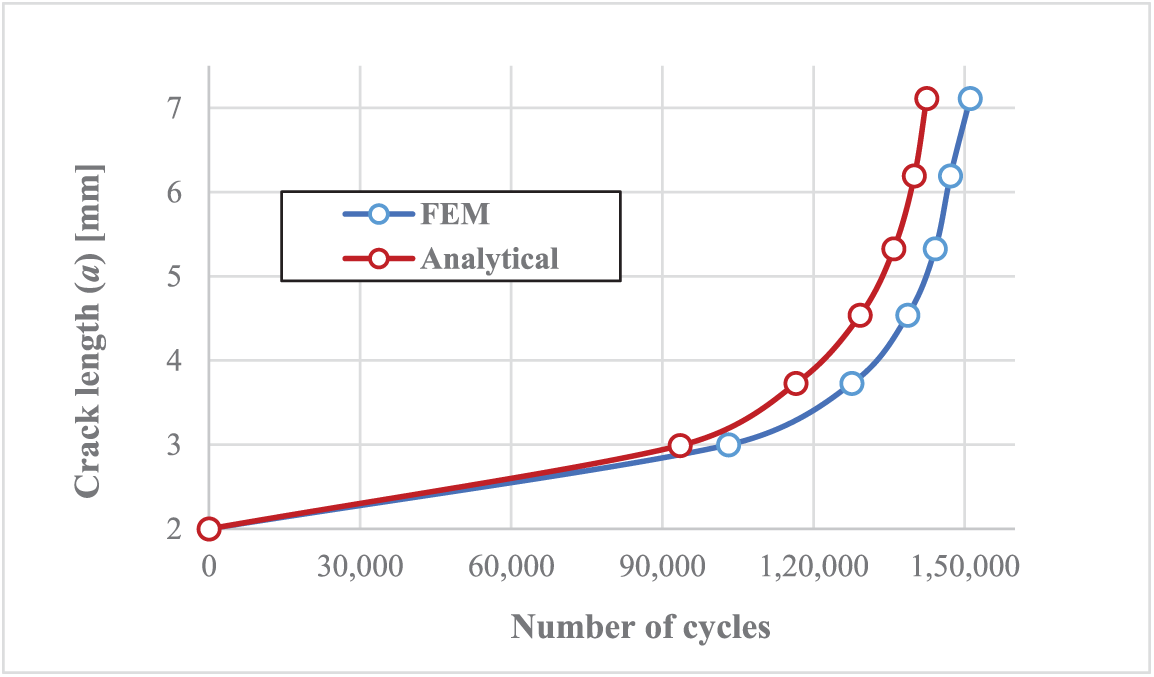
Figure 12: Crack propagation comparison
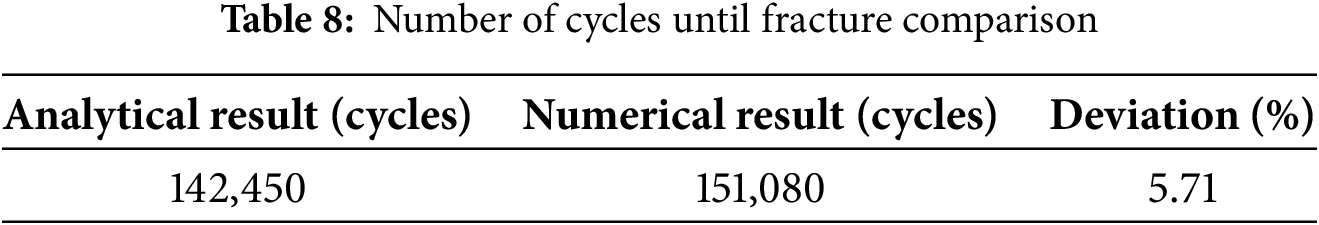
The number of cycles until fracture is compared in Table 8:
Comparison of the change in the Stress Intensity Factor due to crack propagation is shown in Fig. 13:
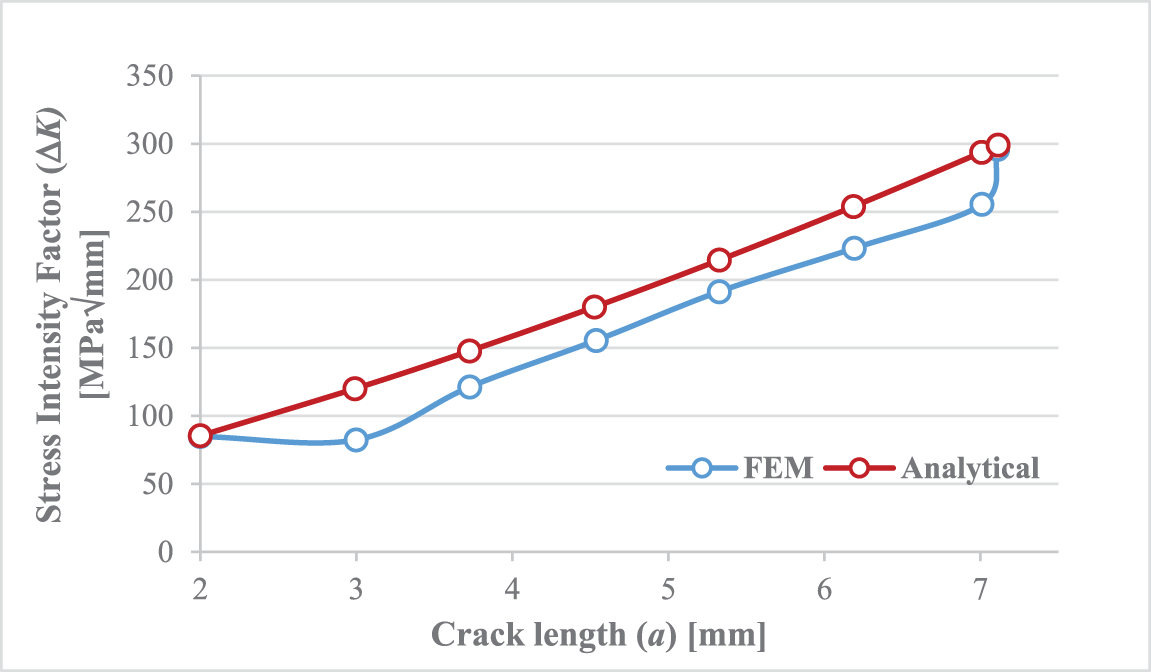
Figure 13: Comparison of the variation in the stress intensity factor due to propagation
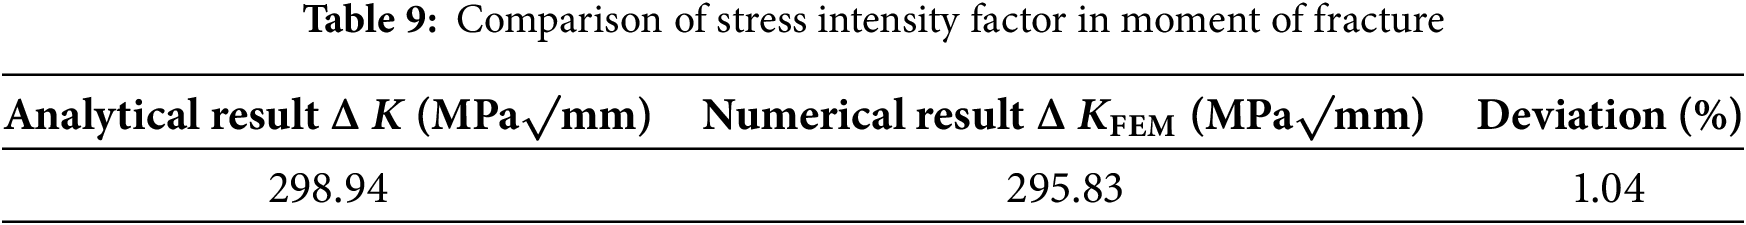
The plot demonstrates that across the entire growth history up to failure (a/t ≤ 1), the migrating maximum ΔKI from numerical (S.M.A.R.T.) crack growth followed the modified Newman prediction (M* = Me). The trend agreement is present beyond shallow crack sizes. Under pressure-dominant loading conditions in a cylindrical shell, the location of max ΔKFEM changes on the contour during the crack propagation to the regions where curvature effects are weak. Suppressing the curvature correction factor fs by using M* = Me avoids overestimating analytical ΔK and ensures that the correct trend is maintained, even for larger crack depths. Comparison of Stress Intensity Factor values at the final step of propagation before the crack extended through the entire cross-section is shown in Table 9:
From the comparison of analytical and numerical approaches for service life determination, it can be concluded that the results aligned well. A small deviation is present, indicating conservatism in the analytical approach. However, the deviation between results in both approaches remains within 5%. By applying the analytical approach, time-consuming numerical modeling can be avoided with less effort. In service life assessment, the range of the Stress Intensity Factor was calculated using the modified magnification factor (M*), which reduced the original Newman formulation and improved agreement with numerical results. It is important to note that this represents a limited study. The broader applicability of the modified magnification factor to other geometries, crack depths, and loading conditions still needs validation in future research.
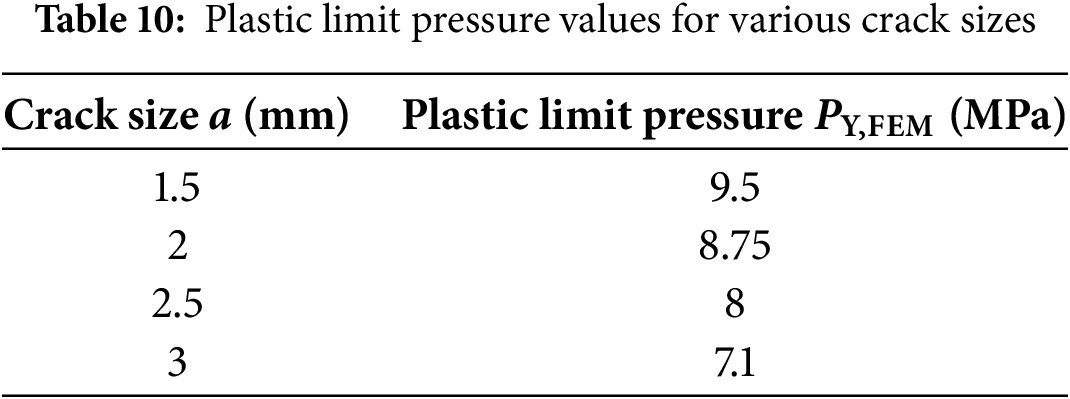
The FAD diagram (Failure Assessment Diagram) is a graphical representation of the results from fracture mechanics analysis, used to evaluate the fracture behavior of materials under different loading conditions. This diagram combines various parameters, such as the Stress Intensity Factor (K), the J-integral, the limit load (PY), or other fracture criteria, to assess the safety and reliability of structures or equipment. The FAD diagram will be constructed using the guidelines of the SINTAP/FITNET procedure. The selected approach applies fracture toughness and load as constant values, while the crack size gradually increases. The assessment point moves towards the FAD line and intersects it at the moment of failure. To determine assessment points for different crack sizes, the Stress Intensity Factor and Plastic Limit Pressure must be calculated for each crack size. Numerical calculations iteratively provided solutions for the limit pressure for crack sizes of 1.5, 2, 2.5, and 3 mm at the operating temperature (Fig. 14, Table 10).
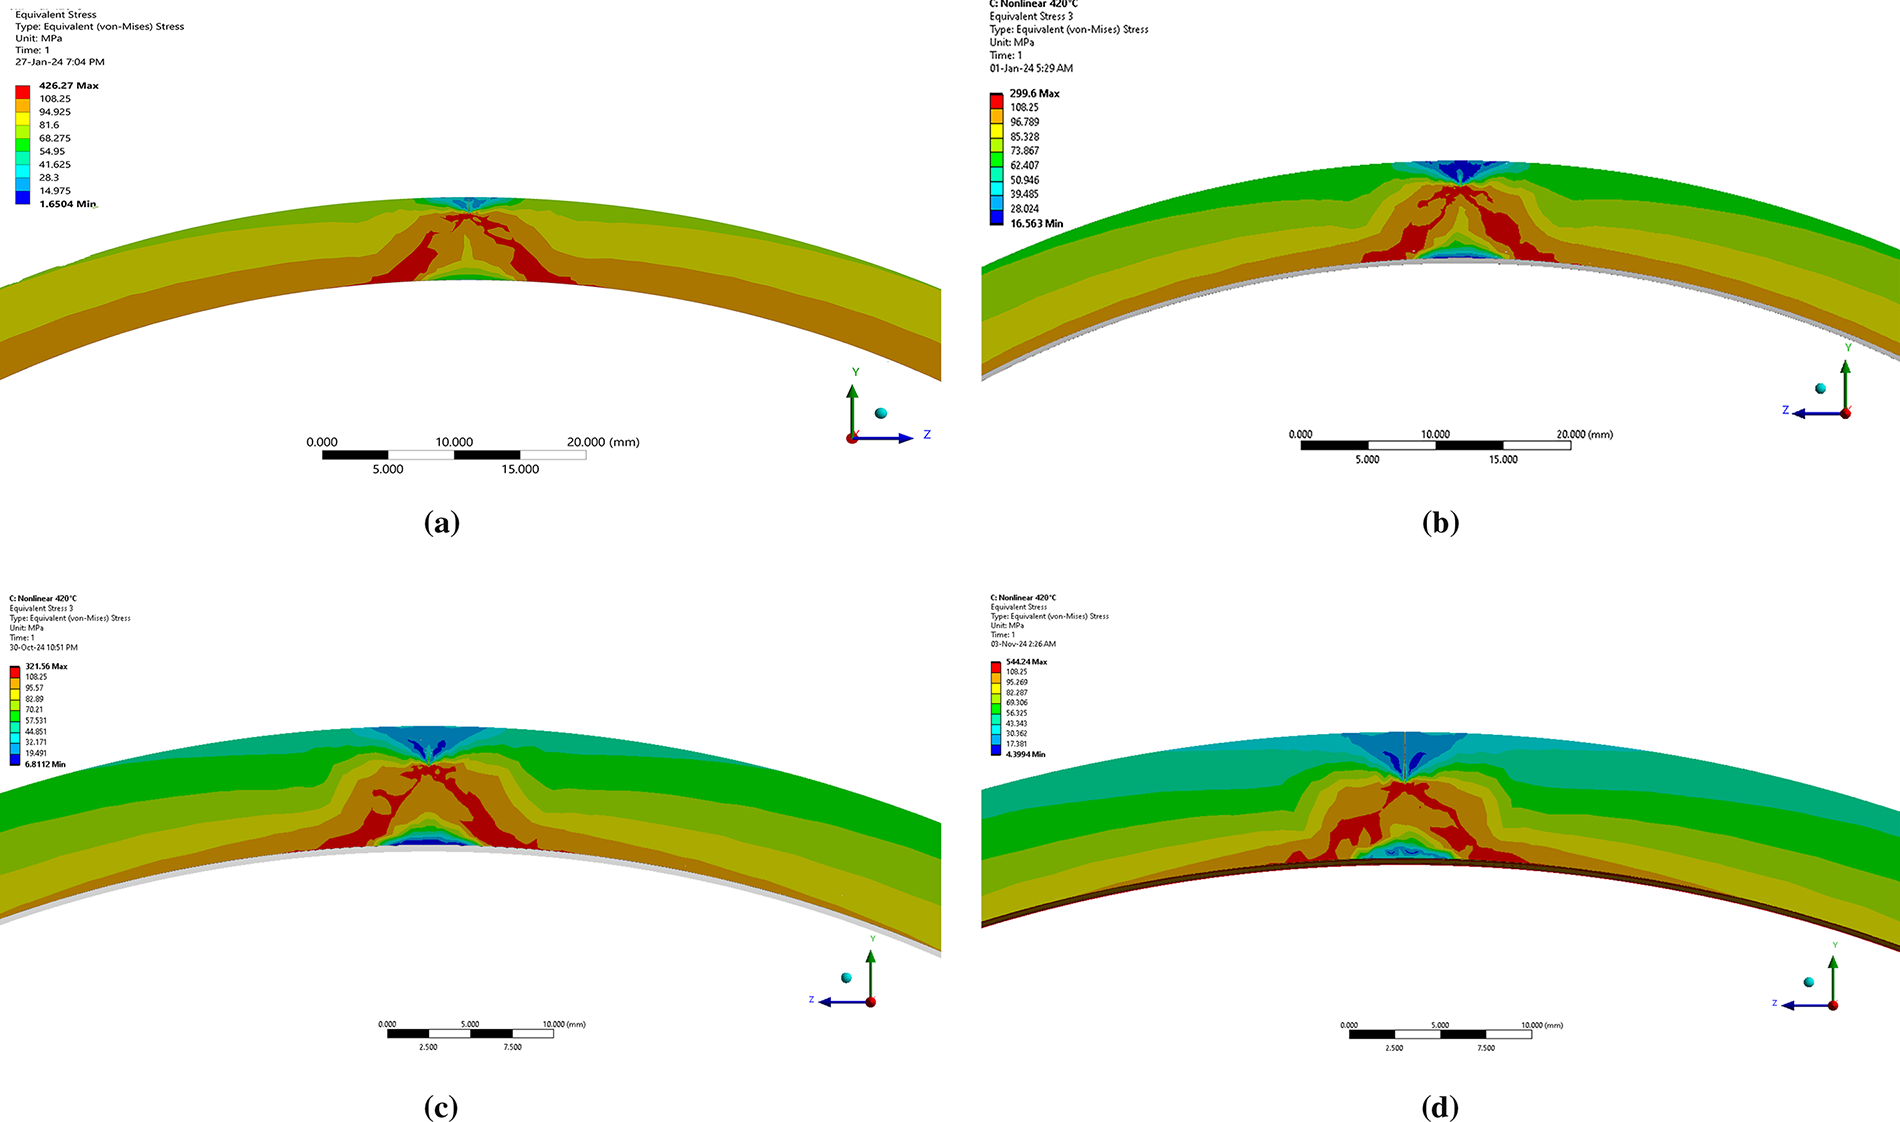
Figure 14: Material yielding due to limit pressure for various crack sizes: (a) a = 1.5 mm; (b) a = 2 mm; (c) a = 2.5 mm; (d) a = 3 mm
The FAD Option 1B is used for materials that do not exhibit a yield plateau, defined as σy = RP0.2. The diagram is constructed using the values of the elastic modulus, yield strength, and tensile strength at the operating temperature. The failure envelope function is given by [36]:
The integrity assessment will be conducted using both analytical (modified Newman) and numerical approaches. The FAD diagram, showing a comparison of analytical and numerical (FEM) assessment points for various crack sizes, is presented in Fig. 15.
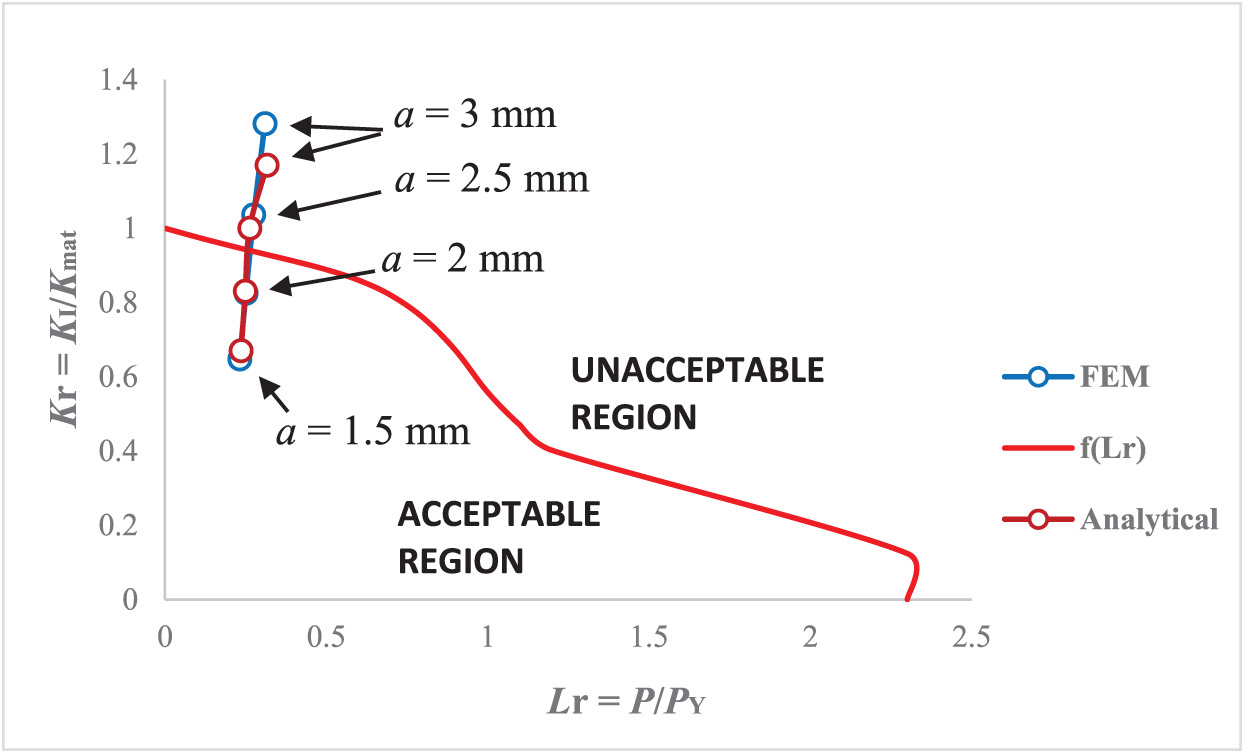
Figure 15: FAD diagram showing a comparison of FEM and analytical assessment points for various crack sizes
The Kr = KI/Kmat represents the ratio between Stress Intensity Factor and fracture toughness of the material, while Lr = P/PY is the ratio between working pressure and Plastic Limit Pressure [37].
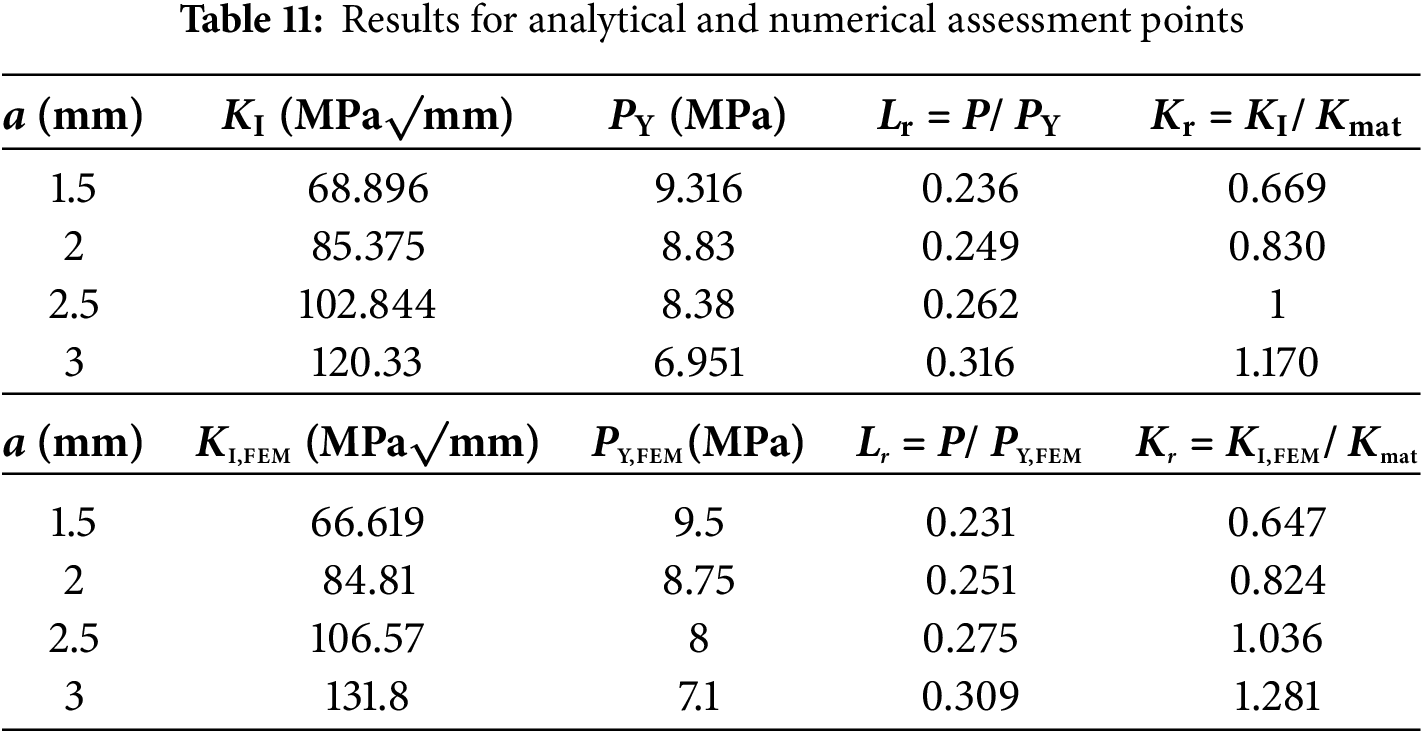
Results for each assessment point are given in Table 11. These values are critical for assessing the integrity of the pipeline and predicting the conditions under which failure might occur.
This study investigates the structural integrity of a transportation-damaged pipe containing a long axial surface crack. The crack depth of a = 2 mm (c/a = 25) was analyzed in detail, and additional calculations were performed for the same half-length (c = 50 mm) with varying depths (a/t = 0.1–0.25), which correspond to aspect ratios ranging from about 70 to 28. The results showed that the original Newman formulation with the shell curvature correction factor overestimated the Stress Intensity Factor by up to 30% for long and shallow cracks, while the modified magnification factor (M* = Me) matched the numerical results within 5%. Plastic Limit Pressure for several crack depths was obtained by using a bilinear material model. PLP results are closely aligned with available solutions. Service life predictions from analytical and FEM methods agreed within 5%, with the analytical method proving conservative by approximately 8500 cycles. The analytical method, despite its conservative nature, provides significant advantages in terms of efficiency and safety, making it suitable for initial evaluations, while numerical simulations can be reserved for situations where additional accuracy is required. The application of the modified magnification factor extends Newman’s formulation to very high aspect ratios, improving agreement with FEM while retaining analytical simplicity. However, the present validation was limited to cracks with a constant half-length (c = 50) and varying depths, corresponding to aspect ratios between 25 and 70. Therefore, the proposed modification should be considered as an initial validation and requires further testing for different crack lengths, geometries, and wall thicknesses to confirm its broader applicability. Future work should expand the applicability study of the modified magnification factor to a broader range of crack configurations, including different crack lengths, loading conditions, and geometries, to develop a broader correction approach for high aspect ratio cracks.
Acknowledgement: Not applicable.
Funding Statement: The authors received no specific funding for this study.
Author Contributions: The authors confirm contribution to the paper as follows: Conceptualization, Božo Damjanović and Pejo Konjatić; Investigation, Božo Damjanović; Methodology, Pejo Konjatić and Marko Katinić; Software, Pejo Konjatić; Supervision, Pejo Konjatić and Marko Katinić; Validation, Marko Katinić; Writing—original draft, Božo Damjanović. All authors reviewed the results and approved the final version of manuscript.
Availability of Data and Materials: The data that support the findings of this study are available from the Corresponding Author, Božo Damjanović, upon reasonable request.
Ethics Approval: Not applicable.
Conflicts of Interest: The authors declare no conflicts of interest to report regarding the present study.
Abbreviations
| ANSYS | Analysis System (FEA software) |
| ASTM | American Society for Testing and Materials |
| ASME | American Society of Mechanical Engineers |
| DN | Nominal Diameter (pipe size designation) |
| FAD | Failure Assessment Diagram |
| FEA | Finite Element Analysis |
| FEM | Finite Element Method |
| LBB | Leak Before Break |
| PLP | Plastic Limit Pressure |
| S.M.A.R.T. | Separating Morphing Adaptive Re-meshing Technology (ANSYS crack growth tool) |
| SIF | Stress Intensity Factor |
| SINTAP | Structural Integrity Assessment Procedure |
| Nomenclature | |
| a | Crack depth |
| c | Half length of crack |
| σ1 | Maximum principal stress |
| E | Young’s modulus |
| ρ | Material density |
| Rp0.2 | Yield strength |
| Rm | Ultimate strength |
| ν | Poisson’s ratio in elastic range |
| α | Coefficient of linear thermal expansion |
| KI | Mode I Stress intensity factor |
| σ | Hoop stress |
| ϕ | Crack shape factor |
| M | Magnification factor |
| M* | Modified magnification factor |
| fs | Shell curvature (free-surface) correction factor |
| M1 | Front-face correction factor |
| PL | Plastic limit pressure |
| Ro | Outside pipe radius |
| Ri | Inside pipe radius |
| σy | Yield strength of the material |
| σeq | Equivalent von Mises stress |
| t | Pipe wall thickness |
| KI,FEM | Numerically determined stress intensity factor |
| PY,FEM | Numerically determined plastic limit pressure |
| da | Incremental increase in crack length |
| dN | Incremental increase in the number of load cycles |
| ΔK | Range of stress intensity factor |
| C | Material constant |
| m | Material constant |
| Kmax | Maximum Stress Intensity Factor |
| KC | Critical stress intensity factor |
| KV | Energy required for fracture |
| B | Thickness of the specimen |
| R | Cycle characteristic |
| a0 | Initial crack length |
| ac | Final crack length |
| N | Number of cycles |
| Kr | Ratio between stress intensity factor and fracture toughness of the material |
| Lr | Ratio between internal pressure and plastic limit pressure |
References
1. Tadwalkar S, Lee Y, Fischer M. Challenges and future of prefabricated pipe spools. In: Proceedings of the 9th International Conference on Construction Engineering and Project Management; 2022 Jun 20–23; Las Vegas, NV, USA. [Google Scholar]
2. Vishnuvardhan S, Murthy AR, Choudhary A. A review on pipeline failures, defects in pipelines and their assessment and fatigue life prediction methods. Int J Press Vessel Pip. 2023;201:104853. doi:10.1016/j.ijpvp.2022.104853. [Google Scholar] [CrossRef]
3. Paris P, Erdogan F. A critical analysis of crack propagation laws. J Basic Eng. 1963;85(4):528–33. doi:10.1115/1.3656900. [Google Scholar] [CrossRef]
4. Arora P, Singh PK, Bhasin V, Vaze KK, Pukazhendhi DM, Gandhi P, et al. Fatigue crack growth behavior in pipes and elbows of carbon steel and stainless steel materials. Procedia Eng. 2013;55:703–9. doi:10.1016/j.proeng.2013.03.318. [Google Scholar] [CrossRef]
5. Sadananda K, Vasudevan AK. Fatigue crack growth mechanisms in steels. Int J Fatigue. 2003;25(9–11):899–914. doi:10.1016/S0142-1123(03)00128-2. [Google Scholar] [CrossRef]
6. Kalnaus S, Fan F, Jiang Y, Vasudevan AK. An experimental investigation of fatigue crack growth of stainless steel 304L. Int J Fatigue. 2009;31(5):840–9. doi:10.1016/j.ijfatigue.2008.11.004. [Google Scholar] [CrossRef]
7. Chapetti MD, Gubeljak N, Kozak D. Intrinsic fatigue limit and the minimum fatigue crack growth threshold. Materials. 2023;16(17):5874. doi:10.3390/ma16175874. [Google Scholar] [PubMed] [CrossRef]
8. Arora P, Singh PK, Bhasin V, Vaze KK, Pukazhendhi DM, Gandhi P, et al. Fatigue crack growth rate behavior in carbon steel elbows of Indian PHWRs. In: Proceedings of the International Conference on Structural Mechanics in Reactor Technology (SMiRT); 2011 Nov 6–11; New Delhi, India. [Google Scholar]
9. Arora P, Singh PK, Bhasin V, Vaze KK, Ghosh AK, Pukazhendhi DM, et al. Predictions for fatigue crack growth life of cracked pipes and pipe welds using RMS SIF approach and experimental validation. Int J Press Vessels Pip. 2011;88(10):384–94. doi:10.1016/j.ijpvp.2011.07.003. [Google Scholar] [CrossRef]
10. Bhargava RY, Bhasin V, Kushwaha HS. Assuring it is safe. In: Proceedings of the International Conference on Integrating Structural Integrity, Inspection, Monitoring, Safety and Risk Assessment; 1998 May 18–19; Edinburgh, UK. [Google Scholar]
11. De Finis R, Palumbo D, Di Carolo F, Ricotta M, Meneghetti G, Galietti U. Crack tip position evaluation and Paris’ law assessment of a propagating crack by means of temperature-based approaches. Procedia Struct Integr. 2022;39:528–45. doi:10.1016/j.prostr.2022.03.126. [Google Scholar] [CrossRef]
12. Brennan FP, Ngiam SS, Lee CW. An experimental and analytical study of fatigue crack shape control by cold working. Eng Fract Mech. 2008;75(3–4):355–63. doi:10.1016/j.engfracmech.2007.03.033. [Google Scholar] [CrossRef]
13. Singh PK, Vaze KK, Bhasin V, Kushwaha HS, Gandhi P, Ramachandra Murthy DS. Crack initiation and growth behaviour of circumferentially cracked pipes under cyclic and monotonic loading. Int J Press Vessels Pip. 2003;80(9):629–40. doi:10.1016/S0308-0161(03)00132-7. [Google Scholar] [CrossRef]
14. Engle RM. Aspect ratio variability in part-through crack life analysis. In: Chang JB, editors. ASTM special technical publication No. 687. Philadelphia, PA, USA: ASTM; 1979. [Google Scholar]
15. Wu SX. Shape change of surface crack during fatigue growth. Eng Fract Mech. 1985;22(5):897–913. doi:10.1016/0013-7944(85)90117-1. [Google Scholar] [CrossRef]
16. Cruse TA, Besuner PM. Residual life prediction for surface cracks in complex structural details. J Aircr. 1975;12(4):369–75. doi:10.2514/3.44458. [Google Scholar] [CrossRef]
17. Liu X, Wu Q, Su S, Wang Y. Evaluation and prediction of material fatigue characteristics under impact loads: review and prospects. Int J Struct Integr. 2022;13(2):251–77. doi:10.1108/ijsi-10-2021-0112. [Google Scholar] [CrossRef]
18. Choi Y, Lee SJ. Probabilistic fatigue crack growth prediction for pipelines with initial flaws. Buildings. 2024;14(6):1775. doi:10.3390/buildings14061775. [Google Scholar] [CrossRef]
19. Azuma K, Li Y. Closed-form stress intensity factor solutions for circumferential and axial surface cracks with large aspect ratios in pipes. J Press Vessel Technol. 2022;144(6):061303. doi:10.1115/1.4053890. [Google Scholar] [CrossRef]
20. Choi W, Han J. Health-monitoring methodology for high-temperature steam pipes of power plants using real-time displacement data. Appl Sci. 2021;11(5):2256. doi:10.3390/app11052256. [Google Scholar] [CrossRef]
21. Peng LC, Peng TL. Pipe stress engineering. New York, NY, USA: ASME Press; 2009. [Google Scholar]
22. European Project BE 95-1462. SINTAP: structural integrity assessment procedure. Brussels, Belgium: Brite Euram Programme; 1999. [Google Scholar]
23. ASME. ASME B31.1-2018: power piping. New York, NY, USA: The American Society of Mechanical Engineers; 2018. [Google Scholar]
24. Newman JCJr. Fracture analysis of surface and through cracks in cylindrical pressure vessels. In: The ASME International Joint Pressure Vessels, Piping, and Petroleum Engineering Conference; 1976 Sep 19–24; Mexico City, Mexico. [cited 2025 Jan 1]. Available from: https://ntrs.nasa.gov/api/citations/19760019492/downloads/19760019492.pdf. [Google Scholar]
25. Kannan P, Amirthagadeswaran KS, Christopher T, Nageswara Rao B. A simplified approach for assessing the leak-before-break for the flawed pressure vessels. Nucl Eng Des. 2016;302:20–6. doi:10.1016/j.nucengdes.2016.02.013. [Google Scholar] [CrossRef]
26. Staat M, Vu DK. Limit analysis of flaws in pressurized pipes and cylindrical vessels. Part I: axial defects. Eng Fract Mech. 2007;74(3):431–50. doi:10.1016/j.engfracmech.2006.04.031. [Google Scholar] [CrossRef]
27. ANSYS. Ansys workbench [Internet]. Canonsburg, PA, USA: ANSYS, Inc.; 2024 [cited 2024 Nov 10]. Available from: https://www.ansys.com/products/ansys-workbench. [Google Scholar]
28. Huang Z, Zhang J, Ma Z, Yuan S, Yang H. Research progress on the relationship between microstructure and properties of AISI 321 stainless steel. Appl Sci. 2024;14(22):10196. doi:10.3390/app142210196. [Google Scholar] [CrossRef]
29. Damjanović B, Konjatić P, Katinić M. Plastic limit pressure and stress intensity factor for cracked elbow containing axial semi-elliptical part-through crack. Appl Sci. 2024;14(18):8390. doi:10.3390/app14188390. [Google Scholar] [CrossRef]
30. ASME. ASME boiler and pressure vessel code, Section VIII, Division 2, 2025 edition. New York, NY, USA: American Society of Mechanical Engineers; 2025. [Google Scholar]
31. Barsom JM, Rolfe ST. Fracture and fatigue control in structures: applications of fracture mechanics. 2nd ed. Englewood Cliffs, NJ, USA: Prentice Hall; 1987. [Google Scholar]
32. Matsushita M. A new method of estimating fracture toughness from charpy impact test data. ASTM Int. 1975;579:141–50. [Google Scholar]
33. Euro Inox. Stainless steel: tables of technical properties. 2nd ed. Brussels, Belgium: Euro Inox; 2007. [Google Scholar]
34. Anderson TL. Fracture mechanics: fundamentals and applications. 4th ed. Boca Raton, FL, USA: CRC Press; 2017. [Google Scholar]
35. ANSYS. ANSYS user’s manual. Release 2022. Canonsburg, PA, USA: ANSYS, Inc.; 2022 [cited 2024 Nov 10]. Available from: https://www.ansys.com. [Google Scholar]
36. Zerbst U. Fitness-for-service fracture assessment of structures containing cracks: a workbook based on the european SINTAP/FITNET procedure. Oxford, UK: Elsevier; 2007. [Google Scholar]
37. Opačić MF, Sedmak A, Bakić G, Milošević N, Milovanović N. Risk assessment of pressure vessels by using fracture mechanics and advanced ultrasonic testing. Teh Vjesn. 2024;31(1):118–24. [Google Scholar]
Cite This Article
 Copyright © 2025 The Author(s). Published by Tech Science Press.
This work is licensed under a Creative Commons Attribution 4.0 International License , which permits unrestricted use, distribution, and reproduction in any medium, provided the original work is properly cited.
 Downloads
 Citation Tools