
 Submit a Paper
 Propose a Special lssue
 Open Access
ARTICLE
PPG Based Digital Biomarker for Diabetes Detection with Multiset Spatiotemporal Feature Fusion and XAI
1 Shenzhen Institutes of Advanced Technology, Chinese Academy of Sciences, Shenzhen, 518055, China
2 University of Chinese Academy of Sciences, Beijing, 101408, China
* Corresponding Author: Zedong Nie. Email:
(This article belongs to the Special Issue: Exploring the Impact of Artificial Intelligence on Healthcare: Insights into Data Management, Integration, and Ethical Considerations)
Computer Modeling in Engineering & Sciences 2025, 145(3), 4153-4177. https://doi.org/10.32604/cmes.2025.073048
Received 09 September 2025; Accepted 29 October 2025; Issue published 23 December 2025
 View Full Text
 Download PDF
Abstract
Diabetes imposes a substantial burden on global healthcare systems. Worldwide, nearly half of individuals with diabetes remain undiagnosed, while conventional diagnostic techniques are often invasive, painful, and expensive. In this study, we propose a noninvasive approach for diabetes detection using photoplethysmography (PPG), which is widely integrated into modern wearable devices. First, we derived velocity plethysmography (VPG) and acceleration plethysmography (APG) signals from PPG to construct multi-channel waveform representations. Second, we introduced a novel multiset spatiotemporal feature fusion framework that integrates hand-crafted temporal, statistical, and nonlinear features with recursive feature elimination and deep feature extraction using a one-dimensional statistical convolutional neural network (1DSCNN). Finally, we developed an interpretable diabetes detection method based on XGBoost, with explainable artificial intelligence (XAI) techniques. Specifically, SHapley Additive exPlanations (SHAP) and Local Interpretable Model-agnostic Explanations (LIME) were employed to identify and interpret potential digital biomarkers associated with diabetes. To validate the proposed method, we extended the publicly available Guilin People’s Hospital dataset by incorporating in-house clinical data from ten subjects, thereby enhancing data diversity. A subject-independent cross-validation strategy was applied to ensure that the testing subjects remained independent of the training data for robust generalization. Compared with existing state-of-the-art methods, our approach achieved superior performance, with an area under the curve (AUC) ofKeywords
Diabetes has impacted approximately 588.7 million adults globally by 2024, and is projected to reach about 852.5 million adults by the year 2050 [1]. This figure represents nearly one in every eight individuals worldwide. Approximately 81% of adults with diabetes live in low- and middle-income countries with limited access to healthcare resources. In terms of mortality, diabetes caused an estimated 3.4 million deaths in 2024, which leads to one death every six seconds. An estimated 252 million people remain undiagnosed, representing a large proportion of the global diabetic population and raising major public health concerns. Among these undiagnosed individuals, nearly 90% are from low- and middle-income regions, highlighting significant disparities in screening and diagnosis. Diabetes arises from impaired pancreatic function, leading to insufficient production or ineffective regulation of insulin—an essential hormone that maintains blood glucose (BG) homeostasis in the body. Diabetes can be categorized into type 1 diabetes mellitus (T1DM), type 2 diabetes mellitus (T2DM), and gestational diabetes mellitus (GDM). T1DM affects 5%–10% of the total diabetic population, while T2DM accounts for approximately 90% of all cases, making it the most prevalent form of diabetes [2]. T1DM involves an autoimmune destruction of insulin-producing cells, leading to symptoms such as weight loss, thirst, frequent urination, and often develops in childhood [3]. T2DM results from insulin resistance, a condition strongly associated with sedentary behavior, poor diet, and obesity. It is typically characterized by increased hunger, thirst, and fatigue [4]. GDM occurs during pregnancy, affecting 2%–10% of pregnancies, with risk factors including family history and obesity, though it often presents with mild or no symptoms [5]. The economic implications are equally alarming, with global healthcare expenditures related to diabetes reaching approximately 1.015 trillion USD in 2024, a 338% increase compared to costs recorded seventeen years ago. This surge places a substantial financial strain on healthcare systems worldwide. As an incurable disease, timely diagnosis and management of diabetes are crucial to prevent long-term diabetic complications [6].
Currently, diabetes detection is primarily performed in hospital settings using the finger-prick method [7]. In addition to its invasive nature, this method requires clinical visits and is time-consuming, making it impractical for individuals in underserved or remote regions. Therefore, the development of a noninvasive, affordable, and accessible method for diabetes detection is both urgent and essential. A digital biomarker is a measurable indicator of a physiological or pathological process that can be collected and analyzed using digital devices such as wearables, smartphones, or other sensor-based technologies [8]. Photoplethysmography (PPG) is an optical technique that enables the noninvasive measurement of blood volume changes, facilitating the acquisition of relevant digital biomarkers [9]. A typical PPG sensor consists of a light-emitting diode (LED) and a photodiode (PD), where the LED emits light onto the skin, commonly at the wrist or finger, and the PD detects the reflected or transmitted light. Traditionally, PPG has been used in clinical settings to measure blood oxygen saturation and heart rate [10]. Although early PPG systems required specialized hardware, recent advances have enabled PPG integration into wearable devices such as smartwatches and fitness trackers. PPG has attracted increasing attention in various healthcare applications, including cardiovascular disease assessment, sleep monitoring, psychiatric evaluation, and BG monitoring [11–14]. Fluctuations in BG levels influence blood viscosity, which in turn affects blood flow velocity within microvascular [15]. These hemodynamic variations are reflected in the PPG waveform [16], enabling the advanced analysis of PPG signals can reveal the underlying relationship between blood flow dynamics and diabetes. The widespread adoption of PPG-based wearable devices presents a promising opportunity to develop noninvasive, cost-effective, and scalable solutions for large-scale diabetes detection and risk stratification.
Several efforts have been made in recent years toward PPG-based diabetes detection, achieving varying degrees of success. However, existing studies continue to face challenges related to PPG waveform representation, model interpretability, and dataset diversity. Xiao et al. [17] proposed a machine learning (ML) approach for the simultaneous prediction of diabetes and diabetic neuropathy based on the energy profile of PPG signals. They collected the toe PPG data and computed a large set of frequency-energy pairs, complemented by demographic information, blood pressure (BP), pulse pressure, glycated hemoglobin (HbA1c), and lipoprotein levels. They evaluated various classifiers, and the artificial neural network (ANN) achieved the highest prediction accuracy of 93.07%. Despite its promising results, they did not address the sensitivity of PPG signals to noise and motion artifacts caused by micro-movements, nor did implement domain-specific filtering or signal quality assessment. Moreno et al. [16] developed a diabetes detection system using a pulse oximeter PPG with random forest (RF) and gradient boosting algorithms. They conducted cepstral analysis to highlight high-frequency and low-frequency components of PPG for heart rate variability characterization. By integrating surrogate and statistical features from cepstral analysis with demographic data, they achieved a 69.4% mean receiver operating characteristic (ROC) area in prediction. Another, lightweight convolutional neural network (CNN) was proposed for T2DM prediction using raw PPG signals and demographic parameters such as age and gender [18]. This approach obtained 75.5%, 76%, and 75% of area under the curve (AUC), specificity, and sensitivity, respectively. The demographic profile data was used in [16–18] along with features for predictive modeling, which imposes additional complexity on automated systems. Keikhosravi et al. [19] investigated the relationship between flow-mediated dilation (FMD) and PPG for diabetes detection by modifying the differential vascular model. FMD assessment indicates abnormal endothelial function correlated with cardiovascular diseases and helps to discriminate diabetic subjects. Singular value decomposition was used for feature reduction, and the naive Bayes algorithm achieved an overall accuracy of 93.5% in diabetes detection. Nirala et al. [20] conducted PPG waveform analysis for diabetes diagnosis, extracting 37 features from PPG, velocity plethysmography (VPG), and acceleration plethysmography (APG), including principal components. They developed a hybrid feature selection technique based on a voting scheme. Subsequently, a support vector machine (SVM) achieved an accuracy of 97.87%. Mishra et al. [21] employed tunable-Q wavelet transform (TQWT) analysis on PPG signals for diabetes prediction. The signals were decomposed into wavelet sub-bands, and entropy features were extracted to differentiate diabetic from healthy individuals. They developed a majority voting-based feature selection method with a least-square SVM, which achieved 98.51% accuracy in prediction. Gupta et al. [22] explored systemic vascular resistance pathology to distinguish diabetic subjects from healthy ones using PPG. They proposed a dynamic systemic vascular resistance index (dSVRI) derived from waveform-related features, mean arterial pressure (MAP), and heart rate (HR). The dSVRI model using random forest achieved an accuracy of 98.53% in diabetes detection. References [19–22] relied on a limited number of hand-crafted features, which are insufficient to capture the full spectrum of the waveform. Given the inherently non-stationary and nonlinear nature of PPG signals, depending solely on manual feature engineering poses significant challenges for robust predictive modeling. Avram et al. [23] introduced a deep neural network (DNN) for diabetes detection using smartphone-based PPG signals. They collected a large dataset from multiple cohorts to assess the model. The DNN consisted of 39 layers arranged in a block structure, where each convolutional layer was followed by batch normalization, a rectified linear unit (ReLU) activation, and probabilistic dropout. Using 21.3-s segments of 120 Hz PPG signals combined with demographic data, the model achieved an AUC of 83% for diabetes prediction. Deep learning models, however, are inherently black-box in nature and unable to provide meaningful decision-making insights to clinicians [18,23]. Explainable artificial intelligence (XAI) is increasingly important in healthcare, where interpretability and transparency in decision-making are essential [24]. Shaheen et al. [25] proposed a trustworthy and privacy-aware framework for early diabetes prediction, integrating a Deep Residual Network (DRNet) with Proximity-Weighted Synthetic (ProWSyn) oversampling to mitigate class imbalance. They further applied Local Interpretable Model-agnostic Explanations (LIME) and SHapley Additive exPlanations (SHAP) for interpretability, identifying the most influential clinical features contributing to diabetes detection. However, the study primarily relied on demographic and clinical data rather than physiological signals, limiting its applicability for wearable or continuous health monitoring scenarios. Singh et al. [26] developed DiaXplain, a deep learning-based explainable framework for diabetes diagnosis that integrates a CNN for automated feature extraction with an XGBoost classifier for final prediction. They employed SHAP to provide both local and global interpretability, allowing clinicians to visualize the contribution of each clinical attribute toward the diagnostic decision. However, this model primarily relies on static clinical features rather than continuous physiological signals. It does not employ continuous or wearable signal modalities, such as PPG, which are increasingly vital for developing real-time, noninvasive digital biomarkers and patient-centric monitoring systems. Despite promising progress, XAI remains largely unexplored in the context of PPG-based diabetes detection [16,17,19–22]. Over the past decade, PPG-based approaches have demonstrated competitive performance in identifying diabetic conditions. However, several limitations persist in the existing studies, including insufficient interpretability, limited dataset diversity, and inadequate feature representation. The inherent complexity of diabetes detection necessitates advanced feature engineering techniques coupled with XAI to uncover digital biomarkers capable of effectively distinguishing between healthy and diabetic patterns.
To address the above-highlighted issues, this study proposed a novel diabetes detection method using PPG signals. The main contributions and novelties of this work are described as follows:
i. We introduced the Savitzky-Golay Signal Skewness Index (
ii. We designed a multiset spatiotemporal feature fusion (MSFF) based on hand-crafted features (HCF) and deep features (DF). HCF includes temporal, statistical, and nonlinear features from multi-channel PPG, VPG, and APG with RFE-based feature selection. Further, we developed a one-dimensional statistical convolutional neural network (1DSCNN) for DF extraction and their statistical interpretation.
iii. We proposed an explainable approach of digital biomarker investigation for diabetes detection using XAI and XGBoost. We assessed the proposed approach on hybrid (clinical+public) data using unseen subject-wise cross-validation. We assessed the proposed approach on hybrid (clinical+public) data using unseen subject-wise cross-validation.
The rest of the paper is organized as follows: Section 2 presents the proposed methodology, describing the overall framework of the approach. Section 3 explains the experimental setup and data acquisition process, while Section 4 presents the results. The discussion and conclusion of the study are reported in Sections 5 and 6, respectively.
This section presents the proposed methodology in detail. The overall algorithmic framework outlines the architecture and key components of the proposed approach. The data processing subsection describes the segmentation, filtering, and signal quality assurance steps applied to the raw PPG signals. The multiset spatiotemporal feature fusion subsection details the extraction, selection, and fusion of multiple sets of handcrafted and deep features. Subsequently, the explainable boosting approach subsection elaborates on the proposed model and its interpretability using explainable artificial intelligence techniques. Finally, the evaluation criteria subsection provides an overview of the performance metrics employed to assess the effectiveness of the proposed approach.
We developed a multiset spatiotemporal feature fusion and explainable boosting approach using the idea of multiset [27], multiview spatiotemporal feature fusion [13,28], and XAI [29,30]. The code of our approach is available at (https://github.com/drmubashirali/msff-ewma, accessed on 28 September 2025). The framework diagram of the proposed approach is shown in Fig. 1 and described as follows.
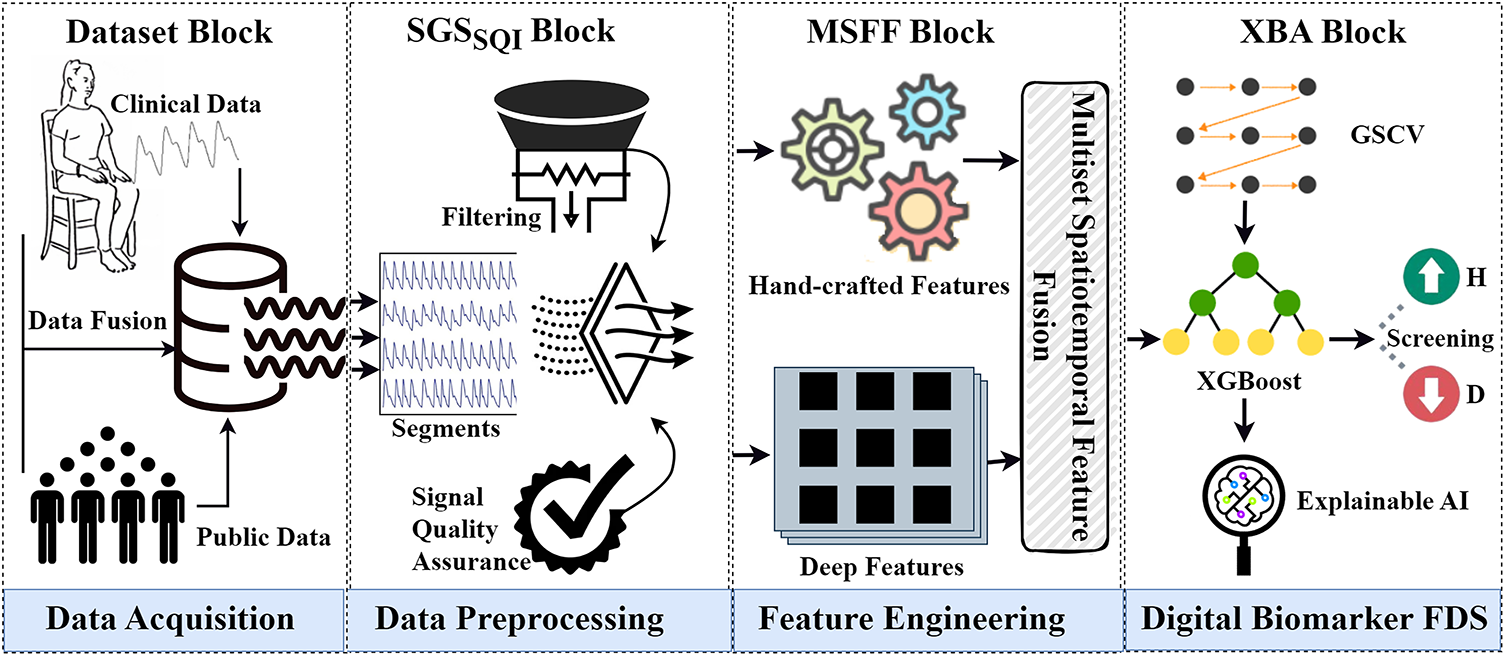
Figure 1: The framework of the proposed approach. The first block shows the data acquisition process through data fusion. The second block illustrates data preprocessing with the
i Dataset Block
The dataset block shows the data acquisition process. We used data from two sources. First, we acquired a public dataset collected by Guilin People’s Hospital, Guilin, China. Second, we collected in-house data from ten subjects at the Shenzhen Institute of Advanced Technology (SIAT), Chinese Academy of Sciences (CAS), Shenzhen, China. Subsequently, we performed early data fusion by merging data from both sources to create the final dataset.
ii Savitzky-Golay Signal Skewness Index (
PPG signals are easily influenced by breathing and micro-movements, resulting in noise and artifacts. To handle this issue, we introduced the
iii Multiset Spatiotemporal Feature Fusion (MSFF) Block
We designed a multiset spatiotemporal feature extraction, selection, and fusion block to extract multiple sets of HCF and DF from preprocessed signals. First, we extracted temporal, statistical, and nonlinear HCF from the PPG, its first derivative (VPG), and second derivative (APG). Second, we employed the recursive feature elimination method to select the top ten features from HCF. Third, we extracted a large number of DF from PPG using 1DSCNN and employed statistical interpretation. Lastly, we performed MSFF on HCF and DF to construct the final feature set.
iv Explainable Boosting Approach (XBA) Block
Finally, we proposed an explainable boosting approach of digital biomarker investigation based on XGBoost and XAI for diabetes detection. We used grid search cross-validation (GSCV) to find the best parameters for XGBoost to enhance the performance.
2.2 Data Preprocessing
Initially, segmentation was performed to align the data from both the public and in-house datasets. In the public dataset, each subject provided three pre-segmented PPG signals of 2.1 s, recorded at a sampling rate of 1000 Hz. In contrast, the in-house dataset consisted of continuous PPG recordings acquired at the same sampling rate. To ensure consistency between the two datasets, the first 20 s of each in-house recording were discarded to allow the subject’s hand to stabilize on the sensor. Subsequently, three consecutive 2.1-s segments were extracted for analysis. PPG signals are highly susceptible to environmental interference, which introduces noise and motion artifacts that can distort the original waveform and compromise reliability in predictive modeling. Therefore, ensuring signal quality is crucial for deriving meaningful physiological information. To address these challenges, we applied the Savitzky–Golay filtering technique to the raw segments. This method is widely recognized for its ability to smooth the signal while preserving essential morphological features such as peaks, widths, and valleys, an aspect vital for accurate peak detection in PPG analysis. In addition to filtering, assessing signal quality was a key step. We evaluated the quality of each 2.1-s segment using the Signal Skewness Quality Index (SSQI), which was identified after extensive comparative analysis involving kurtosis, perfusion index, skewness, non-stationarity, relative power, entropy, and zero-crossing metrics. The SSQI facilitates the identification of the most reliable segment among the three, effectively discarding low-quality signals unsuitable for further processing. A systematic preprocessing pipeline was therefore established to ensure robust and high-quality signal selection. Suppose the raw PPG dataset can be expressed as follows:
where
where
where
where
Fig. 2 presents a visual comparison between preprocessed PPG signals from diabetic and healthy subjects, alongside demonstrations of both raw and preprocessed PPG signals by the
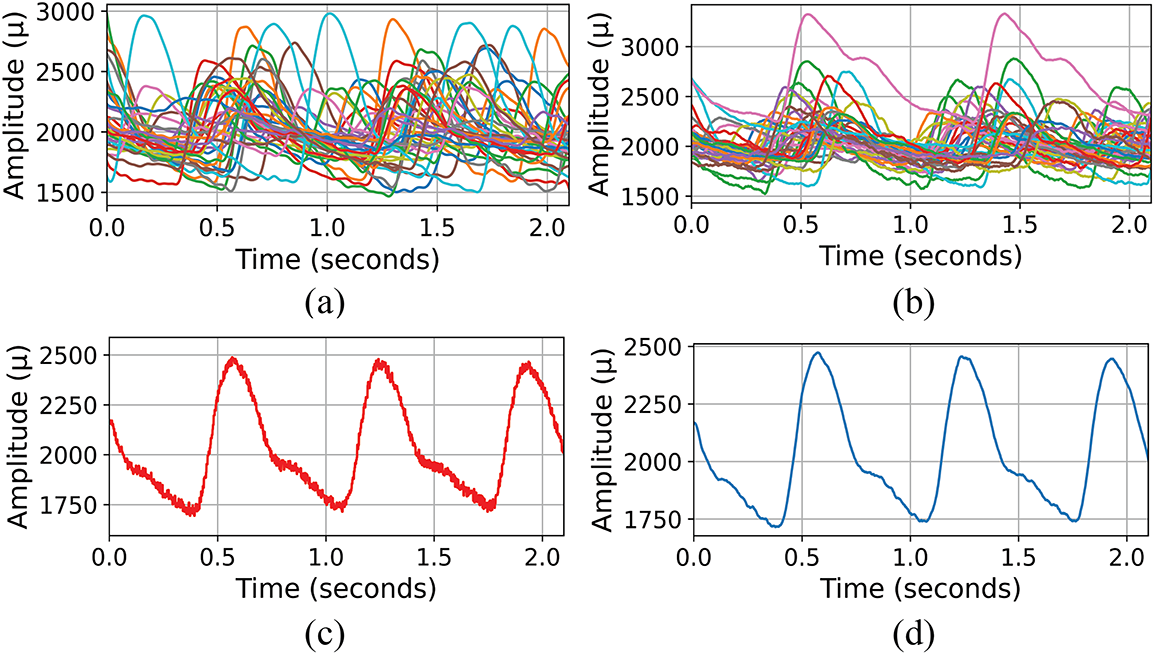
Figure 2: Comparative presentation of PPG signals in the dataset (a) Composite display of preprocessed PPG signals from diabetic subjects, illustrating the variability and complexity within the group. (b) Composite display of preprocessed PPG signals from healthy subjects, showcasing the signal diversity. (c) Raw PPG signal of one subject. (d) Preprocessed PPG signal by
2.3 Multiset Spatiotemporal Feature Fusion (MSFF)
We developed a multiset spatiotemporal feature fusion block based on linear statistical, waveform, nonlinear, and spatial features as presented in Fig. 3.
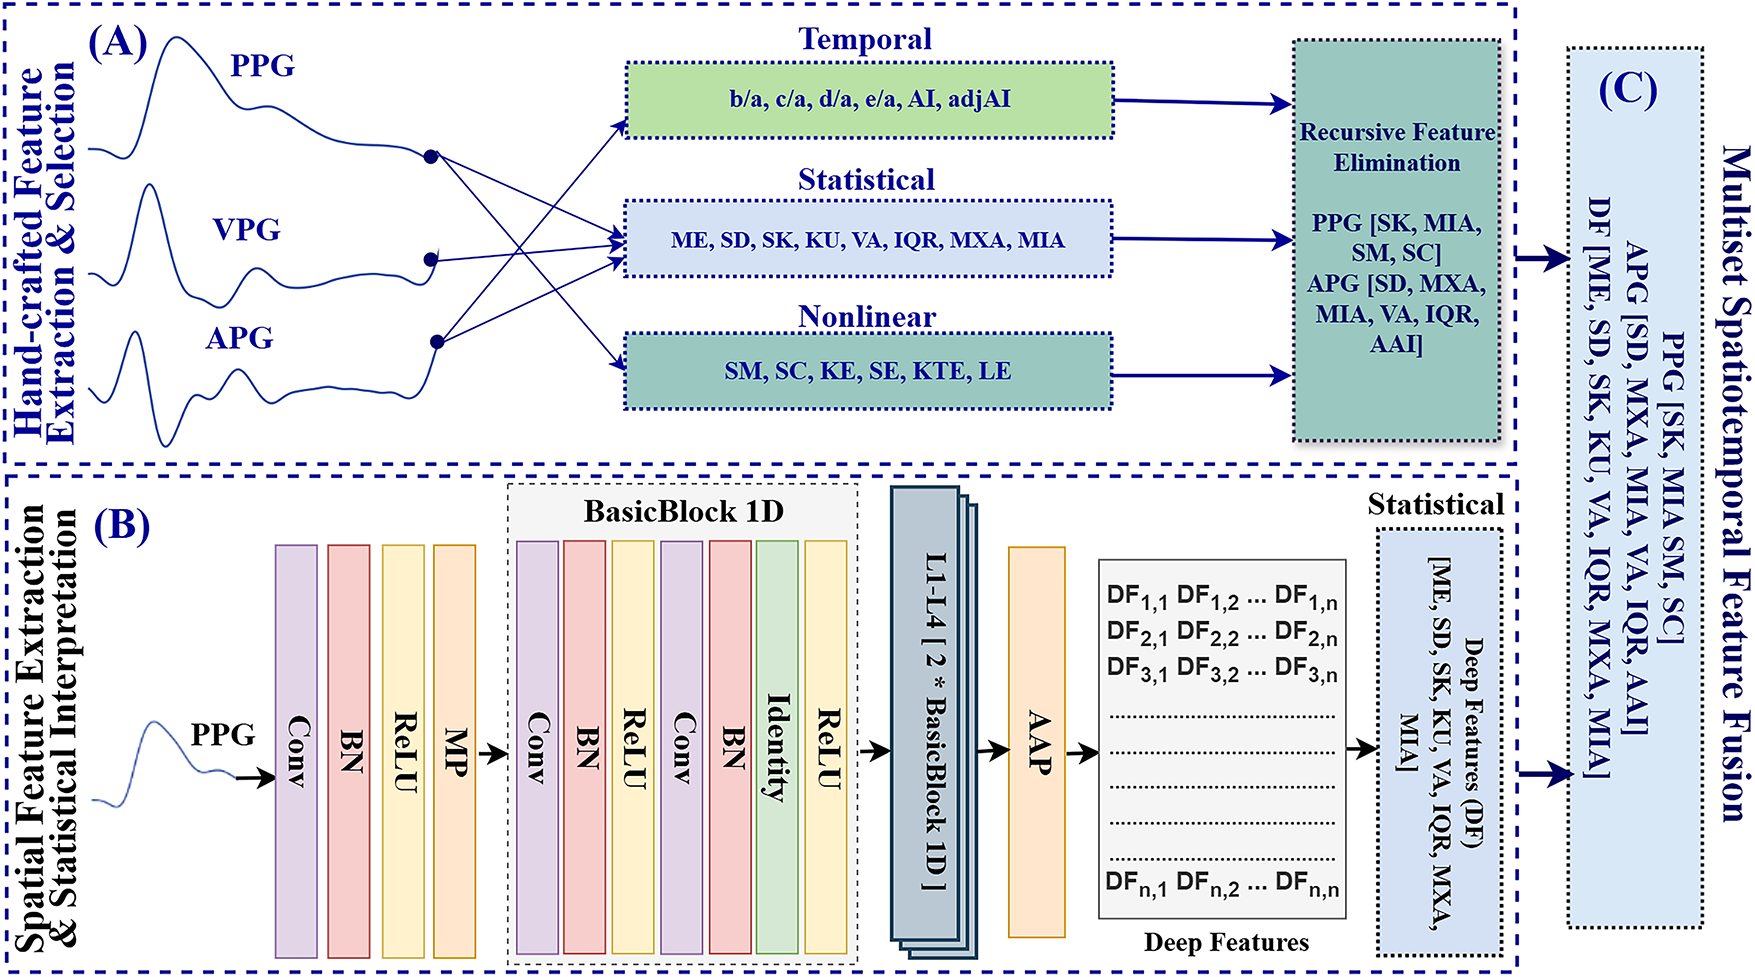
Figure 3: Framework of multiset spatiotemporal feature fusion. (A) Handcrafted features (temporal, statistical, and nonlinear) are extracted from PPG, VPG, and APG signals, followed by Recursive Feature Elimination (RFE) for feature selection. (B) A one-dimensional statistical convolutional neural network (1DSCNN) extracts spatial features from PPG using a convolutional layer (Conv), batch normalization (BN), ReLU activation, max pooling (MP), four stacked residual blocks (L1–L4) based on BasicBlock1D, and an adaptive average pooling (AAP) layer to produce deep features. (C) Final fusion of handcrafted and deep features
i. Hand-Crafted Features Extraction & Selection
For robust and physiologically meaningful feature extraction, the PPG signal was reconstructed into multi-channel waveforms by computing its first and second derivatives. The first derivative, known as the VPG, highlights rapid transitions in the waveform, such as the systolic upstroke and diastolic slope. The second derivative, referred to as the APG, enhances morphological detail by identifying physiologically significant inflection points (a–e) that correspond to arterial stiffness, ventricular function, and peripheral resistance. These clinical and physiological patterns exhibit noticeable alterations in individuals with diabetes. The VPG and APG can be expressed as follows:
where
where
Finally, the feature Set-A is obtained by combining the temporal statistical features and temporal APG waveform features, which can be expressed as follows:
Subsequently, the nonlinear features of signal mobility (SM), signal complexity (SC), Kolmogorov entropy (KE), shannon entropy (SE), Kaiser Teager energy (KTE), and logarithmic energy (LE) are extracted.
The feature Set-B is obtained, which can be expressed as follows:
As the descriptor
where
ii. Deep Feature Extraction & Interpretation
Manual feature engineering often requires extensive domain expertise and may fail to capture hidden relationships or complex nonlinear patterns within the data. To address this limitation, we propose a one-dimensional statistical convolutional neural network (1DSCNN) architecture integrated with residual connections. This architecture enables the extraction of a large number of deep features from PPG signals. Convolutional neural networks (CNNs) have recently achieved remarkable success in spatial and temporal feature extraction owing to their powerful representation learning capabilities [33,34]. Through their hierarchical structure, CNNs effectively learn both low-level and high-level features; however, as the network depth increases, they are prone to the vanishing gradient problem, wherein gradients from the output layer diminish as they propagate backward through earlier layers. To mitigate this issue, we incorporated residual connections into the proposed 1DSCNN, inspired by the Residual Network (ResNet) architecture. ResNet facilitates the training of deeper networks by introducing shortcut connections that alleviate gradient vanishing and preserve essential low-level temporal information. These connections allow gradients to bypass intermediate layers, effectively maintaining learning efficiency [35]. Consequently, the proposed design enables the extraction of complex hierarchical features from PPG signals, capturing both local and long-term temporal variations that are critical for accurate identification of diabetes-related physiological patterns. The proposed model is composed of
where
where
where
These deep features (DFs) represent learned spatiotemporal patterns extracted from the preprocessed PPG signals. However, as high-dimensional vector data, these DFs are not directly interpretable. To enhance interpretability, a set of statistical descriptors was computed to summarize their distributional characteristics. Specifically, the mean was calculated to represent the central tendency, while the standard deviation and variance quantified variability. Skewness assessed the asymmetry of the distribution, and kurtosis measured the sharpness or flatness of the activation profile. The interquartile range (IQR) was used as a robust indicator of spread. In addition, the maximum and minimum values were extracted to capture the extreme boundaries within the feature vector. These eight statistical descriptors were applied directly to the 1000-dimensional DF vector, resulting in a compact yet interpretable representation of deep features. The final feature set consists of these eight statistical features, which can be expressed as follows:
iii. Multiset Spatiotemporal Feature Fusion
After acquiring the respective sets of handcrafted features
2.4 Explainable Boosting Approach (XBA)
To improve the accuracy of diabetes detection from PPG signals, we propose an explainable boosting approach based on XGBoost using
where
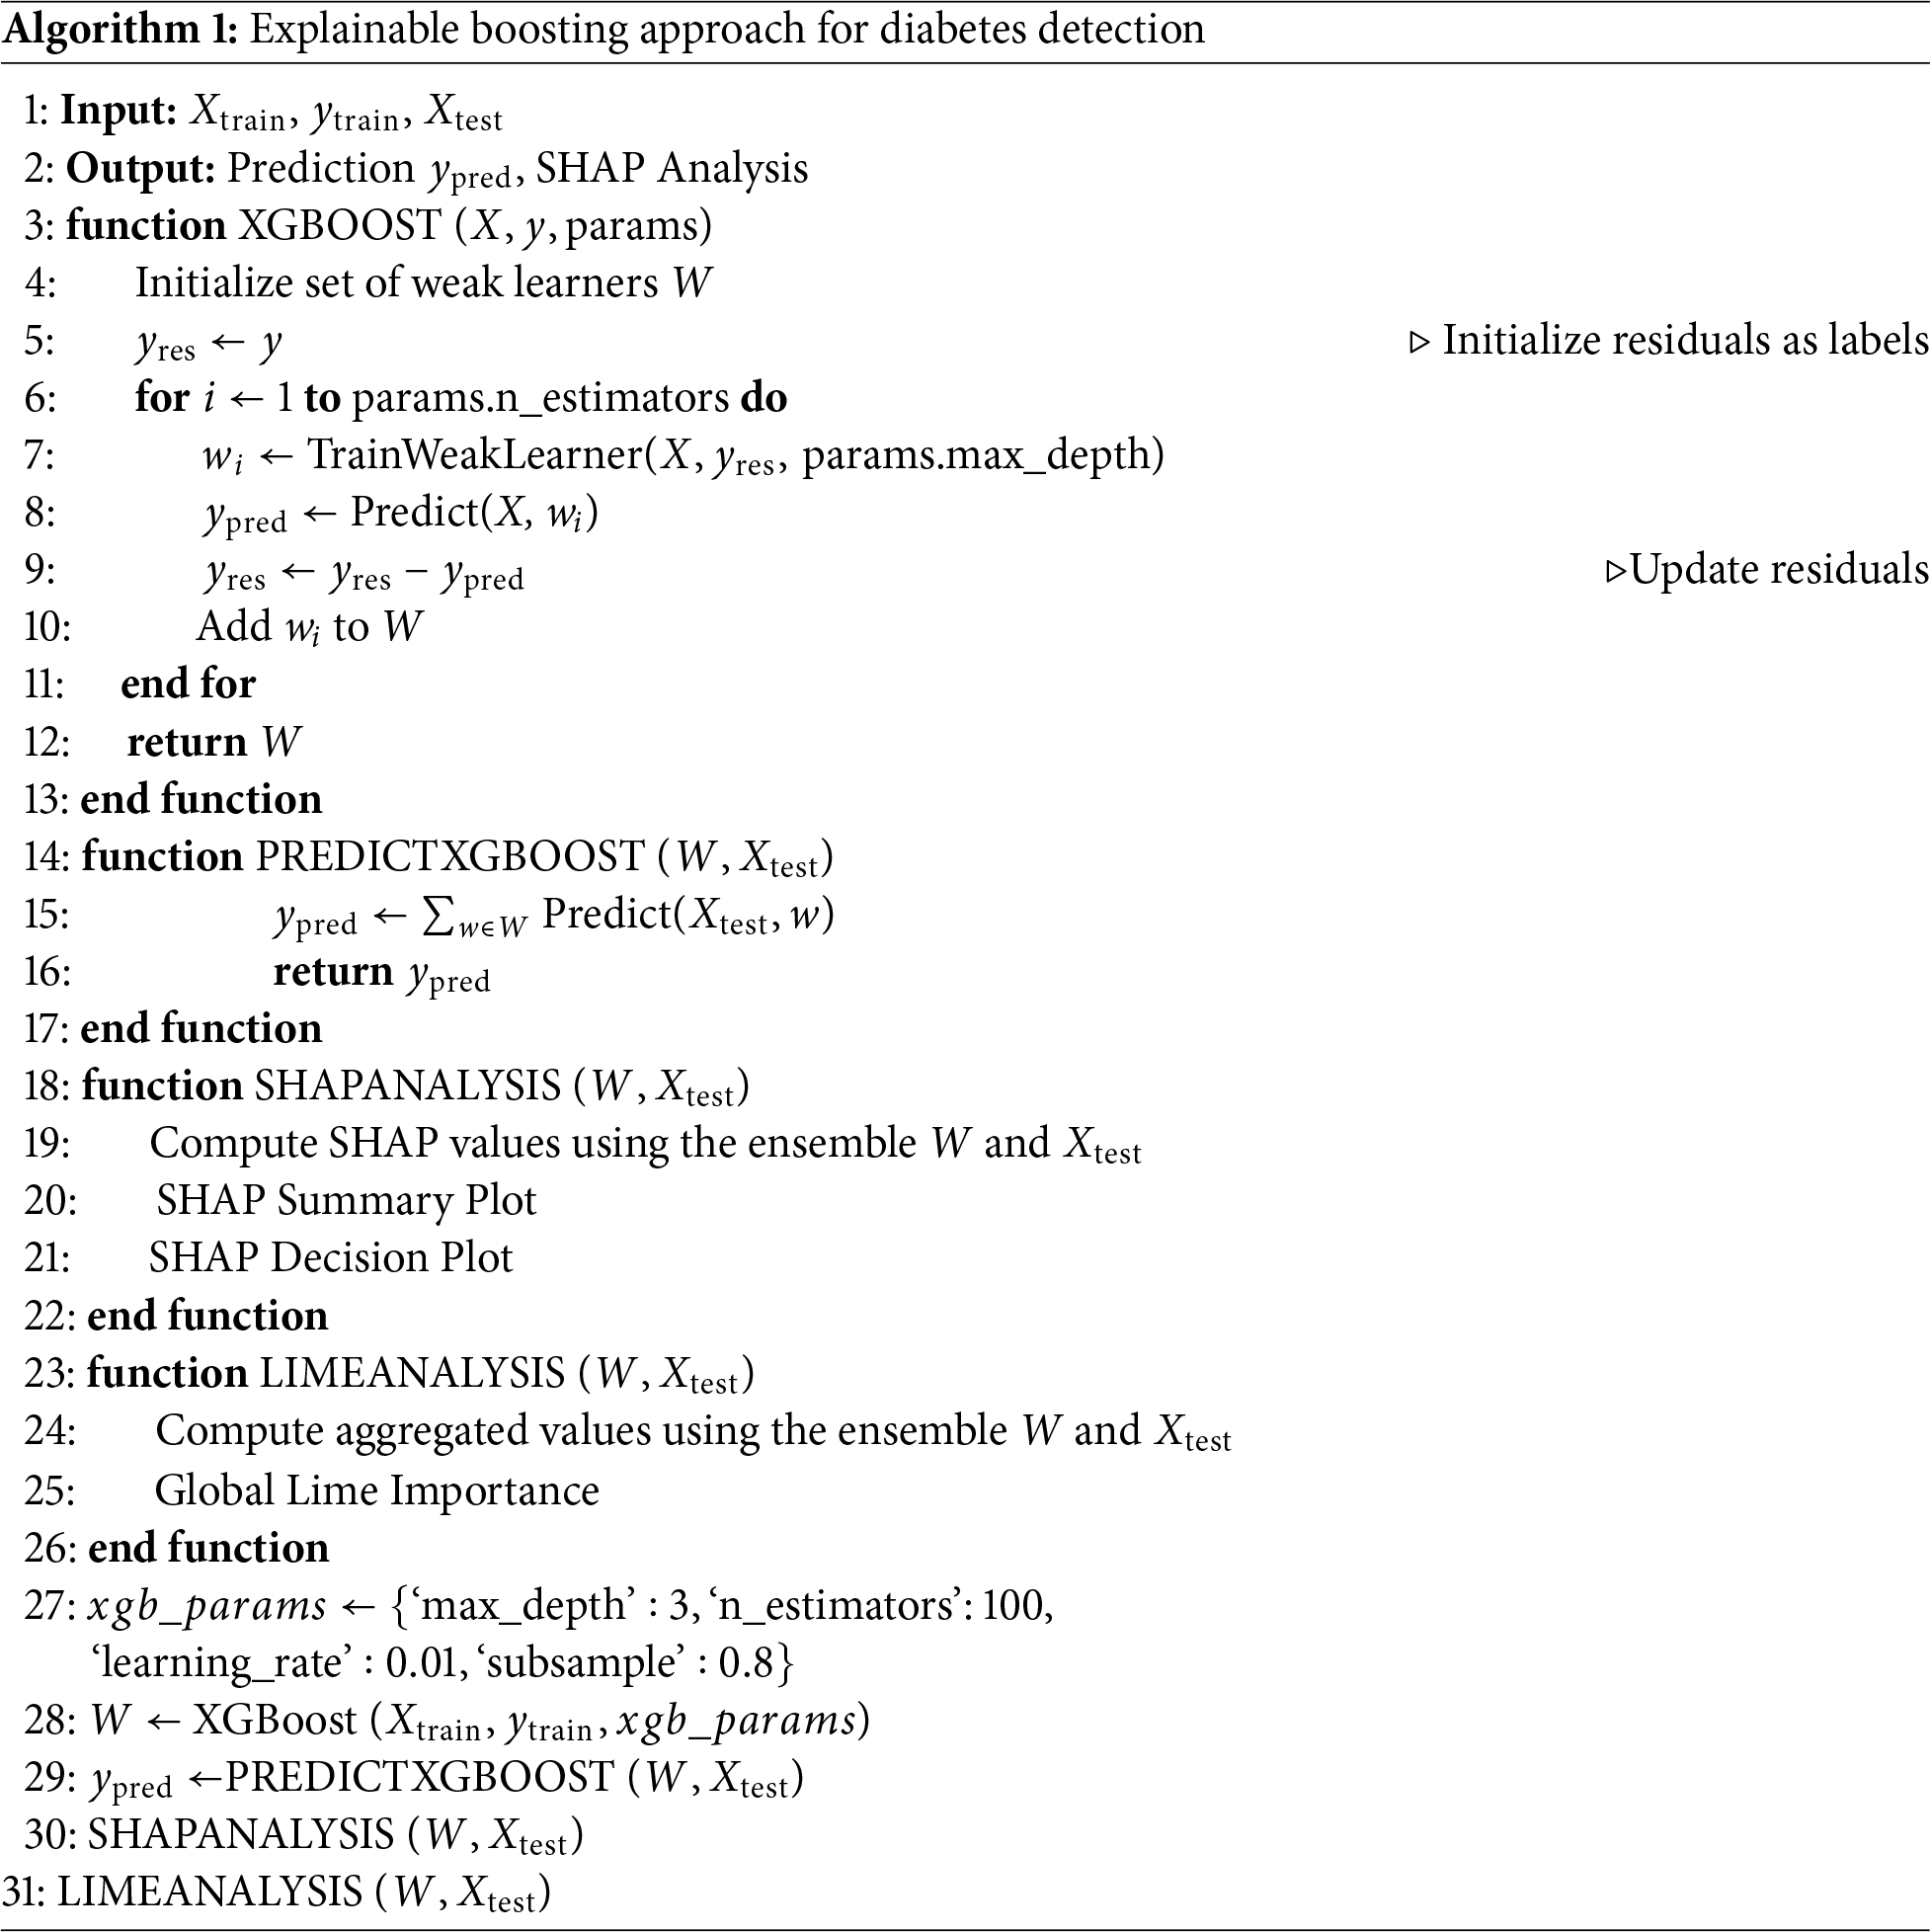
Algorithm 1 illustrates the proposed explainable boosting approach for diabetes detection. The algorithm begins by accepting training features
2.5 Performance Evaluation Criteria
We employed well-established performance metrics, including the area under the curve (AUC), sensitivity, and specificity, to thoroughly evaluate the proposed approach. These metrics are crucial for assessing the effectiveness of classification models, especially in medical diagnostics, where the consequences of false positives and false negatives are significant. Unlike accuracy, which represents the ratio of correctly predicted observations to the total observations and provides a quick overview of the model’s overall performance, AUC offers a more comprehensive measure. AUC quantifies the ability of the model to distinguish between classes under various threshold settings. This is particularly valuable in medical settings where the balance between sensitivity and specificity directly impacts clinical decision-making. The AUC can be represented as the integral of the ROC curve, which can be expressed as follows [40]:
where TPR() is the true positive rate at a threshold
where TP (True Positives) are cases correctly identified as diabetic, and FN (False Negatives) are cases where diabetes is present but not detected by the model. Specificity assesses the proportion of actual cases correctly identified as not diabetic, which can be expressed as follows [41]:
where TN (True Negatives) are cases correctly identified as not diabetic, and FP (False Positives) are cases incorrectly identified as diabetic by the model. Together, these metrics provide a comprehensive framework for evaluating the proposed model.
This section describes the experimental setup. It begins by detailing the study populations used from both the public and in-house datasets. The following subsection outlines the in-house data acquisition process. Finally, we describe the experimental configurations, including the computational environment and cross-validation technique.
In this study, we used data from 62 subjects (31 diabetic and 31 healthy) collected at Guilin People’s Hospital, Guilin, China [42]. We extended this dataset by recording in-lab data from 10 adult subjects (4 diabetic and 6 healthy) at the Shenzhen Institute of Advanced Technology (SIAT), Chinese Academy of Sciences (CAS), Shenzhen, China. The experimental protocols were approved by the ethics committee of SIAT-CAS under the Declaration of Helsinki, with approval numbers SIAT-IRB-200815-H0525 and SIAT-IRB-200315-H0461. We performed manual data fusion in 6 folds on both hospital and in-lab data using random shuffling to avoid bias. Collectively, our study population comprised 72 subjects.
Written informed consent and detailed medical histories were obtained from all participants prior to data collection. Participants were categorized as either diabetic or healthy based on their documented medical history. The experiment was conducted under controlled laboratory conditions to minimize the effects of motion artifacts and environmental variations. Each participant was instructed to sit comfortably and remain relaxed for approximately five minutes before recording. During the experiment, photoplethysmography (PPG), electrocardiography (ECG), and electroencephalography (EEG) signals were simultaneously recorded, as illustrated in Fig. 4. For this study, only the PPG data were utilized. A BIOPAC 100C PPG sensor was attached to the middle finger of the left hand, and data were collected at a sampling frequency of 1000 Hz for both the public and in-house datasets.
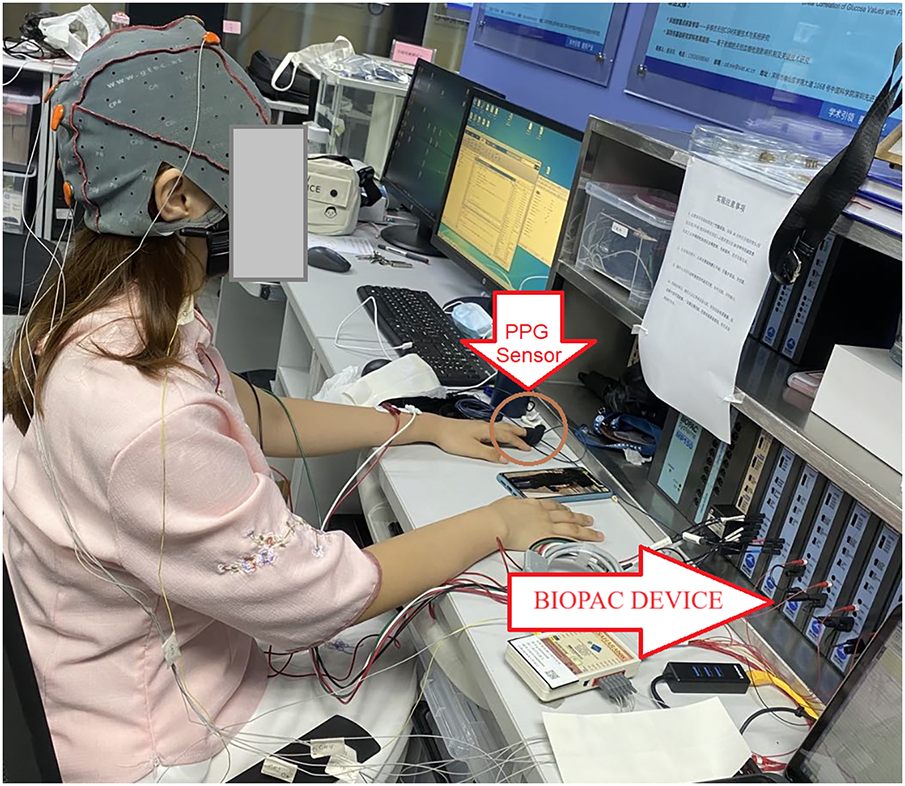
Figure 4: Experimental setup for clinical data Acquisition
We conducted experiments on RTX A6000 GPU with 512 GB RAM, utilizing PyTorch and Python 3.9.7. To effectively validate our proposed approach, we employed a 6-fold cross-validation technique with a random split of the data on a subject-wise basis. This method ensures that all data is used exactly once in the testing set, providing a comprehensive evaluation of the model’s performance across various subsets of the dataset. This rigorous validation helps in assessing the robustness and generalizability of the model under different data conditions.
This section presents the experimental results. It first reports ablation studies on various data fusion methods, feature sets, and machine learning classifiers. It then analyzes the interpretability of the proposed model to identify relevant digital biomarkers. Lastly, the proposed approach is compared with state-of-the-art methods to demonstrate its effectiveness.
4.1 Ablation Studies and Diabetes Detection Results
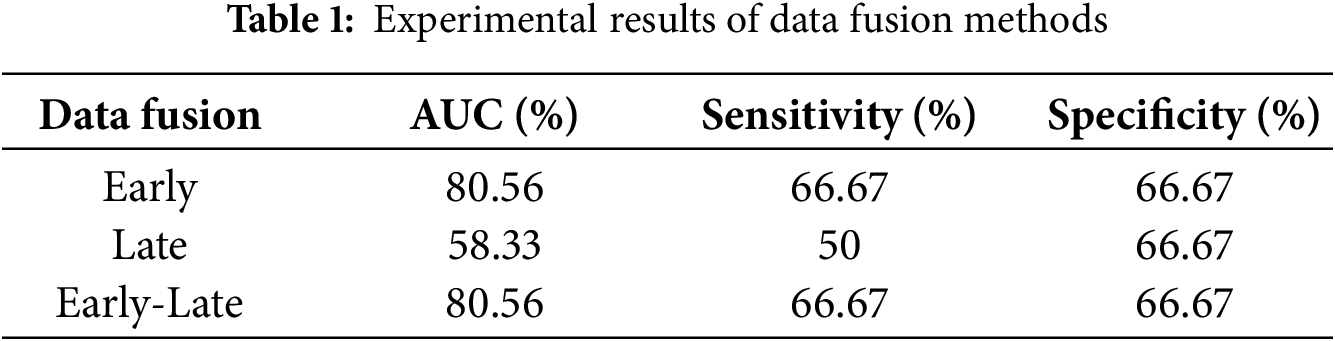
We performed ablation studies on early, late, and early-late data fusion methods using 80% of the data (equally distributed from hospital and in-house subjects) for training, with the remaining 20% for testing.
Early fusion involved feature-level fusion, where XGBoost was trained on a unified feature set and tested on the unseen data, achieving a sensitivity and specificity of 66.67%, and an AUC of 80.56%. In the late fusion approach, decision-level fusion was employed, where separate XGBoost models were trained on hospital and in-house datasets. Predictions from these models were aggregated using majority voting, with a tie-breaking mechanism based on predicted probabilities. This approach resulted in a sensitivity of 50%, specificity of 66.67%, and AUC of 58.33%. Finally, for the early-late fusion method, both early and late fusion models were integrated using the same voting mechanism. The performance of the early-late fusion remained comparable to early fusion, achieving a sensitivity and specificity of 66.67% and an AUC of 80.56%. Therefore, we employed early data fusion. A comprehensive summary of the results obtained from all fusion strategies is provided in Table 1.
We performed the experimental comparison of the proposed approach with sibling machine learning models using 6-fold cross-validation, as shown in Fig. 5. Sub-figure (a) shows the support vector machine (SVM) model, achieving an AUC of 62.2
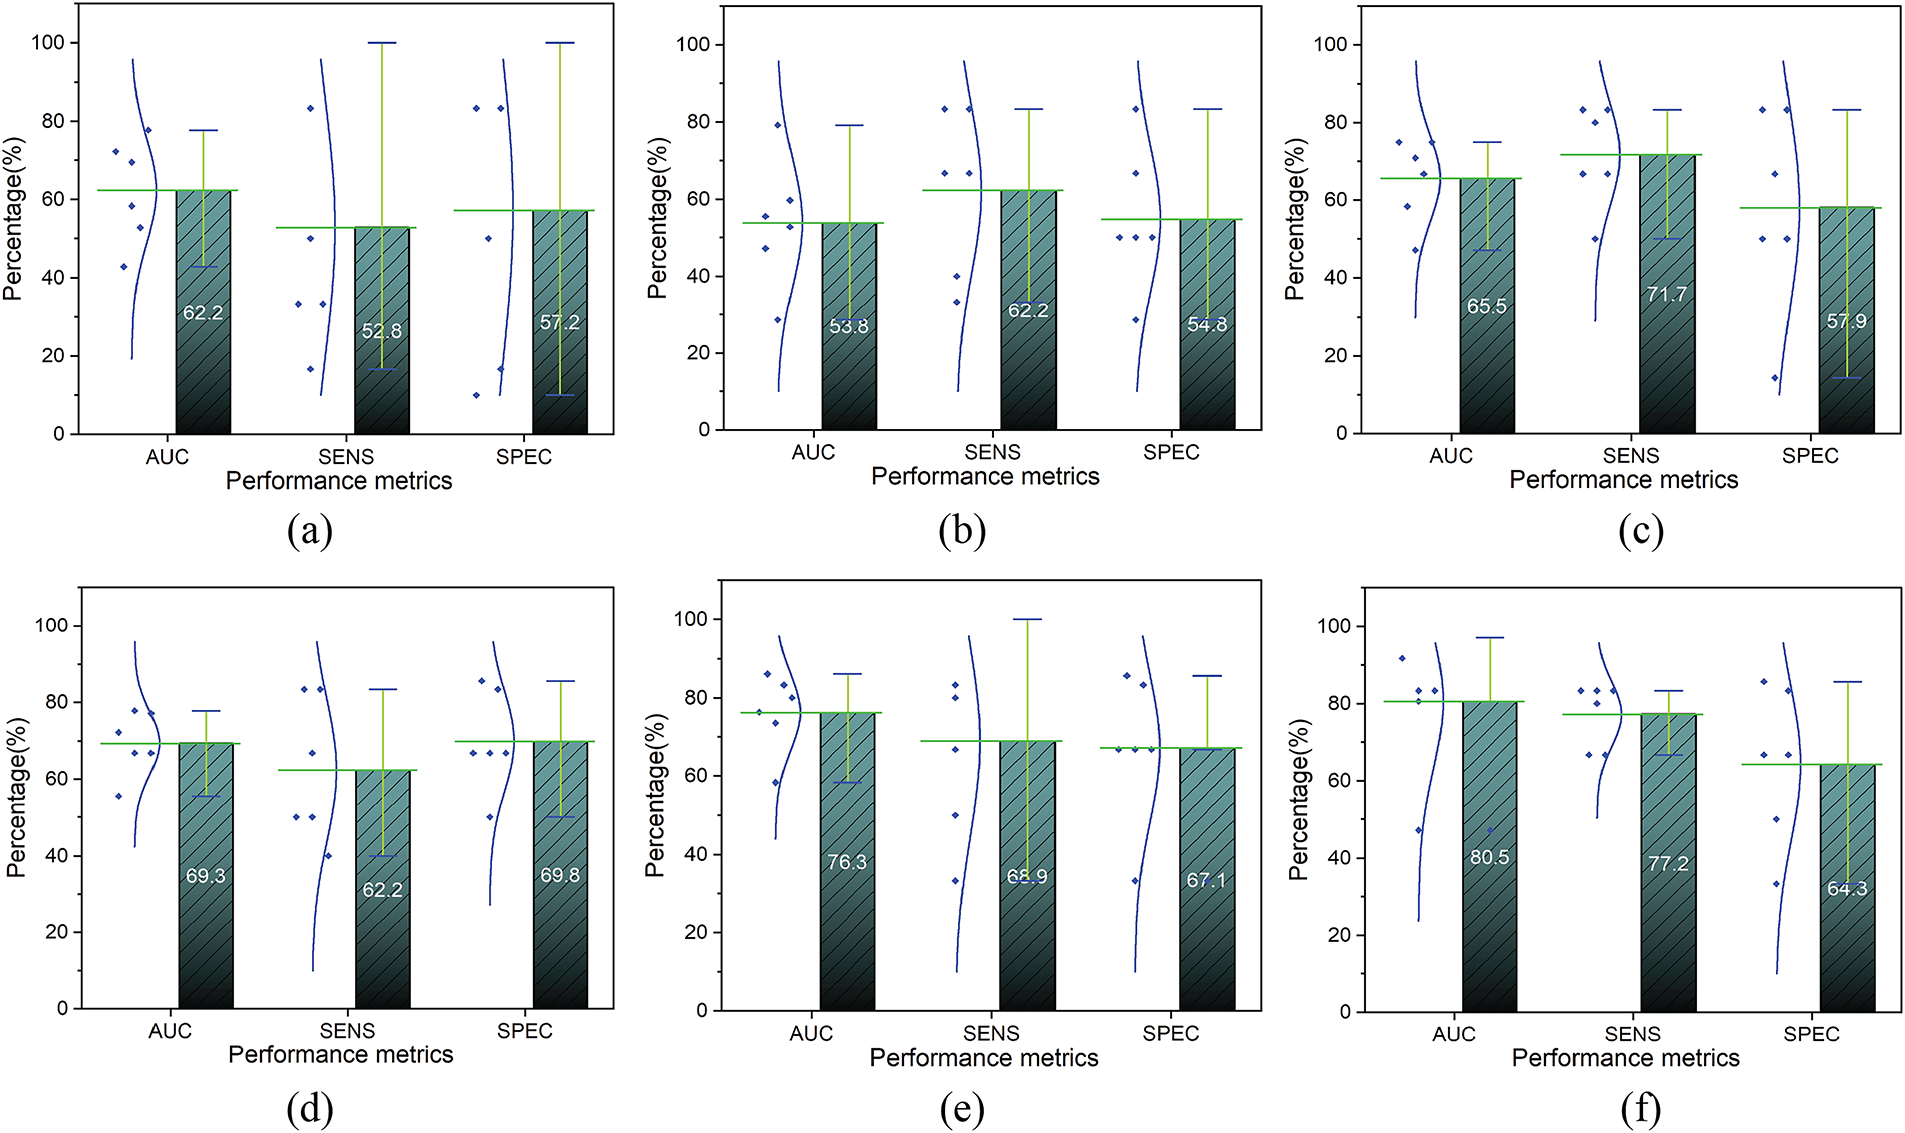
Figure 5: The comparative result of the sibling models. (a): Support Vector Machine; (b): k-Nearest Neighbor; (c): Decision Tree; (d): Logistic Regression; (e): Random Forest; (f): XGBoost b
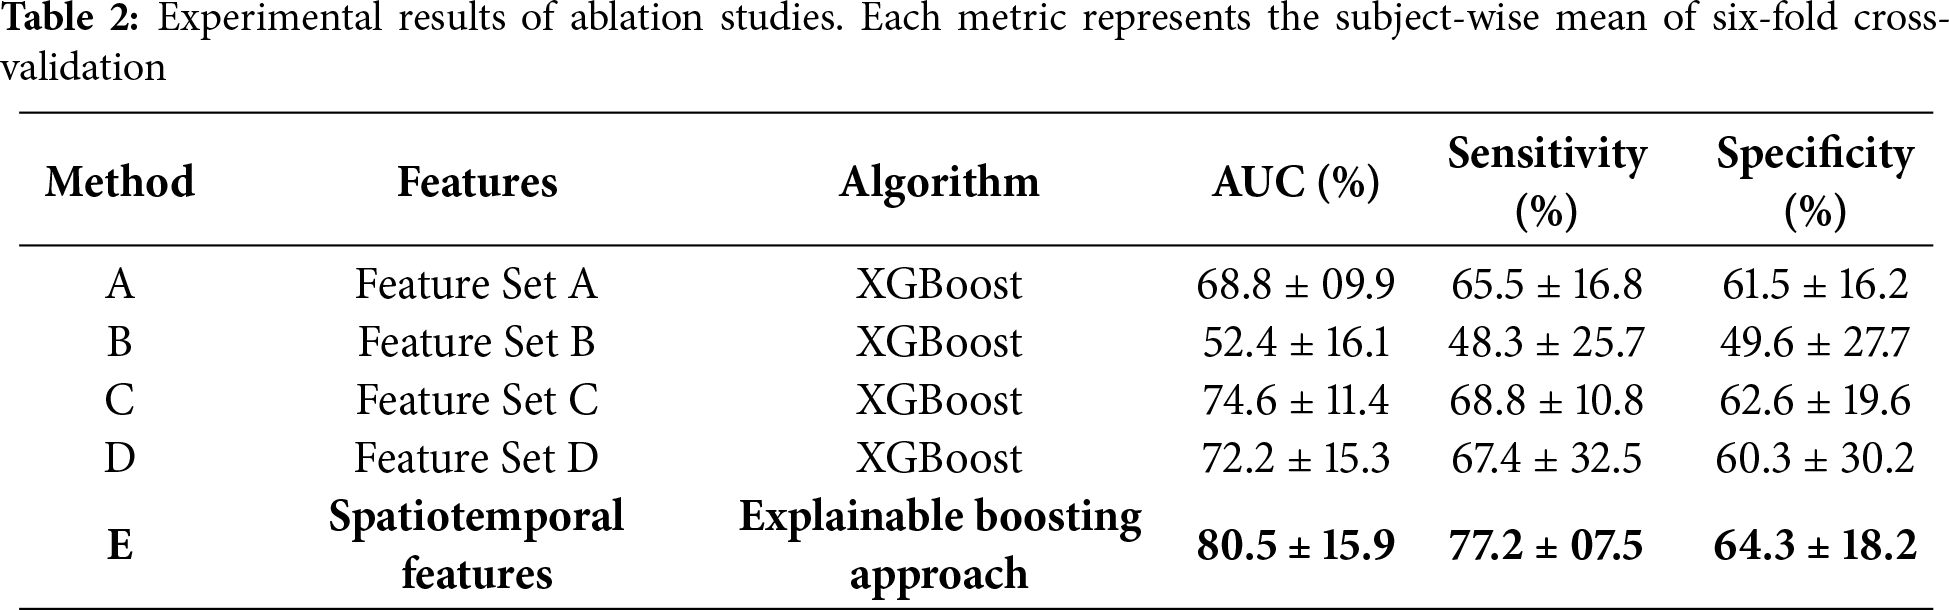
We also conducted comprehensive ablation studies to evaluate the effectiveness of various feature sets with the proposed approach. The results of ablation studies are presented in Table 2, illustrating the subject-wise mean of six-fold cross-validation. Method A, utilizing XGBoost with feature set A, achieved an AUC of 68.8
4.2 Digital Biomarker Investigation through XAI
In this section, we investigate the digital biomarkers identified through the XAI interpretation of the proposed model using the summary plot (SP) and decision plot (DP), as illustrated in Figs. 6 and 7, respectively. The SP visualizes the contribution of each feature to the model’s output, revealing the relative importance and direction of influence. Among all features, the skewness of the velocity PPG (VPG_SK) emerges as a primary digital biomarker, exerting the strongest impact on diabetes detection. In addition, statistical deep features (DFs) such as the minimum amplitude (DF_MIA) and mean (DF_ME) demonstrate a critical role in differentiating healthy individuals from those with diabetes. Moreover, the Kolmogorov entropy of PPG (PPG_KE) shows a notable contribution to the model’s predictive outcomes. The remaining handcrafted features (HCFs) and DFs also contribute meaningfully, underscoring their collective significance in capturing the complex physiological alterations associated with diabetic conditions.
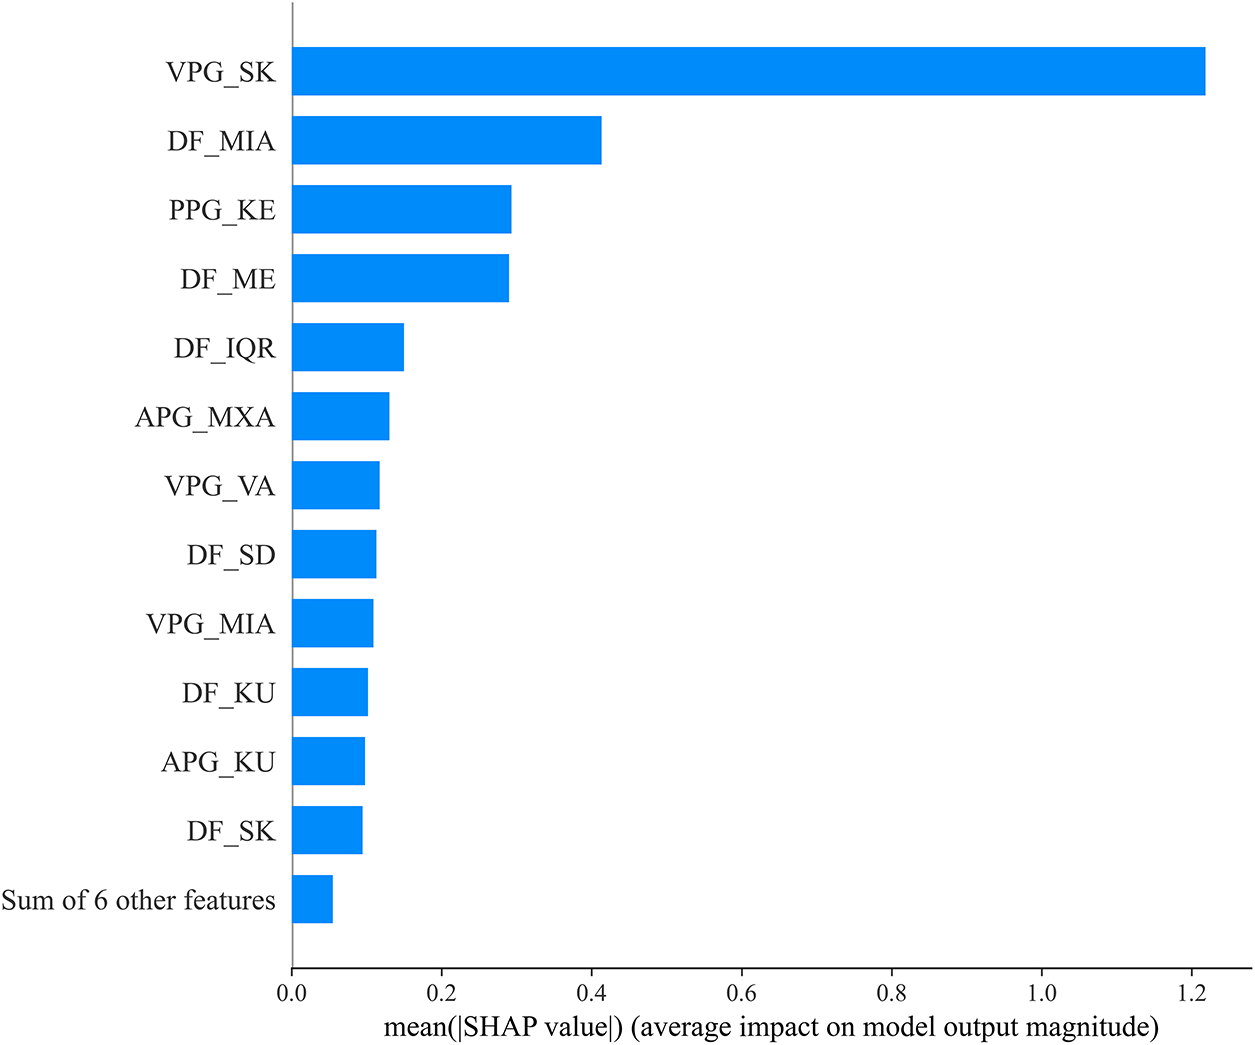
Figure 6: Best-fold summary plot of SHAP values for PPG-based diabetes detection. Class 0 represents the healthy, and class 1 represents the diabetic subjects
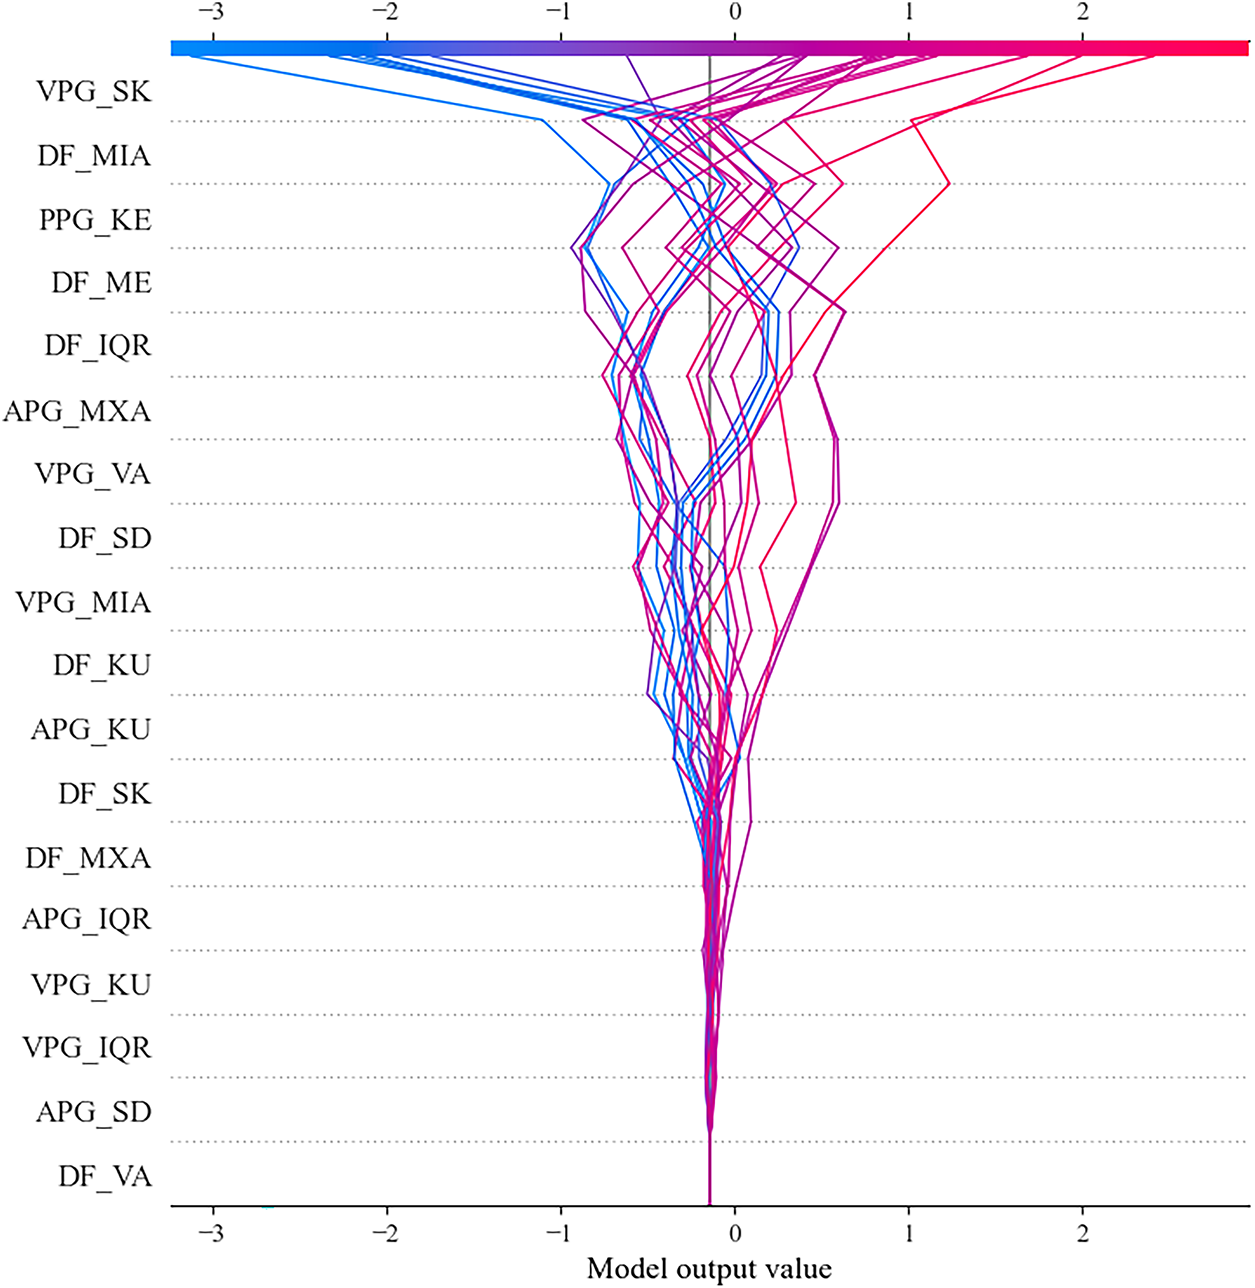
Figure 7: Best-fold decision plot of SHAP values for PPG-based diabetes detection
DP plot demonstrates the varying influence of individual features on the model’s output. Again, VPG_SK emerges as the most influential digital biomarker. The widespread distribution of the lines associated with VPG_SK indicates that this feature consistently drives the model’s decisions, either positively or negatively, across different instances. Other features, such as DF_MIA, PPG_KE, and DF_ME, exhibit a substantial impact on the model’s output. The variation observed in these lines suggests that these features effectively capture complex physiological relationships rather than random noise. Collectively, the remaining features further enhance the model’s predictive capability, underscoring their relevance in diabetes detection.
Further, the LIME results were consistent with the findings obtained from SHAP analysis, reinforcing the reliability of the identified digital biomarkers. The global LIME importance plot in Fig. 8 revealed that VPG_SK and PPG_KE were the two dominant contributors for both diabetic and healthy classifications, aligning closely with the SHAP summary and decision plots. In addition, deep features such as DF_MIA and DF_ME exhibited substantial influence, highlighting their ability to capture the subtle morphological and amplitude variations in PPG signals associated with vascular abnormalities. The comparable magnitudes of the bars across both classes indicate that the model consistently depends on similar physiological cues, which strengthens its generalizability and stability. These LIME results reaffirm that the model’s key discriminative features—VPG_SK, PPG_KE, DF_MIA, and DF_ME—are physiologically interpretable and robust indicators of vascular dysfunction and blood-flow irregularities caused by diabetes. Consequently, the combined SHAP-LIME interpretability framework provides complementary global and local validation of the model’s decision process, thereby enhancing confidence in the proposed explainable approach for PPG-based diabetes detection.
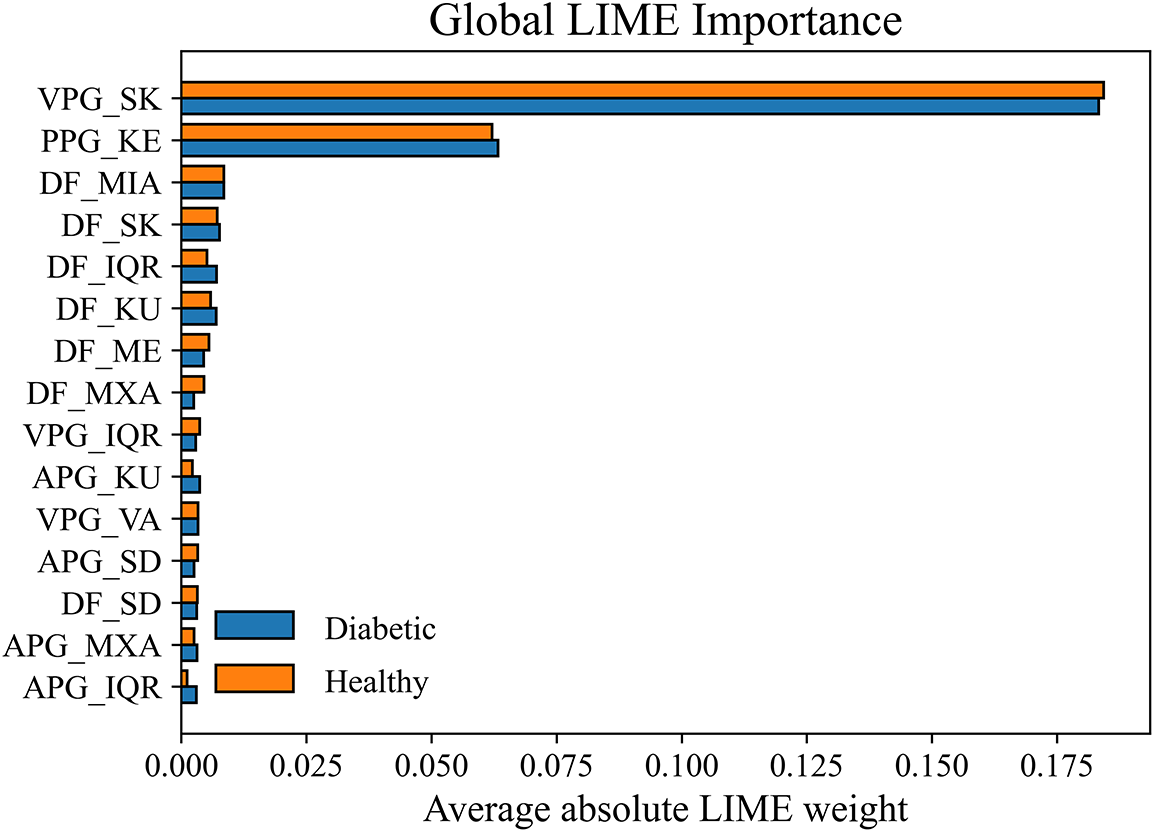
Figure 8: Global LIME features importance for PPG-based diabetes detection
Our analysis reveals that VPG_SK emerges as a strong digital biomarker for PPG-based diabetes detection. VPG_SK effectively captures the asymmetry in blood flow velocity, reflecting the underlying vascular dynamics associated with diabetic conditions. In diabetes, vascular abnormalities and irregular blood flow are commonly observed due to the long-term effects of hyperglycemia on blood vessels. The prominence of VPG_SK therefore suggests its potential role as an early indicator of vascular dysfunction in individuals with diabetes. Further, PPG_KE measures the complexity and irregularity of the PPG signal. Higher entropy values are associated with increased heart rate variability and blood volume fluctuations, which are frequently observed in diabetic patients. This aligns with the clinical understanding that diabetes contributes to autonomic dysfunction and arrhythmia, leading to unstable cardiovascular regulation. Additionally, APG_MXA shows that abnormal blood volume changes are often associated with vascular dysfunction in diabetes. The DF_MIA emerges as the second most influential biomarker. DF_MIA captures reduced blood volume patterns in diabetic patients, indicating potential circulatory inefficiencies and impaired perfusion. The combined behavior of HCFs and DFs suggests that diabetes affects vascular function and cardiovascular regulation, leading to distinctive patterns in blood flow dynamics, which could be analyzed through PPG.
4.3 Comparison with Previous Studies
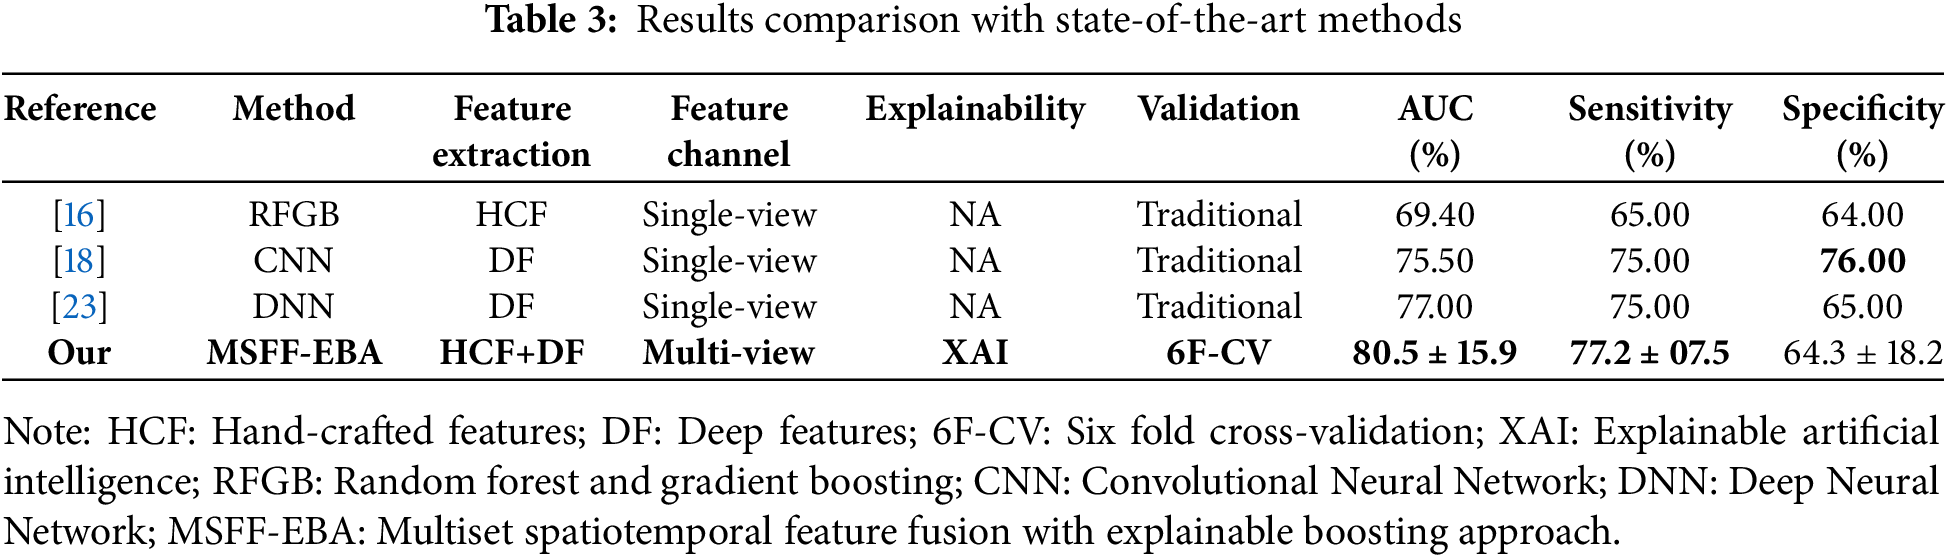
Table 3 presents a comparative analysis of the proposed approach against state-of-the-art methods. In [16], numerous hand-crafted features were extracted through manual feature engineering and applied to random forest and gradient boosting for diabetes detection. In studies [18,23], CNN and DNN models were developed on end-to-end feature learning, achieving an AUC between 75% and 77%. Notably, none of these studies applied XAI or any explainability method to interpret their models. Further, the comparative studies employed the traditional validation method with predefined train-test splits. In contrast, we utilized subject-wise six-fold cross-validation and reported the mean results for better generalization. Our proposed model surpassed all other methods in terms of AUC and specificity, although [18] reported the highest sensitivity at 76%.
In this study, we investigated the digital biomarkers for noninvasive diabetes detection using PPG signals. The proposed approach integrates multiset spatiotemporal feature fusion with an interpretable boosting approach. Spatiotemporal feature fusion has demonstrated substantial success in biomedical signal analysis, as it facilitates comprehensive feature extraction across multiple temporal and spectral dimensions. However, its application to diabetes detection using PPG signals remains largely unexplored. Most existing studies have relied exclusively on handcrafted features or employed simplified end-to-end learning frameworks, often neglecting the interpretability of the resulting models. Furthermore, to date, no studies on PPG-based diabetes detection have incorporated explainable artificial intelligence (XAI) to analyze the feature importance within trained models. To the best of our knowledge, this is the first study to implement multiset spatiotemporal feature fusion with an explainable boosting approach for interpretable, PPG-based diabetes detection.
Specifically, to minimize the impact of noise and motion artifact on PPG, we introduced the
The rapid advancement of smart wearable technologies, including health bands, smart rings, and smartwatches, has significantly available the continuous and unobtrusive acquisition of PPG data. The proposed method provides a noninvasive and physiologically interpretable approach for diabetes detection using PPG signals, integrating handcrafted and deep feature fusion within an explainable boosting model. Despite its clinical potential and competitive advantages, several limitations warrant further investigation. First, the dataset used in this study comprises 72 subjects, emphasizing the need for a larger and more diverse dataset to comprehensively evaluate the feasibility and scalability of the proposed approach. Second, the study population was limited to a single regional group (Chinese), highlighting the importance of extending future research to multi-regional cohorts to assess the model’s generalizability across diverse demographic backgrounds. Third, both datasets were collected under controlled laboratory conditions, indicating the need for future validation in real-world environments that include motion artifacts and daily activity variations.
This study presents a novel multiset spatiotemporal feature fusion with an explainable boosting approach for diabetes detection using photoplethysmography (PPG) signals. The quality and reliability of PPG data were ensured using the
Acknowledgement: This work is supported by the University of Chinese Academy of Sciences (UCAS), Shenzhen Institutes of Advanced Technology, Chinese Academy of Sciences (SIAT-CAS), and Alliance of International Science Organization (ANSO).
Funding Statement: This project is funded by the National Science and Technology Major Project under Grant No. 2024ZD0532000 and Grant No. 2024ZD0532002, the National Natural Science Foundation of China under Grant No. 62173318, the Shenzhen Basic Research Program under Grant No. JCYJ20250604182831042, the Key Laboratory of Biomedical Imaging Science and System, Chinese Academy of Sciences, and the Alliance of International Science Organization (ANSO) under Grant No. 2021A8017729010.
Author Contributions: Conceptualization: Mubashir Ali and Zedong Nie; methodology: Mubashir Ali; software: Mubashir Ali; validation: Jingzhen Li; formal analysis: Mubashir Ali and Jingzhen Li; investigation: Mubashir Ali; resources: Jingzhen Li and Zedong Nie; writing—original draft preparation: Mubashir Ali; writing—review and editing: Zedong Nie; visualization: Mubashir Ali, Jingzhen Li and Zedong Nie; project administration: Zedong Nie; Funding: Zedong Nie. All authors reviewed the results and approved the final version of the manuscript.
Availability of Data and Materials: The data that support the findings of this study are available at 10.1038/sdata.2018.20 (accessed on 28 September 2025).
Ethics Approval: The experimental protocols were approved by the ethics committee of SIAT-CAS under the Declaration of Helsinki, with approval numbers SIAT-IRB-200815-H0525 and SIAT-IRB-200315-H0461.
Informed Consent: Written informed consent and detailed medical histories were obtained from all participants prior to data collection.
Conflicts of Interest: The authors declare no conflicts of interest to report regarding the present study.
Abbreviations
The following abbreviations are used in this manuscript:
| PPG | Photoplethysmography |
| VPG | Velocity Photoplethysmography |
| APG | Acceleration Photoplethysmography |
| CNN | Convolutional Neural Network |
| 1DSCNN | One-dimensional statistical Convolutional Neural Network |
| XAI | Explainable Artificial Intelligence |
| SHAP | SHapley Additive exPlanations |
| AUC | Area Under the Curve |
| IDF | International Diabetes Federation |
| ML | Machine Learning |
| CV | Cross-Validation |
| Savitzky-Golay Signal Skewness Index | |
| MSFF | Multiset Spatiotemporal Feature Fusion |
| HCF | Hand-crafted Features |
| DF | Deep Features |
References
1. Duncan BB, Magliano DJ, Boyko EJ. IDF diabetes atlas 11th edition 2025: global prevalence and projections for 2050. Nephrol Dial Transplant. 2025;403:2100. doi:10.1093/ndt/gfaf177. [Google Scholar] [PubMed] [CrossRef]
2. Tomic D, Shaw JE, Magliano DJ. The burden and risks of emerging complications of diabetes mellitus. Nat Rev Endocrinol. 2022;18(9):525–39. doi:10.1038/s41574-022-00690-7. [Google Scholar] [PubMed] [CrossRef]
3. Katsarou A, Gudbjörnsdottir S, Rawshani A, Dabelea D, Bonifacio E, Anderson BJ, et al. Type 1 diabetes mellitus. Nat Rev Dis Primers. 2017;3(1):1–17. doi:10.1038/nrdp.2017.16. [Google Scholar] [PubMed] [CrossRef]
4. DeFronzo RA, Ferrannini E, Groop L, Henry RR, Herman WH, Holst JJ, et al. Type 2 diabetes mellitus. Nat Rev Dis Primers. 2015;1(1):1–22. doi:10.1038/nrdp.2015.19. [Google Scholar] [PubMed] [CrossRef]
5. McIntyre HD, Catalano P, Zhang C, Desoye G, Mathiesen ER, Damm P. Gestational diabetes mellitus. Nat Rev Dis Primers. 2019;5(1):1–19. doi:10.1038/s41572-019-0098-8. [Google Scholar] [PubMed] [CrossRef]
6. Yan Y, Wu T, Zhang M, Li C, Liu Q, Li F. Prevalence, awareness and control of type 2 diabetes mellitus and risk factors in Chinese elderly population. BMC Public Health. 2022;22(1):1–6. [Google Scholar]
7. Patel P, Macerollo A. Diabetes mellitus: diagnosis and screening. Am Family Phys. 2010;81(7):863–70. [Google Scholar]
8. Vasudevan S, Saha A, Tarver ME, Patel B. Digital biomarkers: convergence of digital health technologies and biomarkers. NPJ Digital Med. 2022;5(1):36. doi:10.1038/s41746-022-00583-z. [Google Scholar] [PubMed] [CrossRef]
9. Allen J, Zheng D, Kyriacou PA, Elgendi M. Photoplethysmography (PPGstate-of-the-art methods and applications. Physiol Meas. 2021;42(10):100301. doi:10.1088/1361-6579/ac2d82. [Google Scholar] [PubMed] [CrossRef]
10. Allen J. Photoplethysmography and its application in clinical physiological measurement. Physiol Meas. 2007;28(3):R1–39. [Google Scholar] [PubMed]
11. Yen CT, Wong JR, Chang CH. Multi-label machine learning classification of cardiovascular diseases. Comput Mater Contin. 2025;84(1):347–63. [Google Scholar]
12. Loh HW, Xu S, Faust O, Ooi CP, Barua PD, Chakraborty S, et al. Application of photoplethysmography signals for healthcare systems: an in-depth review. Comput Methods Programs Biomed. 2022;216:106677. doi:10.1016/j.cmpb.2022.106677. [Google Scholar] [PubMed] [CrossRef]
13. Ali M, Li J, Fan B, Nie Z. PPG based noninvasive blood glucose monitoring using multi-view attention and cascaded BiLSTM hierarchical feature fusion approach. IEEE J Biomed Health Inform. 2025;29(7):4692–702. doi:10.1109/jbhi.2024.3464098. [Google Scholar] [PubMed] [CrossRef]
14. Ramasamy V, Samiappan D, Ramesh R. Heartbeat and respiration rate prediction using combined photoplethysmography and ballistocardiography. Intell Autom Soft Comput. 2023;36(2):1365–80. doi:10.32604/iasc.2023.032155. [Google Scholar] [CrossRef]
15. An Y, Kang Y, Lee J, Ahn C, Kwon K, Choi C. Blood flow characteristics of diabetic patients with complications detected by optical measurement. BioMedical Eng Online. 2018;17(1):1–13. doi:10.1186/s12938-018-0457-9. [Google Scholar] [PubMed] [CrossRef]
16. Moreno EM, Lujan MJA, Rusinol MT, Fernandez PJ, Manrique PN, Trivino CA, et al. Type 2 diabetes screening test by means of a pulse oximeter. IEEE Trans Biomed Eng. 2017;64(2):341–51. doi:10.1109/tbme.2016.2554661. [Google Scholar] [PubMed] [CrossRef]
17. Xiao MX, Lu CH, Ta N, Wei HC, Yang CC, Wu HT. Toe PPG sample extension for supervised machine learning approaches to simultaneously predict type 2 diabetes and peripheral neuropathy. Biomed Signal Process Control. 2022;71(Pt B):103236. [Google Scholar]
18. Zanelli S, Yacoubi MAE, Hallab M, Ammi M. Type 2 diabetes detection with Light CNN from single raw PPG wave. IEEE Access. 2023;11:57652–65. doi:10.1109/access.2023.3274484. [Google Scholar] [CrossRef]
19. Keikhosravi A, Aghajani H, Zahedi E. Discrimination of bilateral finger photoplethysmogram responses to reactive hyperemia in diabetic and healthy subjects using a differential vascular model framework. Physiol Meas. 2013;34(5):513. doi:10.1088/0967-3334/34/5/513. [Google Scholar] [PubMed] [CrossRef]
20. Nirala N, Periyasamy R, Singh BK, Kumar A. Detection of type-2 diabetes using characteristics of toe photoplethysmogram by applying support vector machine. Biocybern Biomed Eng. 2019;39(1):38–51. doi:10.1016/j.bbe.2018.09.007. [Google Scholar] [CrossRef]
21. Mishra B, Nirala N, Singh BK. Photoplethysmography signal-based automated diagnosis of type-2 diabetes using tunable-Q wavelet transform and least-square support vector machine classifier. Signal Image Video Process. 2023;17:2745–54. doi:10.1007/s11760-023-02491-5. [Google Scholar] [CrossRef]
22. Gupta S, Singh A, Sharma A, Tripathy RK. dSVRI: a PPG-based novel feature for early diagnosis of Type-II diabetes mellitus. IEEE Sens Lett. 2022;6(9):1–4. doi:10.1109/lsens.2022.3203609. [Google Scholar] [CrossRef]
23. Avram R, Olgin JE, Kuhar P, Hughes JW, Marcus GM, Pletcher MJ, et al. A digital biomarker of diabetes from smartphone-based vascular signals. Nat Med. 2020;26(10):1576–82. doi:10.1038/s41591-020-1010-5. [Google Scholar] [PubMed] [CrossRef]
24. Loh HW, Ooi CP, Seoni S, Barua PD, Molinari F, Acharya UR. Application of explainable artificial intelligence for healthcare: a systematic review of the last decade (2011–2022). Comput Methods Programs Biomed. 2022;226:107161. doi:10.1016/j.cmpb.2022.107161. [Google Scholar] [PubMed] [CrossRef]
25. Shaheen I, Javaid N, Ali Z, Ahmed I, Khan FA, Pamucar D. A trustworthy and patient privacy-conscious framework for early diabetes prediction using Deep Residual Networks and proximity-based data. Biomed Signal Process Control. 2026;112:108361. doi:10.1016/j.bspc.2025.108361. [Google Scholar] [CrossRef]
26. Singh S, Wani NA, Kumar R, Bedi J. DiaXplain: a transparent and interpretable artificial intelligence approach for Type-2 diabetes diagnosis through deep learning. Comput Electri Eng. 2025;126:110470. doi:10.1016/j.compeleceng.2025.110470. [Google Scholar] [CrossRef]
27. Jing XY, Zhang X, Zhu X, Wu F, You X, Gao Y, et al. Multiset feature learning for highly imbalanced data classification. IEEE Trans Pattern Anal Mach Intell. 2019;43(1):139–56. doi:10.1609/aaai.v31i1.10739. [Google Scholar] [CrossRef]
28. Li J, Ma J, Omisore OM, Liu Y, Tang H, Ao P, et al. Noninvasive blood glucose monitoring using spatiotemporal ECG and PPG feature fusion and weight-based choquet integral multimodel approach. IEEE Trans Neural Netw Learn Syst. 2023;35(10):14491–505. doi:10.1109/tnnls.2023.3279383. [Google Scholar] [PubMed] [CrossRef]
29. Bharati S, Mondal MRH, Podder P. A review on explainable artificial intelligence for healthcare: why, how, and when? IEEE Trans Artif Intell. 2024;5(4):1429–42. doi:10.1109/tai.2023.3266418. [Google Scholar] [CrossRef]
30. Band SS, Yarahmadi A, Hsu CC, Biyari M, Sookhak M, Ameri R, et al. Application of explainable artificial intelligence in medical health: a systematic review of interpretability methods. Inform Med Unlocked. 2023;40:101286. doi:10.1016/j.imu.2023.101286. [Google Scholar] [CrossRef]
31. Press WH, Teukolsky SA. Savitzky-Golay smoothing filters. Comput Phys. 1990;4(6):669–72. doi:10.1063/1.4822961. [Google Scholar] [CrossRef]
32. Elgendi M. Optimal signal quality index for photoplethysmogram signals. Bioengineering. 2016;3(4):21. doi:10.3390/bioengineering3040021. [Google Scholar] [PubMed] [CrossRef]
33. Ajit A, Acharya K, Samanta A. A review of convolutional neural networks. In: 2020 International Conference on Emerging Trends in Information Technology and Engineering (ic-ETITE); 2020 Feb 24–25; Vellore, India. p. 1–5. [Google Scholar]
34. Fatima T, Xia K, Yang W, Ul Ain Q, Perera PL. Diabetes prediction using ADASYN-based data augmentation and CNN-BiGRU deep learning model. Comput Mater Contin. 2025;84(1):811–26. doi:10.32604/cmc.2025.063686. [Google Scholar] [CrossRef]
35. Borawar L, Kaur R. ResNet: solving vanishing gradient in deep networks. In: Mahapatra RP, Peddoju SK, Roy S, Parwekar P, editors. Proceedings of International Conference on Recent Trends in Computing. Singapore: Springer Nature; 2023. p. 235–47. doi:10.1007/978-981-19-8825-7_21. [Google Scholar] [CrossRef]
36. Chen T, Guestrin C. XGBoost: a scalable tree boosting system. In: KDD ’16: Proceedings of the 22nd ACM SIGKDD International Conference on Knowledge Discovery and Data Mining. New York, NY, USA: ACM; 2016. p. 785–94. [Google Scholar]
37. Nohara Y, Matsumoto K, Soejima H, Nakashima N. Explanation of machine learning models using shapley additive explanation and application for real data in hospital. Comput Methods Programs Biomed. 2022;214:106584. doi:10.1016/j.cmpb.2021.106584. [Google Scholar] [PubMed] [CrossRef]
38. Deshpande NM, Gite S, Pradhan B, Assiri ME. Explainable artificial intelligence—a new step towards the trust in medical diagnosis with AI frameworks: a review. Comput Model Eng Sci. 2022;133(3):843–72. doi:10.32604/cmes.2022.021225. [Google Scholar] [CrossRef]
39. Salih AM, Raisi-Estabragh Z, Galazzo IB, Radeva P, Petersen SE, Lekadir K, et al. A perspective on explainable artificial intelligence methods: sHAP and LIME. Adv Intell Syst. 2025;7(1):2400304. doi:10.1002/aisy.202400304. [Google Scholar] [CrossRef]
40. Carrington AM, Manuel DG, Fieguth PW, Ramsay T, Osmani V, Wernly B, et al. Deep ROC analysis and AUC as balanced average accuracy, for improved classifier selection, audit and explanation. IEEE Trans Pattern Anal Mach Intell. 2022;45(1):329–41. doi:10.1109/tpami.2022.3145392. [Google Scholar] [PubMed] [CrossRef]
41. Tharwat A. Classification assessment methods. Appl Comput Inform. 2021;17(1):168–92. [Google Scholar]
42. Liang Y, Chen Z, Liu G, Elgendi M. A new, short-recorded photoplethysmogram dataset for blood pressure monitoring in China. Sci Data. 2018;5(1):180020. doi:10.1038/sdata.2018.20. [Google Scholar] [PubMed] [CrossRef]
Cite This Article
 Copyright © 2025 The Author(s). Published by Tech Science Press.
This work is licensed under a Creative Commons Attribution 4.0 International License , which permits unrestricted use, distribution, and reproduction in any medium, provided the original work is properly cited.
 Downloads
 Citation Tools