
 Submit a Paper
 Propose a Special lssue
 Open Access
ARTICLE
Numerical Study of Fluid Loss Impact on Long-Term Performance of Enhanced Geothermal Systems under Varying Operational Parameters
1 Key Laboratory of Power Station Energy Transfer Conversion and System (North China Electric Power University), Ministry of Education, Beijing, 102206, China
2 School of Petroleum Engineering, Yangtze University, Wuhan, 430100, China
3 School of Mechanical Engineering, Beijing Institute of Petrochemical Technology, Beijing, 102617, China
* Corresponding Author: Kaituo Jiao. Email:
Computer Modeling in Engineering & Sciences 2025, 145(3), 3453-3479. https://doi.org/10.32604/cmes.2025.073239
Received 13 September 2025; Accepted 13 November 2025; Issue published 23 December 2025
 View Full Text
 Download PDF
Abstract
The permeability contrast between the Hot Dry Rock (HDR) reservoir and the surrounding formations is a key factor governing fluid loss in Enhanced Geothermal Systems (EGS). This study thus aims to investigate its impact on system performance under varying operating conditions, and a three-dimensional thermo–hydro–mechanical (THM) coupled EGS model is developed based on the geological parameters of the GR1 well in the Qiabuqia region. The coupled processes of fluid flow, heat transfer, and geomechanics within the reservoir under varying reservoir–surrounding rock permeability contrasts, as well as the flow and heat exchange along the wellbores from the reservoir to the surface are simulated. Then, the influence of permeability contrast, production pressure, injection rate, and injection temperature on fluid loss and heat extraction performance over a 35-year operation period is quantitatively assessed. The results show that increasing the permeability contrast effectively suppresses fluid loss and enhances early-stage heat production, but also accelerates thermal breakthrough and shortens the stable operation period. When the contrast rises from 1 × 10³ to 1 × 10⁵, the cumulative fluid loss rate drops from 54.34% to 0.23%, and the total heat production increases by 132%, although the breakthrough occurs 5 years earlier. Meanwhile, higher production pressure delays thermal breakthrough and slows transient temperature decline, but exacerbates fluid loss and reduces heat production power. For instance, raising the pressure from 17 to 21 MPa increases the fluid loss rate from 33.17% to 54.34% and reduces average annual heat production power from 25.43 to 14.59 MWth. In addition, increasing the injection rate (46 to 66 kg/s) lowers fluid loss rate but brings forward thermal breakthrough by 9 years and causes a 41 K temperature drop at the end of operation. Notably, under high fluid loss, the dynamic response pattern of heat production power shifts from a temperature-dominated “stable–breakthrough–decline” mode to a novel “rising–breakthrough–decline” mode jointly governed by both production temperature and flow rates. These findings provide theoretical support and engineering guidance for improving EGS performance.Keywords
Global efforts to decarbonize and transition toward sustainable energy systems have made the development of deep, clean, and reliable geothermal resources increasingly critical [1]. Hot Dry Rock (HDR) reservoirs possess enormous geothermal potential, offering the capability for large-scale power generation. It is estimated that HDR reservoirs at depths of 3–10 km in China and the United States collectively hold a total heat reserve exceeding 3.9 × 10⁷ EJ [2]. In particular, the total HDR resources in China alone are equivalent to 260,000 times the nation’s annual energy consumption [3]. Efficient exploitation of HDR geothermal resources is essential for meeting growing energy demand and enabling low-carbon development.
Enhanced Geothermal Systems (EGS) represent an open-loop heat extraction technology that activates HDR reservoirs through hydraulic fracturing or similar techniques, thereby creating interconnected fracture networks and stable heat exchange pathways. During operation, a cold working fluid is injected into the reservoir via injection wells, heated by the high-temperature rock matrix, and then recovered through production wells for power generation [4]. This concept was first proposed by the Los Alamos National Laboratory in the United States in 1974 and has since become the core technology for HDR geothermal resource development. Over the past several decades, a series of EGS field experiments have been conducted in countries such as France [5,6], the United States [7], Germany [8,9], Australia [10,11], Japan [12], the United Kingdom [13], and China [14].
Fig. 1 presents several major EGS projects worldwide, where blue boxes indicate currently operating projects and red boxes represent those that have been closed. Although the feasibility of EGS technology has been demonstrated and considerable advances have been made, nearly half of all EGS projects have failed to achieve long-term stable operation, hindering large-scale commercialization. Fluid loss remains a critical challenge that limits both the efficiency and operational stability of EGS systems. Excessive fluid loss results in ineffective recovery of the working fluid, not only reducing heat extraction efficiency but also significantly shortening the operational lifespan of the system [15]. For example, long-term circulation tests at the Hijiori site in Japan reported fluid loss rates exceeding 70% in two key production wells, HDR-2a and HDR-3 [16]. An even more extreme case was observed in the Kakkonda (Koguchi) project in Japan, where fluid loss rates approached 80%, eventually leading to project termination [17].
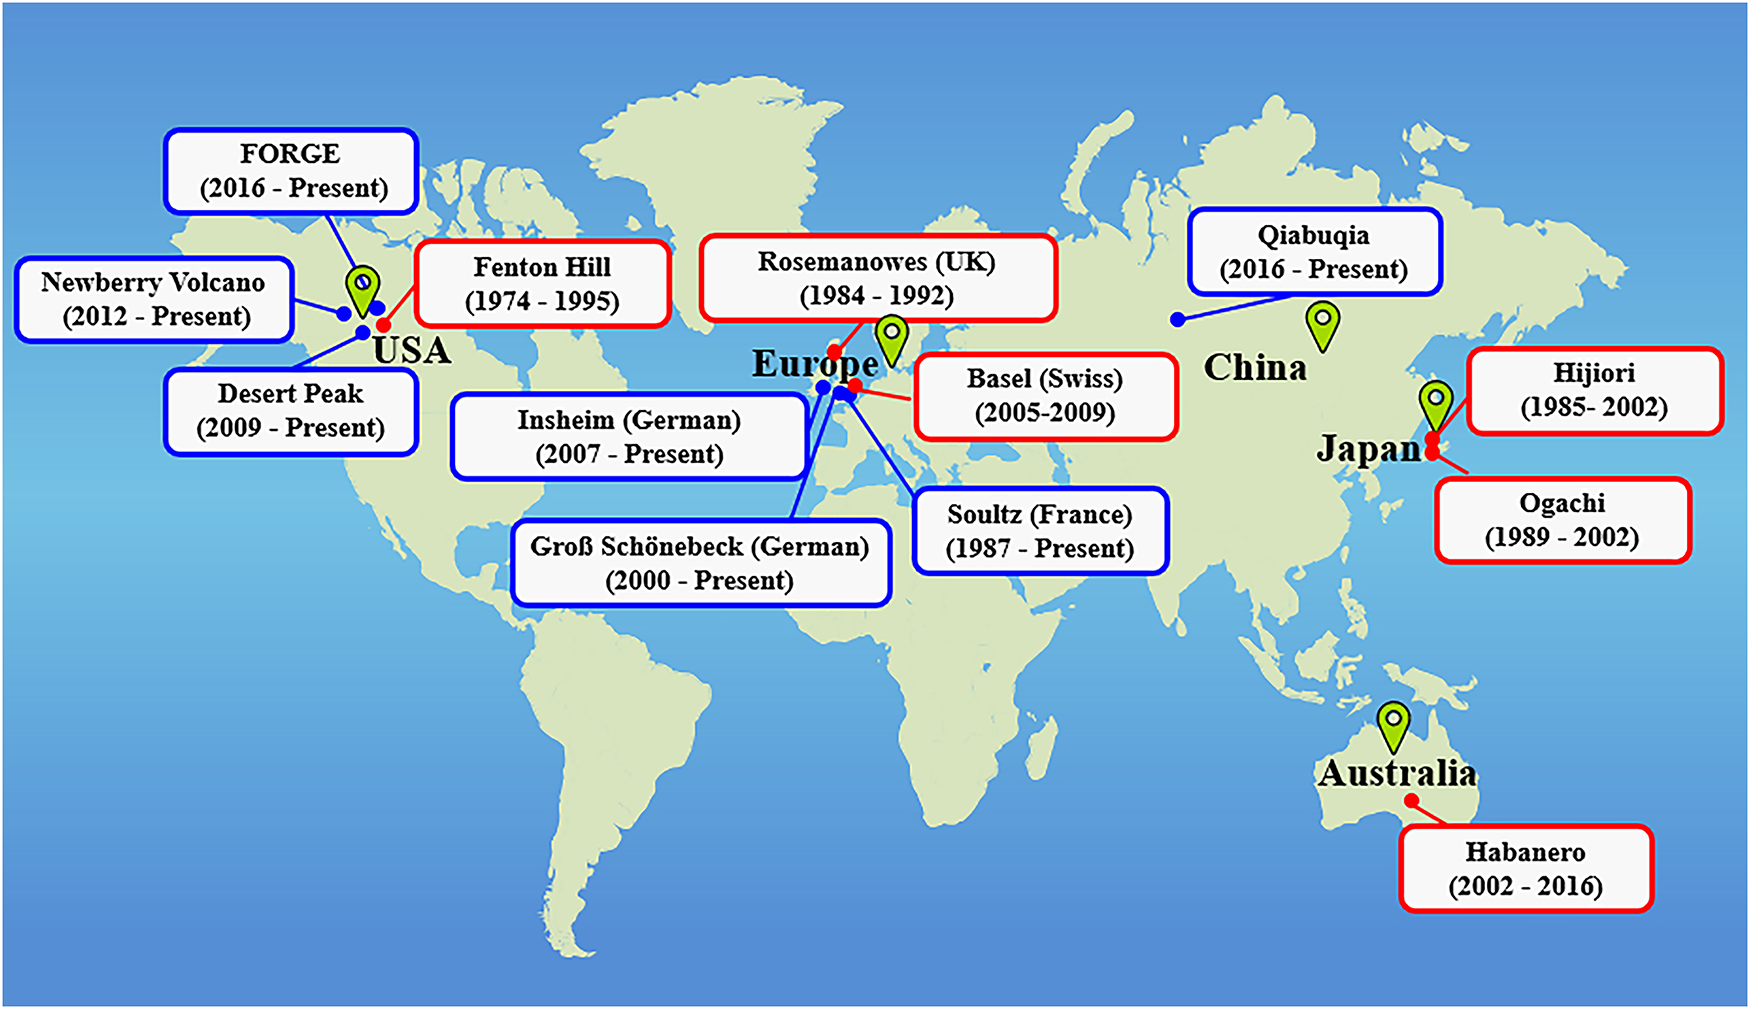
Figure 1: Operating and closed EGS projects worldwide
The mechanisms underlying fluid loss in EGS are inherently complex, resulting from the combined effects of geological characteristics and coupled thermo–hydro–mechanical (THM) processes. Among these, the dynamic evolution and spatial deviation of preferential flow paths within the reservoir are widely recognized as the primary drivers of fluid loss [18,19]. Existing studies have demonstrated that the injection of cold fluid during EGS operation induces disturbances of temperature gradients and pore pressure, causing the fluid to preferentially traverse low-resistance pathways [20]. This leads to the occurrence of “bypass flow,” whereby the injected fluid circumvents high-temperature heat exchange zones. Such flow diversion not only significantly reduces heat extraction efficiency but also results in substantial volumes of fluid failing to participate in effective heat exchange [21,22]. Further numerical simulations by Zinsalo et al. [23] revealed that as the heat extraction process continues, the originally limited preferential channels in the reservoir dynamically evolve. In the later stages of EGS operation, these flow pathways become increasingly concentrated, enabling the fluid to more readily bypass target heat exchange regions or migrate directly toward reservoir boundaries. As a result, irrecoverable fluid loss intensifies, thermal output declines, and the operational lifetime of the system is markedly shortened.
The permeability contrast between the reservoir and the surrounding formations is a key external driver for the dynamic evolution and spatial deviation of preferential flow paths [24]. Cheng et al. [15] developed a comprehensive EGS model, and conducted numerical simulations showing that when the permeability of the surrounding formations approaches that of the reservoir, the working fluid can readily leak into the adjacent strata under injection pressure, resulting in substantial fluid loss. Notably, when the permeability ratio between the reservoir and the surrounding formations exceeds 10:1, the fluid loss rate can surpass 80%. Zeng et al. [25] further demonstrated that, even under gravitational effects, significant preferential flow channels can form from the reservoir to the overlying caprock, directing fluids into non-heat-exchange regions. Their results indicated that as the permeability ratio of the caprock to the reservoir increases from 1 × 10−³ to 1, more than 30% of the injected fluid can directly escape without sufficient heat exchange, leading to a reduction in heat extraction efficiency of over 20%. In addition, Taron and Elsworth [26], using thermo-hydro-mechanical-chemical (THMC) coupled model, showed that high-pressure injection can induce shear slip, microfracture propagation, or chemical dissolution in the surrounding rock, dynamically increasing its permeability. As a result, previously “sealed” formations may be activated as new flow channels, further amplifying fluid loss. Collectively, these studies highlight that the permeability contrast between the reservoir and surrounding formations not only significantly alters the distribution of fluid migration pathways, but also acts as a major control on the evolution of flow paths and the occurrence of fluid loss.
Although previous studies have preliminarily revealed the mechanisms of fluid loss from the perspective of formation permeability contrast, fluid loss rates still exhibit significant variation under different operational conditions [15]. In parallel, many investigations have explored the influence of operating parameters on EGS system performance and have yielded valuable insights. For instance, Li et al. [27] conducted sensitivity analyses on key parameters such as well spacing, injection temperature, and circulation rate, and found that increasing the injection rate can enhance the heat recovery ratio, but also accelerate thermal breakthrough and shorten system lifespan. Ma et al. [28] employed a coupled thermal–hydraulic EGS model to evaluate the combined effects of injection flow rate and temperature on the heat extraction ratio and system stability. Their results showed that increasing the injection flow rate from 80 to 160 kg/s improved the recovery ratio from 57.6% to 84.7%, whereas increasing the injection temperature from 10°C to 20°C reduced the heat extraction ratio from 77.7% to 71.8%. Furthermore, Yin et al. [29] developed a coupled THM model to examine the effects of varying injection pressure, and reported that raising the maximum injection pressure from 34 to 40 MPa increased reservoir permeability by approximately 13.45% and improved the total heat extraction by about 3.5 × 10¹4 J. However, most of these studies focus on idealized heat extraction performance without considering fluid loss, and rarely examine how operating parameters interact with fluid loss under conditions of formation permeability contrast. The dynamic evolution of fluid loss and its impact on system efficiency remain poorly understood. Therefore, further investigation is essential to clarify how varying permeability contrasts and operational parameters jointly affect fluid loss, and to uncover their implications for the thermal performance and long-term stability of EGS systems.
To address this issue, a three-dimensional THM-coupled EGS model is developed based on the geological parameters of the GR1 well region in the Qiabuqia area. The model incorporates injection and production wells, and simulates coupled processes of fluid flow, heat transfer, and mechanical response in the HDR reservoir under varying permeability contrasts between the reservoir and the surrounding formations. The internal flow and heat exchange processes within the wellbores from the reservoir to the surface are also simulated. Based on this model, a comprehensive evaluation is carried out to investigate the effects of permeability contrasts and key operating parameters including production pressure, injection rate, and injection temperature, on fluid loss and heat extraction performance during EGS operation. The present study provides an alternative to achieve higher heat-extraction performance in EGS.
Fig. 2 illustrates the configuration of the EGS, which mainly consists of an injection well, a HDR reservoir, the surrounding formations, and a production well. The actual heat extraction process in EGS involves complex multiphysics interactions [29–31]. This study focuses on the coupled THM processes that are involved in practical EGS heat extraction.
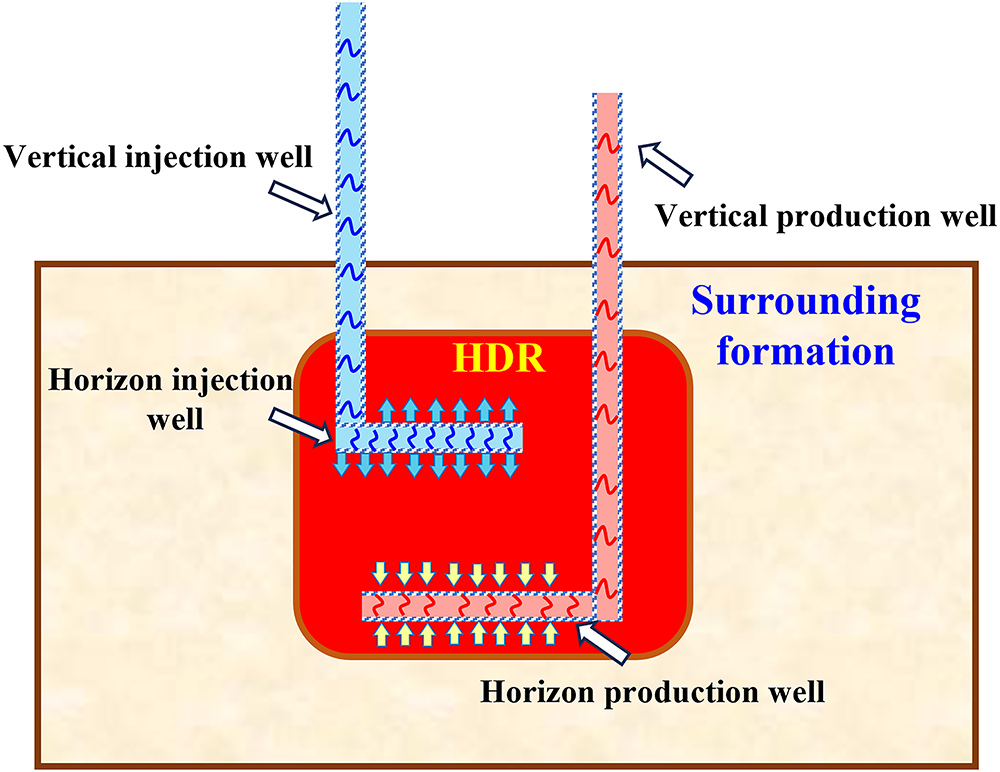
Figure 2: Configuration of the EGS
Specifically, cold fluid is injected from the surface through the vertical section of the injection well and flows laterally into the HDR reservoir. Driven by both the pressure difference between the injection and production wells and gravity, the fluid migrates through the reservoir, absorbing heat from the surrounding rock. The heated fluid then ascends via the vertical section of the production well and is extracted to the surface for geothermal energy utilization. In addition to these transport processes, the model accounts for thermal exchange between the injected/produced fluids and the surrounding formations along the vertical wellbores. Furthermore, it incorporates the coupled mechanical response of the HDR reservoir and adjacent formations under the combined effects of pore pressure, thermal gradients, and in-situ stress, including the resulting evolution in porosity and permeability.
2.2 Numerical Model Assumptions
In this study, water is used as the working fluid for heat extraction. To accurately capture the multiphysics processes occurring within various components of the EGS system during operation, as described in the previous section, a three-dimensional THM coupled EGS model incorporating both injection and production wells is developed. The following assumptions are adopted in constructing the numerical model:
• Injection and production wells: Given that the wellbore diameter is significantly smaller than the dimensions of the HDR reservoir and surrounding formations, the wellbores are treated as one-dimensional line elements. The working fluid within the wells is assumed to be single-phase, with no phase change occurring during flow. Gravity and frictional pressure losses are considered during the flow process. For heat transfer, axial heat exchange between the fluid and surrounding formation is modeled by coupling convective and conductive mechanisms across the wellbore wall, while thermal radiation is neglected [32].
• HDR reservoir and surrounding formations: The HDR and its surrounding formations are modeled as isotropic, continuous porous media with different porosities and permeabilities. Both geothermal gradient and pore pressure gradient along depth are considered. Fluid flow within the porous media is governed by the single-phase Darcy’s law [33]. Heat exchange between the fluid and rock matrix is described as a coupled convective–conductive process based on the local thermal equilibrium assumption and Fourier’s law. The thermal radiation is neglected. Mechanically, under the assumptions of small deformation and linear elasticity, the stress–strain behavior of the reservoir–formation system is described using a quasi-static equilibrium framework that linearly superimposes the effects of pore pressure, thermal expansion, and gravity. Meanwhile, the thermophysical properties of water are treated as functions of both temperature and pressure [34], and chemical interactions between water and the rock matrix within the HDR and surrounding formations are neglected.
2.3 Governing Equations in HDR Reservoir
Based on the aforementioned assumptions, the governing equations of the THM coupled model for EGS are presented in this subsection.
The mass and momentum conservation equations in the HDR and surrounding formations are expressed as follows [35]:
where, ρf is the density, S is the storage coefficient, p is the pore pressure, k is the permeability of solid rock matrix, η is the water viscosity and
The heat transfer process in the HDR and surrounding formations is described by the following energy conservation equations [36]:
where,
The stress distribution in the solid formation is influenced by pore-pressure, temperature variation, and ground stress; the deformation and geometric equations can be formulated as follows [37]:
where E is the Young’s modulus, ν is the Poisson’s ratio, ui,j denotes the displacement gradient, p,i is the gradient of pore pressure, αT is the thermal expansion coefficient, Ts,i represents the temperature gradient. Fi is the body force component, and εi,j is the strain tensor.
The static equilibrium equation can be expressed as [38]:
where
In geothermal reservoirs, porosity is a dynamic property that changes with deformation induced by crustal stress, fluid pressure, and temperature. It is, therefore, imperative to treat it as a variable rather than a constant in computational models to avoid substantial inaccuracies [39]. Porosity is defined as:
where VP and VB denote the total volume of the rock mass and the volume of the rock mass skeleton, respectively.
The strain increment of rock mass skeleton is made up of two components: the strain increment caused by fluid pressure compression of rock mass skeleton and the thermal strain increment caused by thermoelastic expansion [40]. It can be described as:
where Ks is the bulk modulus of the solid grains.
Then, by substituting Eq. (9) into (8) and integrating both sides, the porosity correction model is derived as follows:
where φ0 is the initial porosity of the solid rock matrix. p0, T0, and εV0 denote the initial pore pressure, temperature, and volumetric strain, respectively. This correction model aims to describe the continuous evolution of porosity under the combined effects of thermal stress, pore pressure, and mechanical deformation, which together determine the spatial heterogeneity of permeability and heat transfer efficiency during the production phase.
Based on the cubic law, the correction model for the permeability of the HDR and surrounding formation can be further derived as [40]:
where, k0 is the initial permeability.
2.4 Governing Equation in Vertical Borehole
Working fluid flow in vertical injection and production wells is modeled using the Navier–Stokes equations, and the viscous shear-induced pressure losses are explicitly included. The governing equations are expressed as follows [32]:
where w is the axial velocity of the working fluid in the vertical well. fD is the Darcy friction factor, which is determined based on the effective well diameter d and the corresponding Reynolds number Re [41].
The energy conservation equation for the working fluid in vertical injection and production wells, including the effects of pressure work, is expressed as:
where λ is the thermal conductivity, Af is the cross-sectional area of the flow region, calculated from its flow diameter df. Qwall represents the heat exchanged between the working fluid and the surrounding formation along the vertical well. The detailed equations can be found in our previous study [41].
This subsection provides a detailed description of the specific performance index employed in this study to enable quantitative evaluations of fluid loss and heat extraction performance.
The annual average fluid loss rate and cumulative fluid loss rate are adopted to quantitatively characterize fluid loss behavior under conditions of permeability contrast between the reservoir and the surrounding formations. The corresponding formulations are given as follows [42]:
where
The heat extraction performance of the EGS system is quantitatively characterized using production temperature, heat production power, and cumulative heat extraction, as defined by the following equations.
where Pth,i denotes the heat production power in the ith year, and Qth,cum represents the cumulative heat extraction over N years of operation. hpro,i and hinj,i denote the specific enthalpies of the produced and injected water in the ith year, respectively, and Hi is the total operational hours in that year.
2.6 Model Solution and Verification
In this study, the governing equations of the THM coupled model for the EGS reservoir and the flow–heat transfer model within the vertical wellbores are discretized using the finite element method (FEM). The complete simulation is executed in two main stages: (i) computation of the initial fields and in-situ stress equilibrium; and (ii) full-process simulation of the injection, heat extraction, and production operations. All simulations are performed using the PARDISO direct solver embedded in COMSOL Multiphysics 6.2. Furthermore, in the process of solving the THM coupled model, as well as in the post-processing stage following the extraction of heat, the thermophysical properties of the working fluid are determined by interfacing with the CoolProp database upon the calculation of temperature and pressure. Subsequently, the system performance metrics described in Section 2.4 are calculated using MATLAB R2023b.
Due to the high complexity of experimentally realizing coupled thermal, hydraulic, and mechanical boundary constraints, analytical and laboratory validation of a full 3D THM process is rarely feasible. To validate the accuracy of the developed THM numerical model, a one-dimensional thermo-consolidation problem is employed as a benchmark case. This problem characterizes the coupled interactions among mechanical deformation, temperature variation, and fluid flow in a saturated porous medium, and serves as a classical benchmark for verifying coupled THM processes. The analytical solution to this problem was provided by Bai [43].
The corresponding numerical solution is obtained using the THM coupled model developed in this study. The computational domain is defined as a rectangular region measuring 2 m in width and 7 m in length. The initial temperature and pore pressure are set to 283.15 K and 1000 Pa, respectively. A constant temperature of 333.15 K, an inlet pressure of 0 Pa, and a vertical compressive stress of 1000 Pa are applied at the top boundary. The lateral and bottom boundaries are assumed to be adiabatic and impermeable, with roller supports imposed for mechanical constraints. The domain configuration and boundary conditions are illustrated in Fig. 3, and the key model parameters are summarized in Table 1.
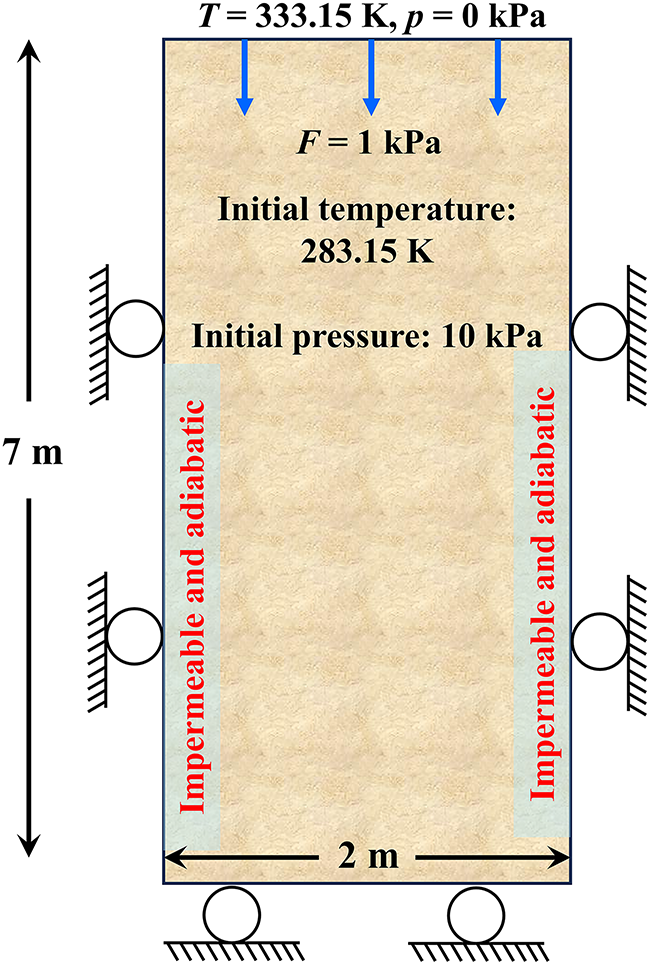
Figure 3: Illustration of the 1D thermal consolidation problem
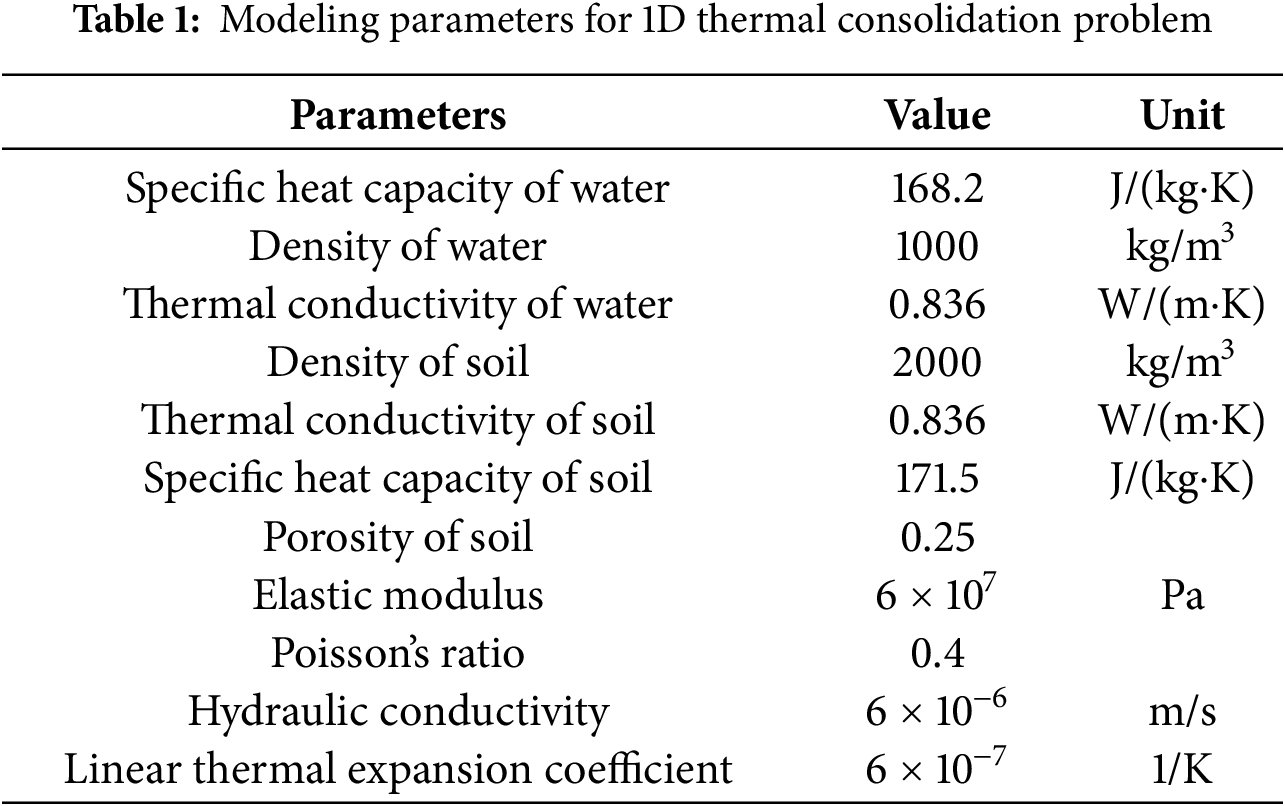
Fig. 4 compares the analytical solutions provided by Bai [43] with the numerical results obtained from the present THM coupled model in terms of temperature, pore pressure, and displacement. The results demonstrate excellent agreement, with relative errors for all three variables remaining within 1%. Specifically, the maximum deviations for temperature, pore pressure, and displacement are 0.85%, 0.92%, and 0.78%, respectively. These findings further validate the accuracy and reliability of the THM coupled model employed in this study for describing the THM coupled process involved in EGS.
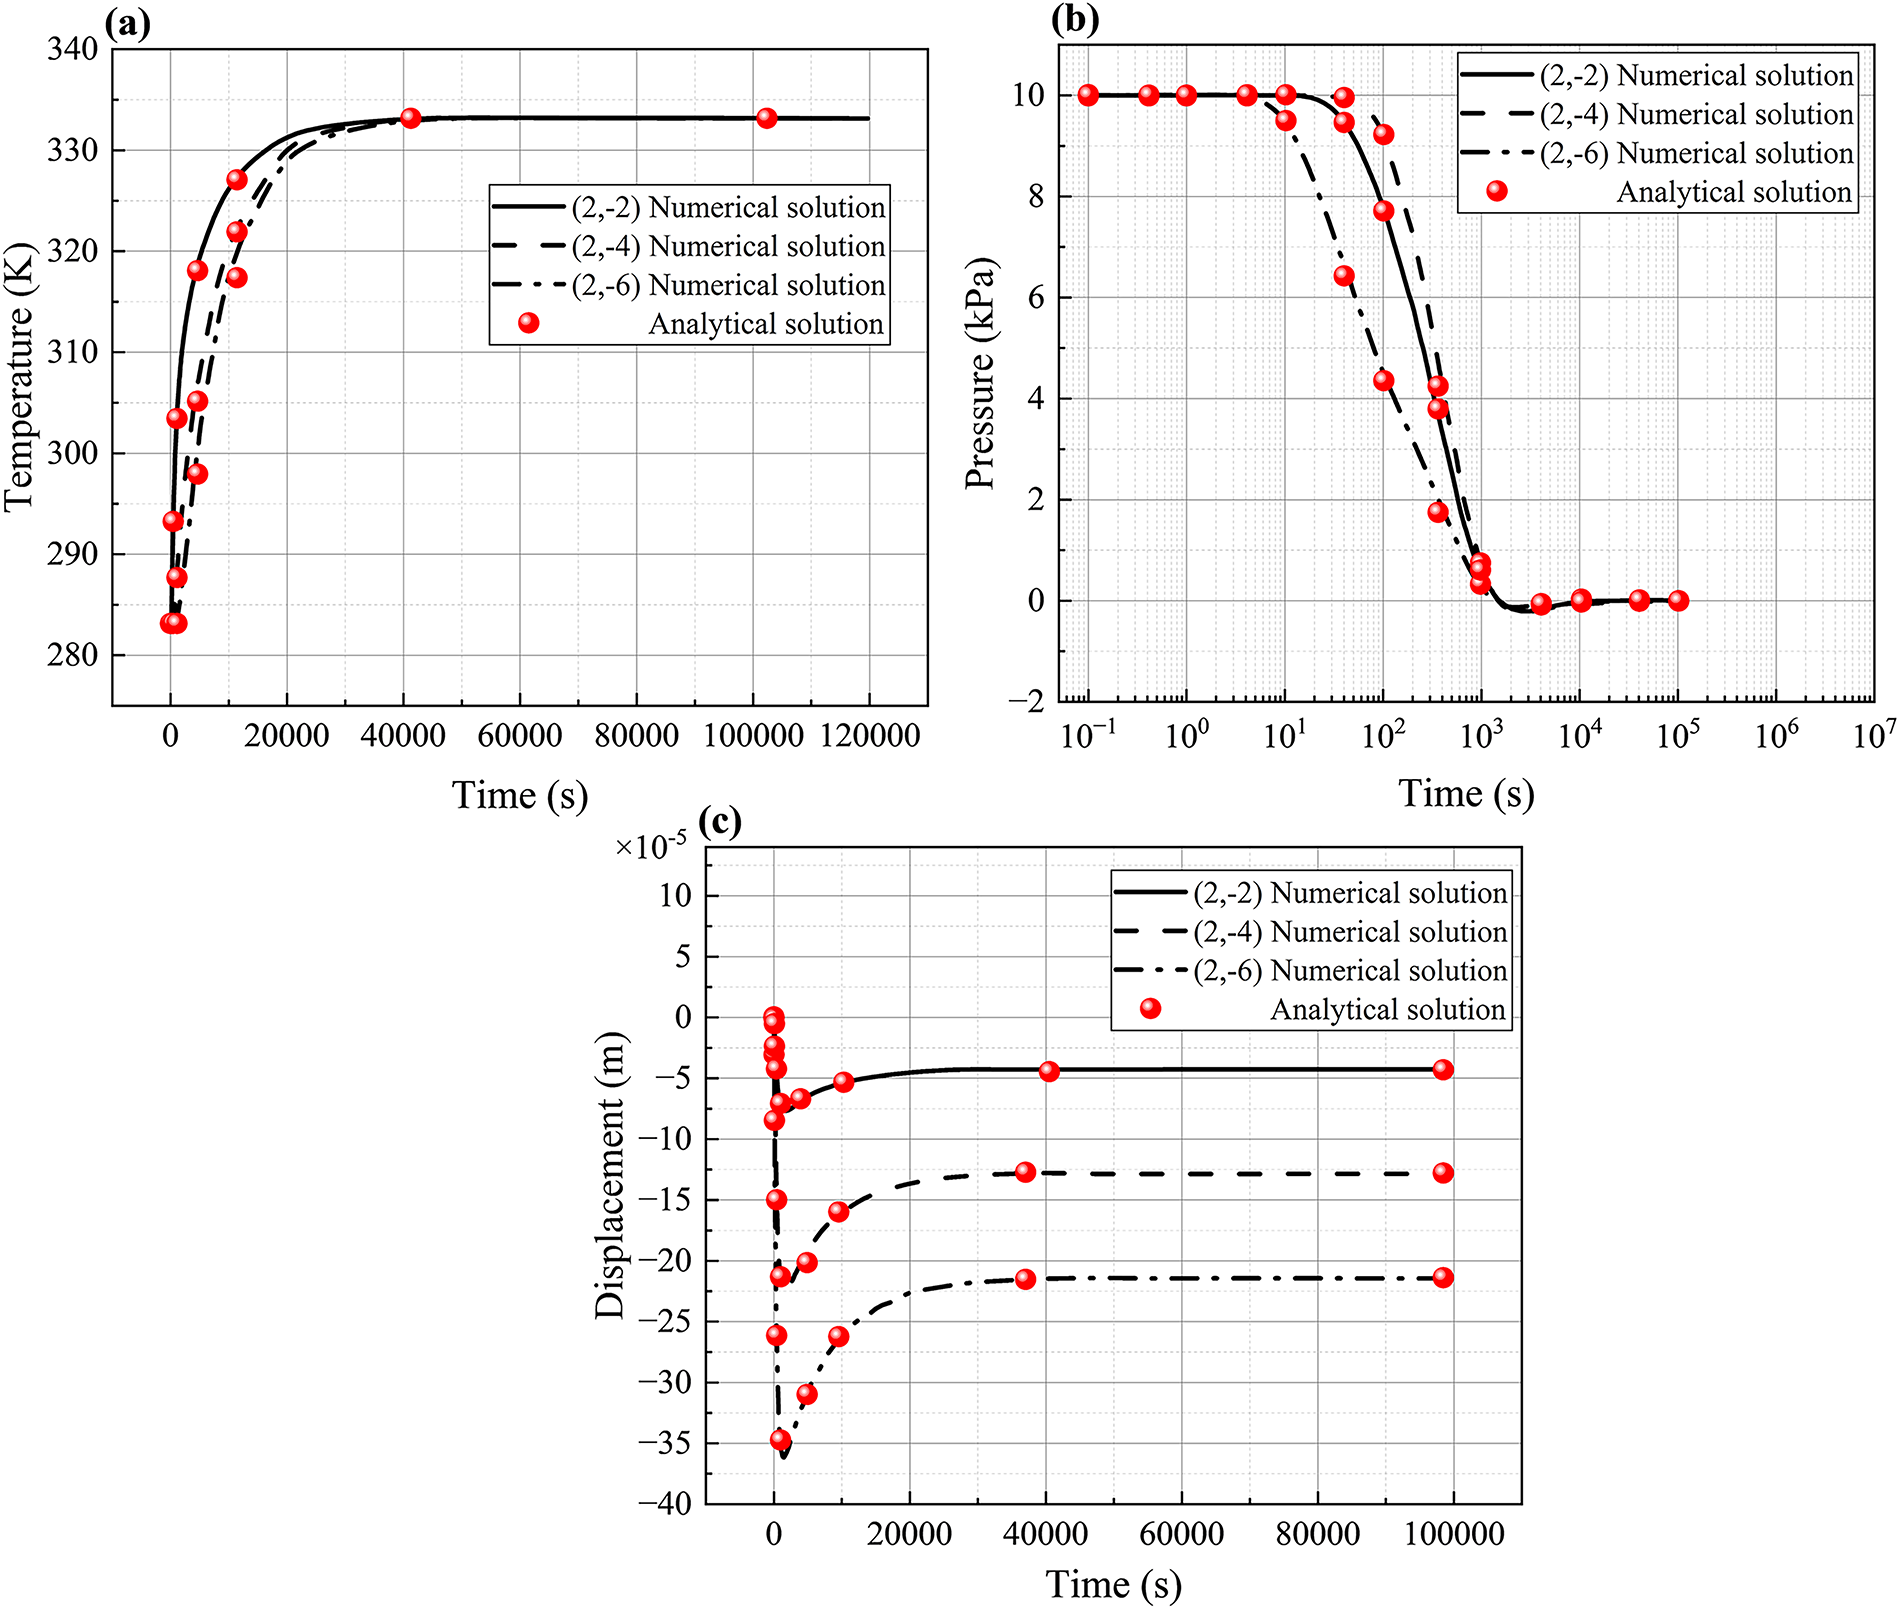
Figure 4: Comparison of analytical and numerical solutions for the one-dimensional consolidation problem: (a) temperature; (b) pore pressure; (c) displacement
3 A practical EGS Project Case
The Qiabuqia region, located in the central part of the Gonghe Basin in Qinghai Province, covers an area of approximately 15,200 km² and serves as one of China’s key demonstration zones for EGS development [44]. Notably, this area possesses rich geothermal resources, as evidenced by the GR1 well, one of the most prominent exploratory boreholes. The well reaches a depth of 3705 m and records a bottom-hole temperature of up to 509.15 K. Based on well logging and geothermal gradient data, the vertical geothermal profile exhibits a distinct three-layer structure: 5.0–6.3 K/100 m within the Quaternary–Neogene sedimentary strata (0–1300 m), 3.0–4.2 K/100 m in the dense granite layer (1300–2900 m), and 5.4–7.1 K/100 m in the plagiogranite formation (2900–3705 m) [45,46]. As one of the deepest and hottest HDR exploration wells drilled in China to date, GR1 demonstrates exceptional potential for geothermal exploitation.
In this study, a three-dimensional THM coupled EGS model is developed for the purpose of investigating the GR1 well and the surrounding reservoir–formation. The values of the geometrical properties of the reservoir and spacing between wells referenced from those employed in previous numerical studies on typical EGS projects [38,47]. Therefore, as illustrated in Fig. 5, the HDR reservoir is defined as a cubic domain measuring 500 m × 500 m × 500 m, located within the depth interval of 3205–3705 m. The surrounding formation extends 250 m above and below the HDR zone along the z-axis, while the well configuration consists of a horizontal injection well placed 50 m below the top of the reservoir, a horizontal production well located 400 m apart, and a pair of vertical injection and production wells that penetrate from the surface to 100 m inside the reservoir boundary.
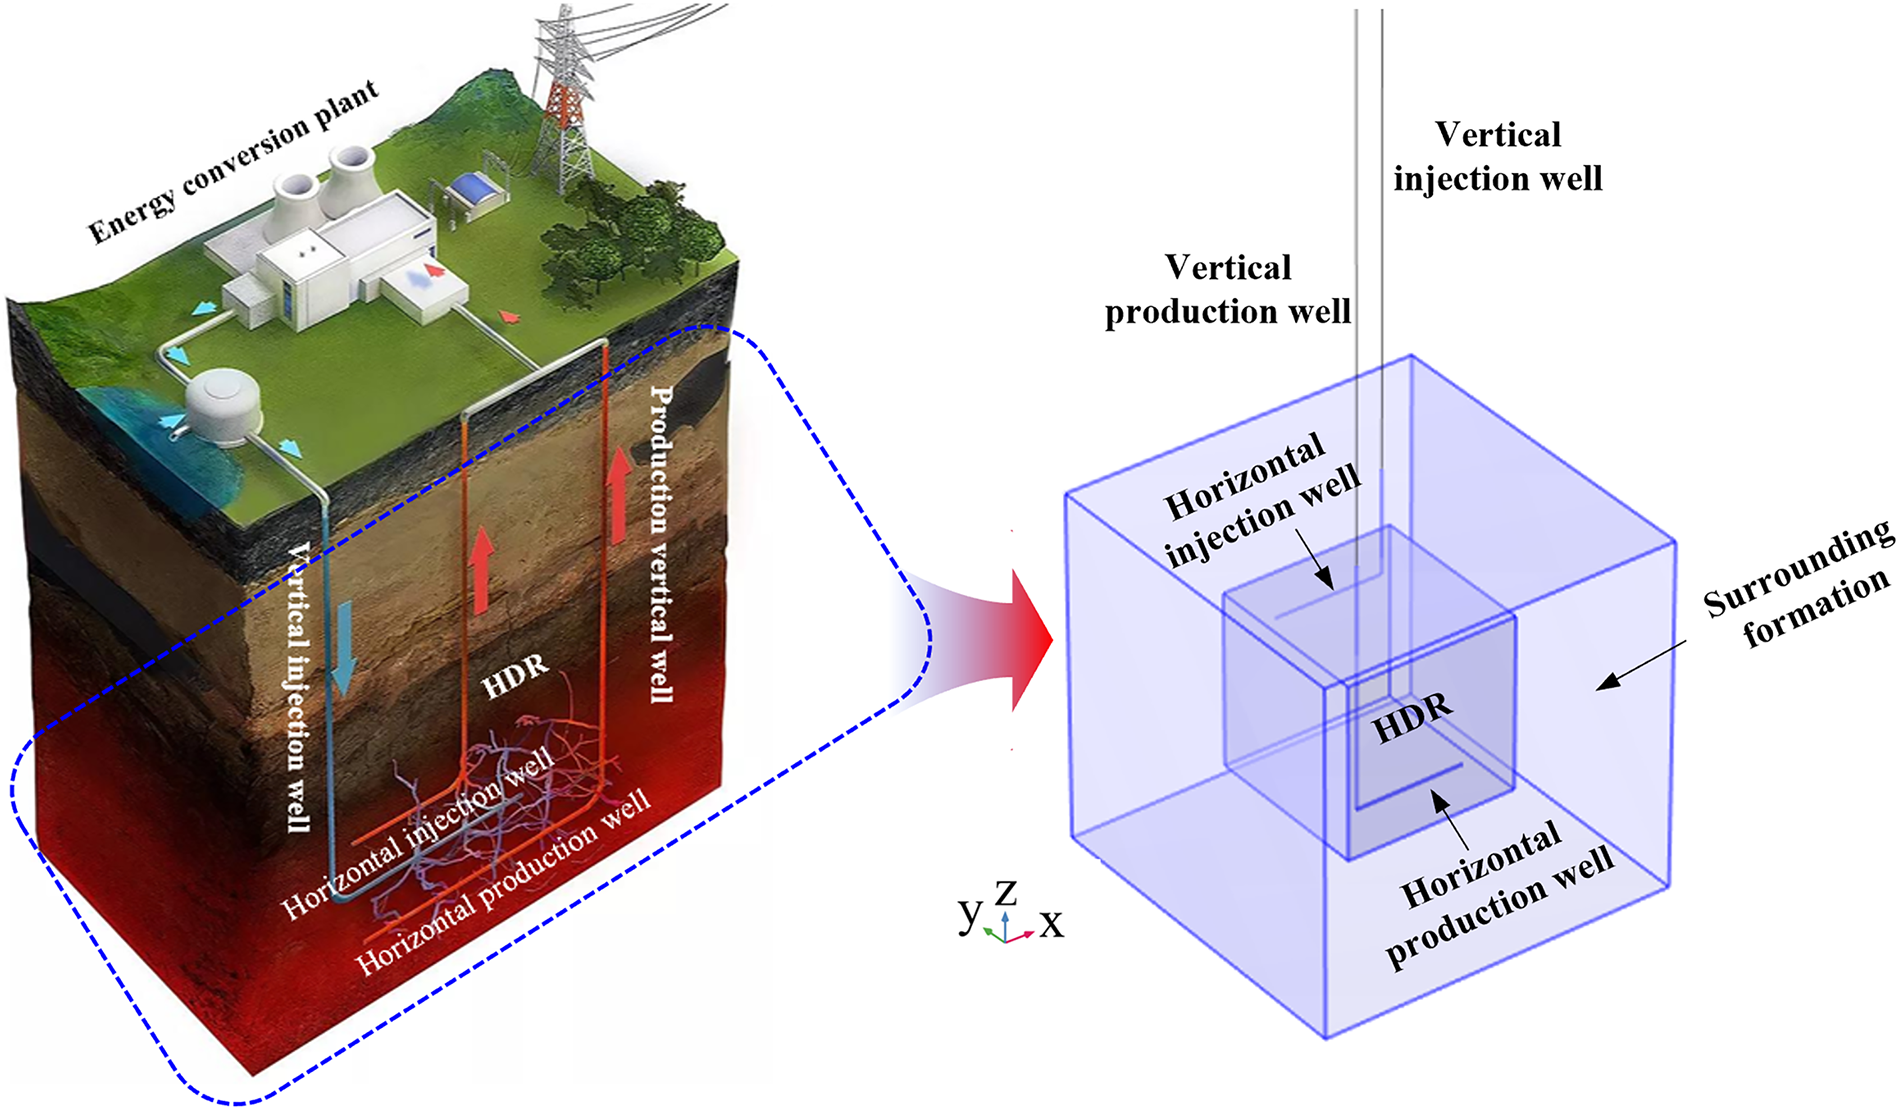
Figure 5: Geological model of the GR1 reservoir
It should be noted that when calculating the temperature distribution of HDR reservoirs, if the surrounding formation are not sufficiently large, boundary temperatures will significantly affect the internal thermal field. we introduce a geometric scale factor fg that uniformly enlarges the formation cube relative to the reservoir cube and further conduct a sensitivity test for larger domains. The fg can be expressed defined as:
where Lcube_i represent the length of formation cube and reservoir cube.
Then, we further evaluated formation size factors fg = 1.22, 1.23, 1.24 and 1.25 to conduct a sensitivity test for larger domains, and tracked the relative temperature deviation at the production well within the reservoir.
As shown in Fig. 6, the relative temperature deviation at the production well within the reservoir falls below 1% at fg = 1.24. Therefore, in the subsequent study, the dimensions of the formation in the x and y directions are set to 1.24 times those of the reservoir domain.
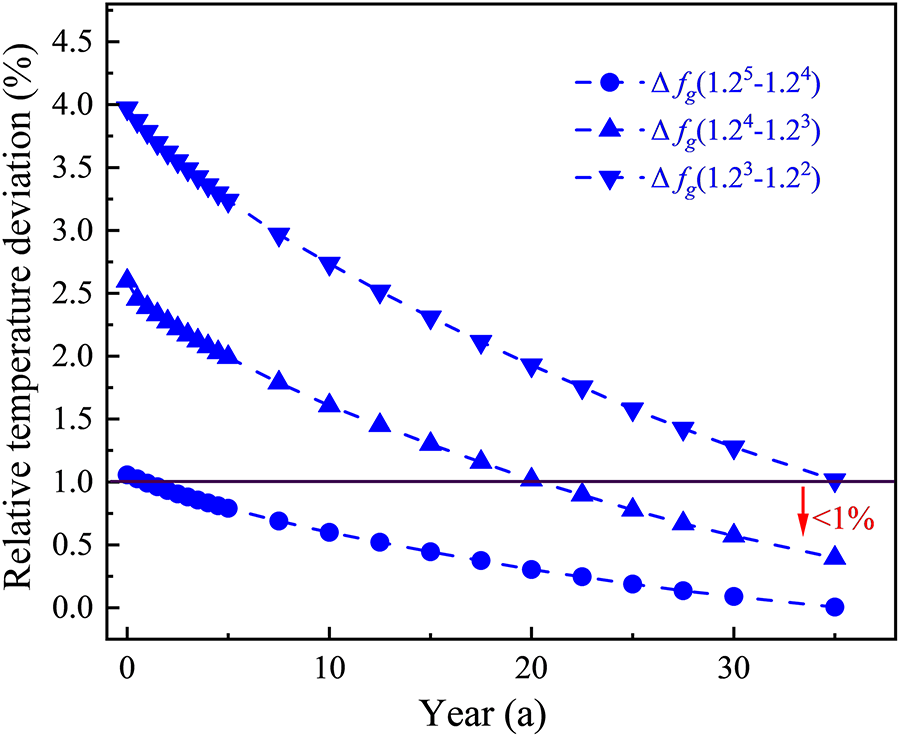
Figure 6: The relative temperature deviation at the production well within the reservoir at varying formation domain sizes
The practical rock properties of formation and HDR are summarized in Table 2. Details regarding the wellbore structure, geometry, and material parameters are provided in Ref. [48].

3.2 Initial Conditions and Boundary Conditions
In this study, the 35-year heat extraction process of the EGS system is simulated based on the geological information described in Section 3.1. The initial temperature field is defined using a piecewise linear geothermal gradient. The surface temperature is set to 296.55 K. And, from the surface to a depth of 2955 m, a gradient of 5.17 K/100 m is applied, while below 2955 to 3955 m, the gradient increases to 7.1 K/100 m. The reservoir is assumed to be fully saturated at the initial state, with a basal pore pressure of 35 MPa and a linear pressure gradient of 9529 Pa/m in the vertical direction. The specific temperature and pressure distributions are as follows:
where z is the depth.
Due to the extremely low permeability and thermal conductivity of the overlying and underlying caprocks, both the top and bottom boundaries of the model are set as no-flow and adiabatic. The remaining external boundaries are defined as pressure and temperature boundaries, with values of T0(z) and p0(z), respectively. To realistically represent the in-situ stress field [48], a vertical stress of 95 MPa is applied at the top boundary, while maximum and minimum horizontal stresses of 85 and 65 MPa are imposed along the y- and x-normal faces, respectively. The remaining lateral faces are constrained using roller boundary conditions.
Based on this setup, multiple sets of key operational parameters are selected for scenario simulation, including the reservoir–formation permeability contrast (κ), production pressure (Ppro), injection flow rate (Qinj), and injection temperature (Tinj), as summarized in Table 3. It should be noted that κ is defined as the ratio of the initial permeability of the reservoir and surrounding formations, which is expressed as:
where, k0,reservoir and k0,formation represent the initial isotropic permeability of reservoir and formation, respectively. Under THM coupling the local permeability evolves, whereas
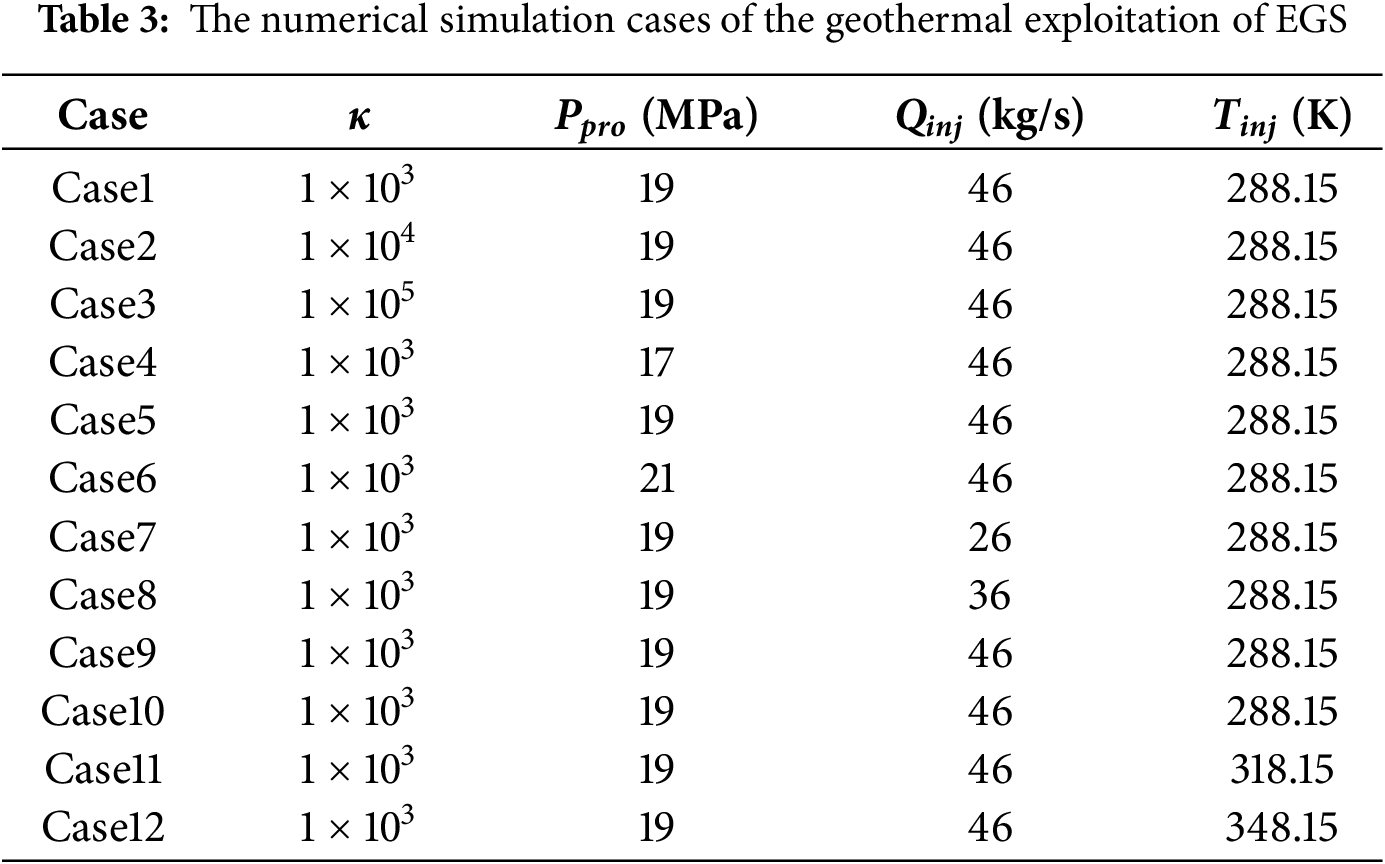
By comparing different operating conditions, this study systematically analyzes the effects of each parameter on fluid loss and heat extraction performance over the 35-year operation period.
In this study, the computational domain consists of a three-dimensional rock matrix, including both the HDR reservoir and the surrounding formation, and one-dimensional wellbores. These components are discretized using tetrahedral and line elements, respectively (see Fig. 7a,b). To verify mesh independence, four levels (Level 1–Level 4) of mesh refinement are applied to both the reservoir and wellbores, corresponding to total element counts of 48,700, 90,800, 168,774, and 264,600, respectively. Fig. 7c presents a comparison of the 20-year production temperature and the associated computation time across all meshing strategies. The results indicate that, while finer meshes significantly increase computational cost, the production temperature stabilizes beyond Level 3. Therefore, Level 3 is adopted for all subsequent simulations to ensure a balance between numerical accuracy and computational efficiency.
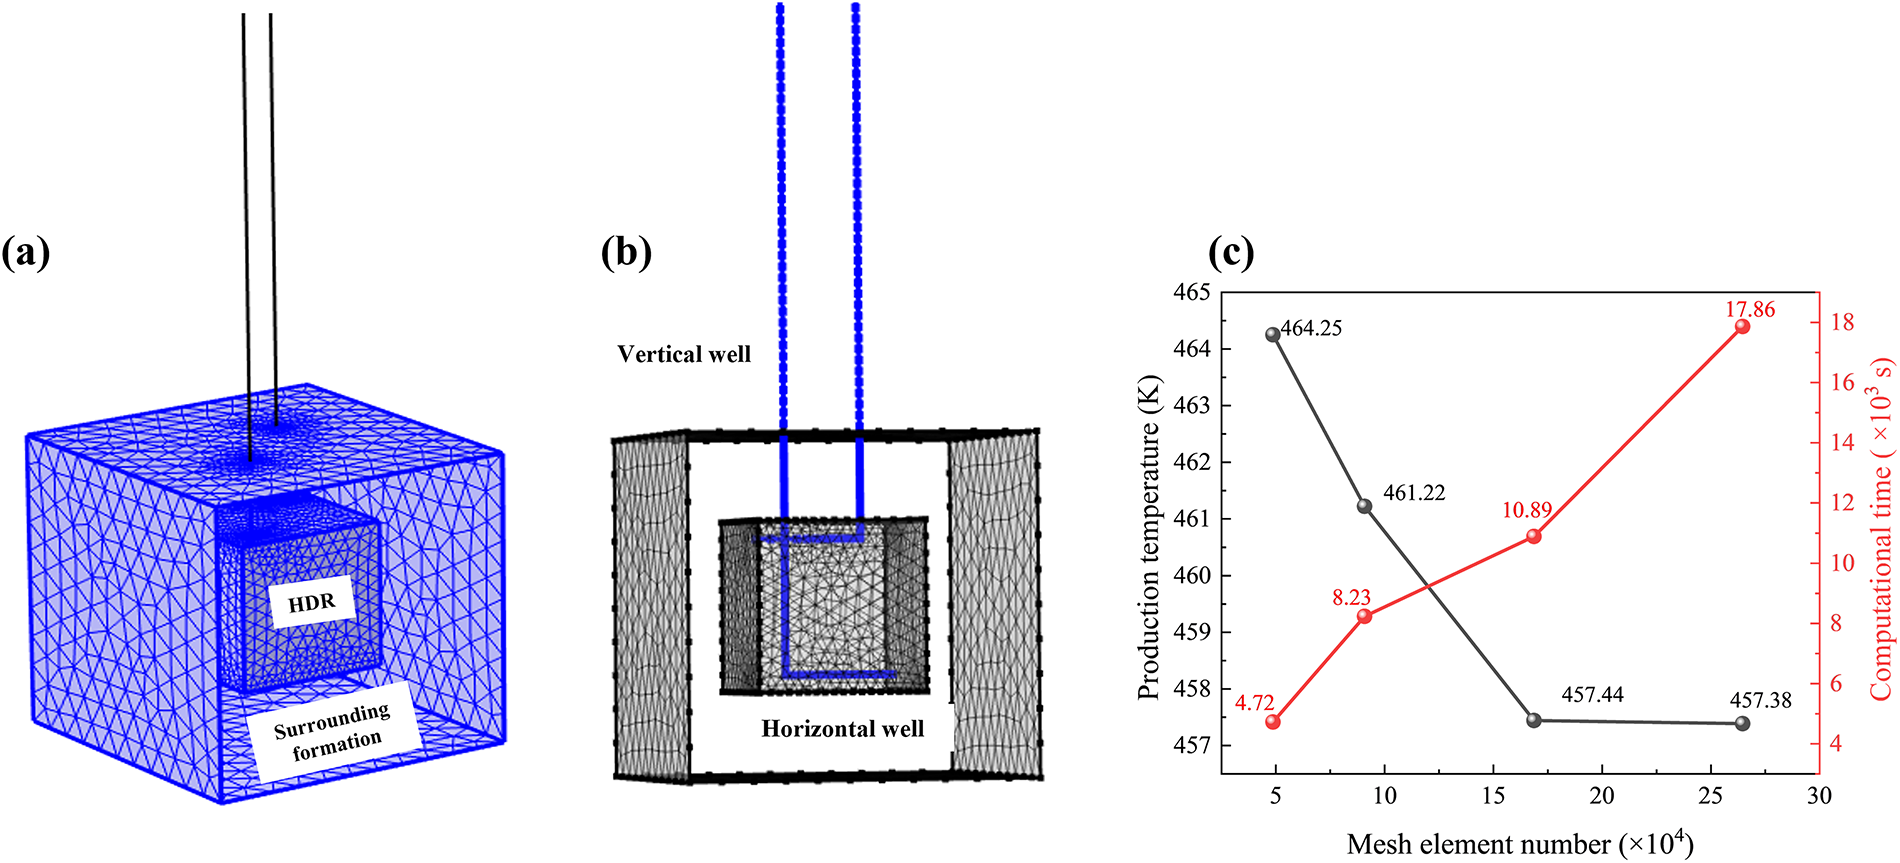
Figure 7: (a) The grid used for HDR and surrounding formation, (b) the grid used for vertical and horizontal wells, (c) production temperature at 20th year and corresponding computational times
In this section, the impact of permeability contrast between reservoir and formation is first examined by analyzing its influence on fluid loss and heat extraction performance in EGS systems. Subsequently, under a fixed permeability contrast, the effects of key operational parameters, including production pressure, injection flow rates, and injection temperature, are systematically investigated in terms of fluid loss and heat extraction performance.
4.1 Effect of Reservoir–Formation Permeability Contrast
In this subsection, the effects of different reservoir–formation permeability contrasts (1 × 10³, 1 × 10⁴, and 1 × 10⁵) on the cumulative fluid loss ratio, the evolution of production temperature, and the variation in cumulative heat extraction over a 35-year operational period are systematically investigated. The corresponding operational conditions are detailed in Table 3.
Fig. 8 illustrates the cumulative fluid loss rates after 35 years of EGS operation under different reservoir–formation permeability contrasts. The results indicate that as the permeability contrast decreases (i.e., the permeability of the surrounding formations increases), the cumulative fluid loss rate rises significantly. Specifically, when the contrast drops from 1 × 10⁵ to 1 × 10³, the loss rate surges from 0.23% to 54.34%, representing a 236-fold increase. This dramatic escalation is primarily attributed to the enhanced pressure gradient between the reservoir and the surrounding formations caused by higher formation permeability, which intensifies fluid leakage into the formation. These findings underscore the critical role of permeability contrast in governing fluid migration behavior and are consistent with the conclusions reported by Cheng et al. [15].
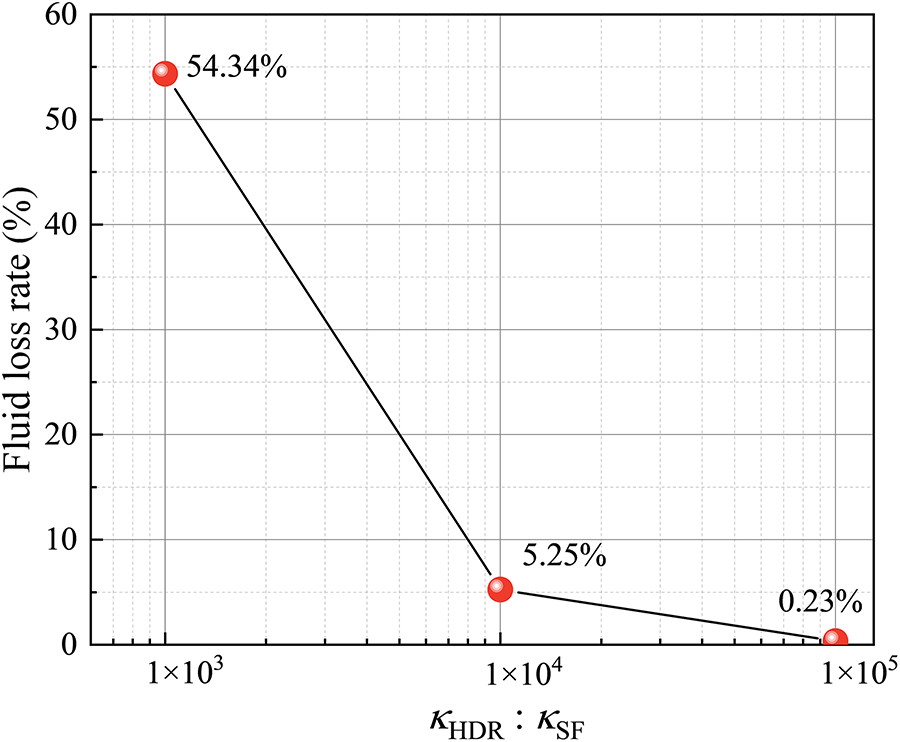
Figure 8: Cumulative fluid loss rate over a 35-year operation period under different reservoir–formation permeability contrasts
Fig. 9a,b illustrates the variations of production temperature and the cumulative heat extraction after 35 years of operation under different reservoir–formation permeability contrasts. It is imperative to elucidate that in this study, the temperature-based breakthrough is defined as the initial production cycle in which the cycle-averaged production temperature declines by ≥1% relative to the average over the three cycles immediately preceding that cycle. As shown in Fig. 9a, the production temperature in all scenarios follows a characteristic “stable–thermal breakthrough–transient” dynamic response pattern: the temperature remains relatively high and stable during the initial phase, followed by a rapid decline triggered by thermal breakthrough. As the permeability contrast increases, the breakthrough occurs significantly earlier, and the temperature decline during the transient stage becomes steeper. In the late stage of operation, the production temperature under high permeability contrast may even fall below that of lower contrast conditions, despite maintaining a higher overall level, particularly during the stable stage.
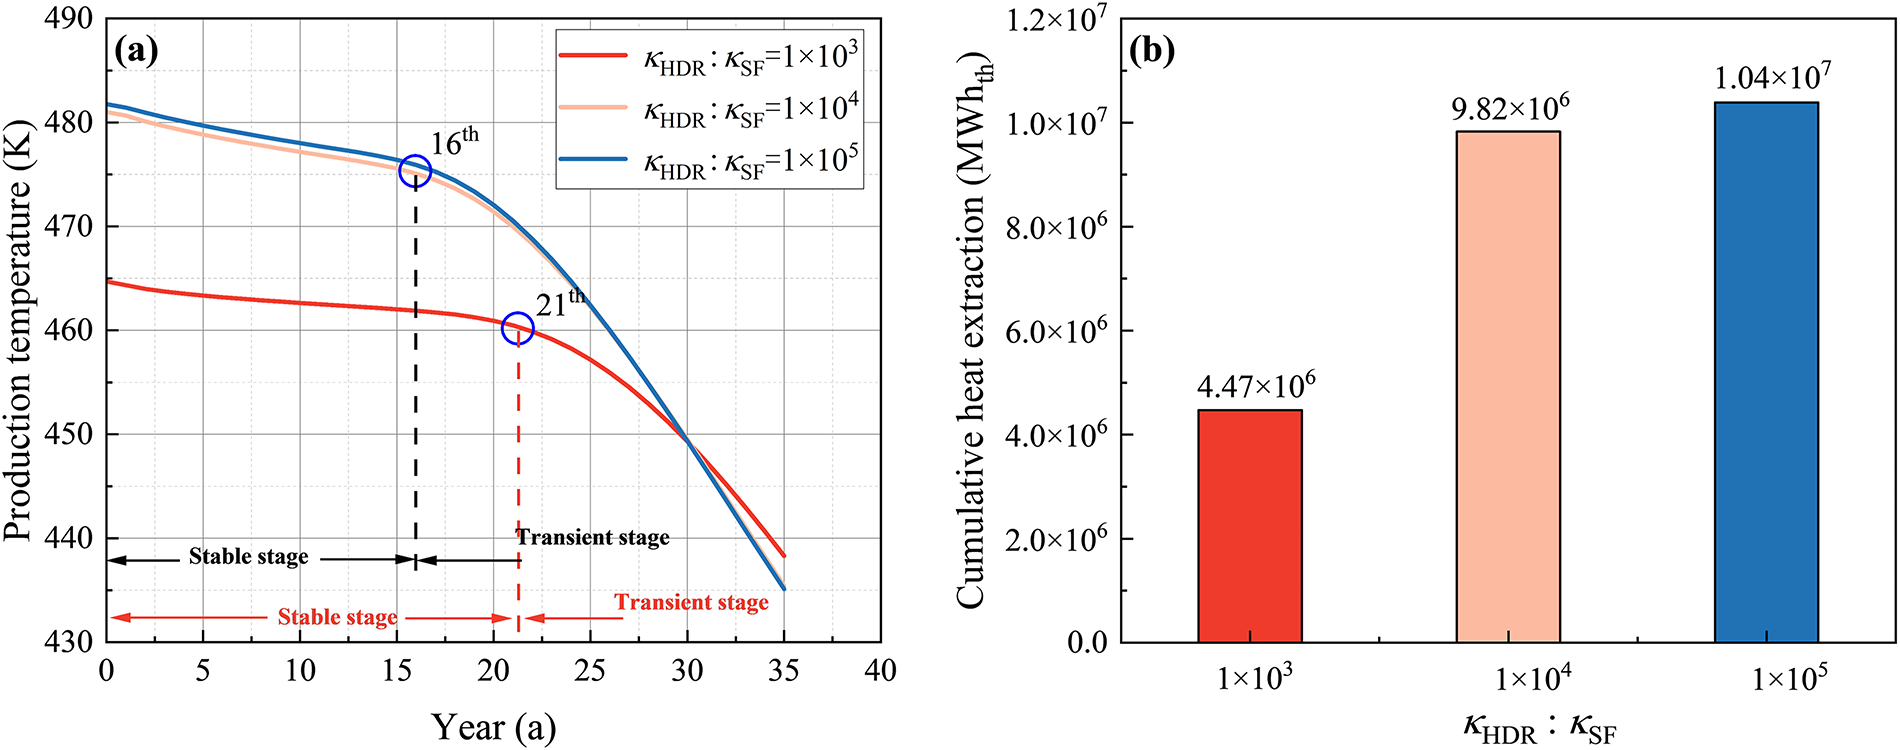
Figure 9: (a) Variations of production temperature over time and (b) cumulative heat extraction over 35 years under different reservoir–formation permeability contrasts
Fig. 9b further indicates that higher permeability contrast leads to a significantly greater cumulative heat extraction output. This improvement is primarily attributed to the restricted fluid migration into the surrounding formation under high contrast conditions, which effectively suppresses fluid loss and enhances both production flow rate and heat recovery efficiency.
Based on the above results, it can be concluded that the reservoir–formation permeability contrast exerts a dual influence on the heat extraction behavior of EGS systems. On one hand, a higher permeability contrast enhances the initial production temperature and overall heat recovery capacity, but it also accelerates thermal breakthrough and shortens the stable operational period. On the other hand, a lower permeability contrast effectively delays thermal breakthrough and extends the thermal utilization lifespan, yet it leads to increased fluid loss rates.
4.2 Effect of Production Pressure
In this subsection, the effects of production pressure (17, 19, and 21 MPa) on the fluid loss and heat extraction performance over a 35-year operational period are systematically investigated. The corresponding operational conditions are detailed in Table 3.
Fig. 10a illustrates the temporal evolution of fluid loss rate over a 35-year operation period under different production pressure conditions. The results indicate that higher production pressures lead to a more rapid decline in fluid loss rate during the early stage of operation. This trend can be attributed to the following mechanism: at the initial stage, a large pore pressure differential exists between the HDR reservoir and the surrounding formations, which drives working fluid to leak from the reservoir into the formation, resulting in a high fluid loss rate. However, as leakage persists, the surrounding formation gradually accumulates infiltrated fluid, thereby reducing the pore pressure gradient between the reservoir and the formation. This attenuation of the driving force for outward leakage causes the fluid loss rate to decline progressively over time. Specifically, when the production pressure is set to 17, 19, and 21 MPa, the cumulative reduction in fluid loss rate over 35 years reaches 6.78%, 9.67%, and 12.48%, respectively.
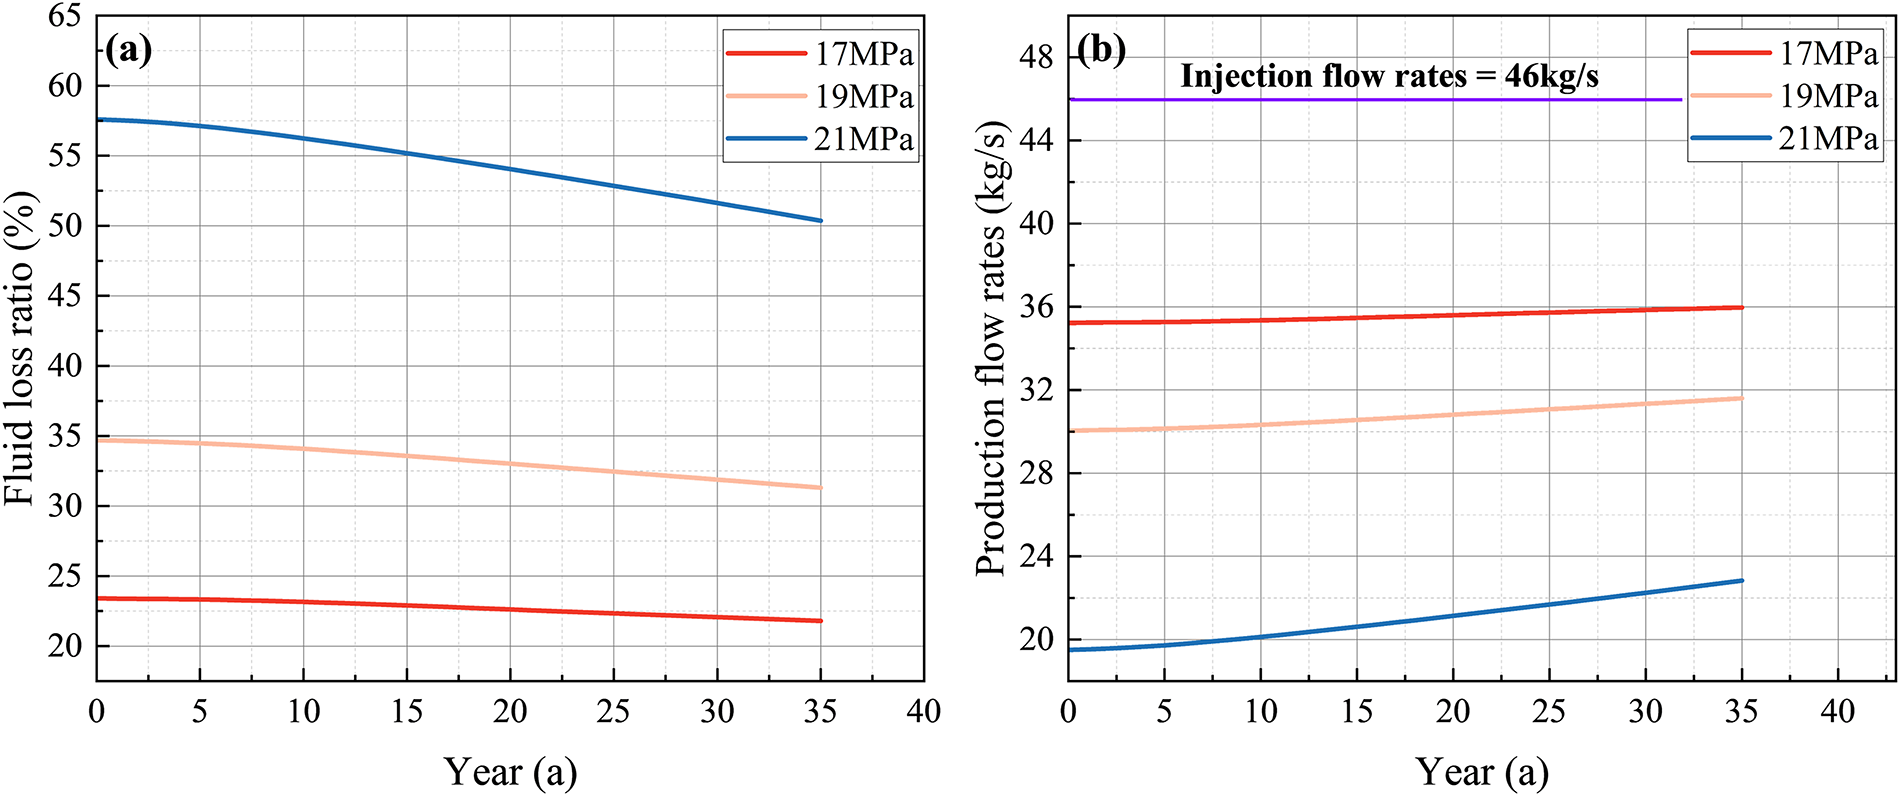
Figure 10: Variations of (a) fluid loss rate and (b) production flow rate over time under different production pressures
Nevertheless, in terms of the overall operational period, increasing production pressure ultimately intensifies the total fluid loss, as shown in Fig. 10a. Fig. 10b further depicts the variation in production flow rate under different conditions. By the 35th year of operation, the actual production flow rate under a 21 MPa condition decreases to only 22.83 kg/s, significantly lower than the 35.97 kg/s observed under the 17 MPa condition.
To further elucidate the physical mechanism underlying the increase in fluid loss with higher production pressures, Fig. 11a–c presents the pressure distribution and equipotential pressure contour maps within the reservoir after 35 years of operation under different production pressures (17, 19, and 21 MPa). The results reveal that as production pressure rises, the equipotential lines around the production well become markedly denser, reflecting a steepened pressure gradient between the reservoir and the surrounding formations. This steepened gradient enhances the driving force for lateral fluid migration, promoting the expansion of leakage pathways and leading to greater overall fluid loss.
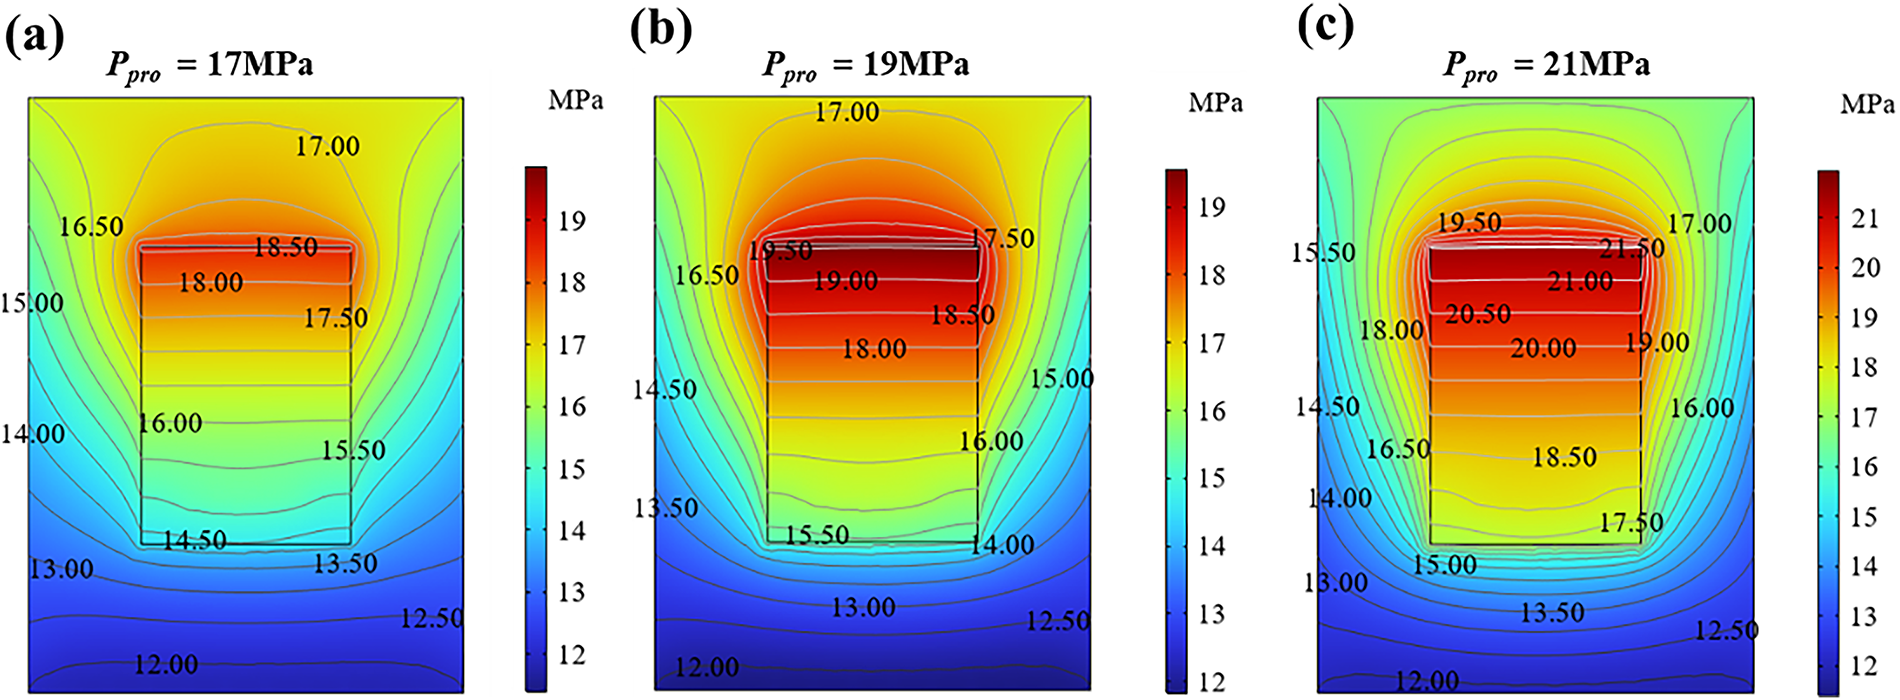
Figure 11: Pressure distributions within the reservoir after 35 years of operation under different production pressures: (a) Ppro = 17 MPa, (b) Ppro = 19 MPa and (c) Ppro = 21 MPa
These findings quantitatively and visually confirm that the observed increase in fluid loss with production pressure is primarily governed by the evolution of local pressure gradients and associated leakage dynamics near the production well.
Fig. 12a illustrates the variation of production temperature under different production pressure conditions. The results indicate that all cases exhibit a typical dynamic response mechanism: an initial stable stage, followed by a transient stage characterized by a rapid temperature decline after the occurrence of thermal breakthrough. Notably, as the production pressure increases, the onset of thermal breakthrough is progressively delayed, and the rate of temperature decline during the transient stage becomes slower. However, this benefit is accompanied by a reduction in the average production temperature during the stable stage. It should be noted that in this study, the power-based breakthrough is defined as the initial production cycle in which the cycle-averaged heat-production power declines by ≥1% relative to the average over the three cycles immediately preceding that cycle. Fig. 12b further presents the variation of heat production power under different production pressure conditions. The results reveal that increasing the production pressure significantly reduces the heat production power of the EGS system. In addition, compared to the production temperature, the critical thermal breakthrough point of heat production power exhibits a noticeable time delay.
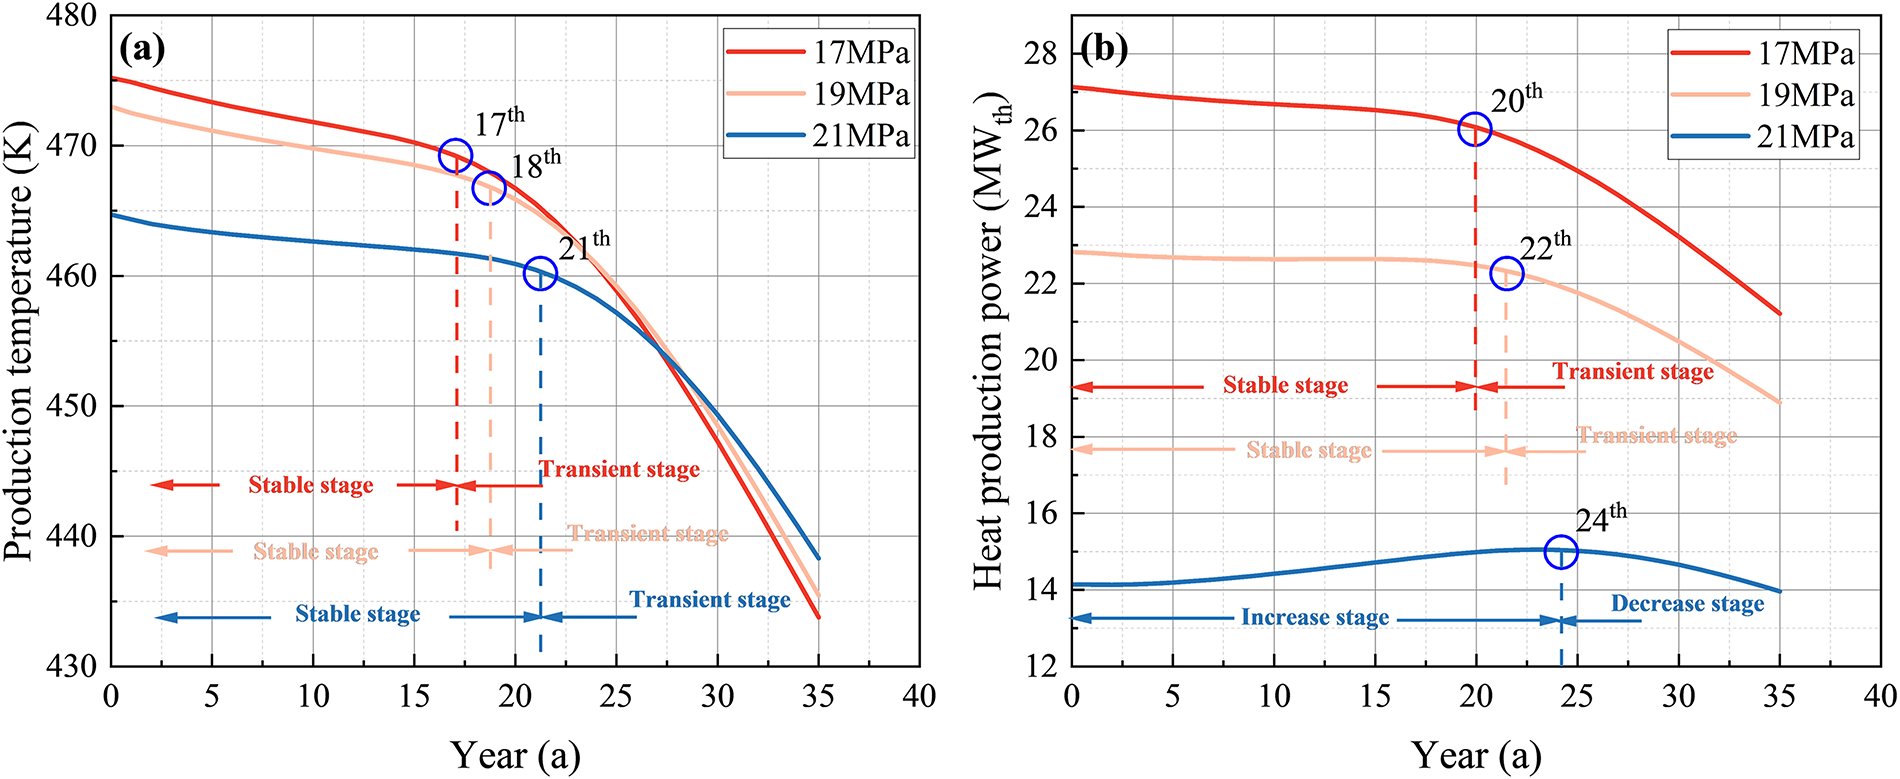
Figure 12: Variations in (a) production temperature and (b) heat production power over time under different production pressures
From Fig. 12b, it should also be noted that under the 17 and 19 MPa conditions, where fluid loss is relatively limited, the heat production power exhibits a dynamic response pattern synchronized with the production temperature, transitioning from a “stable stage” to a “transient stage.” This indicates that temperature decline is the dominant factor driving the reduction in heat production power. However, under the 21 MPa condition, characterized by significant fluid loss, the overall extraction flow rate is much lower, and its relative rate of increase becomes more pronounced (see Fig. 10b). As a result, the heat production power does not exhibit a typical stable stage prior to thermal breakthrough. Instead, it undergoes an “increase stage” followed by a “decrease stage” triggered by the rapid temperature drop. These observations suggest that, as the effect of fluid loss becomes more pronounced, the dynamic response mechanism of heat production power transitions from a temperature-dominated pattern to a temperature–flow rate coupled mechanism, reflecting more complex thermo-hydraulic interactions within the system.
In summary, under the influence of reservoir–formation permeability contrast, increasing the production pressure accelerates the early-stage decline in fluid loss rate but leads to a higher overall loss, thereby reducing the effective production flow. Meanwhile, higher pressures result in a lower average production temperature. Although elevated pressure delays thermal breakthrough and improves stability, it also reduces overall heat production power and alters its dynamic response from “stable–transient” to an “increase–decrease” trend due to the combined effects of production flow rate and temperature.
4.3 Effect of Injection Flow Rates
In this subsection, the effects of injection flow rates (46, 56, and 66 kg/s) on the fluid loss and heat extraction performance over a 35-year operational period are systematically investigated. The corresponding operational conditions are detailed in Table 3.
Fig. 13a,b illustrates the variations in fluid loss rate and actual production flow rate under different injection flow rate conditions during the 35-year EGS operation. As shown in Fig. 13a, although the injection flow rate has a limited effect on the decline rate of fluid loss, it significantly influences its overall magnitude. A lower injection rate results in a higher average fluid loss, thereby substantially reducing the actual production flow, as seen in Fig. 13b. For instance, under the 66 kg/s condition, the average fluid loss rate is 37.53%, which is 16.81% lower than the 54.34% observed at 46 kg/s. Accordingly, the actual production flow rate at 66 kg/s is nearly 1.96 times that at 46 kg/s.
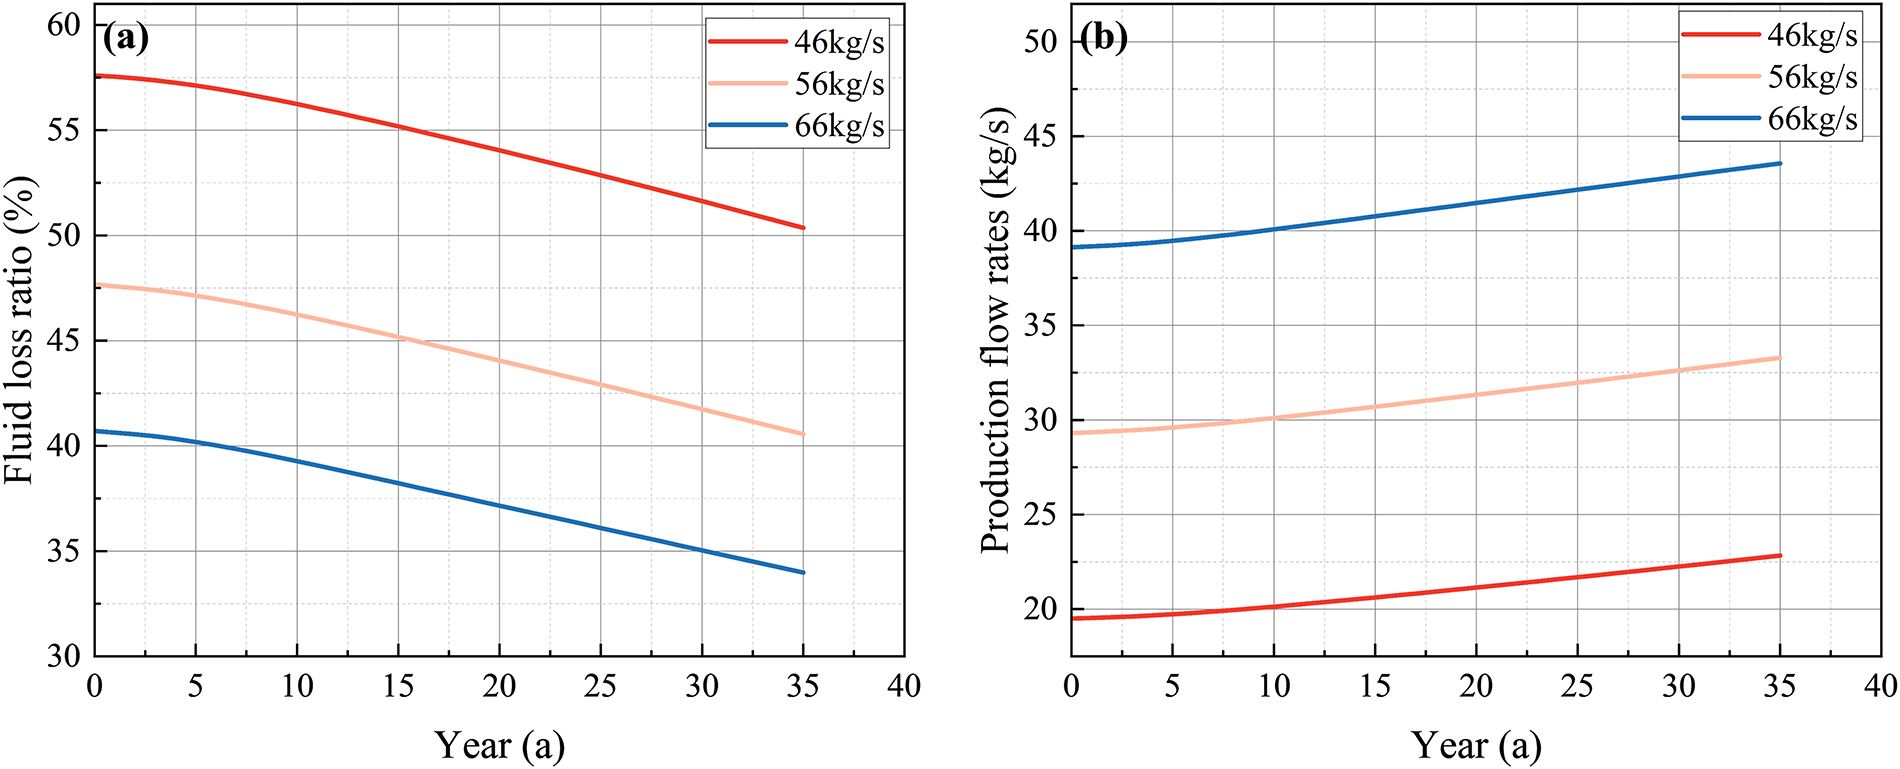
Figure 13: Variations of (a) fluid loss rate and (b) production flow rate over time under different injection flow rates
Fig. 14a presents the variations in production temperature under different injection flow rate conditions during the 35-year EGS operation. The results indicate that while the dynamic response pattern, characterized by a “stable–thermal breakthrough–transient”, remains consistent across all scenarios, increasing the injection flow rate elevates the average production temperature during the stable stage. This improvement arises from reduced conductive heat loss along the vertical wellbore, as higher flow rates shorten fluid residence time and thereby limit thermal attenuation. However, elevated injection flow also significantly advances the thermal breakthrough, accelerates the transition into the transient stage, and intensifies production temperature decline, ultimately impairing long-term thermal performance. This trend is consistent with the findings of Li et al. [27]. For instance, under the 66 kg/s condition, the average stable-stage production temperature reaches 473.94 K—approximately 11 K higher than that of the 46 kg/s case. Nonetheless, the breakthrough time occurs 8 years earlier, and by year 35, the production temperature falls 41.15 K below that of the lower flow scenario, highlighting the thermal efficiency trade-offs associated with high injection rates.
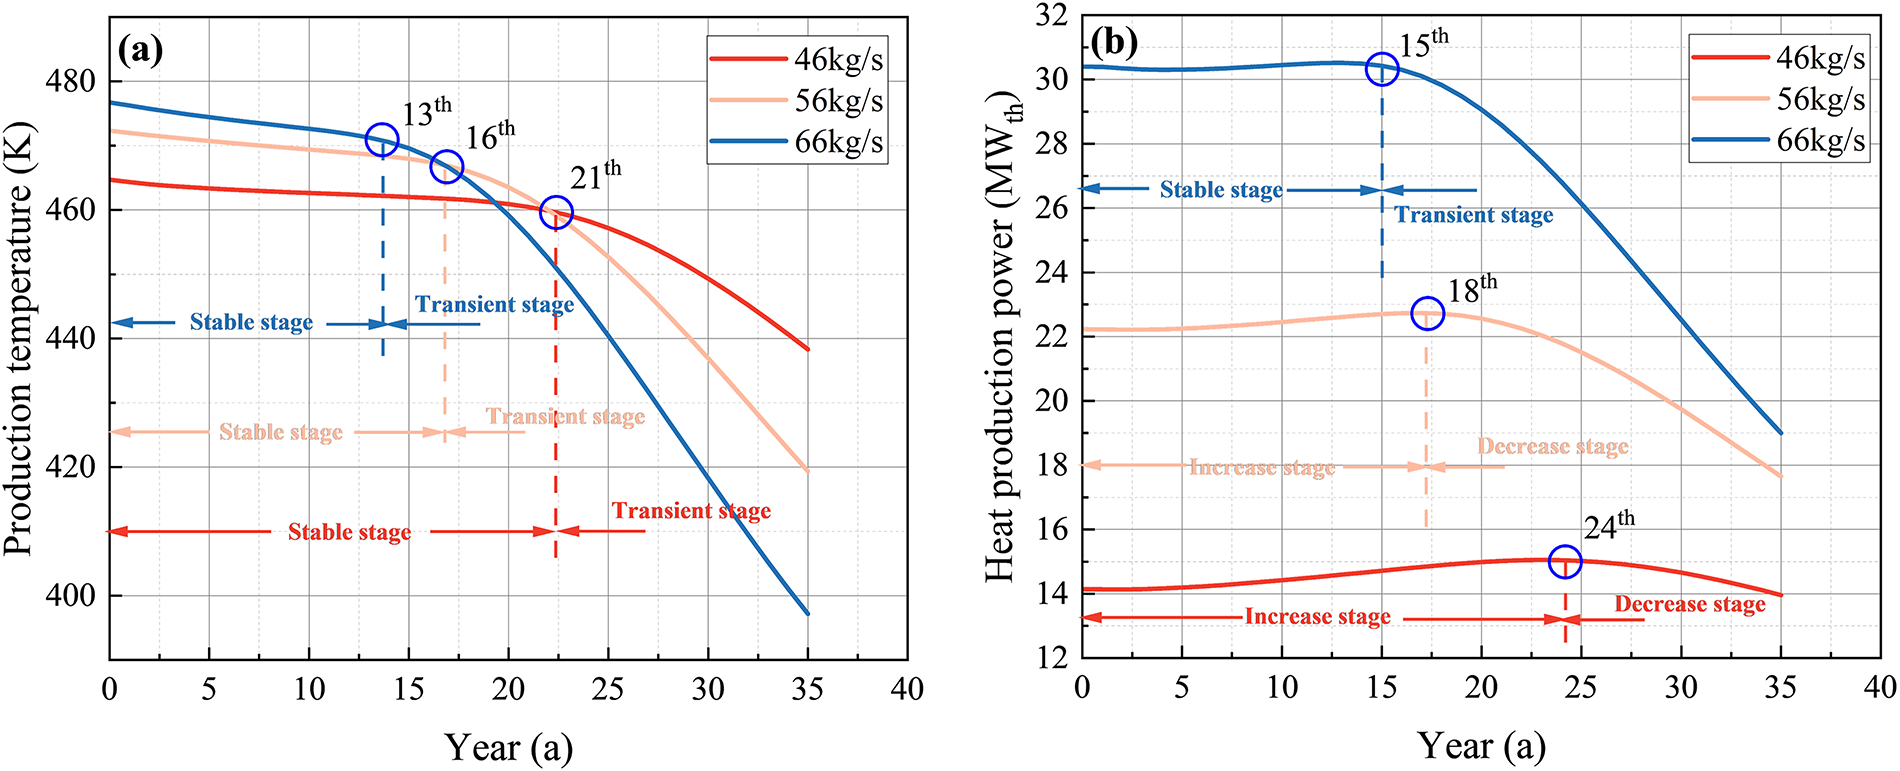
Figure 14: Variations in (a) production temperature and (b) heat production power over time under different injection flow rates
Fig. 14b further illustrates the variations of heat production power under different injection flow rate conditions. The results show that decreasing the injection flow rate leads to a significant rise in fluid loss, thereby shifting the dynamic response of heat production power from a “increase–breakthrough–decrease” pattern to a “stable–breakthrough–transient” pattern, similar to the trend observed in Fig. 11b. In addition, the overall heat production power level drops markedly under low injection flow scenarios due to the reduced production flow rates. However, compared to higher injection flow rates, lower injection flow rates help delay the thermal breakthrough of heat production power, enhancing the operational stability of EGS, for instance, the breakthrough under 46 kg/s is delayed by 9 years compared to that under 66 kg/s.
In summary, under the influence of fluid loss induced by reservoir–formation permeability contrast, reducing the injection flow rate can effectively delay thermal breakthrough and enhance system stability. However, it also intensifies fluid loss and weakens heat production power. Moreover, a lower injection flow rate drives a shift in the dynamic response of heat production power from a temperature-dominated “stable–breakthrough–transient” pattern to an “increase–breakthrough–decrease” pattern governed by both production temperature and flow rate.
4.4 Effect of Injection Temperature
In this subsection, the effects of injection temperature (288.15, 318.15, and 348.15 K) on the fluid loss and heat extraction performance over a 35-year operational period are systematically investigated. The corresponding operational conditions are detailed in Table 3.
Fig. 15a presents the temporal evolution of fluid loss rate under different injection temperature conditions during the 35-year EGS operation. The results indicate that, under the influence of reservoir–formation permeability contrast, injection temperature has a relatively limited effect on fluid loss compared to other key factors such as injection flow rate and production pressure, though its influence is still noticeable. Specifically, lower injection temperatures lead to a faster decline in fluid loss rate, thereby mitigating the extent of fluid loss and contributing to a higher actual production flow rate. This behavior is due to the fact that higher injection temperatures reduce fluid viscosity within the HDR reservoir, facilitating its seepage into the surrounding formation under existing pressure and permeability gradients, and thus aggravating overall fluid loss.
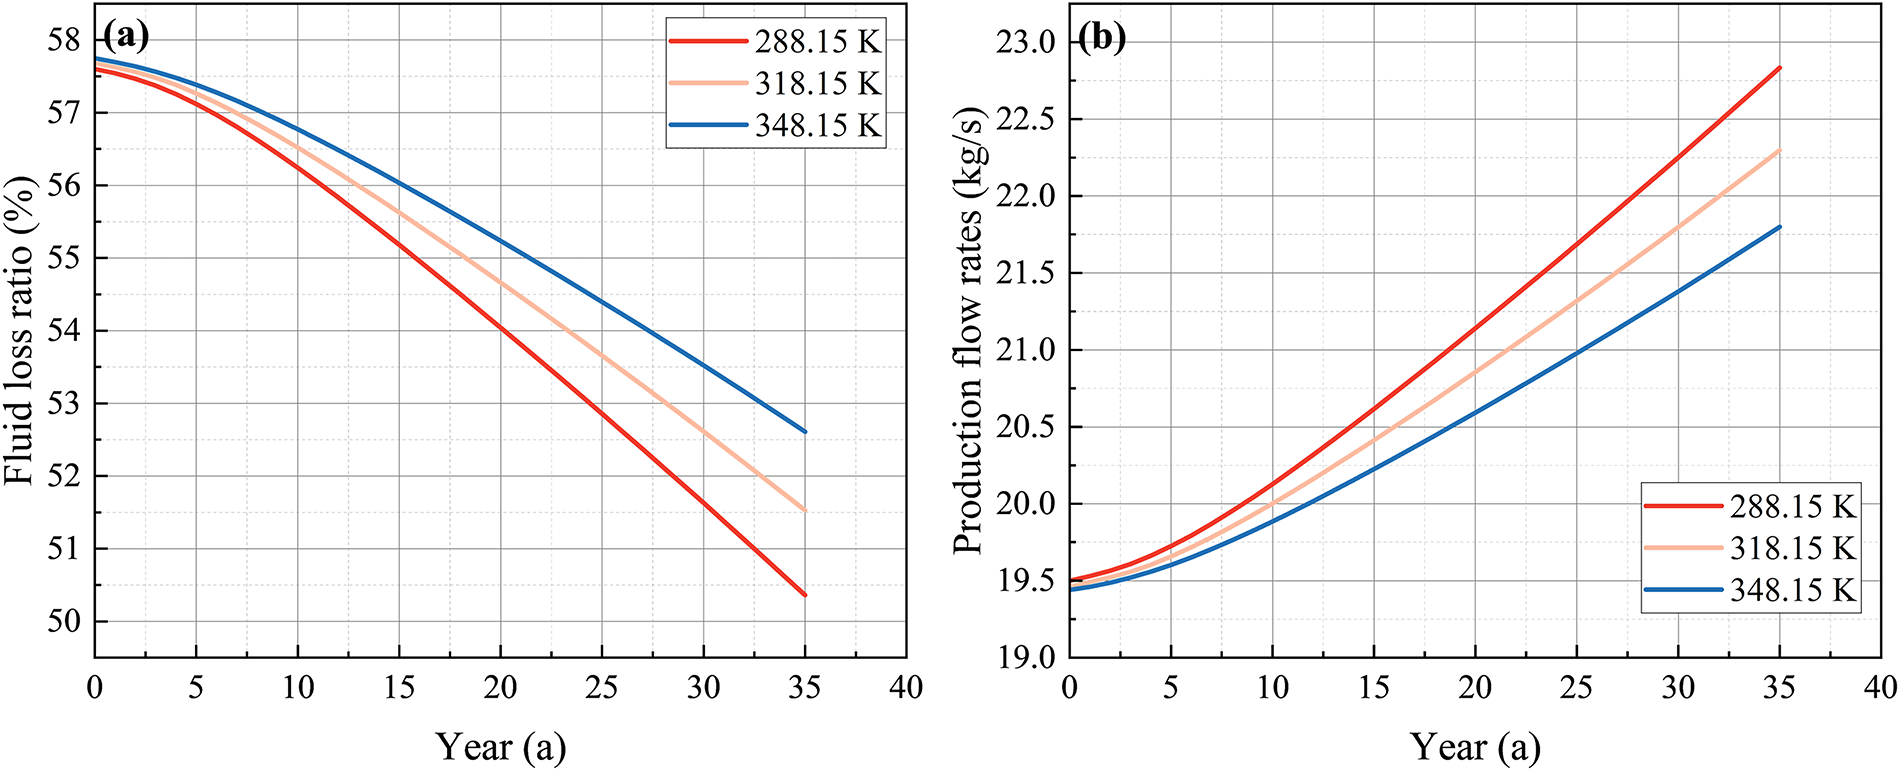
Figure 15: Variations of (a) fluid loss rate and (b) production flow rate over time under different injection temperature
Fig. 15b further illustrates the variations in actual production flow rate under different injection temperature conditions throughout the 35-year EGS operation. The results show that, although the differences in production flow rates are minimal during the initial heating stage, they become progressively more pronounced over time. For instance, by year 35, the production flow rate under the 348.15 K condition is 4.55% lower than that under the 288.15 K case.
Fig. 16a,b shows the variations of production temperature and heat production power under varying injection temperature conditions. As shown in Fig. 16a, changes in injection temperature do not affect the dynamic response pattern of production temperature, which consistently follows the typical “stable–thermal breakthrough–transient” behavior. In contrast, injection temperature has a more pronounced impact on heat production power, as illustrated in Fig. 16b. Under fixed conditions of 21 MPa production pressure and 46 kg/s injection flow rate, all cases exhibit a “increase–breakthrough–decrease” trend, consistent with the results in Figs. 12b and 15b. This consistent trend suggests that injection temperature plays a limited role in altering the fundamental dynamic regime of heat production power. Nevertheless, appropriately lowering the injection temperature can enhance the system’s thermal performance. For example, decreasing the injection temperature from 348.15 to 288.15 K increases the 35-year average heat production power by 2.83 MWth and delays the thermal breakthrough by 3 years.
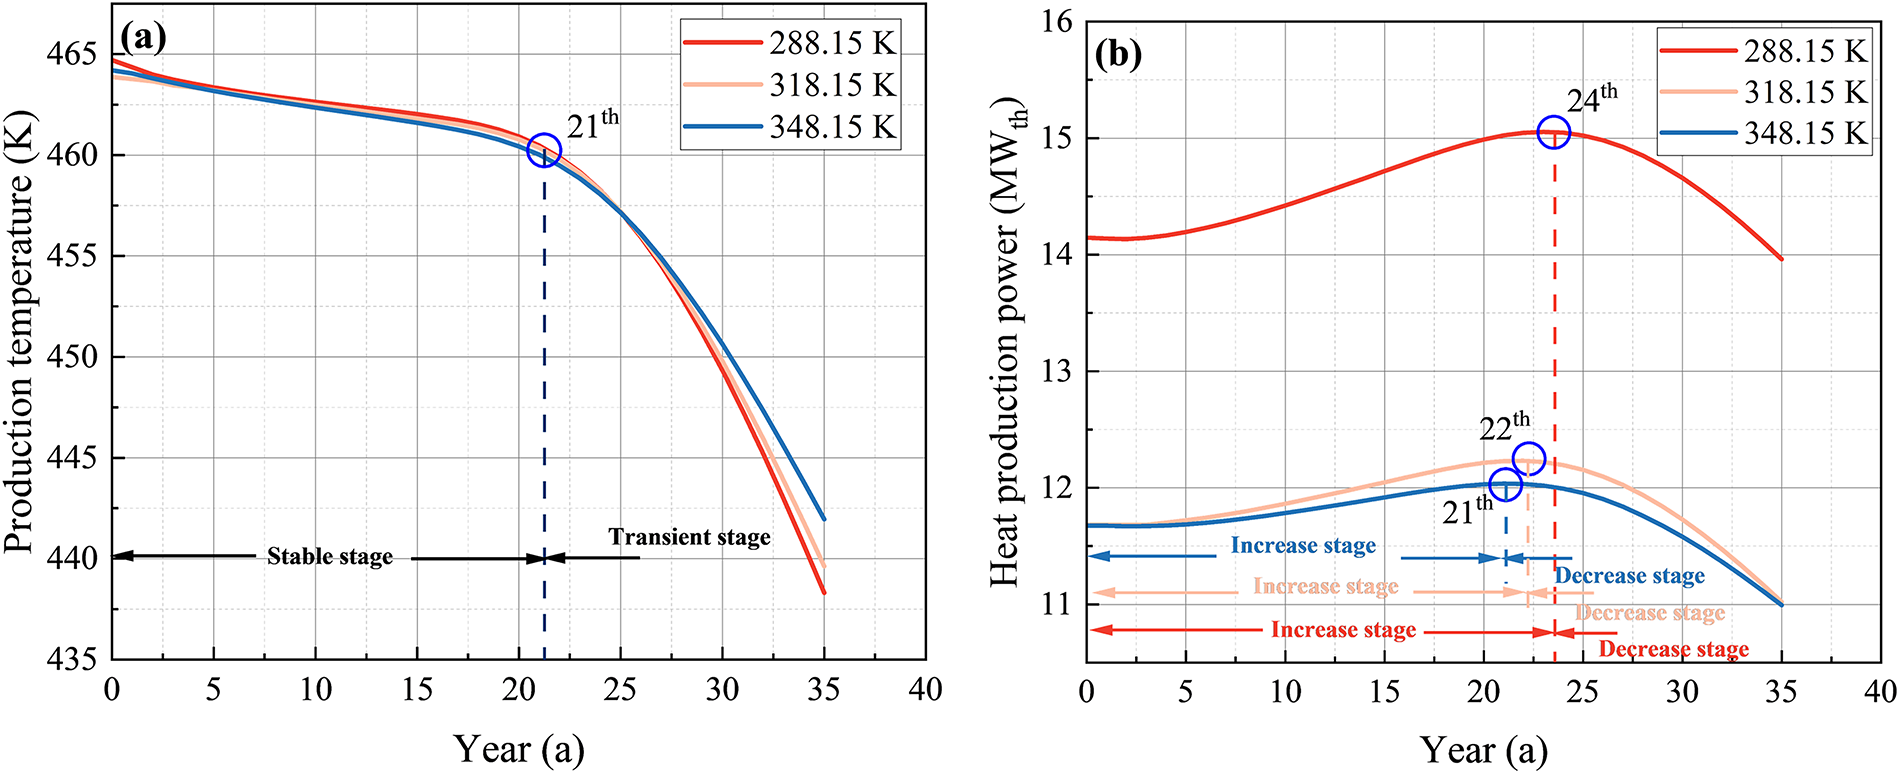
Figure 16: Variations in (a) production temperature and (b) heat production power over time under injection temperature
Overall, compared to other control variables, injection temperature has a relatively limited impact on fluid loss and heat extraction performance. In addition, moderately reducing the injection temperature can enhance heat production power and delay the thermal breakthrough time, thereby improving the system’s dynamic response characteristics and medium-to-long-term operational stability.
This study adopts a local thermal equilibrium (LTE) assumption for heat exchange between the pore fluid and the rock matrix. LTE is widely used and often adequate when interfacial exchange is sufficiently fast relative to advection. However, high-rate injection, low-porosity or strongly heterogeneous media, and fracture-dominated transport may lead to measurable fluid–solid temperature offsets over operational timescales, for which local thermal non-equilibrium (LTNE) can influence early-time thermal responses (e.g., thermal-front timing and short-term production temperatures) [50,51].
In parallel, the distribution and morphology of fracture networks (aperture, connectivity, and specific surface area) can markedly modulate coupled flow–heat–mechanical behavior during EGS operation. Under high-pressure injection conditions, hydraulic fracturing may further induce fracture propagation and aperture evolution, generating spatial variations in heat-transfer areas and fluid pathways. These effects can enhance local convective heat exchange while introducing heterogeneity in the overall water–rock thermal interaction.
Moreover, while this study emphasizes the effects of permeability contrast and operational parameters, the thermophysical and mechanical parameters of the reservoir and surrounding formations, such as thermal conductivity, elastic modulus, and porosity, also exhibit substantial natural variability and uncertainty. Therefore, a more systematic sensitivity and uncertainty analysis is still required to quantify the influence of these geologic properties on the reliability and stability of the predicted fluid loss and heat extraction performance.
In future research, targeted numerical simulations will be performed to explicitly incorporate LTNE effects, fracture evolution, and geologic parameter uncertainties within the coupled THM framework. This will allow a more rigorous assessment of how evolving fracture geometry and rock heterogeneity dynamically affect flow redistribution, heat extraction, and long-term reservoir performance.
In this study, based on the geological parameters of the GR1 well in the Qiabuqia region, a three-dimensional THM coupling numerical model of an EGS system with injection and production wells is developed. This model comprehensively simulates the multiphysics coupling processes of fluid flow, heat transfer, and geomechanics within the HDR reservoir under varying permeability contrasts between the reservoir and the surrounding formations, as well as the flow and heat exchange processes along the wellbores from the reservoir to the surface. On this basis, the impacts of permeability contrast, production pressure, injection flow rate, and injection temperature on fluid loss and thermal performance over a 35-year operation period are systematically evaluated. The main conclusions are summarized as follows:
1. A higher reservoir–formation permeability contrast effectively suppresses fluid leakage and enhances early-stage heat extraction performance; however, it also accelerates thermal breakthrough and shortens the stable operation period of the system;
2. Although increasing the production pressure can delay thermal breakthrough and mitigate the transient decline rate of production temperature, it also intensifies fluid loss and compromises heat extraction performance. When the production pressure increases from 17 to 21 MPa, the overall fluid loss rate rises from 33.17% to 54.34%, the average production temperature during the stable stage drops by approximately 9.68 K, and the annual average heat production power decreases from 25.43 to 14.59 MWth;
3. Increasing the injection flow rate helps suppress fluid loss and enhance early-stage heat extraction; however, it also causes earlier thermal breakthrough and a more rapid decline in late-stage heat production performance. When the injection rate increases from 46 to 66 kg/s, the average fluid loss rate decreases from 54.34% to 37.53%, and the cumulative net electricity generation and CO2 emission reductions over 35 years increase by 85.73% and 265.04%, respectively. Nonetheless, the thermal breakthrough occurs 9 years earlier, and the production temperature at the end of the heating period drops by approximately 41.15 K;
4. The effect of injection temperature on fluid loss in the EGS system is relatively limited; however, it still has a pronounced influence on thermal performance and emission reduction potential. Lower injection temperatures promote a faster decline in fluid loss rate, and prolong thermal breakthrough.
5. The dynamic response pattern of heat production power varies markedly under different fluid loss conditions. Under low fluid loss cases, such as low production pressure or high injection flow rates, the system follows a “stable–thermal breakthrough–transient” pattern dominated by production temperature. In contrast, under high fluid loss cases, such as high production pressure or low injection flow rates, the pattern shifts to a “increase–thermal breakthrough–decrease” jointly governed by both production temperature and flow rates.
In summary, this study systematically elucidates the combined effects of various operational parameters on EGS system performance under fluid loss–coupled conditions, providing quantitative insights and engineering guidance for the design and optimization of EGS.
Acknowledgement: None.
Funding Statement: This work is supported by the Postdoctoral Fellowship Program of China Postdoctoral Science Foundation (GZC20251944), the National Natural Science Foundation of China (No. 52376044), and the National Key Research and Development Program of China (2024YFE0100800).
Author Contributions: The authors confirm contribution to the paper as follows: Conceptualization, Yongwei Li and Kaituo Jiao; methodology, Yongwei Li; software, Yongwei Li; validation, Yongwei Li; formal analysis, Yongwei Li and Kaituo Jiao; investigation, Yongwei Li; resources, Kaituo Jiao and Dongxu Han; data curation, Yongwei Li; writing—original draft preparation, Yongwei Li; writing—review and editing, Yongwei Li and Kaituo Jiao; visualization, Yongwei Li; supervision, Bo Yu and Xiaoze Du; project administration, Bo Yu and Xiaoze Du; funding acquisition, Bo Yu and Dongxu Han. All authors reviewed the results and approved the final version of the manuscript.
Availability of Data and Materials: All data generated or analyzed during this study are included in this published article.
Ethics Approval: Not applicable.
Conflicts of Interest: The authors declare no conflicts of interest to report regarding the present study.
Nomenclature
| Af | Cross-sectional area of the flow region m² |
| c | Specific heat capacity J·kg−¹·K−¹ |
| d | Effective flow diameter m |
| E | Young’s modulus of the solid matrix Pa |
| Fi | Body force per unit volume in direction i N·m−³ |
| fD | Darcy friction factor – |
| Hi | Operational hours in year i h |
| hinj,i | Specific enthalpy of injected fluid J·kg−¹ |
| hpro,i | Specific enthalpy of produced fluid J·kg−¹ |
| k | Permeability of the rock matrix m² |
| k0 | Initial permeability m² |
| KS | Bulk modulus of solid grains Pa |
| Lcube | Length of cube m |
| minj,i | Actual injection flow rate kg·m−1 |
| mpro,i | Actual production flow rate kg·m−1 |
| p | Pore pressure Pa |
| p0 | Initial pore pressure Pa |
| Pth,i | Heat production power in year i W |
| Qf | Fluid source or sink term kg·m−³·s−¹ |
| Qth,cum | Cumulative heat extraction J |
| Qwall | Heat exchanged through borehole wall W |
| Re | Reynolds number – |
| S | Storage coefficient – |
| T | Temperature K |
| T0 | Initial temperature K |
| ui | Displacement component in i-direction m |
| VB | Volume of rock mass skeleton m³ |
| VP | Volume of rock mass m³ |
| w | Axial velocity of working fluid in wellbore m·s−¹ |
| z | Depth coordinate m |
| Greek letters | |
| αB | Biot coefficient – |
| αT | Thermal expansion coefficient K−¹ |
| εi,j | Strain tensor component – |
| εV | Volumetric strain – |
| εV0 | Initial volumetric strain – |
| η | Dynamic viscosity of fluid Pa·s |
| ηloss | Annual average fluid loss rate – |
| κ | Permeability contrast between reservoir and formation – |
| λ | Thermal conductivity W·m−¹·K−¹ |
| λeff | Effective thermal conductivity W·m−¹·K−¹ |
| ν | Poisson’s ratio – |
| ρ | Density kg·m−³ |
| Cp | Effective volumetric heat capacity J·m−³·K−¹ |
| Effective Cauchy stress tensor Pa | |
| φ | Porosity – |
| φ0 | Initial porosity – |
| Superscripts and subscripts | |
| f | Fluid phase |
| s | Solid phase |
| i, j | Spatial indices or directional components |
| 0 | Initial state |
| eff | Effective property |
References
1. Kumar A, Alam T. A review on geothermal energy systems and various approaches to enhance the system’s performance. Energy Build. 2025;344:115962. doi:10.1016/j.enbuild.2025.115962. [Google Scholar] [CrossRef]
2. Chen J, Jiang F. Designing multi-well layout for enhanced geothermal system to better exploit hot dry rock geothermal energy. Renew Energy. 2015;74(5):37–48. doi:10.1016/j.renene.2014.07.056. [Google Scholar] [CrossRef]
3. Zhao X, Wan G. Current situation and prospect of China’s geothermal resources. Renew Sustain Energy Rev. 2014;32(32):651–61. doi:10.1016/j.rser.2014.01.057. [Google Scholar] [CrossRef]
4. Ren Y, Kong Y, Pang Z, Wang J. A comprehensive review of tracer tests in enhanced geothermal systems. Renew Sustain Energy Rev. 2023;182:113393. doi:10.1016/j.rser.2023.113393. [Google Scholar] [CrossRef]
5. Koelbel T, Genter A. Enhanced geothermal systems: the soultz-sous-forêts project. In: Uyar TS, editors. 100 renewable energy. Cham, Switzerland: Springer International Publishing; 2017. p. 243–8. doi:10.1007/978-3-319-45659-1_25. [Google Scholar] [CrossRef]
6. Mahmoodpour S, Singh M, Turan A, Bär K, Sass I. Hydro-thermal modeling for geothermal energy extraction from Soultz-sous-Forêts, France. Geosciences. 2021;11:464. doi:10.3390/geosciences11110464. [Google Scholar] [CrossRef]
7. Moore J, McLennan J, Allis R, Pankow K, Simmons S, Podgorney R, et al. The Utah frontier observatory for research in geothermal energy (FORGEan international laboratory for enhanced geothermal system technology development. In: Proceedings of the 44th Workshop on Geothermal Reservoir Engineering; 2019 Feb 11–13; Stanford, CA, USA. Stanford, CA, USA: Stanford University; 2019. Report No.: SGP-TR-214. [Google Scholar]
8. Huenges E, Holl H-G, Bruhn D, Brandt W, Saadat A, Moeck I, et al. Current state of the EGS project Groß Schönebeck—drilling into the deep sedimentary geothermal reservoir. In: Proceedings of the European Geothermal Congress 2007; 2007 May 30–Jun 1; Unterhaching, Germany. Bochum, Germany: European Geothermal Energy Council; 2007. [Google Scholar]
9. Jacquey AB, Cacace M, Blöcher G, Watanabe N, Huenges E, Scheck-Wenderoth M. Thermo-poroelastic numerical modelling for enhanced geothermal system performance: case study of the Groß Schönebeck reservoir. Tectonophysics. 2016;684:119–30. doi:10.1016/j.tecto.2015.12.020. [Google Scholar] [CrossRef]
10. Hogarth R, Holl H, McMahon A. Production, injection and closed-loop testing at Habanero EGS Project. In: Proceedings of the 35th New Zealand Geothermal Workshop; 2013 Nov 17–20; Rotorua, New Zealand. [Google Scholar]
11. Xu T, Liang X, Xia Y, Jiang Z, Gherardi F. Performance evaluation of the Habanero enhanced geothermal system, Australia: optimization based on tracer and induced micro-seismicity data. Renew Energy. 2022;181(2):1197–208. doi:10.1016/j.renene.2021.09.111. [Google Scholar] [CrossRef]
12. Yamaguchi S, Akibayashi S, Rokugawa S, Fujinaga Y, Tenma N, Sato Y. The numerical modelling study of the Hijiori HDR test site. In: Proceedings of Asia Geothermal Symposium; 2000 May 28–Jun 10; Tohoku, Japan. Tokyo, Japan: New Energy and Industrial Technology Development Organization (NEDO); 2000. p. 145–50. [Google Scholar]
13. Reinecker J, Gutmanis J, Foxford A, Cotton L, Dalby C, Law R. Geothermal exploration and reservoir modelling of the United Downs deep geothermal project, Cornwall (UK). Geothermics. 2021;97(4):102226. doi:10.1016/j.geothermics.2021.102226. [Google Scholar] [CrossRef]
14. Zhang S, Yan W, Li D, Jia X, Zhang S, Li S, et al. Characteristics of geothermal geology of the Qiabuqia HDR in Gonghe Basin, Qinghai Province. Geol China. 2018;45:1087–102. doi:10.12029/gc20180601. [Google Scholar] [CrossRef]
15. Cheng W-L, Wang C-L, Nian Y-L, Han B-B, Liu J. Analysis of influencing factors of heat extraction from enhanced geothermal systems considering water losses. Energy. 2016;115(7):274–88. doi:10.1016/j.energy.2016.09.003. [Google Scholar] [CrossRef]
16. Matsunaga I, Yanagisawa N, Sugita H, Tao H. Reservoir monitoring by tracer testing during a long term circulation test at the Hijiori HDR site. In: Proceedings of the 27th Workshop on Geothermal Reservoir Engineering; 2002 Jan 28–30; Stanford, CA, USA. Stanford, CA, USA: Stanford University; 2002. SGP-TR-171 p. [Google Scholar]
17. Wang G-L, Lu C. Stimulation technology development of hot dry rock and enhanced geothermal system driven by carbon neutrality target. Geol Resour. 2023;32(1):8–12. (In Chinese). doi:10.13686/j.cnki.dzyzy.2023.01.011. [Google Scholar] [CrossRef]
18. Philipp SL, Afşar F, Gudmundsson A. Effects of mechanical layering on hydrofracture emplacement and fluid transport in reservoirs. Front Earth Sci. 2013;1:4. doi:10.3389/feart.2013.00004. [Google Scholar] [CrossRef]
19. Pan Z, Ma Y, Connell LD, Down DI, Camilleri M. Measuring anisotropic permeability using a cubic shale sample in a triaxial cell. J Nat Gas Sci Eng. 2015;26:336–44. doi:10.1016/j.jngse.2015.05.037. [Google Scholar] [CrossRef]
20. Egert R, Nitschke F, Gholami Korzani M, Kohl T. Spatial characterization of channeling in sheared rough-walled fractures in the transition to nonlinear fluid flow. Water Resour Res. 2023;59(10):e2022WR034362. doi:10.1029/2022WR034362. [Google Scholar] [CrossRef]
21. Ishibashi T, Watanabe N, Tamagawa T, Tsuchiya N. Mapping the preferential flow paths within a fractured reservoir. In: Proceedings World Geothermal Congress 2015; 2015 Apr 19–25; Melbourne, Australia. [Google Scholar]
22. Liu J, Xue Y, Zhang Q, Wang H, Wang S. Coupled thermo-hydro-mechanical modelling for geothermal doublet system with 3D fractal fracture. Appl Therm Eng. 2022;200:117716. doi:10.1016/j.applthermaleng.2021.117716. [Google Scholar] [CrossRef]
23. Zinsalo JM, Lamarche L, Raymond J. Sustainable electricity generation from an enhanced geothermal system considering reservoir heterogeneity and water losses with a discrete fractures model. Appl Therm Eng. 2021;192:116886. doi:10.1016/j.applthermaleng.2021.116886. [Google Scholar] [CrossRef]
24. Huang W, Cao W, Jiang F. Heat extraction performance of EGS with heterogeneous reservoir: a numerical evaluation. Int J Heat Mass Transf. 2017;108(Pt A):645–57. doi:10.1016/j.ijheatmasstransfer.2016.12.037. [Google Scholar] [CrossRef]
25. Zeng Y, Sun F, Zhai H. Effect of vertical permeability heterogeneity in stratified formation on electricity generation performance of enhanced geothermal system. Processes. 2021;9(5):744. doi:10.3390/PR9050744. [Google Scholar] [CrossRef]
26. Taron J, Elsworth D. Coupled mechanical and chemical processes in engineered geothermal reservoirs with dynamic permeability. Int J Rock Mech Min Sci. 2010;47(8):1339–48. doi:10.1016/j.ijrmms.2010.08.021. [Google Scholar] [CrossRef]
27. Li P, Zheng J, Dou B, Tian H, Li H, Xiao P, et al. A 3-D numerical simulation-based heat production performance research for enhanced geothermal system with two horizontal wells and rectangular multiparallel fractures. Numer Heat Transf Part B Fundam. 2021;81(1–6):14–37. doi:10.1080/10407790.2021.2009257. [Google Scholar] [CrossRef]
28. Ma Y, Li S, Zhang L, Liu S, Liu Z, Li H, et al. Numerical simulation study on the heat extraction performance of multi-well injection enhanced geothermal system. Renew Energy. 2020;151:782–95. doi:10.1016/j.renene.2019.11.067. [Google Scholar] [CrossRef]
29. Yin X, Jiang C, Yin F, Zhai H, Zheng Y, Wu H, et al. Assessment and optimization of maximum magnitude forecasting models for induced seismicity in enhanced geothermal systems: the Gonghe EGS project in Qinghai. China Tectonophys. 2024;886:230438. doi:10.1016/j.tecto.2024.230438. [Google Scholar] [CrossRef]
30. Zhang W, Han D, Wang B, Chen Y, Jiao K, Gong L, et al. Research on the solution of the thermo-hydro-mechanical-chemical coupling model based on the unified finite volume method framework. Therm Sci Eng Prog. 2024;55(1):102889. doi:10.1016/j.tsep.2024.102889. [Google Scholar] [CrossRef]
31. Jiao K, Han D, Wang B, Chen Y, Bai B, Gong L, et al. Pore-scale modeling of thermal-hydro-mechanical-chemical coupled rock dissolution and fracturing process. J Clean Prod. 2023;421:138391. doi:10.1016/j.jclepro.2023.138391. [Google Scholar] [CrossRef]
32. Shi Y, Song X, Wang G, McLennan J, Forbes B, Li X, et al. Study on wellbore fluid flow and heat transfer of a multilateral-well CO2 enhanced geothermal system. Appl Energy. 2019;249:14–27. doi:10.1016/j.apenergy.2019.04.117. [Google Scholar] [CrossRef]
33. Shi Y, Song X, Li J, Wang G, YuLong F, Geng L. Analysis for effects of complex fracture network geometries on heat extraction efficiency of a multilateral-well enhanced geothermal system. Appl Therm Eng. 2019;159:113828. doi:10.1016/j.applthermaleng.2019.113828. [Google Scholar] [CrossRef]
34. Kim SJ, Kim D, Lee DY. On the local thermal equilibrium in microchannel heat sinks. Int J Heat Mass Transf. 2000;43:1735–48. doi:10.1016/S0017-9310(99)00259-8. [Google Scholar] [CrossRef]
35. Song X, Shi Y, Li G, Yang R, Wang G, Zheng R, et al. Numerical simulation of heat extraction performance in enhanced geothermal system with multilateral wells. Appl Energy. 2018;218(1):325–37. doi:10.1016/j.apenergy.2018.02.172. [Google Scholar] [CrossRef]
36. Xu C, Dowd PA, Tian ZF. A simplified coupled hydro-thermal model for enhanced geothermal systems. Appl Energy. 2015;140(2):135–45. doi:10.1016/j.apenergy.2014.11.050. [Google Scholar] [CrossRef]
37. Zhao Y, Feng Z, Feng Z, Yang D, Liang W. THM (Thermo-hydro-mechanical) coupled mathematical model of fractured media and numerical simulation of a 3D enhanced geothermal system at 573 K and buried depth 6000-7000 M. Energy. 2015;82(3):193–205. doi:10.1016/j.energy.2015.01.030. [Google Scholar] [CrossRef]
38. Sun Z, Zhang X, Xu Y, Yao J, Wang H, Lv S, et al. Numerical simulation of the heat extraction in EGS with thermal-hydraulic-mechanical coupling method based on discrete fractures model. Energy. 2017;120(3):20–33. doi:10.1016/j.energy.2016.10.046. [Google Scholar] [CrossRef]
39. Yao J, Zhang X, Sun Z, Huang Z, Liu J, Li Y, et al. Numerical simulation of the heat extraction in 3D-EGS with thermal-hydraulic-mechanical coupling method based on discrete fractures model. Geothermics. 2018;74(4):19–34. doi:10.1016/j.geothermics.2017.12.005. [Google Scholar] [CrossRef]
40. Chen Z, Huang L, Li X, Liu Z, Chen J. Numerical investigations of mechanical behavior and permeability evolution in mine geothermal reservoir with blasting fractures using fully coupled thermal–hydraulic-mechanical modeling. Appl Therm Eng. 2024;252:123596. doi:10.1016/j.applthermaleng.2024.123596. [Google Scholar] [CrossRef]
41. Han D, Li Y, Jiao K, Chen Y, Wang B, Yu B. A novel preheating system in pressure reduction stations—natural gas directly flowing inside deep borehole heat exchangers. J Clean Prod. 2024;469:143190. doi:10.1016/j.jclepro.2024.143190. [Google Scholar] [CrossRef]
42. Sanyal SK, Butler SJ. An analysis of power generation prospects from enhanced geothermal systems. In: Proceedings of the World Geothermal Congress 2005; 2005 Apr 24–29; Antalya, Turkey. Richmond, CA, USA: GeothermEx, Inc.; 2005. [Google Scholar]
43. Bai B. One-dimensional thermal consolidation characteristics of geotechnical media under non-isothermal condition. Eng Mech. 2005;22(5):186–91. [Google Scholar]
44. Zhang C, Jiang G, Shi Y, Wang Z, Wang Y, Li S, et al. Terrestrial heat flow and crustal thermal structure of the Gonghe-Guide area, northeastern Qinghai-Tibetan plateau. Geothermics. 2018;72:182–92. doi:10.1016/j.geothermics.2017.11.011. [Google Scholar] [CrossRef]
45. Lei Z, Zhang Y. Investigation on the effect of symmetrical multi-well layout on geothermal energy extraction from a fractured granitic reservoir: a case study in the Gonghe Basin, Northwestern China. Energy Rep. 2021;7(1):7741–58. doi:10.1016/j.egyr.2021.10.115. [Google Scholar] [CrossRef]
46. Cao W, Huang W, Jiang F. A novel thermal–hydraulic–mechanical model for the enhanced geothermal system heat extraction. Int J Heat Mass Transf. 2016;100:661–71. doi:10.1016/j.ijheatmasstransfer.2016.04.078. [Google Scholar] [CrossRef]
47. Cai X, Liu Z, Xu K, Li B, Zhong X, Yang M. Numerical simulation study of an Enhanced Geothermal System with a five-spot pattern horizontal well based on thermal-fluid-solid coupling. Appl Therm Eng. 2025;258:124649. doi:10.1016/j.applthermaleng.2024.124649. [Google Scholar] [CrossRef]
48. Jiang F, Chen J, Huang W, Luo L. A three-dimensional transient model for EGS subsurface thermo-hydraulic process. Energy. 2014;72(7):300–10. doi:10.1016/j.energy.2014.05.038. [Google Scholar] [CrossRef]
49. Scibek J. Multidisciplinary database of permeability of fault zones and surrounding protolith rocks at world-wide sites. Sci Data. 2020;7(1):95. doi:10.1038/s41597-020-0435-5. [Google Scholar] [PubMed] [CrossRef]
50. Zhou L, Zhao Z, Jin Y. Integrated PD-HT-FEM simulation of fracture networks and heat extraction in enhanced geothermal systems under coupled thermal-hydraulic-mechanical condition. Energy. 2025;326:136242. doi:10.1016/j.energy.2025.136242. [Google Scholar] [CrossRef]
51. Zhou L, Zhu Z, Xie X. Performance analysis of enhanced geothermal system under thermo-hydro-mechanical coupling effect with different working fluids. J Hydrol. 2023;624(6):129907. doi:10.1016/j.jhydrol.2023.129907. [Google Scholar] [CrossRef]
Cite This Article
 Copyright © 2025 The Author(s). Published by Tech Science Press.
This work is licensed under a Creative Commons Attribution 4.0 International License , which permits unrestricted use, distribution, and reproduction in any medium, provided the original work is properly cited.
 Downloads
 Citation Tools