
 Submit a Paper
 Propose a Special lssue
 Open Access
ARTICLE

Exact Computer Modeling of Photovoltaic Sources with Lambert-W Explicit Solvers for Real-Time Emulation and Controller Verification
1 Department of Electrical Engineering, University of Hail, Hail, 55211, Saudi Arabia
2 Department of Electrical and Electronics Engineering, College of Technology (COT), University of Buea, Buea, P.O. Box 63, Cameroon
* Corresponding Author: Ambe Harrison. Email:
Computer Modeling in Engineering & Sciences 2026, 146(1), 28 https://doi.org/10.32604/cmes.2025.074815
Received 18 October 2025; Accepted 16 December 2025; Issue published 29 January 2026
 View Full Text
 Download PDF
Abstract
We present a computer-modeling framework for photovoltaic (PV) source emulation that preserves the exact single-diode physics while enabling iteration-free, real-time evaluation. We derive two closed-form explicit solvers based on the Lambert W function: a voltage-driven V-Lambert solver for high-fidelity I–V computation and a resistance-driven R-Lambert solver designed for seamless integration in a closed-loop PV emulator. Unlike Taylor-linearized explicit models, our proposed formulation retains the exponential nonlinearity of the PV equations. It employs a numerically stable analytical evaluation that eliminates the need for lookup tables and root-finding, all while maintaining limited computational costs and a small memory footprint. The R-Lambert model is integrated into a buck-converter emulator equipped with a discrete PI regulator, which generates current references directly from sensed operating points, thus supporting hardware-constrained implementation. Comprehensive numerical experiments conducted on six commercial modules from various technologies (mono, poly, and multicrystalline) demonstrate significant accuracy improvements under the IEC EN 50530 near-MPP criterion: the V-Lambert solver reduces the ±10% Vmpp band error by up to 61 times compared to an explicit-model baseline. Dynamic simulations under varying irradiance, temperature, and load conditions achieve millisecond-scale settling with accurate trajectory tracking. Additionally, processor-in-the-loop experimental validation on an embedded microcontroller supports the simulation results. By unifying exact analytical modeling with embedded realization, this work advances computer modeling for PV emulation, MPPT benchmarking, and controller verification in integrated renewable energy systems.Keywords
The drift towards renewable energy sources (RESs) is experiencing a high propensity [1]. This is supported by the urgent need to phase out conventional energy sources, which are the primary contributors to fossil fuel pollution [2]. This shift has sped up the development and technology of renewable energy sources (RESs). Research and development on RESs indicate that solar energy and its related applications (especially photovoltaics) are growing faster than any other source [3]. With ongoing research into solar photovoltaic (PV) systems, enhancing their conventional and operational efficiency has become essential. Photovoltaics have attracted significant attention recently, largely due to advancements in maximum power point tracking (MPPT) [4] and performance modeling [5]. For practical purposes, it is vital to test and validate PV installations prior to field deployment [6]. However, testing and validating these systems using actual solar panels presents notable control challenges. Environmental variables, especially irradiance, fluctuate stochastically and cannot be directly controlled during testing trials. It is also important to investigate methods that allow for the adjustment of solar irradiation, thereby increasing the flexibility of the testing platform. This concept has been explored in the literature under the term solar photovoltaic emulator (PVE). A PVE is a specialized control power electronics system that can replicate both the static and dynamic characteristics of a solar panel [7]. Essentially, a PVE can be considered a closed-loop system, as illustrated in Fig. 1, where a DC-DC converter is regulated by the power stage controller according to set points generated by an integrated reference PV model. A fixed DC power supply connected to the converter’s input acts as the primary energy source for the system. The PV output, as depicted in the same figure, represents the panel’s I-V curve. Recent interest has concentrated on both the power stage (DC-DC) converter and the regulated stage of the PVE. The primary focus is on integrating the PV model into the PVE as a reference system. The literature review phase of this work will discuss several issues related to this aspect of the PVE.
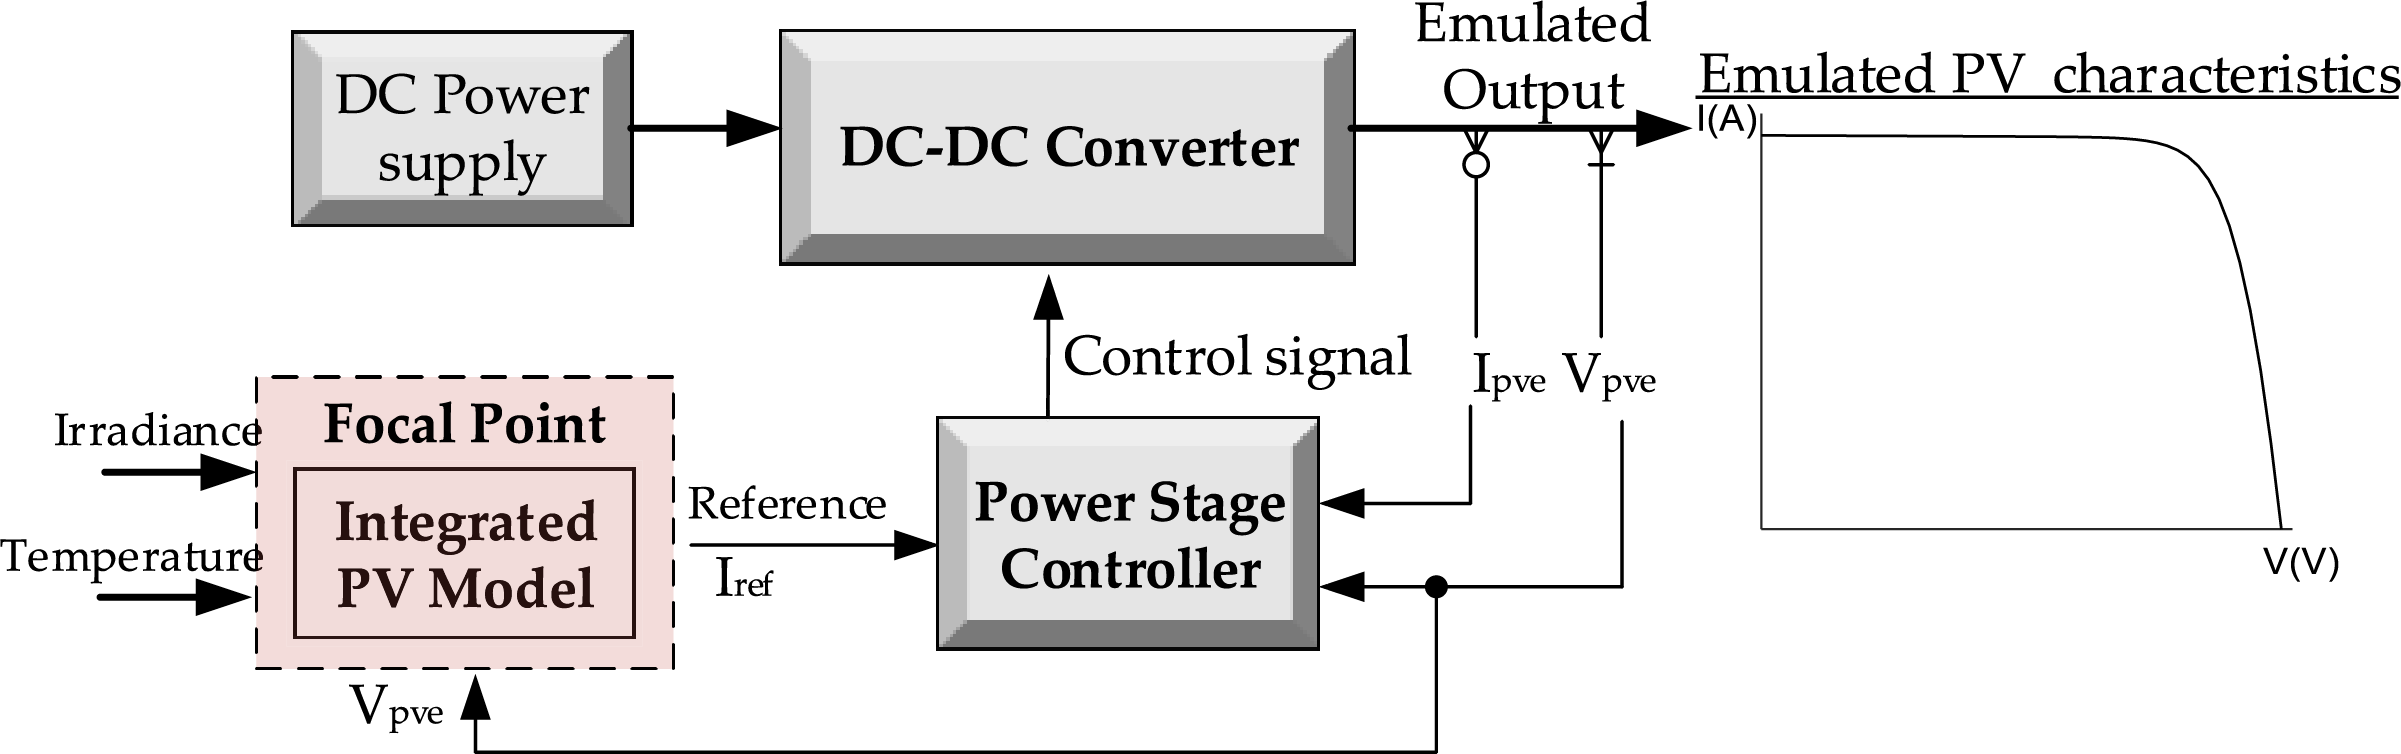
Figure 1: General structure of a solar photovoltaic emulator
The look-up table method has received considerable recognition as one of the most widely used approaches for obtaining PVE references [8]. It primarily relies on pre-existing data, which places substantial memory demands on the embedded processor unit. Consequently, memory constraints significantly limit the overall PVE’s operational range by restricting the amount of stored data. Moreover, emulating a new PV module necessitates data reconstruction, as it directly depends on the specific module. Linearization techniques based on the I-V curve have been extensively studied in the field of PVE referencing. This approach involves partitioning the I-V curve into multiple points and calculating first-order equations using their coordinates. The 3-Point Linearization method utilizes three conventional points on the I-V curve (Fig. 2): the short circuit point (SCP), the maximum power point (MPP), and the open circuit point (OCP). Although this linearization approach may seem straightforward due to its lack of data pre-storage requirements, it unfortunately results in a very low level of accuracy. To improve accuracy, two additional nodes, labeled A and B, are introduced to the I-V curve [9]. These additions enhance the accuracy of the computations. However, since the coordinates are not readily available and an exact mathematical method to derive them is unknown, data pre-storage becomes necessary. This leads to the need for training an artificial neural network (ANN) to identify these points, which becomes essential. While incorporating the ANN improves overall system performance, it complicates the system and increases operational expenses. Thus, it is evident that as the number of segment points increases, the complexity of the ANN model also rises [7]. One can infer that linearization represents a trade-off between complexity (cost) and accuracy, highlighting a significant limitation of the method.
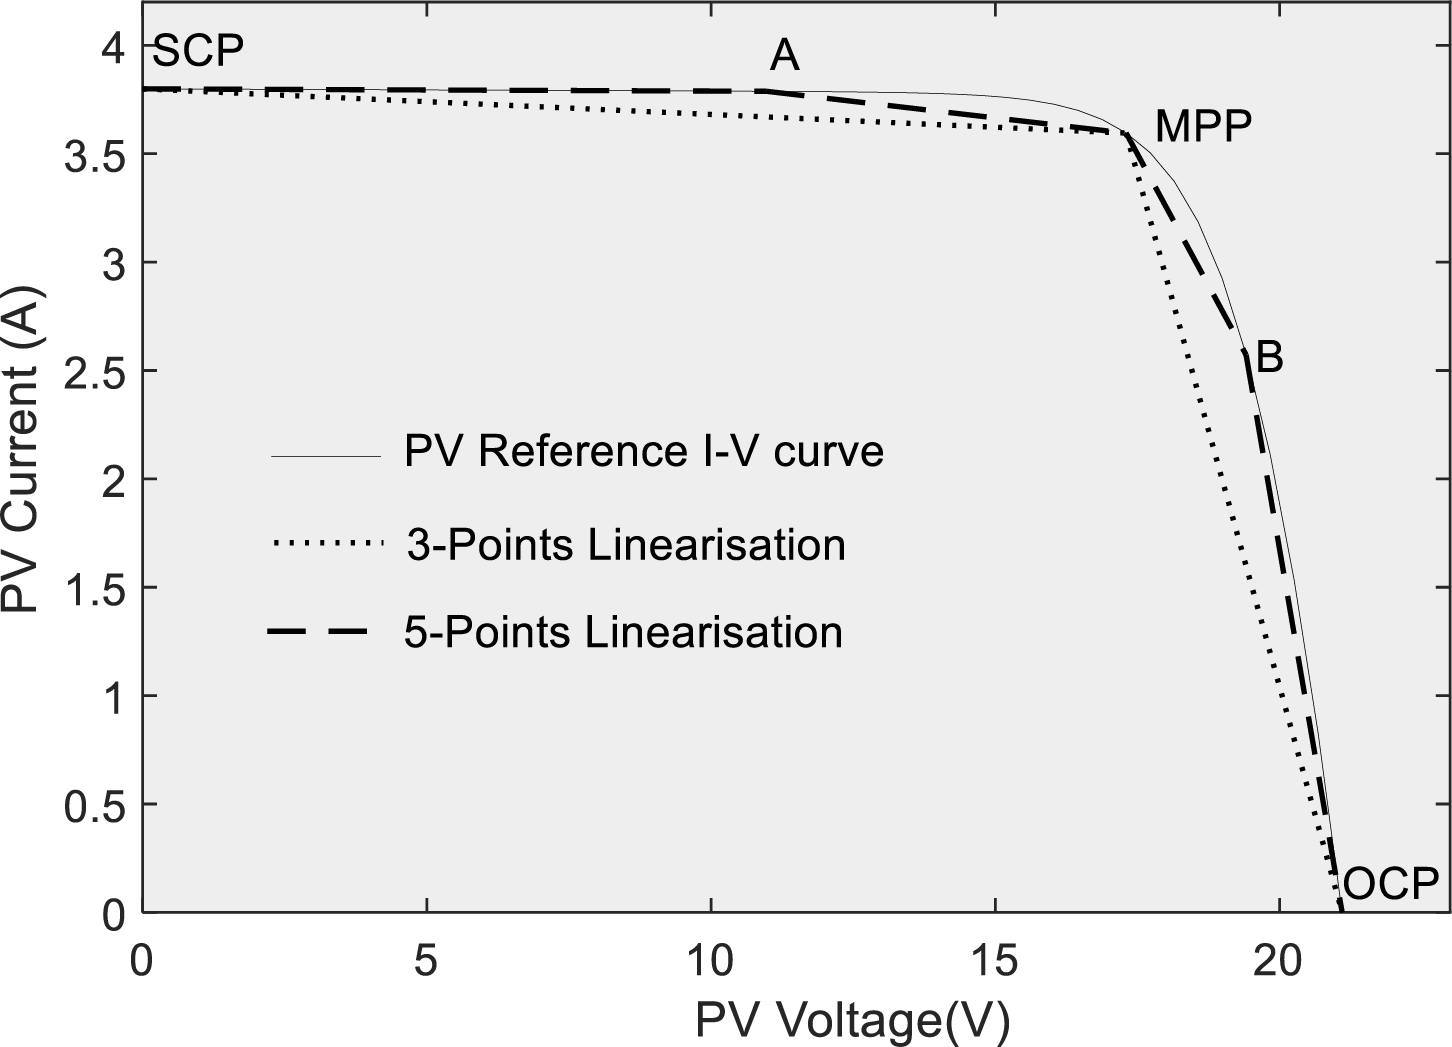
Figure 2: Reference computation of the I-V curve via linearization
To enhance the precision of the PVE while simplifying the process, the I-V curve is approached directly through a numerical method, such as the Newton-Raphson computation algorithm [10]. A significant challenge with numerical methods is the need for many iterations to achieve desired accuracy. Numerous studies have demonstrated that the PVE’s iteration requirements impact both computation and emulation times [11]. As a result, many researchers have concentrated on reducing the iterations needed by the PVE. For example, ref. [12] showed that using the resistance comparison method and the binary search method could limit the iterations to forty. Additionally, combining the current-resistor model with binary search computation reduced the iteration count to a maximum of 20 [13]. However, our recent research indicated that even this reduced number of iterations is still linked to prolonged computation times and slow emulation speeds of the PVE, which points to the urgent need for iteration-free computation methods [11]. In response, we proposed an iteration-free method based on an explicit model of the PV (EPVM) in our recent work. This method effectively addressed the previously mentioned computational challenges. However, we have noted that this approach’s approximation of the I-V curve may result in reduced accuracy in certain regions [MPP]. This issue is particularly important since the maximum power point is the most critical point on the I-V curve. Thus, this concern serves as the primary motivation for conducting this research.
1.2 Proposed Solution and Main Contributions
The accuracy degradation observed in the EPVM near the MPP, as identified in [11], can be attributed to the oversimplification of the I-V equations. To address this issue and enhance the precision of the PVE in that region, we propose a mathematical methodology based on the Lambert function. We demonstrate that we can significantly improve the precision of the I-V curve by maintaining the accuracy of the I-V nonlinear equations. In this context, we present two Lambert-derived approaches for integrating the PVE and PV models. The first method, known as the V-Lambert method, is introduced as an exceptionally accurate technique for calculating PV using voltage inputs. However, integrating the Lambert function into the PVE presents challenges due to its limitations in certain regions of the I-V curve. Consequently, we propose the R-Lambert method, a seamless approach that facilitates the accurate and computationally efficient integration of the PV model into the PVE. We conduct multiple analyses on six different PV modules, including monocrystalline, polycrystalline, and multicrystalline varieties, to validate this research. Using the R-Lambert method, we incorporate the PV model into the PVE. We generate various simulation outcomes to demonstrate the new PVE’s ability to accurately simulate the solar panel. Finally, we confirm the hardware feasibility of the overall PVE through experimental validation in a processor-in-the-loop environment. The primary contributions of this study are succinctly outlined as follows:
I) Development of the V-Lambert method for computing the I-V curve in a PVE setting
II) Development of the R-Lambert method for integrating PV model into the PVE
III) Assessment of the accuracy of the Lambert derived method in comparison with the EPVM method
IV) Implementation of the R-Lambert PVE and assessment in diverse climatic and load conditions
V) Experimental validation of the developed PVE using processor-in-the-loop experiment
2 Computation of PV Model and PVE Integration
The PV model is the most important element of a PVE. As depicted in Fig. 1, for seamless operation of PVE, it has to be integrated and computed to generate a reference for the closed loop system. Eq. (1) is the most common mathematical equation for modeling a solar panel derived from the single diode model [14]:
where
Additionally, G is the incident solar irradiance in W/m2,
where
Numerous intelligent optimization techniques for identifying solar model parameters exist in the literature [15]. The main Eq. (2) is implicit and transcendental and treating it directly will amount to iterations, a situation that is avoided.
To integrate a PV model governed by Eq. (1) into a PVE, it must be computed to reference a voltage or current signal. In this light, ref. [11] proposed an Explicit PV model (EPVM) PVE, where the PV model was integrated through explicit resolution of the nonlinear equation, achieved through a first order Taylor series approximation of the exponential term of Eq. (1). This approximation degrades the accuracy of the integrated PV model around the most nonlinear section of the I-V curve [maximum power point]. To treat such a problem, we buy the idea of maintaining the exactness of this exponential term and hence consolidate the full nature of the equation. The expectation lies in that the accuracy of the PV will be enhanced around the most nonlinear section of the I-V curve, that is, in the vicinity of the maximum power point. This enhancement is vital for upholding the accuracy of solar emulators making them more useful in testing PV systems. The enhancement approach proposed by this study is founded on the Lambert function. Although the Lambert function has been established as a general concept in the literature [16], it has received no attention in the treatment of PV model for integration into a PVE.
The Lambert
(a) Accuracy: It can maintain the exact form of the PV model, avoiding approximations that degrade precision near the maximum power point
(b) Computational Efficiency: It eliminates iterative loops, enabling real-time emulation with minimal processing overhead
Generally, if we consider the expression in (5) and its simplification in (6) as shown below:
The Lambert (
By rearrangement of Eq. (1) and application of the procedure described in Eqs. (5)–(7), the Lambert resolution of the PV model in terms of PV Voltage-V can be obtained as follows:
For the sake of future analysis, we can write the argument of the Lambert function (
Eq. (8) is termed the V-Lambert function because it takes as argument PV voltage. The Lambert function is not a standard function and thus in order to ensure exactness in the I-V model it is represented with a standard function for seamless implementation. In this study, we consider the analytical expression of the Lambert function
Assumption: It is assumed that the evaluation of
In the context of PVE implementation, this must be verified, considering the nonlinear function
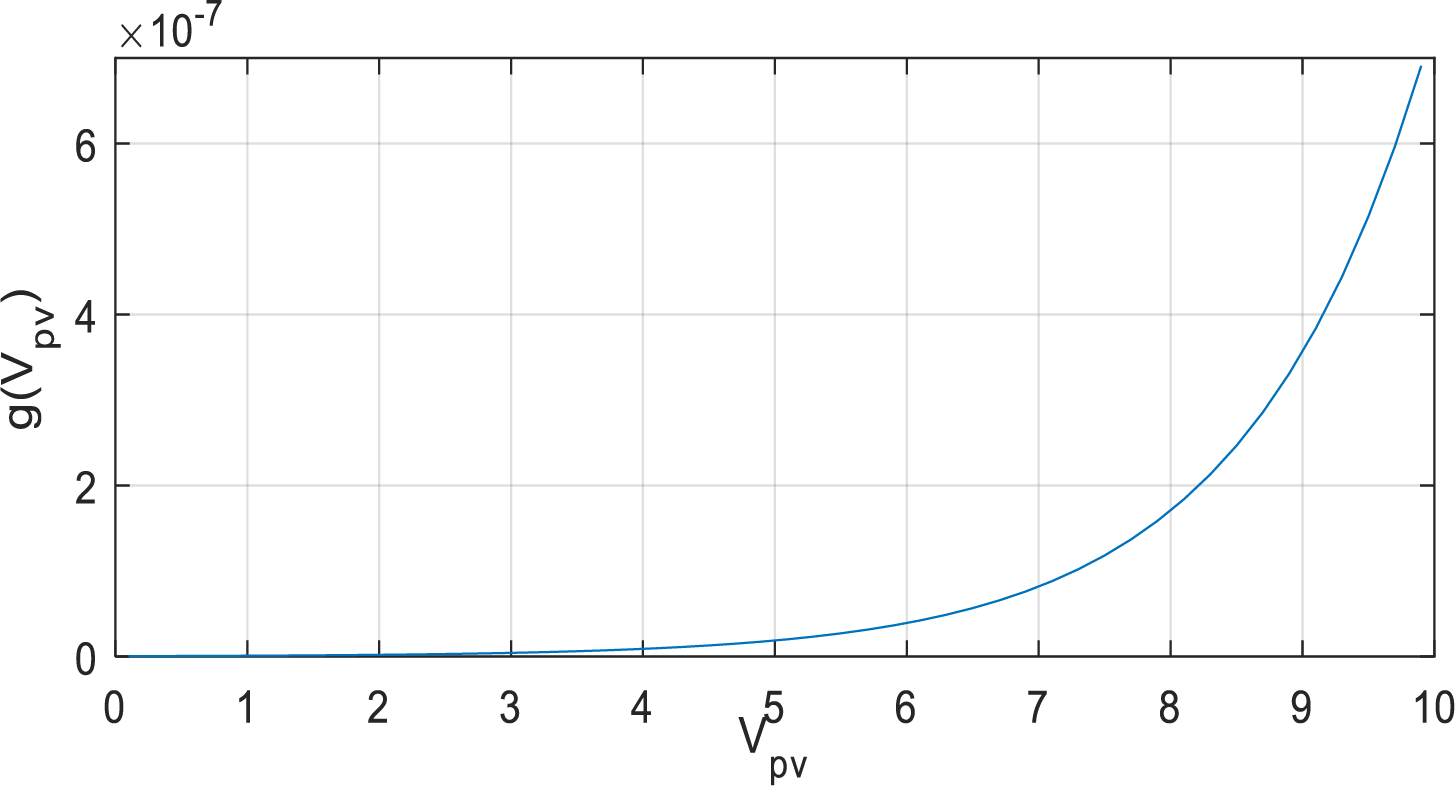
Figure 3: Variation the nonlinear function
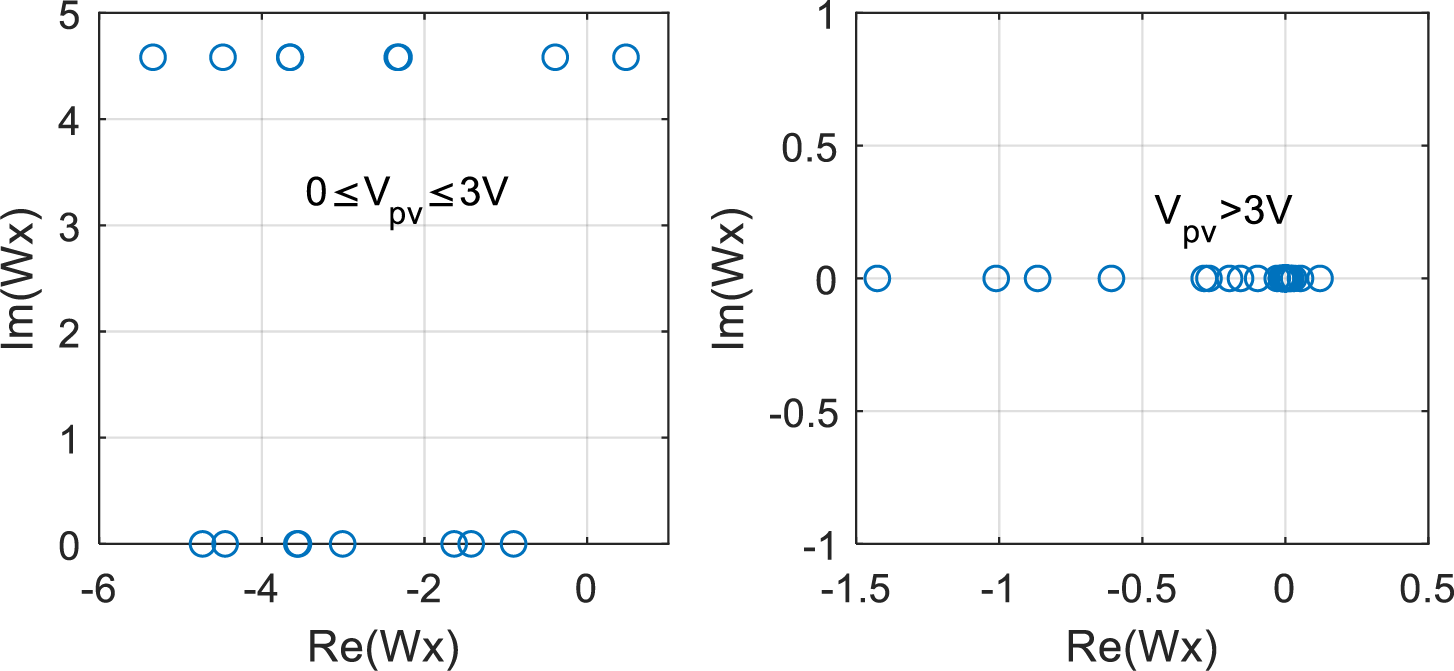
Figure 4: Analysis of the behavior of the Lambert function with the nonlinear function
Remark 1: A PVE is a dynamic system, hence its response is equally dynamic. A PVE response must progress from the transient phase, in which the PVE voltage is relatively low, to the steady state.
Considering remark 1, a PVE computed by the V-Lambert will not be able to operate in the transient phase due to the operational limitations previously exposed.
Remark 2: If the PVE responds to resistance rather than voltage, even during the transient phase, the resistance will not change because
Considering remark-2, the PV model has to be extended to account for responses to resistance. Considering the Lambert foundation, this yield the R-Lambert model. Considering the substitution,
If we apply the same procedure described in Eqs. (5)–(7), the following R-Lambert model can be obtained:
This is therefore referred to as the R-Lambert model. The primary advantage of this model over the V-Lambert is the principal fact that it can operate in the transient phase of the PVE given that
Fig. 5 shows a closed loop implementation of the proposed PVE described as follows: The R-Lambert reference Generator computes the required current reference
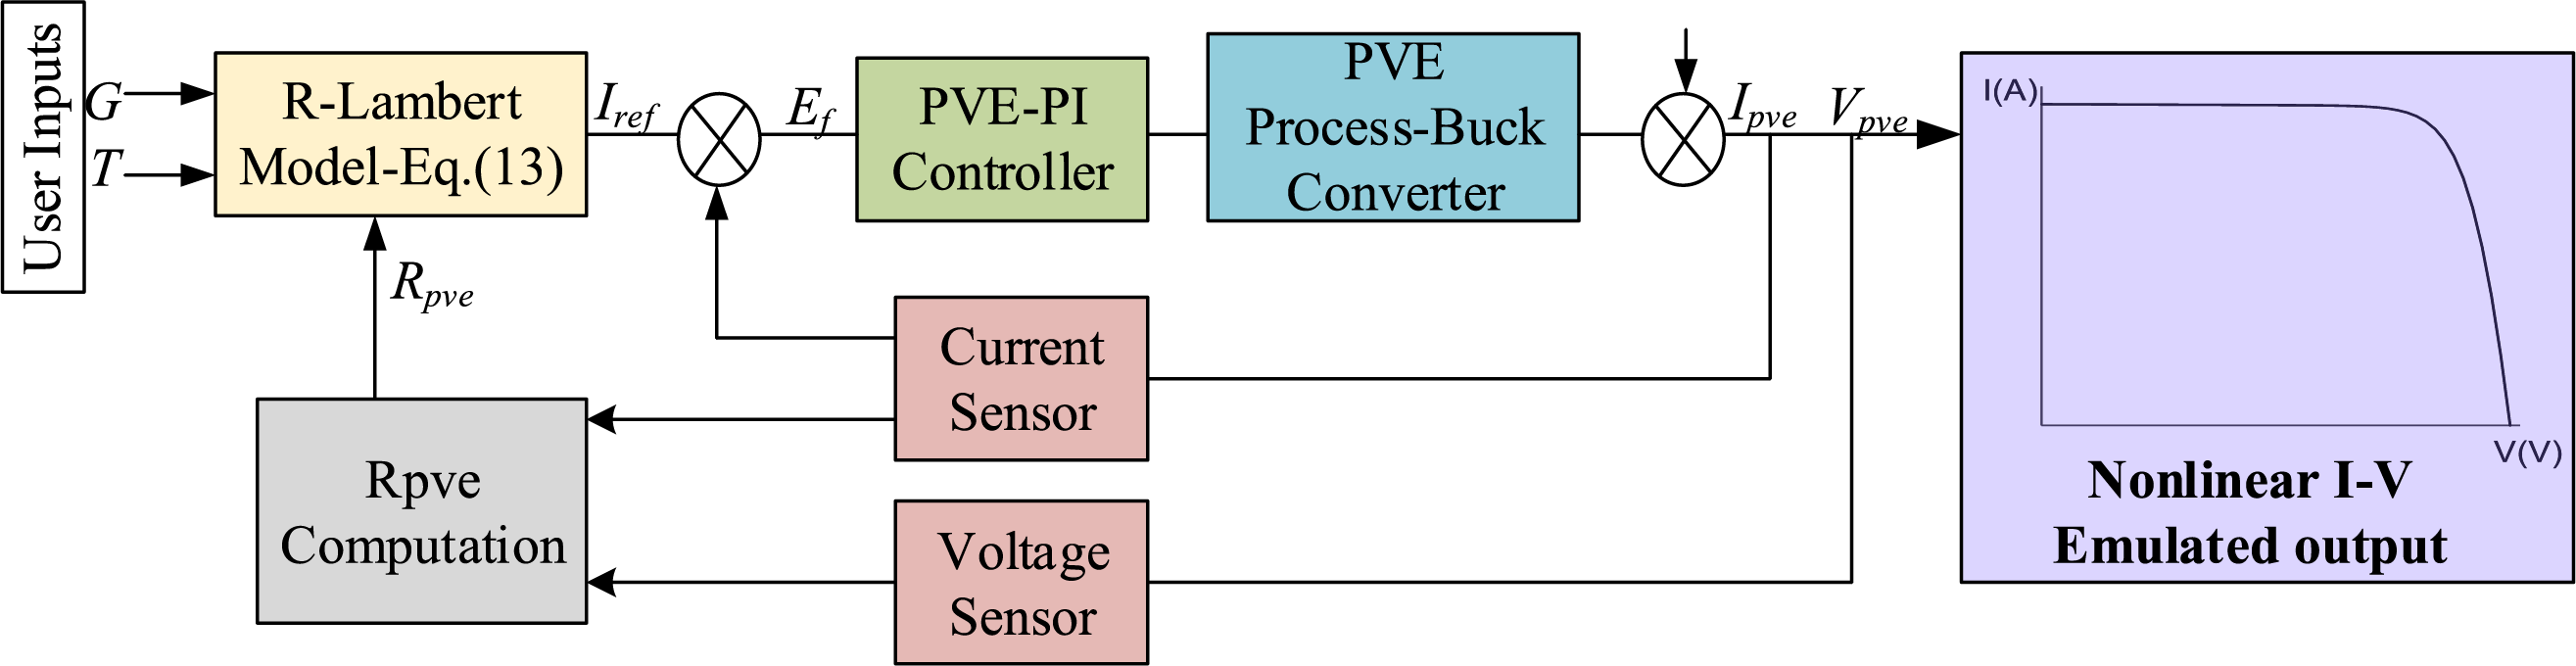
Figure 5: Close loop diagram of the PVE with integrated R-Lambert Model
Therefore, in a PVE setting the reference current will be computed as shown in Eq. (13), derived from (12):
For irradiance and temperature conditions different from standard conditions, the translation Eqs. (3) and (4) are used.
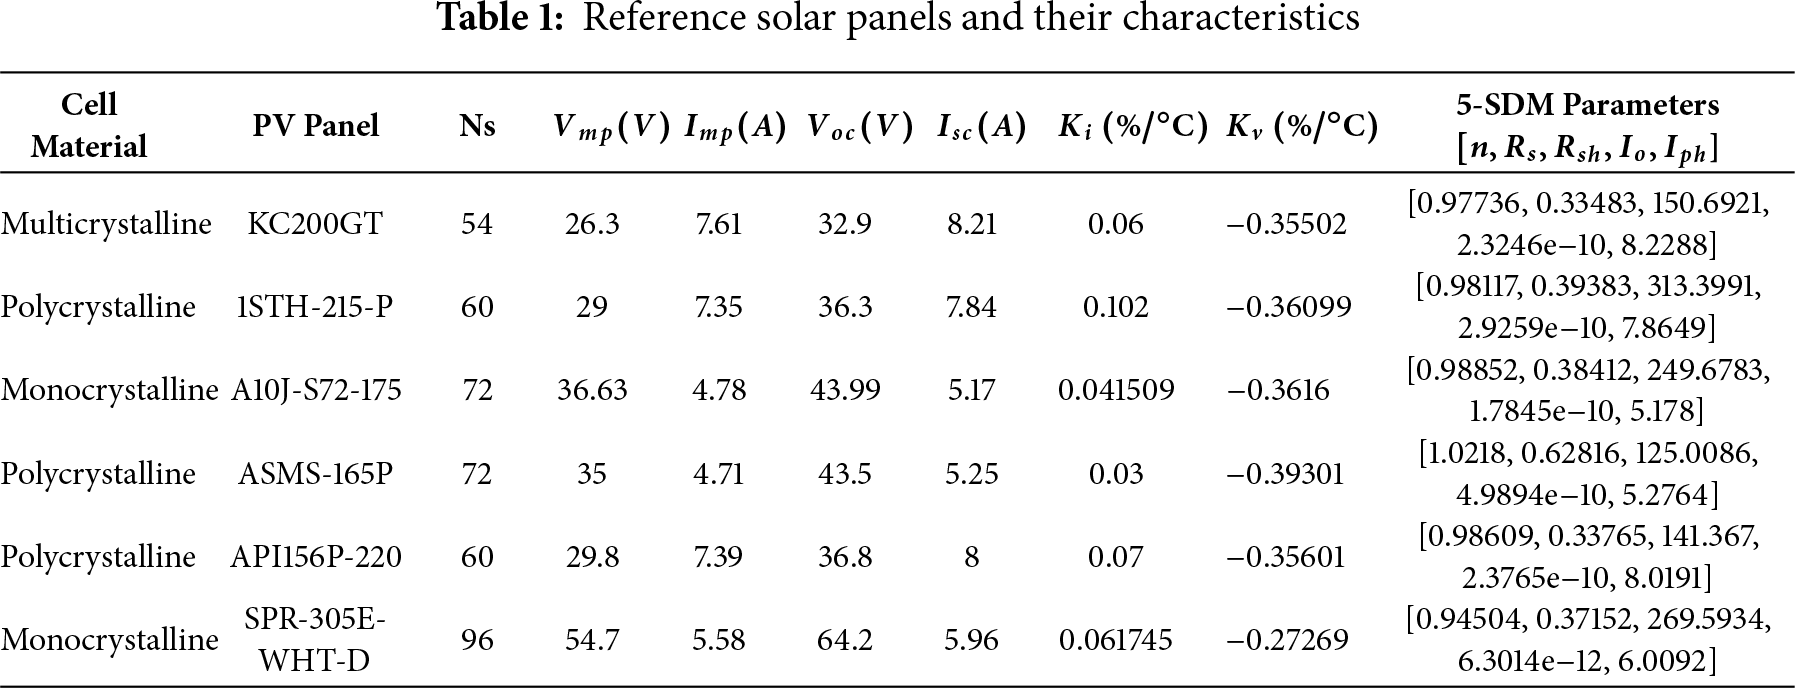
Several numerical investigations were carried out in MALAB/Simulink to study the developed models. For comparison the most recent reference is the explicit PV model (EPVM) PVE recently proposed in [11]. For these investigations, 6 solar panels were considered as comprehensively characterized in Table 1. The single diode parameters (SDM) of the panel models are inherently provided by Simulink PV array package. To appreciate the new Lambert derived model and show that it solves the problem of accuracy degradation inherent in the EPVM, we employ the IEC EN 50530 standard test. This standard stipulates that the absolute error within the vicinity of ±10% of the PV panel’s maximum power point (MPP) should always be less than or equal to 1% [19]. The mathematical expression used for this evaluation is expressed as:
where the reference r represents the measured value of the actual PV curve and s represent the computed value. This standard allows us to appreciate the accuracy of the EPVM model as well as our developed model [V-Lambert model] around the vicinity of the MPP. In this evaluation only the V-Lambert model is considered to show the prowess of the method. Then subsequently for PVE operations, the R-Lambert model will be used. The numerical results gathered for the 6 solar panels are presented in Table 2. It can be seen that the error achieved by the different models across the 6 panels does not violate IEC 50530 standard. It is also seen that the proposed model yields lower errors compared to EPVM model. Comparatively, it is 34.6298 times more accurate than the EPVM for the KC200GT, 50.9635, 17.92, 61.2394, 31.0728 and 9.32 times more accurate than its EPVM counterpart for the 1STH-215-P, A10J-S72-175, ASMS-165P, API156P-220, and SPR-305E-WHT-D solar panels, respectively. This is numerically presented in the bar chart of Fig. 6.
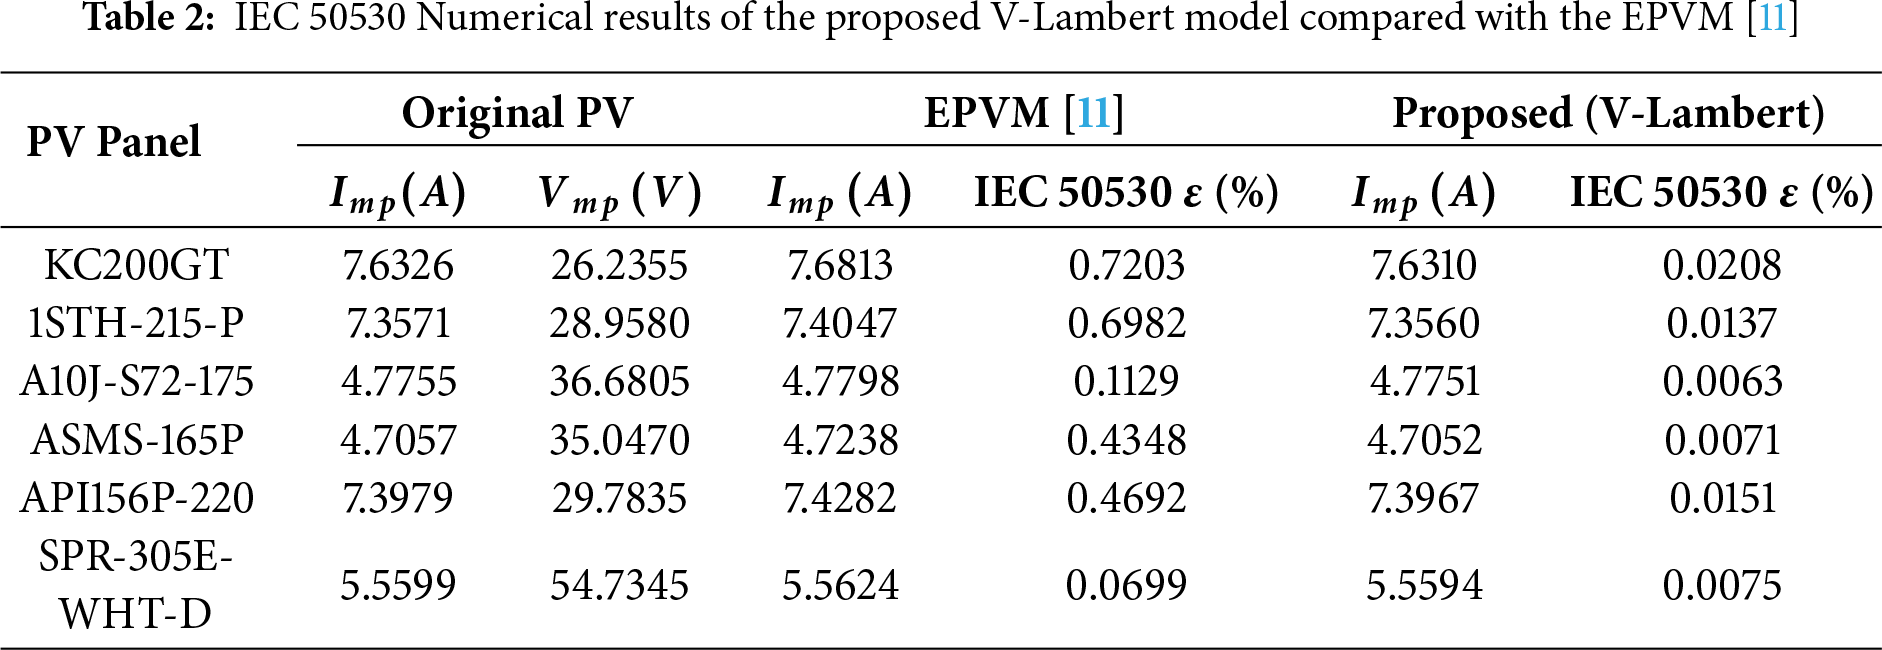
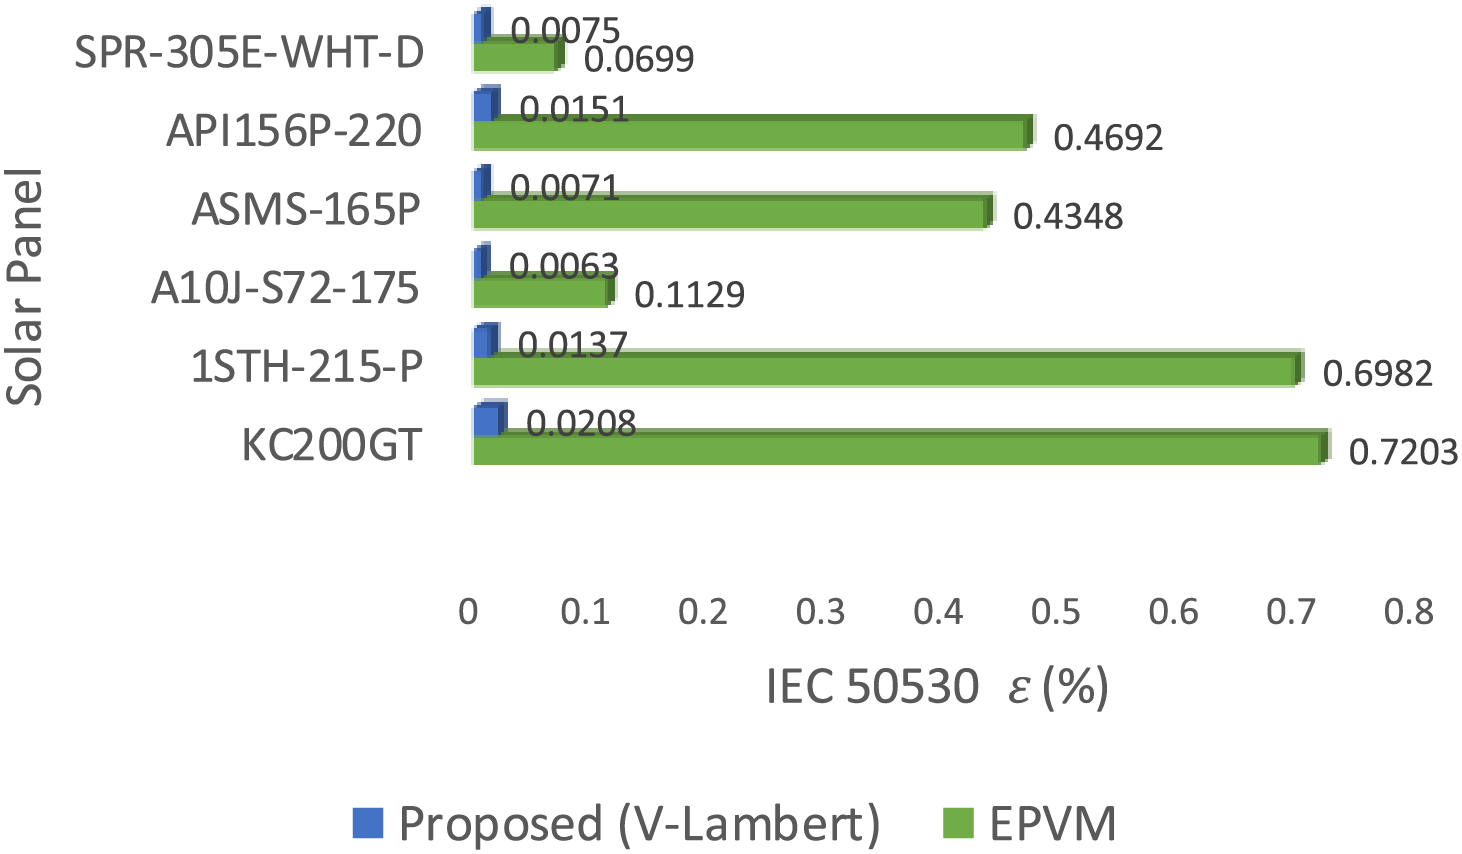
Figure 6: Bar chat of the IEC 50530
A plot of the I-V curve of the different models for the KC200GT is shown in Fig. 7, at G = 1000 W/m2, which shows that the two models align well with the actual reference solar panel, except around the vicinity of
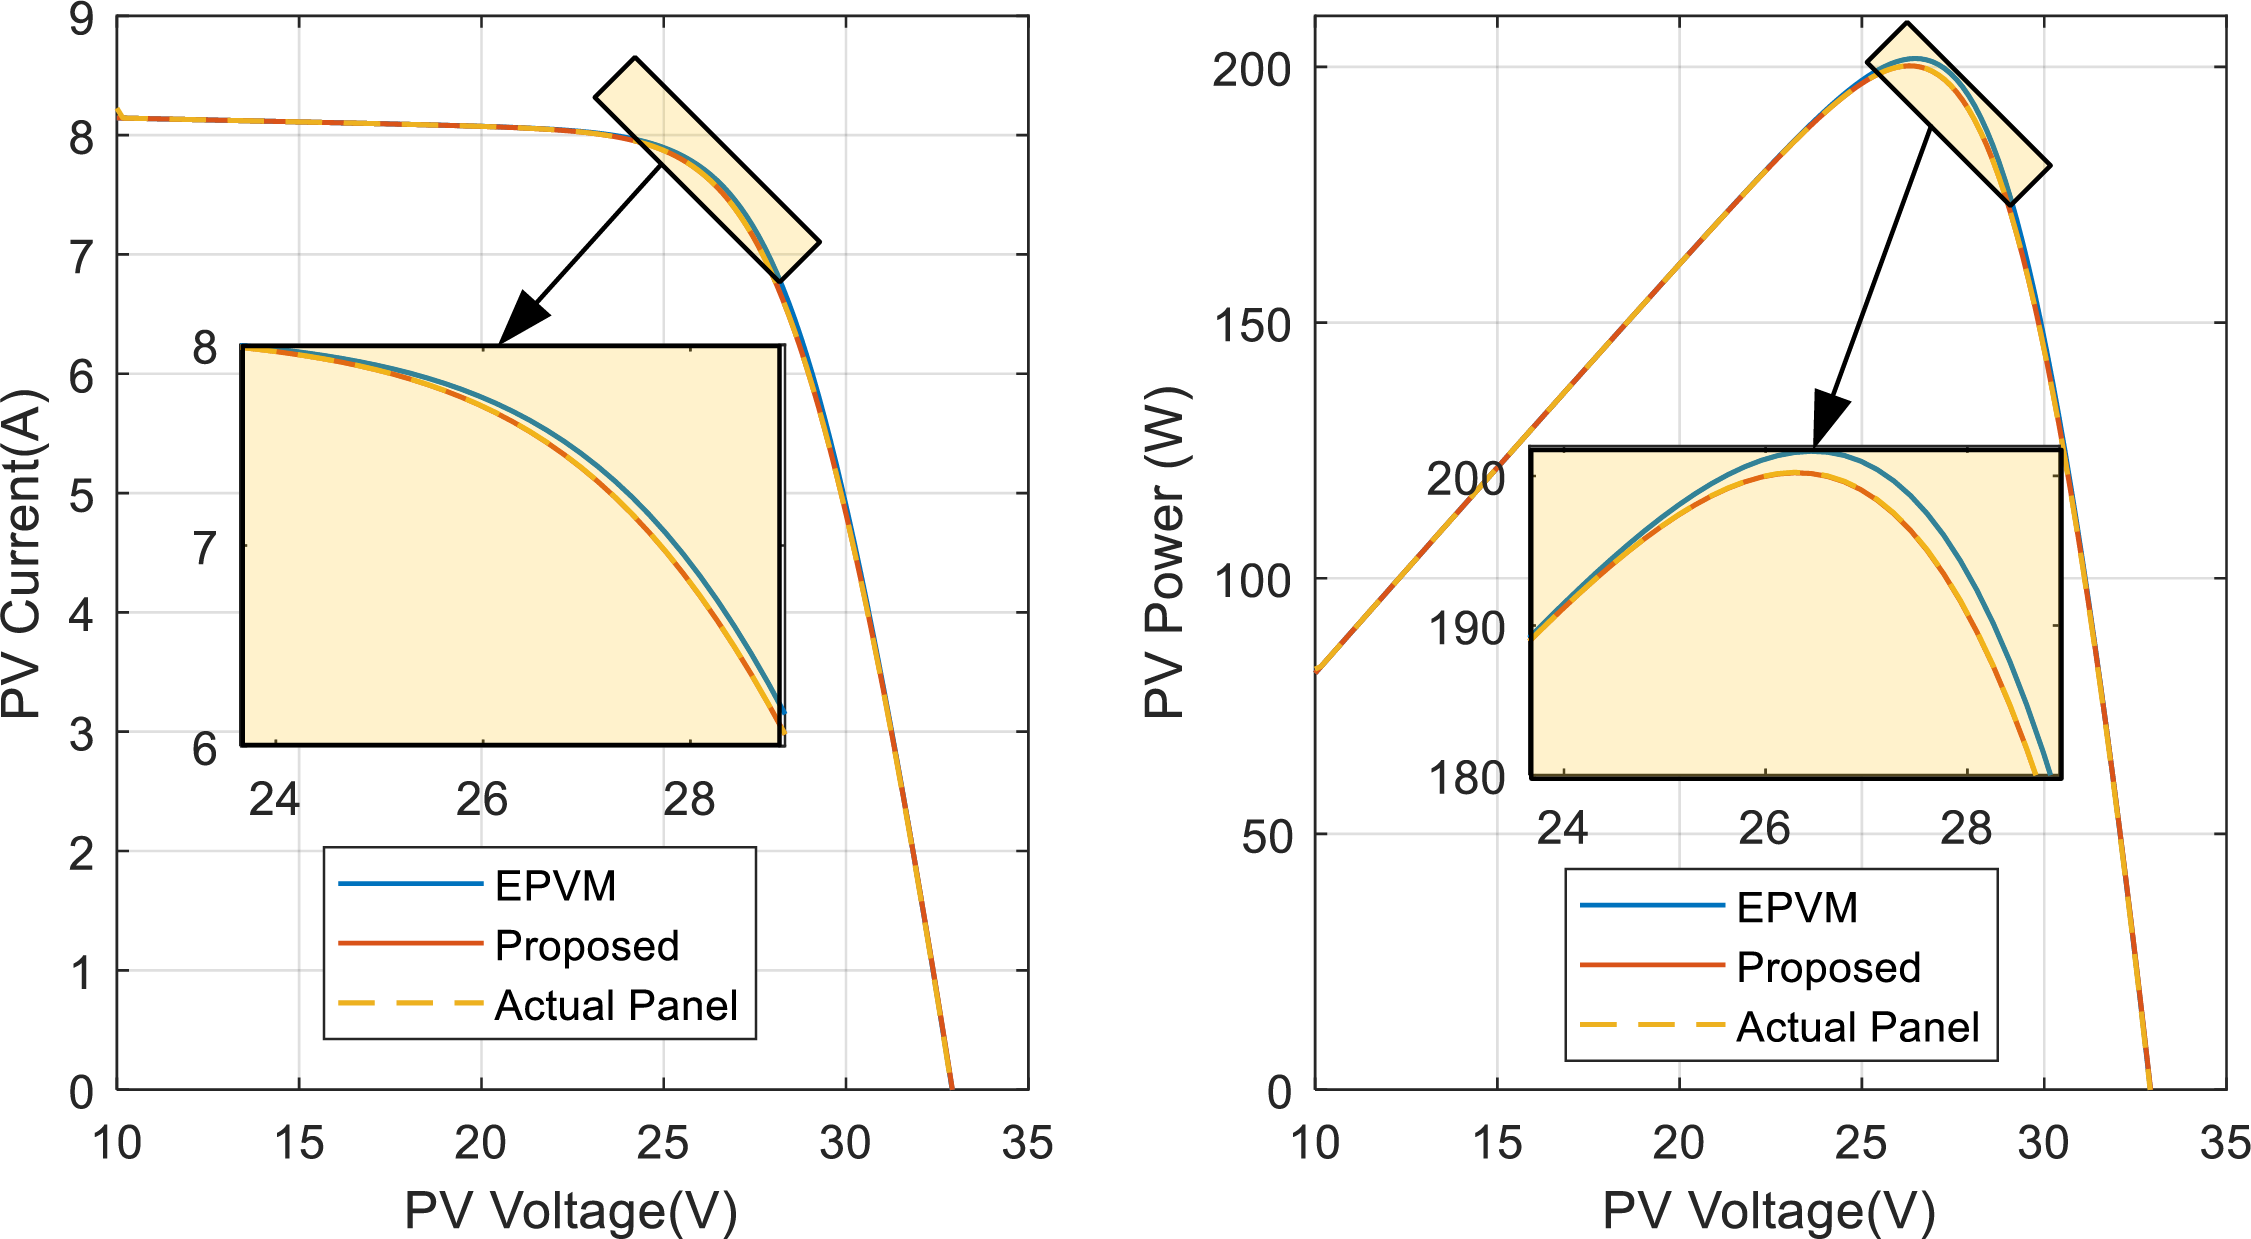
Figure 7: PV curves of the actual solar panel superimposed on the different models for the KC200GT, G = 1000 W/m2
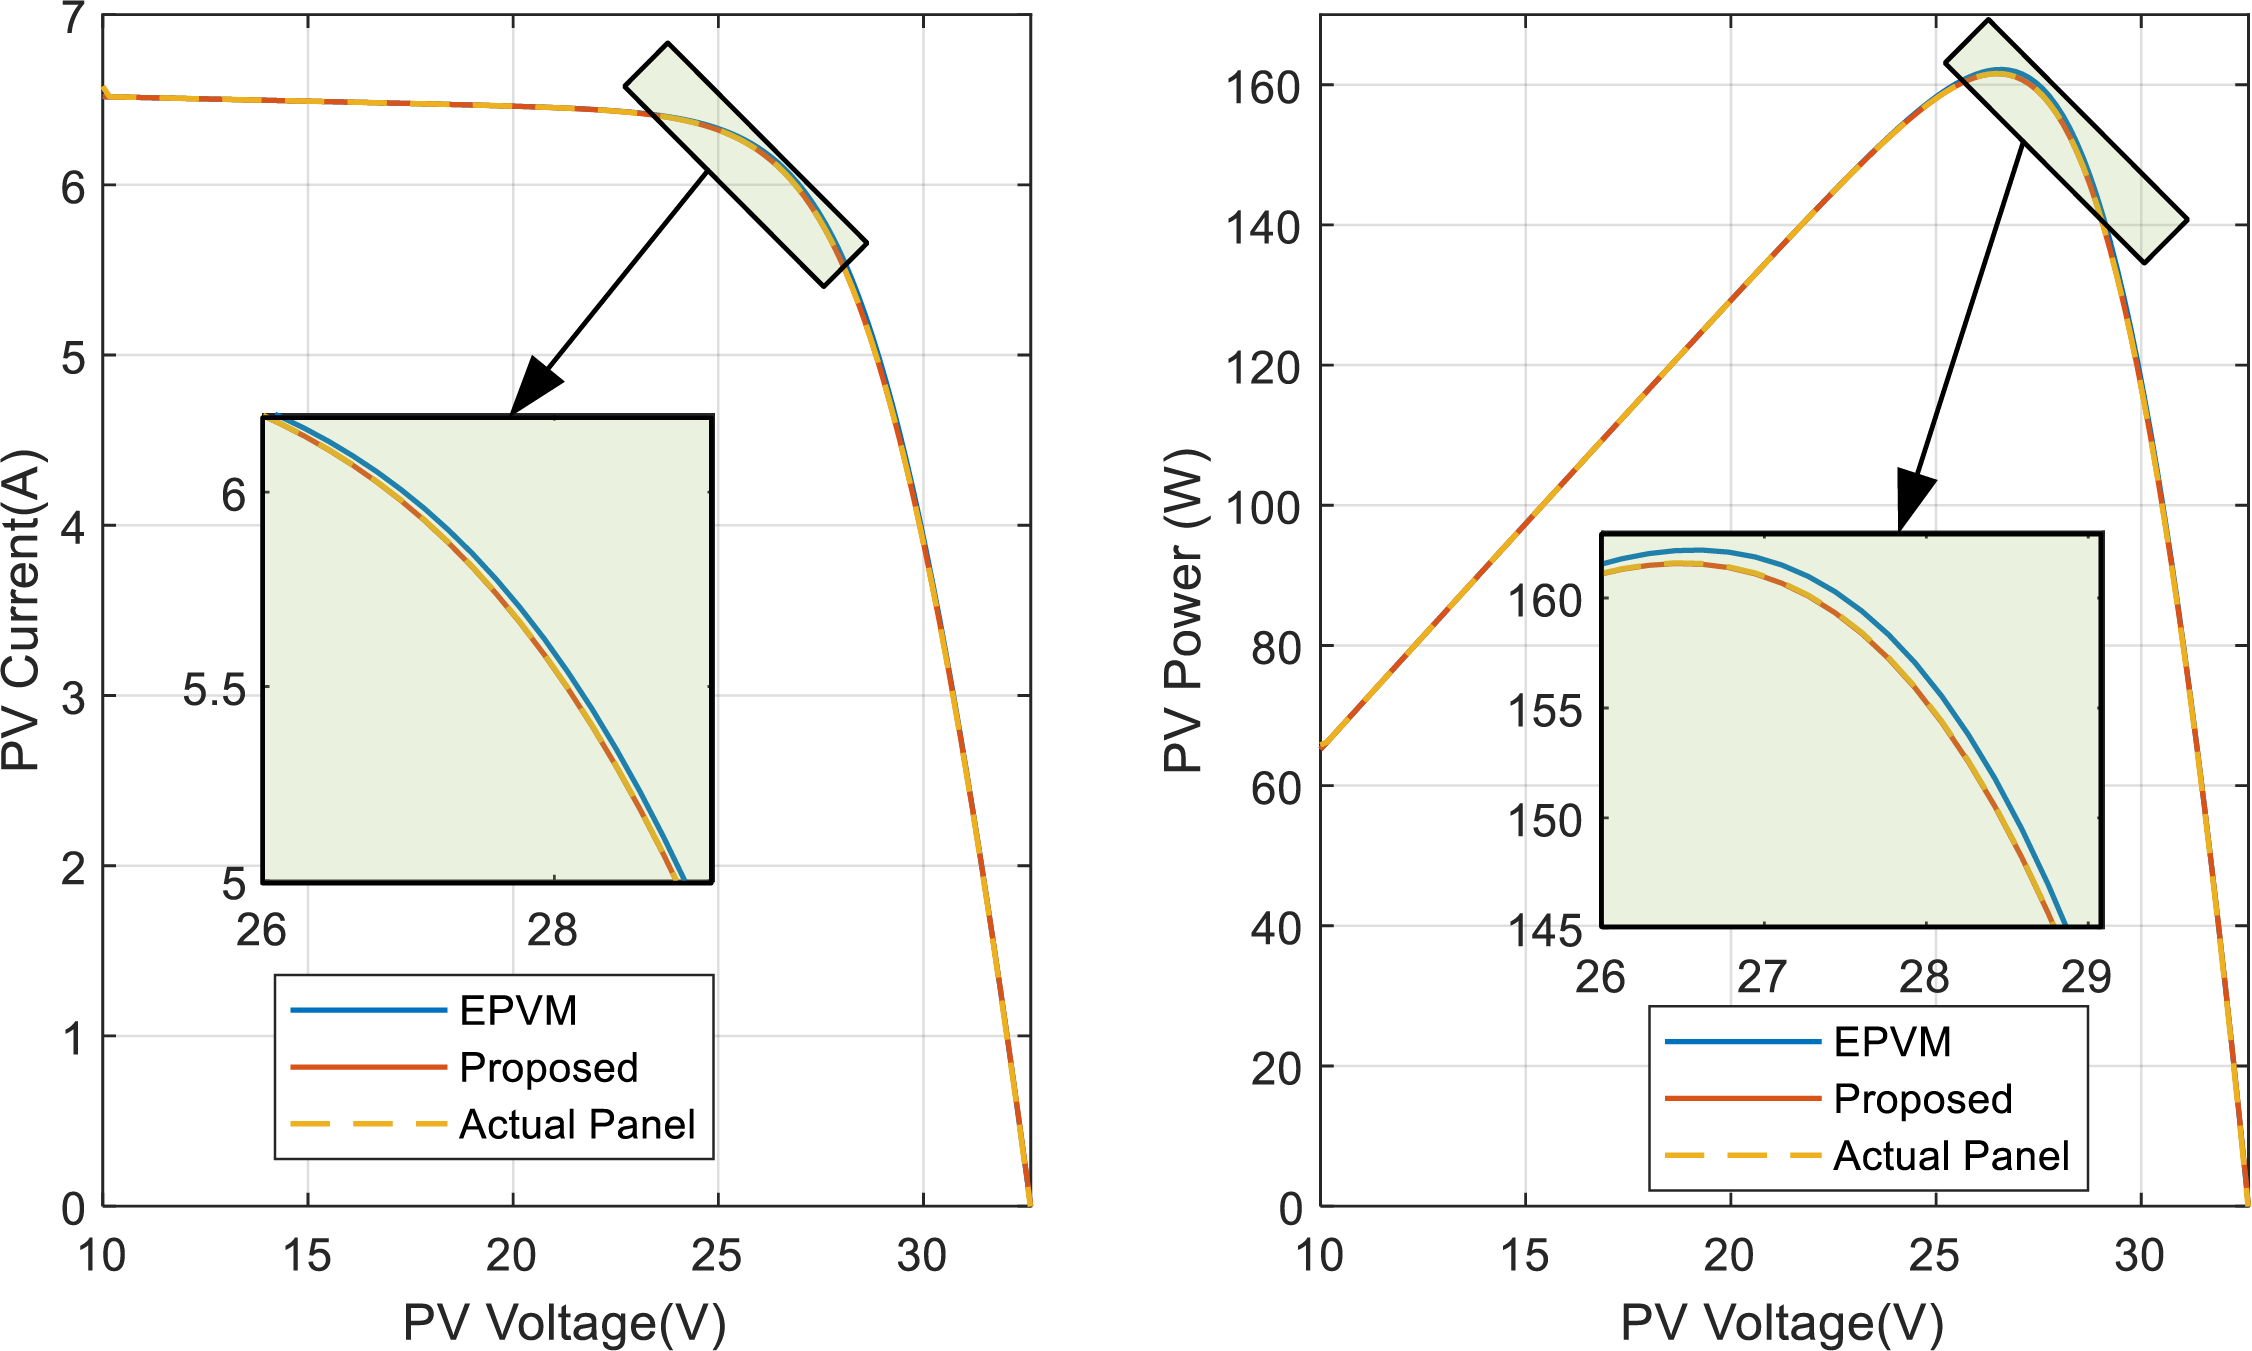
Figure 8: PV curves of the actual solar panel superimposed on the different models for the KC200GT, G = 800 W/m2
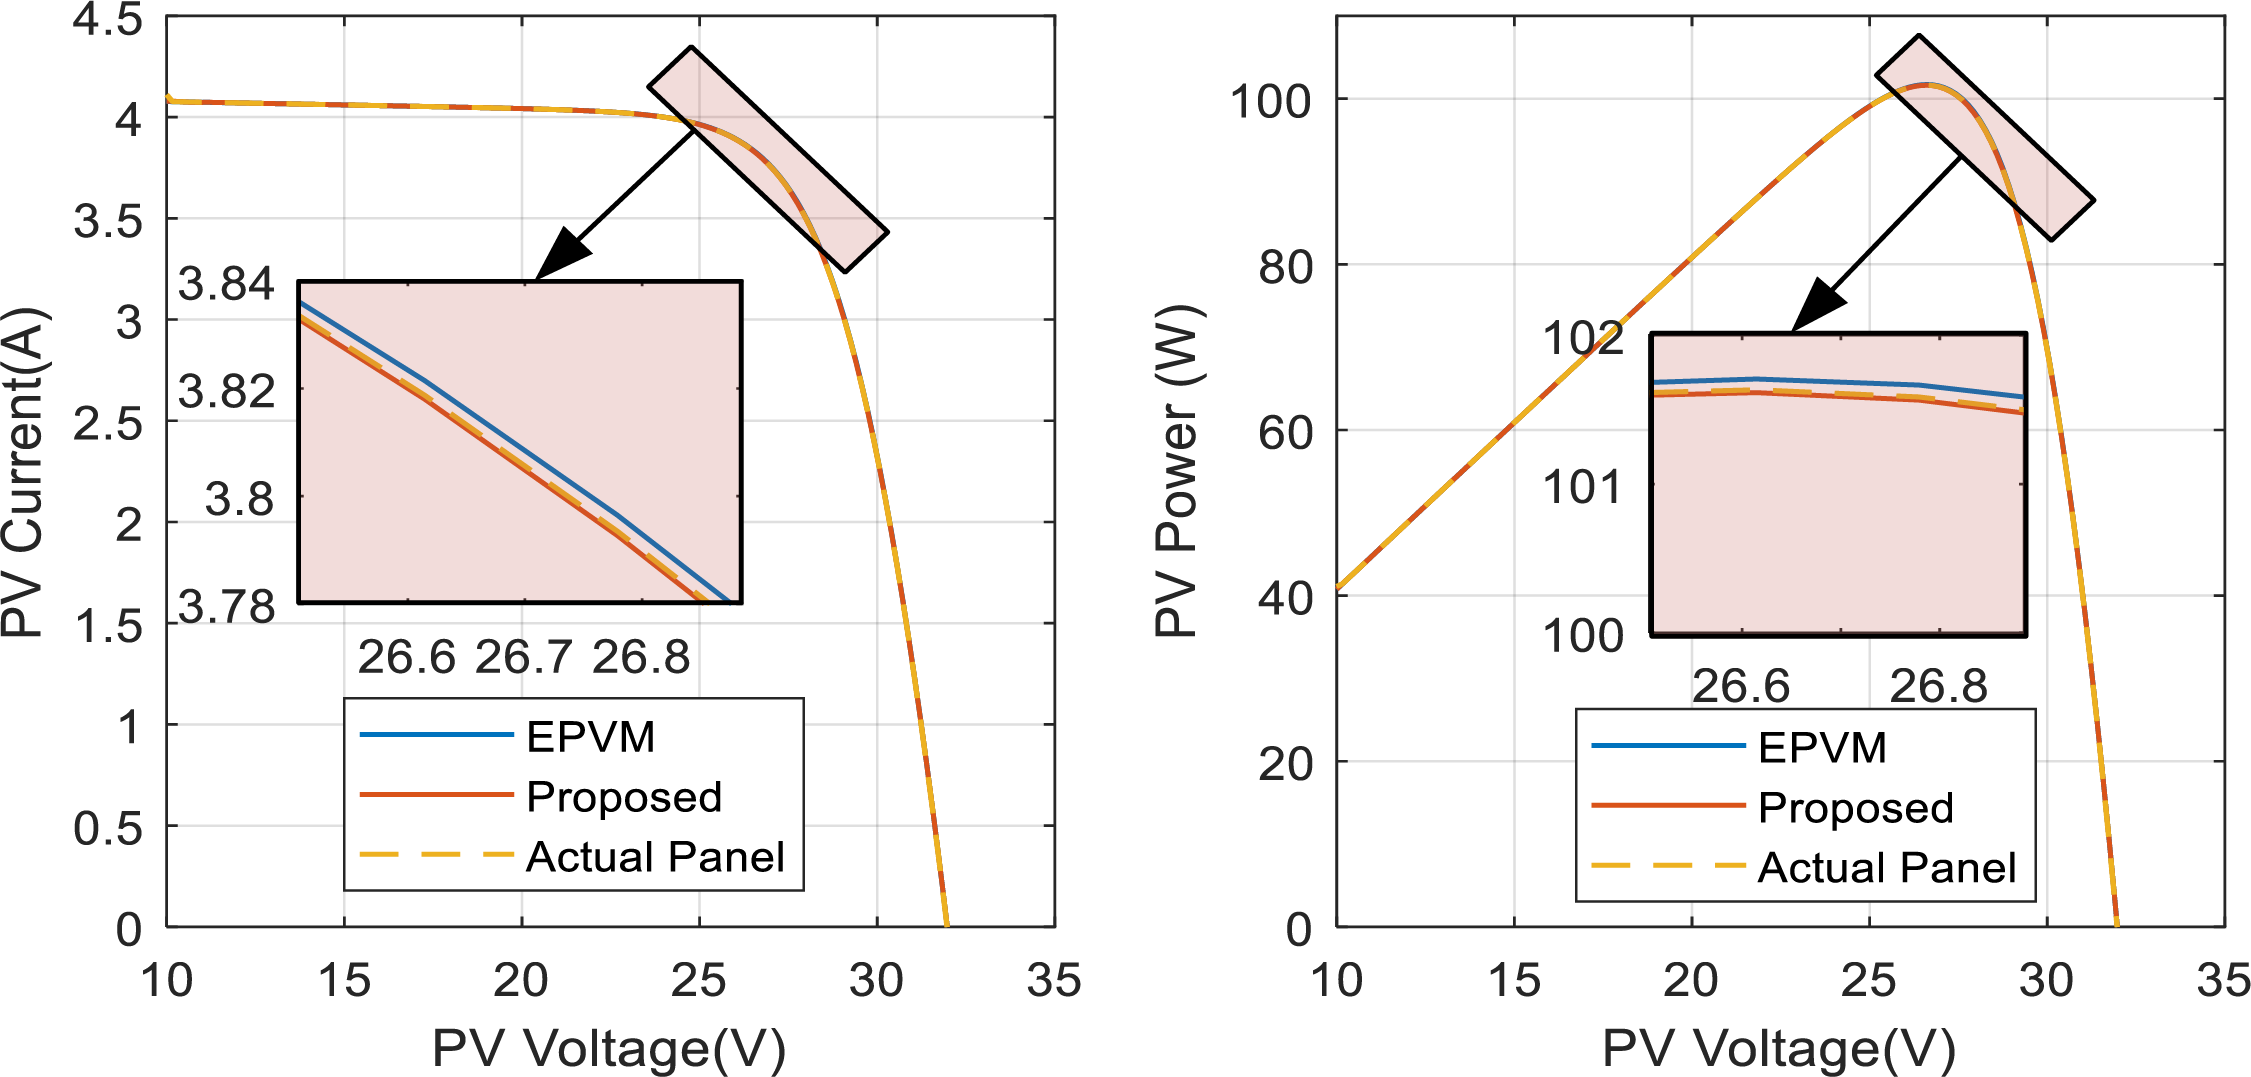
Figure 9: PV curves of the actual solar panel superimposed on the different models for the KC200GT, G = 500 W/m2
For the other panels, including 1STH-215-P, A10J-S72-175, ASMS-165P, and API156P-220, as seen in Figs. 10–14, the error disparity of the EPVM around the vicinity of the MPP is more pronounce both for the current-voltage curve [on left] as well as power voltage curve [on right]. While on the other hand, the proposed model maintains steady alignment with the reference solar panel even around the vicinity of the MPP. The relevance of demining the error around the MPP is crucial for evaluating MPPT algorithms, this therefore underscores the significance of this study. In the final solar panel type, SPR-305E-WHT-D, our EPVM reveals a relatively small error around the MPP. However, its degradation is still relevant as the proposed archives an error that is 9.32 times lower than it.
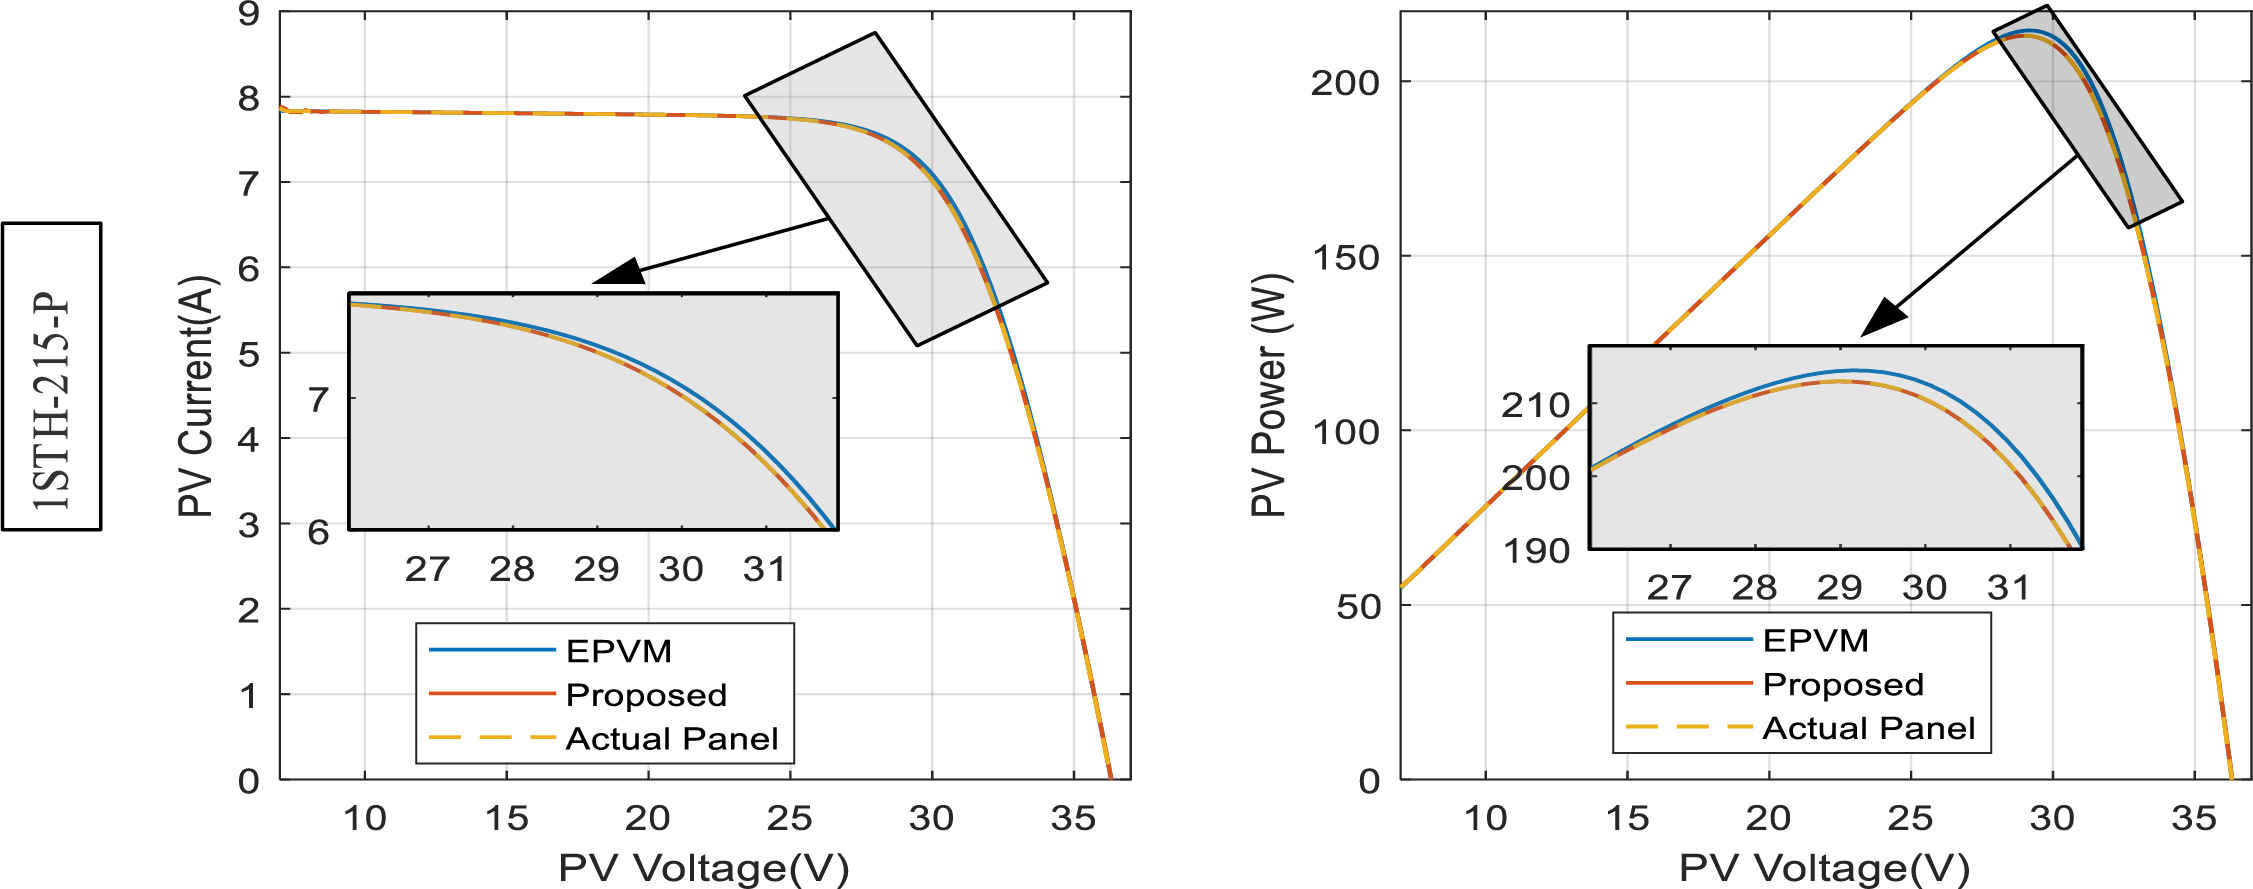
Figure 10: PV curves of the actual solar panel superimposed on the different models for the 1STH-215-P, G = 1000 W/m2
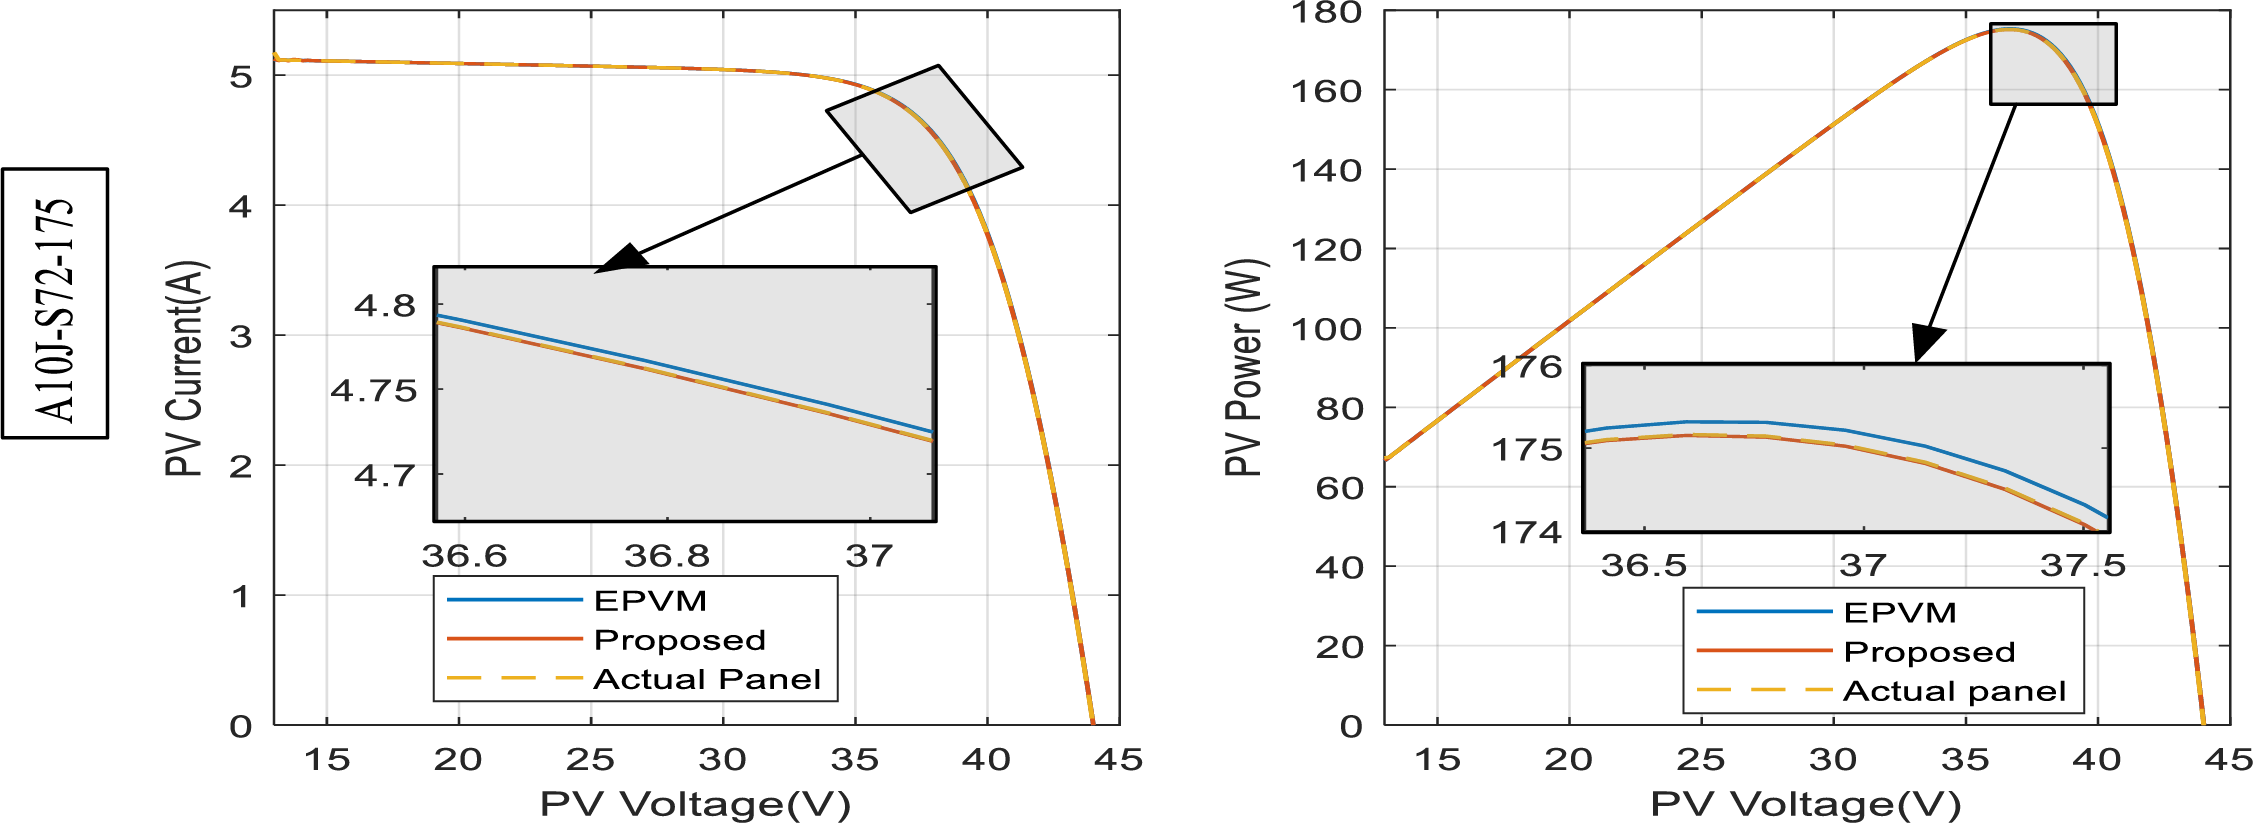
Figure 11: PV curves of the actual solar panel superimposed on the different models for the A10J-S72-175, G = 1000 W/m2
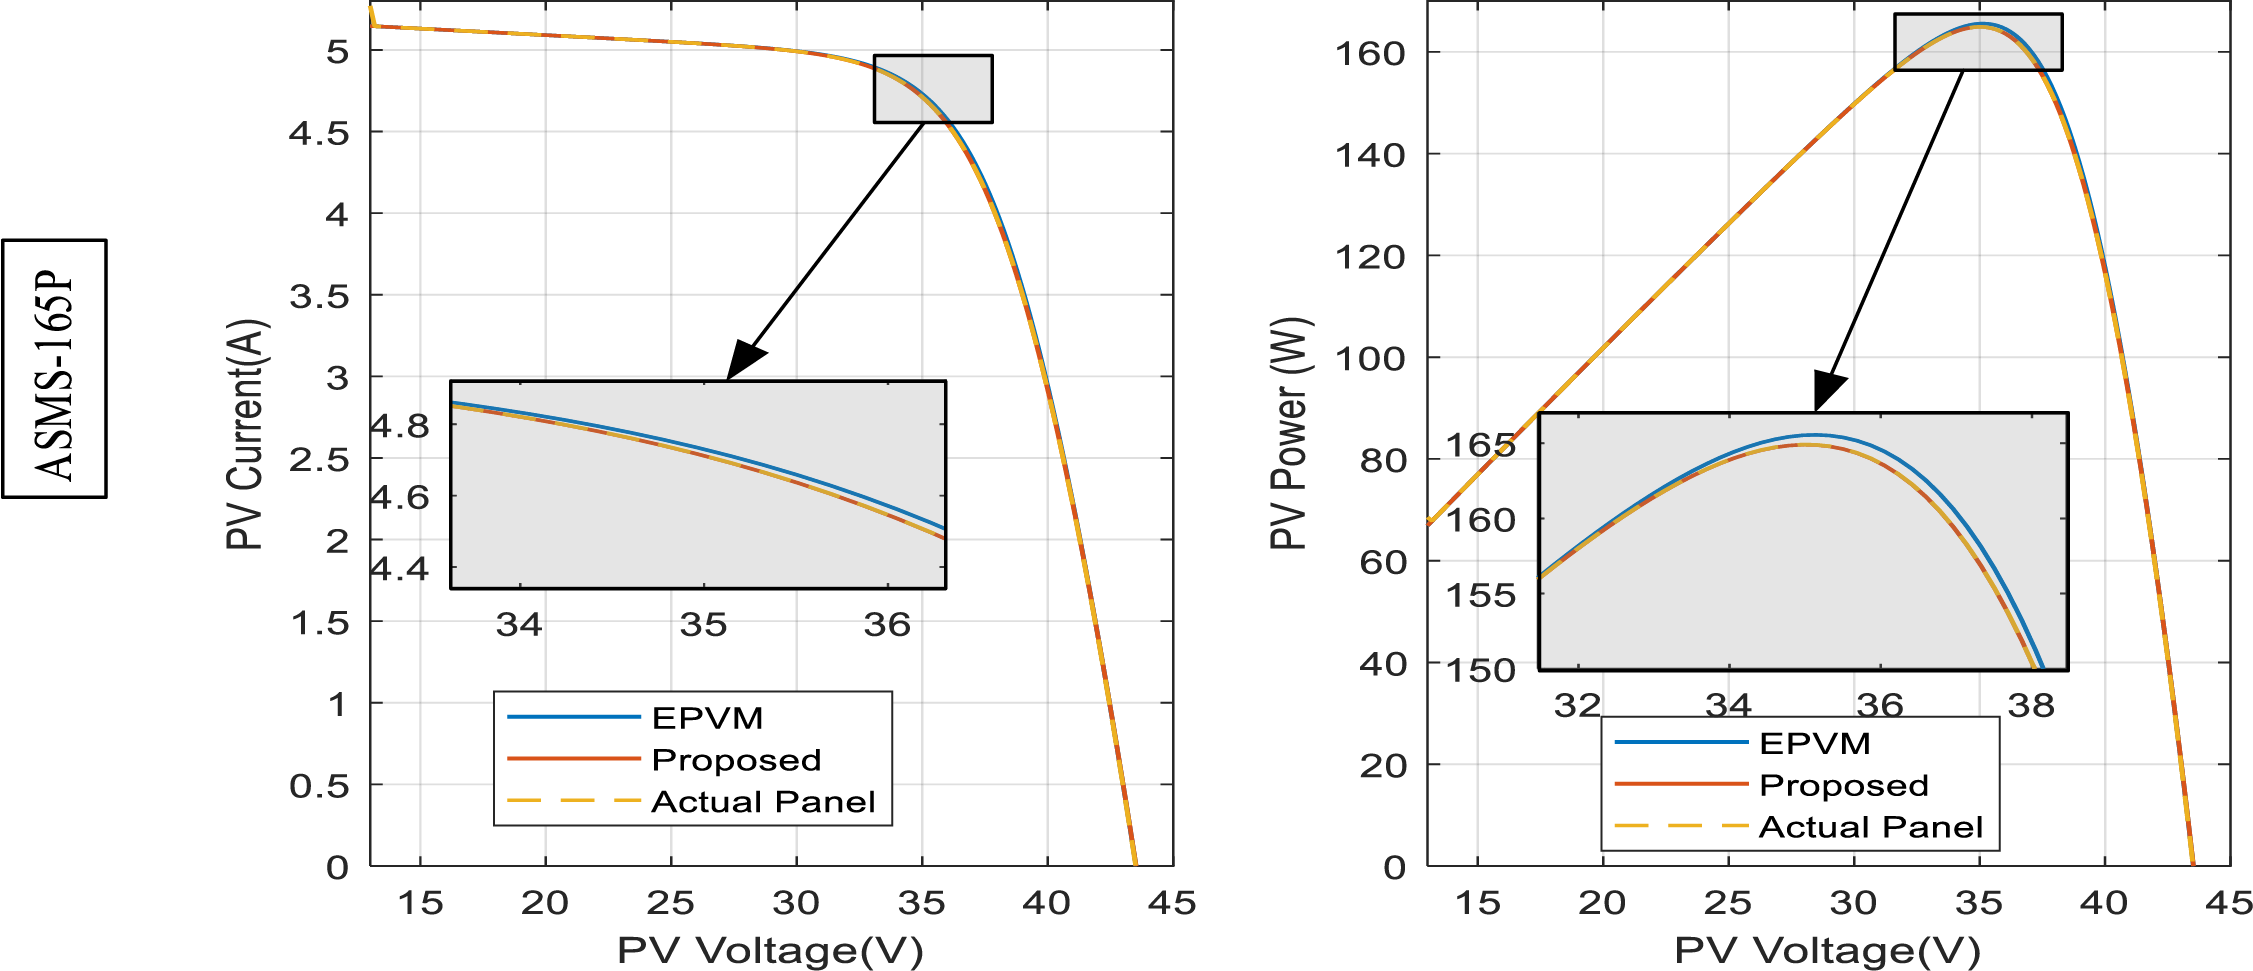
Figure 12: PV curves of the actual solar panel superimposed on the different models for the ASMS-165P, G = 1000 W/m2
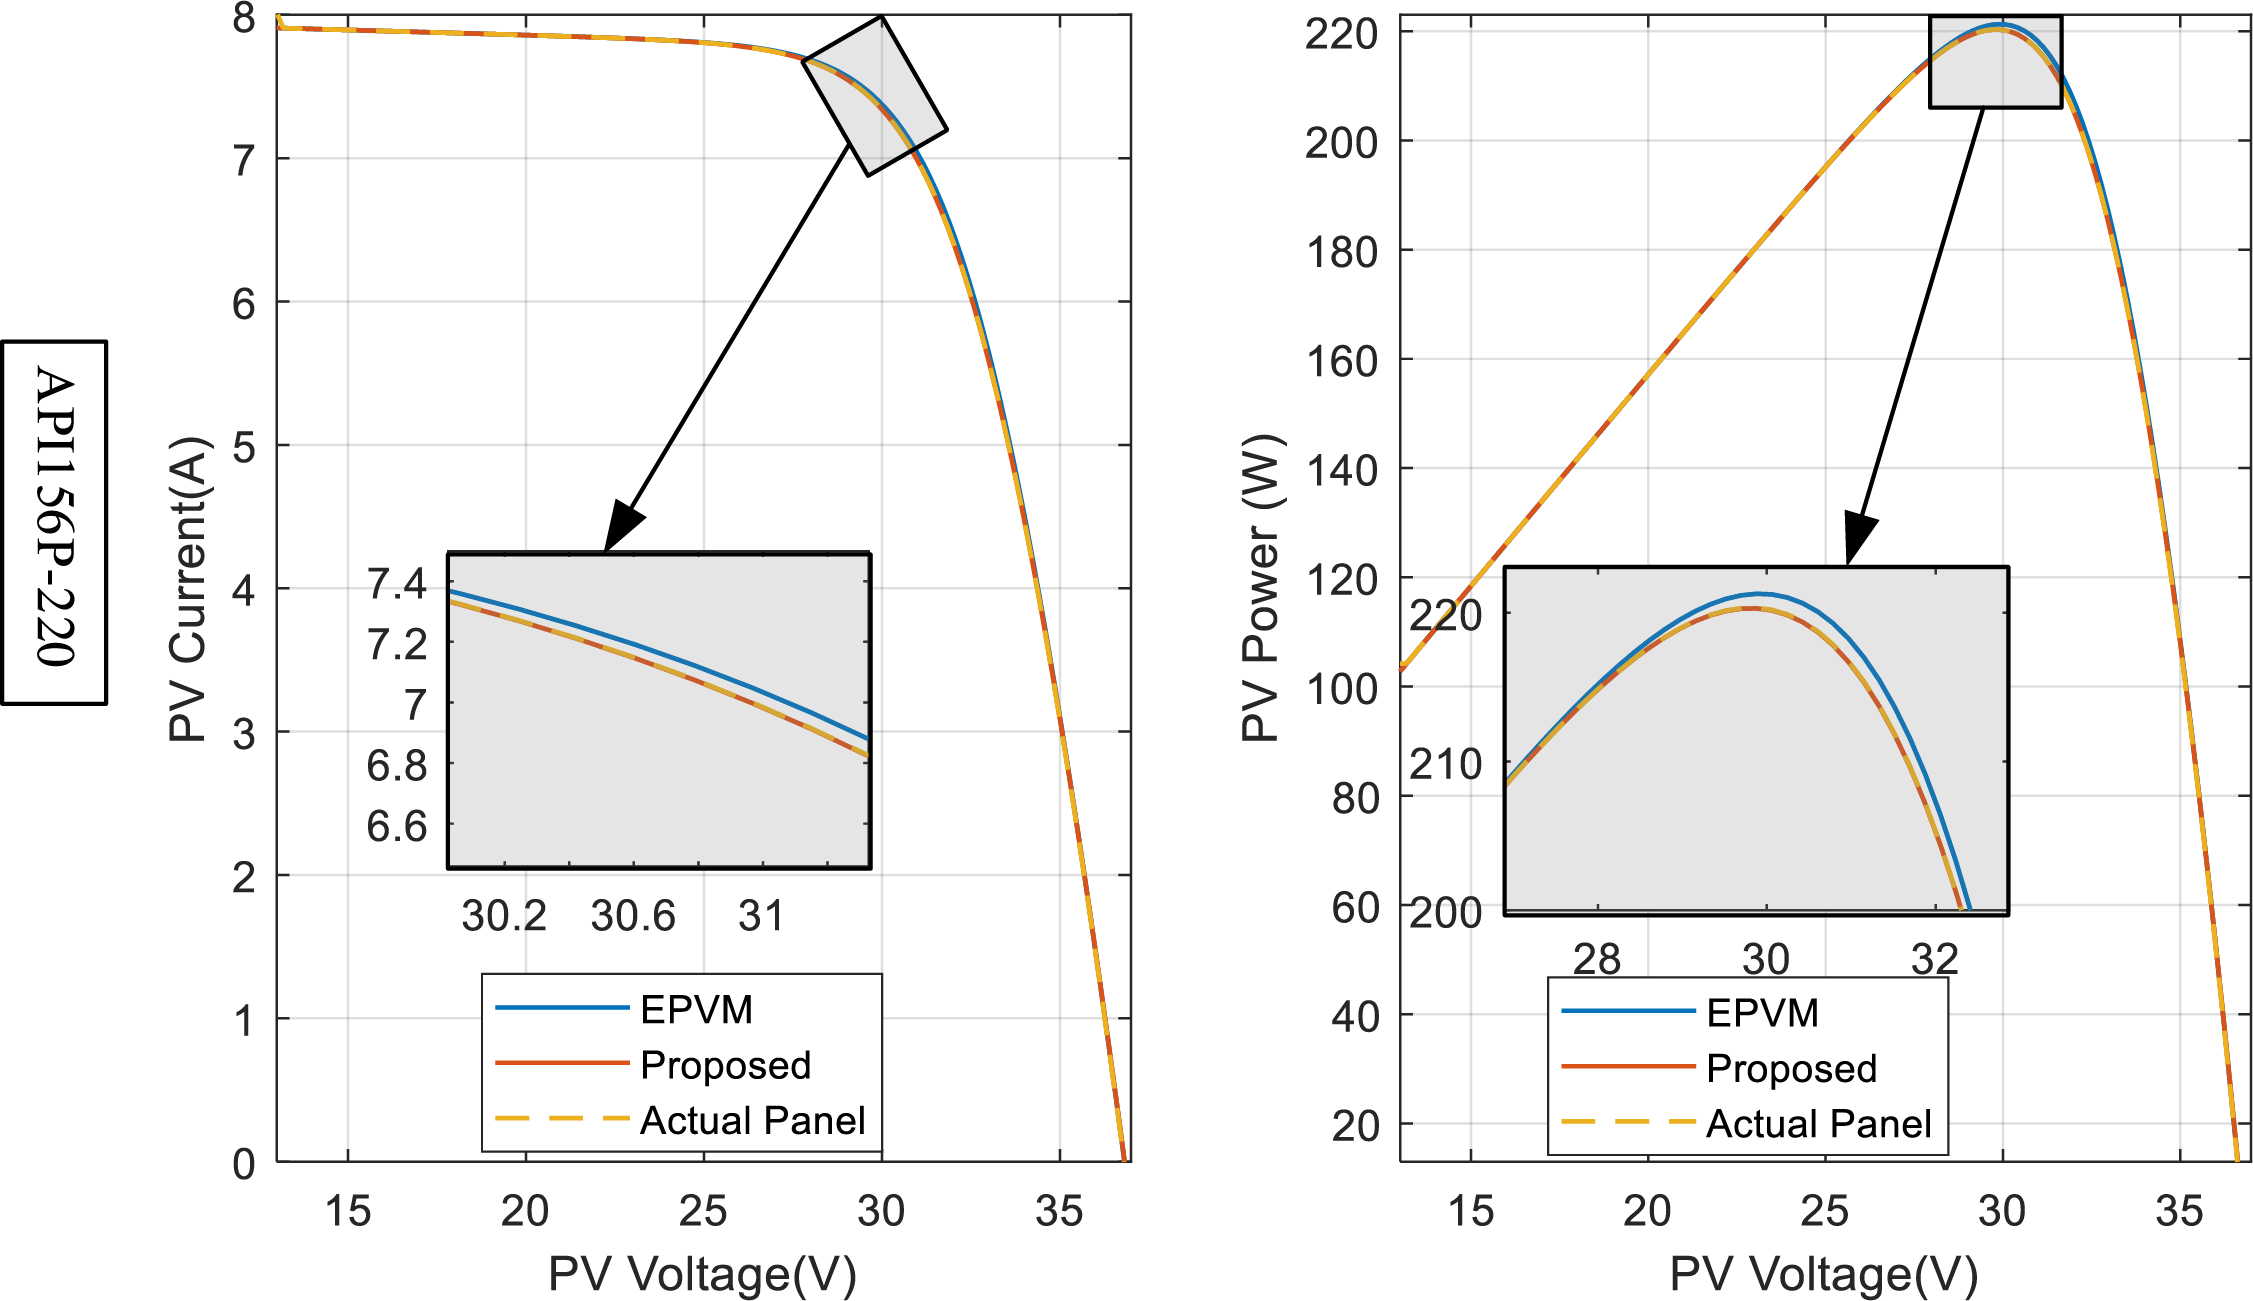
Figure 13: PV curves of the actual solar panel superimposed on the different models for the API156P-220, G = 1000 W/m2
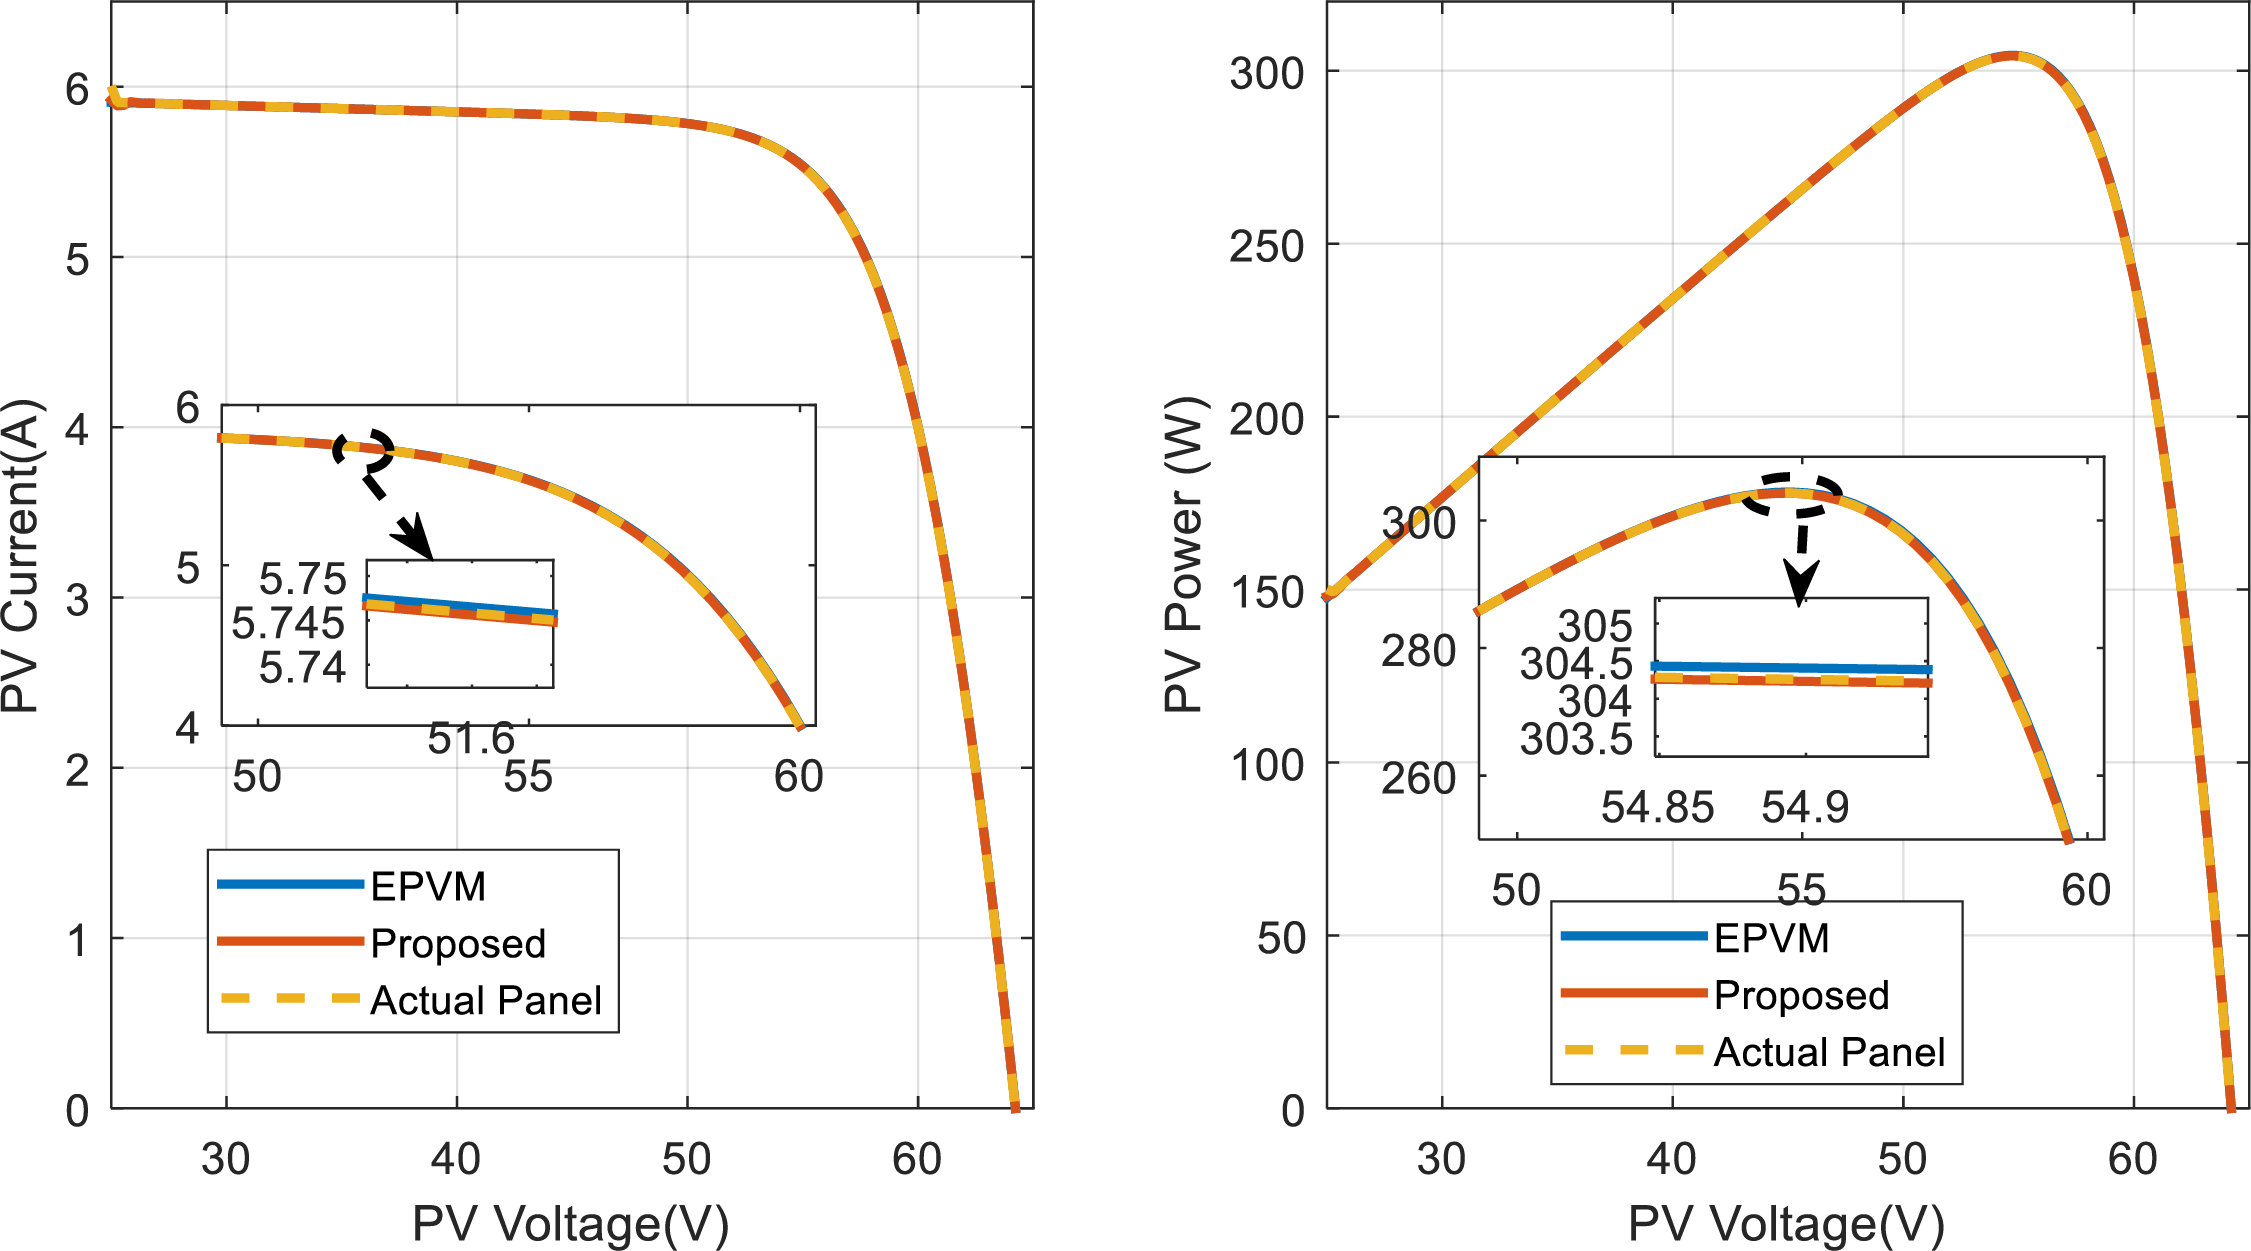
Figure 14: PV curves of the actual solar panel superimposed on the different models for the SPR-305E-WHT-D, G = 1000 W/m2
3.1 Dynamic Assessment of the PVE
In this section, the actual performance of the PVE was evaluated under both distinct environmental conditions as well as load conditions. For this purpose, the PVE is implemented as a closed loop system (see Fig. 5). A single solar panel is considered. The KC200GT solar panel type was chosen for evaluations. The panel is integrated and computed using the R-Lambert model.
The dynamic response of the PVE for four cases of Rpve is presented in Fig. 15. Firstly, it can be seen that the reference current effectively aligns with the actual solar panel (see Fig. 15a–d). This indicates the high efficacy and accuracy of the R-Lambert computation scheme. On the other hand, it is clear that the PVE initially follows the actual solar panel and aligns with it perfectly at steady-state. This shows that there is effective solar panel emulation. The current and voltage plot of the PVE shows that when it operates on a load of Rpve = 1 Ω, the emulator takes approximately 6 ms to settle between ±1% of the actual solar panel. This is the time taken for the emulator to become stable, replicating the dynamic behavior of the solar panel. Under the special condition of MPP, that is, Rpve = 3.456 Ω, the emulator takes 16.55 ms to emulate the solar panel. Furthermore, for Rpve = 20 Ω, the emulator takes approximately 60.2 ms and at Rpve = 50 Ω, the actual PV is emulated in 135 s. It is evident that the emulation time increases with the load as expected.
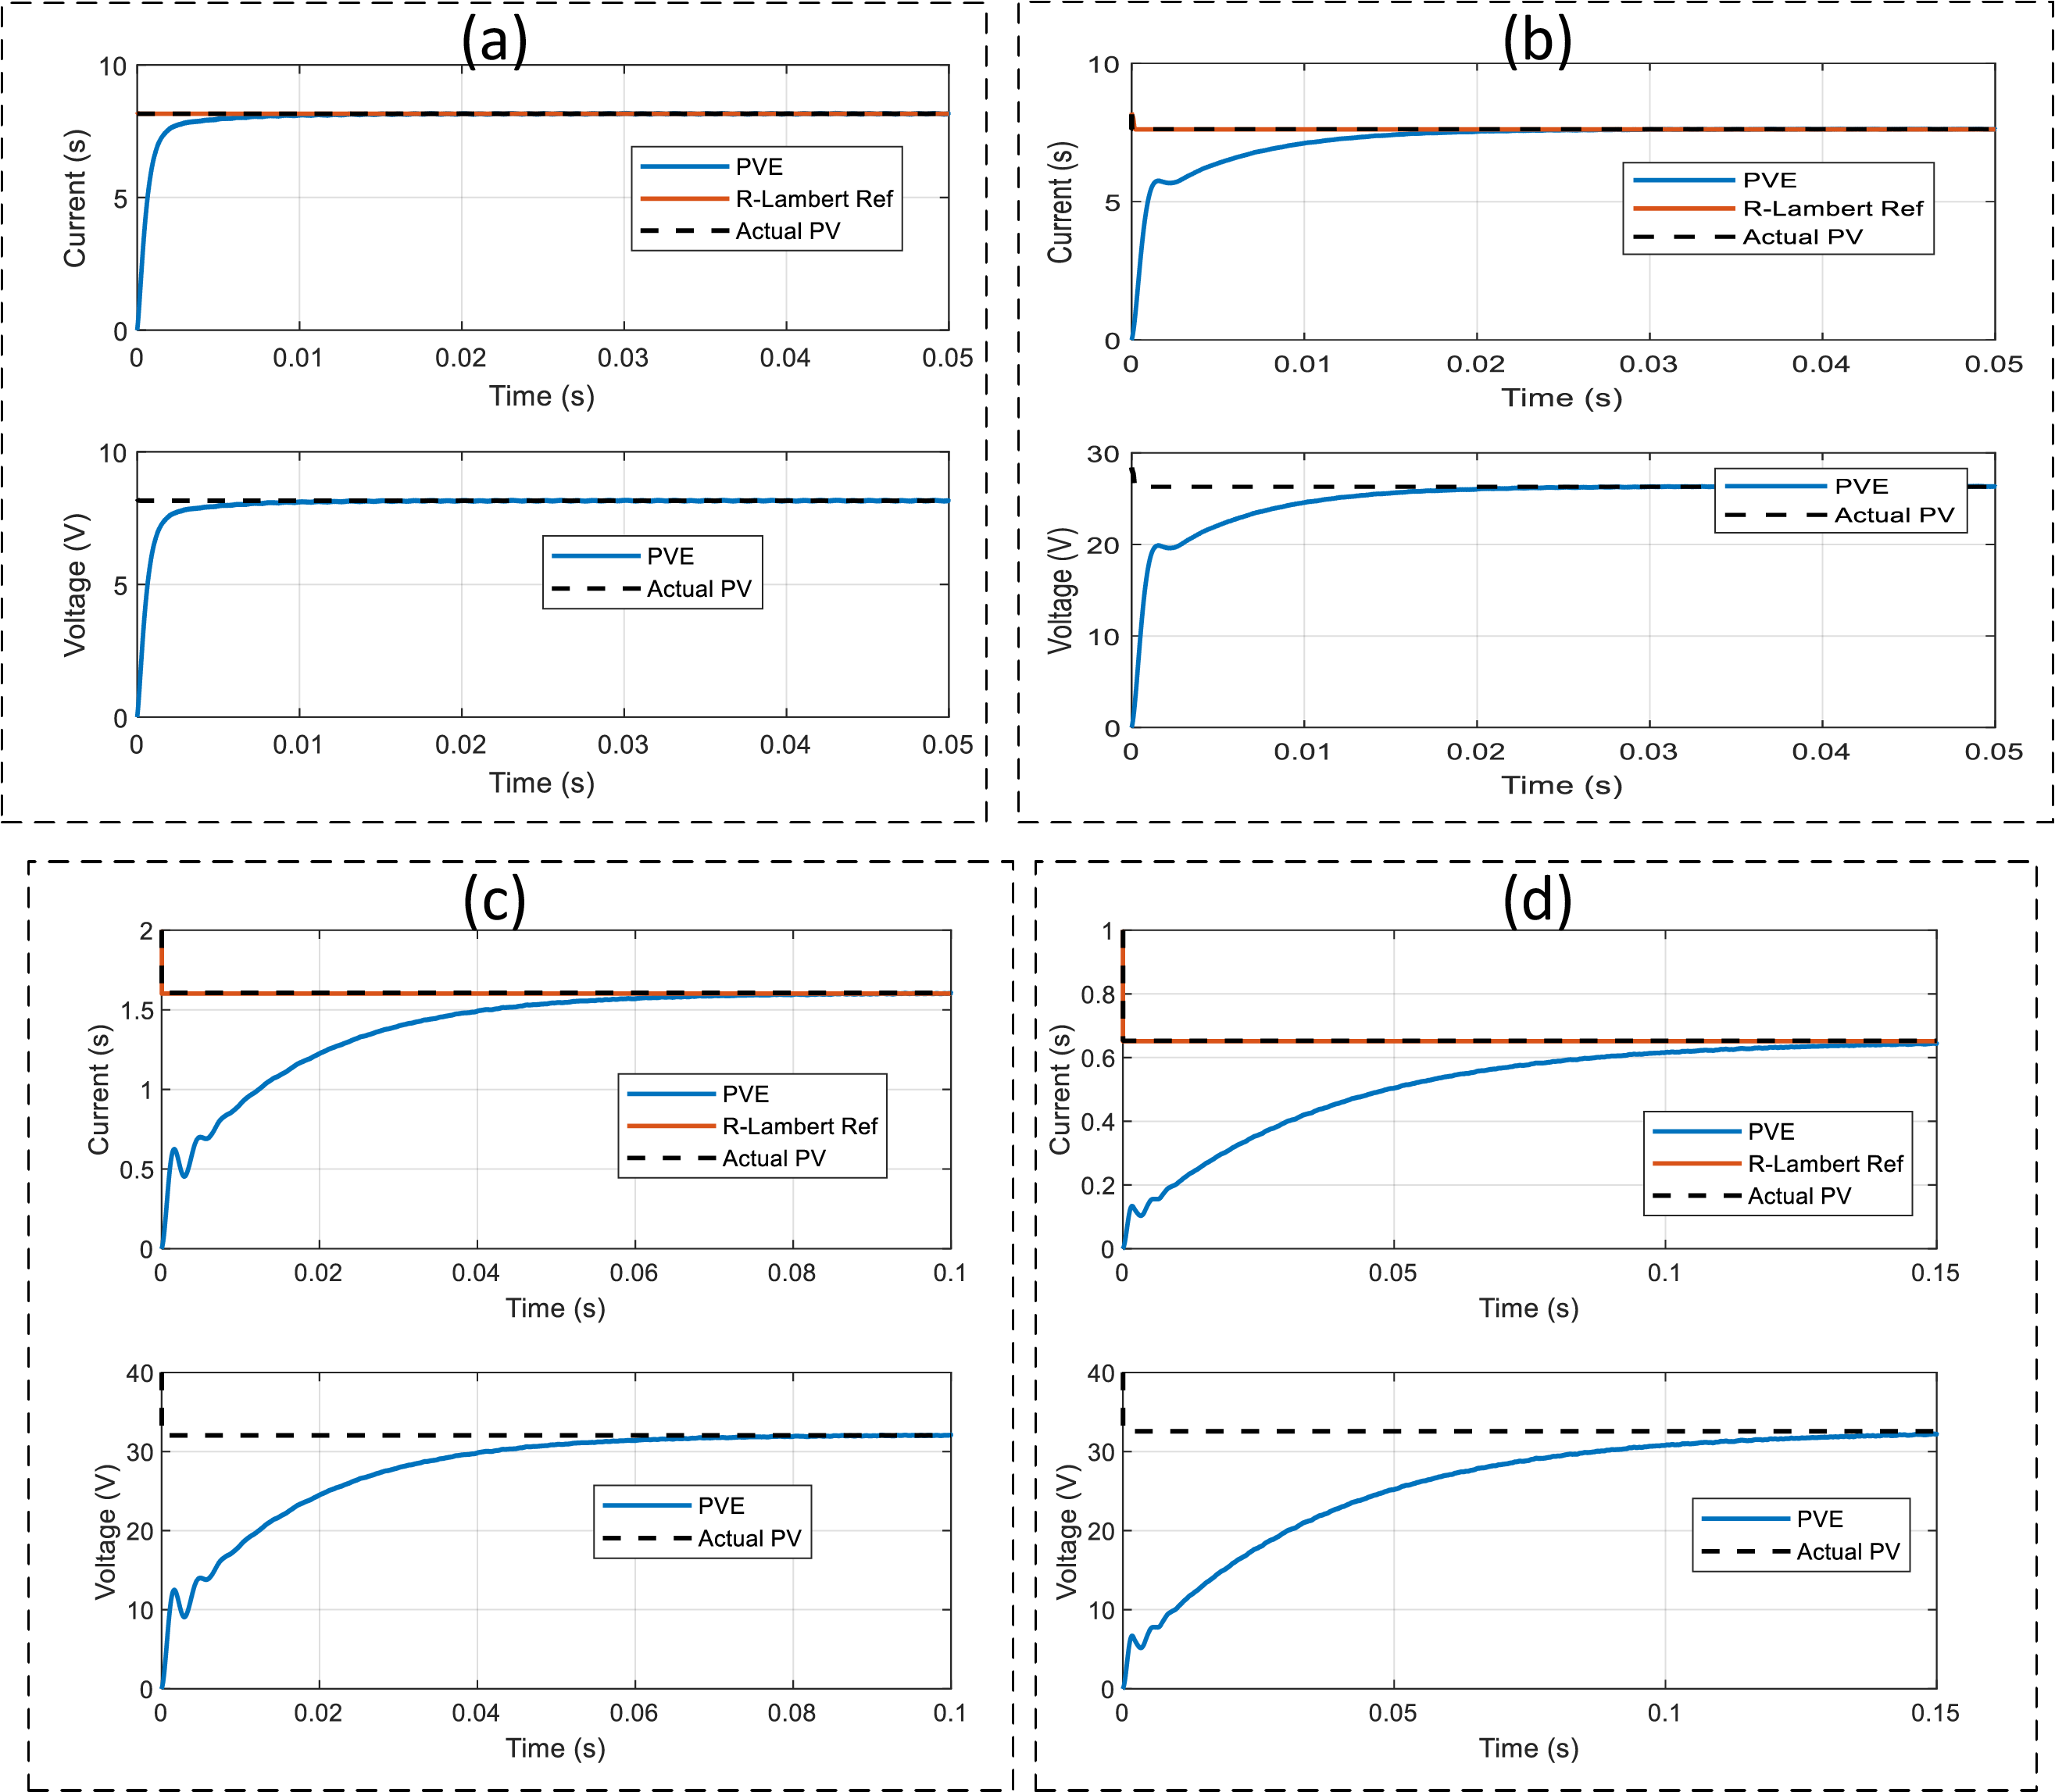
Figure 15: Dynamic response of the PVE under different loading conditions for G = 1000 W/m2. Plots of Actual solar panel superimpose on the PVE alongside the R-Lambert current reference at (a) Rpve = 1 Ω (b) Rpve = 3.456 Ω (MPP) (c) Rpve = 20 Ω (d) Rpve = 50 Ω
To validate the efficacy of the developed PVE, an experimental platform was designed, as illustrated in Fig. 16. Implementing a physically embedded processor into the plant model and its associated control in order to conduct a closed loop experimental evaluation is the primary objective of this undertaking. The integration procedure in question is referred to as “Processor-in-the-loop” (PIL). The control strategy of the PVE is implemented by the target hardware of the embedded processor, which in our case is an Arduino Uno processor, throughout the PIL test. This configuration permits testing the efficacy of the developed PVE on a physical embedded board. The implementation of the controller on a digital signal processor is facilitated by code generation in Simulink. The hardware substrate upon which the PIL investigations are conducted is the embedded board, which is an Arduino Uno board as illustrated in Fig. 16. While the host computer processes the complete system, the code generated by Simulink is executed directly on the Arduino. Data exchange takes place through the utilization of a serial communication cable and a USB cable. The aim of this arrangement is to illustrate that the embedded processor effectively implements the PVE control (R-Lambert+ Discrete PI controller) and that the PVE in its entirety simulates the solar panel in a timely manner. The PI controller in this implementation was discretized as shown in the schematic diagram. Its parameters are effectively,
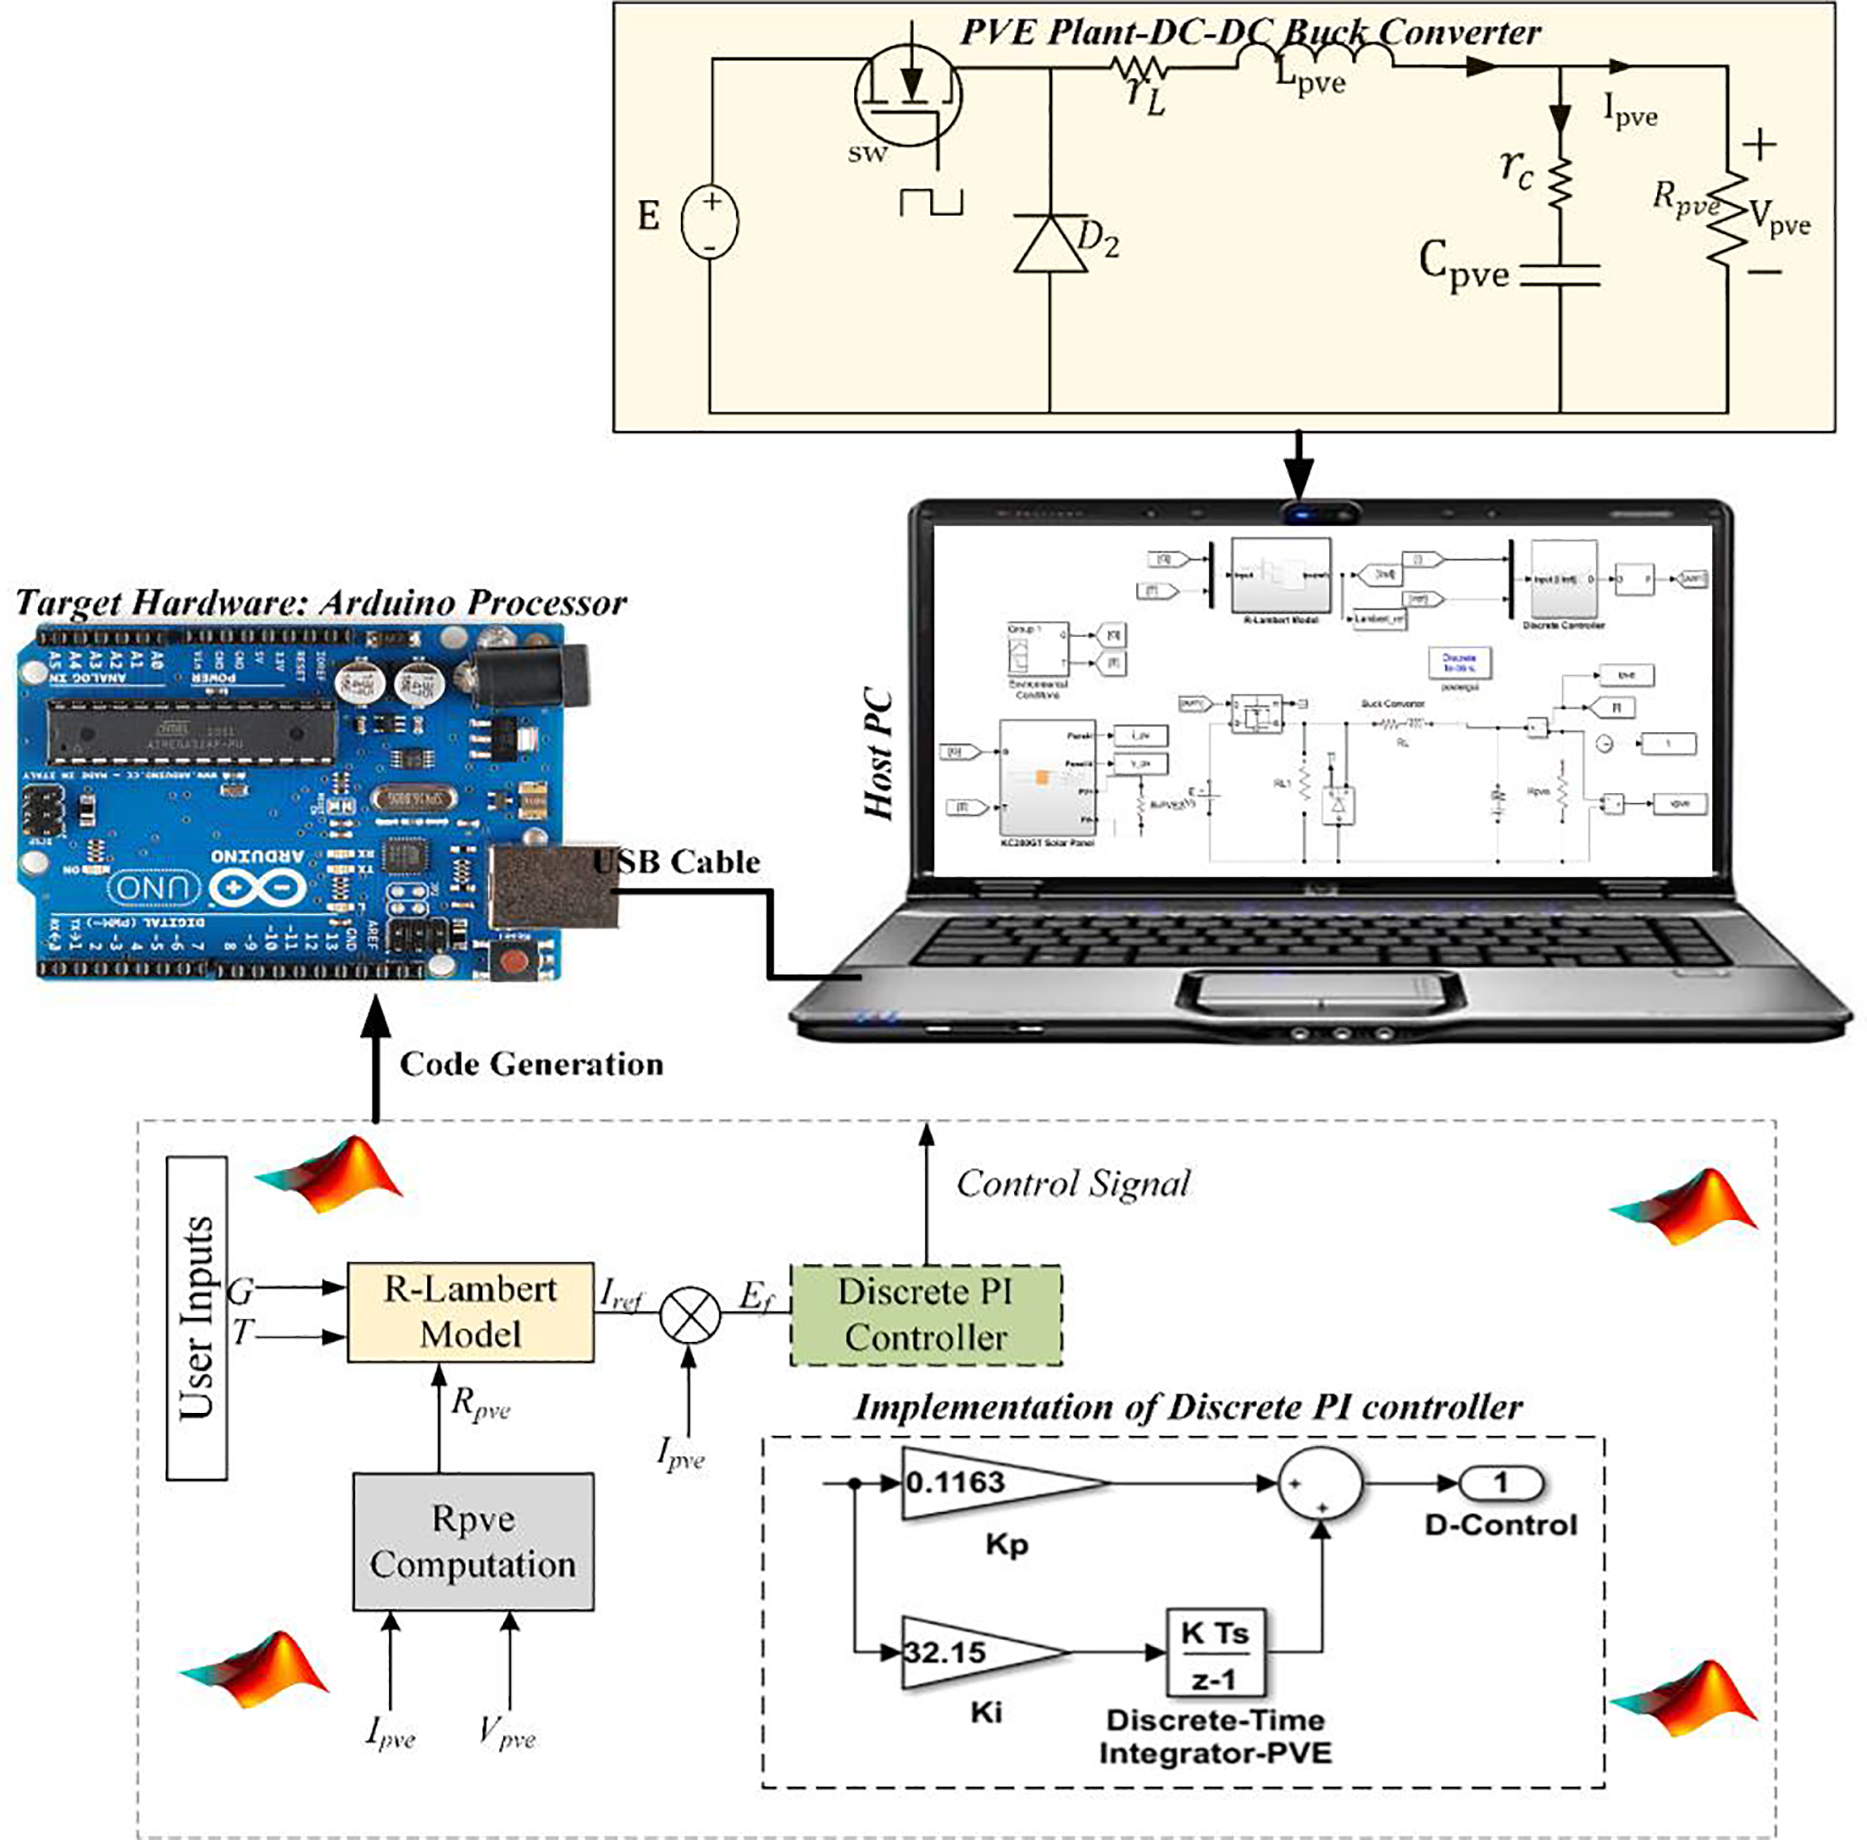
Figure 16: PIL test bench. The controller (R-Lambert reference + discrete PI) runs on an Arduino Uno (embedded target). The buck-converter is a numerical plant in Simulink on the host PC. USB/PIL link: Host → Arduino sends plant measurements and set-points each step; Arduino → Host returns the duty-cycle
In our PIL experiments (Fig. 16), the R-Lambert reference block and the discrete PI controller are code-generated from Simulink and executed on an Arduino Uno (embedded target), while the buck-converter plant is a numerical model running in Simulink on the host PC. At each simulation step, the host sends the plant measurements and set-points to the Arduino via the PIL serial channel, and the Arduino returns the duty-cycle command
To demonstrate the effectiveness of this real embedded system test, outcomes are directly compared to simulation results. The first experiments carried out at conditions of PVE for G = 1000 W/m2, T = 25°C, PVE load of 10 ohms, reveal that the simulation outcomes aligns well the PIL experiments in Fig 17. This shows that the embedded processor is able to implement the control strategy, allowing for swift emulation of the solar panel. It can be seen that this alignment is further maintain even when conditions are different from standard test conditions, that is G = 1000 W/m2, T = 5°C in Fig 18. This shows the efficacy of the emulator in imitating the solar panel considering temperature inputs.
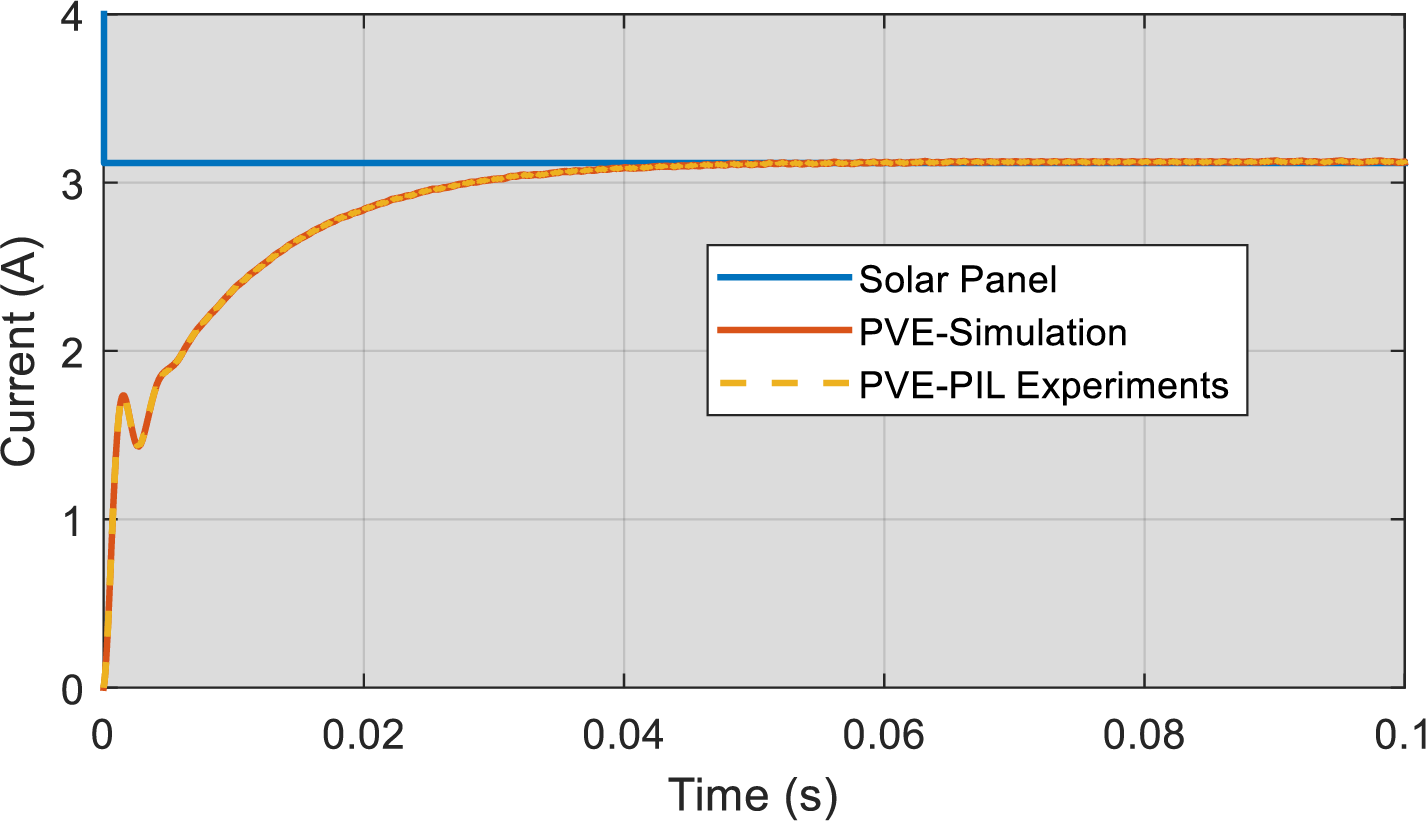
Figure 17: Processor in the Loop Experimental results of the developed PVE for G = 1000 W/m2, T = 25°C, PVE load of 10 ohms
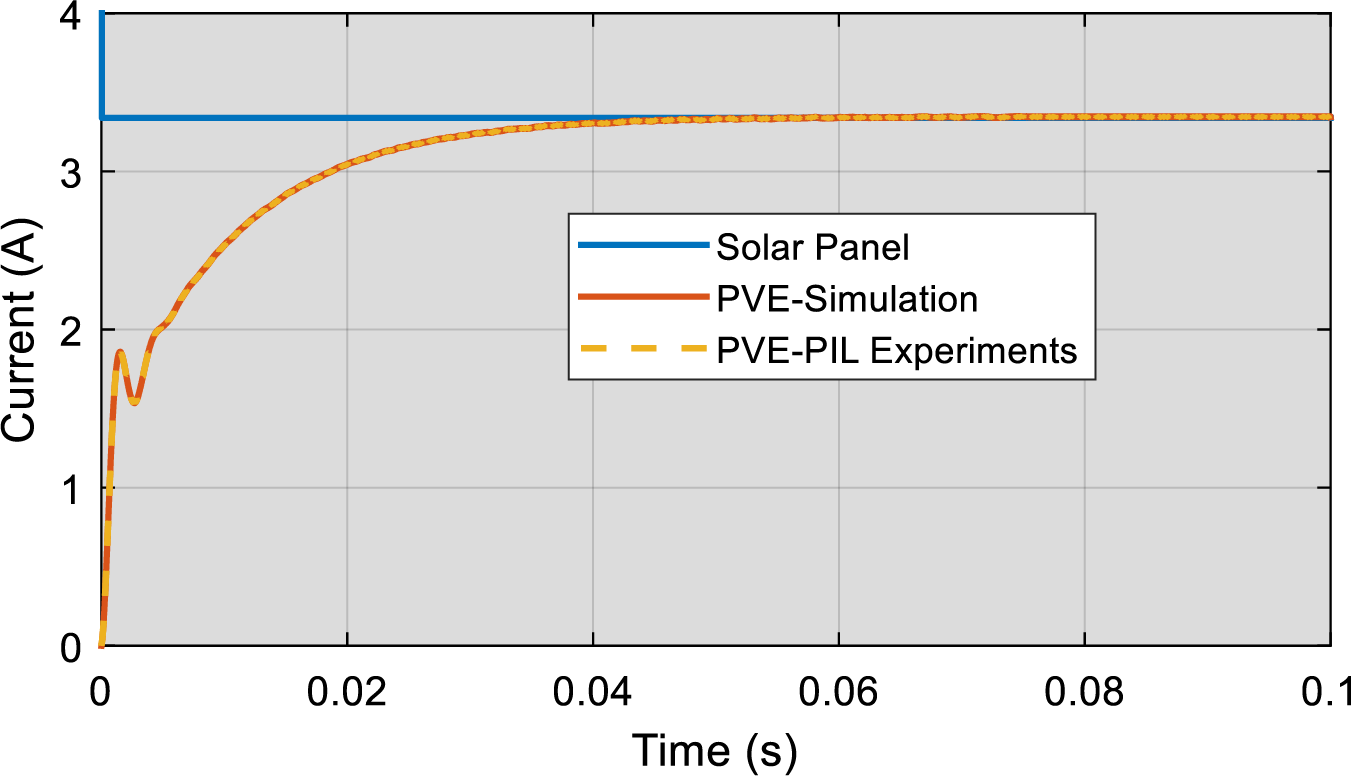
Figure 18: Processor in the Loop Experimental results of the developed PVE for G = 1000 W/m2, T = 5°C, PVE load of 10 ohms
The above results document the performance of the emulator under fixed climatic conditions. It is noted that a practical solar system will face varying climatic conditions. Therefore, it is vital to assess the performance of the emulator when it is face to a practical environmental setting. For this purpose, the climatic signal presented in Fig. 19 was constructed. Between 0 and 0.3 s, the irradiance signal increased steadily from 0 to 1000 W/m2, while the temperature increased from 10°C to 50°C. At 0.3 s right down to 0.6 s, the irradiance decreased steadily from 1000 to 100 W/m2 while the temperature also decreased from 50°C to 10°C. The temperature was maintained at this value till 1 s. The irradiance on the other hand was maintained between 0.6 and 0.7 s at 100 W/m2. Subsequently, irradiance underwent a step increase to 1000 W/m2 and was maintained at the same value till the time of 1 s.
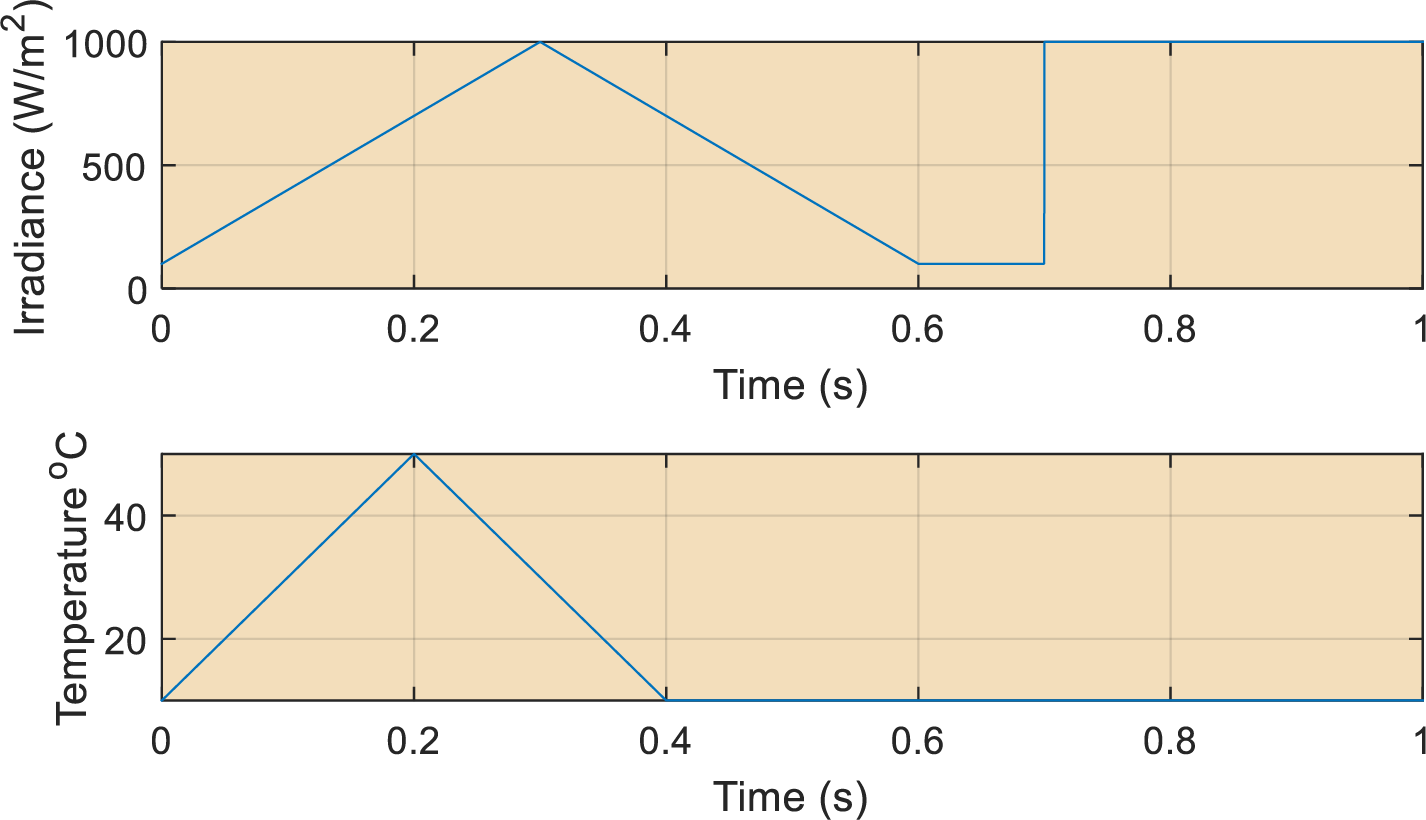
Figure 19: Real Climatic conditions, characterized by continuously changing signal. (Above) Irradiance. (Below) PVE load of 10 ohms
The response of the PVE under the real climatic pattern is presented in Fig. 20. It can be seen that the PVE follows the actual solar panel even under increasing and decreasing irradiance patterns. An abrupt change in current occurs at 0.7 s. It is seen that the PVE follows the actual solar panel and effectively meets it at steady-state. Finally, the close alignment of the simulation results and the PIL experiments validates the practical efficacy of the PVE.
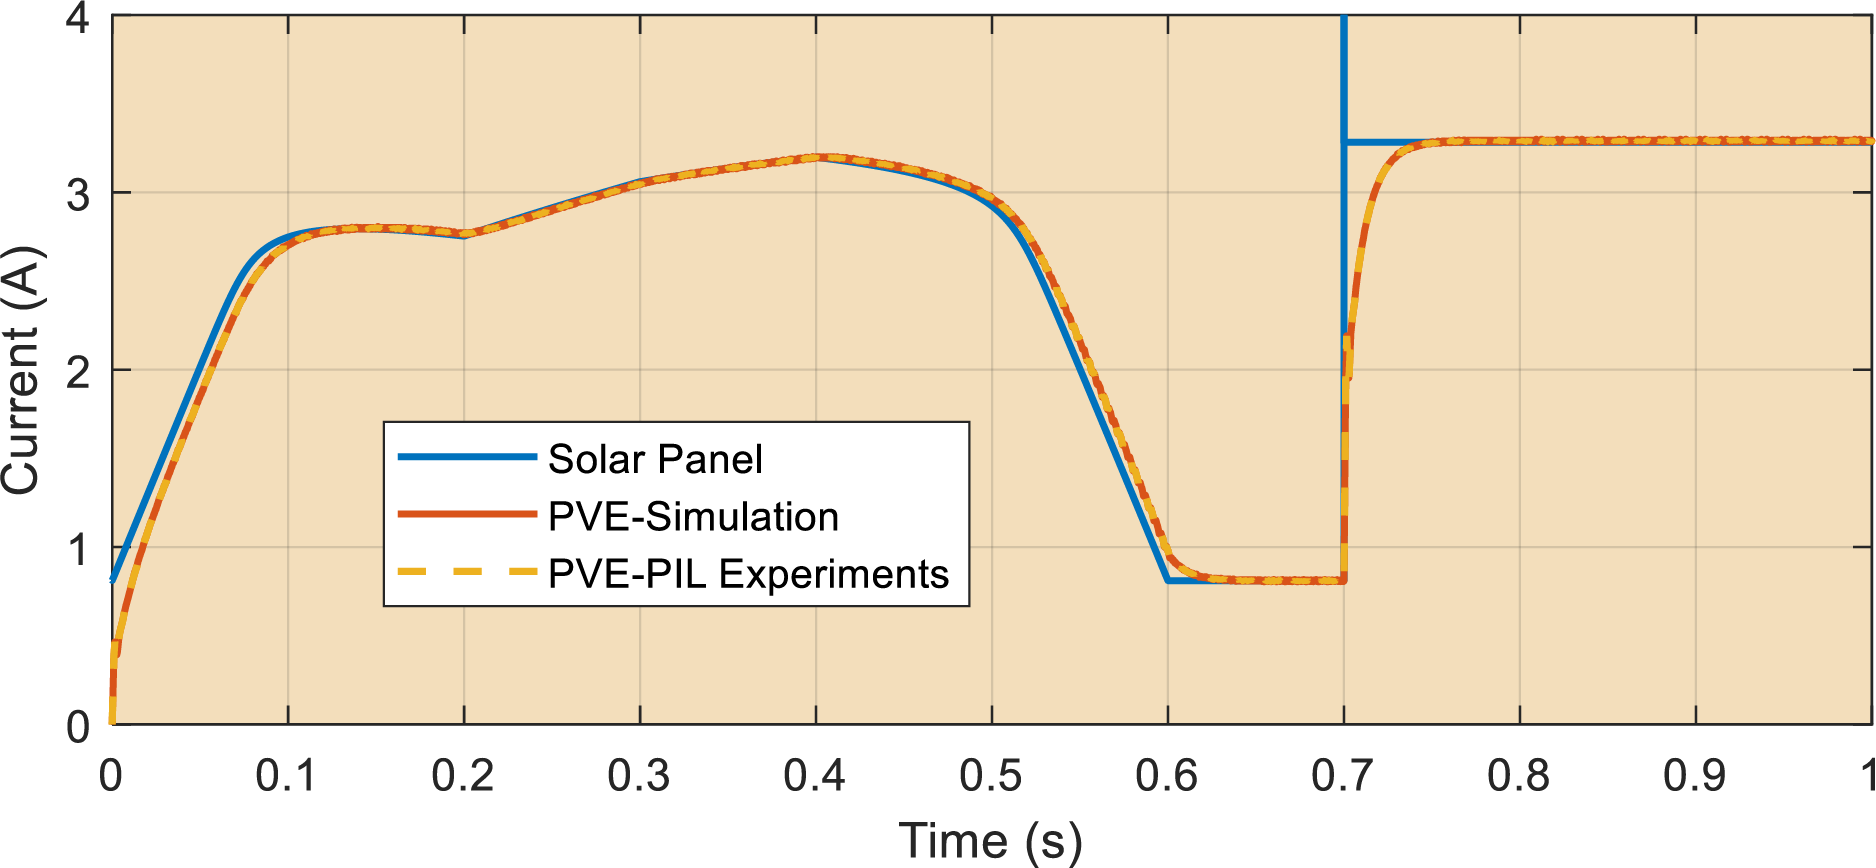
Figure 20: Processor in the Loop Experimental results of the PVE in response to continuously changing climatic conditions, PVE load of 10 ohms
The problem of seamlessly integrating solar models into a photovoltaic emulator was examined in this research. The objective of this study was to address a prevalent issue in the explicit PV model recently published [11]. Evaluations conducted according to the IEC 50530 standard revealed that the accuracy of this model declines near the maximum power point. To tackle this issue, we developed two robust mathematical models based on the Lambert function: the V-Lambert and R-Lambert models. The computational capabilities of these models were validated by performing accuracy assessments in line with the IEC 50530 standard. The new model was tested on six solar panels—KC200GT, 1STH-215-P, A10J-S72-175, ASMS-165P, API156P-220, and SPR-305E-WHT-D. Our findings indicated that our computational model is up to 61 times more accurate than the explicit PV model in the operation region around the maximum power point. While the V-Lambert model is suitable for routine solar computations, it is not recommended for photovoltaic emulator (PVE) integration. To facilitate a seamless integration of the photovoltaic model into the PVE, the R-Lambert model was chosen as the preferred option. This model was used to implement a closed-loop PVE, and a comprehensive dynamic analysis of the PVE was conducted. The proposed PVE demonstrated efficient performance in simulating solar panels under various climatic and resistive conditions. An experimental protocol was developed using Arduino-Processor-in-the-Loop for the proposed system. Multiple experimental investigations indicated that the embedded PVE processor accurately replicates the solar panel, with experimental results aligning closely with the simulation results. The proposed Lambert-W-based explicit solvers, while significantly improving accuracy and eliminating iterative computation, present certain limitations. First, the V-Lambert solver is invalid at very low voltages (near 0 V), restricting its use during the initial transient phase of emulator operation. Second, the evaluation of the Lambert-W function, though implemented via an analytical approximation, remains computationally more demanding than linearized models, which may challenge low-end embedded processors in hard real-time applications. Finally, the model validation is confined to standard single-diode representations and common cell technologies; its performance under more complex cell models or emerging PV materials has not been examined.
Acknowledgement: This research has been funded by Scientific Research Deanship at University of Ha’il-Saudi Arabia.
Funding Statement: This research has been funded by Scientific Research Deanship at University of Ha’il-Saudi Arabia through project number (RG-24 014).
Author Contributions: The authors confirm contribution to the paper as follows: Conceptualization, Ambe Harrison; methodology, Abdulaziz Almalaq, Ambe Harrison, Ibrahim Alsaleh, Abdullah Alassaf and Mashari Alangari; software, Abdulaziz Almalaq and Ambe Harrison; validation, Abdulaziz Almalaq, Ambe Harrison, Ibrahim Alsaleh, Abdullah Alassaf and Mashari Alangari; formal analysis, Abdulaziz Almalaq, Ambe Harrison, Ibrahim Alsaleh, Abdullah Alassaf and Mashari Alangari; resources, Ibrahim Alsaleh, Abdullah Alassaf and Mashari Alangari; data curation, Abdulaziz Almalaq and Ambe Harrison; writing—original draft preparation, Ambe Harrison; writing—review and editing, Ibrahim Alsaleh, Abdullah Alassaf and Mashari Alangari; visualization, Abdulaziz Almalaq; supervision, Mashari Alangari; project administration, Abdulaziz Almalaq; funding acquisition, Abdulaziz Almalaq. All authors reviewed the results and approved the final version of the manuscript.
Availability of Data and Materials: Data Related to this paper can be found in Figshare open access Data repository with the DOI link: 10.6084/m9.figshare.28807178 (accessed on 15 December 2025).
Ethics Approval: Not applicable.
Conflicts of Interest: The authors declare no conflicts of interest to report regarding the present study.
References
1. Sui Q, Zhang J, Li J, Li Z, Su C, Liu C. Optimal scheduling for renewable power grid and vessel-based hydrogen chain integrated systems considering flexible energy transfer. Appl Energy. 2024;367:123401. doi:10.1016/j.apenergy.2024.123401. [Google Scholar] [CrossRef]
2. Tsai WC, Tu CS, Hong CM, Lin WM. A review of state-of-the-art and short-term forecasting models for solar PV power generation. Energies. 2023;16(14):5436. doi:10.3390/en16145436. [Google Scholar] [CrossRef]
3. Wei X, Harrison A, Naser AT, Mbasso WF, Dagal I, Alombah NH, et al. A new intelligent control and advanced global optimization methodology for peak solar energy system performance under challenging shading conditions. Appl Energy. 2025;390:125808. doi:10.1016/j.apenergy.2025.125808. [Google Scholar] [CrossRef]
4. Boubaker O. MPPT techniques for photovoltaic systems: a systematic review in current trends and recent advances in artificial intelligence. Discov Energy. 2023;3(1):9. doi:10.1007/s43937-023-00024-2. [Google Scholar] [CrossRef]
5. Sarkar V, Anantha S, Kolakaluri VK, Sura C, Shambharkar CD. Computationally robust and generalized PV-cell global parameter estimation with non-dependence on the datasheet information. IEEE Trans Ind Appl. 2025. doi:10.1109/TIA.2025.3594642. [Google Scholar] [CrossRef]
6. Ydir B, Saadaoui D, Achouch S, Choulli I, Ben Hmamou D, Arjdal EH, et al. Design and validation of an accurate photovoltaic emulator using black-winged kite optimisation for single diode model parameter extraction. Int J Ambient Energy. 2025;46(1):2577228. doi:10.1080/01430750.2025.2577228. [Google Scholar] [CrossRef]
7. Harrison A, Alombah NH. A new high-performance photovoltaic emulator suitable for simulating and validating maximum power point tracking controllers. Int J Photoenergy. 2023;2023:4225831. doi:10.1155/2023/4225831. [Google Scholar] [CrossRef]
8. Alaoui M, Maker H, Mouhsen A, Hihi H. Real-time emulation of photovoltaic energy using adaptive state feedback control. SN Appl Sci. 2020;2(3):492. doi:10.1007/s42452-020-2294-2. [Google Scholar] [CrossRef]
9. Saraswathi KT, Arumugam P, Swaminathan GV, Periasamy S. An artificial neural network-based comprehensive solar photovoltaic emulator. Int J Photoenergy. 2022;2022:4741428. doi:10.1155/2022/4741428. [Google Scholar] [CrossRef]
10. Alaoui M, Maker H, Mouhsen A. An accurate photovoltaic source emulator with high-bandwidth using a backstepping controller. In: Proceedings of the 2019 4th World Conference on Complex Systems (WCCS); 2019 Apr 22–25; Ouarzazate, Morocco. doi:10.1109/icocs.2019.8930786. [Google Scholar] [CrossRef]
11. Henry Alombah N, Harrison A, Kamel S, Bertrand Fotsin H, Aurangzeb M. Development of an efficient and rapid computational solar photovoltaic emulator utilizing an explicit PV model. Sol Energy. 2024;271:112426. doi:10.1016/j.solener.2024.112426. [Google Scholar] [CrossRef]
12. Ayop R, Tan CW. Improved control strategy for photovoltaic emulator using resistance comparison method and binary search method. Sol Energy. 2017;153:83–95. doi:10.1016/j.solener.2017.05.043. [Google Scholar] [CrossRef]
13. Ayop R, Tan CW. A novel photovoltaic emulator based on current-resistor model using binary search computation. Sol Energy. 2018;160:186–99. doi:10.1016/j.solener.2017.12.005. [Google Scholar] [CrossRef]
14. Mahmod Mohammad AN, Mohd Radzi MA, Azis N, Shafie S, Atiqi Mohd Zainuri MA. A novel hybrid approach for maximizing the extracted photovoltaic power under complex partial shading conditions. Sustainability. 2020;12(14):5786. doi:10.3390/su12145786. [Google Scholar] [CrossRef]
15. Senthilkumar S, Mohan V, Mangaiyarkarasi SP, Karthikeyan M. Analysis of single-diode PV model and optimized MPPT model for different environmental conditions. Int Trans Electr Energy Syst. 2022;2022:4980843. doi:10.1155/2022/4980843. [Google Scholar] [CrossRef]
16. Batzelis EI, Anagnostou G, Chakraborty C, Pal BC. Computation of the lambert W function in photovoltaic modeling. In: ELECTRIMACS 2019. Berlin/Heidelberg, Germany: Springer; 2020. p. 583–95. doi:10.1007/978-3-030-37161-6_44. [Google Scholar] [CrossRef]
17. Moshksar E, Ghanbari T. A model-based algorithm for maximum power point tracking of PV systems using exact analytical solution of single-diode equivalent model. Sol Energy. 2018;162:117–31. doi:10.1016/j.solener.2017.12.054. [Google Scholar] [CrossRef]
18. Ayop R, Tan CW, Syed Nasir SN, Lau KY, Ling Toh C. Buck converter design for photovoltaic emulator application. In: Proceedings of the 2020 IEEE International Conference on Power and Energy (PECon); 2020 Dec 7–8; Penang, Malaysia. doi:10.1109/pecon48942.2020.9314582. [Google Scholar] [CrossRef]
19. Olayiwola TN, Choi SJ. Superellipse model: an accurate and easy-to-fit empirical model for photovoltaic panels. Sol Energy. 2023;262:111749. doi:10.1016/j.solener.2023.05.026. [Google Scholar] [CrossRef]
Cite This Article
 Copyright © 2026 The Author(s). Published by Tech Science Press.
This work is licensed under a Creative Commons Attribution 4.0 International License , which permits unrestricted use, distribution, and reproduction in any medium, provided the original work is properly cited.
 Downloads
 Citation Tools