
 Submit a Paper
 Propose a Special lssue
 Open Access
ARTICLE

Numerical Investigation of Rainfall-Induced Shear Crack Propagation in Railway Embankment Slopes
1 School of Civil Engineering and Surveying, University of Portsmouth, Portsmouth, UK
2 College of Mechanical Engineering, Yanshan University, Qinhuangdao, China
3 Department of Earth Resource Engineering, University of Moratuwa, Moratuwa, Sri Lanka
4 College of Civil Engineering and Transportation, Beihua University, Jilin, China
* Corresponding Author: Jiye Chen. Email:
(This article belongs to the Special Issue: Advances in Computational Fracture Mechanics: Theories, Techniques, and Applications)
Computer Modeling in Engineering & Sciences 2026, 146(3), 12 https://doi.org/10.32604/cmes.2026.073689
Received 23 September 2025; Accepted 26 February 2026; Issue published 30 March 2026
 View Full Text
 Download PDF
Abstract
Slope failures, particularly in railway embankments during intense rainfall, are a major cause of economic damage and humanitarian loss. To forecast how shear cracks develop in slopes under heavy precipitation, we present a novel modeling framework: the Extended Cohesive Damage Element enhanced by soil moisture (SMECDE). The method first translates forecasted rainfall into soil moisture levels via an established correspondence. Then, recognizing that rainfall infiltration lowers soil cohesion—particularly at varying depths—we introduce a Soil Moisture Decoherence Model (SMDM) based on experimental data, which quantifies how cohesion degrades with moisture and how depth affects this process. By embedding SMDM within the ECDE technique, we investigate how shear fractures propagate under different moisture conditions throughout the slope profile. We apply SMECDE to a real railway embankment case to identify critical moisture thresholds and crack growth patterns. Validation is performed by comparing predictions against field measurements and weather station records, and further checked through simulations of large-scale plastic deformation in ABAQUS.Keywords
Climate change has intensified the frequency of extreme rainfall, which often produces widespread social, environmental, and infrastructural disruption. When storms are prolonged, slopes may become unstable, and these instabilities are recognized as one of the most serious geotechnical hazards of the present era. Failures may occur in natural ground (landslides) or engineered slopes such as embankments for railways. Anticipating such events remains difficult. Numerous studies over recent decades have analyzed different slope-failure scenarios. For instance, Niroumand et al. (2012) [1] outlined categories of slope failure, underlying causes, and common remedial strategies. Ground displacements are generally grouped into four movements—slides, flows, falls, and topples—with slides and flows presenting the greatest hazard to built infrastructure. Stability outcomes depend on a combination of climatic drivers, geological and hydrogeological setting, soil composition, landform, and local stress conditions. Rain infiltration is a key factor: when pore water pressure increases and soil interfaces weaken, the shear strength diminishes, leading to slope displacement. In many monsoon-affected regions, this process explains why the majority of landslides occur during summer months (CGEIS 2019 [2]; Froude et al. 2018 [3]).
Despite decades of work, existing predictive models remain limited. Geological approaches cannot always specify where a slope will collapse; statistical models often fail to capture the dynamic progression of failures; and high-resolution site data are often missing (Xu et al. 2012, Gu et al. 2024 [4,5]). Experiments with sensors measuring deformation and creep thresholds improve early warning but cannot reliably predict how failure will propagate across the slope (Teza et al. 2008 [6]). Classical analytical models and fracture mechanics approaches capture only simplified cases (Milledge et al. 2014 [7]), while finite element formulations or cohesive zone models generally require prior knowledge of the failure surface (Donzé et al. 2009 [8]; Quinn et al. 2012 [9]; Zhang et al. 2015 [10]). Newer approaches, such as particle finite element method (PFEM) with strain-softening behavior (Zhang et al. 2019 [11]), have improved retrogressive collapse simulations, but they still struggle to determine the precise initiation point and timing under extreme rainfall. A calculation method of double strength reduction for layered slope was introduced based on the reduction of water content intensity [12], which is a valuable reference for considering water content’s effects on the strength of slopes. Recently, a physics-informed deep learning technology was introduced to reveal the evolutionary characteristics of landslides induced by the rainfall process [13]. This approach combined AI data and traditional stress analysis together, but has limitations in capturing the reality of slope failure as a fracture propagation under extreme rainfall.
In this work, we concentrate on rainfall intensity and soil depth as primary controls on soil moisture at a site with well-characterized material properties. The study considers short rainfall bursts of roughly two hours and their influence on moisture and cohesion, while secondary variables such as frequency, duration, and surface cover are left for later investigation. The relationship between rainfall and soil water content has been noted in earlier contributions (Findell 1997 [14]; MPhi Thesis 2006 [15]; Brandyk et al. 2021 [16]). Building on this, the recently proposed Soil Moisture Extended Cohesive Damage Element (SMECDE) method [17] integrates a Soil Moisture–Cohesion–Depth Model into the ECDE approach, enabling exploration of how shear fractures originate and propagate under moisture changes. Applied to a railway embankment slope, the model identifies moisture thresholds, traces crack initiation and propagation, and provides fracture responses under varying rainfall scenarios. Results are compared with meteorological and field records for validation, and large-deformation simulations in ABAQUS are used as an additional benchmark.
2 The Basic Theoretical Work of the SMECDE
In geotechnical terms, slope instability is a progressive process of shear damage that develops into fracture propagation. As illustrated in Fig. 1, the upper domain (Ω−) tends to slide relative to the lower domain (Ω+) along a cohesive crack surface Γd. To describe this mechanism under conditions of intense rainfall, the Soil Moisture Extended Cohesive Damage Element (SMECDE) approach was formulated. The SMECDE integrates the Extended Cohesive Damage Element (ECDE) model with the Soil Moisture Decoherence Module (SMDM), providing a link between rainfall intensity and soil moisture. This combined method is designed to predict both the initiation of slope failure and the subsequent propagation of shear cracks. The onset of failure and its location are determined first, followed by simulation of the crack path and associated reaction forces at each stage of fracture development. The ECDE methodology was initially developed by Chen and colleagues for simulating fracture propagation in fibre composite materials and structures (Li and Chen, 2016 and 2017) [18–20]. Chen et al. enhanced the ECDE by introducing a mixed damage mode criterion for assessing the progressive failure of naturally porous materials in 2022 [21]. The main features of the ECDE are highly efficient and accurate in the nonlinear iteration process, and mesh density independent. Here, the fundamental theory of SMECDE is outlined prior to incorporating the SMDM in Section 3 and demonstrating applications in Section 7.
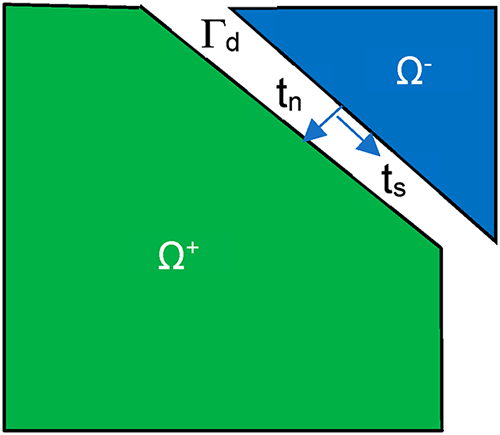
Figure 1: Demonstrated cohesive crack surface Γd between Ω+ and Ω− in a potentially cracked body body.
Because soil properties vary with moisture content, the stiffness K of a soil element and its displacement field u are treated as functions of soil moisture. When moisture is low, and no cracking has occurred, u represents a continuous displacement field, and the basic equilibrium between stiffness and external force F is expressed as in Eq. (1).
here, F also depends on soil moisture, reflecting the influence of varying water content. Once soil moisture reaches a critical threshold, fracture develops, and the displacement field must incorporate discontinuities to capture crack growth within the slope body.
The traction–separation relationship is used to evaluate the cohesive forces across the crack surface, where traction depends on the relative displacement δ between opposing crack boundaries.
in which δ is the relative displacement between two boundaries of discontinuity. This nonlinear law governs material response once discontinuity initiates. When cohesive tractions exist within the defined crack segment, the system’s total potential energy must also include their contribution. Applying the principle of virtual work gives the weak form of the equilibrium equation, as shown in Eq. (3).
The above equation serves as a nonlinear material model when discontinuity onsets. While the cohesive tractions are present within the specified segment of the crack, the total potential of the body should take into account the contribution from cohesive tractions transferred through the crack surface. In Eq. (3), ω(x) and u(x) denote test and trial functions. The displacement field can be separated into a smooth component us(x) and a discontinuous part a(x). A step function
The enrichment uses a shifted Heaviside step function, which preserves the Kronecker-δ property (Ni(xj) = δij) and simplifies numerical implementation. This approach ensures the enrichment vanishes in elements not intersected by a crack. Eq. (5) illustrates how the displacement jump is expressed using enriched functions.
in which
The shifted enrichment guarantees a unique displacement solution for cracks of any geometry and node location. While enrichment contributes values at integration points, it vanishes at enriched nodes. Using the Bubnov–Galerkin method, Eq. (1) is reformulated into the discrete equilibrium form shown in Eq. (7).
In this discrete form, stiffness matrices Kuu and Kaa represent standard and enriched FEM components, while Kua or Kau couple them. The corresponding nodal force vectors are defined as in Eq. (8), which uses material constitutive matrices D, strain–displacement matrices B, and enriched matrices Ba with soil properties at critical moisture levels [20].
In Eq. (8), details for the basic constitutive material matrices D, the deformation gradient matrices B produced for strain calculation, and the deformation gradient matrices Ba relating to the enriched DoFs can be referred to [18–20]. It should be noticed that their calculations use varied material properties at the critical soil moisture, which will be discussed in Sections 3 and 4. It should be noticed that the simulated crack is assumed to be a cohesive crack, and the corresponding discontinuous boundary is a cohesive crack boundary. Thus, the equivalent nodal force vectors in Eq. (7) can be calculated by Eq. (9).
Because of the existence of a cohesive segment, the internal nodal force vector due to cohesive traction t on the crack surface
The integration of the internal nodal force vector due to cohesive traction t shown in Eq. (10) can be obtained by numerical integration with respect to the cohesive stress on the crack surface
where
To obtain a condensed equilibrium system, the enrichment term a is eliminated, leaving only standard FEM unknowns. The resulting system is presented in Eq. (13), with the transformation matrix M defined in Eq. (14). Typically, M = 0 when no external load is applied on the cohesive crack, allowing Eq. (13) to simplify to Eq. (15).
where M is a transformation matrix to link the
The exact expression of M can be found in the author’s previous work [21,22]. It should be noted that in most cases, M is zero because there is no external load applied on the cohesive crack. Thus, Eq. (13) can be rewritten as:
This condensed formulation enables calculation of nodal displacements using only standard FEM degrees of freedom, which enhances computational efficiency and stability in nonlinear structural analysis. The SMECDE approach thus rigorously models the evolution from weak to strong discontinuities. Because enriched DoFs are eliminated, the method can be directly implemented in the commercial FEM package ABAQUS via a user element (UEL) subroutine incorporating (Eqs. (1)–(15)). Fig. 2 presents the flowchart describing the crack propagation algorithm and computational procedure in SMECDE.
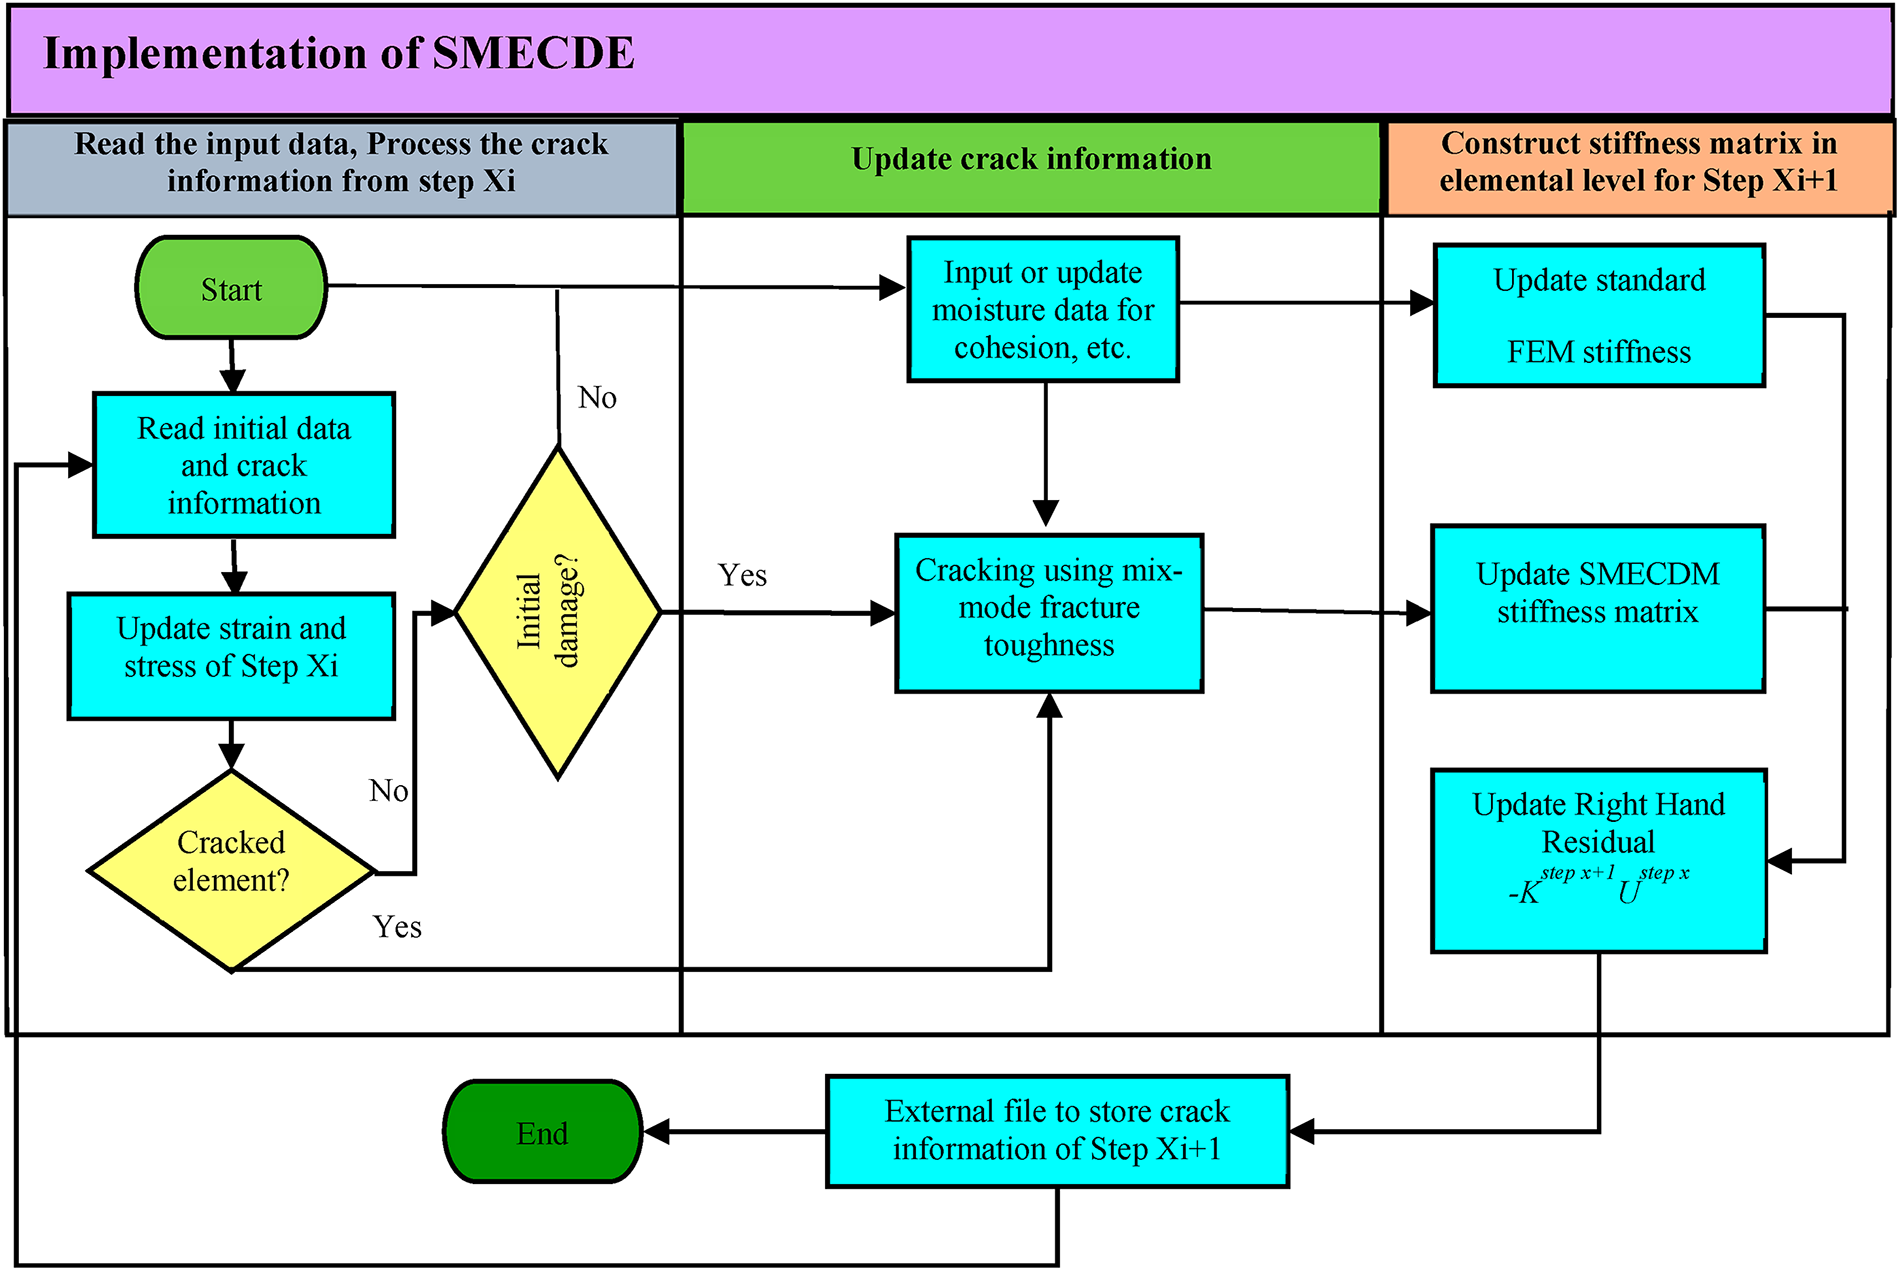
Figure 2: The flow chart of crack propagation scheme and solving procedure in the SMECDE.
3 Establishing Soil Moisture as a Function of Rainfall Intensity
To assess how rainfall intensity influences reductions in soil cohesion, it is necessary to express soil moisture as a function of rainfall. In practice, weather forecast data typically provides two relevant parameters: the natural soil moisture content
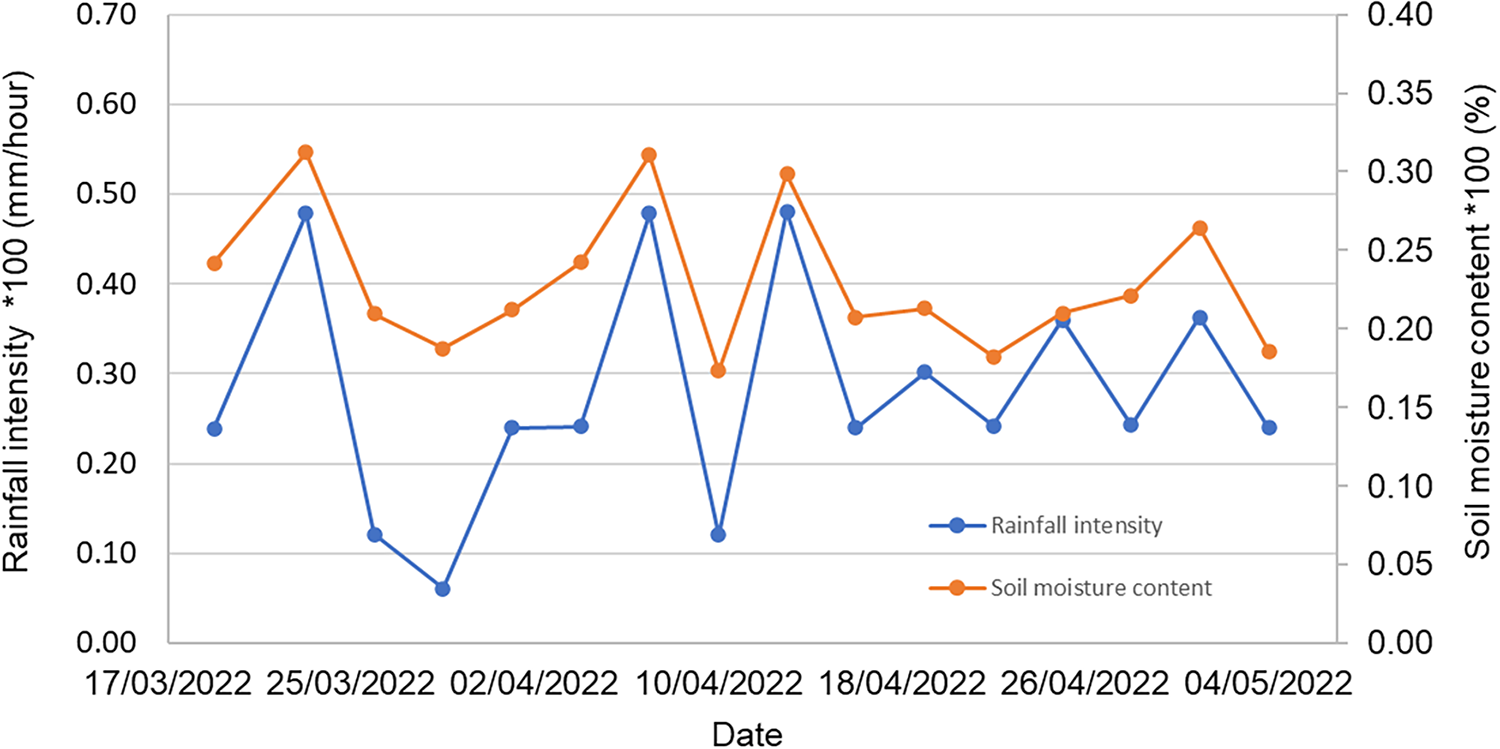
Figure 3: Rainfall intensity and soil moistures time histories.
A correlation model is introduced to describe the relationship between rainfall intensity and soil moisture [17]. The general mathematical form of this model is expressed in Eq. (16):
here, n and k denote general correlation parameters, which may vary with different locations and monitoring periods. Typical values can be considered within the ranges n = (0.1, 0.2, 0.3, 0.4, 0.5, …) and k = (1, 1/2, 1/3, 1/4, …). The time series used for calibration is summarized in Table 1. Applying a curve-fitting approach, with n = 0.21 and k = 1/3, Eq. (16) simplifies to Eq. (17):
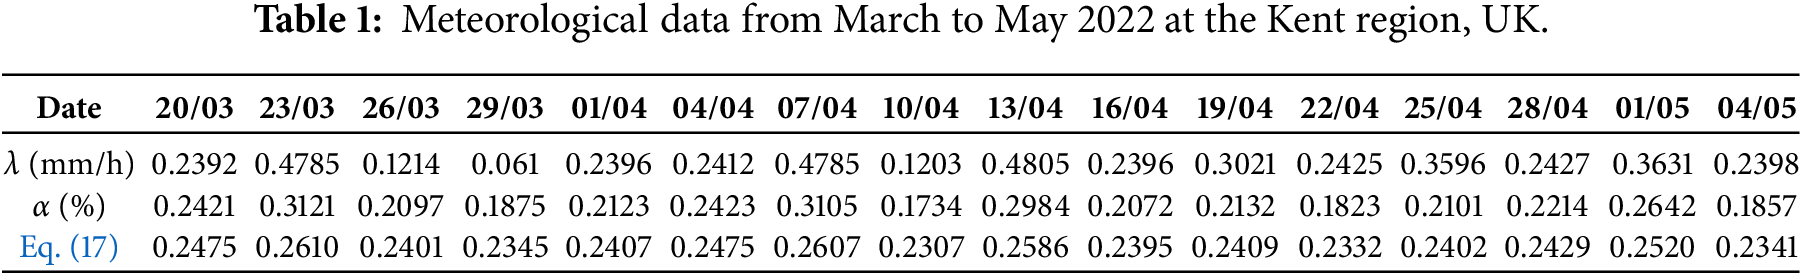
Table 1 also presents the soil moisture values estimated through Eq. (17). The calculated results differ from the forecasted values by an average of approximately 3%, confirming that the simplified model captures the observed correlation effectively for the Kent dataset covering March–May 2022.
4 The Soil Moisture Decohesion Model (SMDM)
A polynomial correlation is often adopted to represent the relationship between soil moisture (α) and soil cohesion (C) near the ground surface, as expressed in Eq. (18) [17].
In this formulation, the constants p, q, and s act as fitting parameters using experimental data. By combining Eq. (16) (soil moisture vs. rainfall intensity) with Eq. (18), one obtains Eq. (19), which links cohesion directly to rainfall intensity.
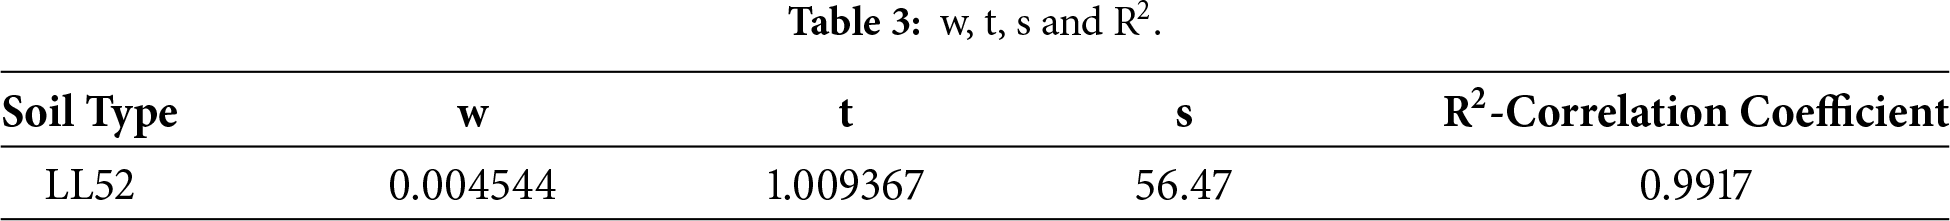
Rearranging and defining w = pk and t = qk, Eq. (19) simplifies into Eq. (20):
The coefficients p, q, and s in Eq. (18) can be identified through laboratory experiments that measure cohesion changes in soil samples under controlled variations of water content. Using Eq. (20), cohesion may then be indirectly expressed as a function of rainfall intensity, with the constants w, t, and s fitted by reference to Eq. (19).
Observations from earlier field studies [24] indicate that soil moisture declines with increasing depth (h) below ground, as depicted in Fig. 4. In that study, the surface moisture content of 21.654% was shown to decrease approximately linearly with depth, with a slope of −0.0417. These data (also used in Figs. 5–8) were collected from field experiments on both natural and artificial grassland in the Anjiapo loess hilly catchment, China, during the 2010 rainy season. Additional work has established that cohesion tends to diminish with rising soil moisture [25,26]. For example, Fig. 5 illustrates the polynomial decay in cohesion with respect to moisture content at the ground surface, consistent with Eq. (18). It should be emphasized that this correlation was derived from short-duration, high-intensity rainfall events (about two hours on average) in prior experiments [24–26]. Other studies have shown that cohesion tends to rise with soil depth [27]. For loamy soils at 25% moisture, a linear relationship between cohesion and depth was reported [22,25,26], as represented in Fig. 6. This correlation can be expressed mathematically by Eq. (21):
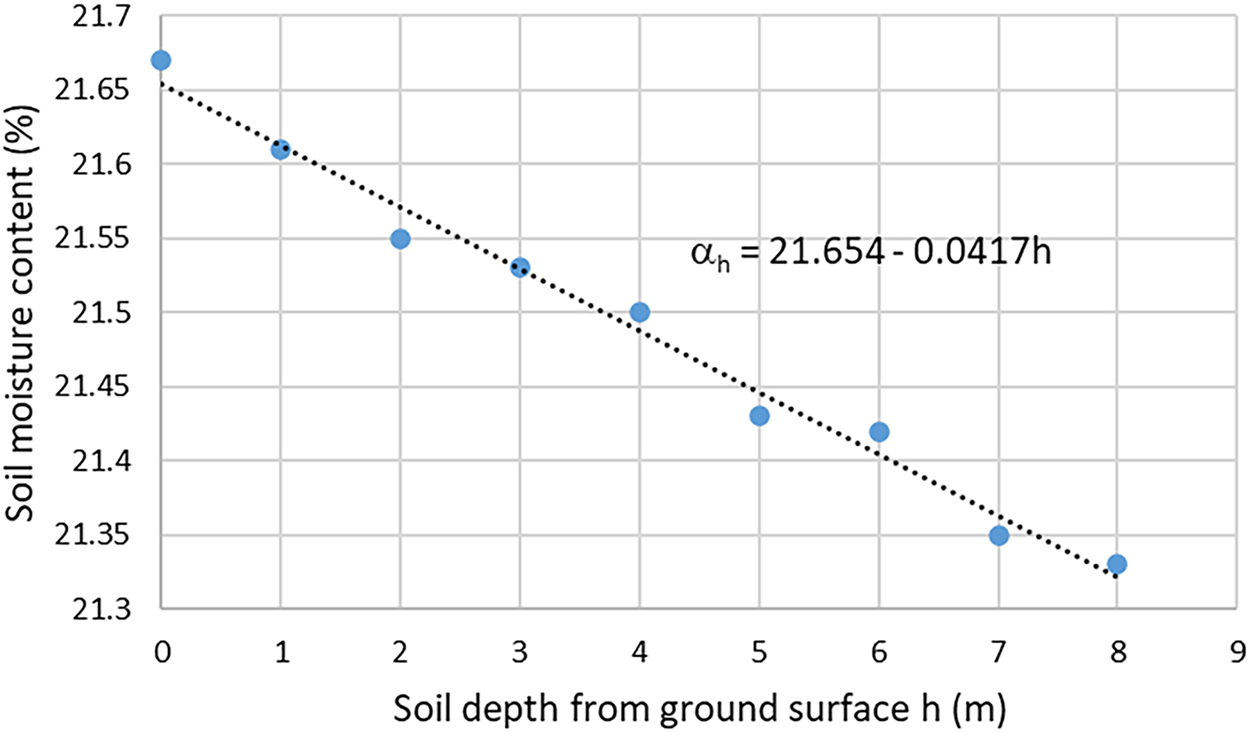
Figure 4: Soil moisture vs. depth underground.
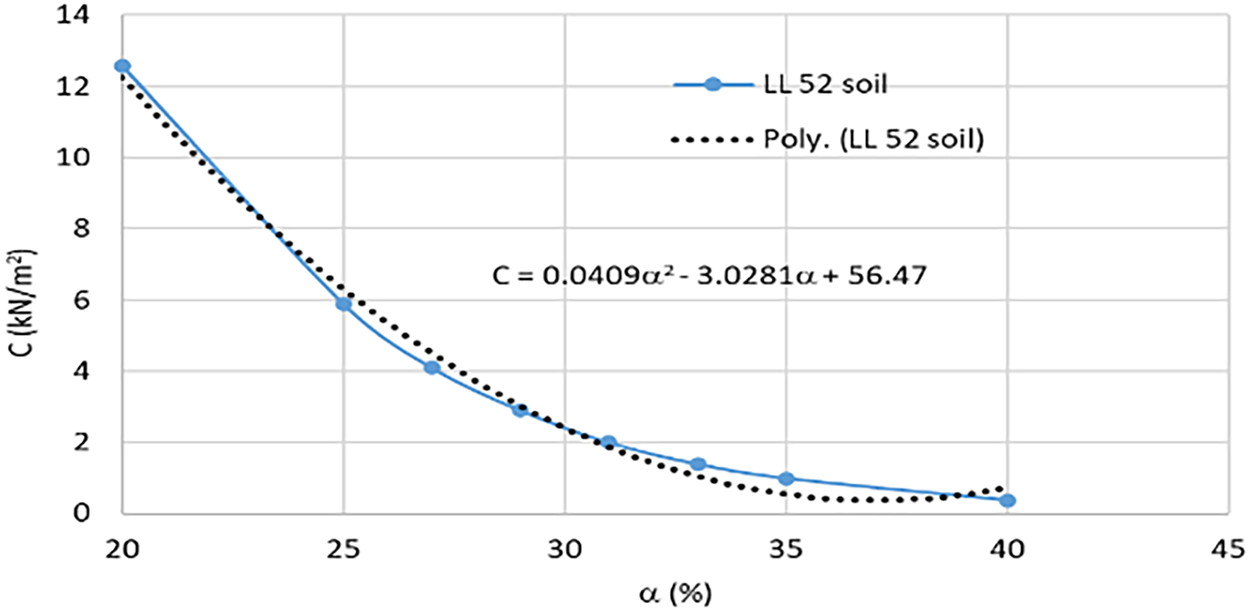
Figure 5: Soil cohesion vs. moisture for lomay soil.
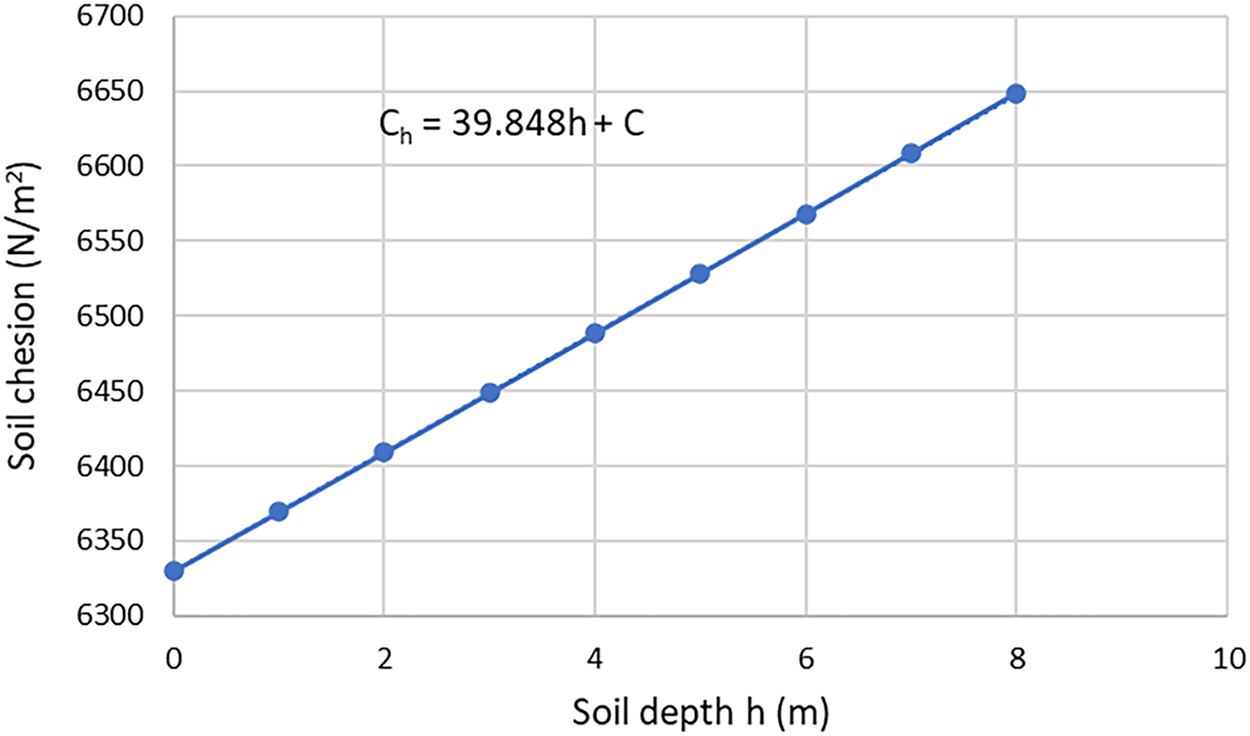
Figure 6: Lomay soil cohesion vs. depth at moisture 25%.
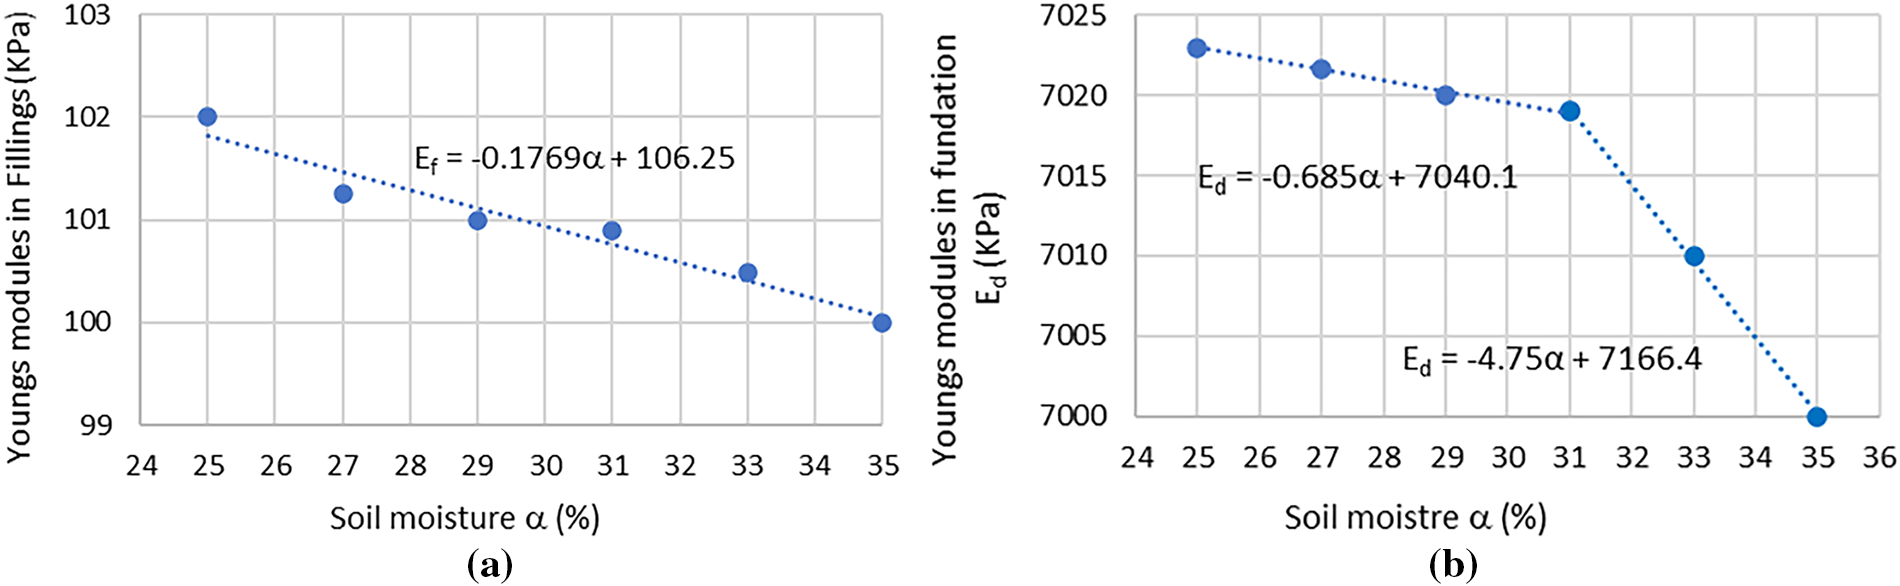
Figure 7: Young’s modules vs. soil moisture for embankment: (a). fillings (left), (b). foundation (right).
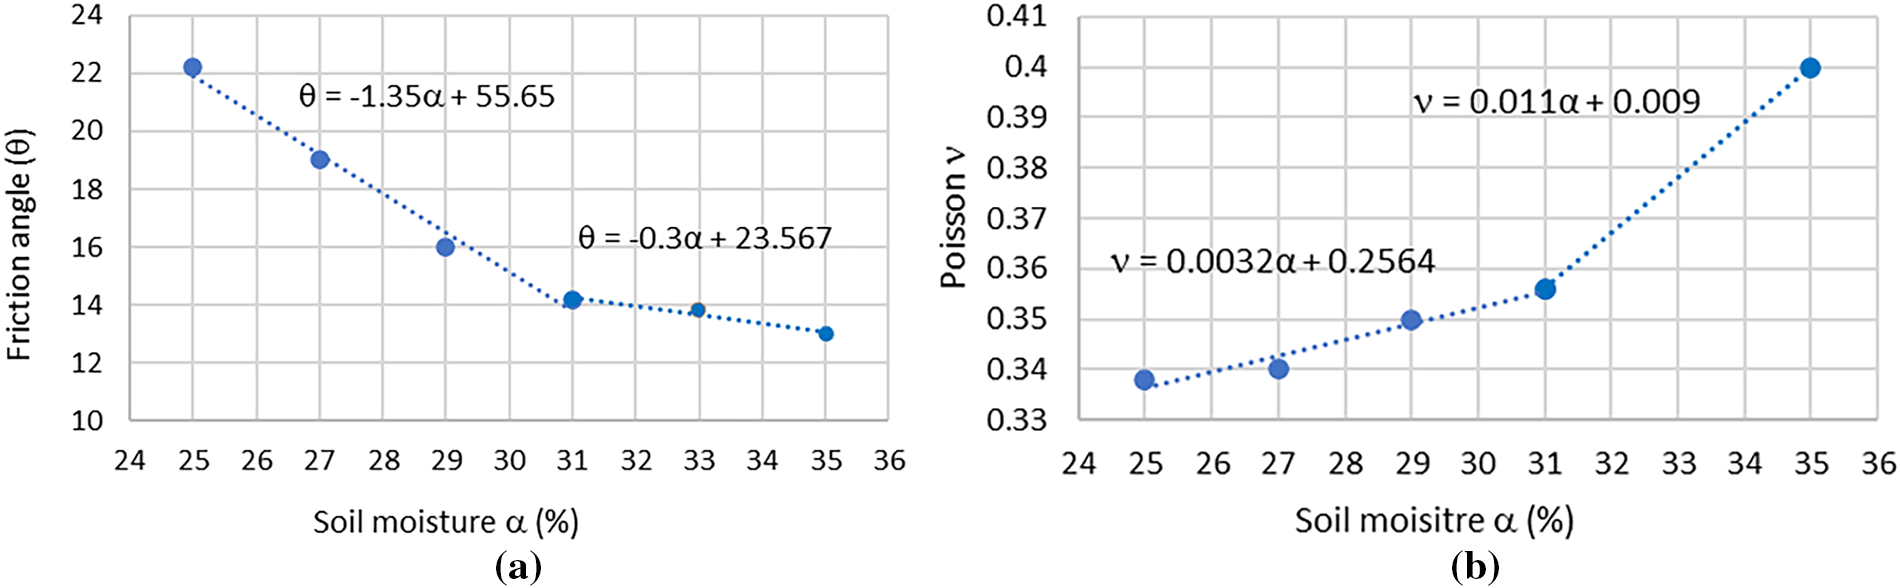
Figure 8: (a). Loamy soil’s friction angle (left), (b). Poisson ratio (right) vs. moisture content.
When combined, Eq. (18) (cohesion vs. moisture) and Eq. (21) (cohesion vs. depth) form the basis of the general Soil Moisture Decohesion Model (SMDM). The coefficients are soil-specific, varying across soil types with different liquid limits (LL). Previous investigations [24,26] (see also Matsushi et al. 2006 [26]) provide supporting data for such correlations. As a case example, this study focuses on a railway embankment slope in Kent, UK, a region with one of the highest recorded rates of slope failures (over 4000 incidents in recent decades). The dominant soil type in Kent is loamy soil with a liquid limit of 52%. Cohesion–moisture relationships for this soil type were obtained by interpolating from prior datasets [24,26], as in Fig. 5. Curve-fitting yields the coefficients p, q, and s for Eq. (18), given in Table 2. Likewise, parameters w, t, and s for Eq. (20) were determined using Eqs. (17) and (18), with results shown in Table 3.
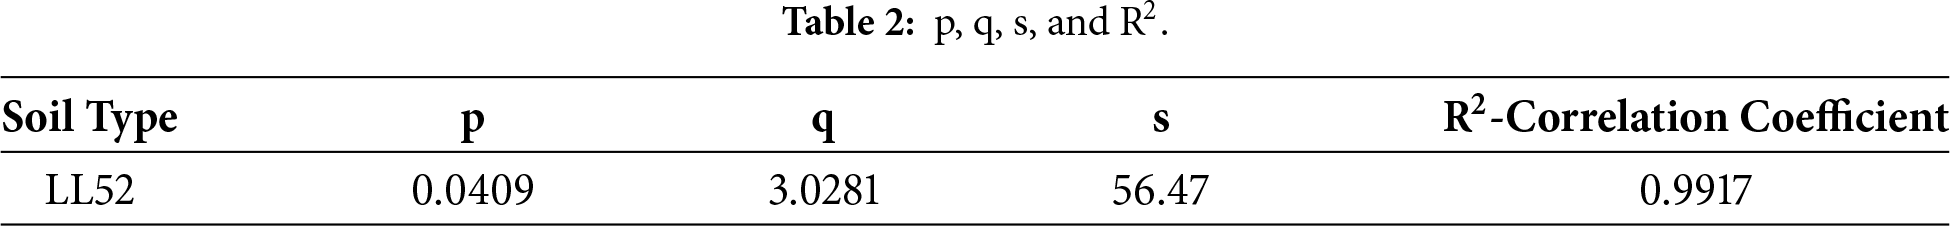
By substituting the values in Table 2, Eq. (18) can be expressed explicitly for LL52 soils as Eq. (22):
Eq. (22) captures the reduction of cohesion with increasing moisture content in the shallow layer, consistent with the trend depicted in Fig. 5. Using Eqs. (17) and (20) along with Table 3, the rainfall intensity–cohesion relationship for Kent can be expressed in Eq. (23):
In Eq. (21), Ch is the cohesion at depth h, C is the surface cohesion, and the linear parameter (
5 Soil or Slope Composite Material Properties
Soils with varying liquid limits (LL) can be generally classified as porous granular media in which cohesion binds the particles. The primary geotechnical parameters that influence the mechanical response of these soils are LL, natural water content, density, and particle gradation. In this study, the emphasis is on how moisture variations and soil depth alter the mechanical behavior of railway embankment slopes. A typical railway embankment consists of two engineered zones: the fill material and the underlying foundation, overlain by ballast or ash at the surface. The embankment body is composed of prepared materials, frequently local loamy soils blended with coarse aggregates, which are referred to in this paper as loamy soil composites. In the UK context, embankment fills usually contain aggregates of 5–40 mm, while the foundation layer comprises sands, gravels, or well-graded soils with particle sizes up to 75 mm. Detailed parameters, such as gradation, permeability, and compaction, are available in [22,24–26]. The properties of interest include water content (α), soil type (LL), cohesion (C), Young’s modulus (E), friction angle (θ), Poisson’s ratio (ν), shear strength (τf), and shear fracture toughness (Gtc). Their variation with moisture content and depth is used to evaluate slope failure processes in a representative embankment geometry. Based on experimental evidence (Stirling 2014 [28]; Subramanian et al. 2017 [29]), the modulus of the fill, Ef, decreases nearly linearly with increasing water content. The trend is summarized in Fig. 7a and can be approximated with the empirical relation of Eq. (24):
Fig. 7a indicates that Ef falls from 106.25 kPa at 25% moisture to 100 kPa at 35% moisture. Similarly, the modulus of the foundation, Ed, changes in a bi-linear manner with respect to moisture (Fig. 7b). Eq. (25) characterizes this piecewise trend:
The foundation modulus initially decreases at a slow rate (−0.685) until α ≈ 31%, after which a much steeper reduction (−4.75) occurs, bringing Ed down to ~7000 kPa at 35% moisture. This transition around 31% moisture is consistent with previously published results [28,29]. Moisture also strongly influences the shear strength parameters. Data from Zhao et al. (2018) and Li et al. (2021) [27,30] show that the friction angle θ of loamy soil in the Kent region follows a bi-linear decline with water content (Fig. 8a), represented by Eq. (26).
The reduction is rapid between 25% and 31% moisture (slope −1.35), then slows (slope −0.3) beyond 31%, reaching ~12.5° at 35%. At the same time, Poisson’s ratio ν, derived from the studies of Kumar Thota et al. (2021) and Oh and Vanapalli (2011) [31,32], increases with α (Fig. 8b). Eq. (27) gives a bi-linear expression:
here, ν rises slowly before α = 31% (slope 0.0032) and much faster afterwards (slope 0.011).
Among all investigated parameters, ν is the only one that increases with water content, indicating enhanced lateral plastic strain capacity under saturation. Overall, increasing α causes consistent reductions in stiffness and strength parameters (C, Ef, Ed, θ), but a rise in ν. The 31% moisture content emerges as a threshold, marking sharp changes in foundation stiffness, friction angle, and Poisson’s ratio. At the transition point of moisture content, soil material properties start changing or reducing. This is because of water infiltration, causing some soil particles to separate and soften partly. This behavior is crucial for predicting rainfall-induced embankment failures. Further insight is obtained from the shear strength and fracture toughness data compiled by Choo et al. (2021) [33]. As displayed in Fig. 9a,b, τf and Gtc both exhibit polynomial declines with α, summarized in Eqs. (28) and (29).
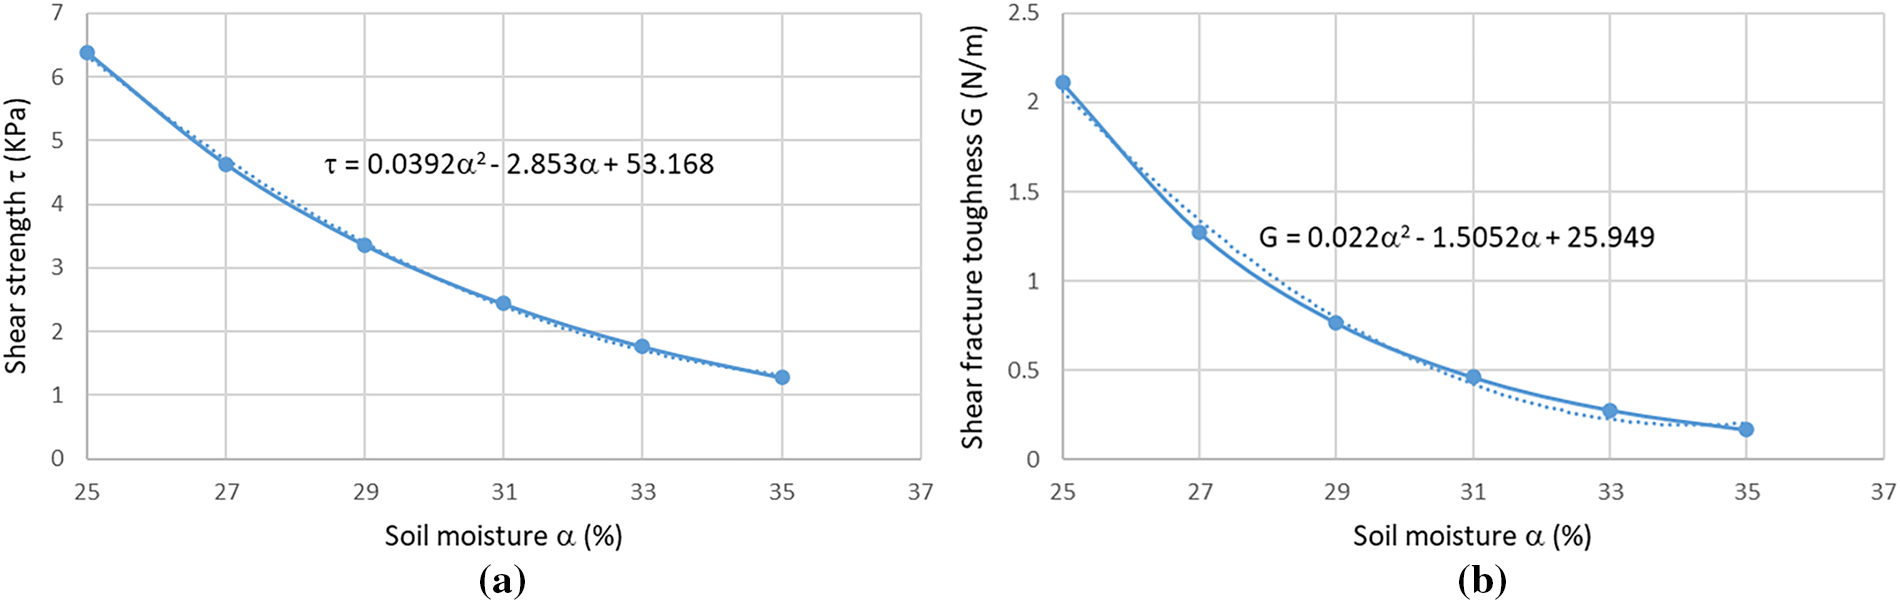
Figure 9: (a). Soil shear strength (left), (b). Shear fracture toughness (right) vs. moisture content.
At the critical moisture of 35%, τf ≈ 1.28 kPa and Gtc ≈ 0.168 N/m. These fracture parameters are applied to simulate crack propagation within the embankment slope. It should also be emphasized that soil properties vary not only with α but also with depth. For embankments, cohesion and modulus differ across fill and foundation layers, whereas θ and ν are relatively uniform with depth due to the engineered nature of the material. In this work, two soil layers are adopted to represent the embankment: the fill and the foundation, each assigned different material constants. Alternatively, depth-dependent parameters can be obtained by combining the moisture–depth correlation shown in Fig. 4 (degradation coefficient ϕ = 0.04 [22,24–26]) with Eqs. (24)–(27).
6 Damage Criteria for Shear Crack Initiation and Propagation in Slopes
Embankment slope collapse generally manifests as downslope sliding of material along a weakly bonded plane. As depicted in Fig. 10a, such planes appear as potential slip surfaces (Bačić and Juzbašić 2022 [34]), while Fig. 10b illustrates an actual failure event in Kent, UK. Key components of the failure include: (i) tensile cracking at the crest of the failed mass, (ii) lateral shear fractures at the flanks, and (iii) extensive mixed-mode deformation along the basal slip plane. The basal surface usually combines shear cracking with compressive crushing, creating a complex failure mechanism typical of porous geomaterials (Gaume et al., 2018 [35]; Rosendahl and Weißgraeber, 2020 [36,37]). For failure to occur, preliminary conditions must be satisfied: tensile opening at the slope top, flank shear fracture development, and mixed-mode cracking in the weak foundation layer. Once initiated, the overlying soil mass detaches when the combined driving forces from gravity and external loading exceed resistance from basal friction.
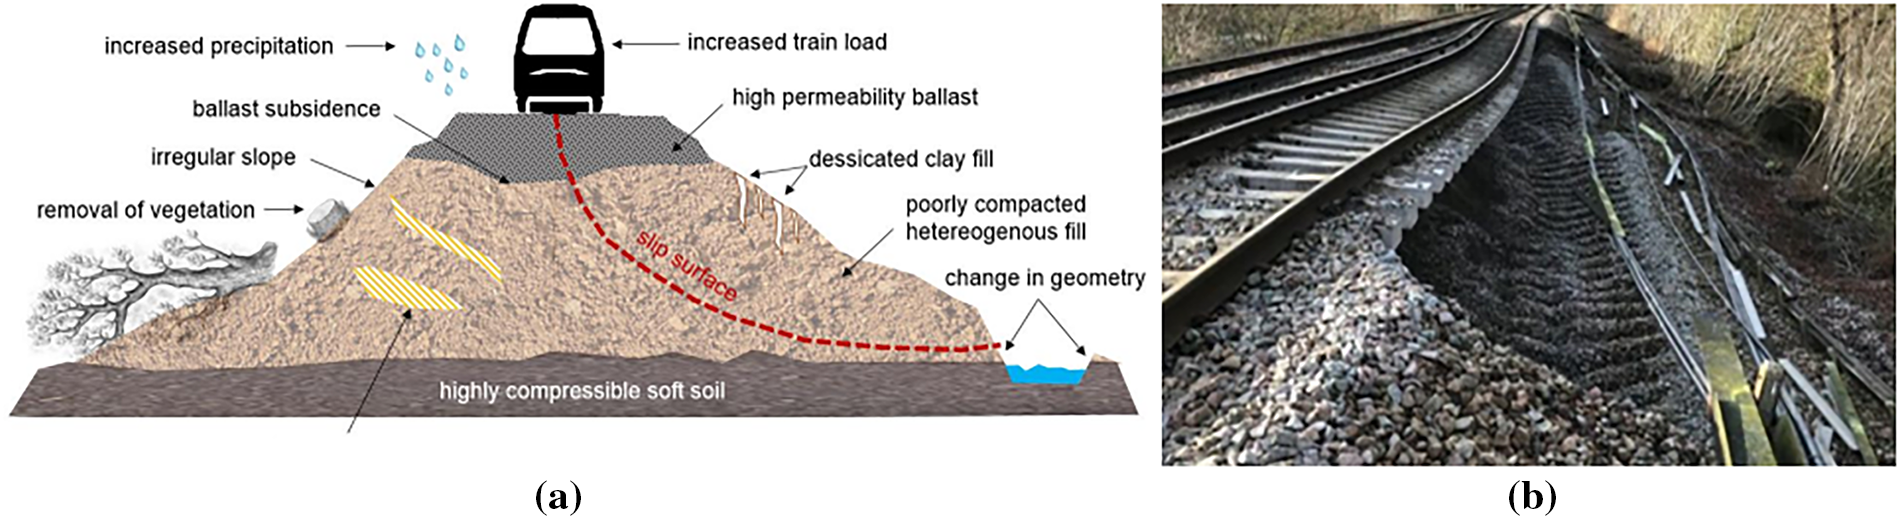
Figure 10: Railway embankment slope with a weak surface (a) and a failed case at Kent UK (b).
Two-Stage Failure Process: The progression of slope damage can be divided into two coupled stages: 1. **Damage Initiation**—The onset of localized failure, previously reported by the authors [17], occurs when the soil moisture content reaches ~35%. 2. **Shear Crack Propagation**—The subsequent enlargement of the fracture system, which is the focus here, includes continued initiation mechanisms from Stage 1 while extending them through stress and energy-based failure criteria.
Stress-Based Criterion: Mixed-mode initiation in porous soils can be expressed through the hybrid criterion proposed by Chen et al. (2022) [21], formulated in Eq. (30):
here, σn, σt, and σc denote tensile, shear, and compressive stresses, while σnc, σtc, and σcc are their critical thresholds. In practice, tensile stress is negligible in soils during rainfall-induced collapse, as cohesion loss and compressive effects dominate. Compression enhances soil particle contact, indirectly raising shear capacity. Accordingly, Eq. (30) may be reduced to a shear-only expression, linking directly to the Mohr–Coulomb framework in Eq. (31).
where τf represents shear strength, C is cohesion, φ is friction angle, and σc is the normal stress varying with slope depth. Thus, Eq. (30) simplifies to τf = σtc for assessing initiation in the Kent embankment slope.
Energy-Based Criterion: For the second stage of failure, propagation is governed by fracture energy release rates. Eq. (32) generalizes this condition.
Gn, Gt, and Gc are energy release rates associated with tensile, shear, and compressive actions, respectively. Their corresponding toughness thresholds are Gnc, Gtc, and Gcc. Simplified forms of Eq. (32) apply to individual cases: Gn = Gnc for crest tension cracks, Gt = Gtc for flank shear cracks, and a coupled Gt–Gc interaction for basal mixed-mode propagation. Because compressive effects are reflected through enhanced shear resistance, Eq. (32) can be reduced to Gt = Gtc for the dominant shear-driven crack extension within the slope body.
Model Representation: Fig. 11 illustrates the slope domain adopted in this study, showing (a) a half-section of the embankment and (b) the corresponding model representation under a distributed load of 37.5 kN/m. This framework supports the numerical evaluation of slope stability using the stress- and energy-based damage formulations described above.
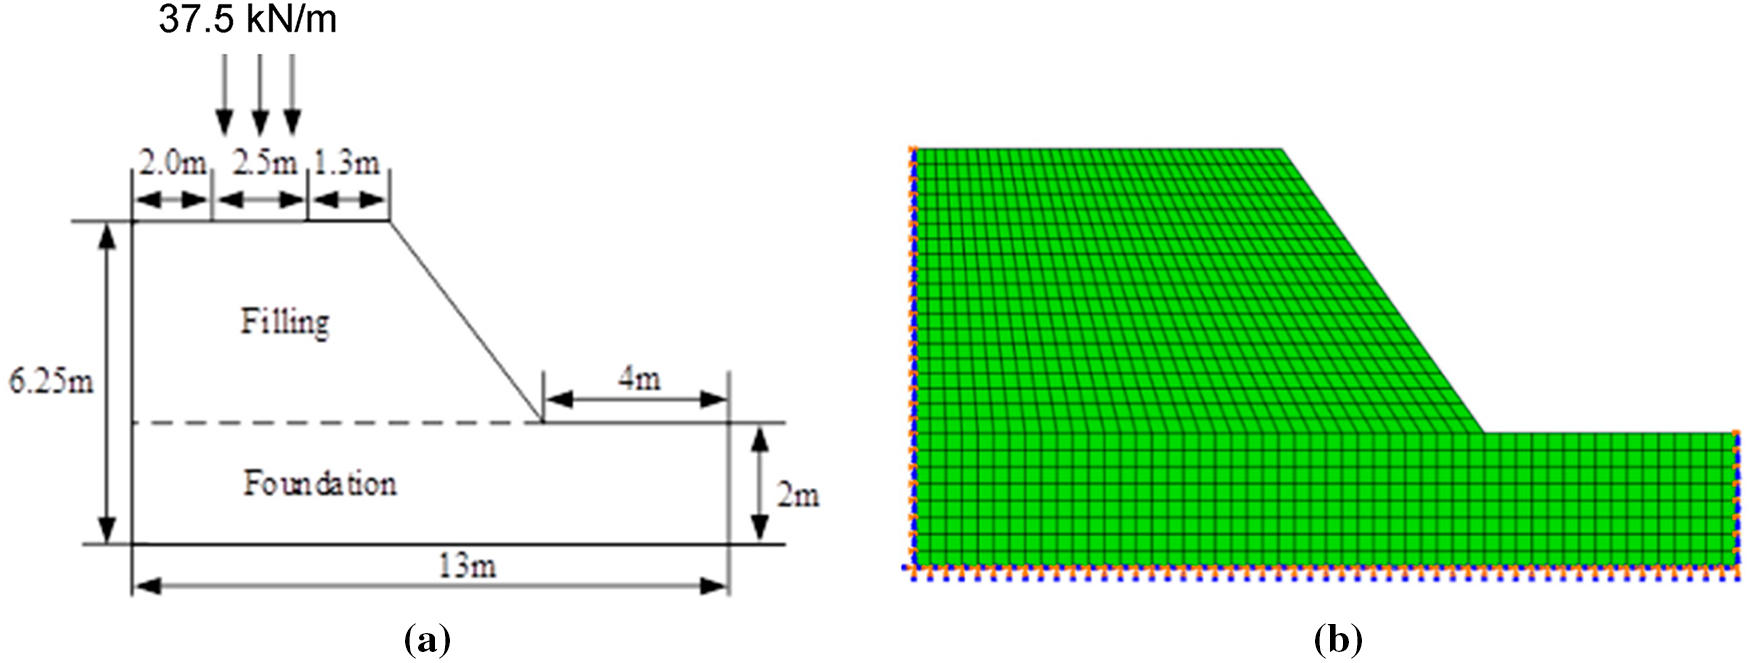
Figure 11: (a). A half of railway embankment slope, (b). A half model of railway embankment slope.
7 The SMECDE Prediction of Shear Crack Propagation
As an example, a railway embankment slope in the Kent region is selected for investigation in this paper. Fig. 11a shows a half-configuration of the railway embankment slope, including its geometrical size, shape, and external loads, used in the analysis due to its symmetrical features [28]. The following material properties—soil moisture, cohesion, Young’s modulus, shear fracture toughness, friction angle, and Poisson’s ratio—are used in this investigation as functions of soil moisture, based on the equations and figures presented in Sections 3 and 5. The detailed values of these properties are provided in Table 4. Fig. 11b presents a basic SMECDE model of half the railway embankment slope with the boundary conditions applied: symmetrical restraints on the left edge and fixed restraints at the bottom of the model. The mesh density, as shown in Fig. 11b, is determined by element sizes ranging from 0.1 to 0.25 m. The proposed SMECDE element, a four-node formulation, is used in the numerical mesh for the simulation. The modeling analysis includes both geostatic and large deformation simulations driven by gravity and train loading. The chosen mesh density is commonly used in geotechnical slope analyses. The SMECDE element is developed within the basic framework of the Extended Cohesive Damage Element (ECDE) method. This element provides high iterative accuracy across a relatively wide range of mesh densities and ensures convergence in nonlinear analysis. Detailed studies on mesh independence can be found in references [21,23–26].
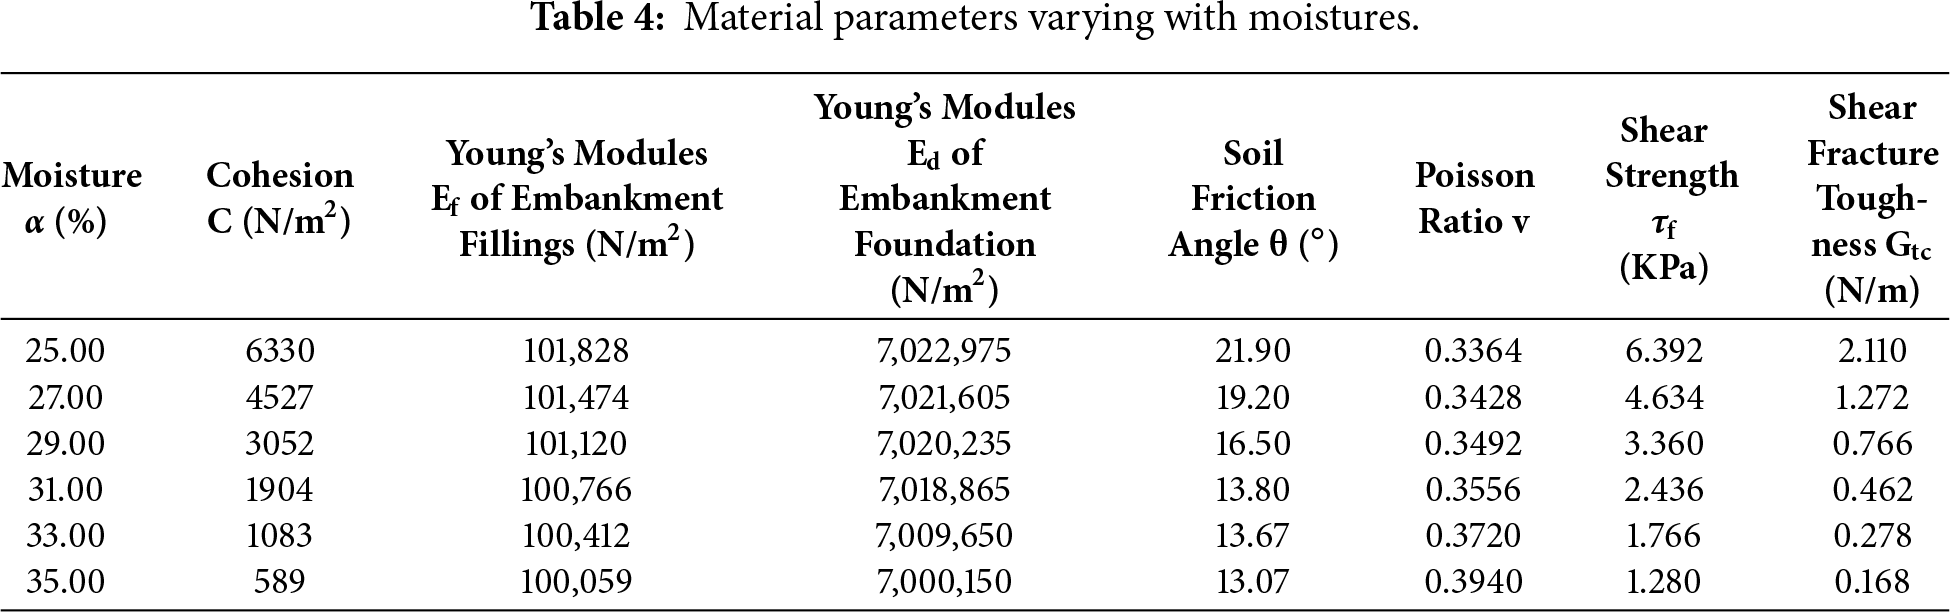
Continuing from previous work [17], this paper investigates shear crack propagation in six cases with varying ground surface soil moisture: 25%, 27%, 29%, 31%, 33%, and 35%. The corresponding material properties are provided in Table 4. Table 5 presents the material property values at a ground surface moisture content of 35%, varying with soil depth from 0 to 6 m—the depth of the railway embankment slope. As a consequence, no shear crack propagation is observed until the soil moisture reaches 35%. Fig. 12 shows the predicted initial damage surface, represented by plastic shear strain contours at 35% moisture. The initial damage surface tends to separate the portion of the slope above the failed surface on the right side from the remaining body of the embankment. This surface is further confirmed by the shear crack propagation results, discussed in detail for the 35% soil moisture condition.
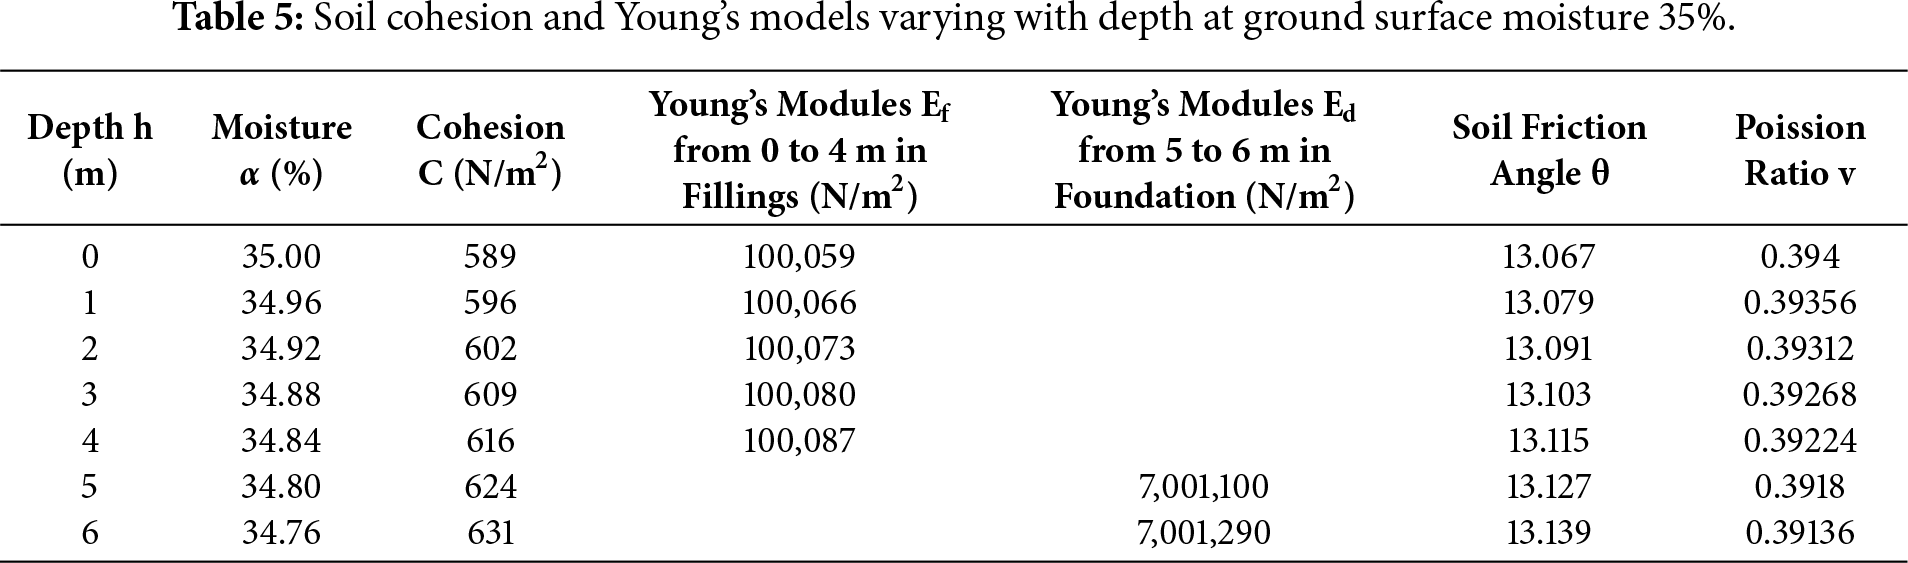
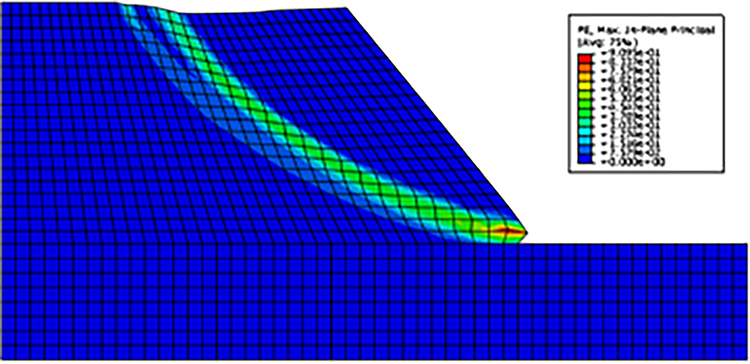
Figure 12: Predicted initial damage surfaces at critical soil moisture 35/%.
Fig. 13 shows the final shear fracture stage predicted by the SMECDE method along the failed surface at 35% soil moisture, based on the large deformation strain contour. In this figure, an equivalent load representing the combined effects of soil self-weight and a portion of the train pressure from the top is applied at the top-right corner to simplify the loading conditions. This equivalent load approach aims to isolate the contributions of soil self-weight and train pressure to each stage of shear crack propagation within the slope. The grey region in Fig. 13 indicates the actual curved fractured surface, where all SMECDE elements have failed due to shear cracking. Corresponding internal stresses at these locations are zero at the end of the iterative analysis. It should be noted that the mesh shown in Fig. 13 is locally refined in the potential cracking region, with element density increased by a factor of two compared to Fig. 11b. Conversely, the mesh outside this region is coarsened, with element density reduced by half relative to Fig. 11b. This refinement strategy is employed to accurately capture the crack path while minimizing computational cost. Fig. 14 presents the failure response through a load–displacement curve, showing multiple crack propagation stages under varying load levels when the slope fails at 35% soil moisture. Five distinct fracture stages are identified before reaching the final shear failure.
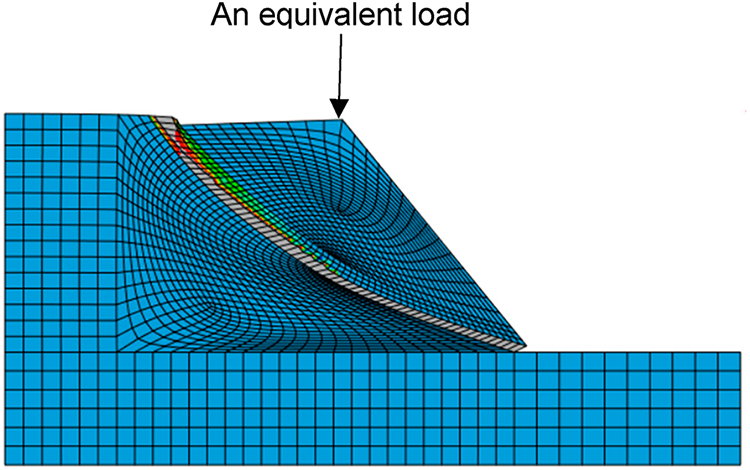
Figure 13: Predicted shear crack propagation along failed surface at 35% soil moisture.
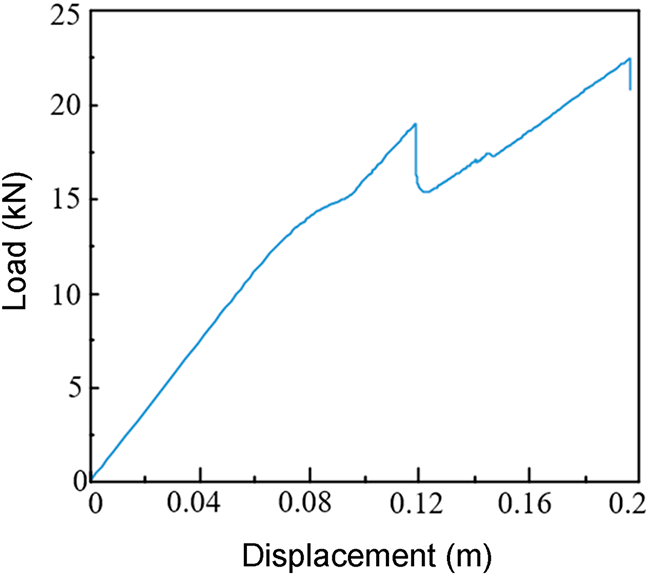
Figure 14: Load–displacement curve when part of slope slides down at 35% soil moisture.
Fig. 15 illustrates the detailed progression of different fracture stages under varying loading conditions, using zoomed views of shear crack states and indicated crack points on the curve. Fig. 15a presents the first fracture stage, where crack initiation occurs at the corner between the slope’s fill material and its foundation. At this stage, the corresponding point on the load–displacement curve shows a slight deviation in the tangential direction. The second fracture stage, shown in Fig. 15b, features an expanded crack propagating along the initial damage surface from the initiation point toward the top of the slope. This stage corresponds to a more pronounced tangential change in the load–displacement curve. Fig. 15c displays the third fracture stage, where the crack continues to propagate upward along the initial damage surface, with a gradual increase in crack width. This is associated with a significant load drop, indicating a notable loss of structural stiffness. Although degraded, the structure still retains some load-bearing capacity at this stage. In the fourth fracture stage (Fig. 15d), a new crack suddenly appears at the top of the slope when a minor drop is observed in the load–displacement curve. This top-surface crack is often reported in field investigations and may be misidentified as the initial crack. However, as shown in Fig. 15a, the actual initial crack originates at the corner between the fill and the foundation, which may be difficult to detect in the field. The fifth fracture stage (Fig. 15e) occurs when the crack from the top propagates downward and connects with the long crack formed during the third stage, establishing a continuous fracture path from the corner to the top of the slope. At this point, the initial damage surface transforms into a fully developed fracture surface, completely separating the upper-right portion of the slope from the rest of the embankment. The corresponding load of 22.5 kN shown in Fig. 15e represents the final fracture force required to initiate slope failure. Notably, the fourth and fifth fracture stages, illustrated in Fig. 15d,e, are typically observable in field investigations.
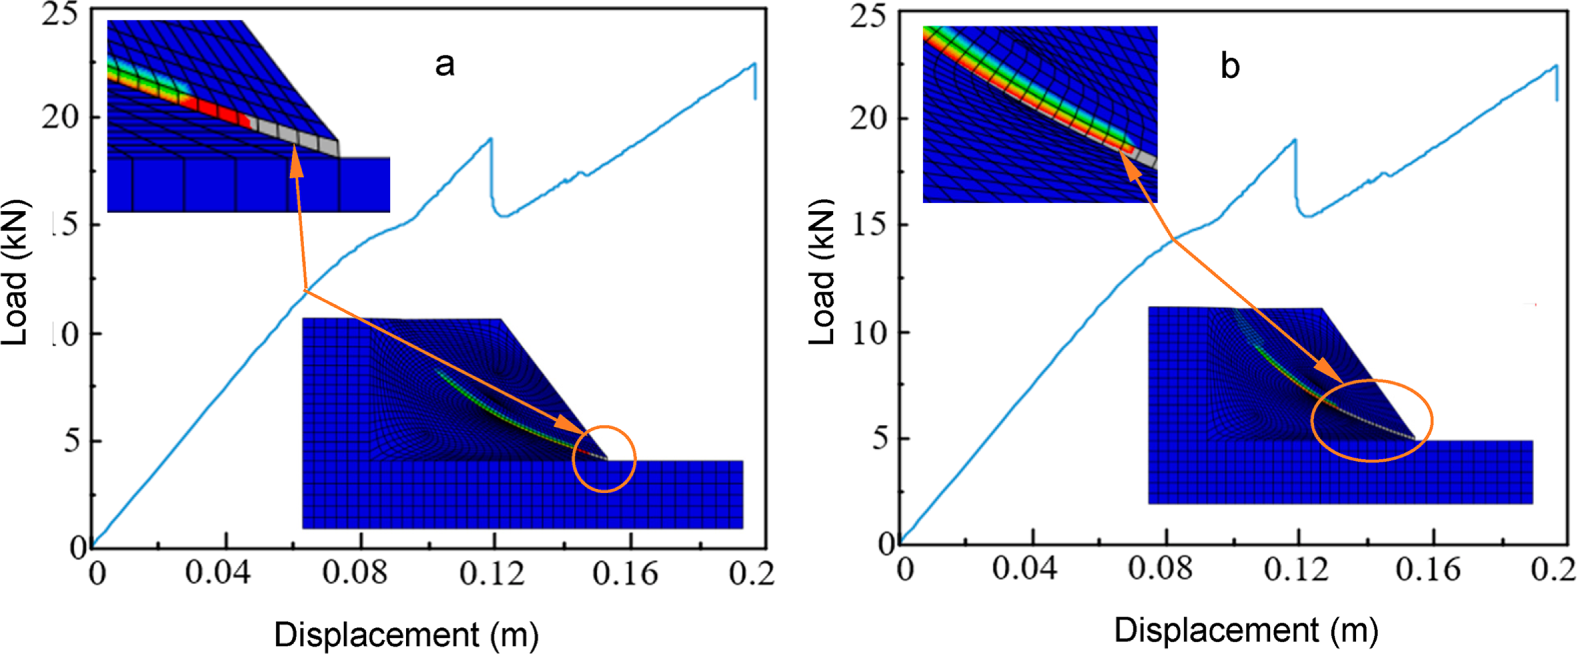
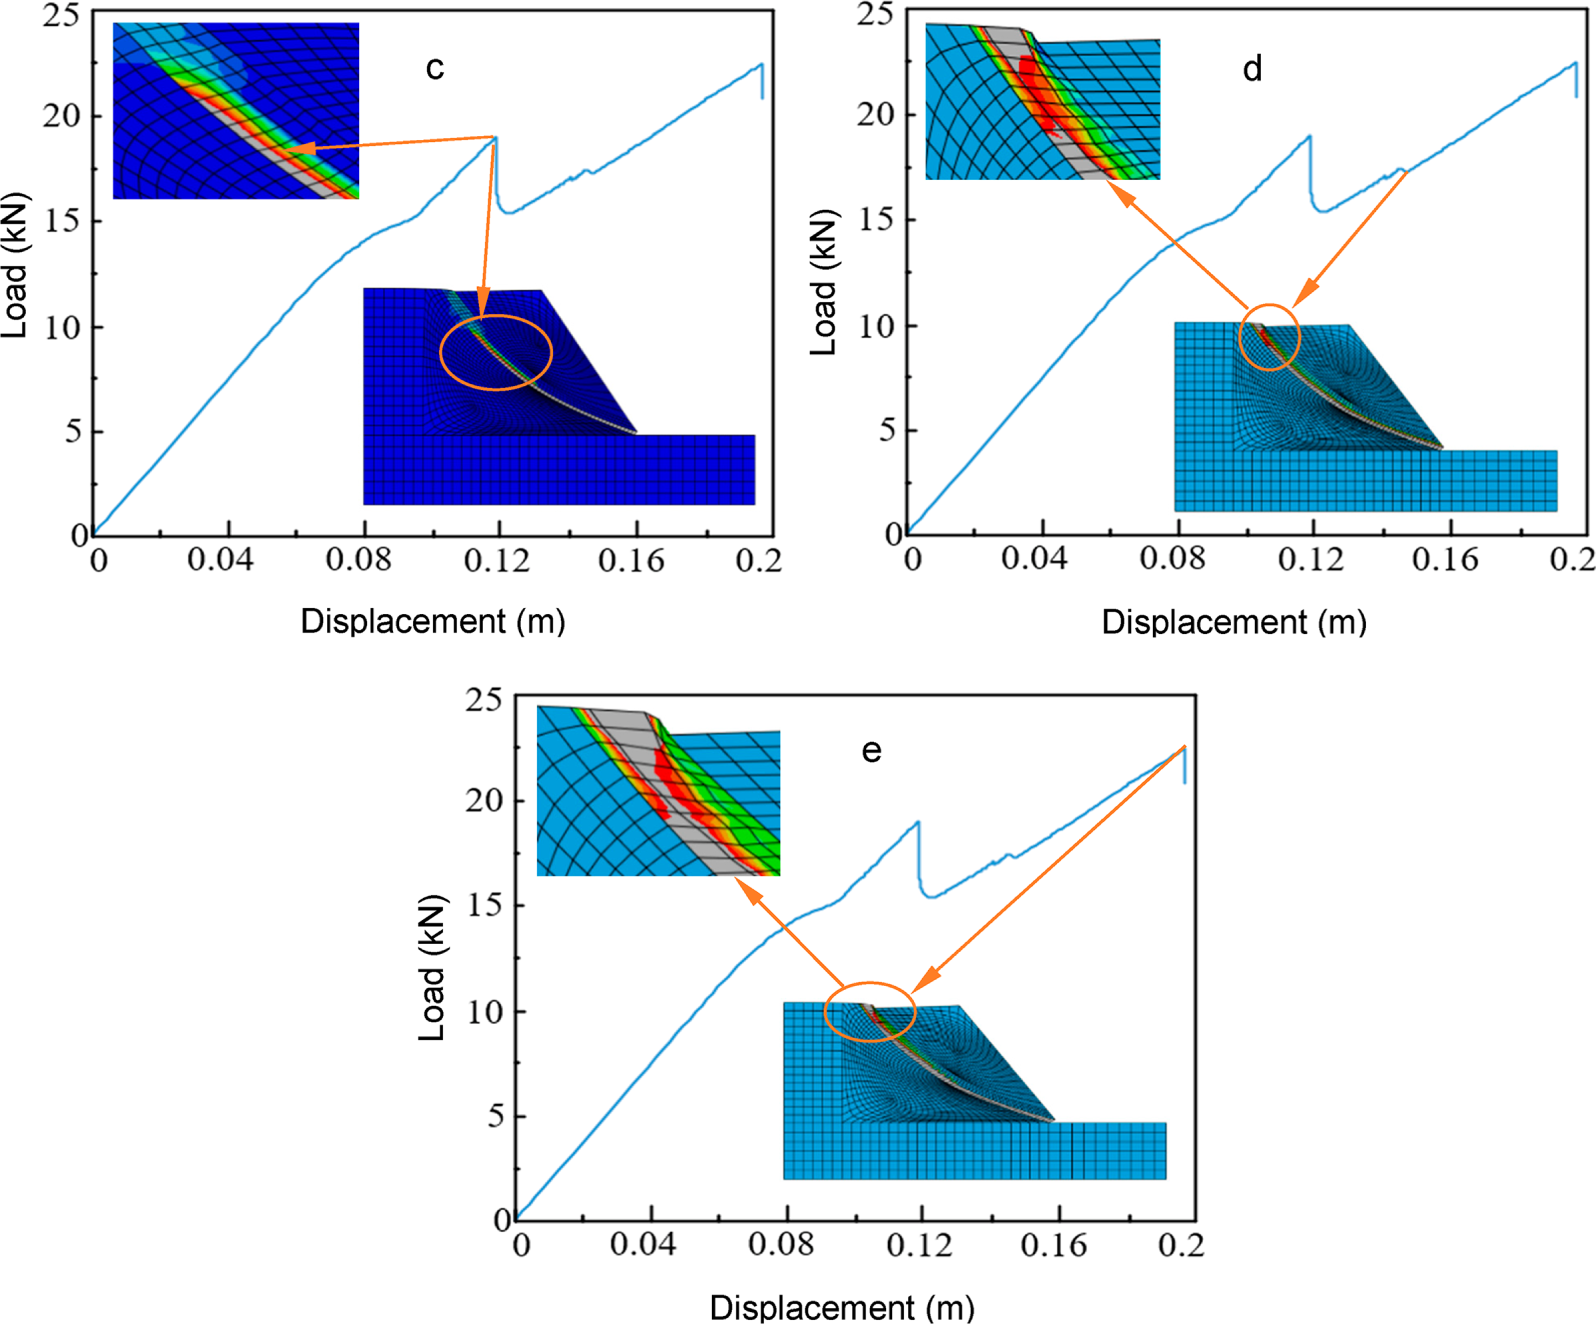
Figure 15: Predicted fracture response with variable cracking stages under different loads.
8 Crack Driving Forces at the Critical Soil Moisture
In fracture stages a to c mentioned in Section 7, cracks have not reached the top or not broken the train pressure line (Fig. 10) on the top of the slope. The crack driving force should include soil self-weight and the part of train pressure on the right side of the point at which the initially predicted damage surface reaches the train pressure line (Fig. 13). In the fracture stages d and e, the crack has broken the train pressure line, and the crack driving force only accounts for soil self-weight. The equivalent load F as crack driving force at different fracture stages can be accounted by Eq. (33) as below.
where, total train pressure W = PL, P is a train pressure taken as 37.5 kN/m, L is the train pressure length taken as 2.5 m (Fig. 11); soil gravity from self-weight G = Sρ = 140.467 kN in this plain strain model, S is the area estimated from the geometrical shape shown in Fig. 12 as 7.963 m2, soil density ρ is taken as 1800 kg/m3;
9 Validation of the Modelling Prediction of the Railway Embankment Slope
To validate the failure prediction of the Kent railway embankment slope, it is important to note that, to date, no detailed laboratory or field investigations of the actual slope failure have been reported. However, meteorological data from previous studies [32–35] indicate that rainfall intensities ranged from 60 to 70 mm/h during the failure event at the Kent site, as shown in Fig. 10b. This observation supports the predicted critical rainfall intensity of 66 mm/h proposed in previous work [17]. In the present investigation, this rainfall intensity corresponds to a critical soil moisture level of 35%.
To further validate the SMECDE failure prediction, the standard commercial FEM software ABAQUS is employed. Using the same numerical mesh (Fig. 11b) and boundary conditions as those used in the SMECDE model, a standard plane strain element (CPE4I) is adopted. Material parameters from Tables 4 and 5 are used to simulate large plastic deformation under identical loading and restraint conditions. Fig. 16 presents the displacement contours of the slope at the critical soil moisture of 35%. A significant plastic deformation is observed in the upper right portion of the slope, forming a failure surface that separates it from the rest of the embankment. This result is consistent with the SMECDE prediction of the initial damage surface driven by shear crack propagation. Unlike the SMECDE, however, the standard plane strain elements in ABAQUS are not capable of explicitly modelling shear crack propagation due to the limitations of the commercial package. The ABAQUS modelling is an indirect validation.
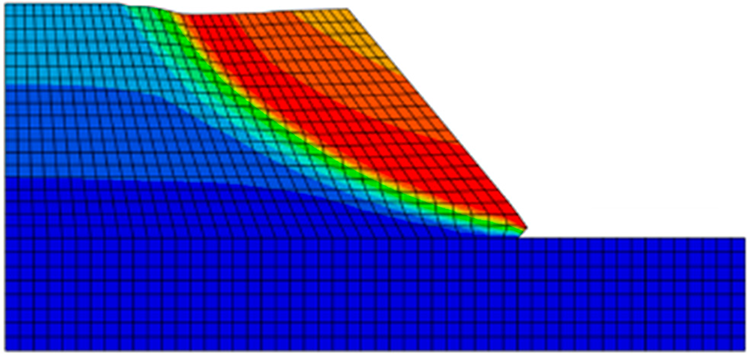
Figure 16: Predicted large plastic deformations at soil moistures 35%.
10 Conclusions and Future Directions
The developed SMECDE method was successfully applied to predict shear crack propagation in the Kent railway embankment slope using meteorological data related to soil moisture and rainfall. This investigation examined the mechanisms of shear cracking in the embankment slope under varying soil moisture levels and rainfall intensities. A critical soil moisture threshold of 35%, corresponding to a rainfall intensity of 66 mm/h, was identified as the tipping point for slope failure. This study confirms that the slope failure is dominated by shear fracture, resulting in slope sliding at the identified critical moisture level. For the first time, this paper presents a detailed investigation of shear crack propagation along the initial damage surface under varying crack-driving forces. The shear crack was found to initiate at the corner between the fill material and the foundation and to propagate upward along a curved failure surface within the slope. The predicted fracture-driving loads at various stages were shown to be a small proportion of the total gravitational force, with the final driving load accounting for less than 20% of gravity. This indicates that the slope had already been critically weakened and was prone to sliding under these conditions. The proposed SMECDE method demonstrates strong potential as a predictive tool for issuing early warnings of railway slope failures based on weather forecasts. This investigation is limited to a 2D model. Future work will focus on investigating the spatiotemporal effects of soil moisture and rainfall intensity on cohesion loss. Furthermore, a spatiotemporal digital monitoring network can be developed using the SMECDE framework—incorporating varying soil types, slope angles, and geometric scales—to improve slope failure prediction and support decision-making in railway infrastructure management.
Acknowledgement: The authors appreciate Mr Simon Abbott at NetworkRail UK for his kindly provided data of railway embankment slope used in this investigation.
Funding Statement: The authors received no specific funding for this study.
Author Contributions: The authors confirm contribution to the paper as follows: study conception and design: Jiye Chen; data collection: Min Fu, Bing Leng; analysis and interpretation of results: Min Fu, Sudath Loku-Pathirage; draft manuscript preparation: Jiye Chen, Sudath Loku-Pathirage. All authors reviewed and approved the final version of the manuscript.
Availability of Data and Materials: The data of material properties and findings have been released in the paper. The data of numerical code is too long to be released in the paper; it could be available under request.
Ethics Approval: Not applicable.
Conflicts of Interest: The authors declare no conflicts of interest.
References
1. Niroumand H, Kassim KA, Ghafooripour A, Nazir R, Far SYZ. Investigation of slope failures in soil mechanics. Electron J Geotech Eng. 2012;17:2703–18. [Google Scholar]
2. China geological and environment information site (CGEIS) [Internet]. 2019 [cited 2026 Jan 1]. Available from: http://www.cigem.cgs.gov.cn. [Google Scholar]
3. Froude MJ, Petley DN. Global fatal landslide occurrence from 2004 to 2016. Nat Hazards Earth Syst Sci. 2018;18(8):2161–81. doi:10.5194/nhess-18-2161-2018. [Google Scholar] [CrossRef]
4. Xu Q, Shang Y, van Asch T, Wang S, Zhang Z, Dong X. Observations from the large, rapid Yigong rock slide–debris avalanche, southeast Tibet. Can Geotech J. 2012;49(5):589–606. doi:10.1139/t2012-021. [Google Scholar] [CrossRef]
5. Gu X, Zhang W, Ou Q, Zhu X, Qin C. Conditional random field-based stochastic analysis of unsaturated slope stability combining Hoffman method and Bayesian updating. Eng Geol. 2024;330:107415. doi:10.1016/j.enggeo.2024.107415. [Google Scholar] [CrossRef]
6. Teza G, Pesci A, Genevois R, Galgaro A. Characterization of landslide ground surface kinematics from terrestrial laser scanning and strain field computation. Geomorphology. 2008;97(3–4):424–37. doi:10.1016/j.geomorph.2007.09.003. [Google Scholar] [CrossRef]
7. Milledge DG, Bellugi D, McKean JA, Densmore AL, Dietrich WE. A multidimensional stability model for predicting shallow landslide size and shape across landscapes. J Geophys Res Earth Surf. 2014;119(11):2481–504. doi:10.1002/2014JF003135. [Google Scholar] [PubMed] [CrossRef]
8. Donzé FV, Richefeu V, Magnier SA. Advances in discrete element method applied to soil, rock and concrete mechanics. Electron J Geotech Eng. 2009;8(1):44. [Google Scholar]
9. Quinn PE, Diederichs MS, Rowe RK, Hutchinson DJ. A new model for large landslides in sensitive clay using a fracture mechanics approach. Can Geotech J. 2011;48(8):1151–62. doi:10.1139/t11-025. [Google Scholar] [CrossRef]
10. Zhang W, Wang D, Randolph MF, Puzrin AM. Catastrophic failure in planar landslides with a fully softened weak zone. Géotechnique. 2015;65(9):755–69. doi:10.1680/geot14.p.218. [Google Scholar] [CrossRef]
11. Zhang X, Wang L, Krabbenhoft K, Tinti S. A case study and implication: particle finite element modelling of the 2010 Saint-Jude sensitive clay landslide. Landslides. 2020;17(5):1117–27. doi:10.1007/s10346-019-01330-4. [Google Scholar] [CrossRef]
12. Shen F, Zhao Y, Li B, Wu K. A calculation method of double strength reduction for layered slope based on the reduction of water content intensity. Comput Model Eng Sci. 2024;138(1):221–43. doi:10.32604/cmes.2023.029159. [Google Scholar] [CrossRef]
13. Li C, Feng P, Meng J, Catani F, Hellevang H, Tang H, et al. Physics-informed deep learning for revealing the evolutionary characteristics of landslides induced by rainfall process. Geophys Res Lett. 2025;52(21):e2025GL117356. doi:10.1029/2025gl117356. [Google Scholar] [CrossRef]
14. Findell KL. An analysis of the relationship between soil moisture, rainfall, and boundary layer conditions, based on direct observations from Illinois [dissertation]. Cambridge, MA, USA: Massachusetts Institute of Technology; 1997. [Google Scholar]
15. Albataineh N. Slope stability analysis using 2D and 3D methods [master’s thesis]. Akron, OH USA: University of Akron; 2006. [Google Scholar]
16. Brandyk A, Szeląg B, Kiczko A, Krukowski M, Kozioł A, Piotrowski J, et al. In search of a soil moisture content simulation model: mechanistic and data mining approach based on TDR method results. Sensors. 2021;21(20):6819. doi:10.3390/s21206819. [Google Scholar] [PubMed] [CrossRef]
17. Loku-Pathirage S, Chen J, Fu M. Predicting railway slope failure under heavy rainfall using the soil moisture extended cohesive damage element method. GeoHazards. 2025;6(1):14. doi:10.3390/geohazards6010014. [Google Scholar] [CrossRef]
18. Li X, Chen J. An extended cohesive damage model for simulating arbitrary damage propagation in engineering materials. Comput Meth Appl Mech Eng. 2017;315:744–59. doi:10.1016/j.cma.2016.11.029. [Google Scholar] [CrossRef]
19. Li X, Chen J. An extended cohesive damage model for simulating multicrack propagation in fibre composites. Compos Struct. 2016;143:1–8. doi:10.1016/j.compstruct.2016.02.026. [Google Scholar] [CrossRef]
20. Li X, Chen J. The implementation of the extended cohesive damage model for multicrack evolution in laminated composites. Compos Struct. 2016;139:68–76. doi:10.1016/j.compstruct.2015.11.080. [Google Scholar] [CrossRef]
21. Chen J, Fyffe B, Han D, Yang S. Predicting mixed mode damage propagation in snowpack using the extended cohesive damage element method. Theor Appl Fract Mech. 2022;122:103567. doi:10.1016/j.tafmec.2022.103567. [Google Scholar] [CrossRef]
22. Dong Y, Wu Y, Yin J, Wang Y, Gou S. Investigation of soil shear-strength parameters and prediction of the collapse of gully walls in the black soil region of northeastern China. Phys Geogr. 2011;32(2):161–78. doi:10.2747/0272-3646.32.2.161. [Google Scholar] [CrossRef]
23. ECMWF. Forecast charts and data [Internet]. [cited 2026 Jan 1]. Available from: https://www.ecmwf.int/en/forecasts. [Google Scholar]
24. Yu Y, Wei W, Chen LD, Jia FY, Yang L, Zhang HD, et al. Responses of vertical soil moisture to rainfall pulses and land uses in a typical loess hilly area, China. Solid Earth. 2015;6(2):595–608. doi:10.5194/se-6-595-2015. [Google Scholar] [CrossRef]
25. Earthworks asset policy development-global stability and resilience appraisal report [Internet]. 2017 [cited 2026 Jan 1]. Available from: https://www.geolsoc.org.uk/~/media/shared/documents/events/Past%20Meeting%20Resources/Ground%20Related%20Risk/Mellor%20Richard.pdf. [Google Scholar]
26. Matsushi Y, Matsukura Y. Cohesion of unsaturated residual soils as a function of volumetric water content. Bull Eng Geol Environ. 2006;65(4):449–55. doi:10.1007/s10064-005-0035-9. [Google Scholar] [CrossRef]
27. Zhao Y, Duan X, Han J, Yang K, Xue Y. The main influencing factors of soil mechanical characteristics of the gravity erosion environment in the dry-hot valley of Jinsha river. Open Chem. 2018;16(1):796–809. doi:10.1515/chem-2018-0086. [Google Scholar] [CrossRef]
28. Stirling RA. Multiphase modelling of desiccation cracking in compacted soil [dissertation]. Newcastle upon Tyne, UK: Newcastle University; 2014. [Google Scholar]
29. Subramanian SS, Ishikawa T, Tokoro T. Climatic effects on the stability of unsaturated soil slope in cold region. In: Proceedings of the 19th International Conference on Soil Mechanics and Geotechnical Engineering; 2017 Sep 17–22; Seoul, Republic of Korea. p. 2203–6. [Google Scholar]
30. Li J, Li L, Li C. Experimental study of triaxial test of unsaturated expansive soil shear strength. IOP Conf Ser Earth Environ Sci. 2021;692(4):042010. doi:10.1088/1755-1315/692/4/042010. [Google Scholar] [CrossRef]
31. Kumar Thota S, Duc Cao T, Vahedifard F. Poisson’s ratio characteristic curve of unsaturated soils. J Geotech Geoenviron Eng. 2021;147(1):04020149. doi:10.1061/(asce)gt.1943-5606.0002424. [Google Scholar] [CrossRef]
32. Oh WT, Vanapalli SK. Relationship between Poisson’s ratio and soil suction for unsaturated soils. In: Proceedings of the 5th Asia-Pacific Conference on Unsaturated Soils; 2011 Nov 14–16; Bangkok, Thailand. p. 239–45. [Google Scholar]
33. Choo J, Sohail A, Fei F, Wong TF. Shear fracture energies of stiff clays and shales. Acta Geotech. 2021;16(7):2291–9. doi:10.1007/s11440-021-01145-5. [Google Scholar] [CrossRef]
34. Bačić M, Juzbašić A. Challenges of railway embankments remediation. In: Proceedings of the International Conference on Civil, Structural and Transportation Engineering; 2020 Nov 12–14; Niagara, ON, Canada. 268 p. doi:10.11159/iccste20.268. [Google Scholar] [CrossRef]
35. Gaume J, Gast T, Teran J, van Herwijnen A, Jiang C. Dynamic anticrack propagation in snow. Nat Commun. 2018;9(1):3047. doi:10.1038/s41467-018-05181-w. [Google Scholar] [PubMed] [CrossRef]
36. Rosendahl PL, Weißgraeber P. Modeling snow slab avalanches caused by weak-layer failure–Part 2: coupled mixed-mode criterion for skier-triggered anticracks. Cryosphere. 2020;14(1):131–45. doi:10.5194/tc-14-131-2020. [Google Scholar] [CrossRef]
37. Environment Agency. Monthly water situation report: Kent and South London Area [Internet]. [cited 2026 Jan 1]. Available from: https://assets.publishing.service.gov.uk/media/698c7981bd090be481c28772/Kent_and_South_London_Water_Situation_Report_January_2026.pdf. [Google Scholar]
Cite This Article
 Copyright © 2026 The Author(s). Published by Tech Science Press.
This work is licensed under a Creative Commons Attribution 4.0 International License , which permits unrestricted use, distribution, and reproduction in any medium, provided the original work is properly cited.
 Downloads
 Citation Tools