
 Submit a Paper
 Propose a Special lssue
 Open Access
ARTICLE

SCAN: Structural Clustering with Adaptive Thresholds for Intelligent and Robust Android Malware Detection under Concept Drift
1 Department of Cybersecurity, Dankook University, Yong-in, Republic of Korea
2 Department of Software Science, Dankook University, Yong-in, Republic of Korea
3 Division of Computer Science and Engineering, Sunmoon University, Asan, Republic of Korea
4 Department of AI-Based Convergence, Dankook University, Yong-in, Republic of Korea
* Corresponding Author: Seong-je Cho. Email:
(This article belongs to the Special Issue: Advanced Security and Privacy for Future Mobile Internet and Convergence Applications: A Computer Modeling Approach)
Computer Modeling in Engineering & Sciences 2026, 146(3), 41 https://doi.org/10.32604/cmes.2026.074936
Received 21 October 2025; Accepted 14 January 2026; Issue published 30 March 2026
 View Full Text
 Download PDF
Abstract
Many machine learning–based Android malware detection often suffers from concept drift, where models trained on historical data fail to generalize to evolving threats. This paper proposes SCAN (Structural Clustering with Adaptive thresholds for iNtelligent Android malware detection), a hybrid intelligent framework designed to mitigate concept drift without retraining. SCAN integrates Gaussian Mixture Models (GMMs)-based clustering with cluster-wise adaptive thresholding and supervised classifiers tailored to each cluster. A key challenge in clustering-based malware detection is cluster-wise class imbalance, where clusters contain disproportionate distributions of benign and malicious samples. SCAN addresses this issue through adaptive thresholding, which dynamically adjusts the decision boundary of each cluster according to its malicious-to-benign ratio. In the final training stage, four supervised learning algorithms—Random Forest (RF), Support Vector Machine (SVM), k-NN, and XGBoost—are applied within the GMM-defined clusters. We train SCAN on Android applications collected from 2014–2017 and test it with applications from 2018–2023. Experimental results demonstrate that SCAN combined with RF consistently achieves superior performance, with both average accuracy and average F1-score exceeding 91%. These findings confirm SCAN’s robustness to concept drift and highlight its potential as a sustainable and intelligent solution for long-term Android malware detection in the real world.Keywords
According to recent statistics from Comparitech [1], approximately 33.3 million malware targeted Android devices in 2024. In particular, mobile banking Trojans raised significant concerns, increasing by 196% to 1.24 million in 2024. These applications pose significant threats to user safety by engaging in harmful behaviors such as stealing sensitive data, increasing privileges without user permission, and generating fraudulent advertisements [2–4]. Given that Android dominates the global mobile market, the rapid proliferation of such threats underscores the urgent need to develop effective and sustainable malicious app detection technologies.
Existing research on Android malware detection primarily relies on two categories of features: static and dynamic. Static features, which include API calls, permissions, opcodes, and control flow graphs (CFGs), are widely adopted due to their ease of extraction and suitability for large-scale analysis. Foundational studies have established the baseline effectiveness of combining API calls and permissions for robust detection [5,6]. To address the high dimensionality inherent in these features—such as the presence of thousands of distinct API calls—subsequent research has employed feature selection algorithms ranging from statistical scoring to Reinforcement Learning (RL) [7–10]. More recently, complex architectures such as graph neural networks (GNNs) and Stacked Networks have been introduced to capture the semantic relationships between static features, rather than treating them as isolated data points [11–13]. In contrast, dynamic features rely on runtime behavioral data, such as system call traces and network activity. While these approaches enable in-depth analysis, they are computationally expensive, often requiring resource-intensive sandboxing or dedicated execution environments. Consequently, this paper focuses on static API calls, as they offer a high-level abstraction of app functionality that balances detection capability with the efficiency required for practical deployment.
Meanwhile, a fundamental challenge, concept drift, undermines the long-term effectiveness of Android malware detection using machine learning. The evolving Android ecosystem, which is characterized by frequent changes in API calls, applications’ behaviors, and security updates, causes previously learned models to become obsolete. This phenomenon, commonly known as ‘concept drift’, leads to continuous and measurable decreases in the performance of detection techniques over time [14–17]. In particular, API call-based detection models can be vulnerable to this issue, as the evolution of malware behaviors and the sheer volume of features can lead to rapid performance degradation [6,9,11]. To mitigate the concept drift problem, several studies have proposed periodic retraining strategies [14–17].
To address the challenge of concept drift in Android malware detection, we propose an intelligent hybrid malware detection framework, termed SCAN (Structural Clustering with Adaptive thresholds for iNtelligent Android malware detection). SCAN combines an unsupervised clustering approach based on Gaussian mixture models (GMMs) and an adaptive thresholding method with supervised learning algorithms tailored for each cluster. The supervised classifiers used in our framework include Support Vector Machines (SVM), Random Forests (RF),
During training, SCAN first determines the optimal number of clusters using a data-driven model selection strategy based on the Akaike information criterion (AIC). Using Android applications collected between 2014 and 2017, our framework then applies GMM-based clustering to group behaviorally similar applications into a fixed number of clusters. This clustering stage does not require labeled data, as the GMM captures the latent structure of the application behaviors based solely on API call features. By modeling the distribution of the training data in this way, SCAN enhances its robustness to temporal shifts and evolving malware characteristics.
This clustering-based malware detection can cause another problem called class imbalance. The class imbalance comes from the varying ratios of benign and malicious applications across different clusters. This cluster-wise imbalance affects global decision boundaries and degrades the performance of detection models. Recent research has prioritized addressing this disparity through various imbalance-aware techniques. Several studies have reviewed the landscape of resampling approaches and their necessity in the malware domain [18–20]. From an architectural perspective, researchers have proposed advanced mechanisms such as dynamic classifier selection and imbalanced heterogeneous graph embeddings to robustly learn from skewed data [21,22]. Furthermore, methodological innovations have focused on clustering-based resampling strategies—such as hybrid clustering and rotation-based oversampling—to synthetically balance class distributions prior to training [23–25].
To address cluster-wise class imbalance, SCAN introduces an adaptive thresholding method. Each cluster adaptively adjusts its decision threshold based on the proportion of malicious samples within the cluster, allowing for more balanced and context-aware detection performance.
In the final stage of the learning process, a supervised classifier is trained for each cluster to distinguish between benign and malicious applications. During testing, Android applications from 2018 to 2023 are first assigned to the most appropriate cluster using the trained GMM, and then classified using the corresponding cluster-specific supervised model. This design allows SCAN to preserve a consistent latent feature structure over time, thereby mitigating the effects of concept drift and maintaining stable detection performance across evolving malware distributions. Experimental results show that SCAN combined with RF achieves the best performance, with both average accuracy and average F1-score exceeding 91%.
This study makes the following key contributions:
• Intelligent Hybrid Detection Framework: SCAN integrates GMM-based clustering with supervised learning to capture evolving behaviors, mitigating the effects of concept drift without retraining.
• Cluster-Wise Adaptive Thresholding: SCAN introduces an automatic threshold adjustment mechanism that dynamically calibrates decision boundaries, improving robustness against class imbalance and enhancing detection reliability.
• Longitudinal Real-World Evaluation: A six-year empirical evaluation from 2018 to 2023 shows that SCAN remains accurate, stable, and effective under real-world distributional changes caused by evolving Android malware.
The remainder of this paper is structured as follows. Section 2 reviews related work. Section 3 describes the datasets used in this study and defines the problem. Section 4 presents the proposed method. Section 5 reports the experimental results and performance evaluation. Section 6 discusses the findings and limitations of the study. Finally, Section 7 concludes the paper and outlines directions for future work.
2.1 Studies Using Static Features
Static features, such as API calls, permissions, and manifest metadata, have been widely used in Android malware detection due to their accessibility and computational efficiency. These features are foundational in both traditional machine learning models and more recent deep learning-based approaches [26–28]. For instance, Cho et al. [29] utilized API-level and permission-based features to construct lightweight detection models. Although such static representations are effective in capturing known behavioral patterns, their reliability is based on the assumption that feature distributions remain stable over time. In reality, Android malware continues to evolve, and recent work has identified temporal shifts in behavior, called concept drift, that degrade the performance of models trained on outdated data [30–33]. This underscores a more fundamental challenge: building detection systems that can maintain accuracy despite long-term distributional changes in the malware ecosystem.
2.2 Studies Assessing Concept Drift
The behavioral characteristics of Android malware are known to evolve, often causing discrepancies between the distributions of training data and those encountered during real-world deployment. To address this concept drift problem, previous studies have suggested retraining or continual learning frameworks that gradually update the classifier as new data becomes available [14–17]. However, these approaches frequently suffer from practical limitations, including the need for ongoing data labeling, increased computational overhead, and added complexity in managing model versions over time. Park et al. [34] proposed a two-stage model to enhance the sustainability of Android malware detection model by combining Android SDK version and API freqeuncies as features and making the mode robust from temporal shift. Moreover, although many prior works acknowledge the existence of temporal shift, few have explicitly segmented test data by time (e.g., by year) or attempted to assess its effect on detection performance in a structured manner. As a result, evaluating the influence of concept drift on detection-based structure and controlling concept drift remains a significant challenge in long-term malicious application detection studies.
2.3 Studies Applying Clustering Methods
Some studies have explored unsupervised clustering to mitigate concept drift in Android malware detection or binary classification problems. These approaches aim to capture latent structures in the feature space, thereby grouping applications with similar characteristics prior to classification. For instance, researchers have utilized clustering to identify malware families or mine malicious payloads without relying on labeled data [35,36]. Furthermore, recent methodological advances have integrated clustering into the resampling process to address data disparity. Techniques such as hybrid clustering strategies [23], clustering-based rotation oversampling (CARBO) [24], and cluster-based reduced noise SMOTE [25] demonstrate that grouping data points prior to classification can effectively define safe regions for synthetic sample generation.
Eslamnejad et al. [37] employed unsupervised techniques, including DBSCAN and Local Outlier Factor (LOF), as defense mechanisms in federated learning-based Android malware detection. The clustering methods are used to identify anomalous or suspicious client updates caused by label-flipping attacks. Although clustering methods have been leveraged to address distributional variance, the issue of class imbalance within individual clusters has largely remained unaddressed. This gap limits the effectiveness of cluster-specific models, particularly in scenarios where the prevalence of malicious samples varies significantly across regions of the feature space.
2.4 Studies Assessing Class Imbalance
Although various methods have addressed class imbalance through sampling or cost-sensitive learning, threshold adjustment remains an underexplored strategy in Android malware detection [38]. Although classification models typically rely on global thresholds, little attention has been paid to adjusting decision boundaries in response to local distributions, such as those induced by clustering. This oversight may limit the effectiveness of detection models in handling imbalanced clusters, especially under distributional shifts.
Together, these limitations suggest that Android malware detection remains fundamentally challenged by two concurrent factors: the temporal evolution of malicious behaviors and the structural imbalance in data distribution.
3 Datasets and Problem Description
In this study, data sets of 76,000 Android applications were collected between 2014 and 2023 from the AndroZoo repository [39,40]. The data sets consist of an equal number of benign and malicious samples. Feature extracted through static analysis, where each APK file was decompiled and relevant API information was retrieved. Among many API calls used in applications, we select 1848 API calls for features as in previous studies [29,41,42].
The data sets were divided into training and test datasets based on a specific year range, as shown in Table 1. The training set is used to classify itself into groups based on the GMM and train cluster-wise supervised learning classification algorithms, while the test set is used to evaluate the performance of the trained model over years. Each data includes the APK filename (apkname), a class label indicating whether the app is benign (0) or malicious (1), the year of collection specified by AndroZoo, and feature values corresponding to 1848 API calls.
The year-based split of the datasets reflects the real-world phenomenon of concept drift, as Android malware continuously evolves, including changes in API usage and malicious behavior. Therefore, the division is reasonable for evaluating the temporal robustness of our model. All string-type features, the name of API calls, are replaced with integer digits during preprocessing. To ensure consistency, a feature normalization technique is applied using the StandardScaler() fitted on the datasets. This normalization improved the stability of clustering and classification processes.
The training set consists of 40,000 samples—10,000 for each year from 2014 to 2017, with a benign-to-malicious ratio of 1:1. The test set contains 36,000 samples, 6000 per year from 2018 to 2023. Table 2 summarizes the year-wise distribution of benign and malicious applications.
To avoid unintended performance inflation caused by redundant applications in AndroZoo, we conducted a duplication analysis based on prior work. Duplicated samples were intentionally retained for three reasons: (i) duplication is an inherent property of real-world Android ecosystems, where multiple repackaged or redistributed variants naturally coexist [43,44]; (ii) removal would disproportionately eliminate malicious behavioral patterns, effectively worsening class imbalance rather than improving data quality; and (iii) prior findings show that duplication has limited impact on supervised learning but substantially affects unsupervised clustering stability [45], which is relevant given the hybrid supervised–unsupervised structure of SCAN. Nevertheless, we also recognize the importance of conducting experiments on deduplicated applications. A full deduplication experiment and its measured impact on class balance and temporal drift is presented in Appendix A.
Concept drift describes changes in the statistical properties of input data over time. Continual updates to the operating system and API calls, evolving security mechanisms, and changes in application development practices drive this drift in the Android ecosystem. As benign and malicious applications evolve in response, their behavioral patterns diverge from those seen in past data. Key features in malware detection, such as API calls, permission requests, and network communication patterns, are also susceptible to drift [29,46–48]. Malware detection models trained on outdated feature distributions often struggle to generalize to newer threats, leading to reduced accuracy and increased false detection.
Section 5.3 provides empirical evidence of concept drift by evaluating baseline models trained with historical data from the four years (2014–2017) and tested with data from the subsequent seven years (2018–2023). The rapid degradation in their performance, especially after 2018, confirms the presence of significant distributional shifts over time, validating the need for drift-resistant detection frameworks. Our proposed framework employs a GMM-based clustering strategy to mitigate the concept drift problem. Our GMM-based clustering is described in detail in Section 4.3.
Fig. 1 illustrates a distributional shift of features by visualizing API calls in applications from 2014 vs. 2017, and 2014 vs. 2023 using principal component analysis (PCA). In addition, Fig. 2 shows another distributional shift using t-distributed stochastic neighbor embedding (t-SNE). Compared to the distributional differences observed between the 2014 and 2017 datasets, the contrast between 2014 and 2023 highlights that the concept drift becomes more pronounced at the feature level over time. Nevertheless, a substantial portion of the 2023 samples still overlaps with the region defined by the 2014 data, supporting the continued validity of the latent structure learned by the GMM. This visualization reinforces the central assumption of our framework: although data distributions evolve, the underlying structural patterns remain sufficiently stable to enable sustainable detection without retraining.
Figure 1: Visualization of concept drift in data distribution using PCA.
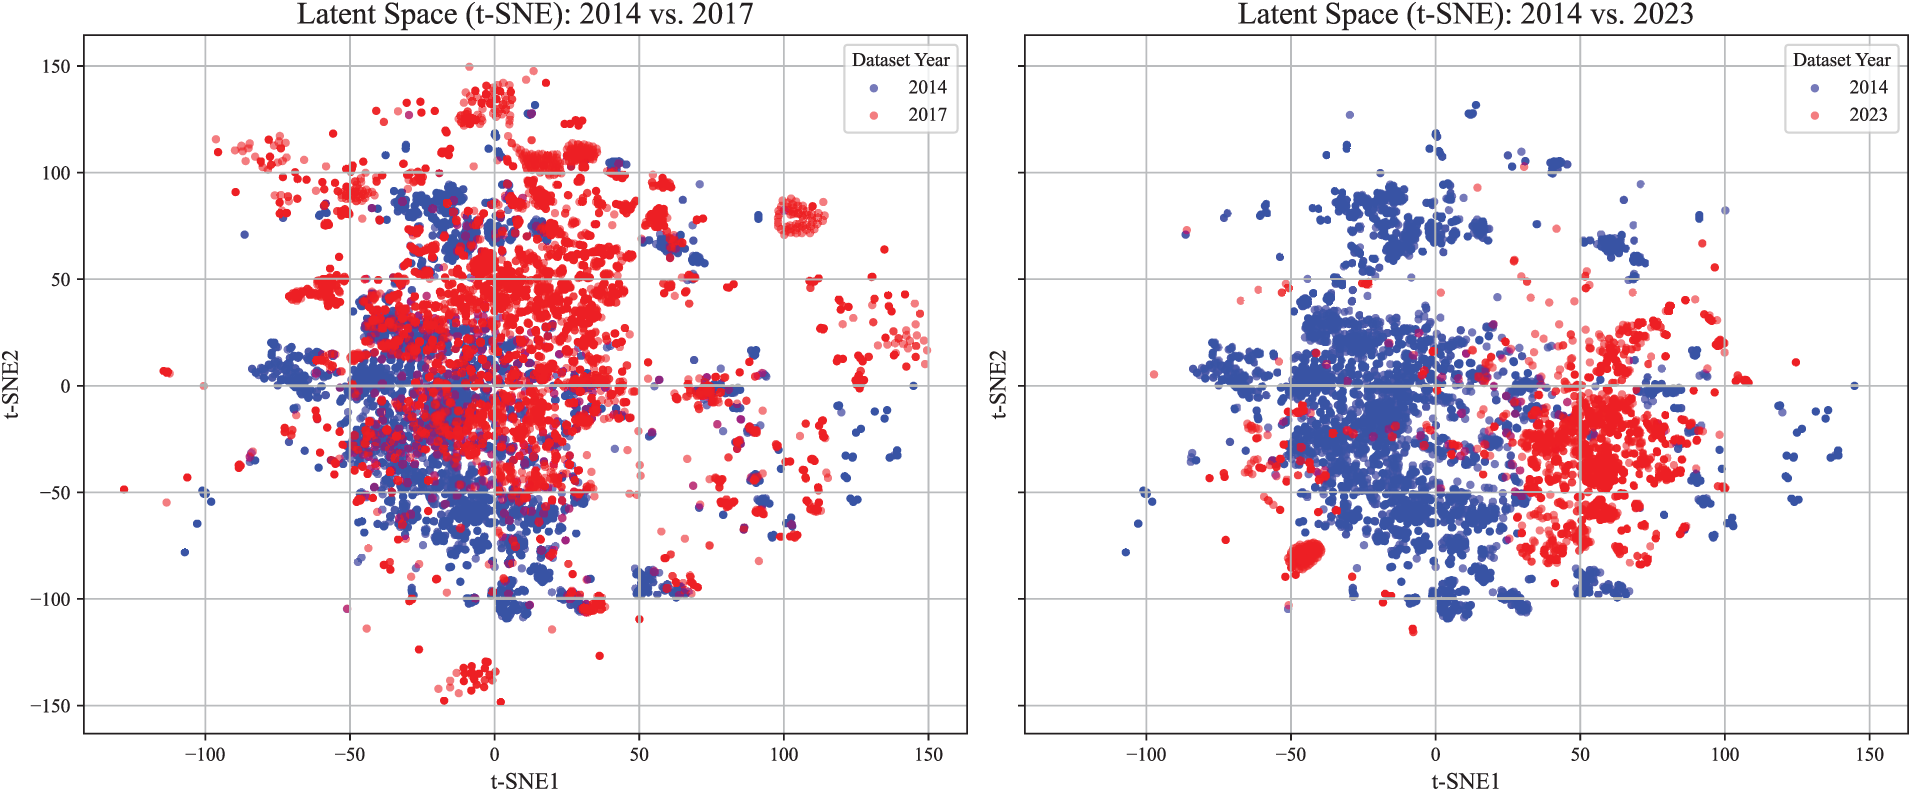
Figure 2: Visualization of concept drift in data distribution using t-SNE.
Performance degradation becomes more acute when concept drift coincides with class imbalance [49–51]. When the ratio of malicious applications to benign ones is imbalanced in clustering-based detection, malicious samples that deviate from their historical patterns are increasingly misclassified as benign, compromising the reliability of detection systems and exposing users to high risk.
The class imbalance constitutes another major challenge in clustering-based malware detection. Class imbalance refers to the irregular sample distribution between clusters, where one cluster contains a disproportionate number of instances compared to the other. This can lead to difficulties in training models and lower accuracy in malware detection. A class imbalance can be of two types. The first refers to the imbalance of the number of applications between clusters. The other refers to the imbalance in the ratio of malicious and benign applications in each cluster. Note that this study focuses on the latter.
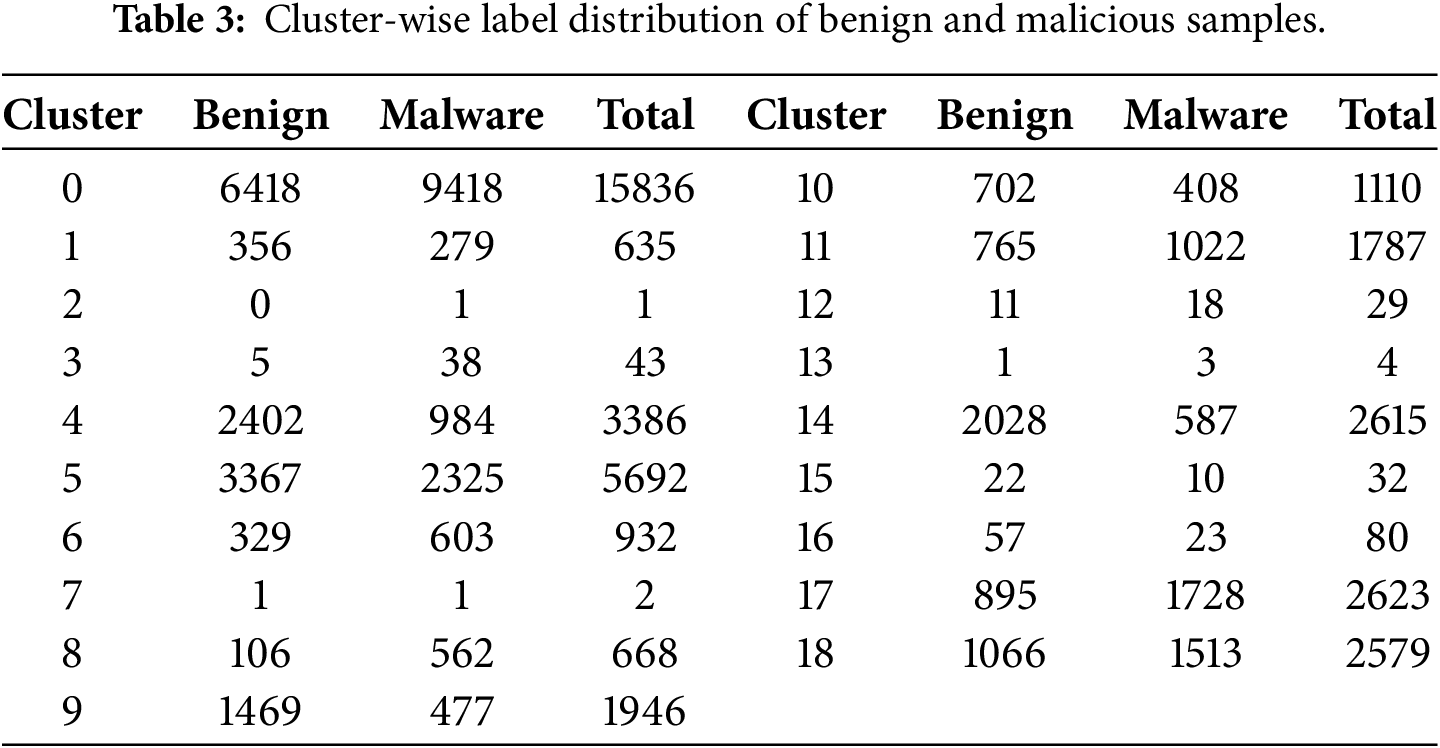
In this study, a GMM clustering approach captures the inherent cluster structure of training data and selects the appropriate number of clusters using the Akaike information criterion (AIC) as 19 clusters shown in Table 3. The process of choosing the optimal number of clusters is described in Section 4.2. Each cluster created by the GMM exhibits a unique ratio of malicious to benign applications. Among the 19 clusters, most of them do not have a 1:1 ratio of malicious and benign apps, causing a class imbalance problem.
To address this, our model introduces an adaptive thresholding method that automatically adjusts decision boundaries based on the ratio of malicious applications within each cluster. This approach ensures that classification sensitivity is aligned with local data distributions, rather than relying on a one-size-fits-all rule. Cluster-wise adaptive thresholding is described in detail in Section 4.5.
4 A Robust Android Malware Detection Framework: SCAN
This paper proposes a sustainable Android malware detection framework, called SCAN, to handle the behavioral evolution of applications over time. SCAN enables continuous detection over multiple years without retraining the entire model, making it robust to concept drift and real-world variability. It adopts a hybrid architecture that combines a clustering structure based on GMMs and an adaptive thresholding method with supervised learning algorithms customized for each cluster. This allows flexible adaptation to evolving feature patterns while maintaining model stability and high detection performance. Fig. 3 shows the structure of our SCAN framework.
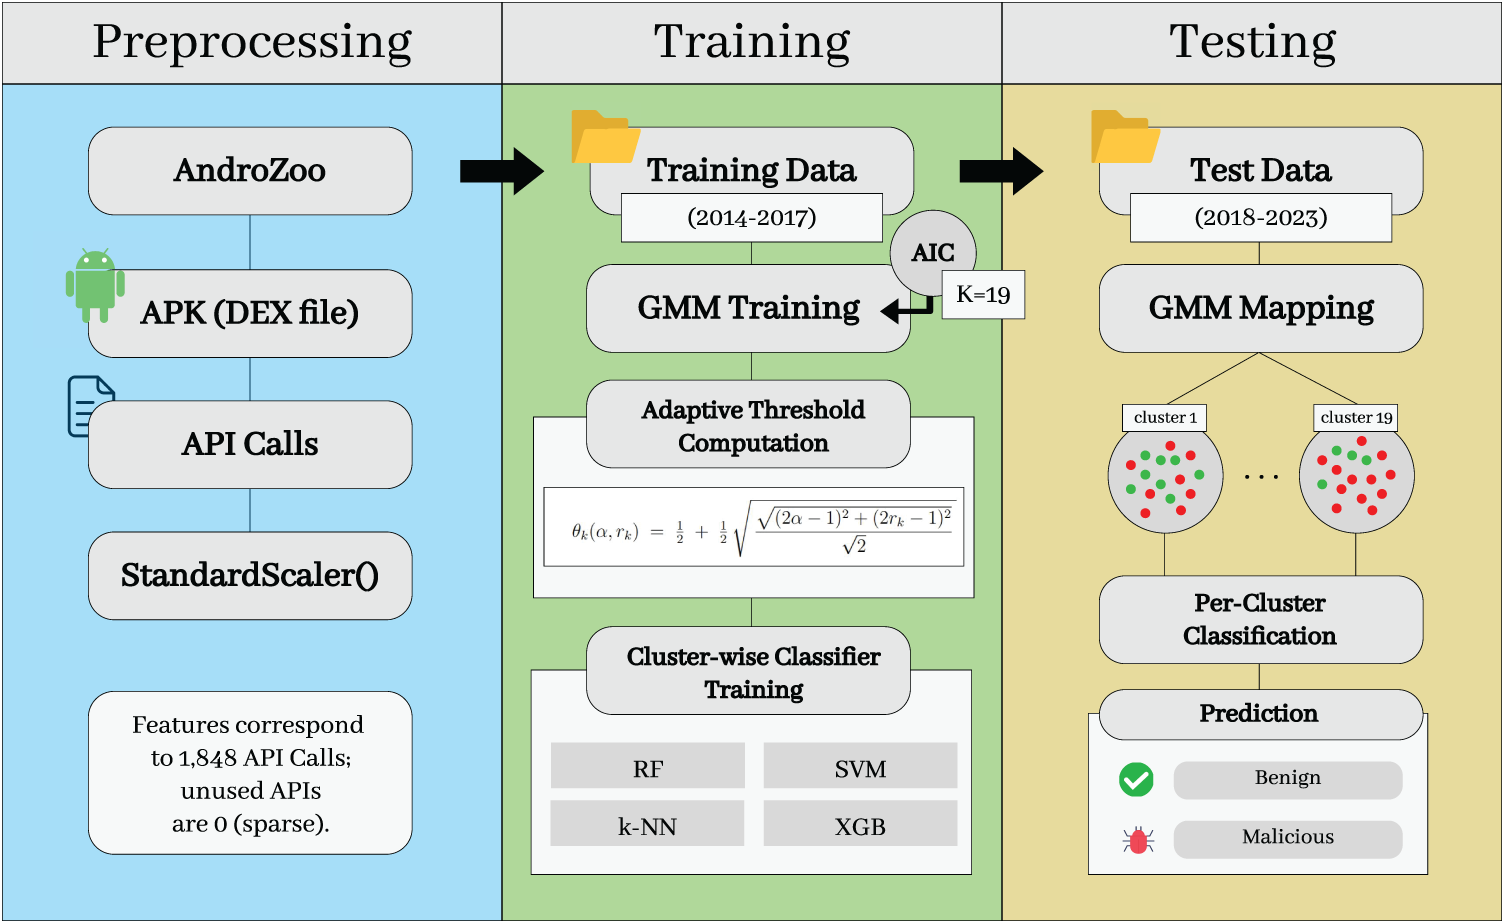
Figure 3: Structure of SCAN framework.
4.2 Selecting an Appropriate Number of Clusters
Because SCAN adopts clustering-based models, selecting the appropriate number of clusters K, is a critical design decision that directly affects the expressiveness of the model, the stability of the classifier, and the interpretability of the detection thresholds. If K is set too low, dissimilar samples can be grouped in the same cluster, resulting in blurred boundaries and reduced detection accuracy. On the other hand, an overly large K can yield clusters with an insufficient sample size, thereby compromising the stability and reliability of classifier training.
To determine the appropriate number of clusters K, we adopt a data-driven model selection strategy based on Akaike information criterion (AIC) [52]. The AIC balances the goodness of fit of the model against its complexity, penalizing overly complex models to prevent overfitting.
The AIC is formally defined as Eq. (1).
where
We evaluated GMMs with varying values of K in the range of 1 to 20, using the training data. For each value of K, a GMM was trained and its AIC score was calculated. Fig. 4 shows that the AIC score reaches its minimum when
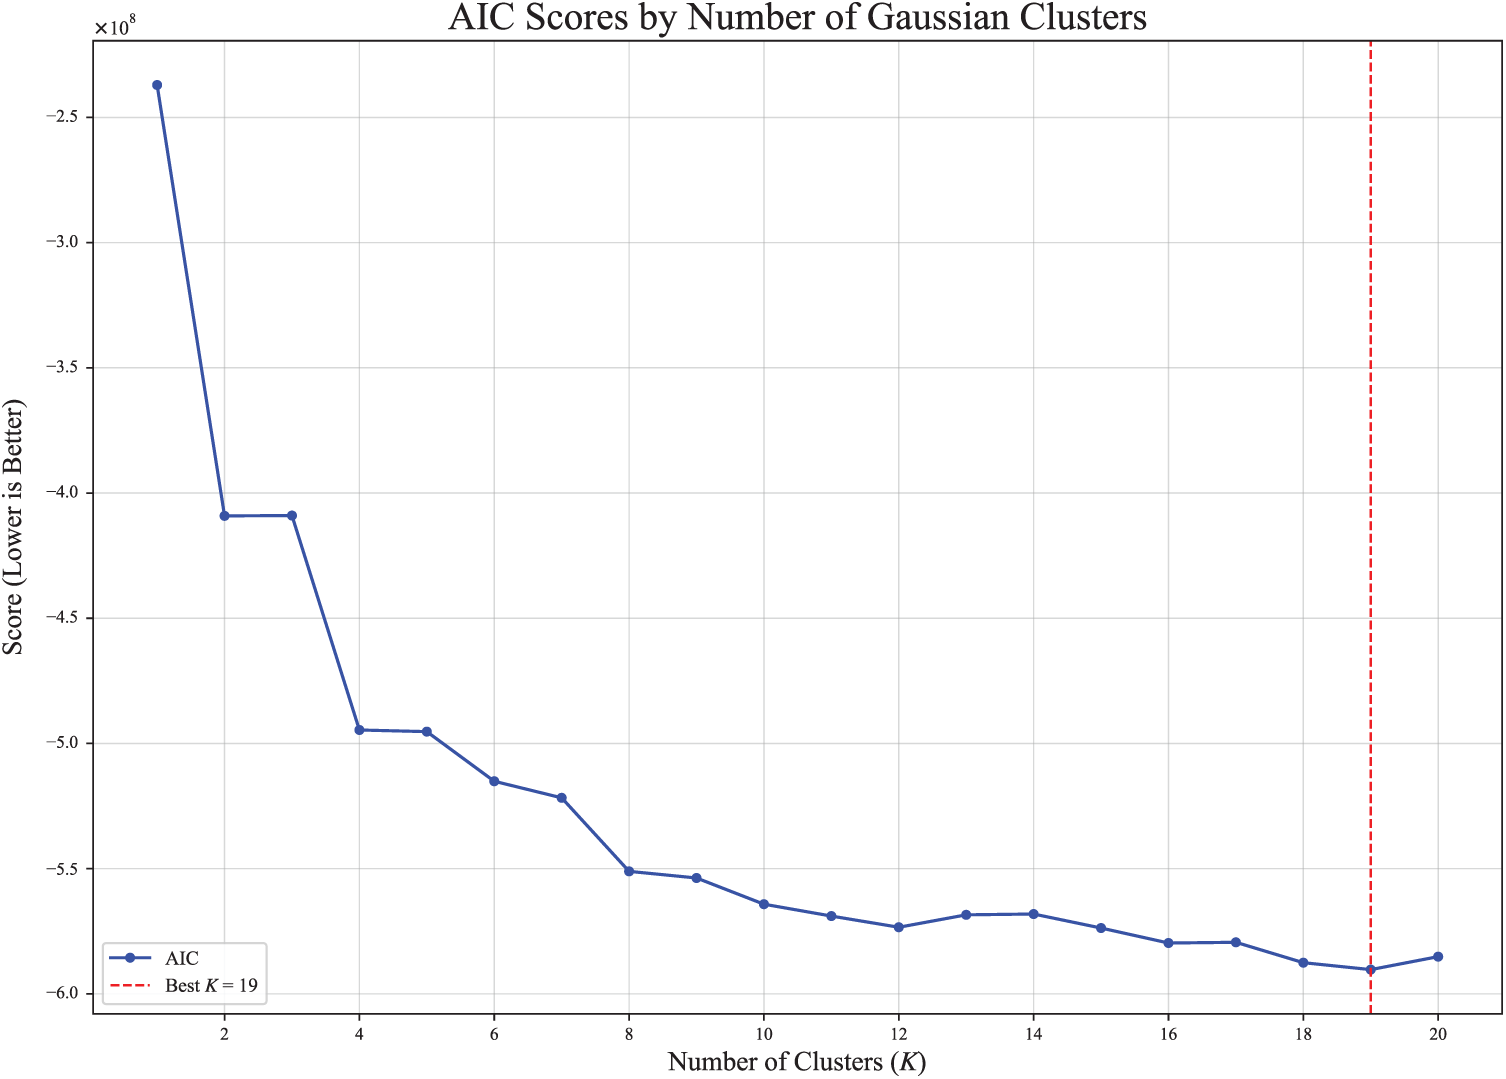
Figure 4: AIC scores by the number of gaussian clusters.
4.3 GMM-Based Clustering for Concept Drift-Resilient Detection
In SCAN, the GMM groups Android applications into clusters based on behavioral similarity. For clustering-based malware detection, the rationale for selecting GMM over other methods is as follows. First, GMM is a soft clustering technique that assigns probabilities of membership across multiple clusters, allowing it to capture the nuanced and overlapping behavioral characteristics of real-world applications. Second, GMM is well-suited for continuous and high-dimensional feature spaces, such as those derived from API call patterns. The number of APIs used as features in this study is 1848, which is high-dimensional data. Third, since each cluster is modeled as a probability density function, subsequent steps—such as threshold adjustment or anomaly scoring—can leverage statistically grounded decisions.
The probabilistic nature of GMM supports structural consistency over time. Specifically, the GMM is trained once with applications from 2014 to 2017, and the resulting model is used to assign applications from each test year between 2018 and 2023 to clusters. Notably, our approach does not require retraining the entire dataset annually.
The proposed method relies on the assumption that the data is generated from a mixture of Gaussian distributions. Each application sample is probabilistically assigned to clusters based on its likelihood of belonging to each Gaussian component.
The probability density function of a GMM is defined as:
where
To ensure that the use of Gaussian Mixture Models is appropriate for the 1848-dimensional API-call feature space, we conducted empirical distributional diagnostics including marginal normality tests, Q–Q plot inspections, and covariance spectrum analysis. The results confirm that although individual marginals are heterogeneous (e.g., zero-inflated, heavy-tailed, or Gaussian-like), the mixture-based modeling assumption remains valid. Moreover, diagonal-covariance GMMs avoid singularity issues arising from high-dimensional covariance matrices and provide numerically stable clustering. Detailed statistical results are provided in the Appendix B.
4.4 Cluster Filtering and Posterior Reassignment
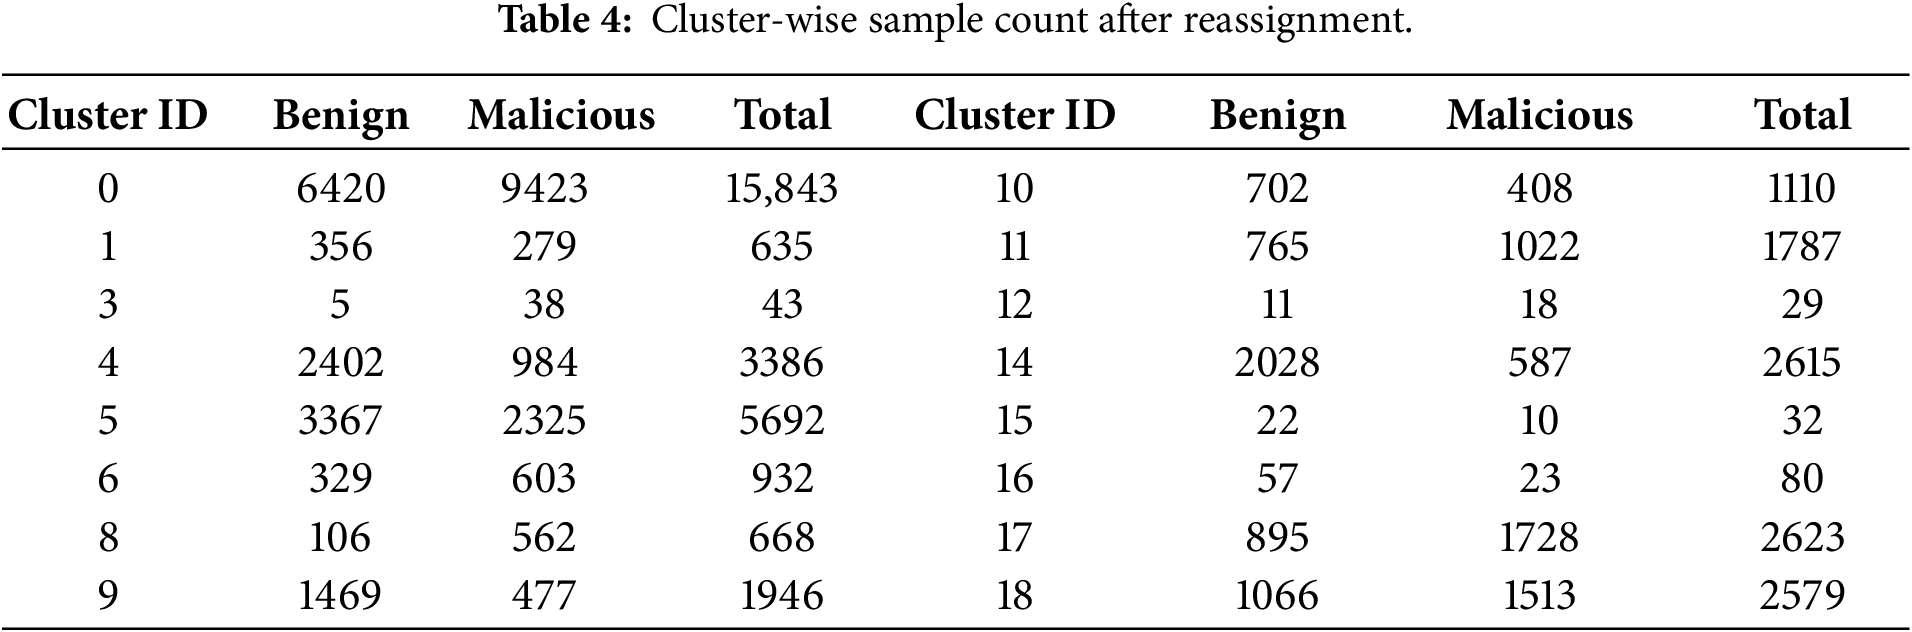
GMM clustering occasionally produced clusters with extremely small sample sizes, which could lead to overfitting when training cluster-specific classifiers. To mitigate this issue, we removed clusters containing fewer than 20 samples or consisting of only a single class, following prior recommendations in clustering studies [23,54]. In Table 3, clusters of ID 2, 7 and 13 met these conditions and were eliminated.
Samples from the removed clusters were then reassigned to the remaining clusters based on GMM posterior probabilities, ensuring that all samples belong to sufficiently populated clusters while preserving the underlying mixture structure. The final cluster-wise benign and malicious sample counts after reassignment are reported in Table 4.
4.5 Reducing Class Imbalance Using Cluster-Wise Adaptive Thresholding
Each cluster created by the GMM contains a distinct mix of benign and malicious samples, with varying degrees of class imbalance. As shown in Table 3 and Fig. 5, the distribution of malicious and benign applications differs significantly across clusters.
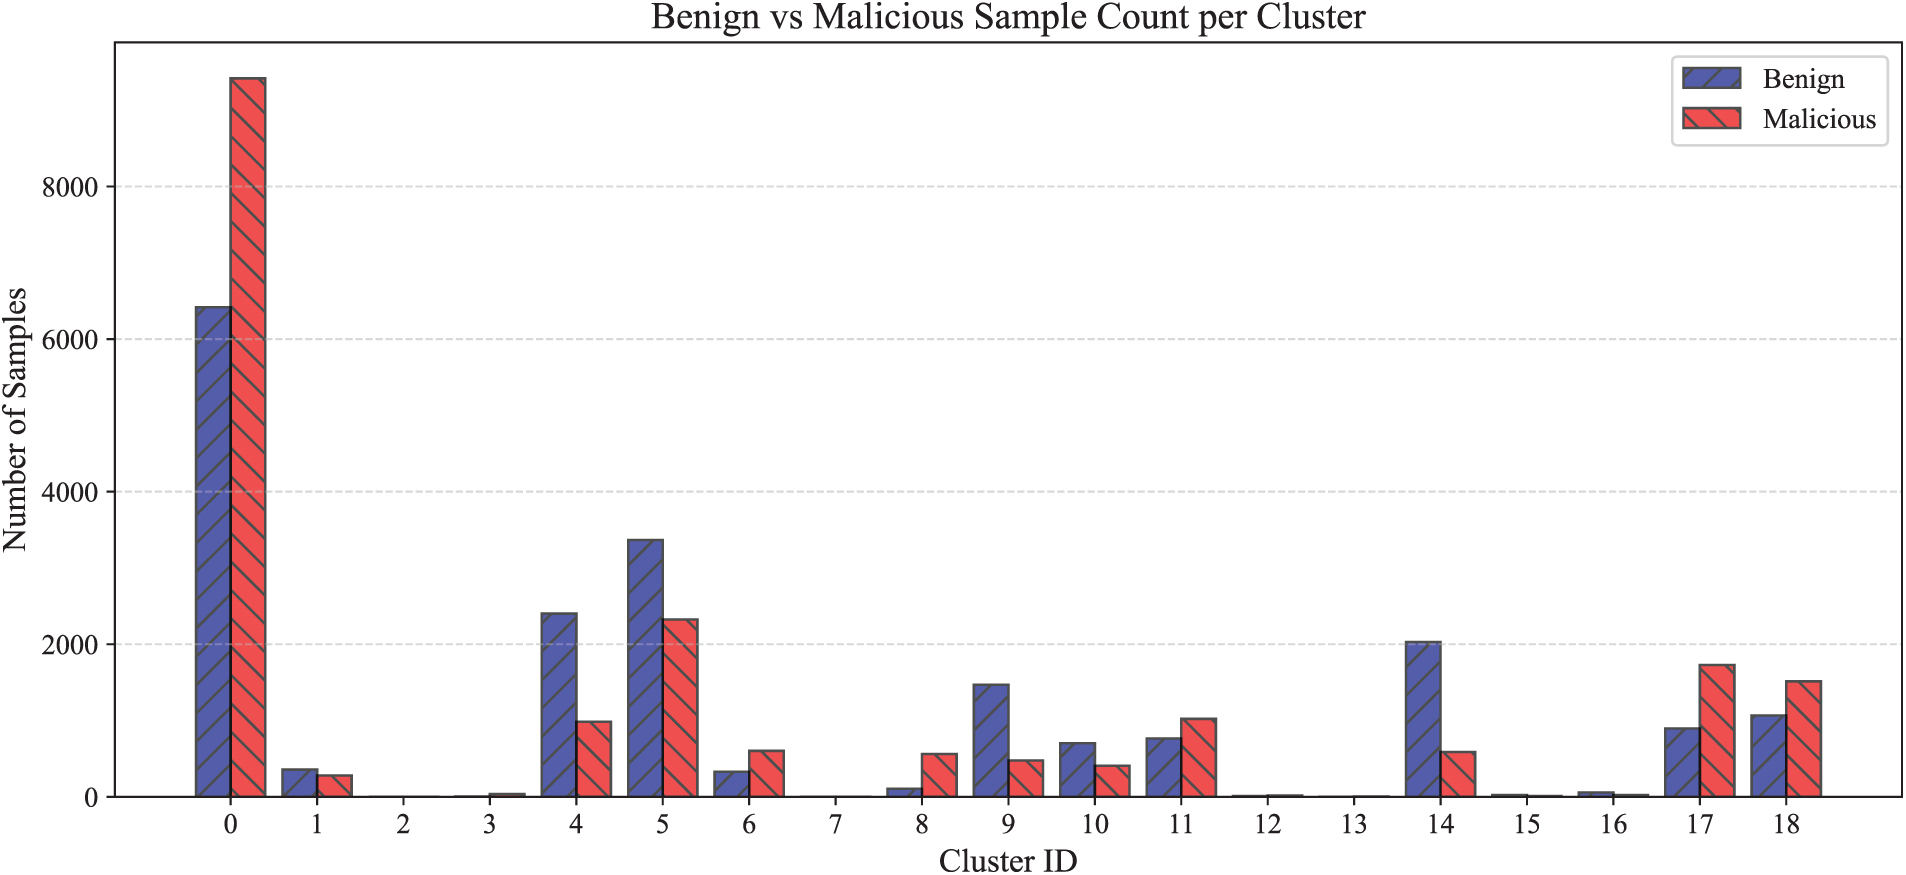
Figure 5: Numbers of benign and malicious applications per cluster.
To classify applications as benign or malicious, a supervised classifier (such as RF or SVM) is trained separately for each cluster. These classifiers output a score interpreted as the probability of maliciousness. A threshold is then used to interpret this score—i.e., a sample is labeled as malicious if its predicted score exceeds a pre-defined cutoff. However, using a fixed global threshold (e.g., 0.5) across all clusters can be suboptimal, as each cluster has its own class distribution and feature characteristics. Consequently, the same score may imply different levels of risk in different clusters.
To address this, we introduce cluster-wise adaptive thresholding. For each cluster, a separate threshold is determined based on the proportion of malicious samples in the training data. This aligns the decision boundary with cluster-specific characteristics and improves robustness under class imbalance and distribution shift.
where
By construction,
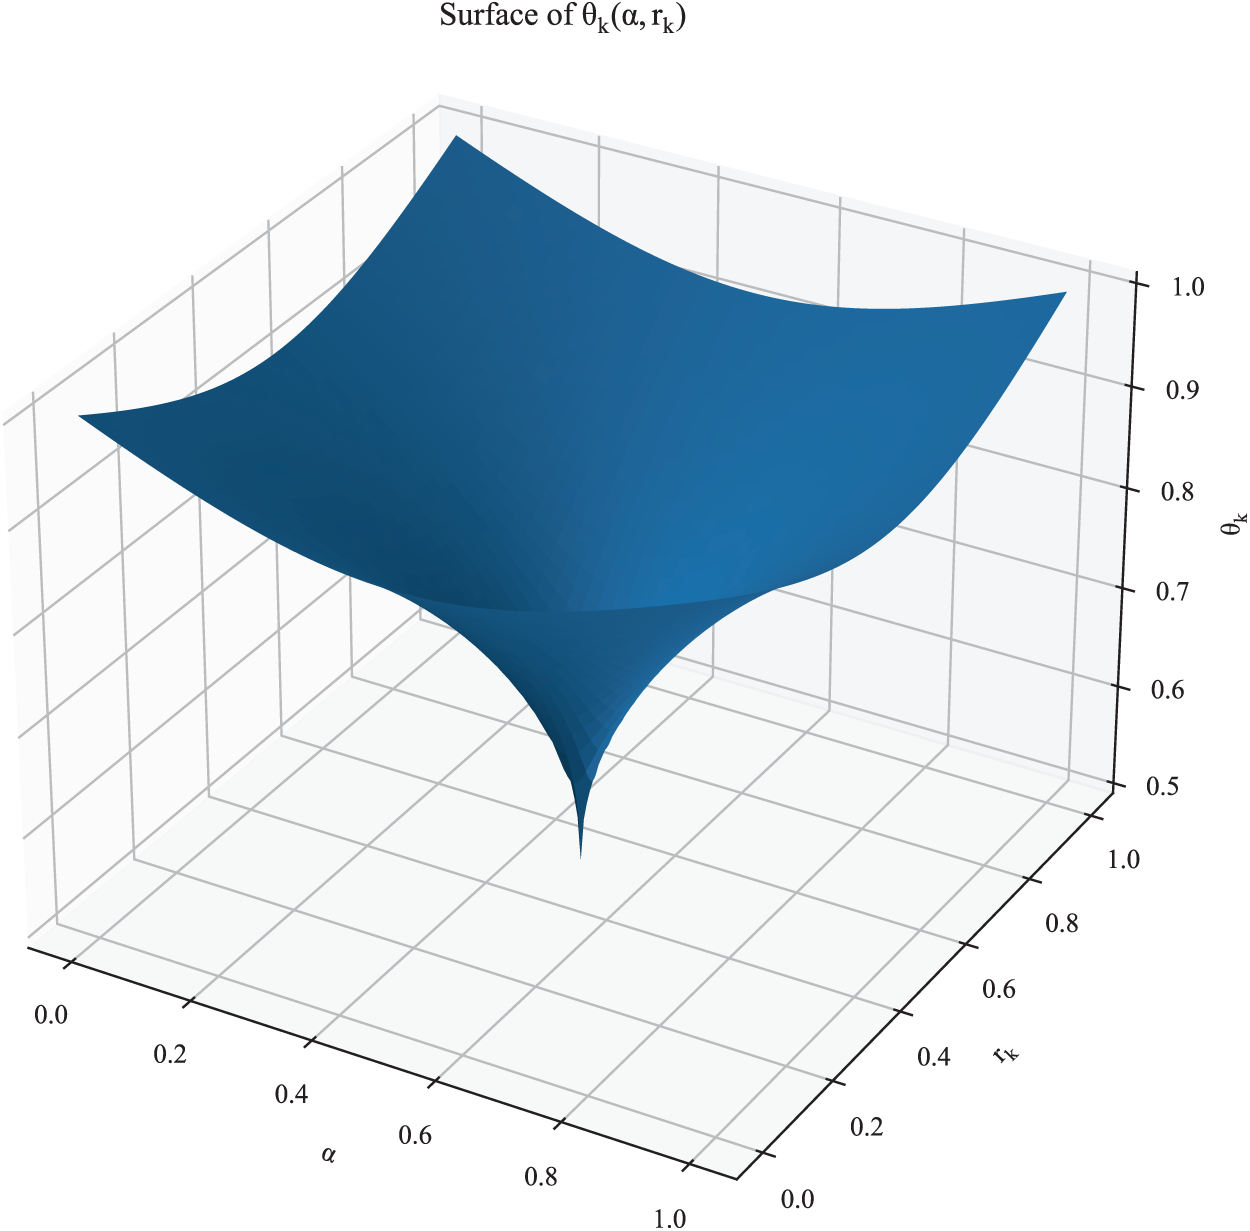
Figure 6: 3D surface (and contours) of the adaptive threshold
This construction separates the roles of class imbalance and operational preference. Eq. (4) provides two key advantages:
1. Balance-aware conservative boundary. The threshold reaches its minimum at
2. Tunable parameter for decision control. The coefficient
At inference, a test sample
Coupling the decision boundary to each cluster’s malicious density and a policy-controlled sensitivity enables robust detection under concept drift and non-uniform class distributions without retraining.
After applying an adaptive thresholding mechanism to each cluster generated via the GMM, SCAN trains a dedicated classifier for each cluster using the corresponding subset of training data. This design enables localized learning that reflects the behavioral characteristics of applications within each cluster, thereby improving the detection precision.
To evaluate classifier performance across clusters, we employ four widely used supervised learning algorithms: Random Forest (RF), Support Vector Machine (SVM),
• RF is an ensemble-based learning method that constructs multiple decision trees using randomized subsets of data and features. By aggregating the outputs of individual trees, RF improves prediction stability and mitigates the risk of overfitting.
• SVM is a kernel-based classifier that constructs an optimal hyperplane to separate classes in a high-dimensional feature space. SVM is known for its strong generalization ability, especially in binary classification tasks with high-dimensional input data.
•
• XGBoost is a scalable and efficient gradient boosting framework that builds additive tree-based models. It is widely adopted for its superior predictive performance, built-in regularization, and ability to handle large-scale datasets.
By applying these classifiers to the GMM-generated clusters, we explore the most effective pairing between clustering structure and supervised learning technique. This cluster-wise classification strategy supports robust malware detection under evolving distributions, enabling each classifier to specialize in the unique behavioral profiles represented within its cluster.
4.7 Year-Wise Mapping into the Cluster Structure
As a way to evaluate the performance of SCAN in the testing phase, we adopted a GMM-based mapping strategy each year. We provide a mathematical rationale for why year-wise mapping can yield more reliable detections under concept drift.
Let
where
Assuming concept drift, the distribution of input data
Despite this, pooling all test data across years and projecting them jointly through the GMM (i.e., pooled mapping) introduces bias due to the distributional shift. Specifically, the expected cluster assignment probabilities under pooled mapping deviate from the average of year-wise mappings:
Here,
In contrast, year-wise GMM mapping addresses this issue by performing clustering based on each year’s specific distribution
where
This formulation ensures that, for each year, the classifier operates on data projected into a latent space that reflects the distribution specific to that year. By preserving the temporal structure of the data, year-wise mapping allows the classifier to maintain the conditional distribution
Thus, year-wise GMM mapping offers a mathematically grounded strategy to mitigate the concept drift problem. It allows the model to maintain detection accuracy and reliability over time, without requiring retraining or modification of the underlying GMM structure. By fixing the latent space and performing independent projections per year, this approach effectively handles temporal distribution shifts and ensures that the classifier can adapt to evolving data distributions.
This design also preserves temporal segmentation during evaluation, while avoiding contamination of the latent space by future data. Mapping each year’s test set independently allows for a fine-grained evaluation of performance degradation or stability in response to shifting distributions. Moreover, it reflects a realistic deployment scenario where labeled data for future years is unavailable and retraining is impractical.
From a structural perspective, this mapping assumes that, while application behaviors evolve over time, the underlying latent structure remains sufficiently stable to support detection. This assumption is supported by the PCA analysis in Fig. 1, which shows partial spatial overlap between training and test data distributions. By anchoring detection to this stable latent structure, the method mitigates the impact of concept drift without compromising modularity or scalability.
To substantiate the above rationale, we conclude this subsection with an empirical comparison between pooled and year-wise mapping. We measure the deviation:
The deviation was computed across all clusters
Among these values, the largest deviation occurs at cluster 17 in year 2021 with
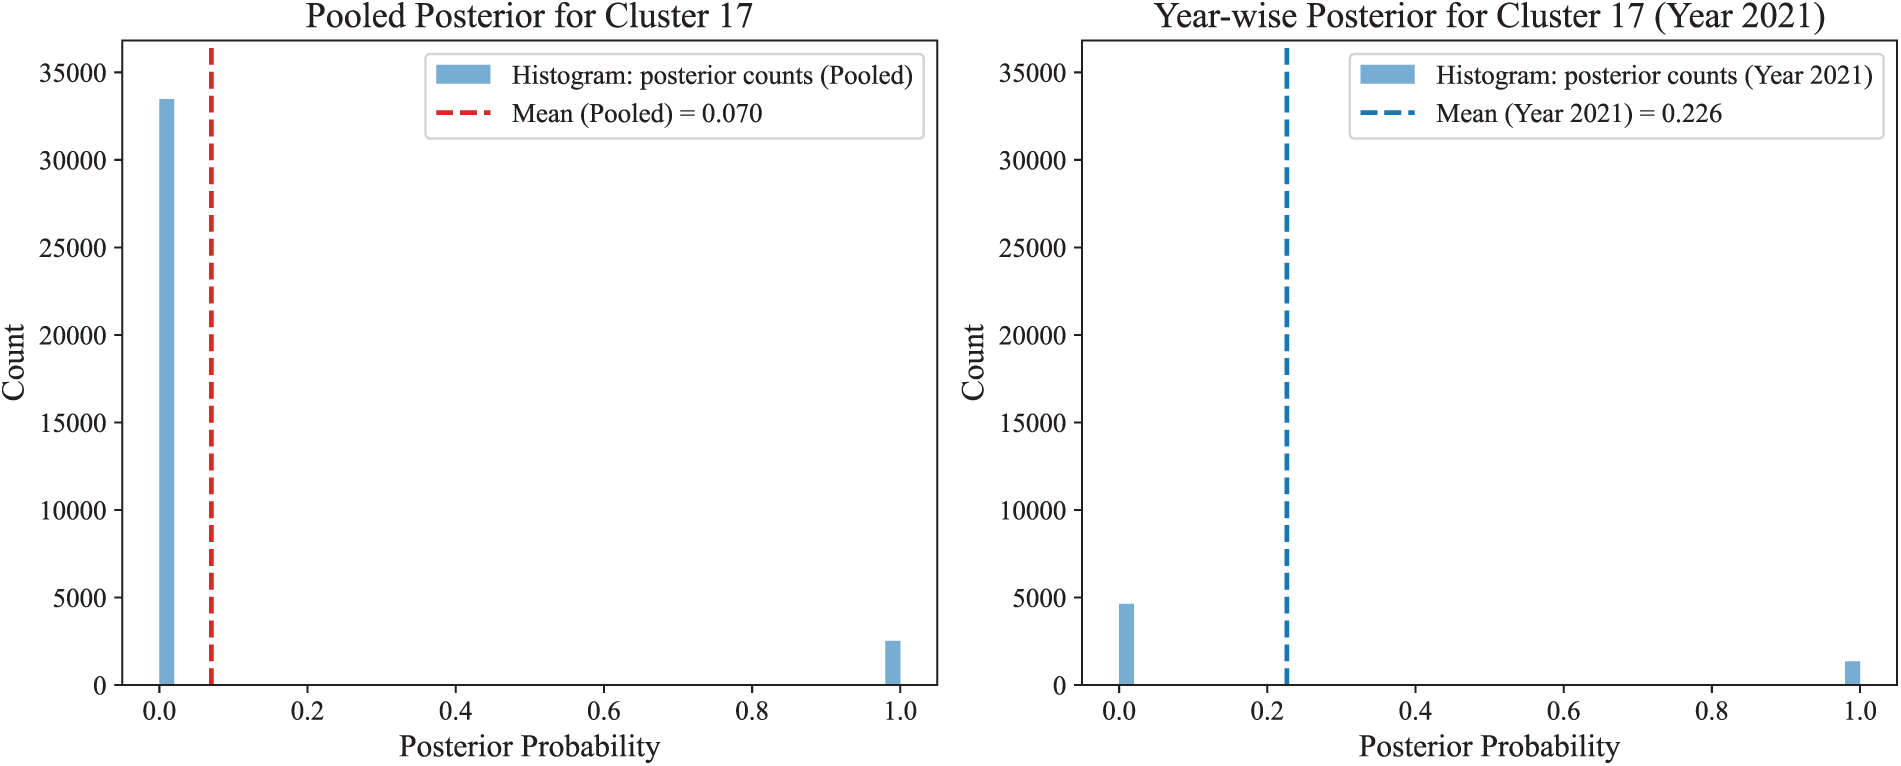
Figure 7: Posterior probability for cluster 17 under pooled vs. year-wise mapping.
Together, the distributional shift in Fig. 7 shows year-wise mapping preserves the temporal structure of the test data and avoids the over-smoothed posteriors produced by pooled mapping, leading to more reliable detections under concept drift. The improvement of the performance after applying the year-wise mapping method is described in Section 5.4.2.
During the preparation of this study, generative artificial intelligence (GenAI) tools were used in a limited and auxiliary manner. Specifically, GenAI was used to assist in analyzing trends in existing related studies and to support the writing of Section 2. In addition, GenAI tools were used to help translate portions of the original manuscript written in Korean into English.
5 Experimental Results and Evaluation
We perform a comprehensive evaluation of the proposed malware detection framework, SCAN, using test datasets spanning from 2018 to 2023. To avoid overfitting, we applied five-fold cross validation during training. The implementation of the proposed models and experiments was conducted on a Microsoft Windows 11 Pro system (Version 24H2, Build 26100.4946) running under WSL2 with Linux kernel 6.6. The hardware configuration included an Intel(R) Xeon(R) W-3235 CPU @ 3.30 GHz (12 cores, 24 threads), 64 GB of DDR4 RAM and an NVIDIA Quadro RTX 4000 GPU. Notably, CUDA/cuDNN acceleration was not used; all models were trained on the CPU using the PyTorch 2.2 backend.
5.1 Legends and Evaluation Metrics
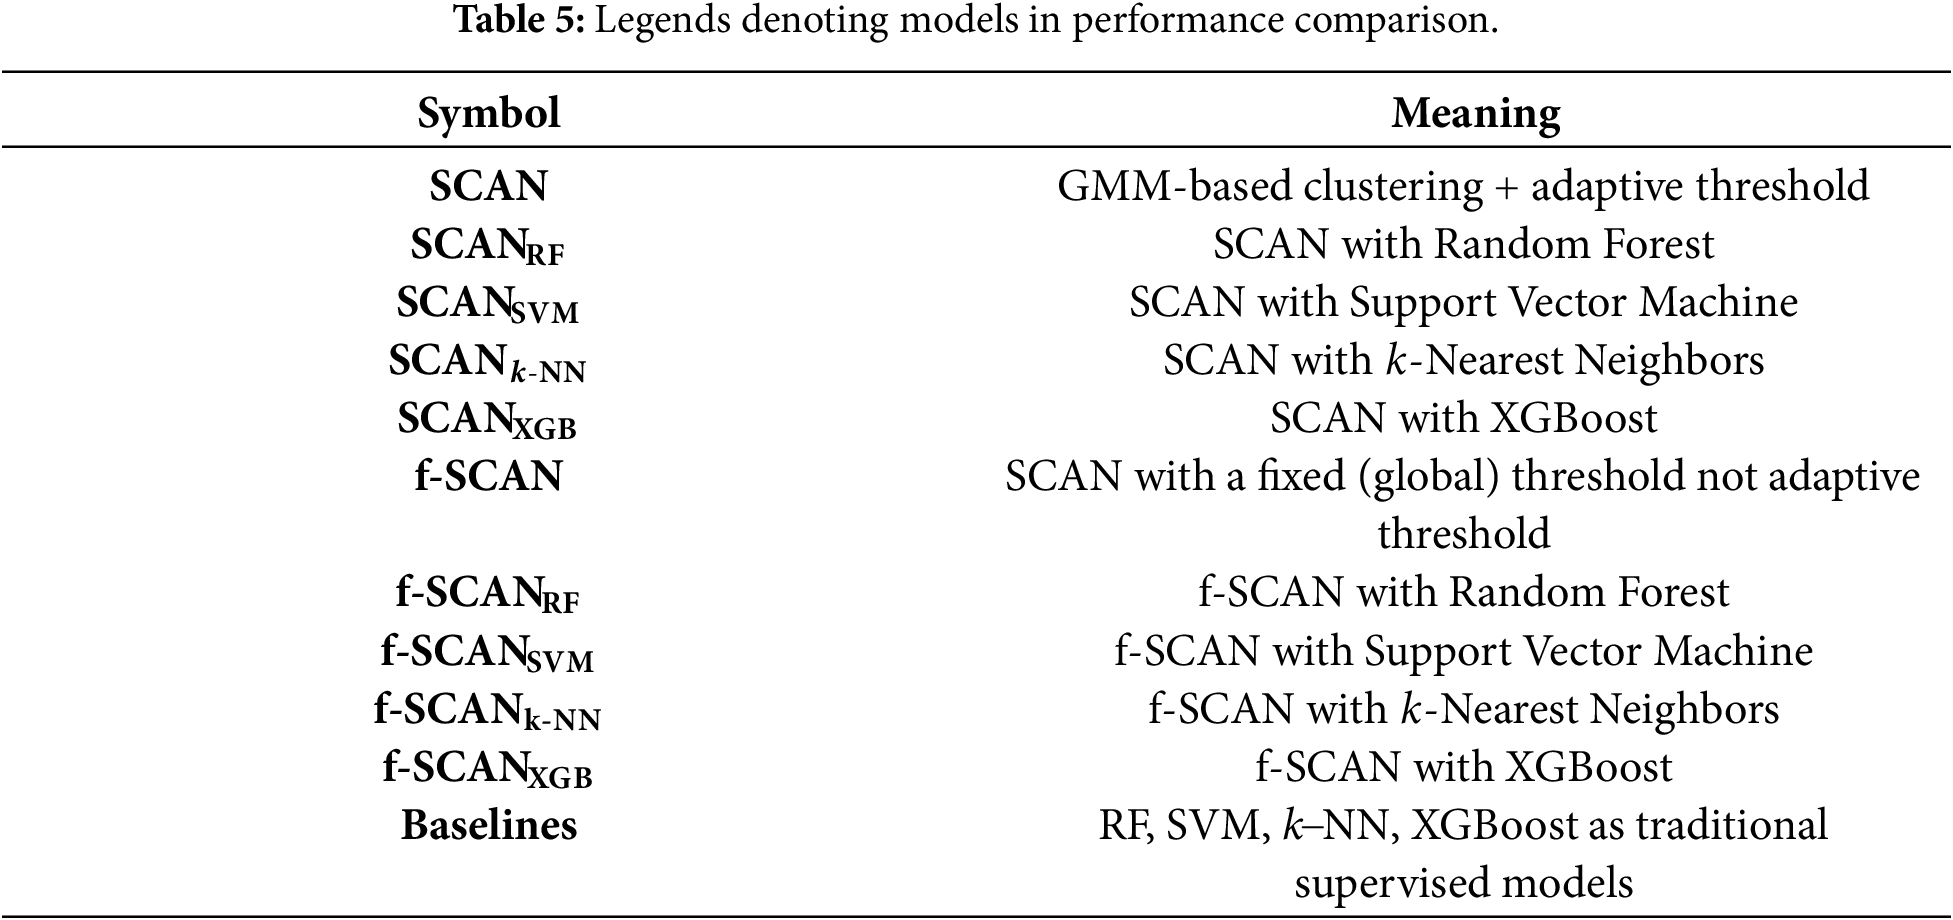
This section defines the symbols and metrics used for performance evaluation. SCAN denotes our framework that contains GMM-based clustering and cluster-wise adaptive thresholding mechanisms. f-SCAN is similar to SCAN except that it uses a single fixed threshold of 0.5 for every cluster instead of the cluster-wise adaptive threshold. The subscripts used in SCAN or f-SCAN indicate the classifier:
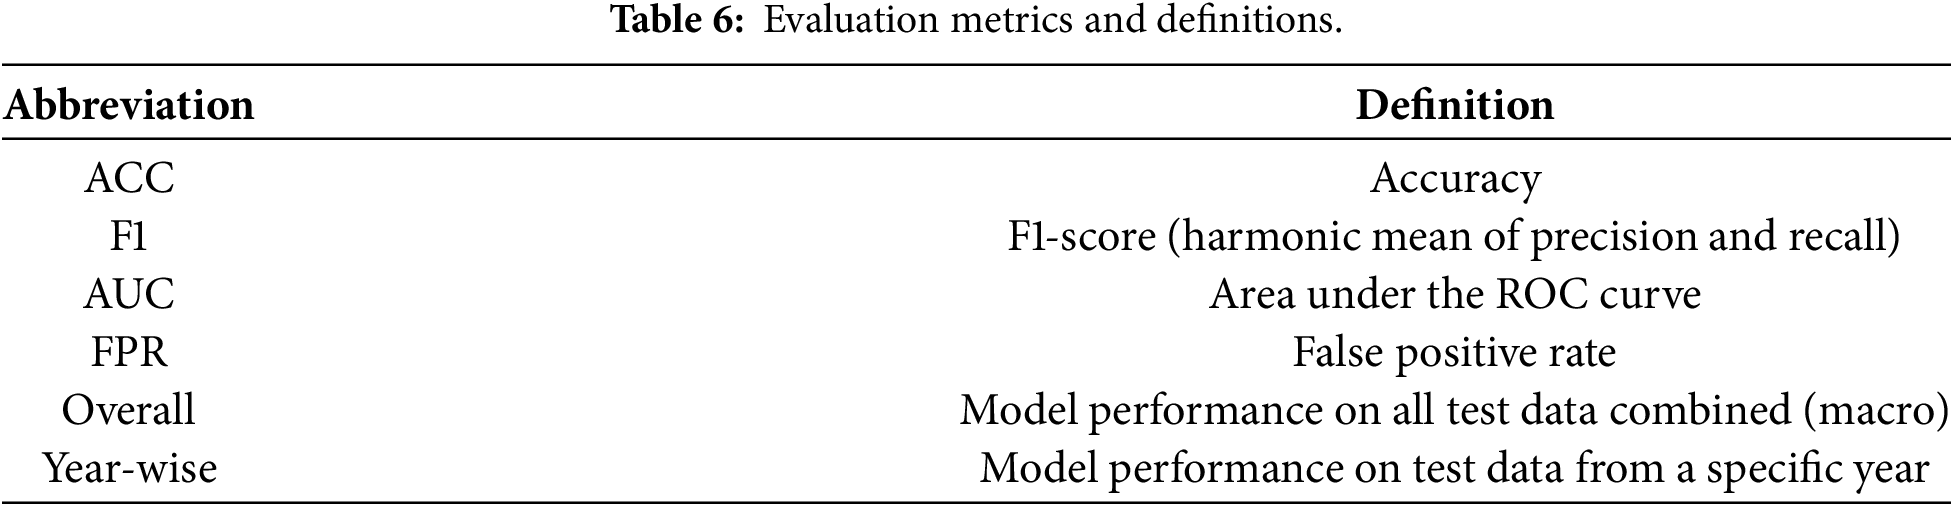
In this study, the true positive (TP) is the number of malicious applications correctly classified and the false positive (FP) is the number of benign applications classified as malware. We adopt four metrics: ACC (accuracy), F1 (F1-score), AUC (area under ROC curve), and FPR (false positive rate). Overall performance refers to the evaluation results obtained by applying the model to the entire test dataset throughout all years from 2018 to 2023. Year-wise performance refers to the evaluation results obtained by applying the model to the test dataset corresponding to a specific year. Table 6 shows the meaning of the metrics.
5.2 Performance Evaluation of SCAN
We evaluate SCAN by applying four supervised learning classifiers-RF, SVM,
As summarized in Table 7,
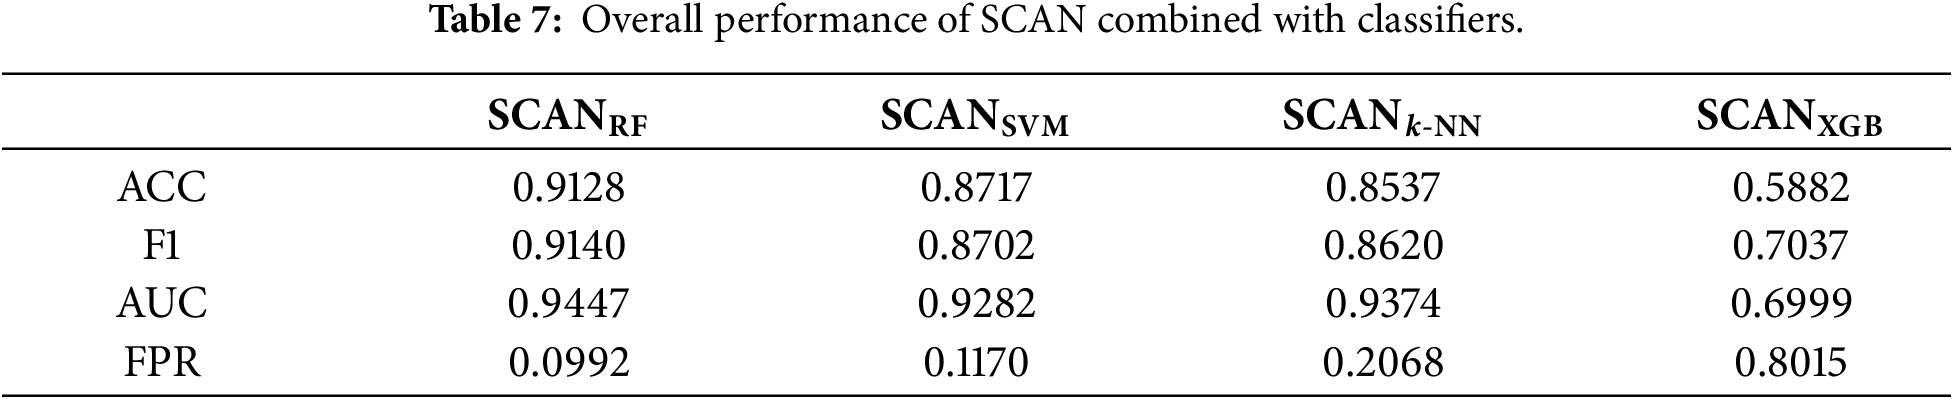
While Table 7 summarizes the overall performance, it does not fully capture how each classifier behaves under year-wise distributional shifts. To provide a deeper insight, Fig. 8 shows temporal trends for each metric across six consecutive years. This analysis is crucial to understanding the consistency and reliability of SCAN when deployed in dynamic real-world environments.
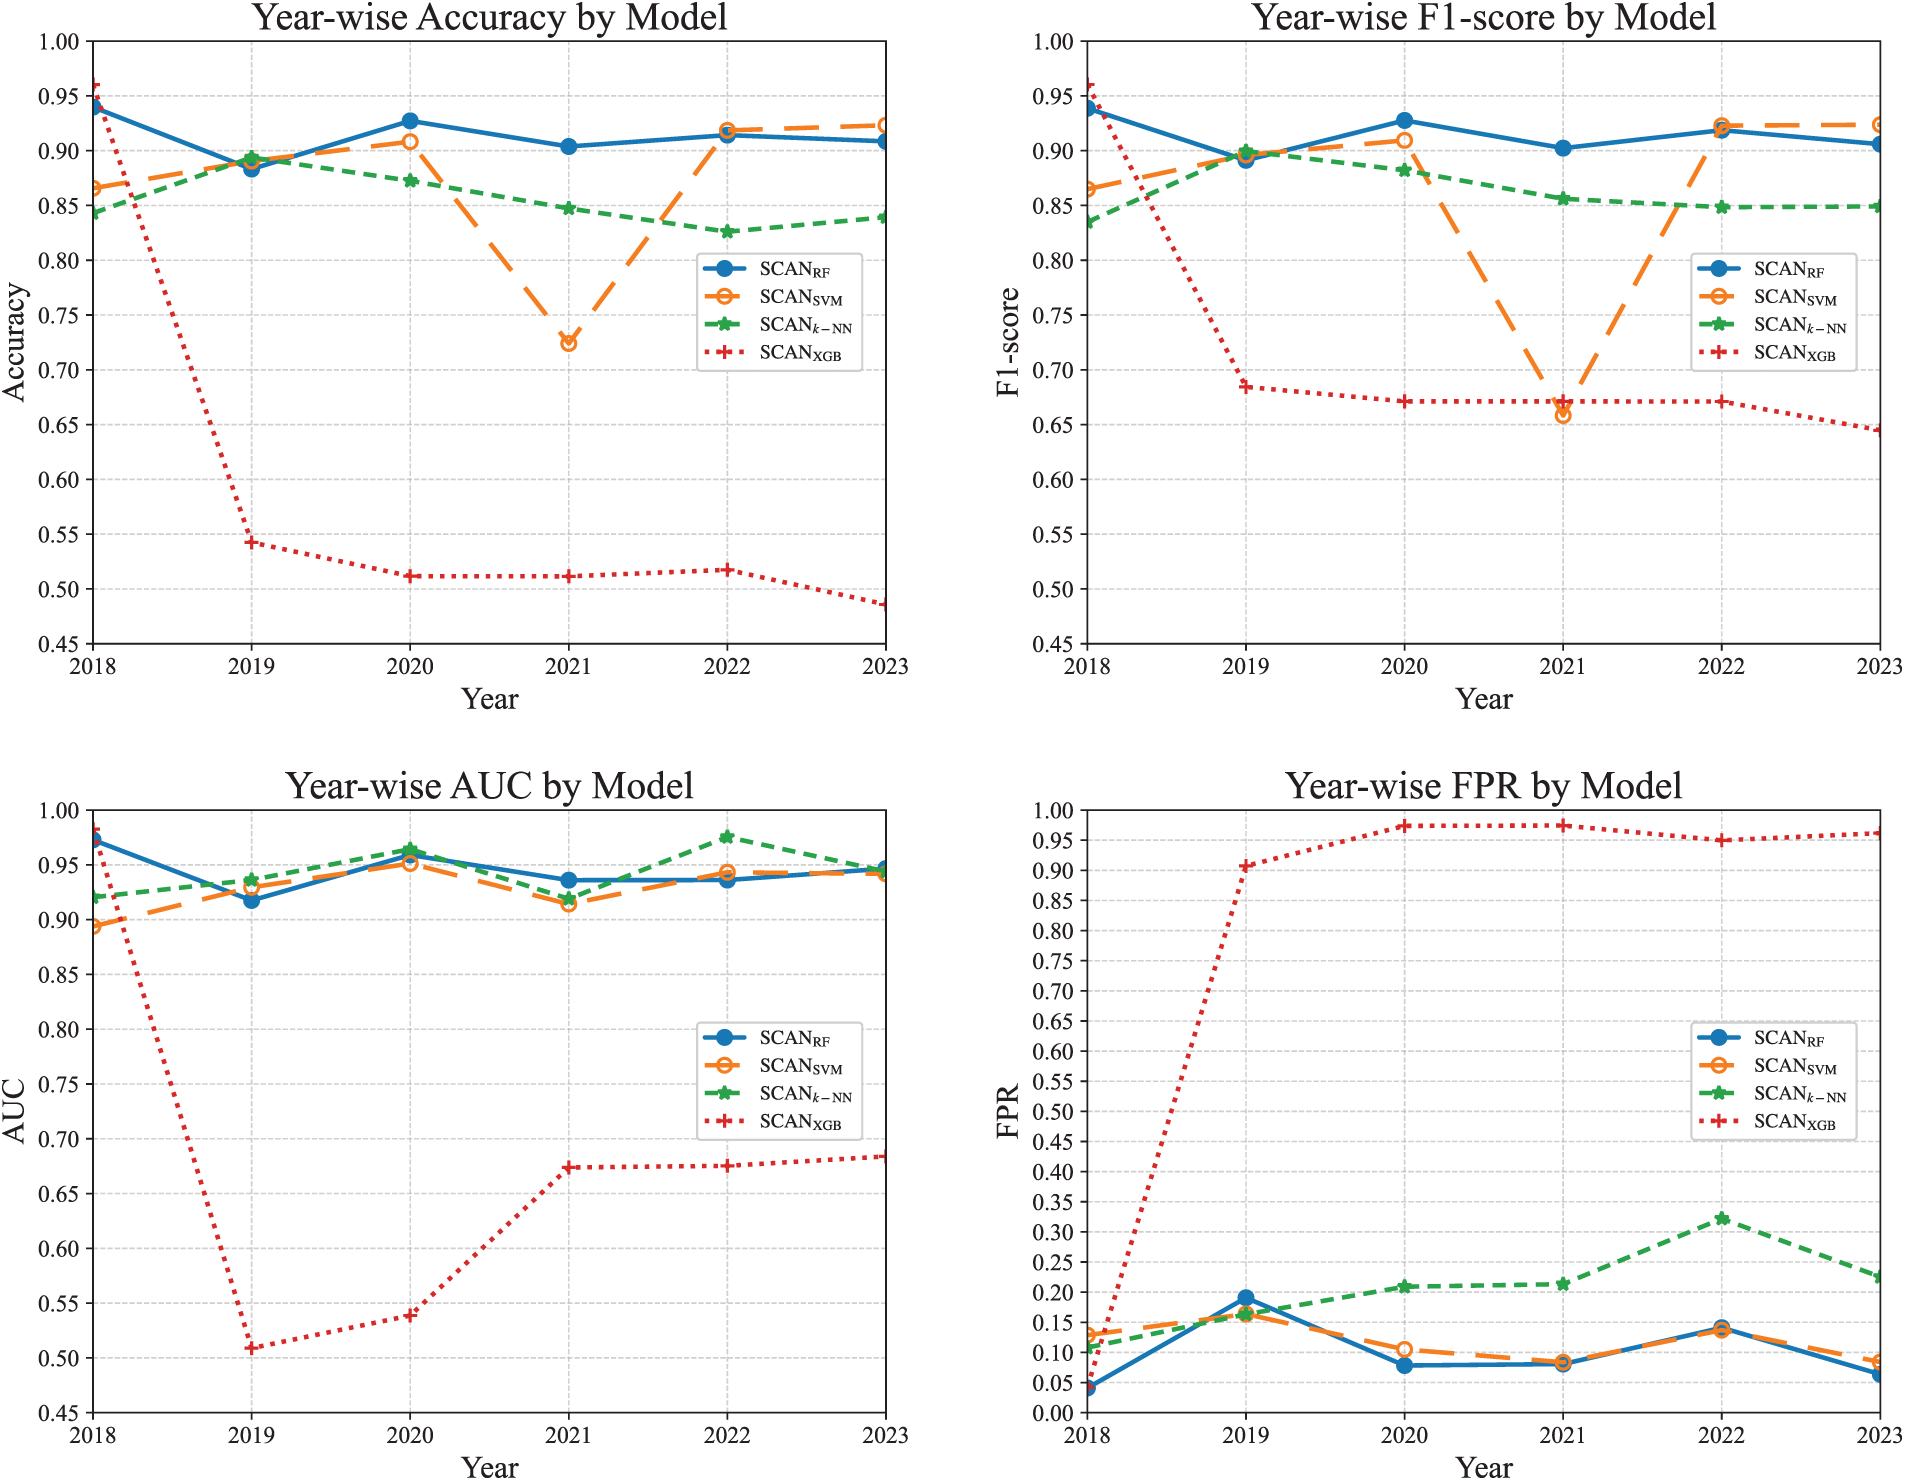
Figure 8: Year-wise performance of SCAN combined with each classifier.
As shown in Fig. 8,
The AUC results further support this pattern,
These findings indicate that while SCAN’s architecture remains fixed, its effectiveness depends heavily on the chosen classifier. Among the models tested,
5.3 Comparison with Baseline Models
We compare the performance of SCAN against conventional baseline models that do not use any clustering techniques. The baseline models consist of traditional machine learning classifiers: RF, SVM,
Fig. 9 shows the performance comparison between the baseline models and the SCAN models on the bar charts.
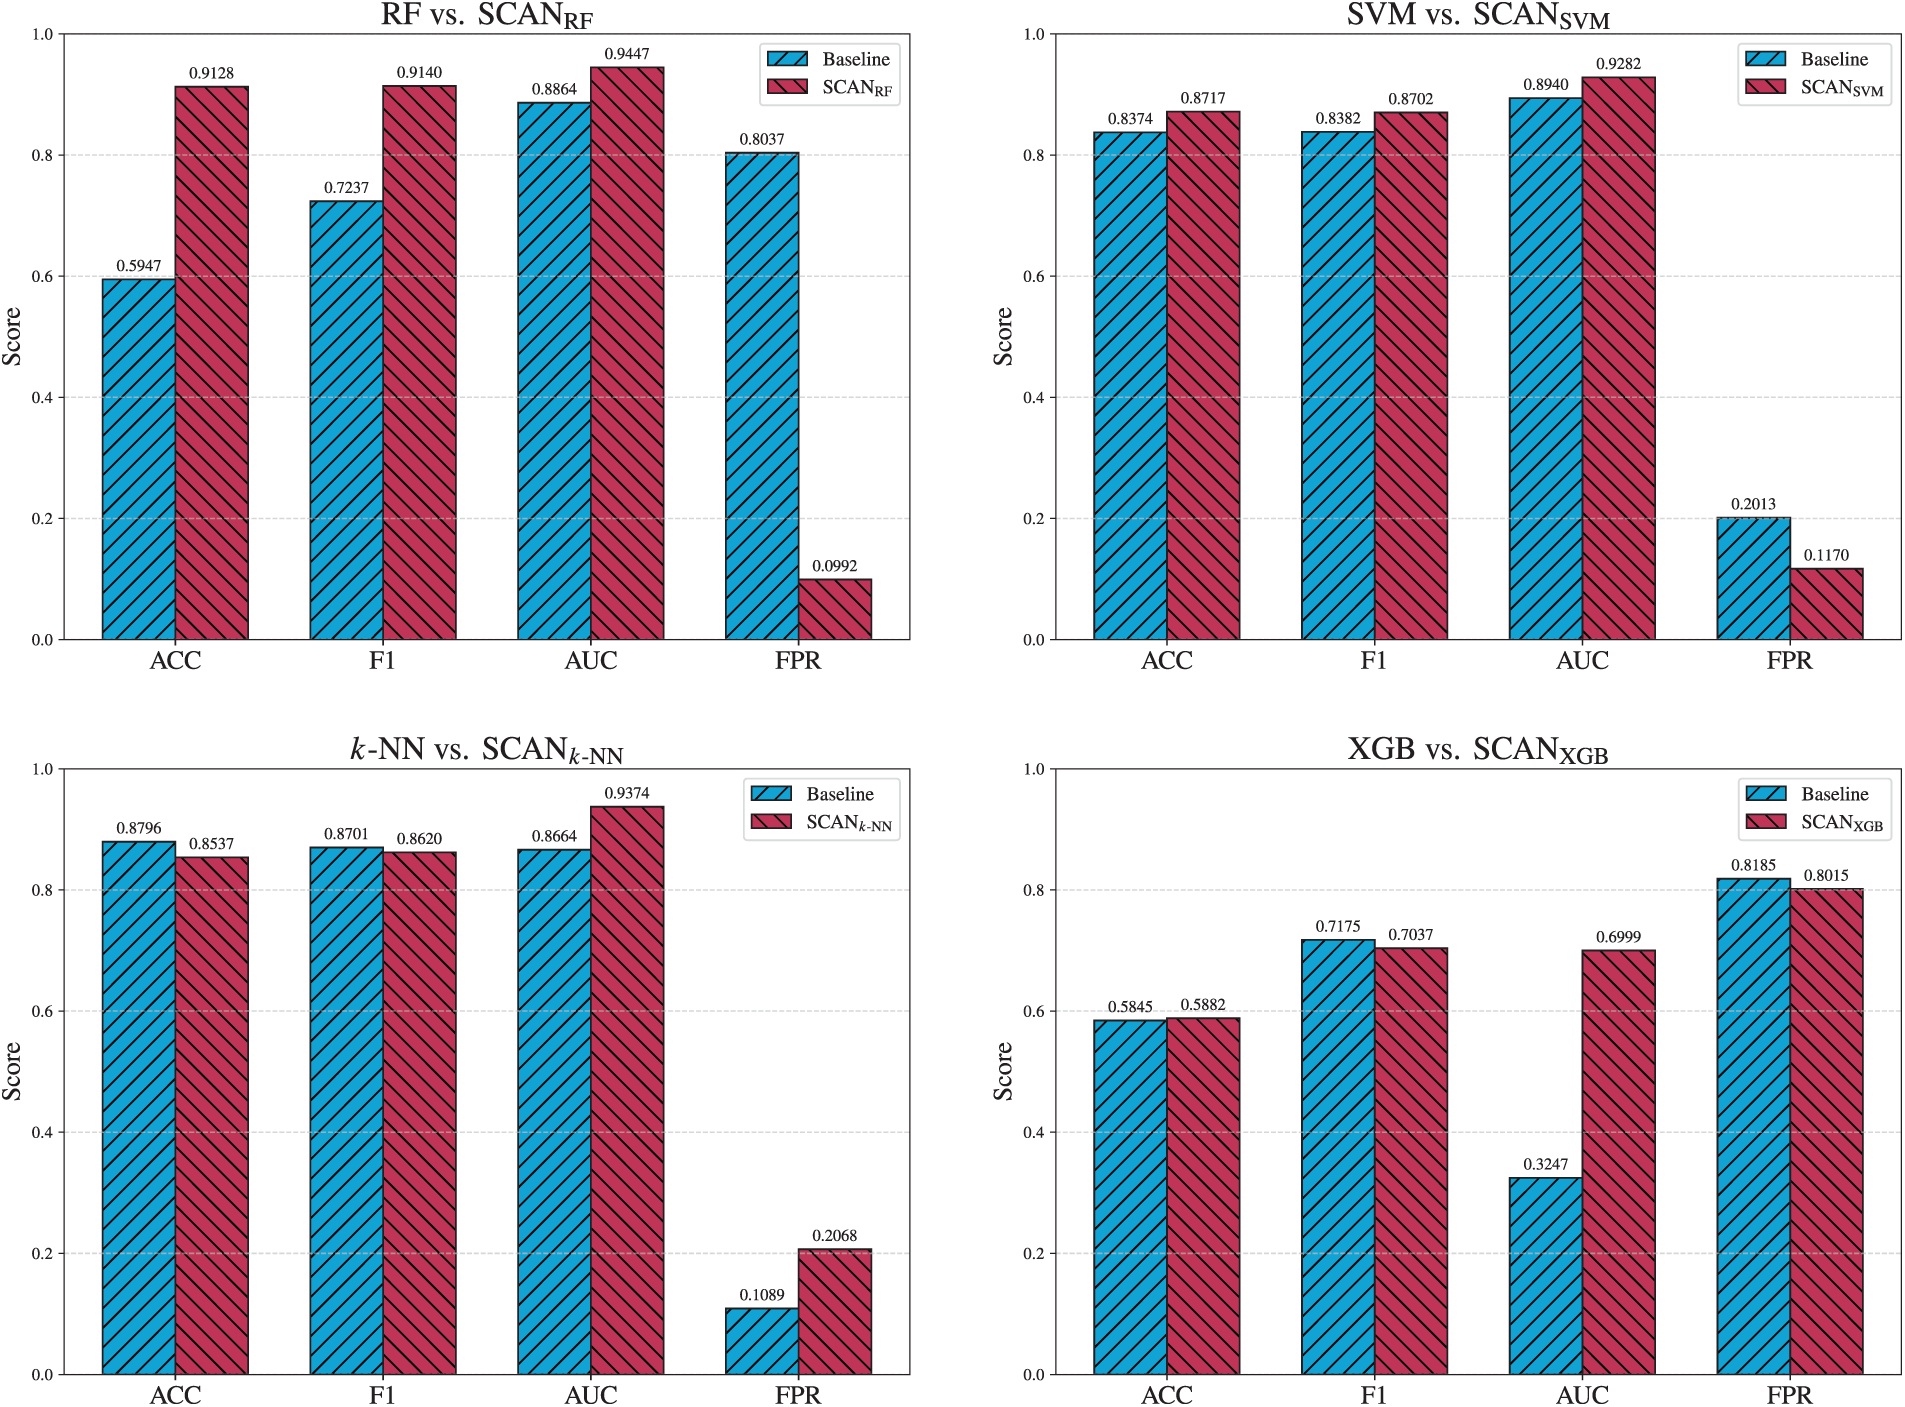
Figure 9: Overall performance comparison of baseline models and SCAN counterparts.
Fig. 10 shows the performance comparison between RF and
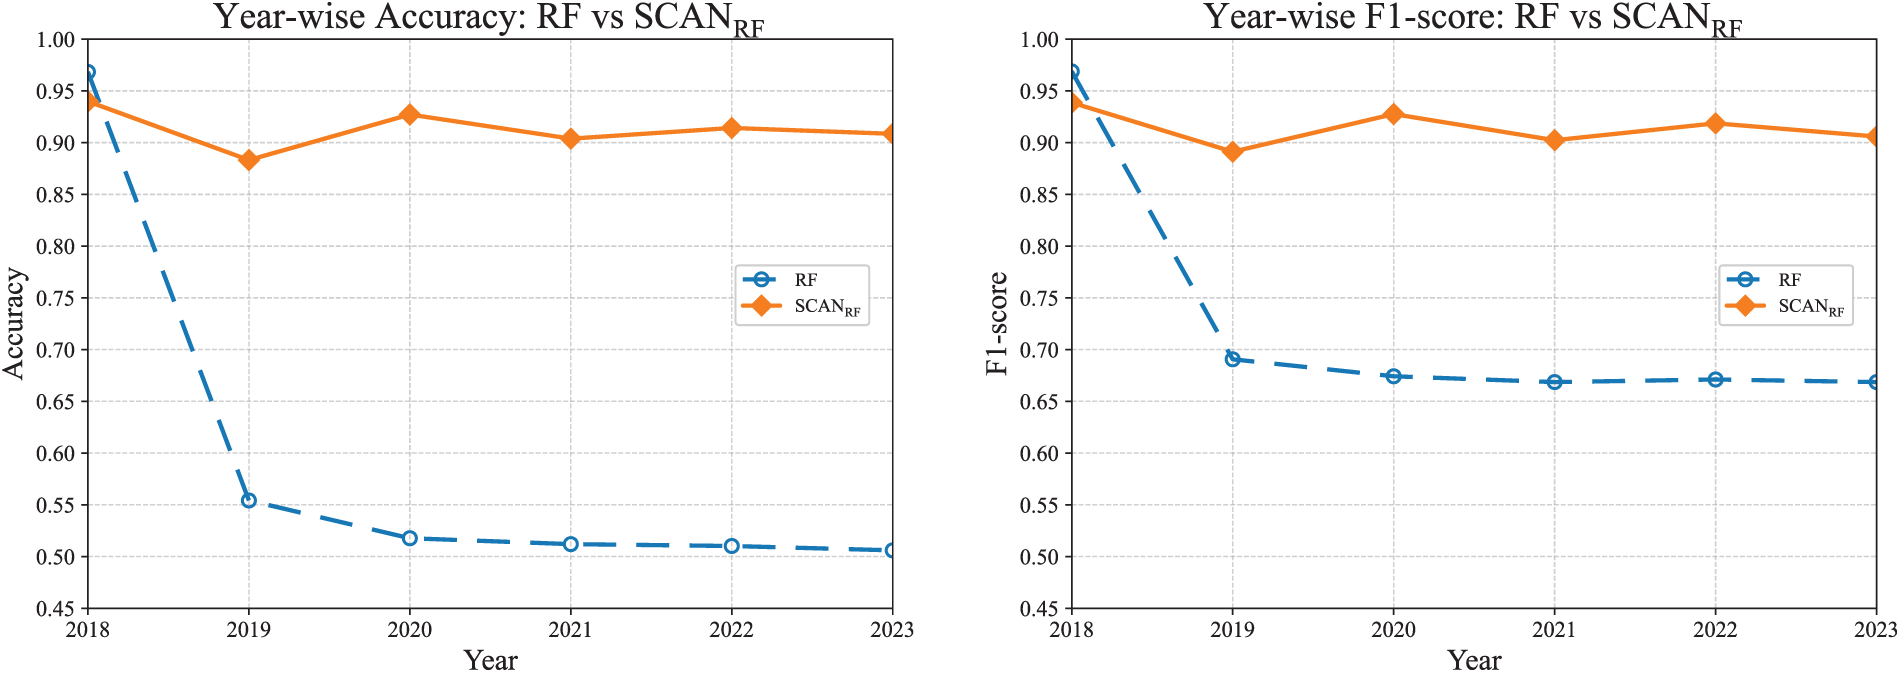
Figure 10: Year-wise comparison between RF and
Fig. 11 compares the performance of SVM and
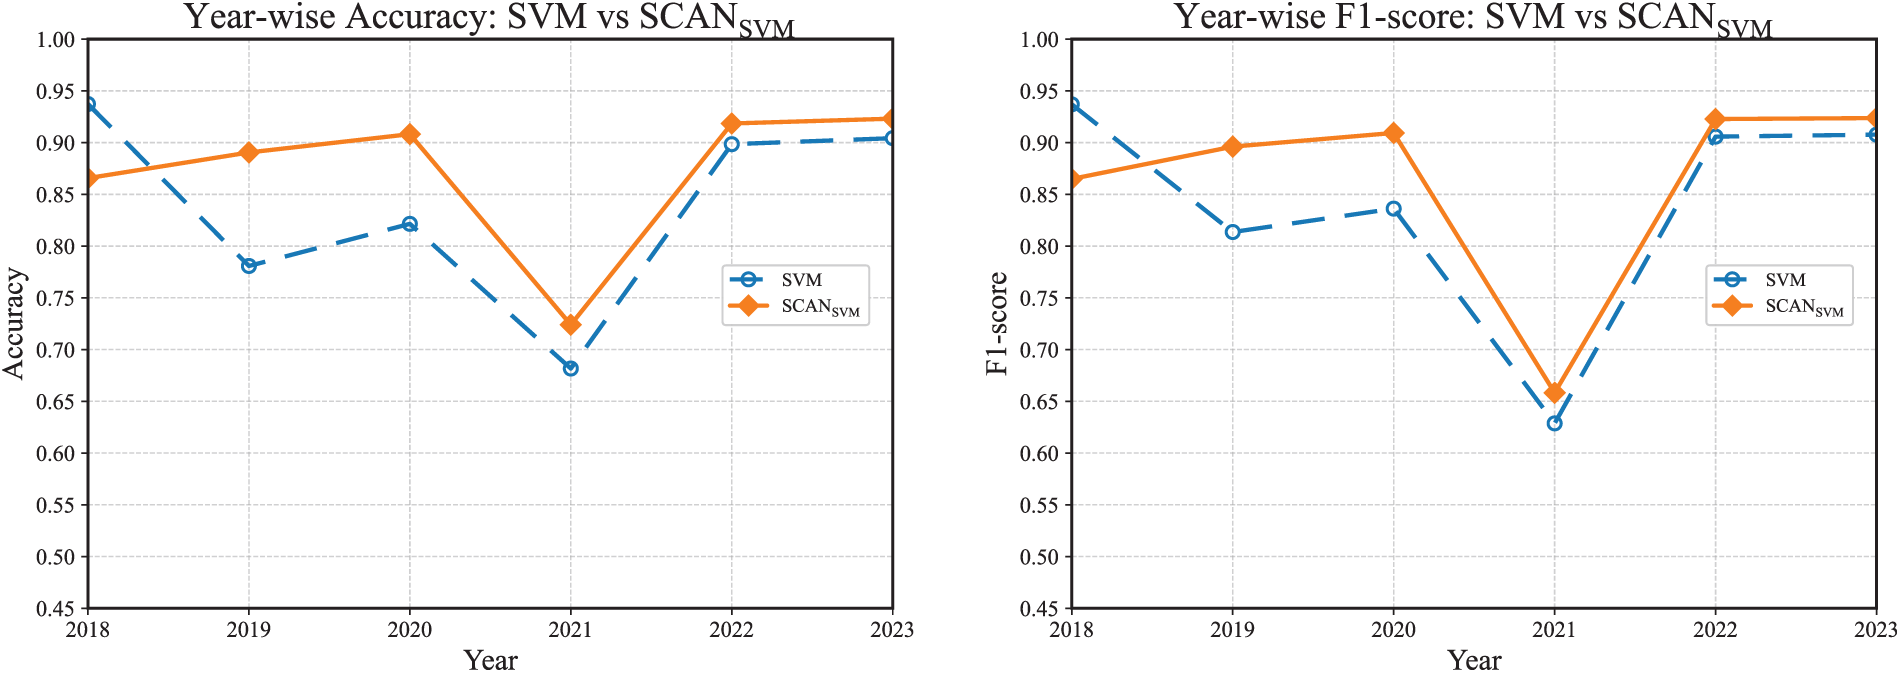
Figure 11: Year-wise comparison between SVM and
In summary, SCAN reduces false positives and dampens inter-year variance by enforcing decisions within more homogeneous clusters and by using adaptive thresholds. The approach turns RF from a drift-prone baseline into a competitive detector and further stabilizes the SVM under the same evaluation protocol.
In this section, we analyze the effect of the cluster-wise adaptive thresholding (see Section 4.5) and the year-wise mapping (see Section 4.7).
5.4.1 Evaluating the Effects of the Adaptive Thresholding
As described in Section 5.1, f-SCAN as a variant of SCAN uses a fixed uniform threshold of
Fig. 12 shows that adaptive thresholding produces clear improvements for RF and
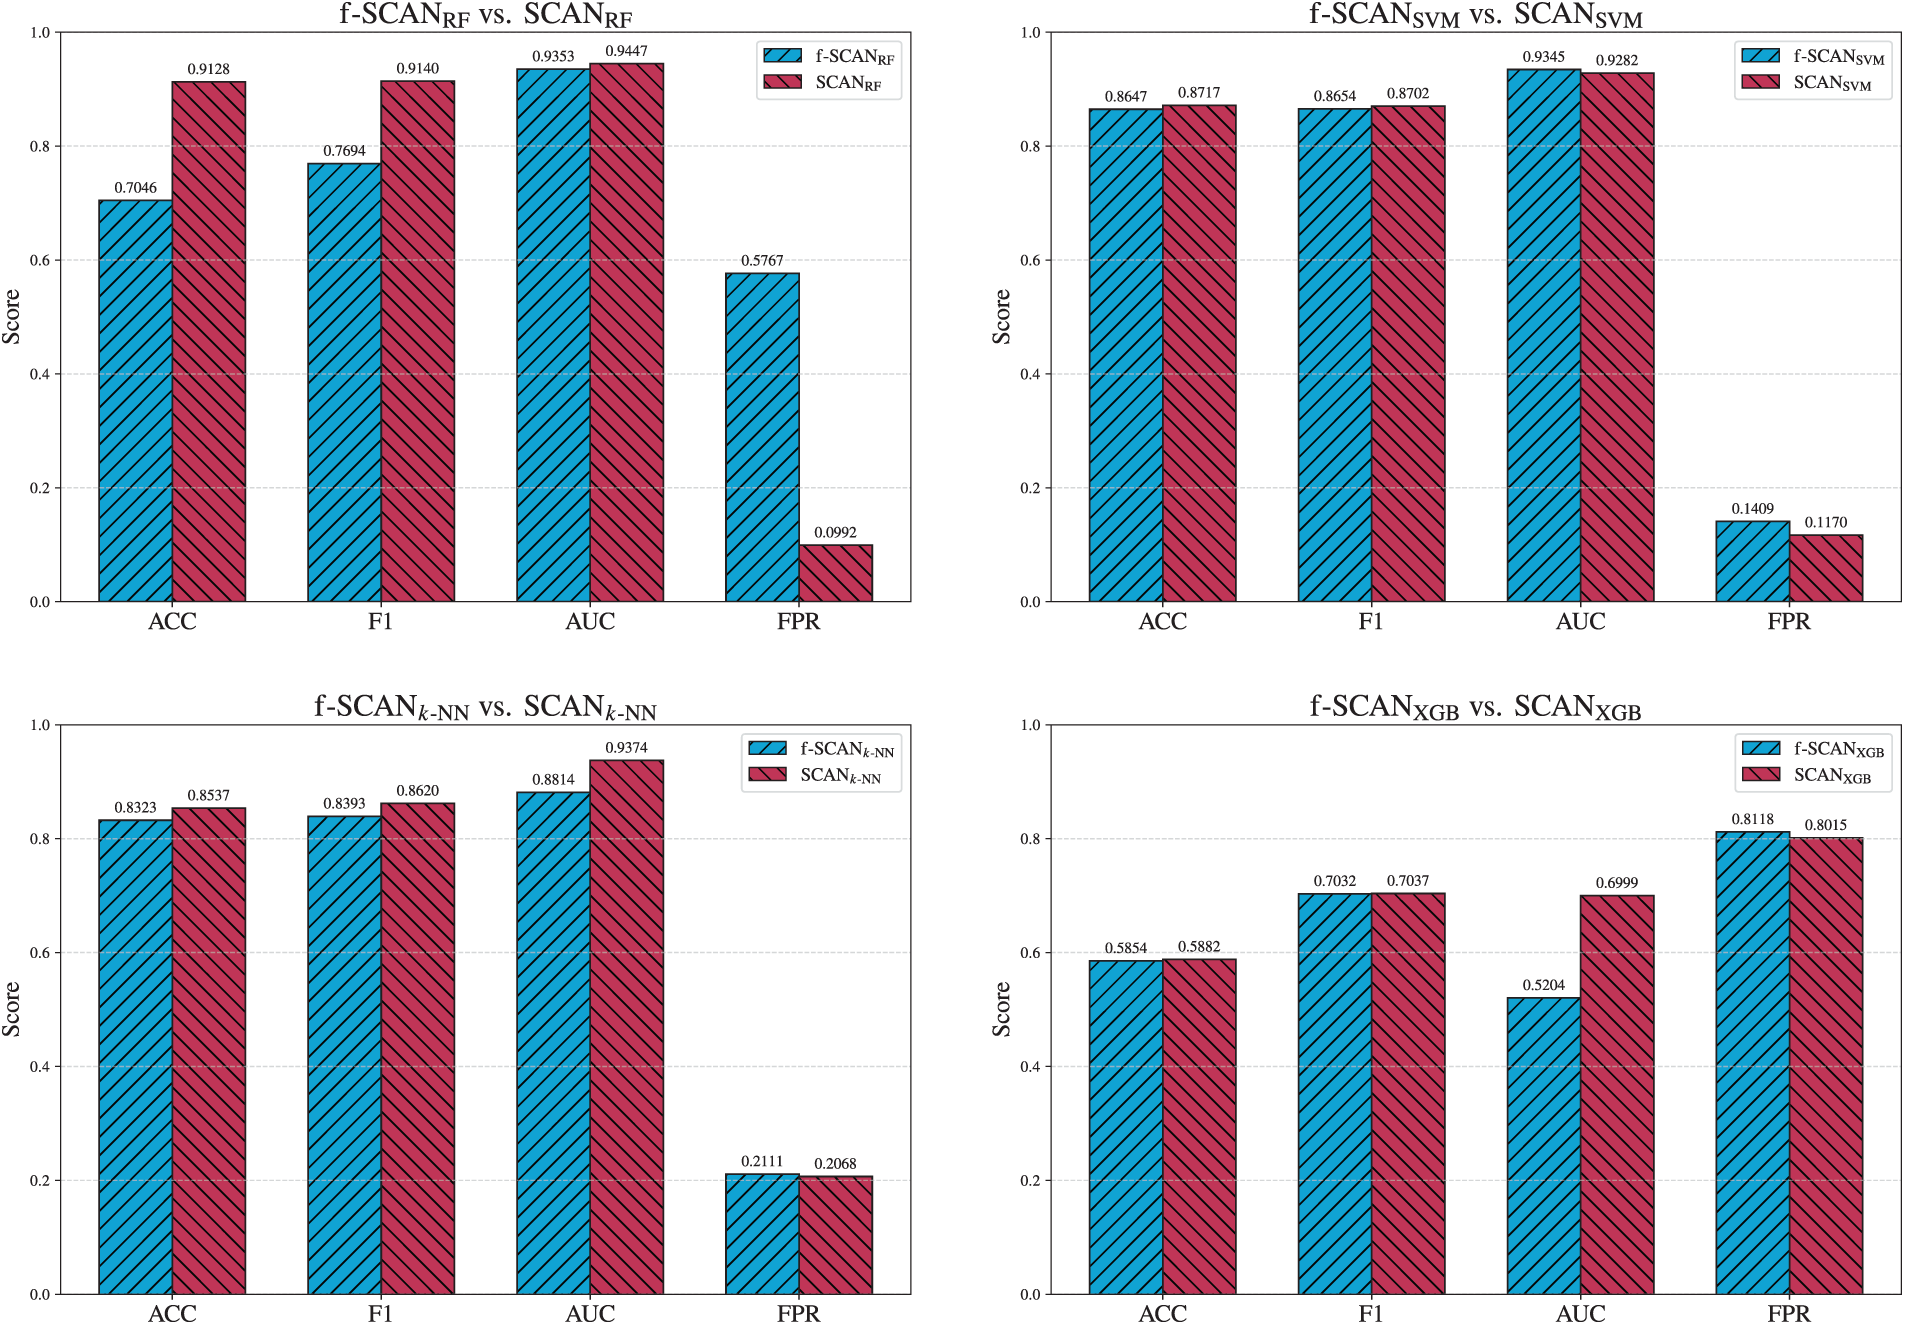
Figure 12: Overall performance comparison of f-SCAN and SCAN counterparts.
In Fig. 13, the adaptive threshold for RF significantly suppresses false positives in benign-dominant years, restoring accuracy and F1-score where f-SCAN previously over-flagged benign applications. The year-wise profile also becomes more stable.
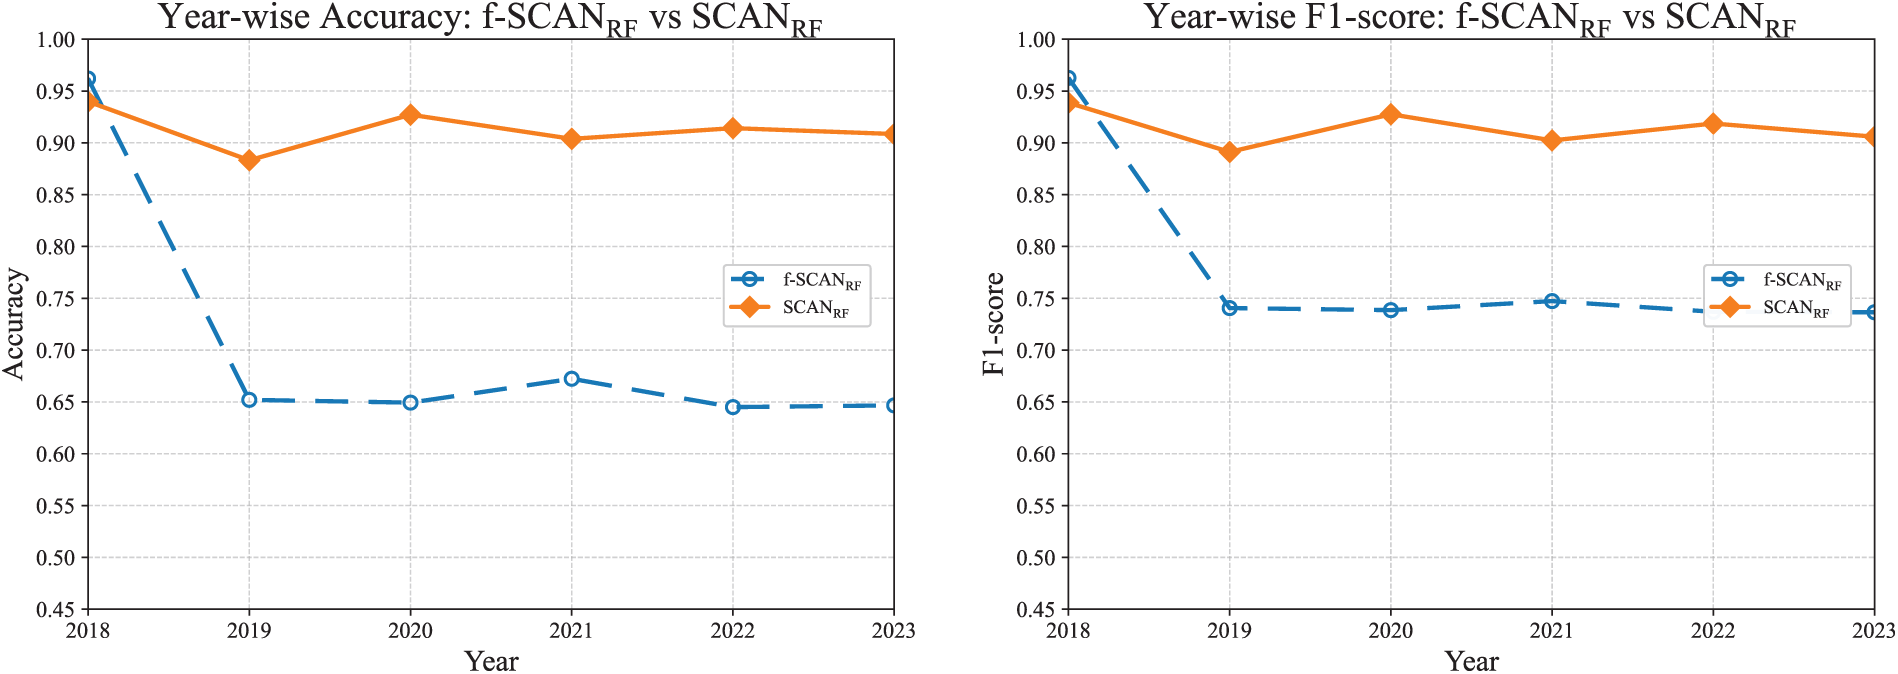
Figure 13: Year-wise comparison between
For SVM, shown in Fig. 14, adaptive thresholding does not yield consistent benefits. It offers slight improvements in certain years, but shows little or no advantage in others.
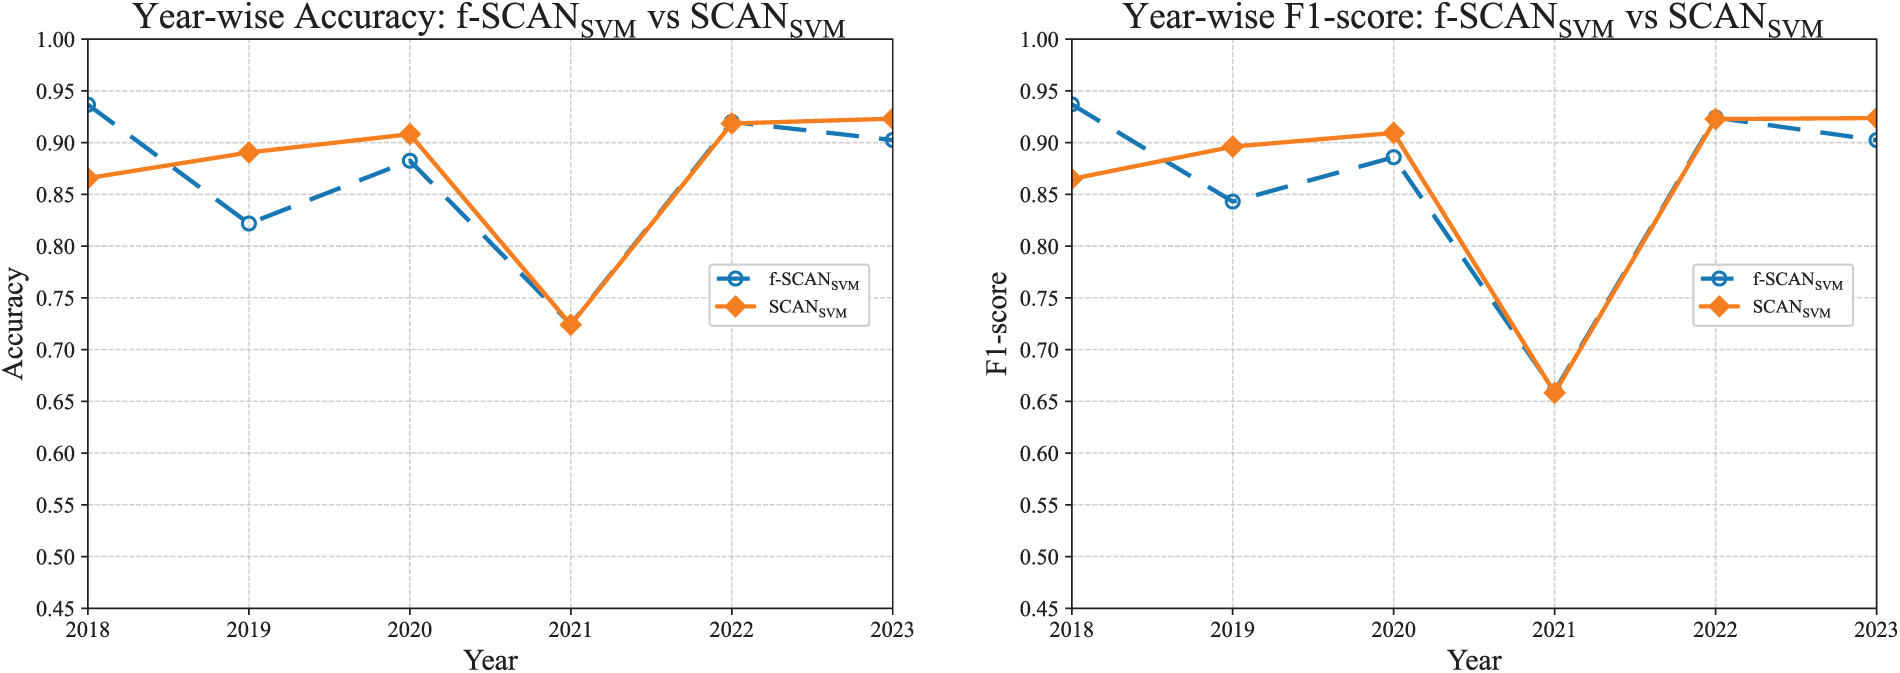
Figure 14: Year-wise comparison between
In conclusion, the ablation demonstrates that the adaptive thresholding strategy described in Section 5.4.1 is effective primarily for RF and
5.4.2 Evaluating the Effects of Year-Wise Mapping
We evaluate the impact of year-wise mapping by comparing SCAN with year-wise mapping against SCAN with pooled mapping. Table 8 presents the overall performance of both approaches using the
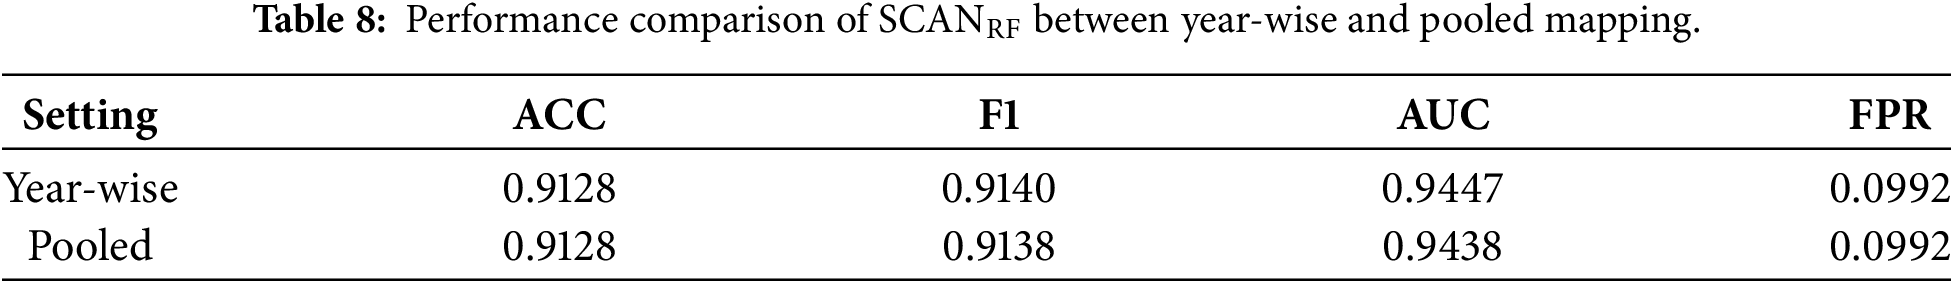
As shown in Table 8, the year-wise mapping method yields slight but consistent improvements in F1-score and AUC compared to pooled mapping. These results suggest that year-wise mapping provides better robustness under concept drift by better aligning the cluster structure with evolving data distributions.
5.5 External Generalization Evaluation Using Combined AndroZoo and DREBIN Datasets
In addition to the primary AndroZoo-based dataset described in Table 1, we construct an extended benchmark by incorporating the DREBIN dataset [55,56] to evaluated the external generalization capability of SCAN. Since DREBIN lacks temporally aligned metadata and is therefore unsuitable for year-wise temporal analysis, its malicious samples are used exclusively as (i) an additional malicious source during training and (ii) an independent out-of-distribution (OOD) malwared source during testing. The composition of the resulting DREBIN-enhanced datasets is summarized in Table 9.
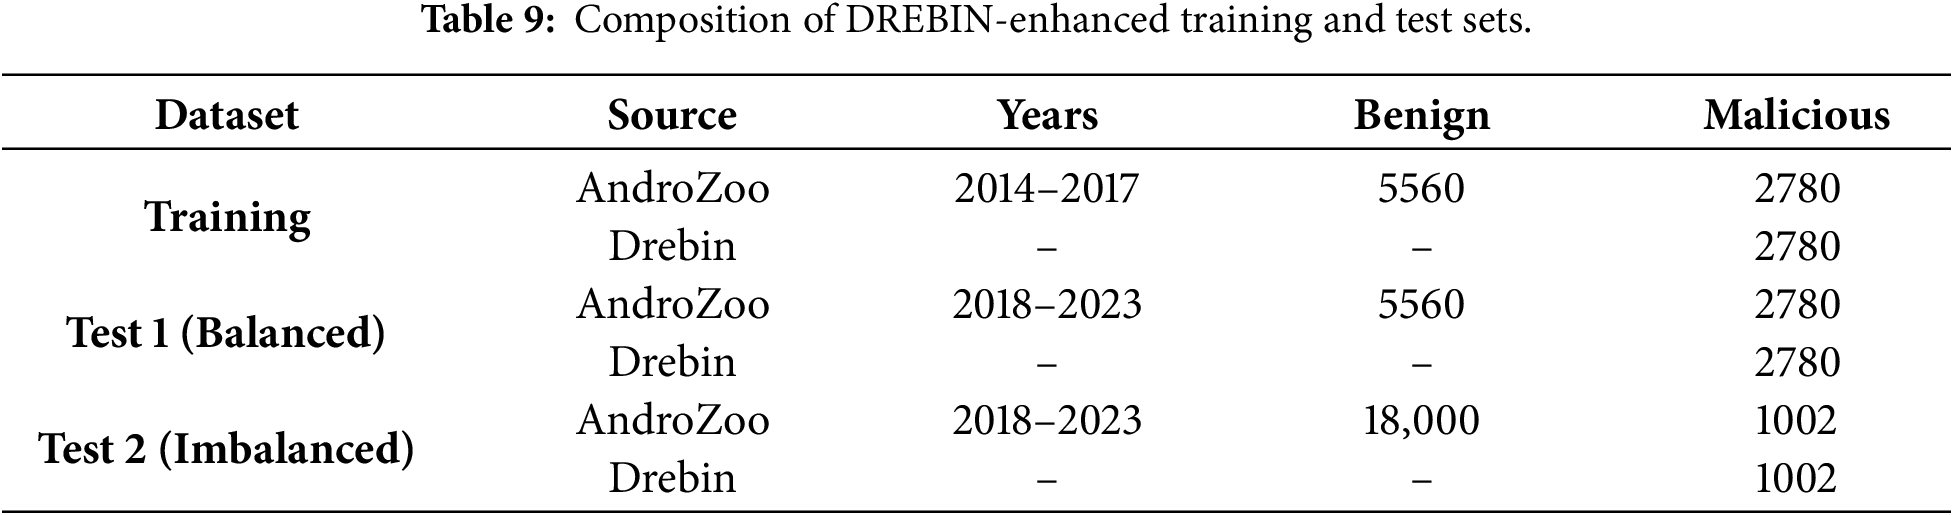
As shown in Table 9, the training set consists of 11,120 applications (5560 benign and 5560 malicious), forming a balanced 1:1 ratio. Benign samples are drawn from AndroZoo (2014–2017), with 1390 applications selected per year. Malicious samples include 695 AndroZoo applications per year from the same period, supplemented by 2780 malicious samples from DREBIN to achieve class balance.
Two types of test data sets are constructed. The first test set, Test 1 (Balanced), contains 11,120 applications (5560 benign and 5560 malicious). Benign samples are obtained from AndroZoo (2018–2023), with 926–927 applications sampled per year. The malicious class consists of 2780 DREBIN samples and 2780 AndroZoo samples, where the AndroZoo portion is sampled uniformly across years (463–464 samples per year).
The second test set, Test 2 (Imbalanced), reflects a realistic deployment scenario with a 9:1 benign-to-malicious ratio, comprising 18,000 benign and 2004 malicious applications. All benign samples are drawn from AndroZoo (2018–2023). The malicious set includes 1002 DREBIN samples and 1002 AndroZoo samples, with the latter sampled evenly across years (167 per year). The 9:1 benign-to-malicious ratio follows the settings in prior Android malware detection study to reflect realistic class imbalance [57].
5.5.1 Evaluation on a Balanced Cross-Source Dataset
In this subsection, SCAN is trained using the standard balanced training protocol (1:1 benign-to-malicious ratio) constructed solely from AndroZoo data (2014–2017). Once trained, the model is fixed and evaluated without retraining under different test configurations to assess robustness against temporal and cross-source distribution shifts.
We first evaluate SCAN with Random Forest (
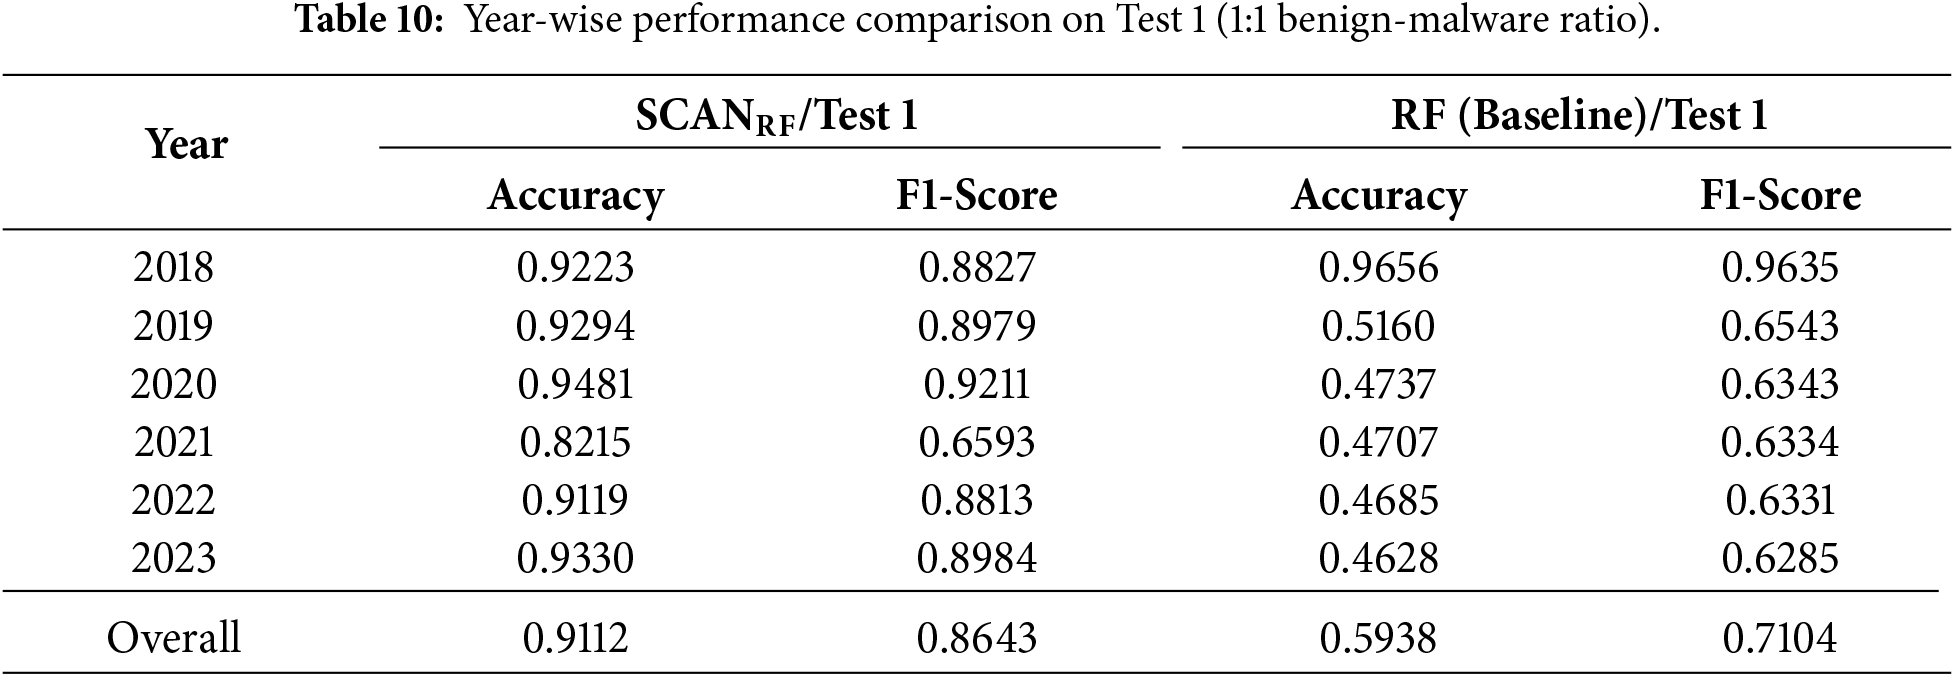
Under this balanced evaluation,
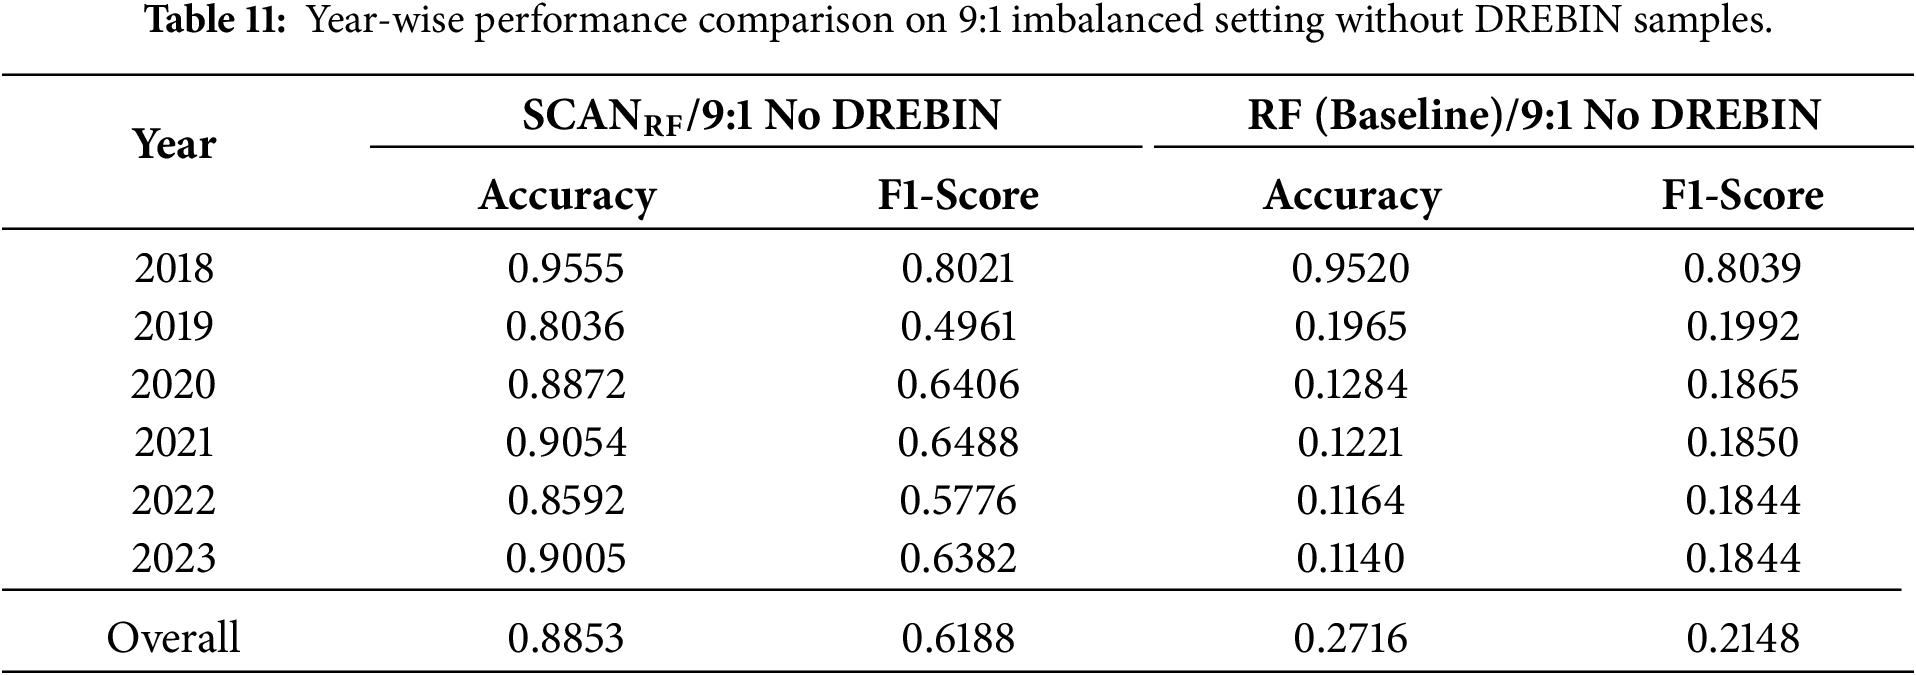
5.5.2 Evaluation under Real-World Imbalanced Conditions
In real-world Android markets, benign applications typically dominate, resulting in highly imbalanced class distributions. To evaluate SCAN under such deployment conditions, we conduct experiments under two complementary imbalanced scenarios.
First, we construct an imbalanced test set without DREBIN, undersampling malicious samples to create a 9:1 benign-to-malicious ratio. As shown in Table 11, SCAN maintains strong performance despite severe imbalance, achieving an overall Accuracy of 0.8853 and F1-score of 0.6188. Under this setting,
Second, we evaluate SCAN under a cross-source imbalanced setting by incorporating DREBIN malware samples while maintaining the same 9:1 ratio (Test 2 in Table 12). As reported in Table 9, SCAN remains robust in this more challenging configuration, achieving an overall Accuracy of 0.9394 and F1-score of 0.5892. In contrast, the Random Forest baseline exhibits near-zero detection performance for malicious samples, resulting in near-zero F1-scores across all years.
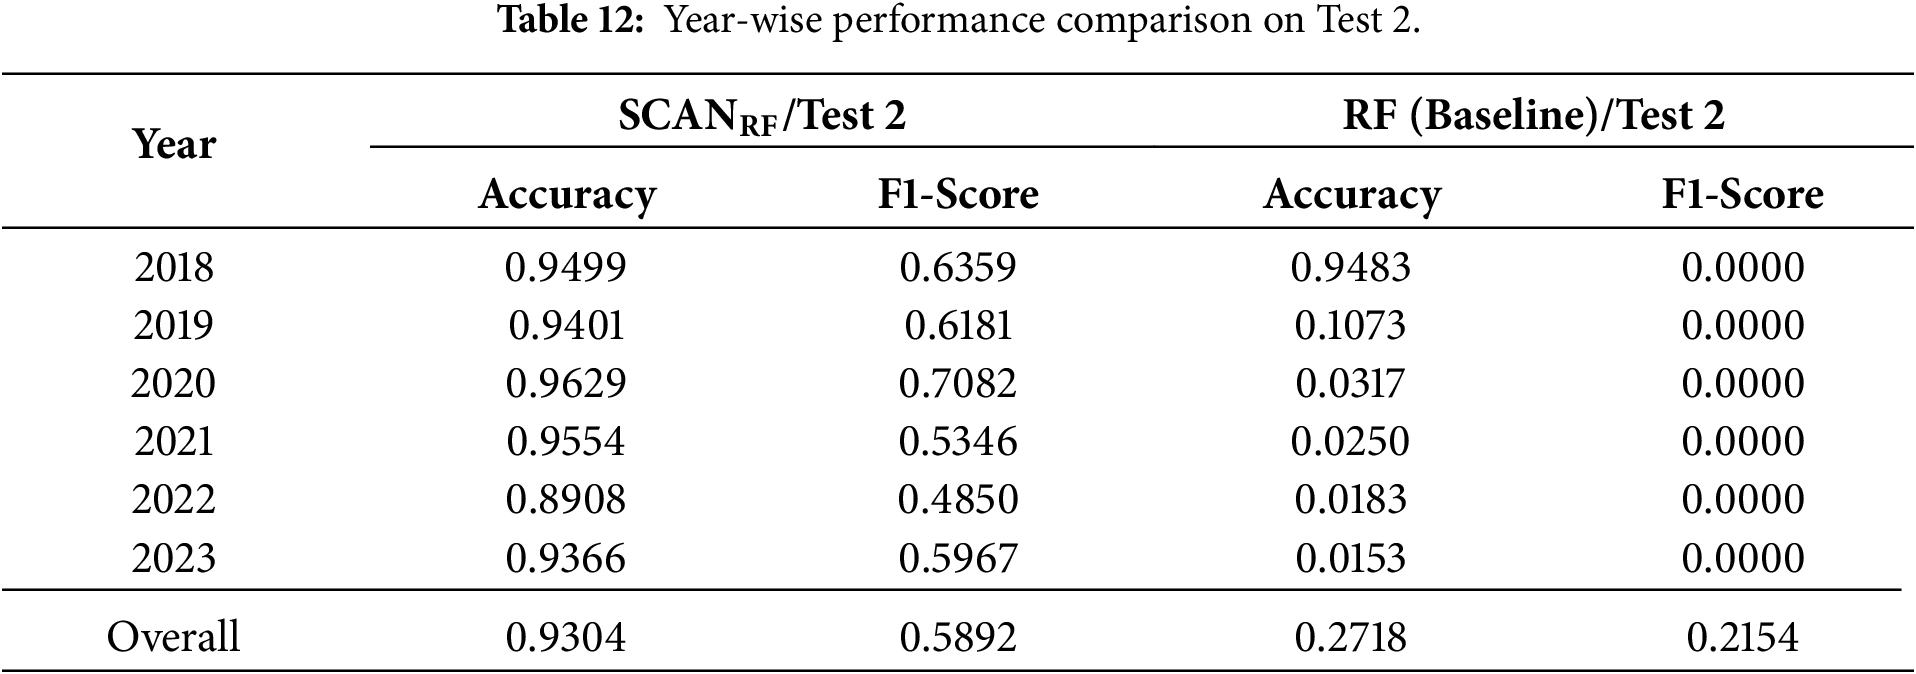
For completeness, year-wise results for all remaining SCAN and f-SCAN variants under both imbalanced settings are provided in Appendix F.
5.6 Analyzing Training Time and Size of Models
This section quantifies the computational overhead of representative models. We analyze end-to-end training time and serialized memory size for six models shown in Table 13. They are run on the same computer, and the overhead is measured from data loading to the completion of the model fitting. We report training time in three separate components: (1) clustering time, (2) threshold computing time, and (3) classifier training time.
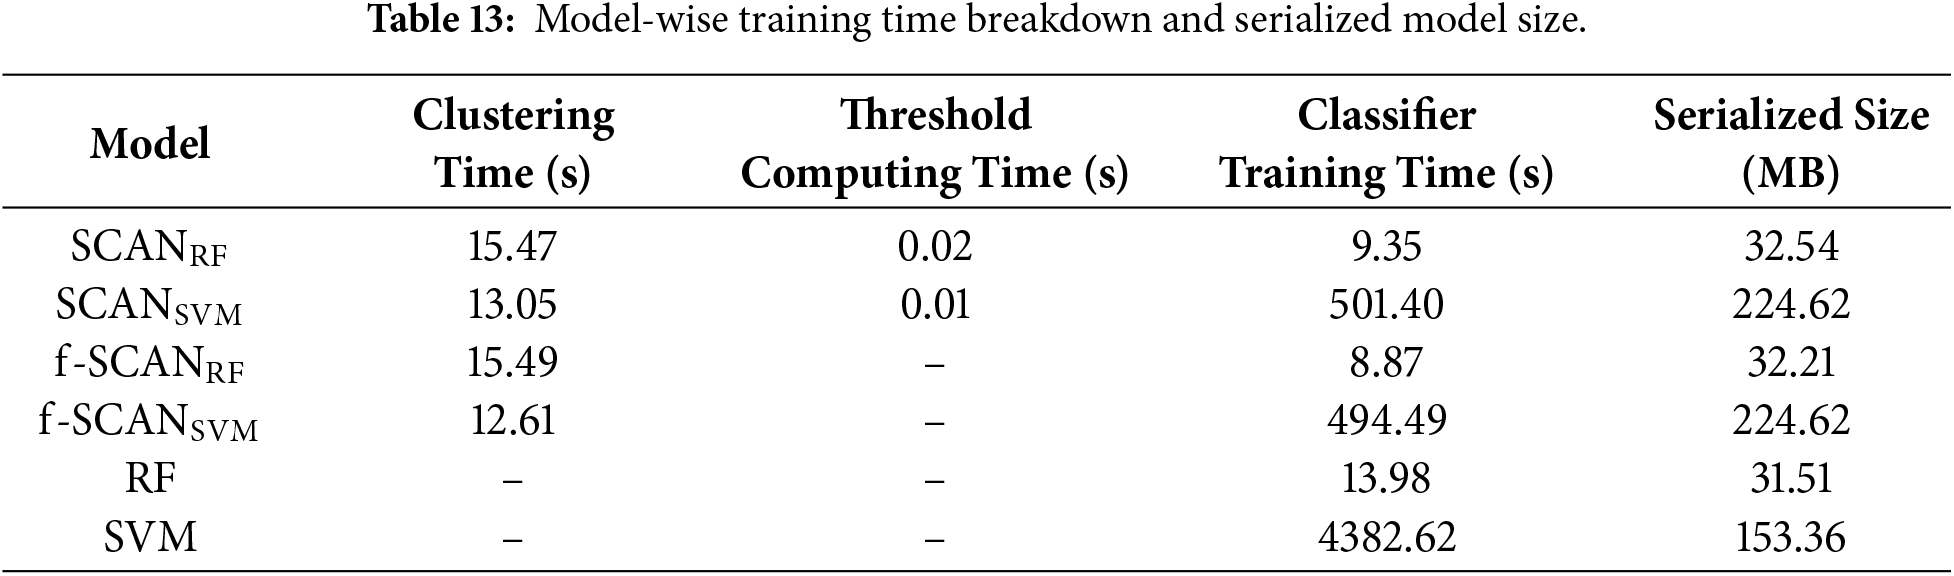
As shown in Table 13, SCAN and f-SCAN exhibit very similar training times because adaptive thresholds are derived directly from cluster statistics without requiring additional optimization. RF completes training faster than
In case of serialized model size, in general, RF-based models are significantly smaller than SVM-based ones. Specifically,
In summary, the clustering models combined with RF introduce only a modest overhead relative to the baseline RF, and remain feasible for offline training. The clustering models combined with SVM substantially alleviate computational burden by reducing training time and keeping the model size larger but within a manageable range, making it more practical than training the baseline SVM. SCAN provides the benefit of adaptive thresholds without increasing training cost and with a smaller serialized memory size compared to f-SCAN, offering a favorable trade-off given the performance improvements reported earlier. Importantly, the inference cost remains unchanged because only the relevant cluster-specific classifier is evaluated at the test stage.
This study presents an efficient and retraining-free Android malware detection framework called SCAN that addresses two key challenges: concept drift and class imbalance. SCAN combines three core components, GMM-based clustering, cluster-specific adaptive thresholding, and cluster-wise supervised learning classifiers to maintain detection robustness across evolving environments without model updates.
A central insight in SCAN is to maintain a fixed latent space constructed by the GMM-based clustering using the training data from 2014 to 2017. The test data from 2018 to 2023 is mapped into this fixed latent space on an annual basis, allowing year-wise evaluation of model performance under real-world distributional shifts. This design allows for a consistent interpretation of behavioral changes over the years while avoiding the cost and complexity of continuous learning.
In operational settings, SCAN does not explicitly rely on temporal labels. When applications arrive in a time-coherent manner, the mapping naturally takes a year-wise form, highlighting how the model responds to distributional shifts over time. Conversely, when applications from different periods are intermixed, the mapping becomes pooled, reflecting the aggregate distribution typically observed in practice. While both mappings are realistic, the year-wise setting is particularly valuable as it reacts more sensitively to concept drift. In this study, we adopt the year-wise mapping for evaluation, as it provides clearer insights into temporal robustness, although pooled behavior may also arise in real deployments.
What further distinguishes our approach is its ability to adapt classification sensitivity to local data distributions of the clusters generated by the GMM. Existing methods use a single fixed threshold for all clusters, ignoring the internal imbalance that naturally arises within individual clusters. Our design explicitly addresses this by assigning each cluster its adaptive threshold, calculated from the ratio of malicious applications per cluster. As a result, the model adjusts its decision boundaries based on the nature of the training data.
Sustained performance over multiple years validates the effectiveness of our proposed approach in detecting malicious Android applications. To highlight the distinctions between SCAN and existing solutions, we conducted a comparison with three previous studies [14,16,63], with the key differences summarized in Table 14.
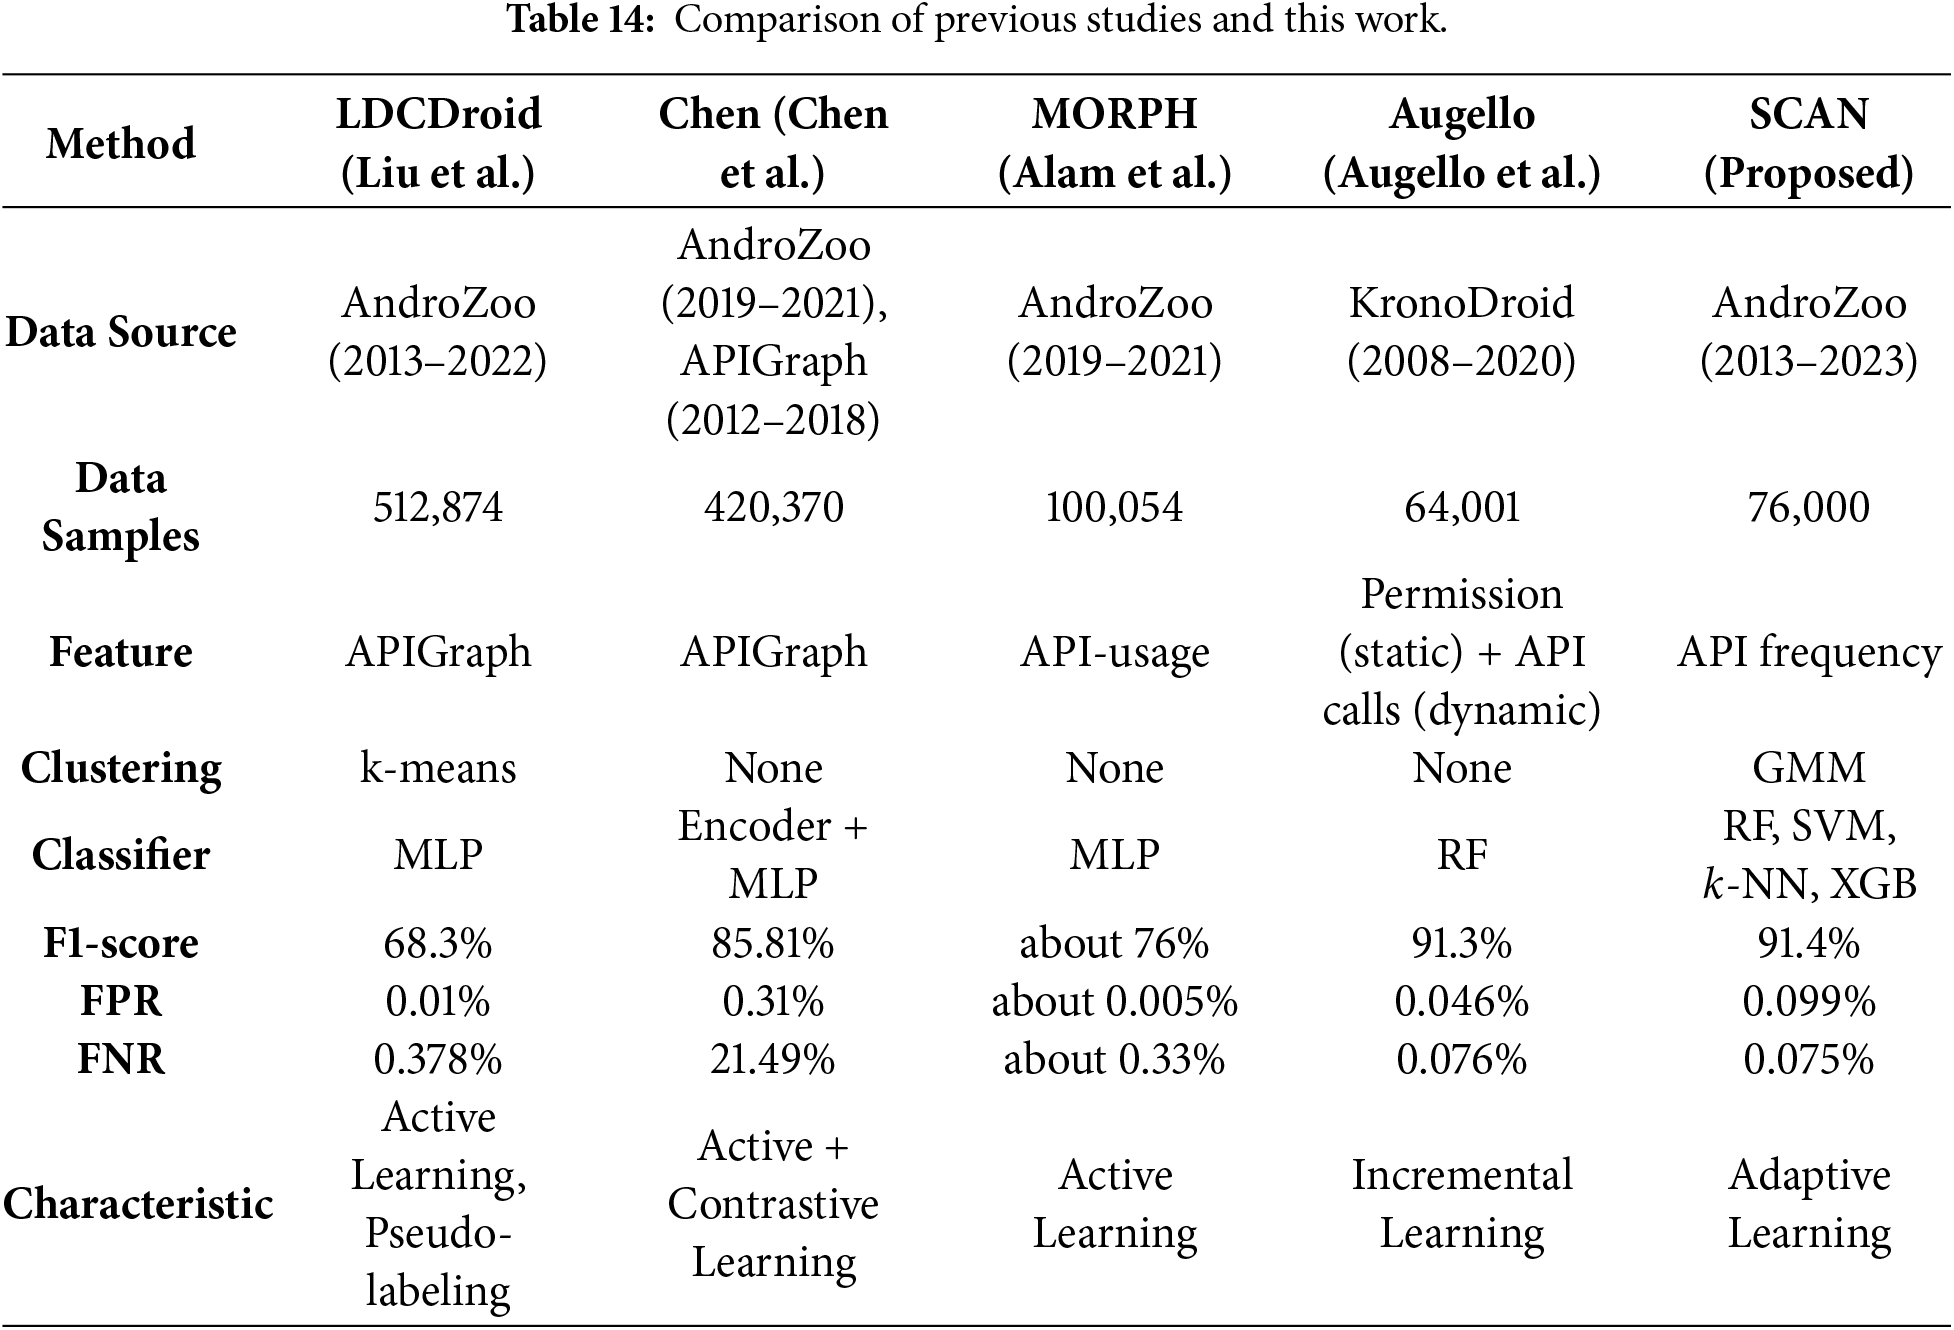
LDCDroid [63] adopts the Multi-Layer Perceptron (MLP) algorithm and a retraining-based pipeline that integrates pseudo-labeling with confidence-based drift detection. Using the label information known for the training phase, they applied the
Chen et al. [14] propose a sophisticated model that takes advantage of APIGraph features and hierarchical contrastive learning combined with active learning to generate embeddings, which are then fed into an MLP classifier. This approach achieves a relatively high F1-score of 85.81% for the AndroZoo dataset, but it shares the limitation of requiring continuous retraining to address concept drift. Moreover, the model exhibits a high false negative rate (21.49%), raising the risk of overlooking novel types of malware, which maintains a low FNR.
MORPH [16] tackles concept drift through active learning based on API-usage features. Although this methodology keeps the model up to date via retraining, the associated labeling costs and computational complexity remain pressing challenges. Furthermore, while the MLP classifier used in MORPH demonstrates competitive performance, it lacks the intrinsic adaptability of SCAN, which leverages GMM clustering and adaptive thresholding to respond dynamically to shifts in data distribution.
SCAN is designed to handle concept drift and class imbalance simultaneously using a train-once-deploy-forever approach. By fixing a GMM-based clustering structure and calibrating cluster-specific thresholds based on historical malicious ratios, SCAN can maintain year-wise generalization across evolving data distributions. This structural design significantly reduces the complexity and labeling burden typically required in long-term malware detection systems.
SCAN has several limitations that warrant consideration.
• Imperfectness of AIC: The Akaike Information Criterion (AIC) assumes that the data generation process is well-approximated by the chosen model family, in this case, a mixture of Gaussians. If the true distribution of data deviates significantly from this assumption, the selected number of clusters K may not reflect the actual underlying structure. In small datasets, it may overestimate K, whereas in very large datasets, it may favor overly complex models.
• Cluster Sparsity: Due to the fixed nature of the GMM structure, some clusters may contain only a small number of samples, particularly in high-dimensional feature spaces. This can introduce statistical instability during classifier training and degrade the reliability of the evaluation.
• Boundary Sensitivity: Applications located near cluster boundaries may receive low-confidence predictions, especially when local classifiers are unable to generalize effectively across overlapping feature regions.
• Limited Visibility of Dynamic Behaviors: SCAN relies solely on static features without executing applications. While this approach is simple and cost-effective, it is inherently less effective against malware that employs code obfuscation, encryption, packing, or dynamic code-loading techniques, as these can conceal malicious behaviors from static analysis.
These limitations highlight opportunities for future research, including the integration of online clustering updates, the adoption of latent variable models for the evolution of scalable clusters, and the development of uncertainty-aware classification methods that dynamically adapt decision thresholds for boundary cases.
This study proposes SCAN, an intelligent and sustainable Android malware detection framework designed to address two fundamental challenges: concept drift and class imbalance. SCAN leverages a GMM-based clustering structure to assign latent behavioral representations to applications, thereby mitigating the effects of temporal distributional shifts without requiring retraining. In addition, the framework employs adaptive thresholding, adjusting the decision boundary for each cluster according to its internal class distribution. This enables balanced decision-making even under skewed or imbalanced data conditions.
A six-year longitudinal evaluation demonstrates that SCAN consistently maintains high detection performance over time. Analysis of confusion matrices reveals a stable balance between false positives and false negatives, indicating strong generalization capabilities and operational reliability. The absence of significant performance degradation under concept drift underscores the robustness and suitability of SCAN for long-term deployment in real-world settings.
The strength of SCAN lies not only in its empirical performance, but also in its architectural design philosophy. By embedding adaptability into both the representation layer (through clustering) and the decision layer (via thresholding), SCAN proactively accounts for distributional uncertainty. This makes it particularly effective in environments where labeling is costly and continuous retraining is impractical.
However, SCAN has limitations. The fixed cluster structure can lead to instability in small or sparsely populated clusters, and the static assignment of new samples to existing clusters may reduce flexibility when entirely novel behavioral patterns emerge.
In future work, several directions are available to enhance the current detection framework. One potential extension is to replace or complement the GMM structure with a Latent Variable Model (LVM). Unlike GMMs, LVMs can capture richer semantic representations and model more flexible inter-cluster relationships. This capability could enable the framework to better characterize the complex and evolving behavior patterns of malicious applications.
Another promising direction is the integration of online learning mechanisms. In real-world deployment, malware distributions evolve continuously. An online architecture would allow both classifier parameters and cluster-specific thresholds to be updated incrementally, enabling real-time adaptation to distributional drift without the need for full retraining. Additionally, further improvements could be achieved through a progressive cluster adaptation strategy. For example, cluster centers could be dynamically tracked, merged, split, or newly initialized in response to emerging patterns. Such adaptive cluster management would provide greater temporal flexibility, allowing the system to evolve in response to changes in malware behavior.
Acknowledgement: During the preparation of this manuscript, the authors utilized ChatGPT (GPT-4 series) and Gemini 3 for assistance in literature trend analysis and language translation. The authors have carefully reviewed and revised the output and accepted full responsibility for all content.
Funding Statement: This work was supported in part by Basic Science Research Program through the National Research Foundation of Korea (NRF) funded by the Ministry of Science and ICT (No. 2021R1A2C2012574); and in part by the IITP (Institute of Information & Communications Technology Planning & Evaluation)-ITRC (Information Technology Research Center) grant funded by the Korea government (Ministry of Science and ICT) (IITP-2025-RS-2023-00259967).
Author Contributions: The authors confirm contribution to the paper as follows: Conceptualization, Kyoungmin Roh and Seungmin Lee; data curation, Kyoungmin Roh and Seungmin Lee; investigation, Kyoungmin Roh; writing—original draft, Kyoungmin Roh and Seungmin Lee; validation, Seong-je Cho, Youngsup Hwang and Dongjae Kim; writing—review & editing, Seong-je Cho and Youngsup Hwang; supervision, Seong-je Cho; funding acquisition, Seong-je Cho; methodology, Youngsup Hwang and Dongjae Kim. All authors reviewed and approved the final version of the manuscript.
Availability of Data and Materials: The Android applications used to support the findings of this study can be downloaded from AndroZoo (available at https://androzoo.uni.lu/). The feature data that support the findings of this study are available from the Corresponding Author, Seong-je Cho, upon reasonable request.
Ethics Approval: Not applicable.
Conflicts of Interest: The authors declare no conflicts of interest.
Appendix A Deduplication Analysis and Experimental Results
This appendix presents the full results of the deduplication experiment performed on the original dataset. To construct the fully deduplicated version, metadata fields (label, year, and package identifiers) were removed, and samples sharing identical feature vectors were collapsed into unique instances. Table A1 summarizes the resulting dataset composition.
Appendix A.1 Class Distribution after Deduplication
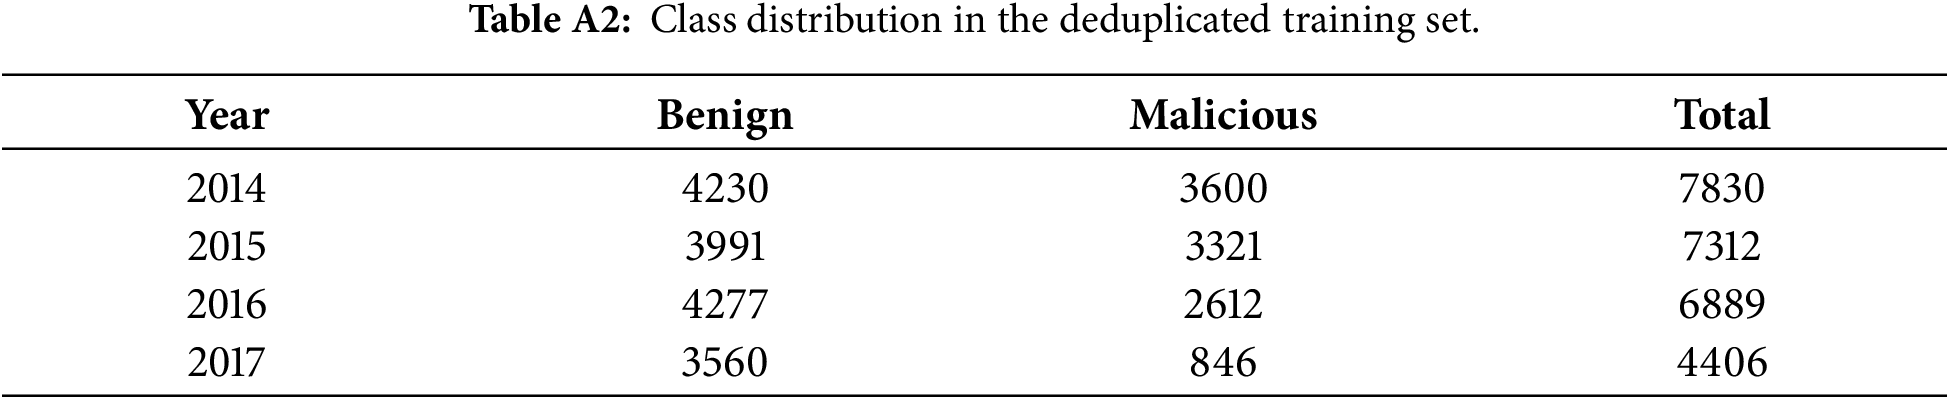
Deduplication significantly altered class balance across years. The training portion shifted from a near 1:1 ratio to approximately 1.2:1 benign-malicious. The effect was more pronounced in the testing years, where several periods became highly imbalanced. Tables A2 and A3 report the class distributions after deduplication.
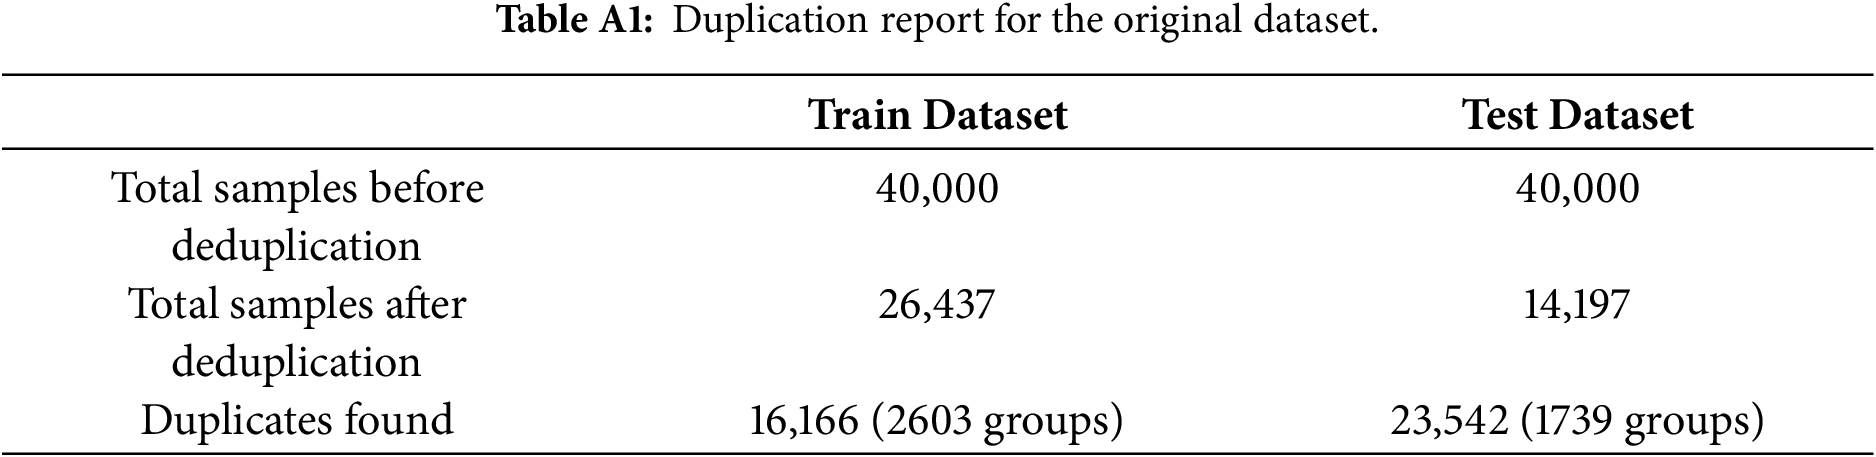
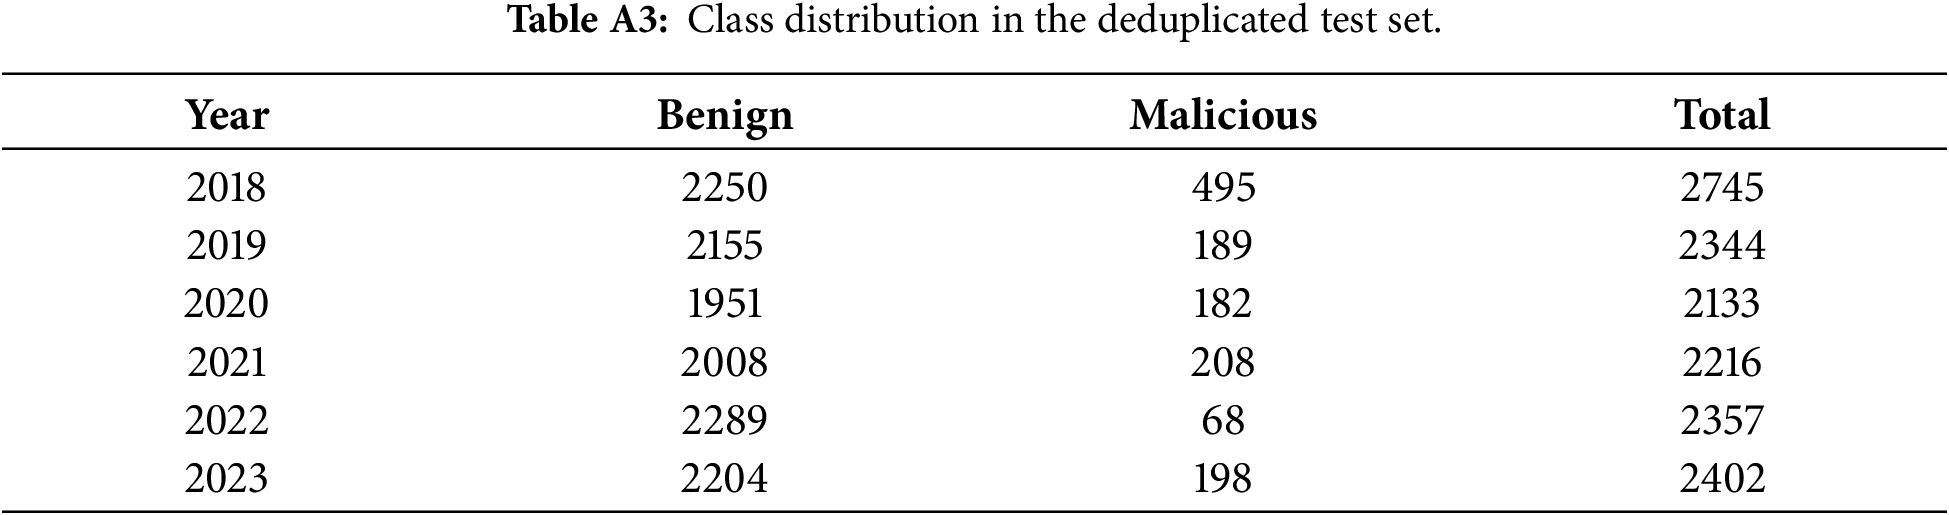
In several years (e.g., 2020 and 2022), the benign–malicious ratio exceeded 10:1 and 30:1, respectively, exceeding typical imbalance scenarios encountered in malware research.
Appendix A.2 Effect on Temporal Drift
To quantify distributional shifts introduced by deduplication, KL divergence was computed between the deduplicated training set and each test year. Without smoothing, several years produced infinite KL divergence values due to complete feature drop-out in malicious samples. After applying Laplace smoothing, divergence values became measurable, and the trend is reported in Table A4 and Fig. A1.
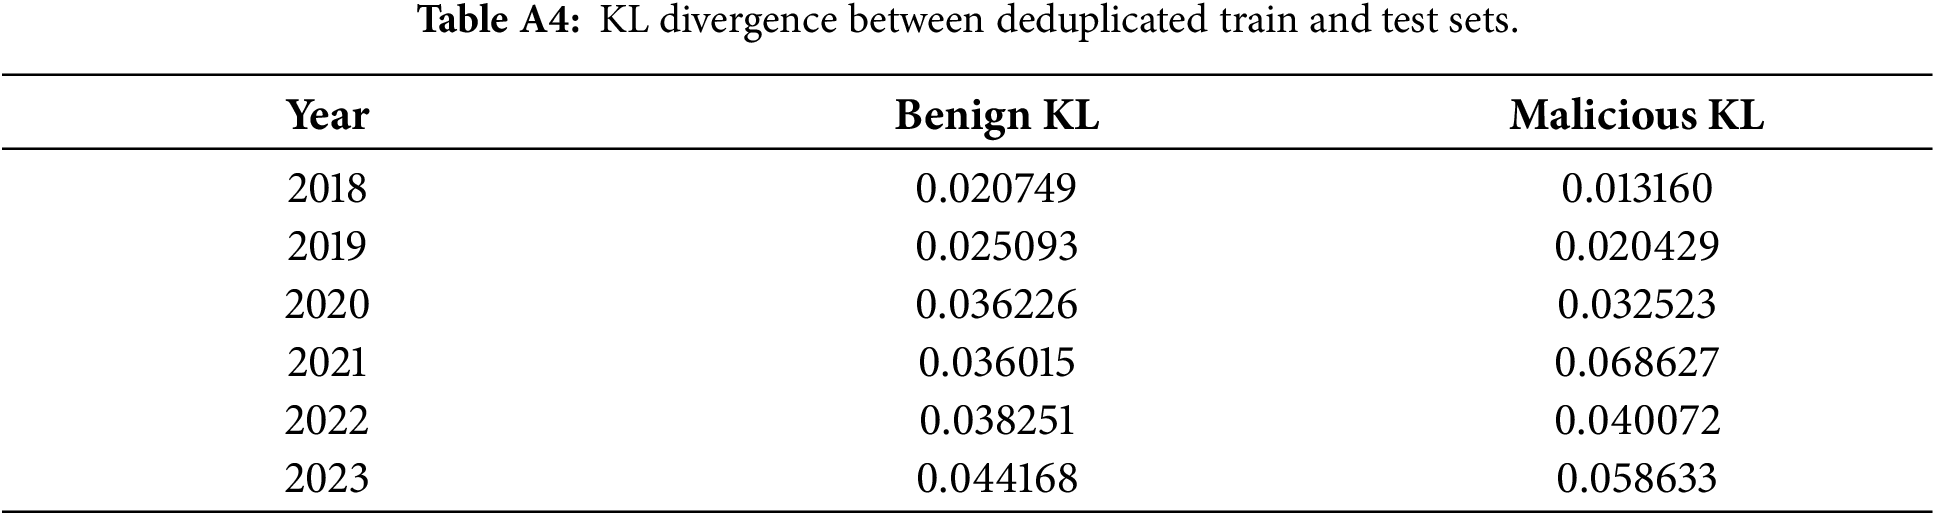
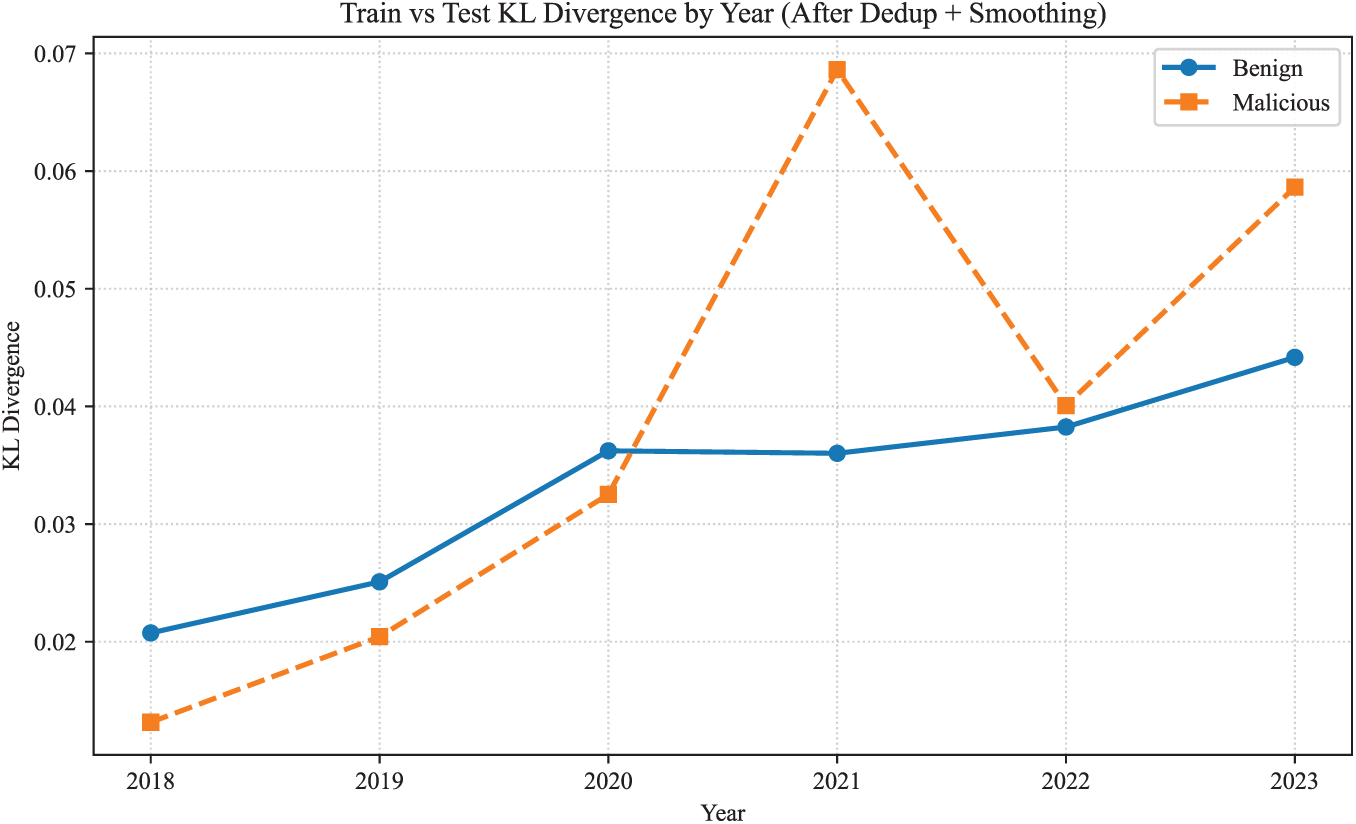
Figure A1: Train vs. Test KL Divergence by Year.
Appendix A.3 Summary
The results indicate that deduplication:
• introduced substantial and inconsistent class imbalance across years.
• increased temporal drift, particularly in malicious samples.
• removed behaviorally relevant variants rather than redundant noise.
These effects suggest that full deduplication alters the underlying ecosystem representation and does not yield a more realistic distribution for temporal malware analysis.
Appendix B Gaussianity Diagnostics and Validation of GMM Modeling
To validate the suitability of GMMs for clustering the 1848-dimensional API-call feature space, we empirically examined the distributional properties of the training set (2014–2017). The goal of this analysis is not to assume global Gaussianity, but to verify whether mixture-based modeling with diagnoal covariance matricies is appropriate and numerically stable in this domain.
Appendix B.1 Marginal Distribution Analysis
We applied the Kolmogorov-Smirnov (KS) test to all 1848 feature marginals. Representative results for 10 API calls are shown in Table A5.
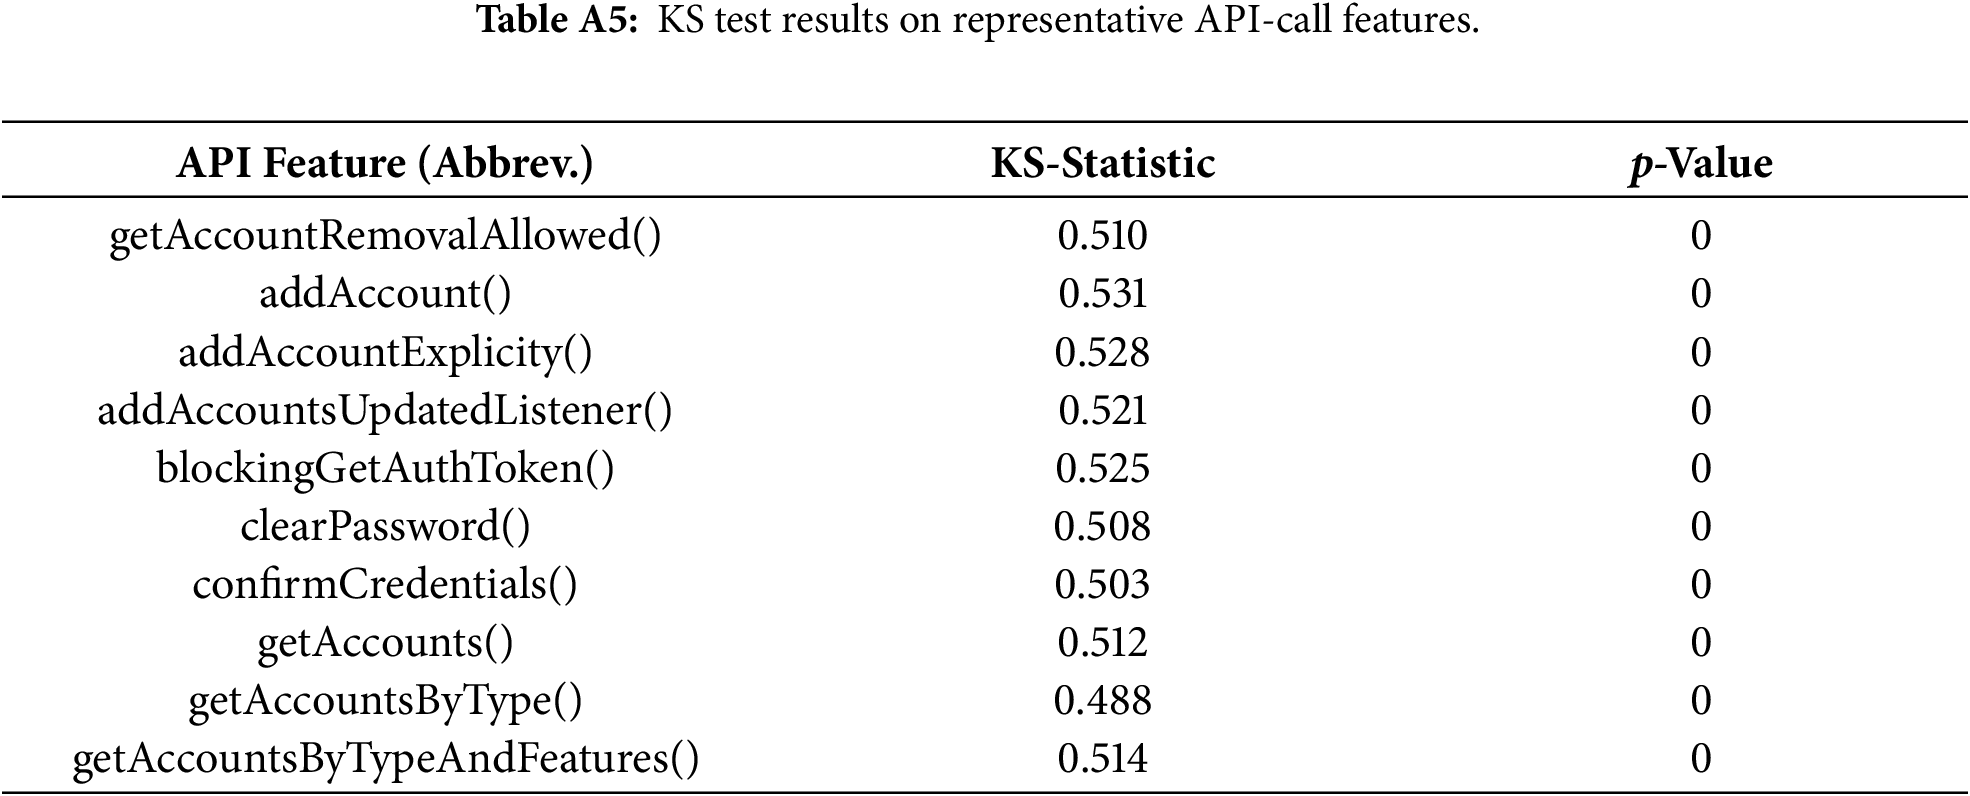
Most marginals deviate from a univariate Gaussian distribution; this behavior is expected because API-call frequencies are sparse, zero-inflated, and discrete. The KS test confirms non-Gaussianity but also highlights heterogeneous marginal structures that are consistent with mixture modeling rather than single global density.
Appendix B.2 Sahpiro-Wilk Normality Test
We additionally ran the Shapiro-Wilk test on 10 randomly selected features (2000 samples each). Results are reported in Table A6.
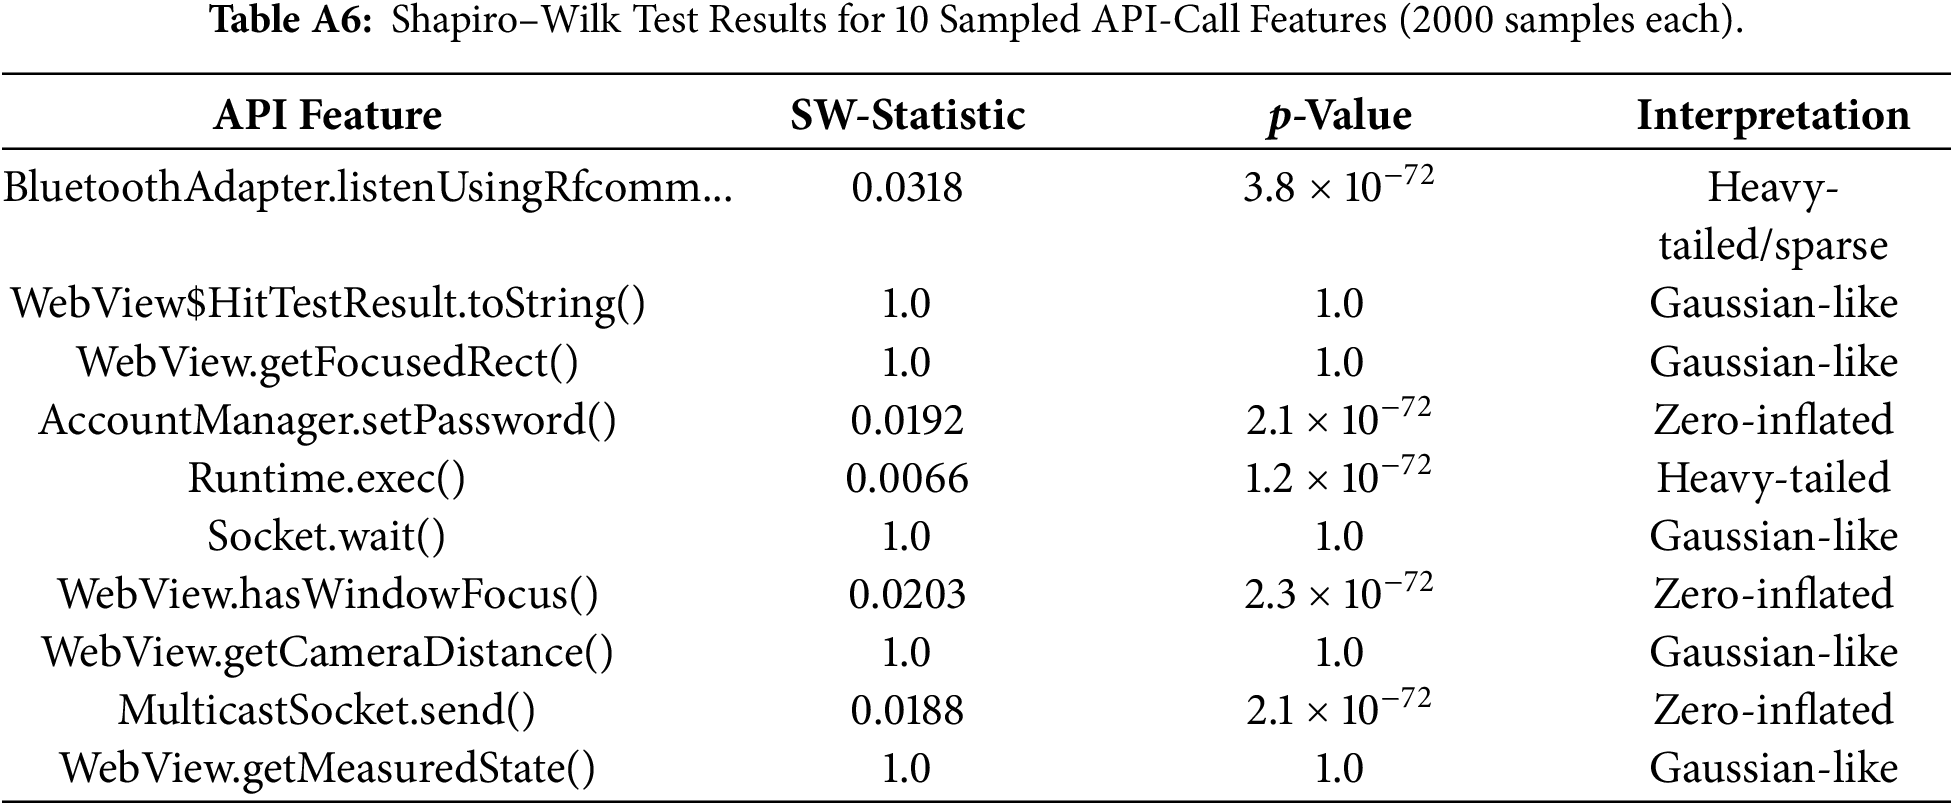
The marginals display diverse behaviors—Gaussian-like, heavy-tailed, and zero-inflated. This heterogeneity supports the use of a mixture model over any single distributional assumption.
Appendix B.3 Q-Q Plots and Marginal Histograms
Representative Q-Q Plots and histograms illustrate (i) approximately Gaussian-like marginals, (ii) zero-inflated distributions, and (iii) heavy-tailed distributions. The Q-Q plots and histograms are shown in Figs. A2 and A3.
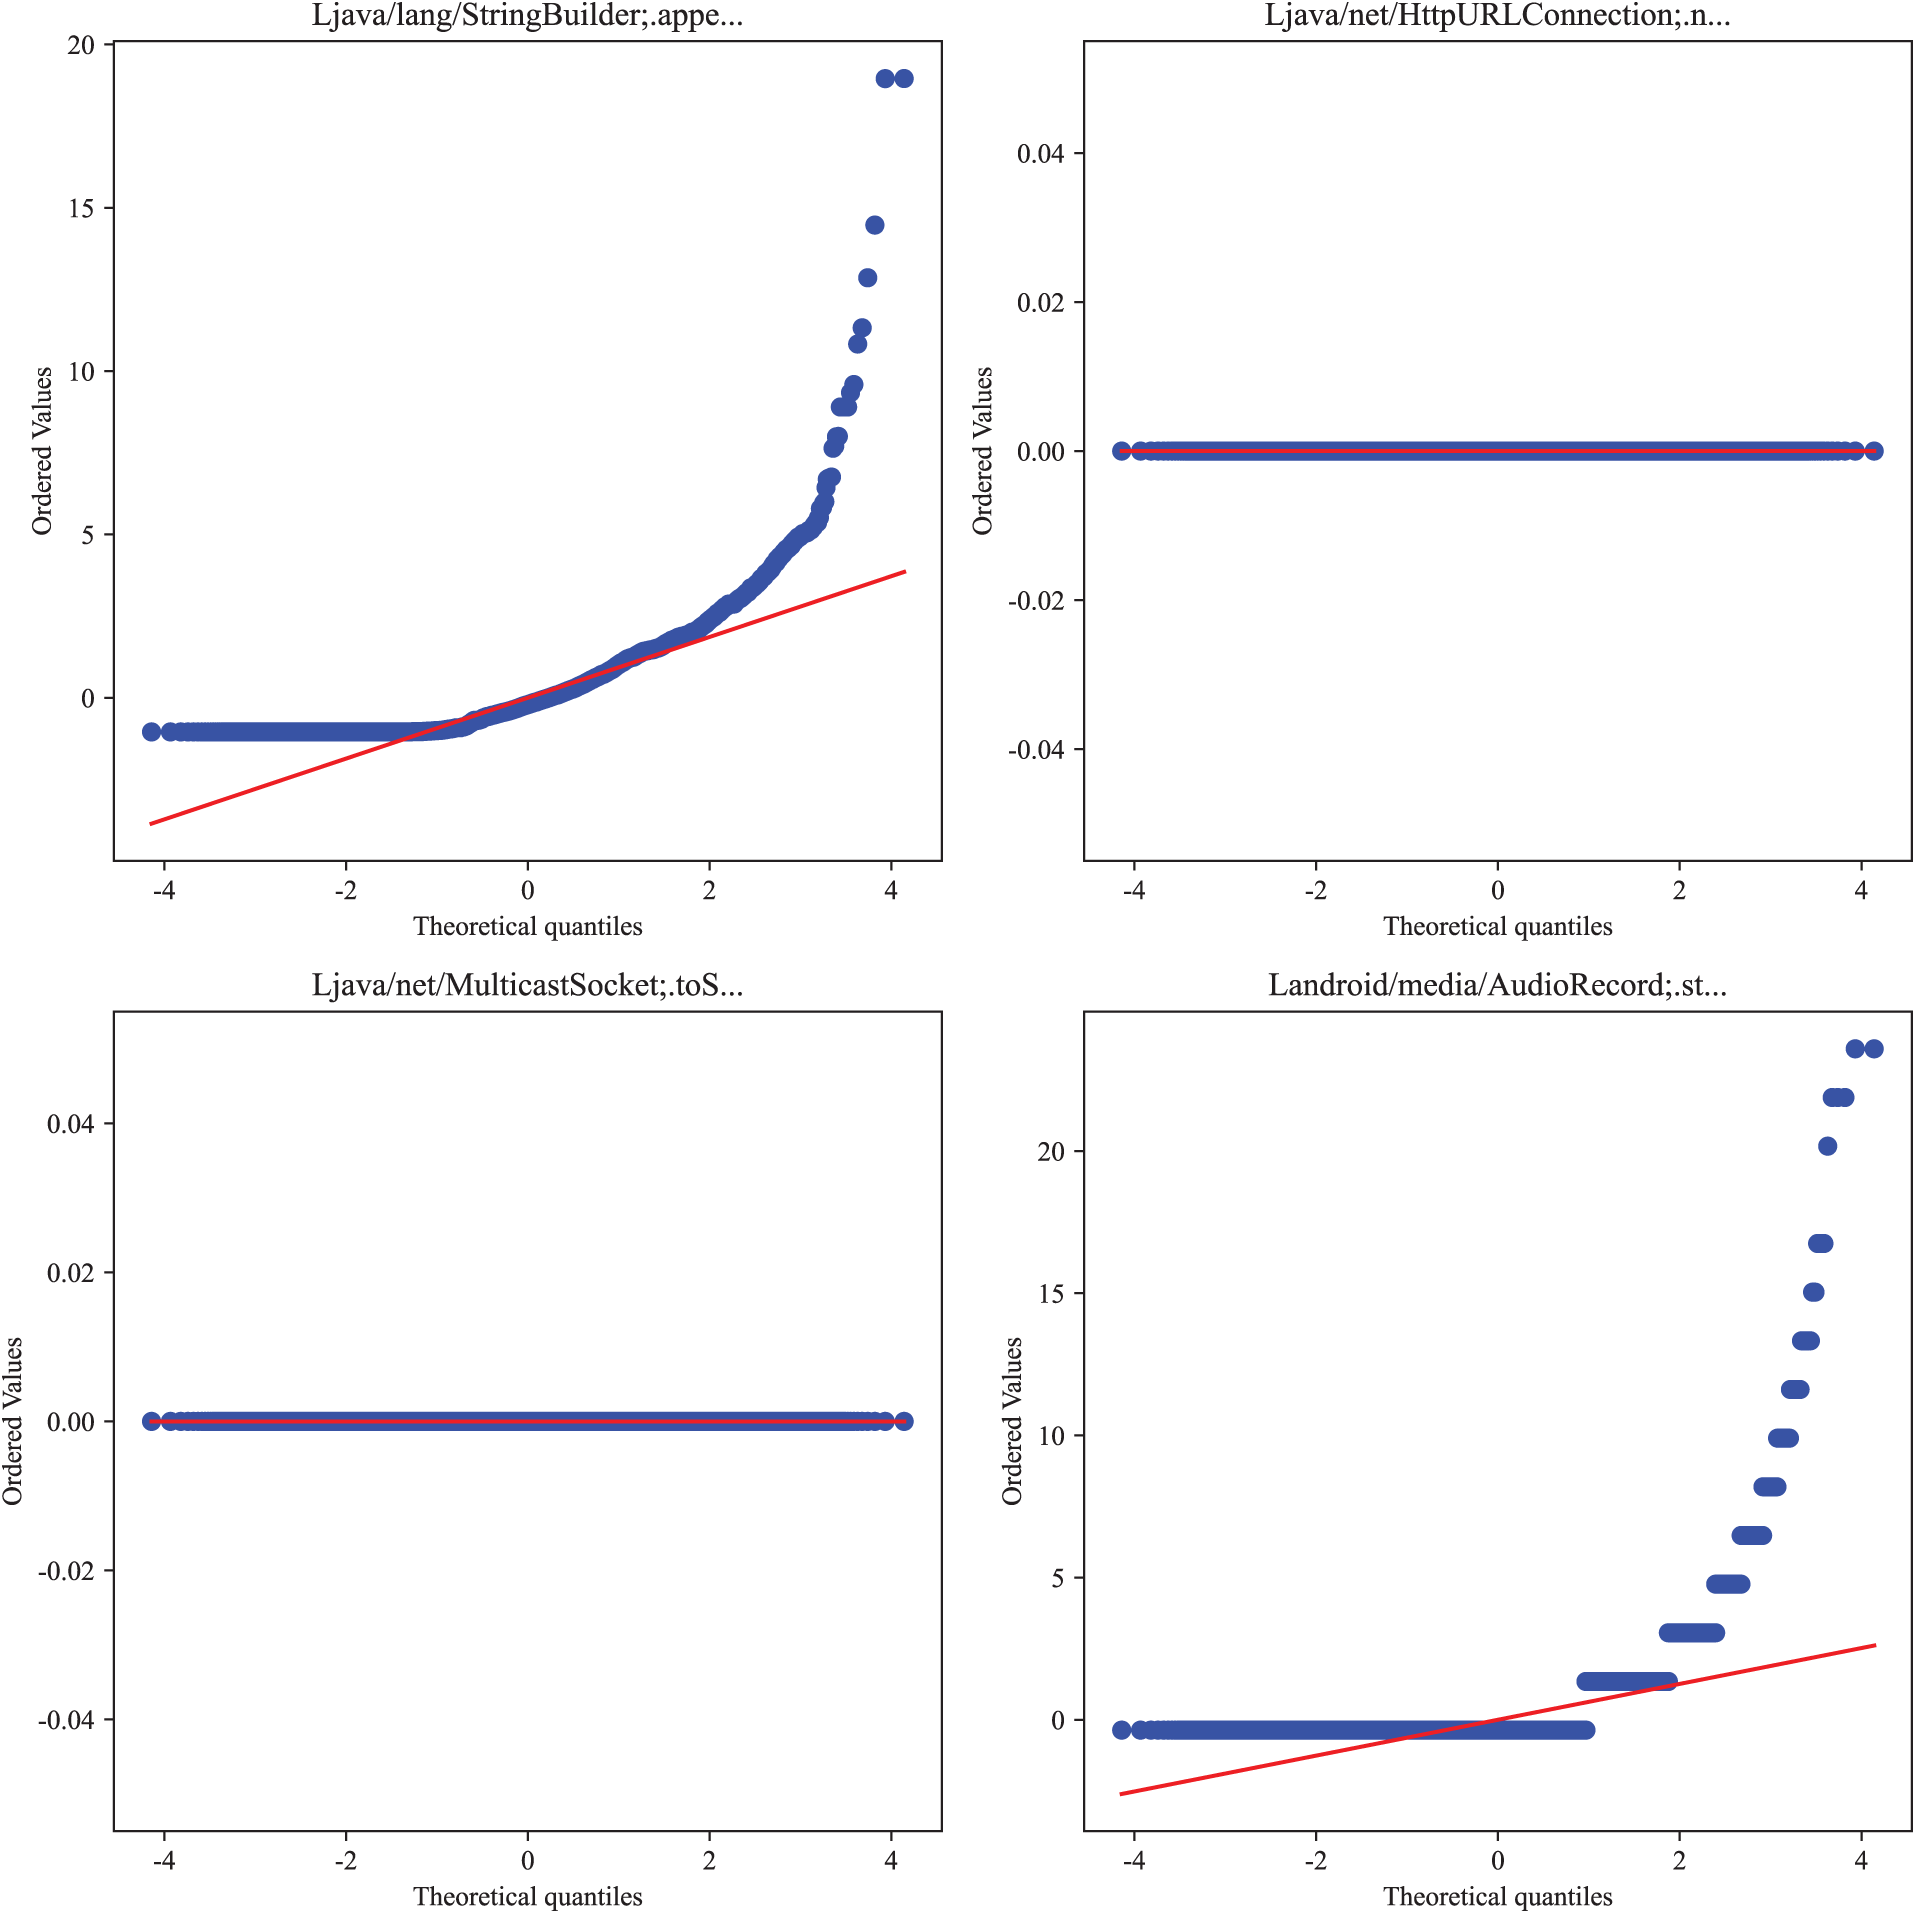
Figure A2: Q-Q Plots.
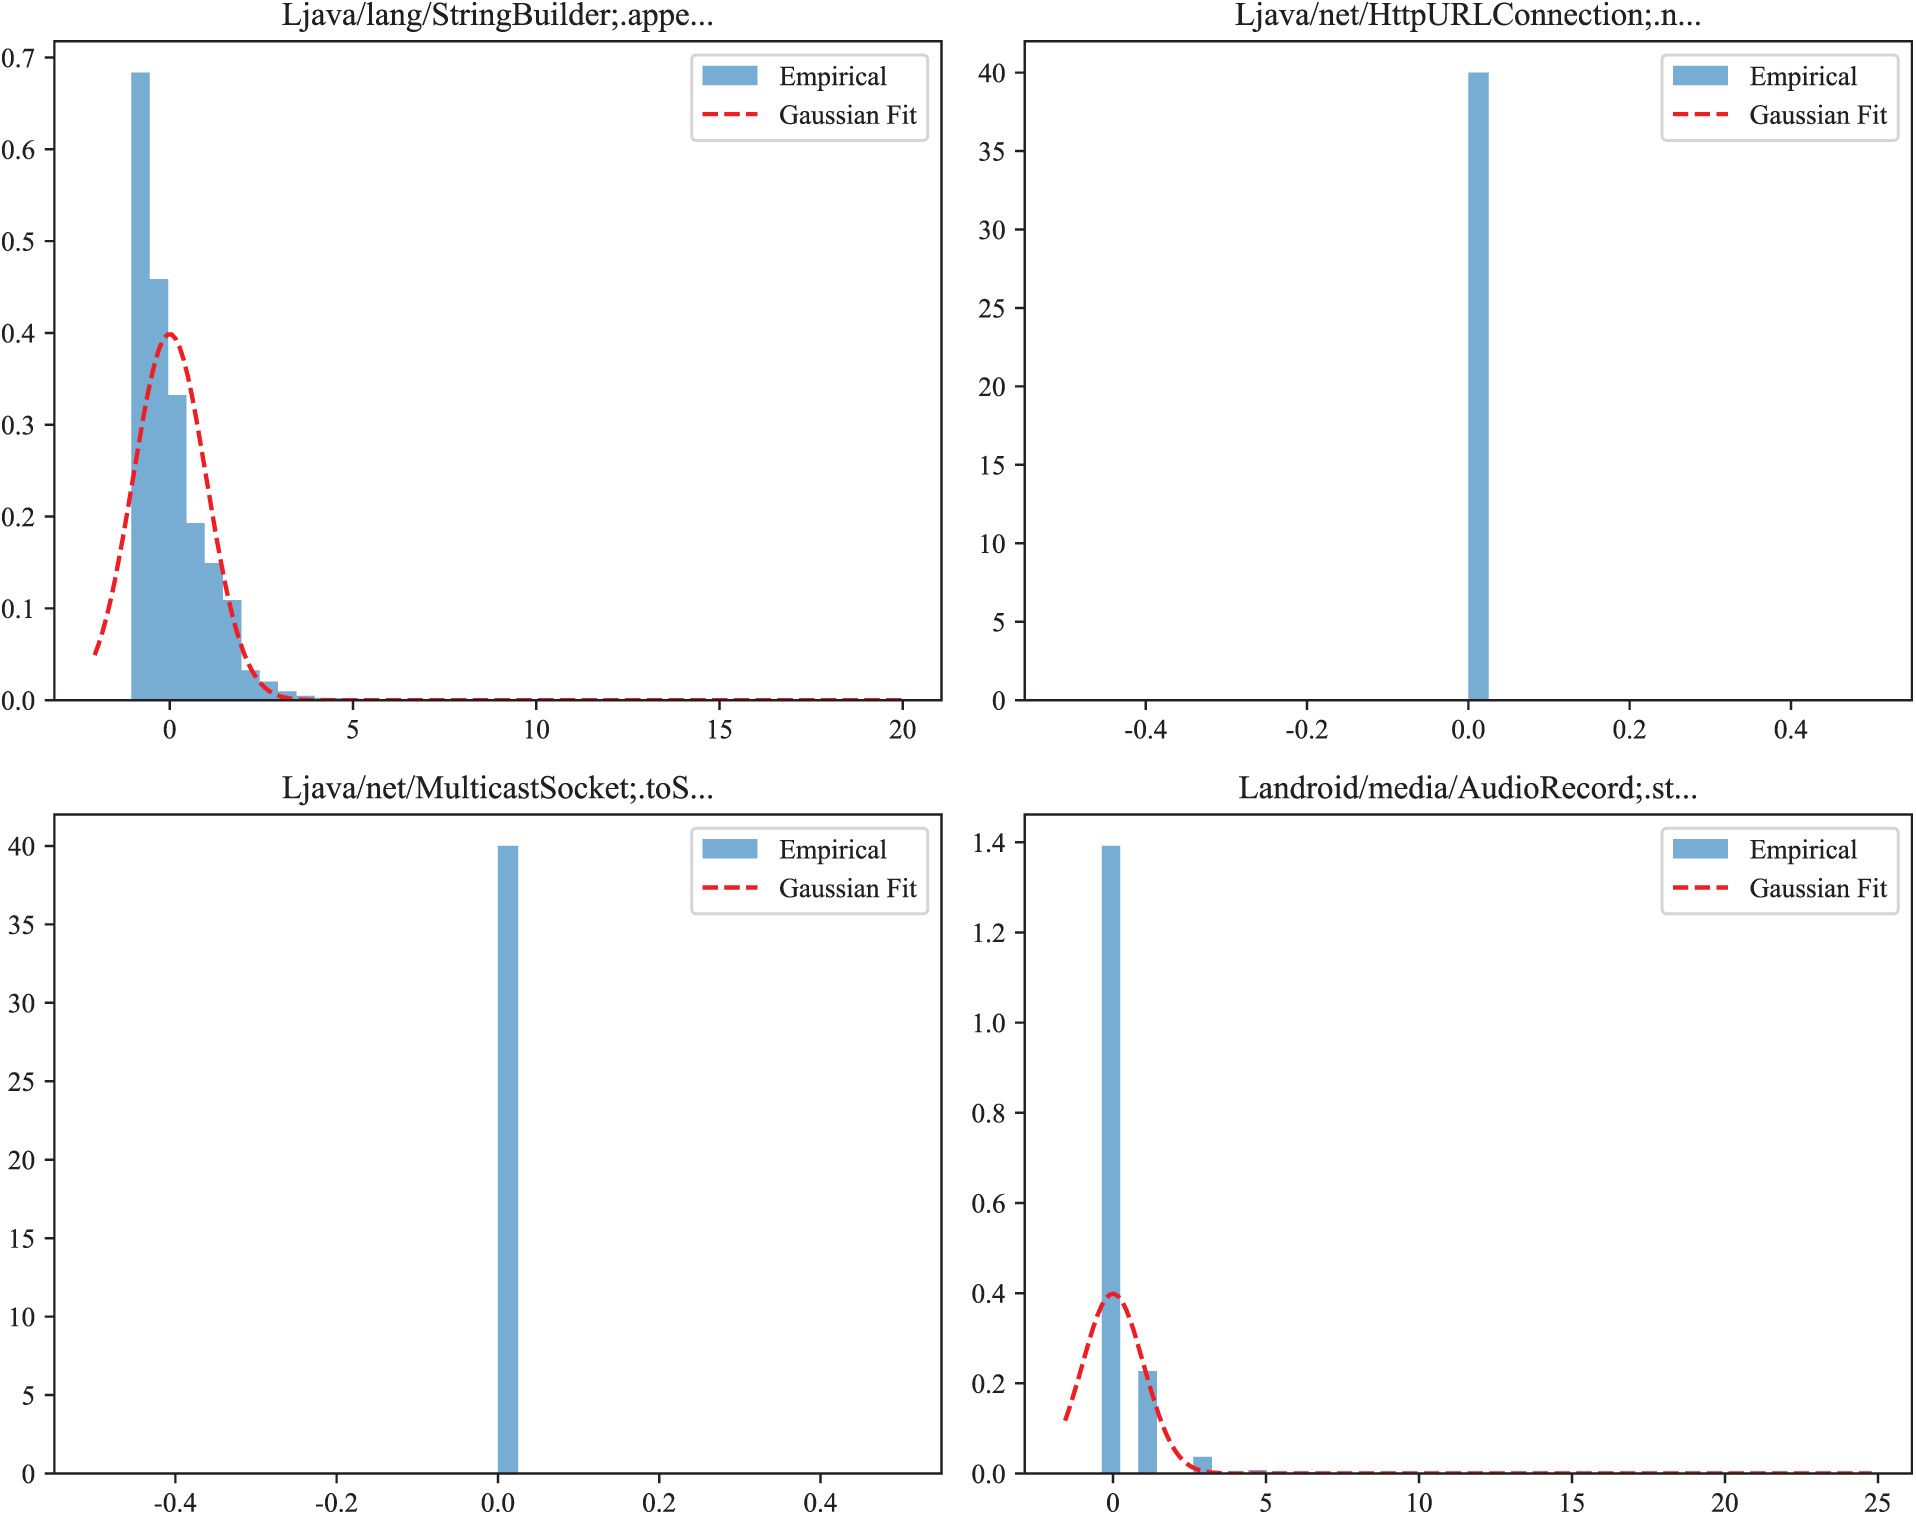
Figure A3: Histograms.
The presence of multiple local modes and heterogeneous tails aligns with the assumptions behind Gaussian Mixtures, which model such variability through multiple components.
Appendix B.4 Covariance Diagnostics and Choice of Diagonal Covariance
To evaluate the stability of Gaussian Mixture Models in a 1848-dimensional space, we examined the eigenvalue spectrum of the empirical covariance matrix.
As shown in Table A7 and Fig. A4, the covariance matrix exhibits extremely small eigenvalues and a very high condition number, indicating near-singular behavior. Over 95% of eigenvalues are close to zero, confirming that a full-covariance GMM would be numerically unstable and prone to singularity during EM updates. These diagnostics justify the adoption of a diagonal-covariance GMM in our framework.
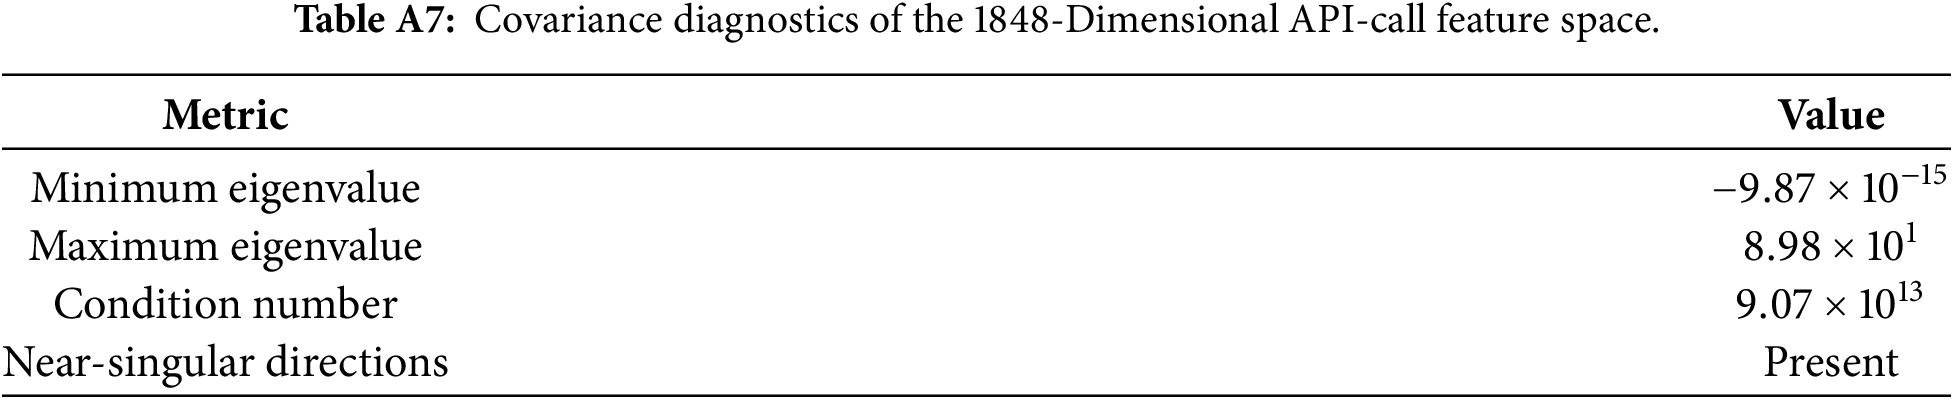
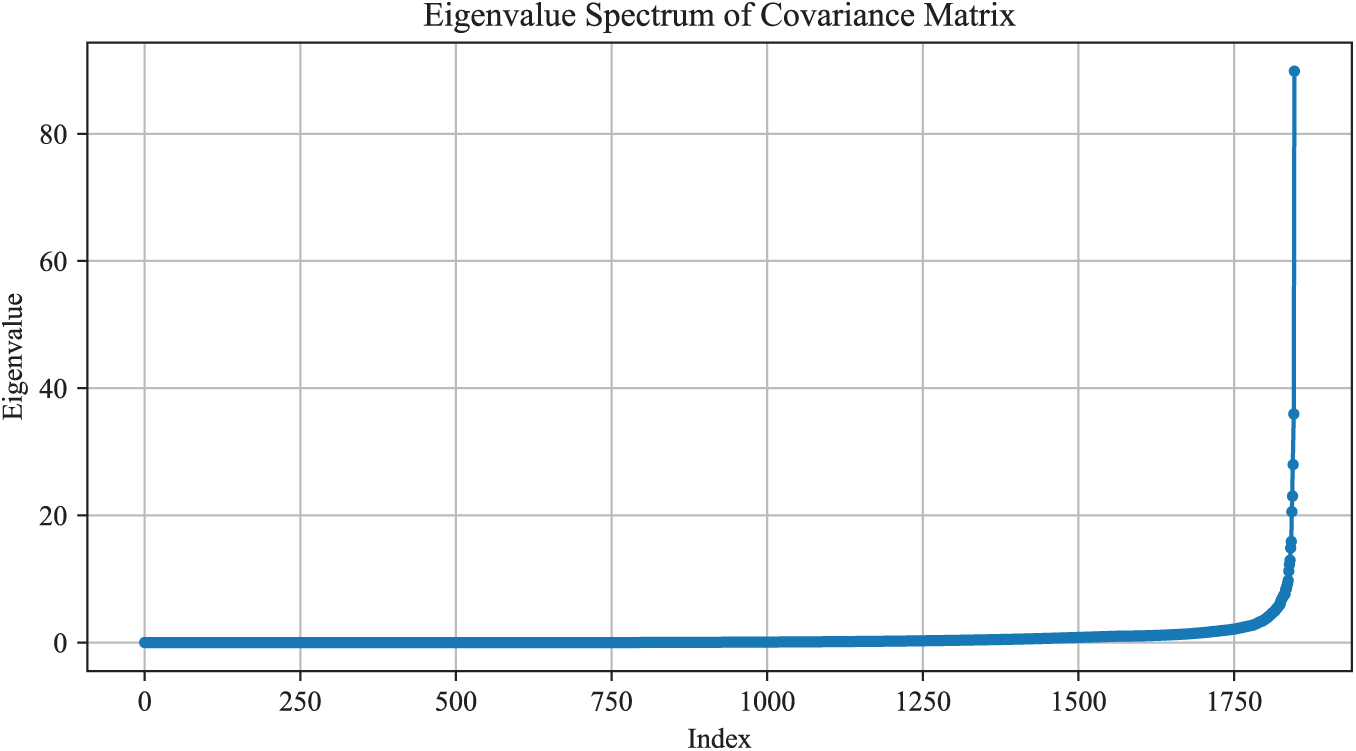
Figure A4: Eigenvalue spectrum of the covariance matrix.
Appendix C Sensitivity Analysis of the Adaptive Threshold Parameter
This appendix presents the full sensitivity analysis conducted to evaluate the effect of the adaptive-threshold coefficient
Appendix C.1 Experimental Setup
We varied
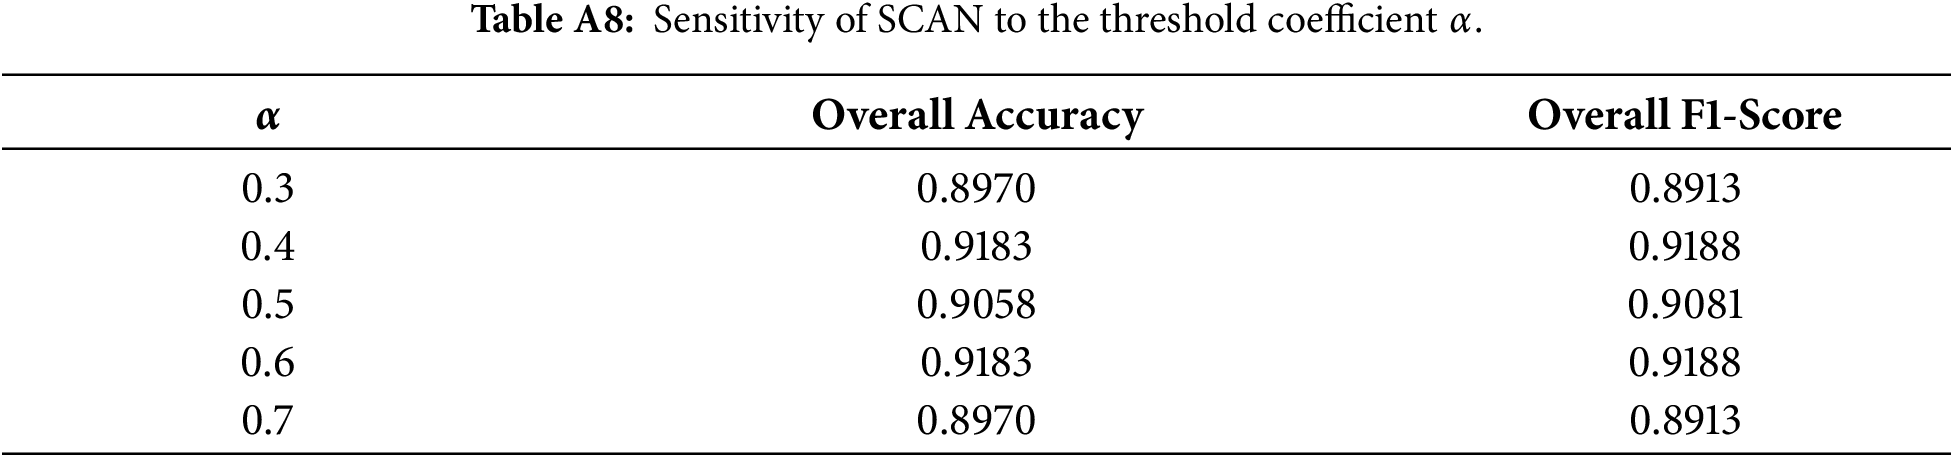
Appendix C.2 Interpretation
The results show three key findings:
(1) Stability around the midpoint.
Performance remains highest and most stable in the neighborhood of
(2) Symmetric degradation.
Both accuracy and F1-score degrade symmetrically as
(3) Justification for
Because
Overall, the sensitivity analysis confirms that SCAN is not fragile with respect to the choice of
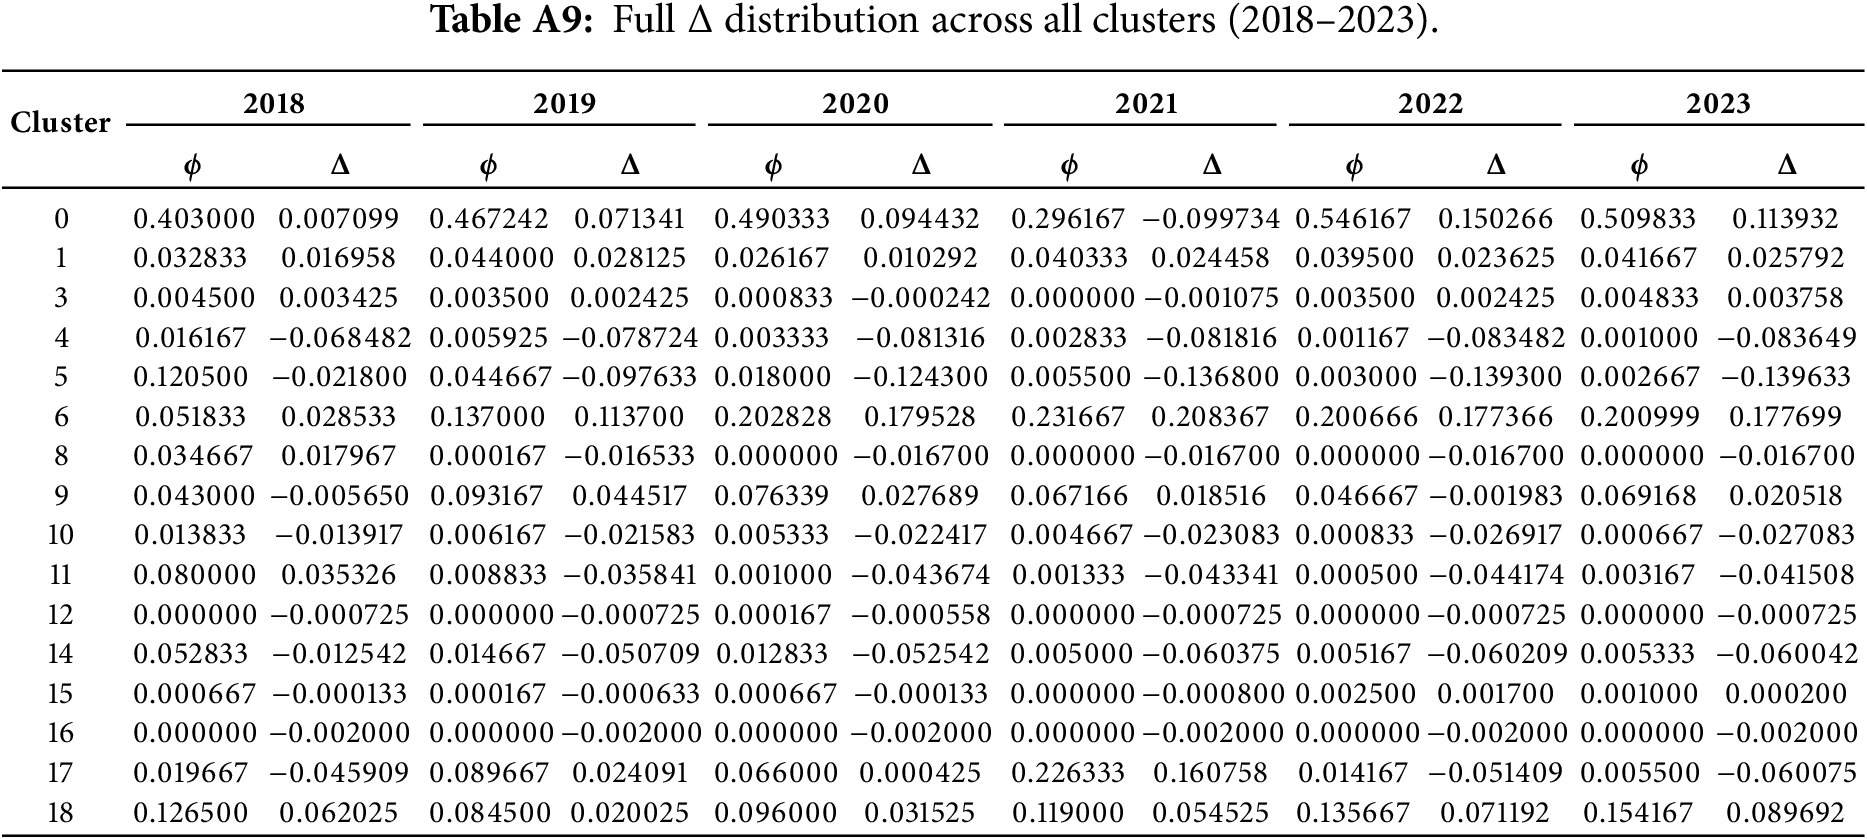
Appendix D Full
In this appendix, we report the complete deviation values
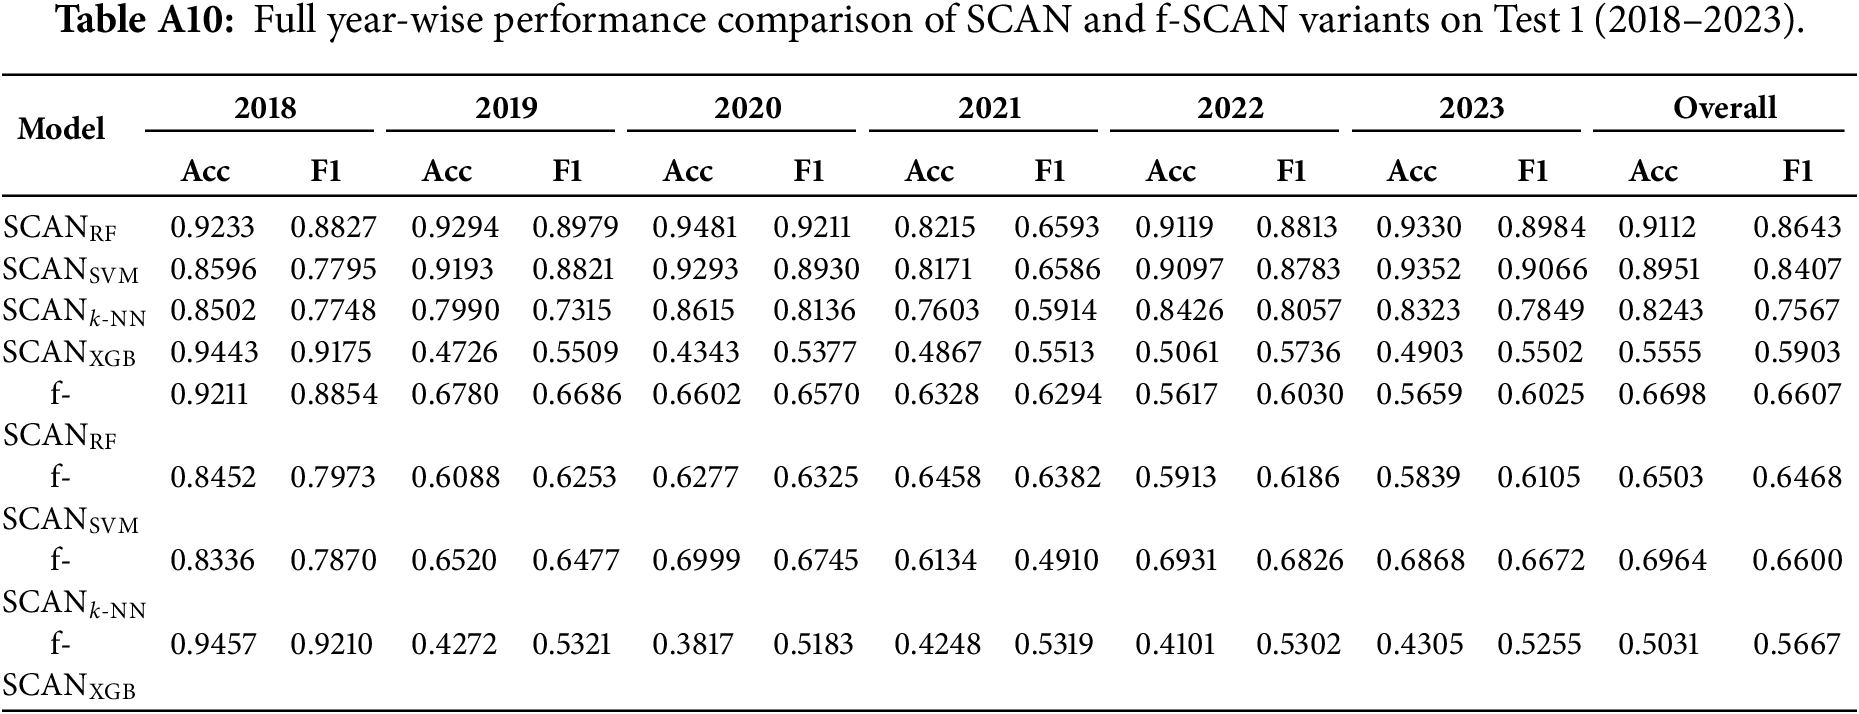
Appendix E Full Comparison of All Classifiers on Test 1
This appendix summarizes the performance of all SCAN variants and fixed-threshold models (f-SCAN) evaluated under the Test 1 setting. The Table A10 reports the full year-wise performance.
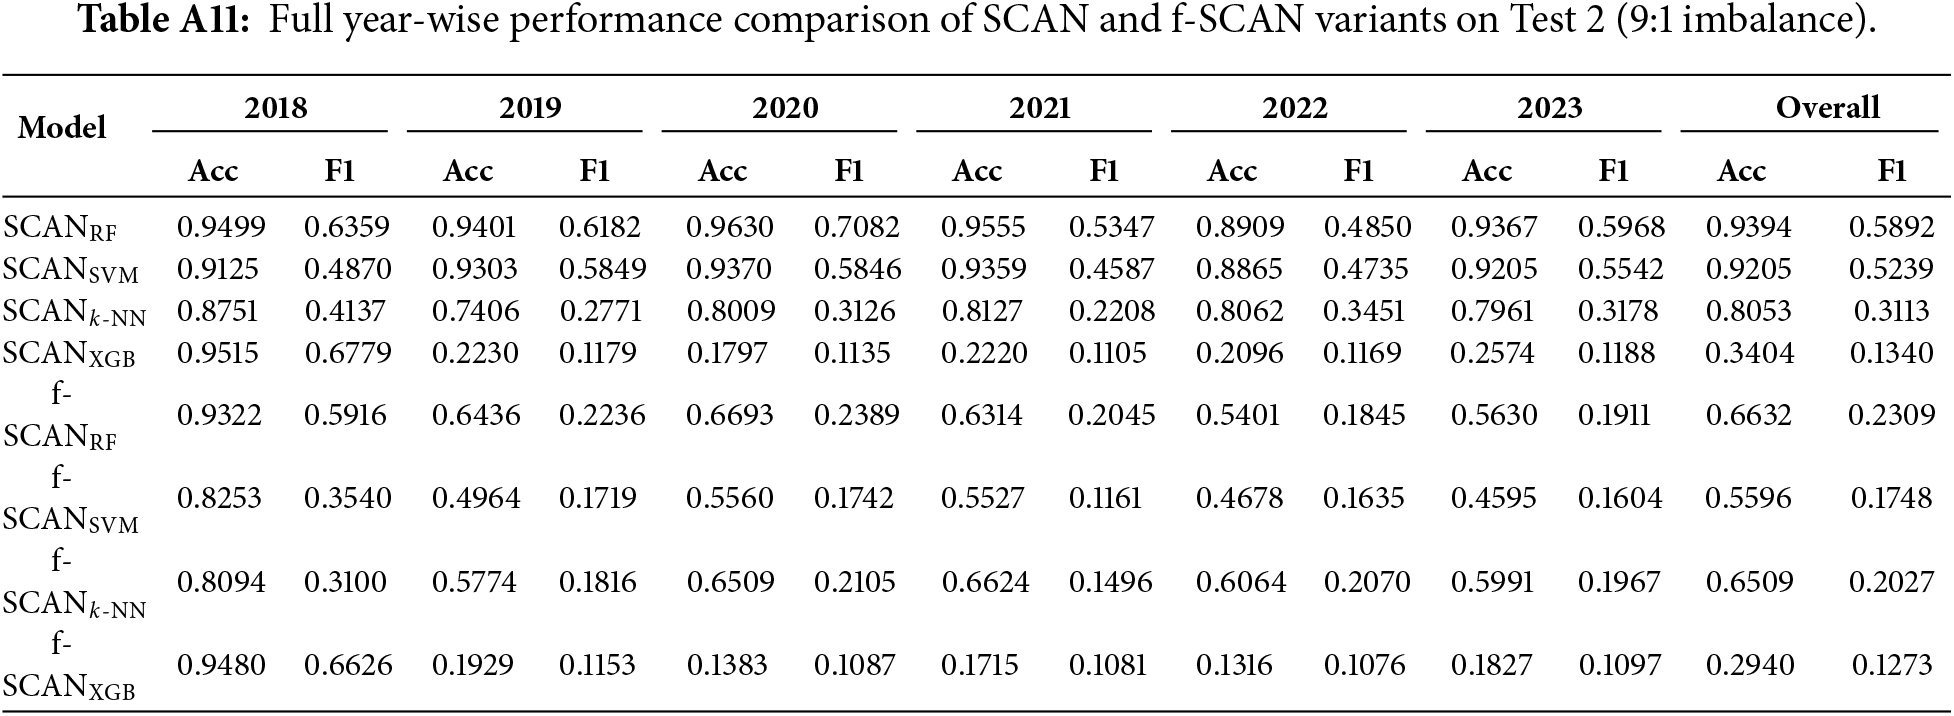
Appendix F Full Comparison of All Classifiers on Test 2
This appendix reports the complete performance metrics for all SCAN variants under the Test 2 setting, where the test distribution follows a realistic 9:1 benign-malicious ratio. Table A11 shows the complete performance metrics.
References
1. Comparitech. 20+ Android malware statistics and facts for 2024. [cited 2025 Apr 29]. Available from: https://www.comparitech.com/blog/vpn-privacy/20-current-android-malware-stats/. [Google Scholar]
2. Shu L, Dong S, Su H, Huang J. Android malware detection methods based on convolutional neural network: a survey. IEEE Trans Emerg Top Comput Intell. 2023;7(5):1330–50. doi:10.1109/tetci.2023.3281833. [Google Scholar] [CrossRef]
3. Yang H, Wang Y, Zhang L, Cheng X, Hu Z. A novel Android malware detection method with API semantics extraction. Comput Secur. 2024;137:103651. doi:10.1016/j.cose.2023.103651. [Google Scholar] [CrossRef]
4. Razgallah A, Khoury R, Hallé S, Khanmohammadi K. A survey of malware detection in Android apps: recommendations and perspectives for future research. Comput Sci Rev. 2021;39(3):100358. doi:10.1016/j.cosrev.2020.100358. [Google Scholar] [CrossRef]
5. Chan PPK, Song WK. Static detection of Android malware by using permissions and API calls. In: Proceedings of the 2014 International Conference on Machine Learning and Cybernetics; 2014 Jul 13–16; Lanzhou, China. p. 82–7. doi:10.1109/icmlc.2014.7009096. [Google Scholar] [CrossRef]
6. Muzaffar A, Ragab Hassen H, Lones MA, Zantout H. Android malware detection using API calls: a comparison of feature selection and machine learning models. In: Ragab Hassen H, Batatia H, editors. Proceedings of the International Conference on Applied CyberSecurity (ACS) 2021; 2021 Nov 13–14; Dubai, United Arab Emirates. Cham, Switwerland: Springer International Publishing; 2022. p. 3–12. doi:10.1007/978-3-030-95918-0_1. [Google Scholar] [CrossRef]
7. Mahindru A, Arora H, Kumar A, Gupta SK, Mahajan S, Kadry S, et al. PermDroid a framework developed using proposed feature selection approach and machine learning techniques for Android malware detection. Sci Rep. 2024;14(1):10724. doi:10.1038/s41598-024-60982-y. [Google Scholar] [PubMed] [CrossRef]
8. Polatidis N, Kapetanakis S, Trovati M, Korkontzelos I, Manolopoulos Y. FSSDroid: feature subset selection for Android malware detection. World Wide Web. 2024;27(5):50. doi:10.1007/s11280-024-01287-y. [Google Scholar] [CrossRef]
9. Wu Y, Li M, Zeng Q, Yang T, Wang J, Fang Z, et al. DroidRL: feature selection for Android malware detection with reinforcement learning. Comput Secur. 2023;128(1):103126. doi:10.1016/j.cose.2023.103126. [Google Scholar] [CrossRef]
10. Pathak A, Barman U, Kumar TS. Machine learning approach to detect Android malware using feature-selection based on feature importance score. J Eng Res. 2025;13(2):712–20. doi:10.1016/j.jer.2024.04.008. [Google Scholar] [CrossRef]
11. Wu Y, Shi J, Wang P, Zeng D, Sun C. DeepCatra: learning flow- and graph-based behaviors for android malware detection. arXiv:2201.12876. 2022. doi:10.48550/arxiv.2201.12876. [Google Scholar] [CrossRef]
12. Nasser AR, Hasan AM, Humaidi AJ. DL-AMDet: deep learning-based malware detector for Android. Intell Syst Appl. 2024;21(6):200318. doi:10.1016/j.iswa.2023.200318. [Google Scholar] [CrossRef]
13. Anusha M, Karthika M. Deep learning based maldroid stacked propagate network for Android malware prediction for security enhancement. Indian J Sci Technol. 2024;17(45):4743–55. doi:10.17485/ijst/v17i45.3099. [Google Scholar] [CrossRef]
14. Chen Y, Ding Z, Wagner D. Continuous learning for android malware detection. In: Proceedings of the 32nd USENIX Security Symposium (USENIX Security 23); 2023 Aug 9–11; Anaheim, CA, USA. Washington, DC, USA: USENIX Association; 2023 [cited 2025 Jan 1]. Available from: https://www.usenix.org/conference/usenixsecurity23/presentation/chen-yizheng. p. 1127–44. [Google Scholar]
15. Guerra-Manzanares A, Bahsi H. Experts still needed: boosting long-term Android malware detection with active learning. J Comput Virol Hacking Tech. 2024;20(4):901–18. doi:10.1007/s11416-024-00536-y. [Google Scholar] [CrossRef]
16. Alam MT, Fieblinger R, Mahara A, Rastogi N. MORPH: towards automated concept drift adaptation for malware detection. arXiv:2401.12790. 2024. doi:10.48550/arxiv.2401.12790. [Google Scholar] [CrossRef]
17. Aniket Mishra MS. Cluster analysis and concept drift detection in malware. arXiv:2502.14135. 2025. doi:10.48550/arXiv.2502.14135. [Google Scholar] [CrossRef]
18. Qin S, Chow KP. Improving Android malware detection in imbalanced data scenarios. In: Advances in digital forensics XX. Cham, Switzerland: Springer Nature; 2025. p. 183–200. doi:10.1007/978-3-031-71025-4_10. [Google Scholar] [CrossRef]
19. Carvalho M, Pinho AJ, Brás S. Resampling approaches to handle class imbalance: a review from a data perspective. J Big Data. 2025;12(1):71. doi:10.1186/s40537-025-01119-4. [Google Scholar] [CrossRef]
20. Almajed H, Alsaqer A, Frikha M. Imbalance datasets in malware detection: a review of current solutions and future directions. Int J Adv Comput Sci Appl. 2025;16(1):1323. doi:10.14569/ijacsa.2025.01601126. [Google Scholar] [CrossRef]
21. Souza JVS, Vieira CB, Cavalcanti GDC, Cruz RMO. Imbalanced malware classification: an approach based on dynamic classifier selection. arXiv:2504.00041. 2025. doi:10.48550/arxiv.2504.00041. [Google Scholar] [CrossRef]
22. Li T, Luo Y, Wan X, Li Q, Liu Q, Wang R, et al. A malware detection model based on imbalanced heterogeneous graph embeddings. Expert Syst Appl. 2024;246(27):123109. doi:10.1016/j.eswa.2023.123109. [Google Scholar] [CrossRef]
23. Salehi A, Khedmati M. Hybrid clustering strategies for effective oversampling and undersampling in multiclass classification. Sci Rep. 2025;15(1):3460. doi:10.1038/s41598-024-84786-2. [Google Scholar] [PubMed] [CrossRef]
24. Paul MK, Pal B, Sattar AHMS, Siddique ASMMR, Al Mehedi Hasan M. CARBO: clustering and rotation based oversampling for class imbalance learning. Knowl Based Syst. 2024;300(1):112196. doi:10.1016/j.knosys.2024.112196. [Google Scholar] [CrossRef]
25. Hemmatian J, Hajizadeh R, Nazari F. Addressing imbalanced data classification with cluster-based reduced noise SMOTE. PLoS One. 2025;20(2):e0317396. doi:10.1371/journal.pone.0317396. [Google Scholar] [PubMed] [CrossRef]
26. Hefter A, Sendner C, Dmitrienko A. Metadata-based malware detection on android using machine learning. arXiv:2307.08547. 2023. doi:10.48550/arxiv.2307.08547. [Google Scholar] [CrossRef]
27. Alazab M, Alazab M, Shalaginov A, Mesleh A, Awajan A. Intelligent mobile malware detection using permission requests and API calls. Future Gener Comput Syst. 2020;107(4):509–21. doi:10.1016/j.future.2020.02.002. [Google Scholar] [CrossRef]
28. Rahima Manzil HH, Naik SM. DeepMetaDroid: real-time Android malware detection using deep learning and metadata features. Cloud Comput Data Sci. 2024;2024:203–25. doi:10.37256/ccds.5220244503. [Google Scholar] [CrossRef]
29. Cho W, Lee H, Han S, Hwang Y, Cho SJ. Sustainability of machine learning-based Android malware detection using API calls and permissions. In: Proceedings of the 2022 IEEE Fifth International Conference on Artificial Intelligence and Knowledge Engineering (AIKE); 2022 Sep 19–21; Laguna Hills, CA, USA. p. 18–25. doi:10.1109/aike55402.2022.00009. [Google Scholar] [CrossRef]
30. Kılıç K, Atacak İ, Doğru İA. FABLDroid: malware detection based on hybrid analysis with factor analysis and broad learning methods for Android applications. Eng Sci Technol Int J. 2025;62(5):101945. doi:10.1016/j.jestch.2024.101945. [Google Scholar] [CrossRef]
31. Hu Q, Wang W, Song H, Guo S, Zhang J, Zhang S. ASDroid: resisting evolving Android malware with API clusters derived from source code. IEEE Trans Inform Forensic Secur. 2025;20(3):1822–35. doi:10.1109/tifs.2025.3536280. [Google Scholar] [CrossRef]
32. AlSobeh AMR, Gaber K, Hammad MM, Nuser M, Shatnawi A. Android malware detection using time-aware machine learning approach. Clust Comput. 2024;27(9):12627–48. doi:10.1007/s10586-024-04484-6. [Google Scholar] [CrossRef]
33. Ravi V, Poornima AS. Designing a robust network traffic annotator and classifier using active learning technique. In: 2024 Asia Pacific Conference on Innovation in Technology (APCIT); 2024 Jul 26–27; Mysore, India. p. 1–5. doi:10.1109/apcit62007.2024.10673636. [Google Scholar] [CrossRef]
34. Park S, Lee H, Kim D, Jun Moon H, Cho SJ, Hwang Y, et al. Enhancing the sustainability of machine learning-based malware detection techniques for Android applications. IEEE Access. 2025;13:98876–87. doi:10.1109/access.2025.3576733. [Google Scholar] [CrossRef]
35. Li Y, Jang J, Hu X, Ou X. Android malware clustering through malicious payload mining. arXiv:1707.04795. 2017. doi:10.48550/arXiv.1707.04795. [Google Scholar] [CrossRef]
36. Zhang Y, Sui Y, Pan S, Zheng Z, Ning B, Tsang I, et al. Familial clustering for weakly-labeled Android malware using hybrid representation learning. IEEE Trans Inform Forensic Secur. 2020;15:3401–14. doi:10.1109/tifs.2019.2947861. [Google Scholar] [CrossRef]
37. Eslamnejad M, Taheri R, Shojafar M, Bader-El-Den M. Federatedlearning-based robust Android malware detection: label-flipping attacks and defenses. Neural Comput Appl. 2025;37(32):27057–82. doi:10.1007/s00521-025-11656-x. [Google Scholar] [CrossRef]
38. Esposito C, Landrum GA, Schneider N, Stiefl N, Riniker S. GHOST: adjusting the decision threshold to handle imbalanced data in machine learning. J Chem Inf Model. 2021;61(6):2623–40. doi:10.1021/acs.jcim.1c00160. [Google Scholar] [PubMed] [CrossRef]
39. Allix K, Bissyandé TF, Klein J, Le Traon Y. AndroZoo: collecting millions of Android apps for the research community. In: Proceedings of the 13th International Conference on Mining Software Repositories; 2016 May 14–15; Austin, TX, USA. New York, NY, USA: Association for Computing Machinery; 2016. p. 468–71. doi:10.1145/2901739.2903508. [Google Scholar] [CrossRef]
40. Alecci M, Jiménez PJR, Allix K, Bissyandé TF, Klein J. AndroZoo: a retrospective with a glimpse into the future. In: Proceedings of the 21st International Conference on Mining Software Repositories; 2024 Apr 15–16; Lisbon, Portugal. New York, NY, USA: Association for Computing Machinery; 2024. p. 389–93. doi:10.1145/3643991.3644863. [Google Scholar] [CrossRef]
41. Jung J, Park J, Cho SJ, Han S, Park M, Cho HH. Feature engineering and evaluation for android malware detection scheme. J Internet Technol. 2021;22(2):423–40. [Google Scholar]
42. Lee H, Cho SJ, Han H, Cho W, Suh K. Enhancing sustainability in machine learning-based Android malware detection using API calls. In: Proceedings of the 2022 IEEE Fifth International Conference on Artificial Intelligence and Knowledge Engineering (AIKE); 2022 Sep 19–21; Laguna Hills, CA, USA. p. 131–4. doi:10.1109/aike55402.2022.00028. [Google Scholar] [CrossRef]
43. Khanmohammadi K, Ebrahimi N, Hamou-Lhadj A, Khoury R. Empirical study of Android repackaged applications. Empir Softw Eng. 2019;24(6):3587–629. doi:10.1007/s10664-019-09760-3. [Google Scholar] [CrossRef]
44. Zhang F, Huang H, Zhu S, Wu D, Liu P. ViewDroid: towards obfuscation-resilient mobile application repackaging detection. In: Proceedings of the 2014 ACM Conference on Security and Privacy in Wireless & Mobile Networks; 2014 Jul 23–25; Oxford, UK. New York, NY, USA: Association for Computing Machinery; 2014. p. 25–36. doi:10.1145/2627393.2627395. [Google Scholar] [CrossRef]
45. Zhao Y, Li L, Wang H, Cai H, Bissyandé TF, Klein J, et al. On the impact of sample duplication in machine-learning-based Android malware detection. ACM Trans Softw Eng Methodol. 2021;30(3):1–38. doi:10.1145/3446905. [Google Scholar] [CrossRef]
46. Ceschin F, Botacin M, Gomes HM, Pinagé F, Oliveira LS, Grégio A. Fast & Furious: on the modelling of malware detection as an evolving data stream. Expert Syst Appl. 2023;212(2):118590. doi:10.1016/j.eswa.2022.118590. [Google Scholar] [CrossRef]
47. Augello A, De Paola A, Lo Re G. M2FD: mobile malware federated detection under concept drift. Comput Secur. 2025;152(7):104361. doi:10.1016/j.cose.2025.104361. [Google Scholar] [CrossRef]
48. Guerra-Manzanares A, Luckner M, Bahsi H. Android malware concept drift using system calls: detection, characterization and challenges. Expert Syst Appl. 2022;206:117200. doi:10.1016/j.eswa.2022.117200. [Google Scholar] [CrossRef]
49. Mulimani D, Patil PR, Totad SG. Adaptive classifier to address concept drift in imbalanced data streams. In: 2023 IEEE 2nd International Conference on Data, Decision and Systems (ICDDS); 2023 Dec 1–2; Mangaluru, India. p. 1–5. doi:10.1109/icdds59137.2023.10434793. [Google Scholar] [CrossRef]
50. Li Z, Huang W, Xiong Y, Ren S, Zhu T. Incremental learning imbalanced data streams with concept drift: the dynamic updated ensemble algorithm. Knowl Based Syst. 2020;195(4):105694. doi:10.1016/j.knosys.2020.105694. [Google Scholar] [CrossRef]
51. Ancy S, Paulraj D. Handling imbalanced data with concept drift by applying dynamic sampling and ensemble classification model. Comput Commun. 2020;153:553–60. doi:10.1016/j.comcom.2020.01.061. [Google Scholar] [CrossRef]
52. Akaike H. A new look at the statistical model identification. IEEE Trans Automat Contr. 1974;19(6):716–23. doi:10.1109/tac.1974.1100705. [Google Scholar] [CrossRef]
53. Dempster AP, Laird NM, Rubin DB. Maximum likelihood from incomplete data via the EM algorithm. J R Stat Soc Ser B Methodol. 1977;39(1):1–38. doi:10.1111/j.2517-6161.1977.tb01600.x. [Google Scholar] [CrossRef]
54. Gomez G, Kotzias P, Dell’Amico M, Bilge L, Caballero J. Unsupervised detection and clustering of malicious TLS flows. Secur Commun Netw. 2023;2023:3676692. doi:10.1155/2023/3676692. [Google Scholar] [CrossRef]
55. Arp D, Spreitzenbarth M, Hubner M, Gascon H, Rieck K, Siemens C. Drebin: effective and explainable detection of android malware in your pocket. Netw Distrib Syst Secur. 2014;14:23–6. doi:10.14722/ndss.2014.23247. [Google Scholar] [CrossRef]
56. Irolla P, Dey A. The duplication issue within the Drebin dataset. J Comput Virol Hacking Tech. 2018;14(3):245–9. doi:10.1007/s11416-018-0316-z. [Google Scholar] [CrossRef]
57. Pendlebury F, Pierazzi F, Jordaney R, Kinder J, Cavallaro L. {TESSERACT}: eliminating experimental bias in malware classification across space and time. In: Proceedings of the 28th USENIX Security Symposium (USENIX Security 19); 2019 Aug 14–16; Santa Clara, CA, USA. [cited 2025 Jan 1]. Available from: https://www.usenix.org/conference/usenixsecurity19/presentation/pendlebury. p. 729–46. [Google Scholar]
58. Tang W. Application of support vector machine system introducing multiple submodels in data mining. Syst Soft Comput. 2024;6(2):200096. doi:10.1016/j.sasc.2024.200096. [Google Scholar] [CrossRef]
59. Almasi ON, Rouhani M. Fast and de-noise support vector machine training method based on fuzzy clustering method for large real world datasets. Turk J Elec Eng Comp Sci. 2016;24:219–33. doi:10.3906/elk-1304-139. [Google Scholar] [CrossRef]
60. Khan L, Awad M, Thuraisingham B. A new intrusion detection system using support vector machines and hierarchical clustering. VLDB J. 2007;16(4):507–21. doi:10.1007/s00778-006-0002-5. [Google Scholar] [CrossRef]
61. Shen XJ, Mu L, Li Z, Wu HX, Gou JP, Chen X. Large-scale support vector machine classification with redundant data reduction. Neurocomputing. 2016;172(3):189–97. doi:10.1016/j.neucom.2014.10.102. [Google Scholar] [CrossRef]
62. Singh D, Roy D, Mohan CK. DiP-SVM: distribution preserving kernel support vector machine for big data. IEEE Trans Big Data. 2017;3(1):79–90. doi:10.1109/tbdata.2016.2646700. [Google Scholar] [CrossRef]
63. Liu Z, Wang R, Peng B, Qiu L, Gan Q, Wang C, et al. LDCDroid: learning data drift characteristics for handling the model aging problem in Android malware detection. Comput Secur. 2025;150(2):104294. doi:10.1016/j.cose.2024.104294. [Google Scholar] [CrossRef]
Cite This Article
 Copyright © 2026 The Author(s). Published by Tech Science Press.
This work is licensed under a Creative Commons Attribution 4.0 International License , which permits unrestricted use, distribution, and reproduction in any medium, provided the original work is properly cited.
 Downloads
 Citation Tools