
 Submit a Paper
 Propose a Special lssue
 Open Access
ARTICLE

Natural Frequency-Based Sensitivity Analysis of Pipe Systems with Uncertain Clamp Stiffness and Position Parameters
1 National Elite Institute of Engineering, Northwestern Polytechnical University, Xi’an, China
2 Shenyang Liming Aero Engine Corporation Limited, Aero Engine Corporation of China, Shenyang, China
3 Shenyang Engine Research Institute, Aero Engine Corporation of China, Shenyang, China
4 School of Mechanical Engineering and Automation, Northeastern University, Shenyang, China
* Corresponding Author: Xufang Zhang. Email:
(This article belongs to the Special Issue: Structural Reliability and Computational Solid Mechanics: Modeling, Simulation, and Uncertainty Quantification)
Computer Modeling in Engineering & Sciences 2026, 146(3), 13 https://doi.org/10.32604/cmes.2026.076624
Received 23 November 2025; Accepted 04 February 2026; Issue published 30 March 2026
 View Full Text
 Download PDF
Abstract
This paper introduces a computationally efficient global sensitivity analysis method for quantifying the influence of uncertain clamp support conditions on the natural frequencies of aero-engine pipe systems. The dynamic model is based on a three-dimensional Timoshenko beam finite element formulation, with clamps represented as distributed spring elements possessing anisotropic stiffness. To overcome the prohibitive cost of traditional Monte Carlo simulation, the multiplicative dimensional reduction method (M-DRM) is integrated with variance decomposition theory. This approach approximates the high-dimensional frequency response function as a product of univariate components, enabling rapid computation of Sobol’ sensitivity indices with a computational cost reduced by three orders of magnitude. Numerical case studies on a planar Z-shaped pipe and a spatial series-parallel configuration reveal that clamp position parameters dominate the system’s natural frequency characteristics. For critical clamps, Sobol’ indices exceedKeywords
External pipe systems are critical components in aero-engine architectures, responsible for transporting hydraulic fluid, fuel, lubricating oil, and compressed air [1,2]. Their dynamic behavior directly influences structural integrity and reliability, as excessive vibrations can lead to clamp loosening, fatigue cracking, and progressive structural failure. Clamps act as elastic supports that define the boundary conditions of pipe segments, thereby shaping the system’s natural frequencies and mode shapes. Variations in clamp stiffness alter the constraint level and shift eigenfrequencies. Furthermore, uncertainties in clamp installation position, such as axial misalignments or angular offsets, introduce asymmetry in mass and stiffness distribution [3,4]. These spatial deviations affect eigenfrequency predictions and may induce unexpected resonances [5–7].
Extensive research has focused on dynamic modeling of clamp-pipe systems. Widely adopted methods include the finite-element method [8,9], the spectral element method [10,11], the transfer matrix method [12–15], and semi-analytical methods [16–19]. These techniques enable comprehensive modal analysis under diverse boundary conditions. For instance, ref. [20] proposed an enhanced spectral element method for handling complex clamped boundaries, ref. [21] introduced an improved high-efficiency transfer matrix method for fluid-conveying pipes, and ref. [22] combined spectral and transfer matrix methods to study acoustic black hole piping structures. While effective in specific applications, these methods face challenges in balancing computational efficiency with high-fidelity modeling for complex three-dimensional pipe systems involving multiple uncertain clamp parameters. The Timoshenko beam based finite element model is particularly suitable for this study because it accurately captures shear deformation and rotary inertia effects, enabling precise representation of dynamic stiffness under varying clamp conditions. This formulation supports reliable prediction of natural frequencies and mode shapes, and its flexibility facilitates the incorporation of clamp parameters for sensitivity analysis.
The vibration characteristics of a clamp-pipe system represent an implicit function of clamp parameters. Previous studies have developed simulation models based on experimentally tested stiffness coefficients [23], employed distributed spring elements to model elastic support [24], and used Euler-Bernoulli beam elements with springs for multi-clamp systems [25]. Building on these foundations, this study adopts a Timoshenko beam finite element model combined with spring elements to characterize elastic support, providing an efficient computational approach for sensitivity analysis with uncertain clamp parameters. To quantitatively assess the impact of uncertain factors, sensitivity analysis methods are essential. These methods are categorized into local and global sensitivity analyses [26,27]. Local sensitivity analysis employs gradient-based metrics to evaluate parameter influence at specific points [28]. For example, ref. [29] used the Taguchi method for aircraft landing gear shimmy analysis, and [30] conducted parameter perturbation analysis for pipe systems. However, local sensitivity analysis provides only local approximations and requires gradient computations, limiting its application to complex implicit functions such as natural frequencies [31].
Global sensitivity analysis quantifies parameter influence across their entire domain [32,33]. Applications include aerospace gear systems [34], air rudder flutter [35], bridge dynamics [36], and multi-span pipe resonance [37]. The Sobol’ method, based on variance decomposition theory, quantifies the influence of individual inputs and their interactions on structural vibrations [38,39]. It overcomes the reference-point dependence of local approaches by capturing contributions across the complete parameter domain. The first-order index
The multiplicative dimensional reduction method offers an efficient alternative [41]. It derives approximate analytical solutions for Sobol’ indices through a finite number of operations by decomposing the input-output relationship into multiplicative terms. This significantly reduces the sampling burden while preserving accuracy. The multiplicative dimensional reduction method has demonstrated broad applicability, including uncertainty quantification in MEMS actuators [42], gas synthesis processes [43], and nonlinear structural dynamics [44]. This study addresses the vibration characteristics of aero-engine pipe systems under uncertain support conditions. Practical installation involves unavoidable variations in clamp positioning and stiffness due to manufacturing tolerances and assembly processes. These uncertainties cause natural frequency shifts, potentially leading to resonance and structural failure. The objective is to develop an efficient sensitivity analysis method that identifies critical clamp parameters, guiding tolerance design and installation quality control for enhanced reliability.
The proposed methodology integrates three principal technical components, namely a three-dimensional Timoshenko beam finite-element model for dynamic simulation, the multiplicative dimensional reduction method for efficient uncertainty propagation, and Sobol’ indices for global sensitivity quantification. This integration preserves the accuracy inherent in three-dimensional beam theory while achieving significant computational efficiency through dimensional reduction. The balanced fulfillment of accuracy and efficiency renders the method particularly suitable for the analysis of aero-engine pipe systems, where both attributes are critically demanded in practical engineering applications.
The remainder of this paper is organized as follows. Section 2 develops the simulation model using three-dimensional Timoshenko beam theory. Section 3 presents the Sobol’ sensitivity indices and the multiplicative dimensional reduction method approximation for efficient computation. Section 4 provides numerical examples for planar and spatial pipe systems. Finally, Section 5 summarizes the main conclusions.
2 Model for Dynamic Analysis of the Clamp-Pipe System
To ensure the accuracy and reliability of sensitivity analysis for natural vibration characteristics in complex piping systems, this study develops a parametric geometric model that captures both nominal configurations and realistic installation variations. The model enables precise representation of spatial pipe layouts, including straight segments, bends, and support constraints, forming the basis for a comprehensive dynamic analysis framework. By integrating spring elements to simulate clamp-induced elastic supports and employing a hybrid beam-spring finite element formulation, the approach provides a robust foundation for global sensitivity assessment of system-level dynamic responses. This section presents the analytical framework for modeling the natural vibration behavior of pipe systems under varying geometric and boundary conditions.
2.1 The Timoshenko Beam Based Pipe Element
Consider a hollow circular pipe segment of length L with outer diameter D and inner diameter
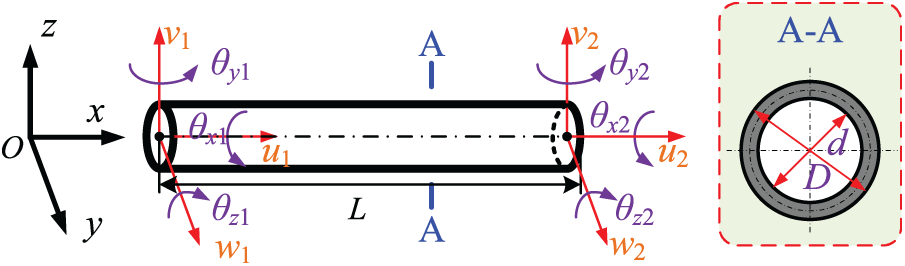
Figure 1: A mechanical model of pipes based on Timoshenko beam.
The geometric parameters of the pipe, including outer diameter D, inner diameter
Based on the Timoshenko beam theory, the complete element displacement vector
The kinetic energy for the pipe segment is theoretically represented as
where
The strain energy of the Timoshenko beam based pipe element is defined as
where E is the Young’s modulus,
Application of Hamilton’s principle,
In this formulation, the element mass and stiffness matrices
where
The Timoshenko beam element incorporates six degrees of freedom per node: three translational and three rotational displacements. This formulation enables accurate representation of three-dimensional pipe behavior. The consistent derivation of kinetic and strain energy expressions captures rotary inertia effects and transverse shear deformation of the pipe body. This formulation serves as the foundation for subsequent global sensitivity analysis, enabling investigation of how clamp support parameters influence the inherent vibrational characteristics of complex piping systems.
Single clamps are extensively employed in aerospace and industrial piping systems to fix pipe segments to engine casings or structural frames. As critical boundary conditions, they substantially influence the system’s dynamic behavior, particularly its natural frequency distribution and mode shapes. Manufacturing tolerances, installation variability, and geometric asymmetry often lead to directional dependence and non-uniformity in clamp stiffness properties, resulting in anisotropic support behavior. Accurate modeling of these effects is crucial for predicting vibration response, avoiding resonance, and ensuring structural reliability under operational loads. This section presents a finite element based approach to model the elastic support of single clamps, incorporating translational and rotational stiffness across six degrees of freedom to capture their asymmetric mechanical response.
As illustrated in Fig. 2, the elastic support behavior of a single clamp is modeled using two sets of spring elements connected at the node corresponding to the clamp location. These springs represent the translational and rotational stiffness characteristics of the clamp across six degrees of freedom:
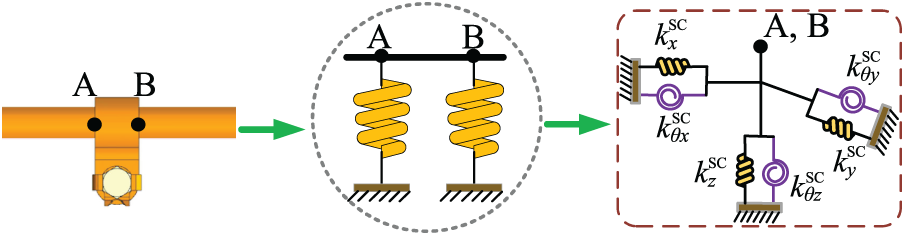
Figure 2: Mechanical model for dynamic simulation of single clamp.
Each node-localized spring group is represented by a diagonal stiffness matrix
In the finite element assembly process, the factor
In summary, the presented method enables precise capture of the elastic support behavior of single clamps within the finite element model. By integrating experimentally derived stiffness parameters and a physically consistent spring-mass formulation, the method supports accurate prediction of natural frequencies, mode shapes, and sensitivity to parametric variations of the single clamp. This capability is particularly valuable in engineering applications where clamp stiffness and position are treated as uncertain variables, enabling robust dynamic analysis and informed decision-making in the early stages of system design.
Double clamps are widely used in aerospace and industrial piping systems to provide enhanced structural restraint at critical junctions between adjacent pipe segments. To capture their dynamic influence within the finite element environment, double clamps are modeled as discrete connection mechanisms linking two nodes on adjacent pipe segments. The mechanical properties are represented by concentrated masses and stiffnesses distributed at the connection points as depicted in Fig. 3. The superscript
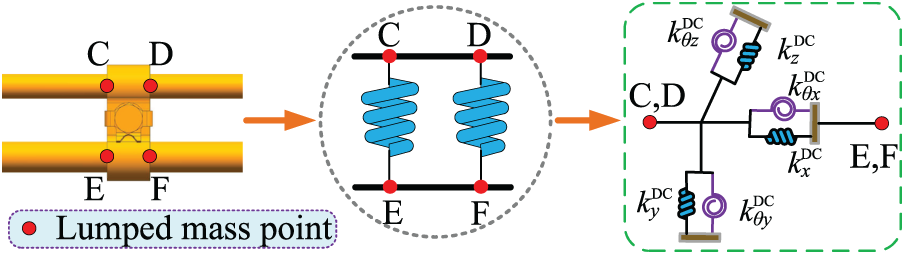
Figure 3: A mechanical model for dynamic simulation of double clamps.
The mass contribution of the double clamp is distributed equally among its four attachment points, two per node, reflecting the symmetric nature of its installation. As a result, each nodal mass represents one-quarter of the total double clamp mass
where
The stiffness matrix of the double clamp reflects the coupling between the two connected nodes. It is defined in a full
with submatrices given by
Here,
In summary, this procedure enables accurate representation of double clamp effects on the system dynamic characteristics. By incorporating both mass and stiffness contributions in a physically consistent manner, the model provides reliable prediction of natural frequencies and mode shapes for complex piping systems. The resulting element-level matrices are assembled into the global system equations, enabling comprehensive evaluation of how double clamp installations influence overall pipe dynamic behavior.
2.4 System Model for Natural Frequency Analysis
The integration of Timoshenko beam finite element modeling with discrete clamp representations enables a comprehensive and physically consistent procedure for analyzing the dynamic behavior of clamp-pipe systems. This section presents the global system formulation that combines contributions from pipe segments, single clamps, and double clamps into unified mass and stiffness matrices. The resulting model captures the influence of both clamp stiffness and position on the natural frequencies and mode shapes of the system, providing a robust foundation for sensitivity analysis and design optimization. In this study, the focus is on the deterministic modal characteristics of the clamp-pipe system, specifically the first five natural frequencies, which are critical for identifying potential resonance risks in engineering applications.
The Timoshenko beam finite element procedure allows one to obtain the global matrices for dynamic modeling of the clamp-pipe system as follows:
Herein,
The operator
where
The natural frequencies of the clamp-pipe system are computed by solving the generalized eigenvalue problem, which establishes an implicit relationship between the system response and clamp parameters. The natural frequency vector
The modal properties are obtained by solving the generalized eigenvalue problem
where
In summary, this section presents a dynamic model for natural frequency analysis of clamp-pipe systems, integrating three-dimensional Timoshenko beam theory with discrete clamp representations. Pipe segments are modeled using Timoshenko beam finite elements, capturing bending and shear deformation effects essential for accurate dynamic characterization of aero-engine piping components. Clamps are represented as distributed spring elements that account for directional stiffness variations and anisotropic support behavior. Double clamps are modeled as coupled connection mechanisms introducing stiffness coupling between adjacent nodes. This integrated model establishes an explicit parametric relationship between clamp configuration parameters and system natural frequencies, forming a computational foundation for subsequent sensitivity analysis. The model enables evaluation of how clamp stiffness coefficients and spatial positioning influence the vibrational characteristics of complex piping systems, with emphasis on the dominant modes critical for resonance avoidance.
3 Global Sensitivity Analysis of Natural Frequencies with Respect to Clamp Parameters
Uncertainties in clamp installation, including positional deviations and stiffness variations of single and double clamps, significantly influence the dynamic behavior of engine piping systems. These uncertainties originate from manufacturing tolerances, assembly errors, thermal expansion, and material property fluctuations during operation. Consequently, the natural frequencies and mode shapes of the system exhibit variability, potentially leading to unexpected resonance or excessive vibration under operational loads. Sensitivity analysis quantifies the impact of these uncertain parameters on the system dynamic response, identifying dominant factors and guiding robust design practices. This section presents a comprehensive procedure for analyzing the sensitivity of natural vibration characteristics to clamp position deviations and stiffness parameters, employing global sensitivity indices derived from variance decomposition, multiplicative dimension-reduction modeling, and Monte Carlo simulation.
3.1 The Sobol’ Sensitivity Index
The natural frequency response of the clamp-pipe system is characterized by the functional relationship
Sobol’ sensitivity analysis decomposes the output variance into contributions from individual parameters and their interactions. The main-effect sensitivity index for parameter
where
The total-effect sensitivity index accounts for both the main effect of
where
These sensitivity indices enable quantitative assessment of how clamp stiffness and position uncertainties influence the natural frequency characteristics of piping systems. The first-order index
Exact computation of Sobol indices requires evaluating high-dimensional conditional expectations, posing significant computational challenges for complex pipe system models. For clamp-pipe systems with numerous uncertain parameters representing clamp stiffness coefficients and positional coordinates, direct Monte Carlo simulation becomes computationally prohibitive due to its inherent double-loop sampling structure.
To estimate the sensitivity indices via Monte Carlo simulation, two independent sample matrices
The main computational burden arises from evaluating the conditional expectation
where
The main-effect sensitivity index is estimated as
with
For the total effect, the conditional variance estimator requires computing
and the total sensitivity index is estimated as
where
This computationally intensive procedure becomes intractable for realistic pipe system models, where each finite element analysis involves assembling and solving the full eigenvalue problem for three-dimensional Timoshenko beam elements with complex clamp boundary conditions. For typical aerospace piping systems with
3.2 Efficient Computation of Sensitivity Indices Using M-DRM
To overcome the computational challenges associated with direct integration in global sensitivity analysis, the multiplicative dimension reduction method provides an efficient alternative for estimating Sobol indices in complex pipe system models.
The multiplicative dimension reduction method leverages a multiplicative decomposition of the original model response
Herein,
The component function
The reference point
The first-order moment of the
and the second-order moment is
These moments can be efficiently computed using Gauss-quadrature integration over the one-dimensional domain of
The numerical integration employs Gaussian quadrature rules with appropriately selected abscissas and weights for evaluating the one-dimensional component functions arising from the multiplicative decomposition. For a
where
Therefore, the main effect sensitivity index for the
Similarly, the total effect sensitivity index, which accounts for both main and interaction effects involving
The computational efficiency of the multiplicative dimensional reduction method is achieved through systematic reduction of finite element reanalysis requirements. For a system with
In summary, the multiplicative dimensional reduction method approximation provides an efficient computational method for global sensitivity analysis of clamp-pipe systems by transforming high-dimensional integrals into products of one-dimensional components. This approach significantly reduces the computational burden associated with traditional Monte Carlo based methods, enabling practical sensitivity analysis for complex three-dimensional piping systems with multiple uncertain clamp parameters. The resulting computational efficiency, with speedup factors reaching three orders of magnitude compared to direct Monte Carlo simulation approaches, makes the multiplicative dimensional reduction method based sensitivity analysis particularly valuable for engineering applications where computational resources are limited and rapid design iterations are required.
3.3 Numerical Algorithm and Implementation
The computational procedure for global sensitivity analysis of clamp-pipe systems quantifies the influence of clamp stiffness coefficients and installation position coordinates on natural frequency characteristics. The algorithm integrates three-dimensional Timoshenko beam finite element modeling with multiplicative dimensional reduction method based sensitivity analysis to efficiently evaluate the impact of clamp parameters. The procedure encompasses parameterized model construction, Timoshenko beam finite element based natural frequency analysis, and multiplicative dimensional reduction method approximations for Sobol’ sensitivity indices.
As depicted in Algorithm 1, the NaFreSA procedure implementation begins with constructing a parameterized finite element model that explicitly incorporates clamp stiffness coefficients and installation position coordinates as the
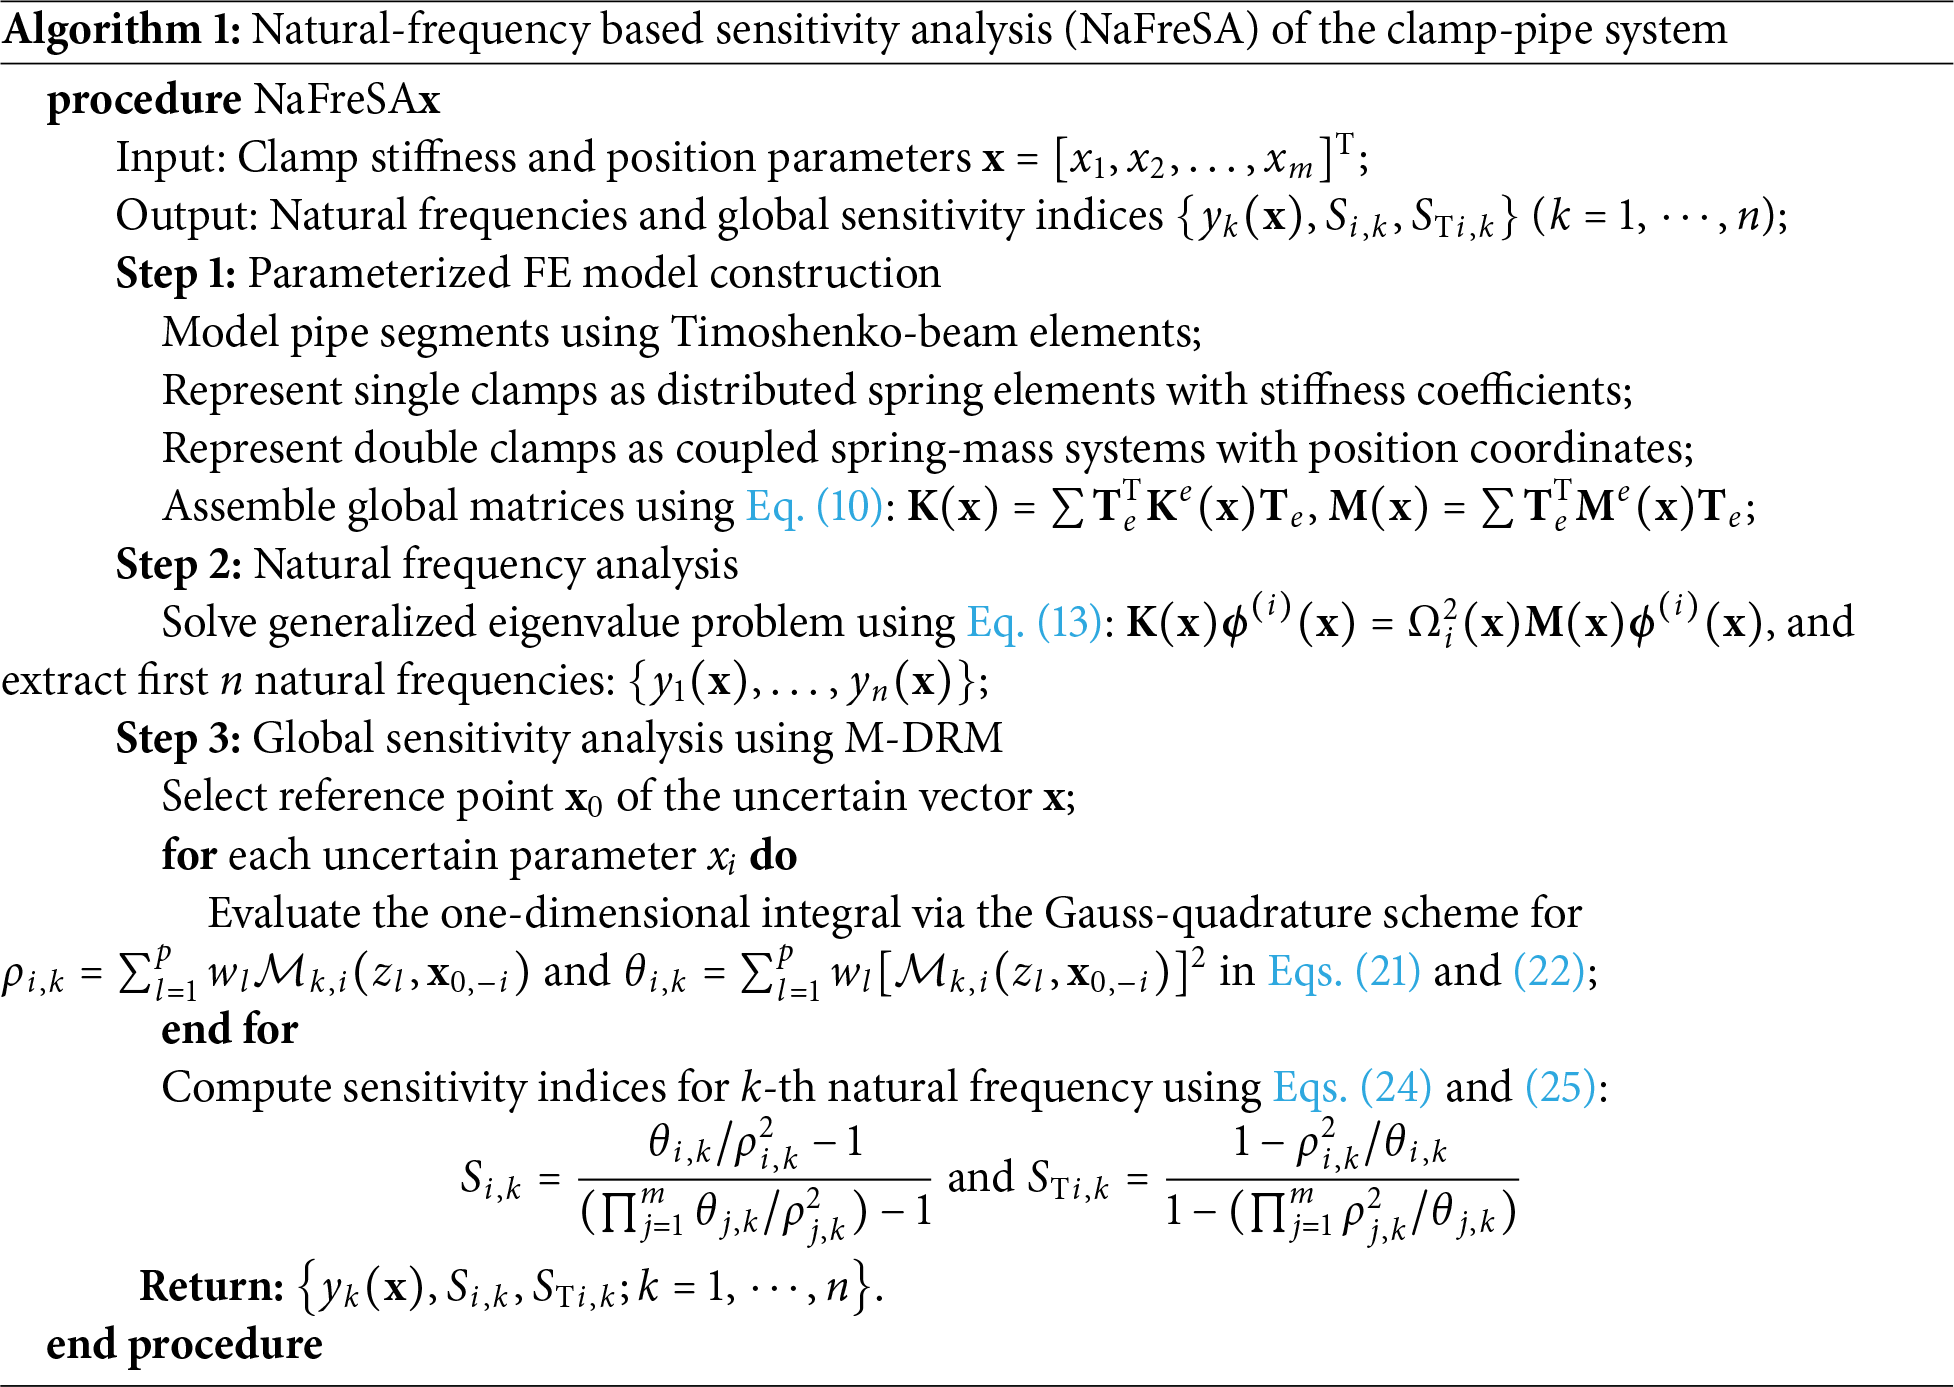
In summary, the proposed NaFreSA algorithm provides a computationally efficient method for global sensitivity analysis of clamp-pipe systems. By integrating parameterized Timoshenko beam finite element modeling with multiplicative dimensional reduction method based sensitivity computation, the algorithm achieves an optimal balance between accuracy and efficiency essential for practical engineering applications. The evaluation of both first-order and total-effect sensitivity indices enables comprehensive assessment of clamp parameter importance for natural frequency predictions. The resulting sensitivity analysis supports informed decision-making in design optimization and uncertainty quantification of engine piping systems, making it a valuable tool for engineering practitioners and researchers in structural dynamics and vibration analysis.
4 Natural Frequency Based Sensitivity Analysis of Clamp Parameters
This section focuses on two representative pipe configurations, including a Z-shaped pipe and a spatial series-parallel pipe system, to demonstrate the methodology and reveal the relative importance of different clamp parameters. These configurations represent common structural layouts encountered in aerospace engine applications. Through sensitivity analysis, the investigation aims to identify critical clamp parameters that most significantly influence natural frequency characteristics, providing valuable insights for understanding piping systems with uncertain stiffness and installation position parameters.
4.1 A Planar Z-Shape Clamp-Pipe System
Consider the Z-shaped pipe model illustrated in Fig. 4. Control point coordinates of Z-shaped pipe are given as
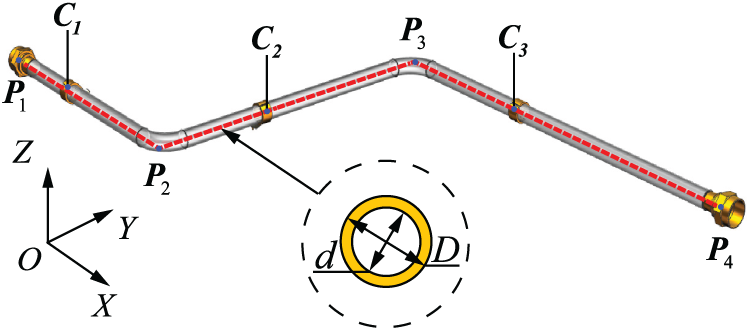
Figure 4: The geometry model of a Z-shape pipe system.
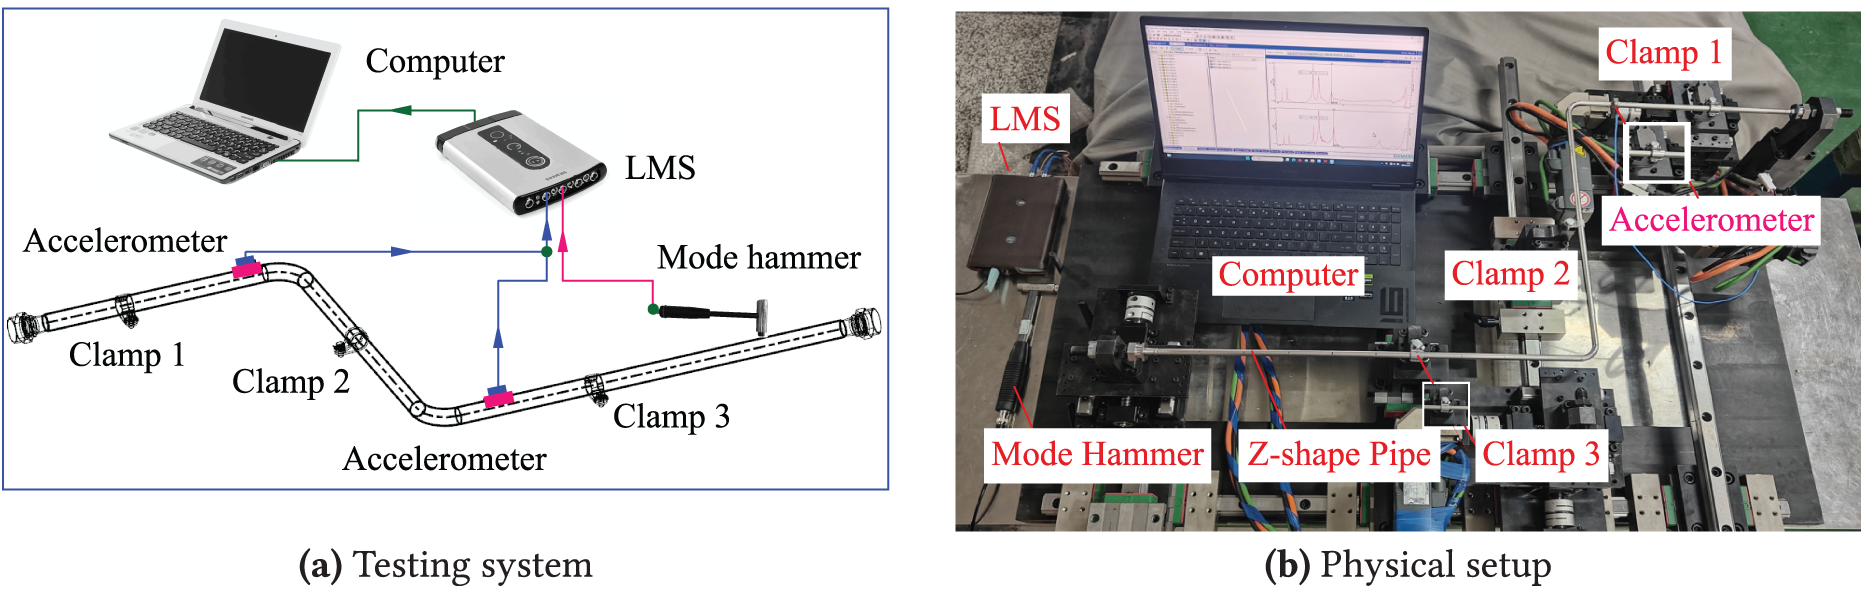
Figure 5: An illustration of the z-shape pipe system for experimental test results of the natural frequency.
The Z-shaped pipe represents a typical aero-engine fuel pipe segment. The material is AISI 304 stainless steel with a Young’s modulus of 200 GPa, density of 7800
The boundary conditions consist of three single clamps (
4.1.1 Experimental Verification
Fig. 5 shows a Z-shaped pipe supported by three clamps on a rigid frame. Two piezoelectric accelerometers (PCB 356A01) measure the dynamic response for identifying natural frequencies and mode shapes. A modal-impact hammer delivers impulse excitation across the relevant frequency range. The LMS SCADAS data acquisition system records the input force and acceleration signals. The numerical model uses Timoshenko beam elements for the pipe and spring elements for the clamps. The finite element model contains 298 nodes and 297 elements, yielding 1788 degrees of freedom. Validation uses Sensor Point 1 at
Table 1 compares the first ten natural frequencies from simulation and experiment. All relative errors are within
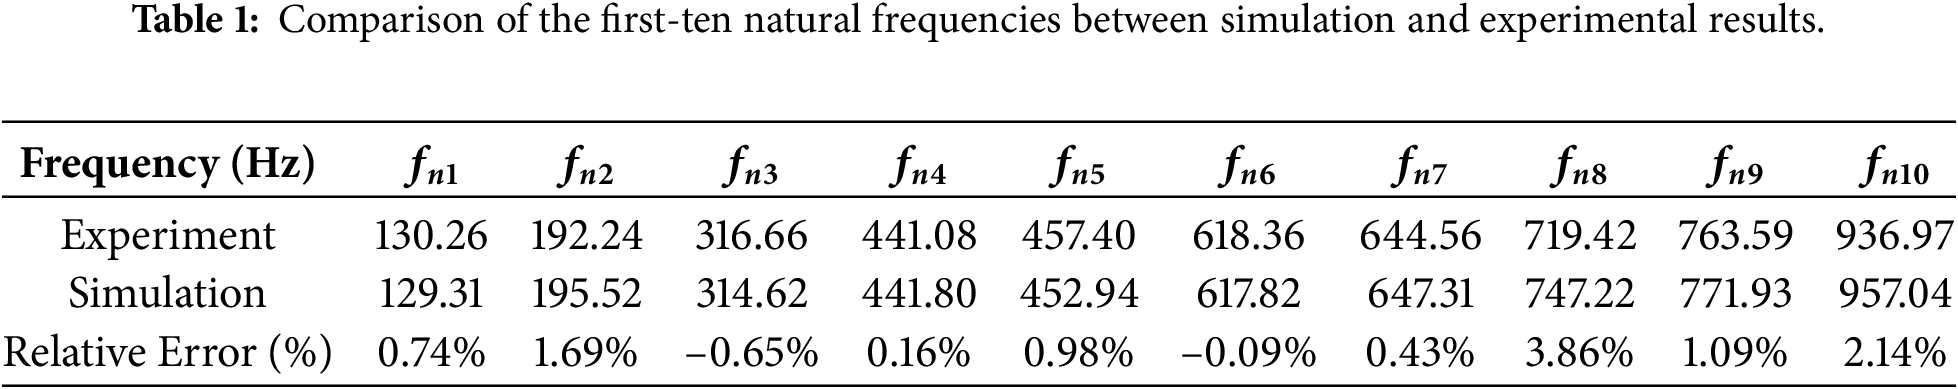
Fig. 6 presents the experimental frequency response functions, identifying the first ten natural frequencies of the Z-shaped pipe system. The FRF peaks align with the natural frequencies in Table 1, confirming the reliability of the experimental and numerical results. The agreement between simulation and experiment across a wide frequency range demonstrates the finite element model’s accuracy in representing the physical behavior of the pipe system, including the effects of clamp stiffness and positioning on dynamic characteristics. This validated model provides a reliable basis for subsequent sensitivity analysis of clamp parameter uncertainties on natural frequencies.
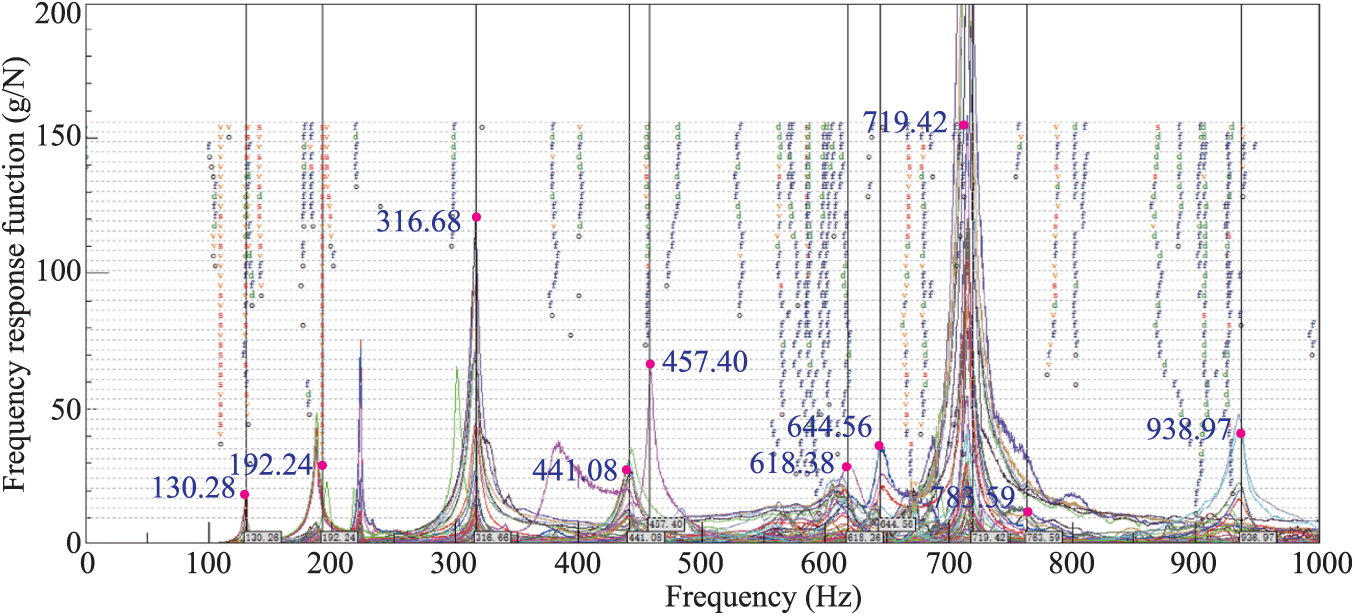
Figure 6: The experimental frequency response function (FRF) for natural frequency results of the Z-shaped pipe system.
4.1.2 Uncertain Clamp Parameters and Global Sensitivity Results
To simulate the natural vibration characteristics of the Z-shaped pipe, the stiffness coefficients
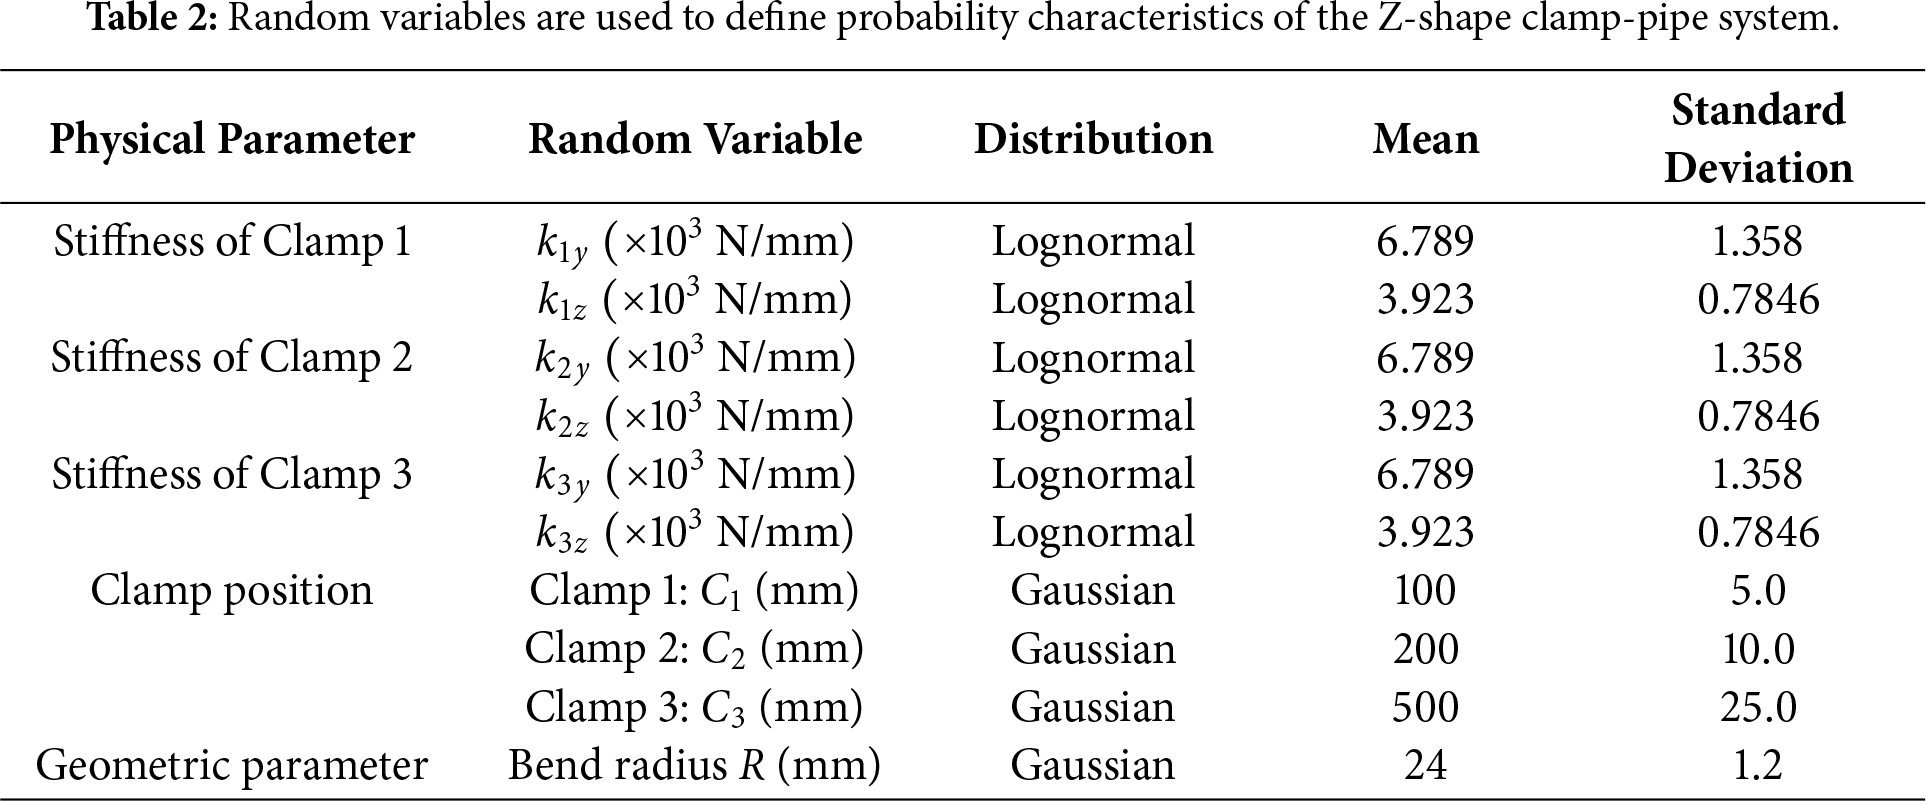
Stiffness parameters follow a Lognormal distribution, which ensures positive values and captures the right-skewed variability arising from manufacturing processes and material scatter. This distribution aligns with the asymmetric variability observed in experimental clamp data. Positional accuracy degrades with increasing distance from the reference due to cumulative assembly errors. Consequently, Clamp 1, located near the fixed end, exhibits the smallest variation, while Clamp 3, at the distal end, shows the largest variation of 25%. These values correspond to typical installation tolerances ranging from
4.1.3 Results for the Global Sensitivity Analysis
Global sensitivity analysis of the Z-shaped pipe system uses the multiplicative dimension reduction method and Sobol’ indices to quantify the influence of clamp stiffness and position parameters on natural frequencies. Twelve uncertain parameters are considered, including six clamp stiffness coefficients and four position variables. For the first ten natural frequencies, the method computes first-order and total-effect sensitivity indices by evaluating one-dimensional integrals along each parameter dimension. The parameterized finite element model from Section 2 incorporates these parameters through stiffness matrices and geometric mapping. Sensitivity indices are computed via Eqs. (24) and (25), enabling efficient assessment of parameter importance and interactions for the planar Z-shaped pipe configuration.
Table 3 presents the first-order sensitivity indices for twelve uncertain parameters across the first ten natural frequencies of the Z-shaped pipe system. Parameter influence varies systematically with modal order. Lower-order modes
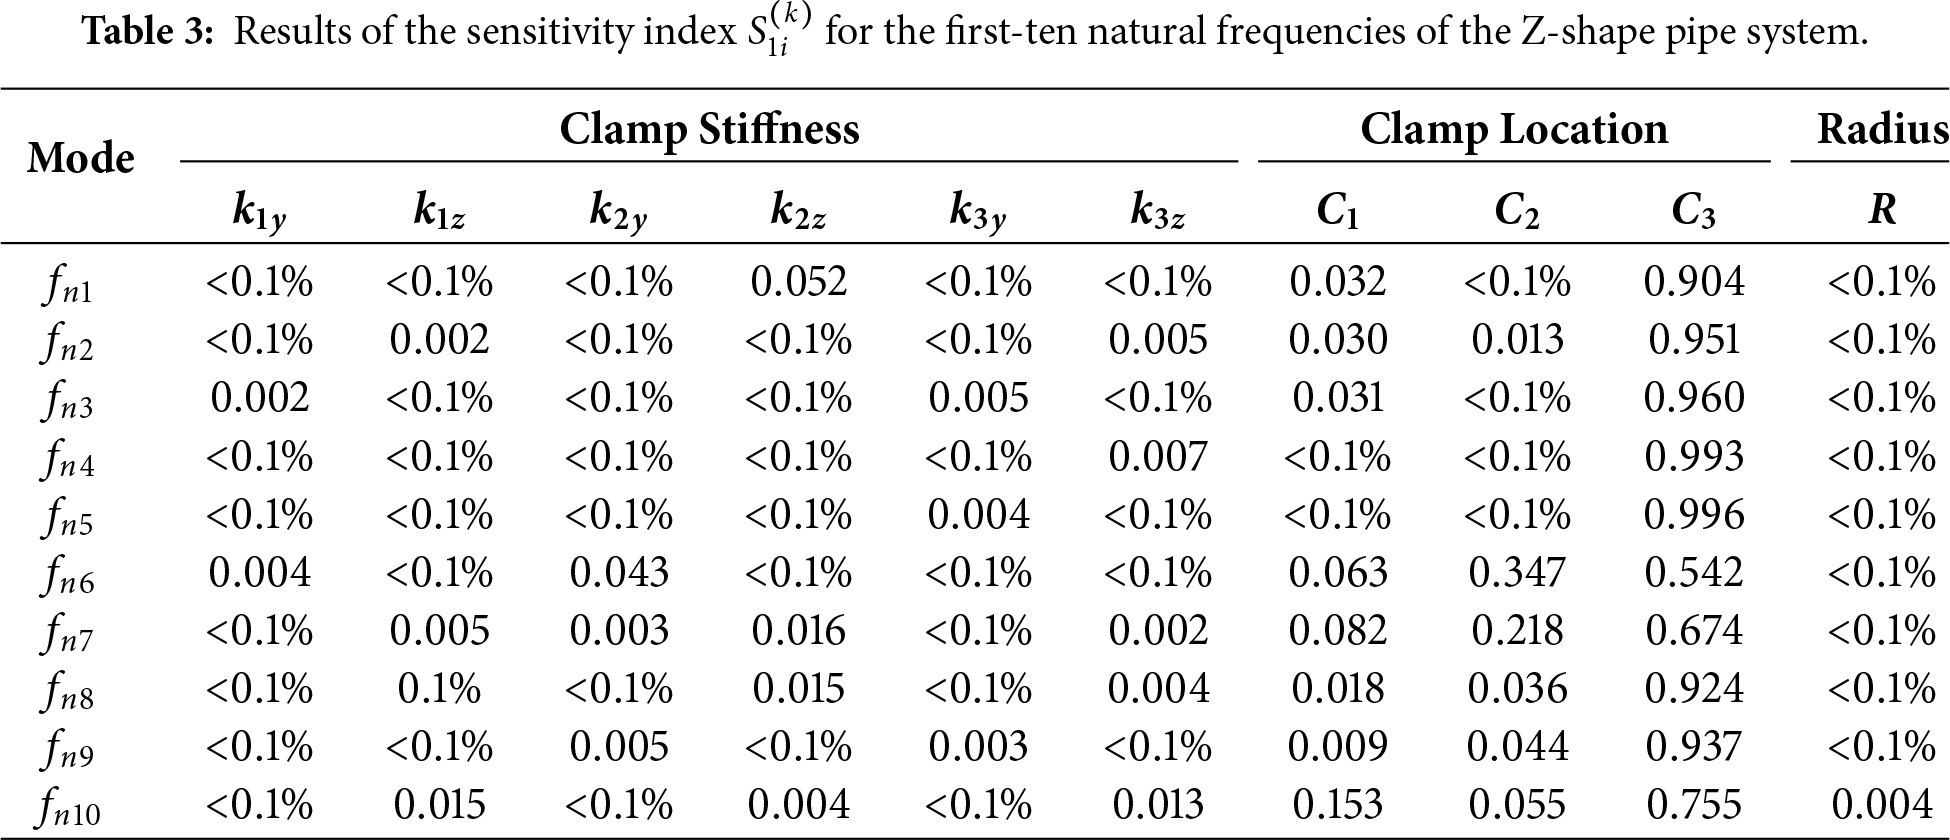
As mode order increases beyond
Stiffness parameters exhibit minimal influence. Only
4.2 A Spatial Series-Parallel Pipe System
Previous analyses of planar pipe systems have demonstrated that clamp position parameters dominate natural frequency characteristics compared to stiffness parameters. This finding motivates the current investigation into positional uncertainty effects in three-dimensional configurations in Fig. 7. The geometric configuration is based on actual routing data in Table 4. A three-dimensional finite element model is developed comprising 681 Timoshenko beam elements, 683 nodes, and 4098 degrees of freedom, enabling accurate simulation of natural vibration modes. Flexible pipe segments are represented by beam elements, while clamp constraints are modeled via spring elements. This approach captures the influence of clamp installation deviations on system stiffness and boundary conditions, providing a reliable basis for assessing the impact of positional uncertainties on dynamic response.
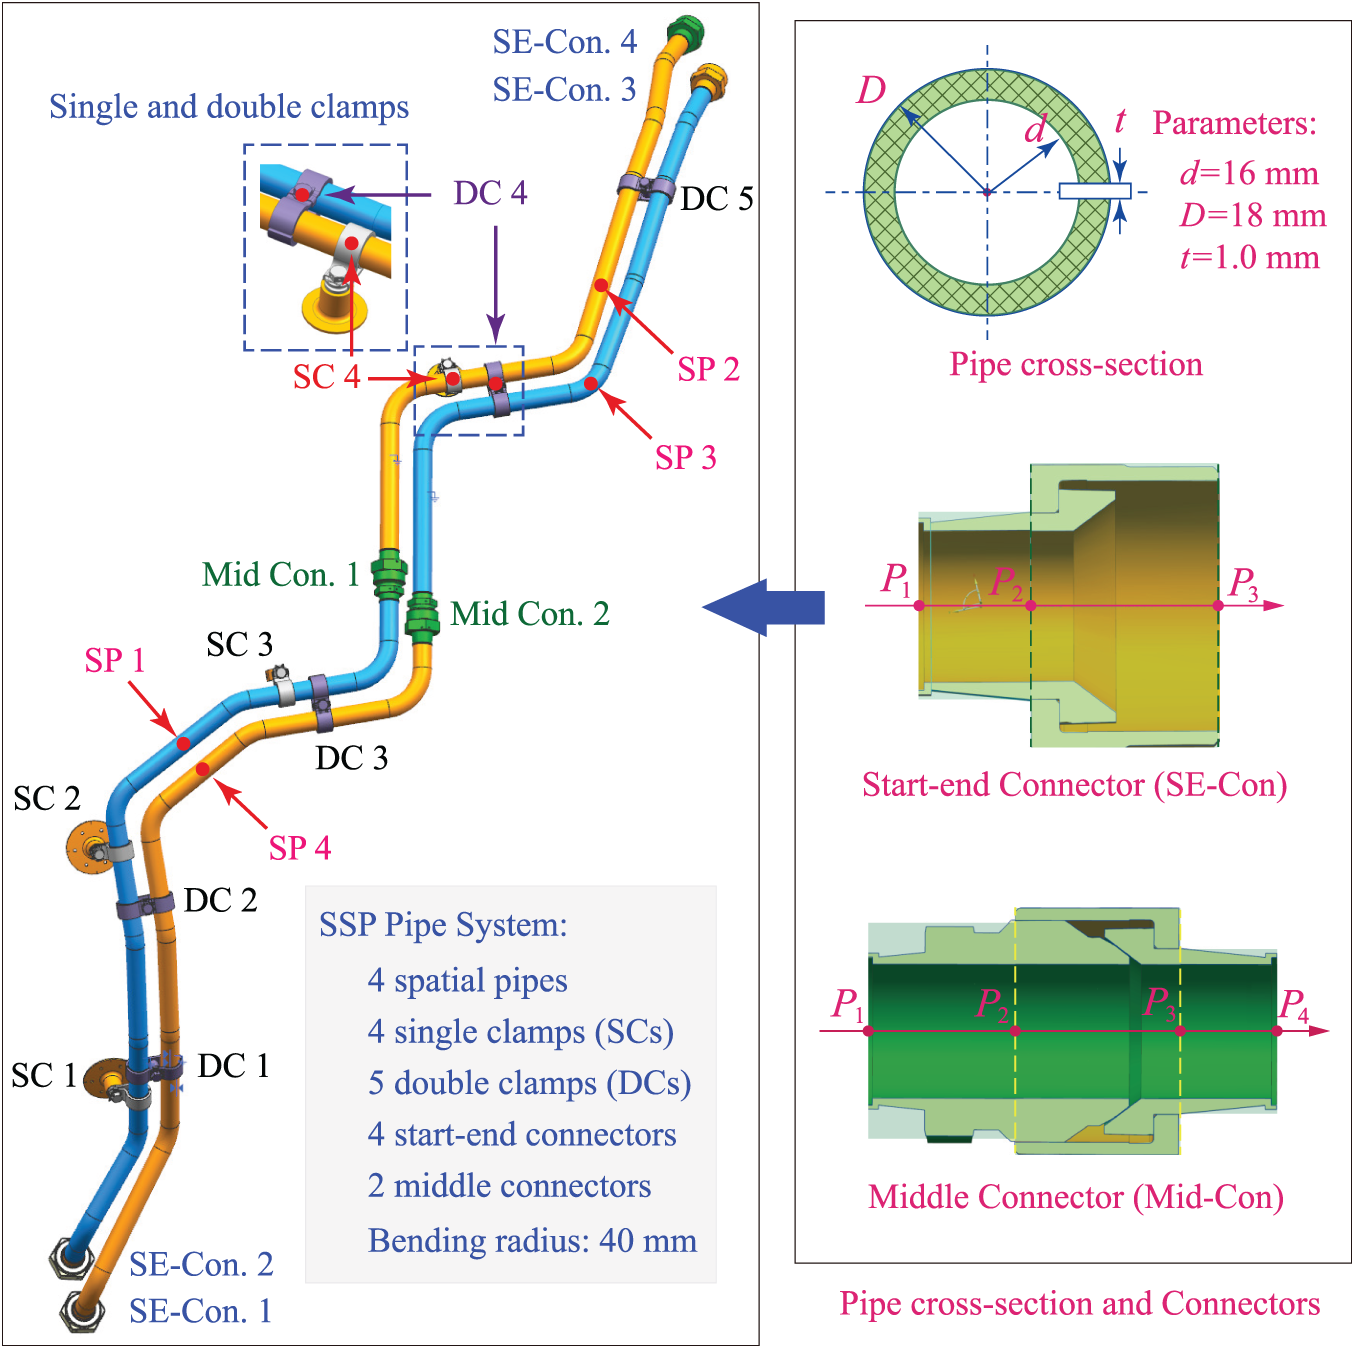
Figure 7: An illustration of the spatial serial-parallel (SSP) pipe system: Four SSP pipes, two middle connectors (Mid-Cons), four start-end connectors (SE-Cons), four single clamps (SCs), and five double clamps (DCs).
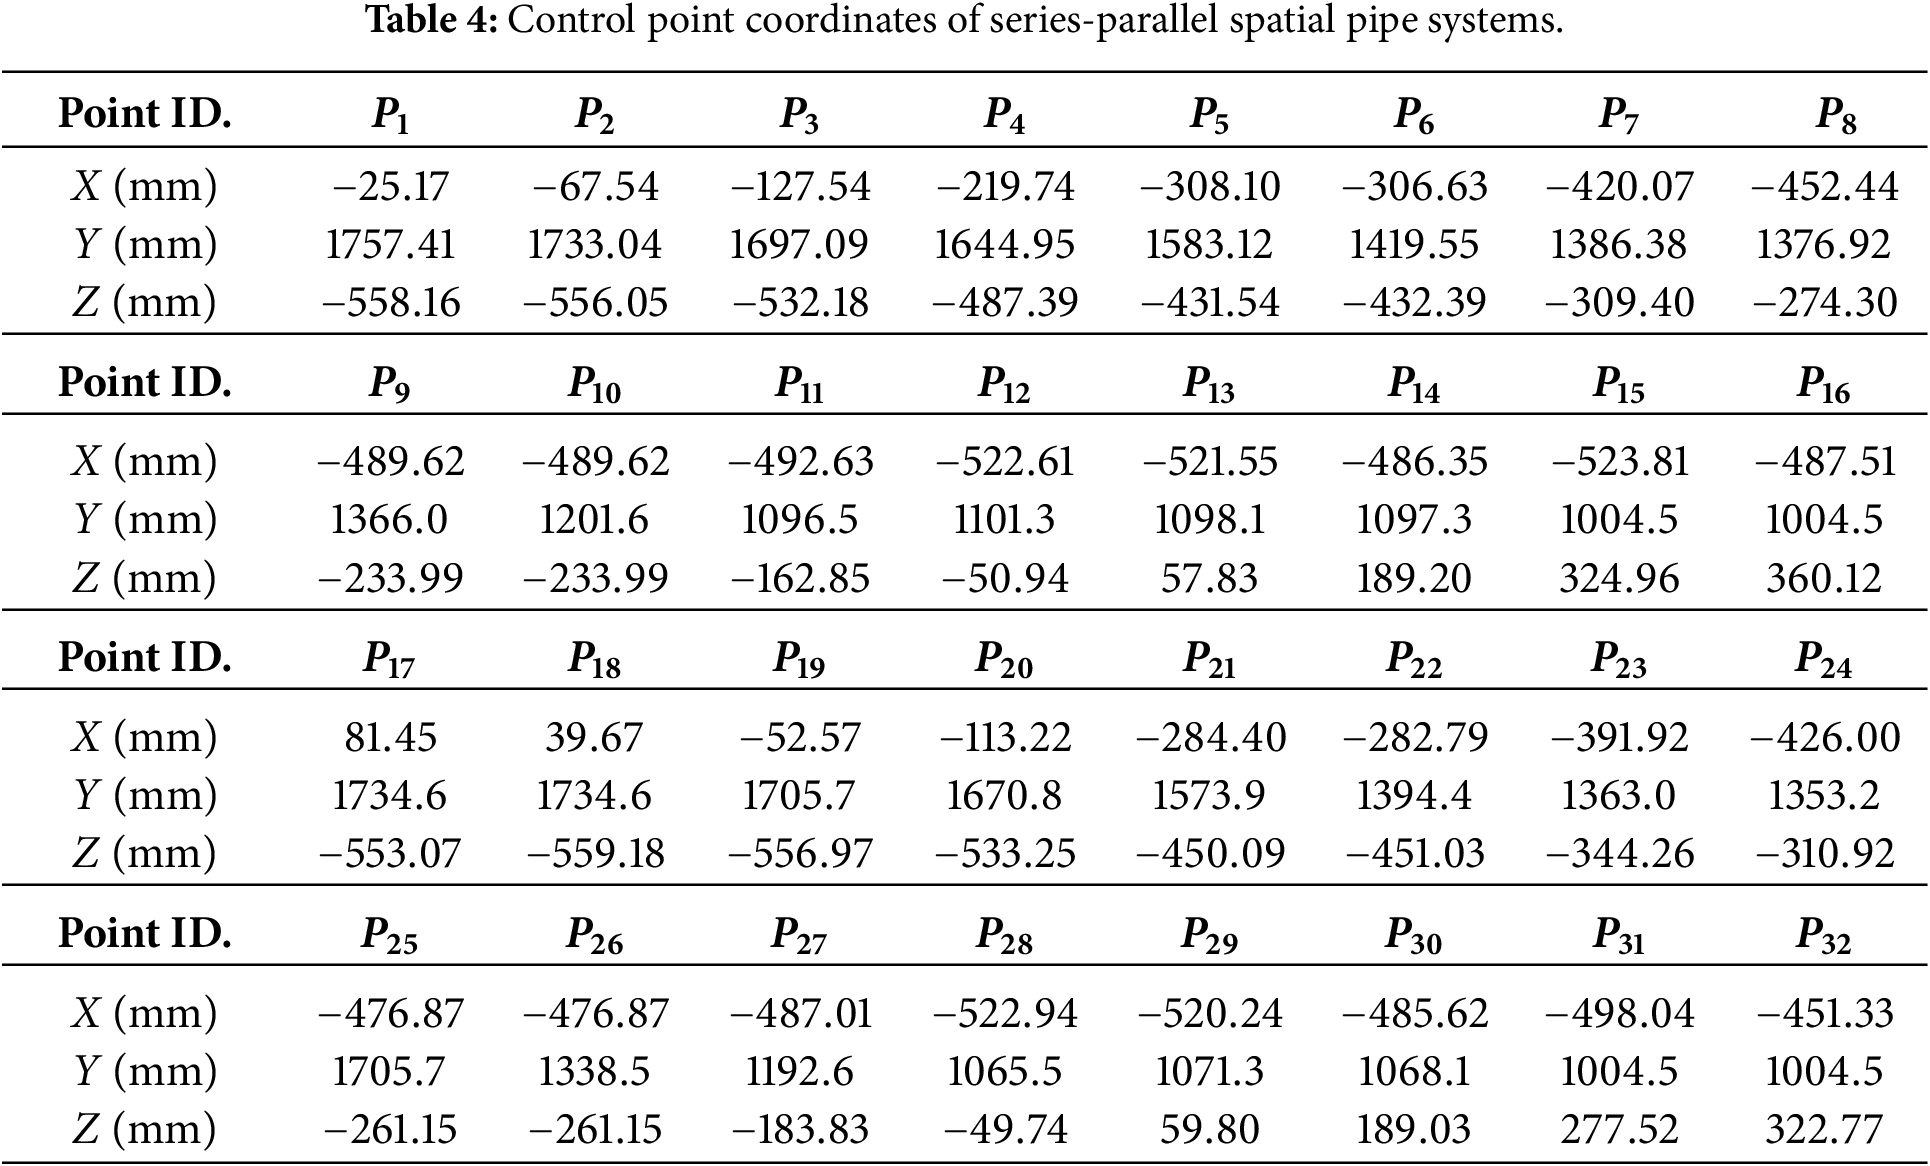
Table 5 compares the first ten natural frequencies from finite element simulation and experimental testing. The relative errors all fall within
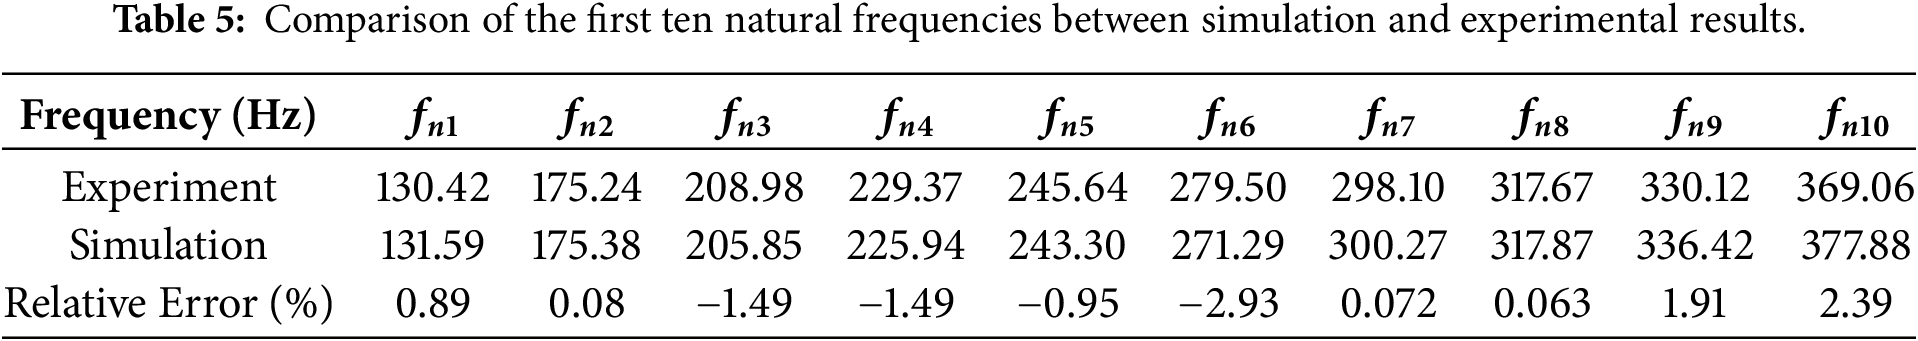
Fig. 8 displays the experimentally obtained frequency response functions, which identify the first ten natural frequencies of the spatial series-parallel pipe system. The FRF peaks align with the natural frequencies listed in Table 5, validating both the experimental measurements and numerical predictions. The close agreement across a wide frequency range demonstrates that the finite element model accurately captures the physical behavior of the pipe system, including the influence of clamp positioning on its dynamics. This validated model provides a basis for the subsequent global sensitivity analysis of clamp position uncertainties.
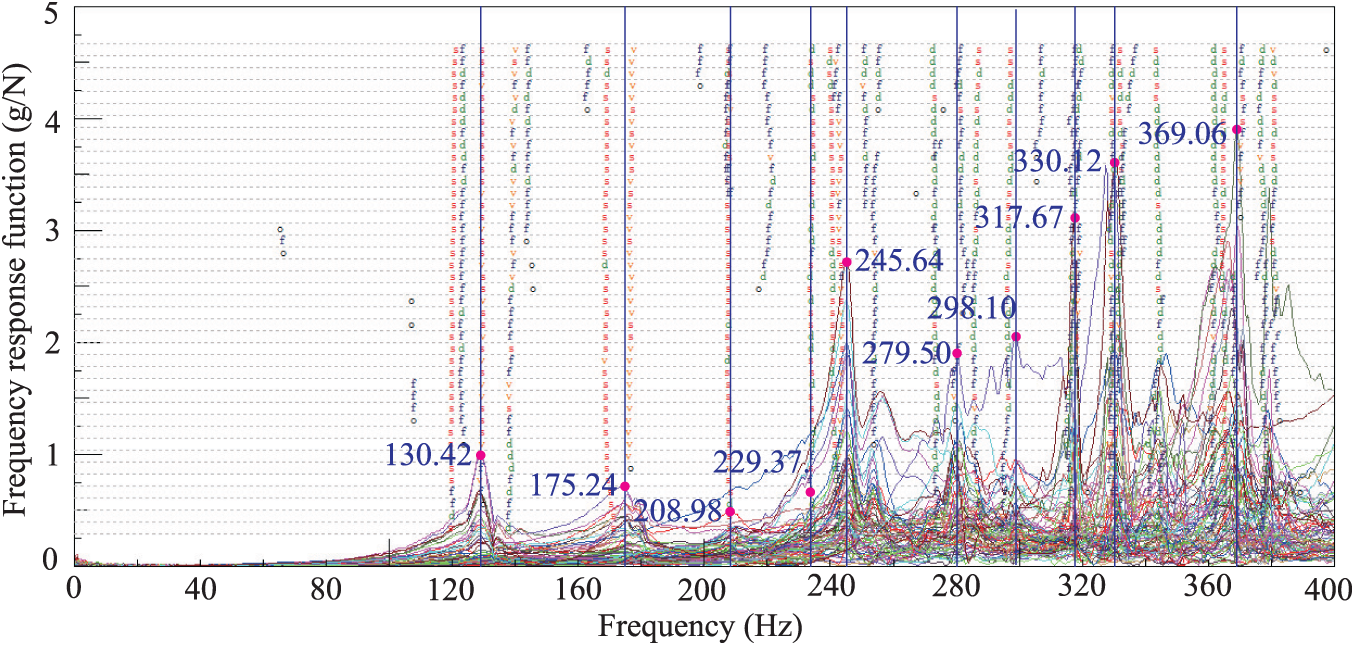
Figure 8: The experimental frequency response function (FRF) for natural frequency results of the SSP pipe system.
4.2.1 The Deviation Effect of Double Clamps
Double clamps connect and secure parallel pipe sections, enhancing the overall structural stiffness. This study investigates how installation position deviations of double clamps influence the system’s vibration characteristics. Controlled deviations of
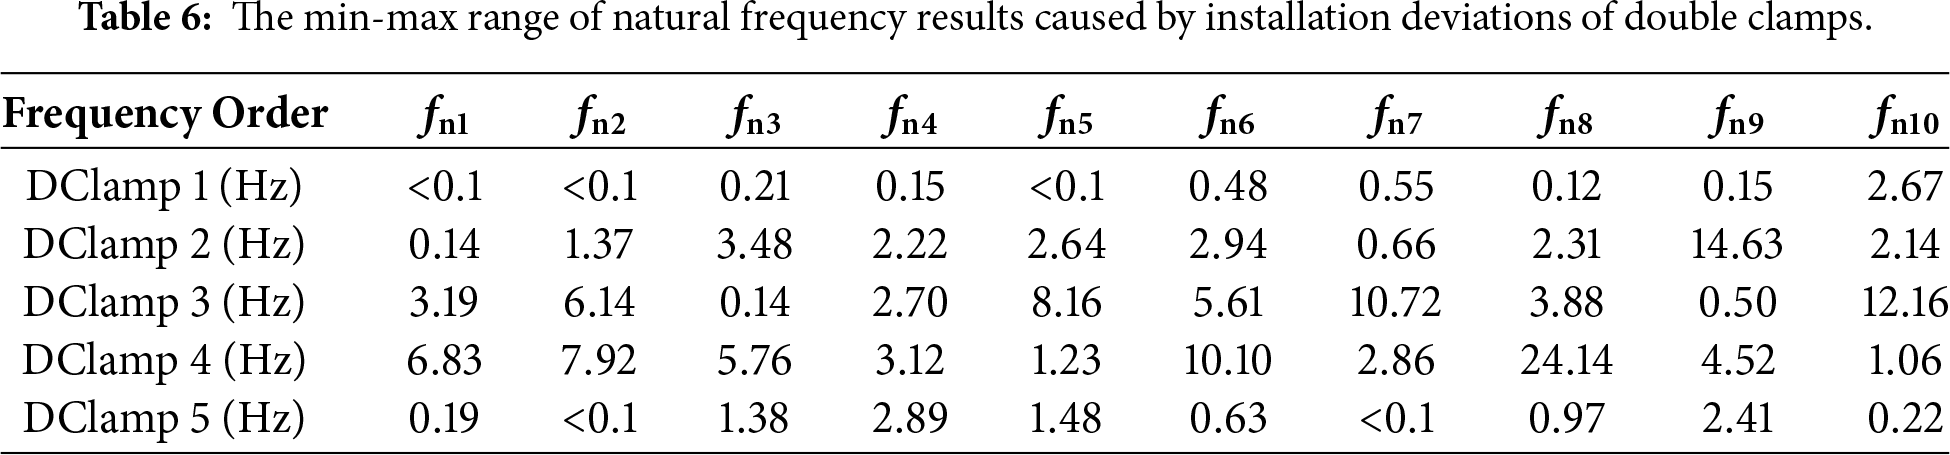
Fig. 9 shows the variations of the first four natural frequencies with installation deviations. Different clamps dominate the response in different modes, revealing a mode-dependent sensitivity pattern. For the first mode, DC-4 shows a pronounced nonlinear decrease while DC-3 increases linearly. DC-1, DC-2, and DC-5 show negligible variation. For the second mode, DC-3 increases and DC-4 decreases significantly, with DC-1 remaining constant. DC-2 and DC-5 show minor effects. The third mode is dominated by DC-2 which increases and DC-4 which decreases, while DC-1 and DC-3 remain stable. For the fourth mode, DC-4 again dominates with a steep decline and DC-2 increases moderately. DC-1 is invariant and DC-3 and DC-5 have limited influence.
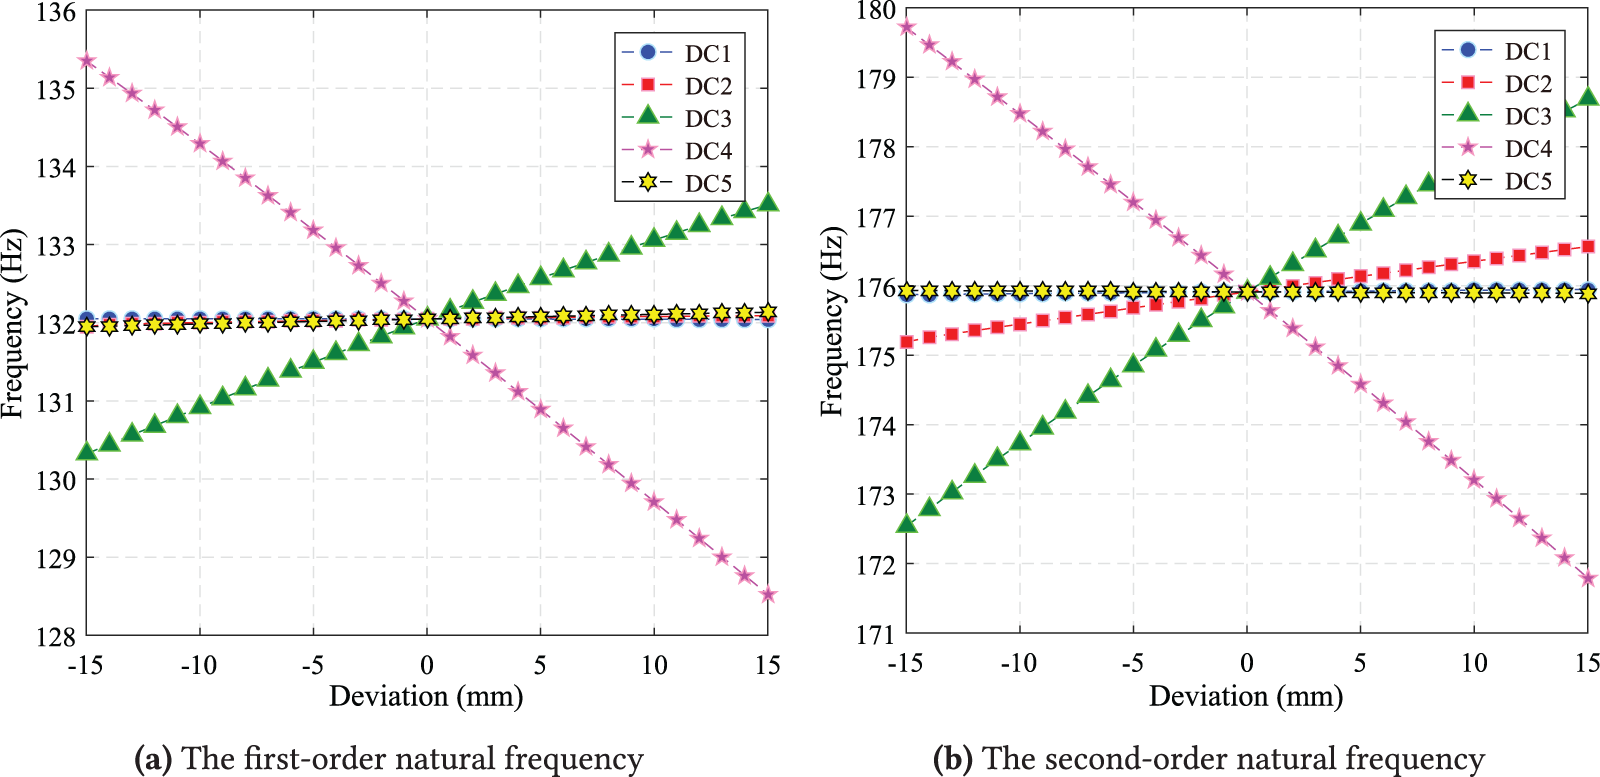
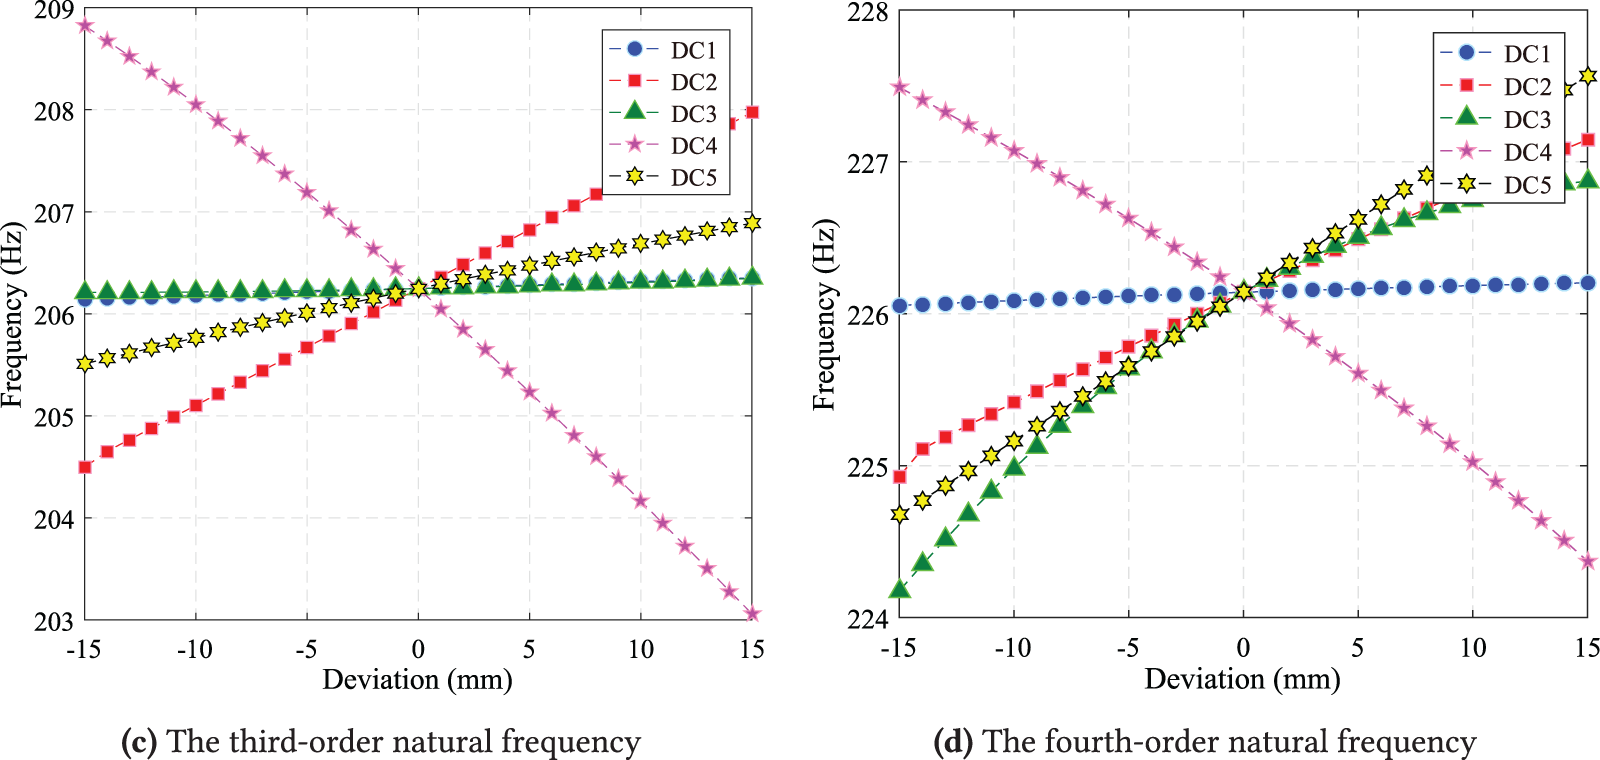
Figure 9: Numerical variations of the natural frequency result as the position deviation within the interval
DC-4 consistently shows the highest sensitivity across all four modes, indicating its critical role. DC-3 also exhibits significant influence in multiple modes. In contrast, DC-1 remains insensitive, suggesting minimal impact. DC-2 and DC-5 show moderate influence that depends on the mode. These findings identify DC-4 and DC-3 as key clamps governing system vibrations, while DC-1 can be assigned relaxed tolerance controls.
Table 6 summarizes the natural frequency ranges induced by
4.2.2 Global Sensitivity Analysis Results
A global sensitivity analysis based on Sobol indices quantifies the influence of double-clamp position deviations on the natural frequencies of the spatial series-parallel piping system. Unlike local sensitivity methods, which evaluate parameter effects at a single nominal point, the Sobol method accounts for the full range of parameter variations and their nonlinear interactions across the entire input domain. This approach comprehensively assesses how each clamp location contributes to the variability in system response and identifies which positional uncertainties most significantly affect critical vibration modes.
Sobol sensitivity indices decompose the total variance of the natural frequencies into contributions from individual input parameters and their interactions. First-order indices measure the main effect of each clamp position, while total-effect indices include both direct effects and all interaction terms. This decomposition clarifies the relative importance of different clamp locations and reveals potential synergistic effects. The Sobol sensitivity indices for the first ten natural frequencies are presented in Table 7 and Fig. 10.
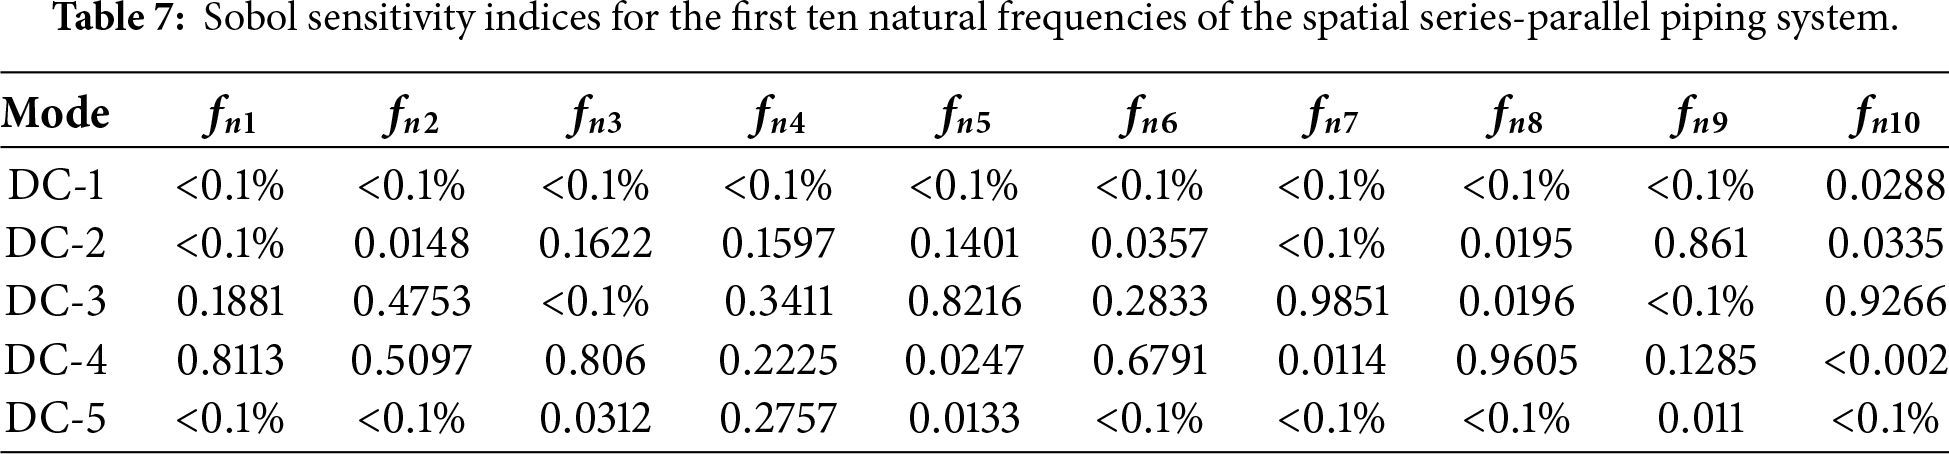
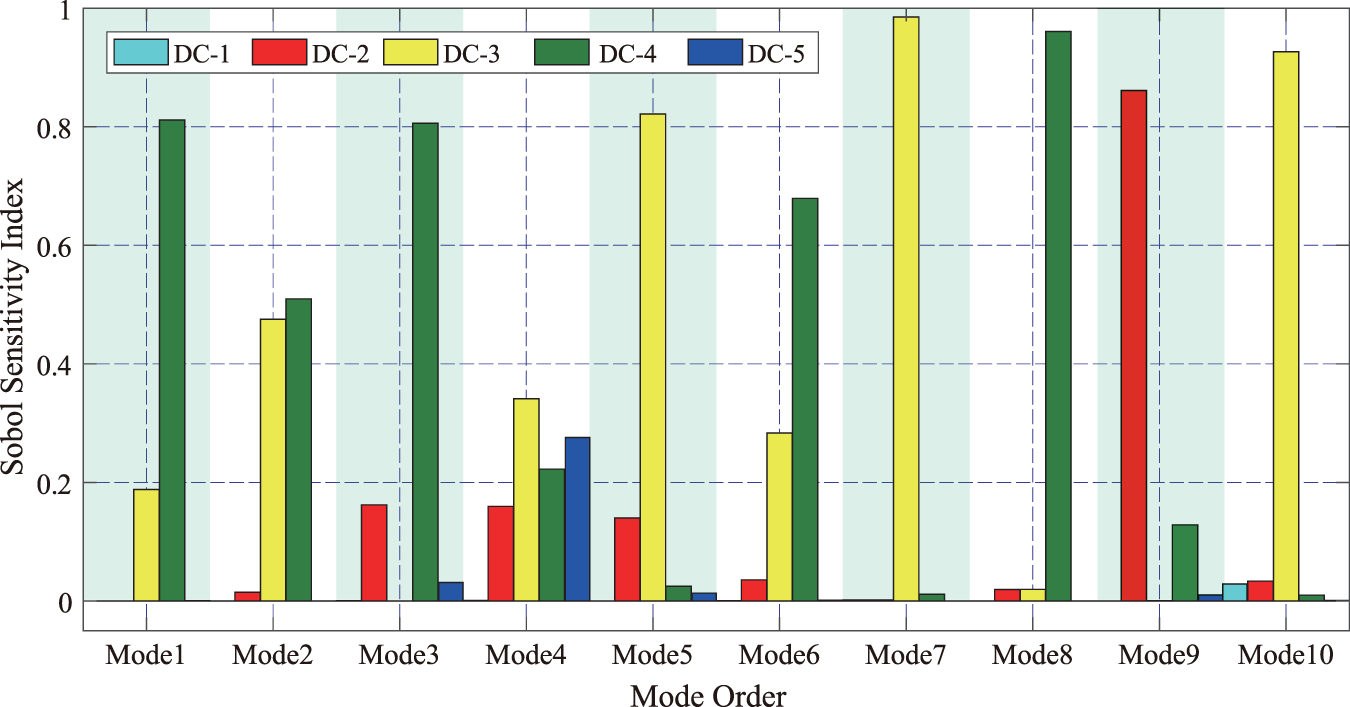
Figure 10: Sobol sensitivity indices for double-clamp positions across the first ten natural frequencies.
The results demonstrate significant variation in the influence of different double-clamp positions. Clamp DC-4 exhibits the highest sensitivity across several modes, with indices of
These sensitivity findings are consistent with the earlier single-parameter deviation analysis presented in Fig. 9 and Table 6. That analysis identified DC-4 as inducing the largest frequency shifts, quantified here by its high Sobol indices. Both methods confirm DC-3 as highly influential for higher-order modes and DC-1 as negligible. This mutual validation strengthens the conclusion that DC-4 and DC-3 are the primary determinants of the system’s dynamic behavior, whereas the positions of DC-1 and DC-5 can be governed by relaxed tolerance specifications.
The non-uniform distribution of parameter sensitivity underscores the importance of targeted design optimization. Tighter manufacturing and installation tolerances should be applied to high-sensitivity clamps such as DC-3 and DC-4. Focusing quality control efforts on these critical components provides a direct pathway to enhance structural robustness and mitigate resonance risk under operational conditions.
In summary, the global sensitivity analysis reveals a highly non-uniform influence of double-clamp positioning on the system’s natural frequencies. Clamp DC-4 is the most critical parameter across multiple modes. Clamp DC-3 exerts substantial influence on higher-order modes. Clamps DC-1 and DC-5 have a minimal impact, and DC-2 shows a moderate, mode-specific influence. This establishes a clear hierarchy of parameter importance, demonstrating that geometric uncertainties in clamp positioning dominate the dynamic response. Consequently, tolerance requirements can be strategically relaxed for less sensitive clamp locations without significantly compromising system performance.
This study develops an efficient method for global sensitivity analysis of aero-engine pipe systems with uncertain clamp support conditions. The approach combines a three-dimensional Timoshenko beam finite-element model with the multiplicative dimensional reduction method to compute Sobol’ sensitivity indices rapidly. The computational cost is reduced by three orders of magnitude compared with conventional Monte Carlo simulation while preserving accuracy.
Numerical examples on a planar Z-shaped pipe and a spatial series-parallel configuration validate the method. For the Z-shaped pipe, the position of clamp
In summary, the work contributes an efficient computational procedure for sensitivity analysis of high-dimensional clamp parameters in piping systems. The results establish a clear hierarchy of parameter importance, demonstrating that positional accuracy of specific clamps is paramount. This insight allows strategic allocation of manufacturing tolerances, focusing precision on dominant parameters without compromising dynamic performance. The method supports practical design and maintenance decisions for aero-engine pipes. It enables optimized tolerance assignment, guides inspection priorities, and facilitates rapid evaluation of design alternatives. By identifying the most influential clamp parameters, the approach can be expected to enhance system reliability and reduce lifecycle costs while maintaining safety.
Acknowledgement: None.
Funding Statement: This research was funded by the Major Projects of Aero-Engines and Gas Turbines grant number J2019-I-0008-0008.
Author Contributions: The authors confirm contribution to the paper as follows: study conception and design: Yan Shi, Xufang Zhang; data collection: Yan Shi, Shang Ren; analysis and interpretation of results: Yan Shi, Xin Wang, Yi Wang; draft manuscript preparation: Yan Shi, Bingfeng Zhao and Xufang Zhang. All authors reviewed and approved the final version of the manuscript.
Availability of Data and Materials: Data available on request from the authors.
Ethics Approval: Not applicable.
Conflicts of Interest: The authors declare no conflicts of interest.
Appendix A The Local Mass and Stiffness Matrices
The local mass matrix
Similarly, the coupling mass matrix
The stiffness matrices
and the coupling stiffness matrix
in which the shear deformation parameters are defined as
References
1. Cao Y, Chen W, Ma H, Li H, Wang B, Tan L, et al. Dynamic modeling and experimental verification of clamp-pipeline system with soft nonlinearity. Nonlinear Dyn. 2023;111(19):17725–48. doi:10.1007/s11071-023-08814-y. [Google Scholar] [CrossRef]
2. Zhangabay N, Bonopera M, Avramov K, Chernobryvko M, Buganova S. Use of scaled models to evaluate reinforcement efficiency in damaged main gas pipelines to prevent avalanche failure. Comput Model Eng Sci. 2025;145(1):241–61. doi:10.32604/cmes.2025.069544. [Google Scholar] [CrossRef]
3. Ma Y, Wang Z, Zhang J, Huo R, Yuan X. Sensitivity analysis of electromagnetic scattering from dielectric targets with polynomial chaos expansion and method of moments. Comput Model Eng Sci. 2024;140(2):2079–102. doi:10.32604/cmes.2024.048488. [Google Scholar] [CrossRef]
4. Zhang X, Wang L, Sørensen JD. AKOIS: an adaptive Kriging oriented importance sampling method for structural system reliability analysis. Struct Saf. 2020;82:101876. [Google Scholar]
5. Steltner K, Pedersen CB, Kriegesmann B. Semi-intrusive approach for stiffness and strength topology optimization under uncertainty. Optim Eng. 2023;24(3):2181–211. doi:10.1007/s11081-022-09770-z. [Google Scholar] [CrossRef]
6. Li W, Liu Z, Ma Y, Meng Z, Ma J, Liu W, et al. Sensitivity analysis of structural dynamic behavior based on the sparse polynomial chaos expansion and material point method. Comput Model Eng Sci. 2025;142(2):1515–43. doi:10.32604/cmes.2025.059235. [Google Scholar] [CrossRef]
7. Li F, Liu H, Li Y, Chen L, Lian H. Shape sensitivity analysis of acoustic scattering with series expansion boundary element methods. Comput Model Eng Sci. 2025;143(3):2785–809. doi:10.32604/cmes.2025.066001. [Google Scholar] [CrossRef]
8. Cao Y, Chai Q, Guo X, Ma H, Wang P. Comparative study on two finite element models for multi-clamp pipeline system. J Mech Sci Technol. 2022;36(3):1157–69. doi:10.1007/s12206-022-0208-5. [Google Scholar] [CrossRef]
9. Gao PX, Zhai JY, Yan YY, Han QK, Qu FZ, Chen XH. A model reduction approach for the vibration analysis of hydraulic pipeline system in aircraft. Aerosp Sci Technol. 2016;49(2):144–53. doi:10.1016/j.ast.2015.12.002. [Google Scholar] [CrossRef]
10. Sun Z, Yu R, Wang X, Zhang X. Dynamic analysis of liquid-filled clamp-pipe systems based on the spectral element method. Arch Appl Mech. 2025;95(1):24. doi:10.1007/s00419-024-02723-1. [Google Scholar] [CrossRef]
11. Xu H, Zhang X, Sun Z, Sun S. A Gegenbauer-polynomial-based semi-analytical approach for dynamic modeling of series-parallel pipe systems under elastic boundary conditions. Appl Math Model. 2025;149:116317. doi:10.1016/j.apm.2025.116317. [Google Scholar] [CrossRef]
12. El-Sayed T, El-Mongy H. Free vibration and stability analysis of a multi-span pipe conveying fluid using exact and variational iteration methods combined with transfer matrix method. Appl Math Model. 2019;71:173–93. doi:10.1016/j.apm.2019.02.006. [Google Scholar] [CrossRef]
13. Li Q, Yang K, Zhang L, Zhang N. Frequency domain analysis of fluid-structure interaction in liquid-filled pipe systems by transfer matrix method. Int J Mech Sci. 2002;44(10):2067–87. doi:10.1016/s0020-7403(02)00170-4. [Google Scholar] [CrossRef]
14. Guo X, Ge H, Xiao C, Ma H, Sun W, Li H. Vibration transmission characteristics analysis of the parallel fluid-conveying pipes system: numerical and experimental studies. Mech Syst Signal Process. 2022;177(11):109180. doi:10.1016/j.ymssp.2022.109180. [Google Scholar] [CrossRef]
15. Guo X, Cao Y, Ma H, Xiao C, Wen B. Dynamic analysis of an L-shaped liquid-filled pipe with interval uncertainty. Int J Mech Sci. 2022;217(1):107040. doi:10.1016/j.ijmecsci.2021.107040. [Google Scholar] [CrossRef]
16. Chen W, Guo Z, Chen S, Cao Y, Guo X, Ma H, et al. Semi-analytic modeling and experimental verification of arbitrary aero-engine complex spatial pipeline. Appl Math Model. 2024;131(4):505–34. doi:10.1016/j.apm.2024.04.003. [Google Scholar] [CrossRef]
17. Dou B, Luo ZB, Deng TC, Mao XY, Li M, Ding H. Two-directional and multi-modal vibration reduction of fluid-conveying pipes by using piecewise retaining clips. Thin-Walled Struct. 2025;209:112945. doi:10.1016/j.tws.2025.112945. [Google Scholar] [CrossRef]
18. Chen W, Cao Y, Guo X, Ma H, Wen B, Wang B. Semi-analytical dynamic modeling and fluid-structure interaction analysis of L-shaped pipeline. Thin-Walled Struct. 2024;196(4):111485. doi:10.1016/j.tws.2023.111485. [Google Scholar] [CrossRef]
19. Ma H, Sun W, Ji W, Zhang Y, Liu X, Liu H. Dynamic modeling and vibration analysis of planar pipeline with partial constrained layer damping treatment: theoretical and experimental studies. Compos Struct. 2023;323(1):117476. doi:10.1016/j.compstruct.2023.117476. [Google Scholar] [CrossRef]
20. Bu Y, Tang Y, Yang T, Ding Q. Enhanced dynamic modeling of pipes conveying fluid with multiple constraints and accessories based on spectral element method. Mech Syst Signal Processing. 2025;237:113097. [Google Scholar]
21. Wang L, Yin Y, Qi L, Qu C, Yu Y, Liu B, et al. High frequency vibration calculation methods for PFCPs. Int J Mech Sci. 2025;301(4):110502. doi:10.1016/j.ijmecsci.2025.110502. [Google Scholar] [CrossRef]
22. Bu Y, Tang Y, Wu J, Yang T, Ding Q, Li Y. Novel vibration suppression of spinning periodically acoustic black hole pipes based on the band-gap mechanism. Thin-Walled Struct. 2025;212(20):113198. doi:10.1016/j.tws.2025.113198. [Google Scholar] [CrossRef]
23. Ji W, Ma H, Liu F, Sun W, Wang D. Dynamic analysis of cracked pipe elbows: numerical and experimental studies. Int J Mech Sci. 2024;281(1):109580. doi:10.1016/j.ijmecsci.2024.109580. [Google Scholar] [CrossRef]
24. Chai Q, Zeng J, Hui M, Kun L, Qingkai H. A dynamic modeling approach for nonlinear vibration analysis of the L-type pipeline system with clamps. Chin J Aeronaut. 2020;33(12):3253–65. doi:10.1016/j.cja.2020.04.007. [Google Scholar] [CrossRef]
25. Wang W, Zhou C, Gao H, Zhang Z. Application of non-probabilistic sensitivity analysis in the optimization of aeronautical hydraulic pipelines. Struct Multidiscip Optim. 2018;57(6):2177–91. doi:10.1007/s00158-017-1848-4. [Google Scholar] [CrossRef]
26. Guan Y, Zhi P, Wang Z. A novel variable-fidelity kriging surrogate model based on global optimization for black-box problems. Comput Model Eng Sci. 2025;144(3):3343–68. doi:10.32604/cmes.2025.069515. [Google Scholar] [CrossRef]
27. Amstutz S. Sensitivity analysis with respect to a local perturbation of the material property. Asymptot Anal. 2006;49(1–2):87–108. doi:10.3233/asy-2006-778. [Google Scholar] [CrossRef]
28. Zhao Y, Cheng X, Zhang T, Wang L, Shao W, Wiart J. A global-local attention network for uncertainty analysis of ground penetrating radar modeling. Reliab Eng Syst Saf. 2023;234(2):109176. doi:10.1016/j.ress.2023.109176. [Google Scholar] [CrossRef]
29. Borgonovo E. Sensitivity analysis with finite changes: an application to modified EOQ models. Eur J Oper Res. 2010;200(1):127–38. [Google Scholar]
30. Liu W, Cao G, Zhai HB, Liu YS. Sensitivity analysis and dynamic optimization design of supports’ positions for engine pipelines. J Aerosp Power. 2012;27(12):2756–62. doi:10.2514/6.1994-4275. [Google Scholar] [CrossRef]
31. Yao Z, Hao J, Tan Z, Li C, Zhao J. Ratcheting fatigue reliability and sensitivity analysis of hydraulic pipe under in-service loadings. Reliab Eng Syst Saf. 2025;264:111293. doi:10.1016/j.ress.2025.111293. [Google Scholar] [CrossRef]
32. Hou J, Jiang Z, Wu F, Lian H, Wang Z, Liu Z, et al. A novel multi-objective topology optimization method for stiffness and strength-constrained design using the SIMP approach. Comput Model Eng Sci. 2025;144(2):1545–72. doi:10.32604/cmes.2025.068482. [Google Scholar] [CrossRef]
33. Zhang X, Pandey MD. Structural reliability analysis based on the concepts of entropy, fractional moment and dimensional reduction method. Struct Saf. 2013;43(1):28–40. doi:10.1016/j.strusafe.2013.03.001. [Google Scholar] [CrossRef]
34. Borgonovo E, Tarantola S, Plischke E, Morris MD. Transformations and invariance in the sensitivity analysis of computer experiments. J R Stat Soc Ser B Stat Methodol. 2014;76(5):925–47. doi:10.1111/rssb.12052. [Google Scholar] [CrossRef]
35. Ye K, Qin L, Ye Z, Yang D, Dong B. Uncertainty analysis of rudder shaft thermal conditions on the flutter characteristics of the hypersonic control surface. Aerosp Sci Technol. 2024;155:109721. doi:10.2139/ssrn.4727103. [Google Scholar] [CrossRef]
36. Wan HP, Todd MD, Ren WX. Statistical framework for sensitivity analysis of structural dynamic characteristics. J Eng Mech. 2017;143(9):04017093. doi:10.1061/(asce)em.1943-7889.0001314. [Google Scholar] [CrossRef]
37. Guo Q, Liu Y, Zhao Y, Li B, Yao Q. Improved resonance reliability and global sensitivity analysis of multi-span pipes conveying fluid based on active learning Kriging model. Int J Press Vessel Pip. 2019;170(4):92–101. doi:10.1016/j.ijpvp.2019.01.016. [Google Scholar] [CrossRef]
38. Li D, Jiang P, Hu C, Yan T. Comparison of local and global sensitivity analysis methods and application to thermal hydraulic phenomena. Prog Nucl Energy. 2023;158(3):104612. doi:10.1016/j.pnucene.2023.104612. [Google Scholar] [CrossRef]
39. Saltelli A, Annoni P, Azzini I, Campolongo F, Ratto M, Tarantola S. Variance based sensitivity analysis of model output. Design and estimator for the total sensitivity index. Comput Phys Commun. 2010;181(2):259–70. doi:10.1016/j.cpc.2009.09.018. [Google Scholar] [CrossRef]
40. Sobol IM. Global sensitivity indices for nonlinear mathematical models and their Monte Carlo estimates. Math Comput Simulation. 2001;55(1–3):271–80. doi:10.1016/s0378-4754(00)00270-6. [Google Scholar] [CrossRef]
41. Zhang X, Pandey MD. An effective approximation for variance-based global sensitivity analysis. Reliab Eng Syst Safety. 2014;121(2):164–74. doi:10.1016/j.ress.2013.07.010. [Google Scholar] [CrossRef]
42. Duong PLT, Tran TT, Raghavan N. Application of multiplicative dimensional reduction method for uncertainty quantification and sensitivity analysis of mems electrostatic actuators. Microelectron Reliab. 2017;76(5):619–25. doi:10.1016/j.microrel.2017.07.091. [Google Scholar] [CrossRef]
43. Minh LQ, Duong PLT, Goncalves J, Kwok E, Lee M. A two-stage approach of multiplicative dimensional reduction and polynomial chaos for global sensitivity analysis and uncertainty quantification with a large number of process uncertainties. J Taiwan Inst Chem Eng. 2017;78(1):254–64. doi:10.1016/j.jtice.2017.06.012. [Google Scholar] [CrossRef]
44. Balomenos GP, Genikomsou AS, Polak MA, Pandey MD. Efficient method for probabilistic finite element analysis with application to reinforced concrete slabs. Eng Struct. 2015;103(3):85–101. doi:10.1016/j.engstruct.2015.08.038. [Google Scholar] [CrossRef]
45. Zhang X, Zhang Y, Pandey MD. Global sensitivity analysis of a CNC machine tool: application of MDRM. Int J Adv Manuf Technol. 2015;81(1):159–69. doi:10.1007/s00170-015-7128-9. [Google Scholar] [CrossRef]
Cite This Article
 Copyright © 2026 The Author(s). Published by Tech Science Press.
This work is licensed under a Creative Commons Attribution 4.0 International License , which permits unrestricted use, distribution, and reproduction in any medium, provided the original work is properly cited.
 Downloads
 Citation Tools