
 Login
Login Register
 Submit a Paper
 Propose a Special lssue
 Open Access
ARTICLE
Prediction and Multi-Objective Optimization of Blast-Induced Dust Emissions in Limestone Mine Blasting Using Gene Expression Programming and Grasshopper Algorithm
1 School of Highway Engineering, Shaanxi College of Communications Technology, Xi’an, China
2 European Organization for Nuclear Research, CERN, Geneva, Switzerland
3 Faculty of Engineering, Tarbiat Modares University, Tehran, Iran
4 Civil Engineering Department, College of Engineering, Rangsit University, Mueang, Pathum Thani, Thailand
* Corresponding Authors: Biao He. Email: ; Seyed Yaser Mousavi Siamakani. Email:
(This article belongs to the Special Issue: Computational Intelligent Systems for Solving Complex Engineering Problems: Principles and Applications-III)
Computer Modeling in Engineering & Sciences 2026, 148(2), 25 https://doi.org/10.32604/cmes.2026.084187
Received 17 April 2026; Accepted 11 June 2026; Issue published 28 August 2026
 View Full Text
 Download PDF
Abstract
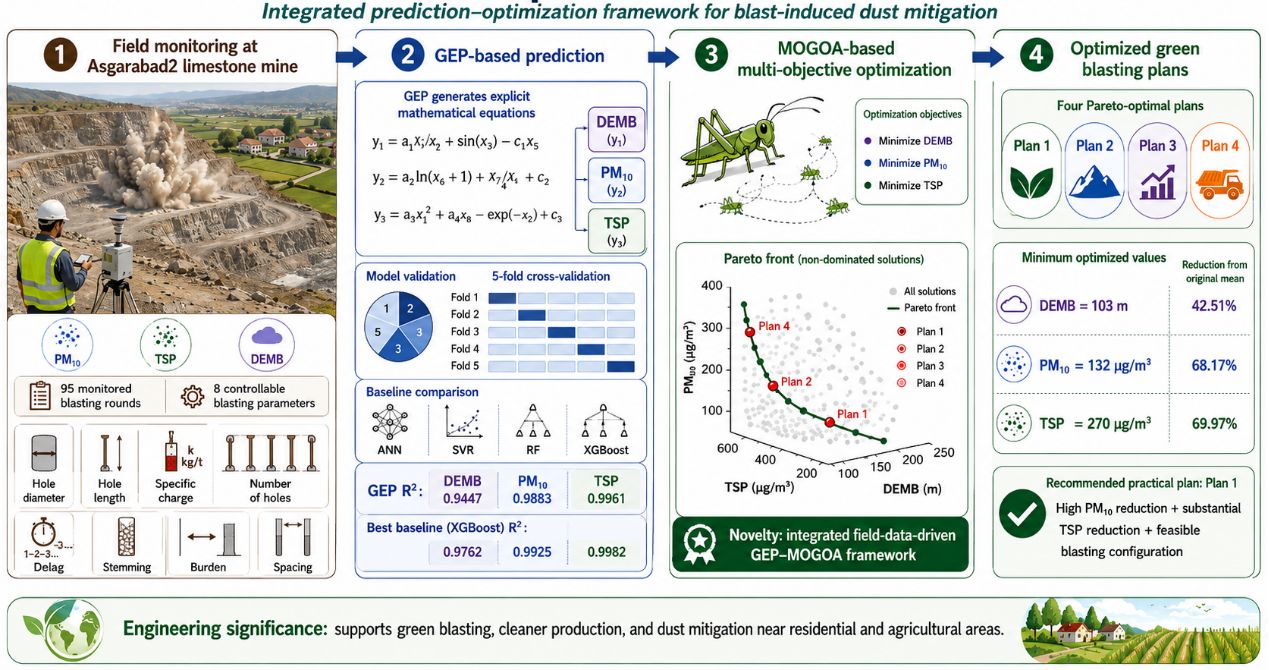
Mining activities are associated with environmental side effects, which can be successfully predicted and strategies proposed for mitigating their adverse impacts. The cleaner production policies of green blasting focus on ecological issues related to mining operations and reduction plans. As a prediction part of this policy, this research proposed a mathematical model named Gene Expression Programming (GEP) to accurately predict the factors that generated pollutions, i.e., total suspended particles (TSP), particles dust with an analogous aerodynamic diameter of less than 10 μm (PM10), and dust emission distance due to mine blasting (DEMB), simultaneously. As the reduction component of the proposed green blasting policy, the multi-objective grasshopper optimization algorithm was coupled with the GEP-derived objective functions to simultaneously minimize DEMB, PM10, and TSP in a limestone mine located near residential and agricultural areas. To strengthen model validation, the predictive performance of GEP was also compared with ANN, SVR, RF, and XGBoost models. The results showed that XGBoost achieved the highest numerical accuracy for DEMB, PM10, and TSP prediction, with R2 values of 0.9762, 0.9925, and 0.9982, respectively. However, the GEP models also showed competitive performance, with R2 values of 0.9447, 0.9883, and 0.9961 for DEMB, PM10, and TSP, respectively, while providing explicit mathematical equations suitable for direct integration into the optimization framework. The MOGOA process generated four Pareto-optimal blasting plans. Among these solutions, the minimum optimized values of DEMB, PM10, and TSP were obtained as 103 m, 132, and 270 μg/m3, respectively. These values correspond to relative reductions of 42.51%, 68.17%, and 69.97%, respectively. Considering both environmental performance and practical feasibility, Plan 1 was recommended as a suitable blasting strategy because it achieved the greatest PM10 reduction and a substantial TSP reduction while maintaining a comparatively more feasible blasting configuration.Graphic Abstract
Keywords
Mining operations are one of the ways for the exploitation of mineral resources underground. On the one hand, the mining industry provides a foundation for other industries, and its constant activity for modern living is vital, but on the other hand, owing to its adverse effects on the environment, it faces crucial challenges. The sub-operations of surface mining, including drilling, blasting, loading, hauling, and dumping, have considerable effects on the external environment [1]. Of those, blasting is a routine operation in the open-pit mines that causes adverse impacts such as dust pollution, sound pollution, gas emission, fly-rock, backbreak, etc. [2]. In a blasting operation, the drilling process is conducted and then is charged with explosive compounds. About eighty-five percent of the explosive strength, representing a substantial portion, is lost due to undesired effects. Dust pollution is one of the crucial impacts, among other consequences, due to mine blasting that is discharged into the atmosphere and affects the ecosystem, human health, wildlife habitat, drinking fresh water, etc. Notably, one of the other effects of dust pollution during mine blasting is on the fauna and flora [3]. The total suspended particles (TSP) and dust particles with an equivalent aerodynamic diameter less than 10 μm (PM10) are dangerous factors for atmospheric pollution and public health [4,5]. PM10 and TSP are associated with ocular, respiratory, and lung diseases. In surface mining, many operations release PM10 dust, such as transportation, drilling, blasting, and dumping [6]. The mentioned activities can be categorized into three main sources: point, line, and area. Of these operations, blasting is classified in the point sources category that discharges dust particles into the surrounding of the mine, and it has become a crucial challenge. Therefore, strict control and accurate estimation of the TSP and PM10 from blasting operations are essential actions in open-pit mining for cleaner mineral production and to control probable hazards [7].
The United States Environmental Protection Agency (USEPA) proposed several empirical models to predict dust concentration and emission. Furthermore, scholars have presented experimental formulas for estimating dust concentration. However, these forecasting models are not appropriate for any condition in mining operations. The number of studies conducted on dust emission caused by blasting is limited. Researchers have focused more on the dust emission in other mining operations. However, the dust emission due to blasting operations can be several times more destructive than other operations.
In the recent decade, traditional models have been proposed as useful methods to estimate blasting environmental side effects. However, these models presented insufficient accuracy and performance level for predicting aims. Therefore, artificial intelligence (AI)-based techniques as robust tools are widely used in engineering problems, especially in earth and mining engineering sciences, for estimating environmental impacts. In the literature of dust pollution prediction due to mining activities, the following studies have been reviewed.
Chelani et al. [8] presented multi-layer back-propagation (BP) perceptron neural networks for predicting PM10 concentration, and the considerable capability of their models was demonstrated. The PM10 and PM2.5 have been predicted by McKendry [9] using a conventional ANN. An ANN was developed by Lal and Tripathy [10] to predict PM10 concentration induced by blasting operation in a surface coal mine exploited in India. In another research, Alkasassbeh et al. [11] highlighted an ANN model based on the autoregressive with external. They presented this model to estimate the PM10 and TSP and concluded that the AI-based models were better and more accurate than other models. In another study, Mishra et al. [12] integrated the ANN model with fuzzy logic to construct an ANFIS model for anticipating TSP. They concluded that the suggested approach is superior compared to conventional ANNs. Dust emission distance is also one of the essential factors in the analysis of areas affected by dust particles. Accurate forecasting of the distance at which dust is emitted helps to find environmental points affected by dust damage. In this regard, Bakhtavar et al. [13] highlighted a model based on a combination of ANN and fuzzy cognitive map to anticipate the distribution of dust emission distance generated in a surface mine in both horizontal and vertical forms. In another study, Bakhtavar et al. [14] anticipated dust pollution distance during blasting rounds utilizing a hybrid fuzzy intelligent probability-based system. They found that AI-based models present the highest capability in comparison of statistical models. Hosseini et al. [15] addressed to an ANN model integration of dimensional analysis for anticipating dust emission distance in a limestone mine. Their developed system is capable of anticipating dust emission distance due to mine blasting (DEMB) with an acceptable degree of accuracy. Fuzzy systems and fuzzy numbers have found acceptable applications in mining and civil engineering domains. The application of AI-based approaches in estimating PM10 and TSP is summarized in Table 1.

Based on the review of relevant literature, although scholars have conducted studies about developing models for anticipating PM10 and TSP in open-pit mines, these are still very sketchy and imprecise. Therefore, more accurate models are required to be developed. Notably, PM10 and TSP intensity in various regions/countries/mines/areas with different rock masses, as well as the meteorological parameters, can be different. Hence, each region needs specific and extensive investigations in order to identify solutions for overcoming residential and employee health and safety challenges. Moreover, controlling solutions in each mine should be analyzed and implemented to minimize PM10 and TSP.
In this study, DEMB, TSP, and PM10 due to blasting operation in surface mines were analyzed and monitored in each blasting round. The Asgarabad2 small-scale limestone mine in Iran was considered a mine with a critical location from an environmental viewpoint. In this regard, different AI-based methods can be used for predicting PM10 and TSP; however, selecting the best technique is a challenging issue. This study aims to develop a predictive model that provides explicit mathematical equations applicable to blast-induced dust assessment. Therefore, the current study developed a GEP model for the first time to estimate PM10 and TSP in open-pit mines. The present study is applicable to the environmental science and mining engineering communities, providing insights for minimizing the impact of PM10 and TSP on the environment.
The probable desirable impact of dust emissions and generation due to mine blasting on the ecosystems surrounding the blast site must be reduced by controlling solutions. In this way, dust reduction may be achieved by adopting two main strategies: (1) implementing preventative attempts before blasting round, and (2) evaluating the influence of dust production on human health and the environment. However, the second effort is a time-consuming and exorbitant solution. There have been fewer research studies reporting on the former solution than the latter, despite the former being the more effective solution. Ionized water bags were proposed by Abdollahisharif et al. [22] to effectively minimize dust pollution due to blasting operation. Zhu et al. [25] suppressed dust using adjusting fundamental foam machine elements for dust reduction. Wang et al. [26] presented an efficient effort using water. They infused water into blasting holes to significantly reduce dust emissions generated from the blast site. Bakhtavar et al. [13] placed water capsules containing ionized combinations in the blast-holes and reduced the distribution of dust emission distance by approximately six times. Apart from the two solutions mentioned, one of the most superlative and economical solutions is to design blasting patterns to minimize the impacts of dust emissions, which the current research would attempt. To the best of the authors’ knowledge, no investigation and studies have been conducted in the literature to obtain the optimal value of blast pattern design factors to minimize simultaneously DEMB, PM10, and TSP, induced from mine blasting.
Despite the progress made in applying empirical, statistical, and artificial intelligence-based methods to blasting-related environmental problems, a clear research gap remains in the field of cleaner production and green blasting. Most previous studies have focused either on predicting a single blasting consequence, such as dust emission distance, PM10, TSP, flyrock, vibration, or back-break, or on applying post-blast mitigation measures after dust has already been generated. However, limited attention has been given to developing an integrated framework that can simultaneously predict and minimize multiple dust-related outputs through the optimization of controllable blasting design parameters. This limitation is particularly important for limestone mines located near residential areas, agricultural lands, and sensitive ecosystems, where blast-induced dust emissions may cause environmental, health, and social concerns. Therefore, the main problem addressed in this study is how to convert field-monitored blasting data into practical green blasting plans that can reduce DEMB, PM10, and TSP before blasting operations are performed. To address this gap, the present study develops an integrated field-data-driven GEP–MOGOA framework. In this framework, explicit GEP-based mathematical equations are first developed for predicting DEMB, PM10, and TSP using 95 monitored blasting records. These equations are then incorporated into the MOGOA framework as objective functions to determine Pareto-optimal blasting patterns. The novelty of this study lies in linking interpretable prediction equations with multi-objective optimization to provide an engineering decision-support tool for simultaneous dust prediction, dust reduction, and cleaner blasting design. This approach advances the state of the art by moving beyond single-output prediction toward practical optimization-based dust mitigation in surface mining.
This study employed the GEP technique to model DEMB, PM10, and TSP for a limestone mine with a critical location that discharged dust particles into the atmosphere. Since there are living areas close to the studied mine, the site is in a dangerous position. The flow of methodology is described in the three-step process as follows. As stated in the research framework, three GEP-based predictive models using effective variables of DEMB, PM10, and TSP were first developed. The GEP models were then used in the MOGOA process as OFs. In this context, the optimization process was further extended, and the general MOGOA was comprehensively detailed.
To provide a clear overview of the methodological procedure, the overall research framework of the present study is illustrated in Fig. 1. The framework consists of five main stages. In the first stage, field data were collected from monitored blasting rounds at the Asgarabad2 limestone mine, and the most influential controllable blasting parameters were selected based on the literature review, physical relevance, data availability, and practical controllability. In the second stage, the collected dataset was preprocessed through normalization and then divided into training and testing subsets. In the third stage, three GEP-based predictive models were developed separately for DEMB, PM10, and TSP, and their performances were evaluated using statistical indices, including R2, RMSE, RAE, MAE, and RRSE. In the fourth stage, the developed GEP equations were incorporated into the MOGOA framework as objective functions, and the controllable blasting parameters were optimized under defined lower and upper bounds. Finally, Pareto-optimal blasting plans were obtained and analyzed to identify suitable green blasting strategies for reducing blast-induced dust emissions. This framework clarifies the connection between prediction, optimization, and practical dust mitigation in the studied mine.

Figure 1: Research framework of the proposed GEP-MOGOA approach for prediction and multi-objective optimization of blast-induced dust emissions.
Step 1: Influential Parameters Gathering
The required database and reviewed relevant research studies were gathered to evaluate the critical situation in this region. Many parameters affect DEMB, PM10, and TSP, such as blasting pattern design, meteorological, and rock mass geo-mechanical parameters. Some of these parameters are controllable, and others are uncontrollable. The corresponding study is tabulated in Table 2, together with the most influential parameters used in DEMB, PM10, and TSP prediction under two main categories: controllable and uncontrollable.

The input variables used in this study were selected according to four main criteria. First, a literature-based screening was performed to identify the parameters most frequently reported in previous studies on blast-induced dust emission, PM10, TSP, and dust emission distance. Second, only parameters with a clear physical relationship with dust generation and dispersion during blasting were considered. Third, the selected parameters had to be available in the field database collected from the monitored blasting rounds at the Asgarabad2 limestone mine. Fourth, since the main purpose of this study was tox develop an optimized blasting pattern, the variables had to be controllable during blast design and implementation. Based on these criteria, eight controllable blasting parameters were selected as model inputs: hole diameter (R), hole length (L), specific charge (Q), number of holes (N), delay timing (TD), stemming (St), burden (B), and spacing (S). Although meteorological variables, including wind speed, wind direction, air temperature, air humidity, and atmospheric pressure, are important factors affecting dust dispersion, they were not used as decision variables in the optimization stage because they cannot be directly controlled by mine engineers. Therefore, the proposed GEP-MOGOA framework was developed using controllable blasting parameters that can be practically adjusted to reduce DEMB, PM10, and TSP.
Based on the reviewed papers in the literature, as given in Table 2, the most critical parameters were considered as effective parameters among all parameters listed in Table 2 as follows:
Among the controllable parameters identified in the reviewed research, the parameters which were used more in the literature review (Table 2) are taken into account as hole diameter (7 times), hole length (5 times), number of holes (4 times), stemming (6 times), burden (6 times), spacing (6 times), delay timing (6 times), and specific charge (3 times).
In addition, five parameters of air humidity (13 times), air temperature (13 times), wind speed (13 times), atmospheric pressure (17 times), and wind direction (7 times) were also the most effective parameters in the majority of the study, as mentioned in Table 2. However, these parameters are uncontrollable and cannot be changed; hence, they cannot be incorporated into the optimization framework.
It is worth noting that in the field of blast-induced dust, two groups of problems, consisting of dust prediction and dust reduction, have been studied. In the first group, as mentioned in recent research such as [13–15,24], both controllable (blasting pattern design factors) and uncontrollable parameters (micro-meteorological parameters) are considered. Similarly, both controllable and uncontrollable parameters are important in the second group of problems, emphasizing the reduction or minimization of the blast-induced dust emission. Differently, our research does not consider the mentioned problems directly. Actually, it focuses on another aspect of the blast-induced dust issue, where a blasting plan with the minimum dust generation would be found as the optimum plan. Given that a blasting plan consists of blasting (controllable) parameters, only the controllable parameters can be variably evaluated in the optimization process. An optimized blast pattern with the minimization objective of dust minimizes the amount of dust instead of the emission distance. Notably, in some specific cases, such as the mine under investigation, where all blasts have been carried out under steady meteorological conditions, the meteorological parameters could be assumed constant.
Step 2: Gene Expression Programming
In this research, the GEP method was used to model the fragmentation and obtain a definite equation. The GEP technique, as an artificial procedure to solve the genotype system, was first invented by Ferreira [30]. This method is a developed version of genetic programming (GP) and follows the evolutionary theorem of population. It includes both the parse trees (genetic programming) and simple linear chromosomes of fixed length (genetic algorithm). Developing a mathematical formula to solve intricate and non-linear problems is possible through evolutionary algorithms (EAs), and especially through GP and GEP [31]. In GEP algorithm, individual solutions are represented as chromosomes and are expressed in K-Expression (Ferreira invented Karva language) to decode programs in the chromosomes (see Fig. 2). As shown in Fig. 2, two principal portions of the head and tail are existed in GEP chromosomes, which only the terminal (i.e., input variables and constant values) is located in the heads part, while both functions and terminal (e.g., ∗, ÷, +, −, Exp, Cot, Pow) is located in the tails part [32]. The head size (hs) is a defined parameter in the GEP process, which can be determined utilizing the trial-and-error approach and also the essence of the issue. While tail size (ts) should be assigned based on the following equation:
where amax is the maximum argument of the functions [30,33].

Figure 2: Structure of a chromosome in the GEP algorithm. (a) K-expression, (b) Expression trees (ETs), (c) Mathematical equation.
Fig. 3 illustrates the steps of GEP modeling. The GEP algorithm was performed by randomly generating chromosomes of the initial population with a fixed length for all individuals [34]. Afterward, the chromosomes are represented as the expression trees, and the fitness of each individual is assessed using the fitness function. The best-fit chromosomes are chosen by the Roulette wheel method [14] to apply the reproduction process in the next generation. Then, four leading genetic operators, involving mutation, inversion, triple recombination operators (One-point recombination, Two-point recombination, and Gene recombination), and triple transportation (IS transposition, RIS transposition, and Gene transposition) operators are implemented on the individuals, respectively, to convert the population and lead to an increase in the capability to generate chromosomes with better fitness. Afterward, the best solutions will be copied into the next step. The iteration continues until the best solution is obtained or the maximum number of generations is met (the stopping condition).

Figure 3: Schematic diagram of the GEP algorithm.
Step 3: Optimal Tuning of Blasting Pattern Based on a Multi-Objective Optimization Algorithm
As aforementioned, an optimal blasting pattern is suggested for optimization of dust pollution due to bench blasting to appropriately perform an eco-friendly scheme and decrease dust dispersion. The optimization algorithm is capable of accurately and efficiently improving the capability of the objective by obtaining its optimum parameters. Owing to the MO nature of the eco-friendly problem and the inherent conflicts between the objectives, MOGOA was employed, utilizing three OFs: PM10, TSP, and DEMB.
The defined function in MO optimization is determined on the basis of the optimal solution set, concerning that all objectives can be viewed as essential. The multi-objective optimization problem (MOP) arises in many applications where two or more functions are optimized concurrently. The MOP can be formulated as follows:
where m, o, n, d are the number of OFs, the number of equality constraints, the number of inequality constraints, and the number of variables, respectively. x = [x1, x2, …, xd] indicates a vector of design.
Variables, gi and hi represent the ith inequality constraint and equality constraint, respectively, and [Li, Ui] represents the ith variable boundaries.
An external archive (A) containing a set of solutions with the highest accuracy can be defined in the MOP, where the problem can be solved in the best way by storing these solutions in the archive. This archive preserves recorded solutions that are generated for the non-dominated solution obtained in the search stage. Firstly, the determined search space is initialized. This archive can be updated repeatedly, and the best solutions are determined as Pareto optimal solutions or non-dominated solutions [35]. In MOP, the obtained solutions owing to multi-criterion comparison metrics are inherently incomparable using logical operators. Therefore, other operators should be considered to extract and determine the preponderance of a solution as opposed to another if it meets the following conditions:
Pareto dominance: provided two vectors V = (v1, v2, …, vn) and W = (w1, w2, …, wn). The vector V is dominated by the vector W if and only if vector W signifies tendentiously less than vector V in the objective spaces, as shown in the following:
In which m indicates the amount of OFs.
Pareto optimal solution (POS): vector W indicates a POS if and only if not dominated by any further solutions acquired.
Optimal Front (PFOptimal) is a set of POS that represents a set of solutions that are not dominated by any others. The optimisation algorithms are implemented with the aim of searching for the highest-accuracy approximation of trustworthy POS, i.e., convergence in the presence of uniformly distributed variables in overall defined objectives [36].
Fig. 4 illustrates a scheme of POS and the non-dominated solution(s) in the MOP. This is an MOP with two OFs (two-dimensional space), and the purpose is to minimize the OFs. In the overview of non-dominated solutions, the f1 and f2 values related to the C solution are more than the f1 and f2 values of the A and B solutions, i.e., f1(C) > f1(A) and f1(C) > f1(B). Accordingly, C is dominated by A and B. Nevertheless, the A and B solutions do not dominate each other and are recognized as non-dominated solutions [37].

Figure 4: An illustrative scheme of the Pareto optimal solution.
Grasshopper Optimization Algorithm
In the first, GOA was presented by Saremi et al. [38]. The GOA originates from the natural swarming behavior of grasshoppers. The position of grasshoppers in a population denotes a feasible solution to a certain optimization problem, which Eq. (4) calculates the situation of the ith grasshopper and simulates the triple component:
In this Equation, Xi denotes the location of the grasshoppers, Si stands for the social interaction, Gi indicates the gravity force on the ith grasshopper, and Ai denotes the wind flow.
The three components of the social interaction (Si), wind advection (Ai), and gravity (Gi) make up the flying pathway of a grasshopper colony [39]. The social interaction component is the principal exploration tool in the grasshopper algorithm, which is determined as Eq. (5):
in which
In which f is the strength of attraction, r is a random number in [0, 1], and l denotes the attractive length scale.
The “s” function creates attraction and repulsion between the grasshopper’s swarm. The distance among the grasshoppers is so influential in a swarm movement. Examining Fig. 5, as it is seen, if the length between the ith and jth grasshoppers varies from 0 to 2.079, they repulse each other so that they do not collide with each other. Until the distance between two grasshoppers varies from 2.079 to 4, attraction strength rises between grasshoppers to preserve continuity and prevent irregular dispersion of artificial grasshoppers. The Comfort zone is an area where attraction and repulsion forces do not work, and occurs if the distance between the grasshoppers is accurately 2.079. After the attraction force reaches 2.079, it rises again and goes up to the limit of 4, and finally begins to decrease gradually. A schematic model of the grasshopper swarm and the types of forces that exist between them is shown in Fig. 6 [39]. If the strength of attraction and the attractive length scale (parameters l and f in Eq. (6)) of grasshopper populations changes within a certain range, their social behaviors change as a function of distance (Fig. 7). Although the s function has particular merit in simulating the social behavior of artificial grasshoppers, it still cannot implement sufficient forces between grasshoppers with vast distances between them. Mapping or normalizing the distance between each grasshopper between 1 and 4 dissolves this problem completely.

Figure 5: Function s when l be 1.5 and f be 0.5.

Figure 6: Repulsion and attraction force with the comfort zone in GOA (based on [39]).

Figure 7: Changing the l or f value and its effect on function s behavior.
The Gi element in Eq. (7) is determined as follows:
in which g is the gravitational constant,
The Ai element in Eq. (8) is determined as follows:
where u is the constant drift,
According to Eqs. (2), (4) and (5),
A balance between exploration and exploitation phases is a crucial issue in order to have an efficient optimization algorithm. In other words, performing accurate and effective exploration and exploitation operations reasonably approximates the global optimum and solves major optimization problems. Eq. (9), as a mathematical model, must have certain parameters to present explorations and exploitations in various optimisation steps. Therefore, the following mathematical equation solves these problems:
In which the upper and lower bounds are shown as ubd and lbd in the dth dimension,
Noteworthy that s parameter is approximately similar to the s parameter in Eq. (4). Nevertheless, we do not examine the gravity force between the grasshoppers (Gi element) and always consider the unit vector in the direction of wind towards a target. Notably, the c parameter inside parentheses reduces repulsion or attraction forces between swarm grasshoppers in proportion to the number of iterations. But the c parameter outside parentheses decreases the search coverage around the target in proportion to the iteration counter. By applying Eq. (11), the c parameter is updated, leading to a gradual reduction in explorations and a corresponding increase in exploitations over successive iterations.
In this equation, cmax and cmin are the max and minimum values of the c parameter, l stands for the present repetition, and L stands for the max number of iterations. The flowchart representation of the grasshopper algorithm is demonstrated in Fig. 8.

Figure 8: The flowchart representation of GOA.
3 Case Study and Data Analysis
The monitoring of blasting rounds for collecting required data was performed in the Asgarabad2 mine. This mine operates on a small scale, in which a 12.3 million-ton ore deposit is extracted to fulfill the demand for raw materials required by the Urmia White Cement Plant. The geographical location and topographical map of this mine are illustrated in Fig. 9. As seen, many inhabited areas (over 150 villages and one city), Salt Lake Urmia, and adjacent farms (more than 150 km2) are located in very close proximity to the mine.

Figure 9: Geographical location and topography of the mine area together with a blasting shot.
The appropriate explosive material utilized in the mine is a mixture of ammonium nitrate and fuel oil (ANFO). First, a pattern is designed, and several holes are drilled in the rock mass. Then, drill holes are charged by using ANFO and emulite cartridge. Finally, charged drill holes are blasted by considering the defined delay timing. According to the review of previous papers, the most important blasting parameters on DEMB, PM10, and TSP, including the number of holes, delay timing, stemming, hole diameter, burden, spacing, charge per delay, and hole length, were immediately measured after 95 blasting shots and employed in constructing the proposed model. The annual descriptive statistics of controllable parameters of monitored blasting rounds are recorded in Table 3.

Notably, Pearson’s correlation matrix of parameters is demonstrated in Fig. 10, which shows the relativity between the inputs and outputs as well as relativity between each input parameter together. The correlation matrix shows that the dust-related outputs are influenced by different blasting parameters with varying degrees of linear association. DEMB shows relatively strong positive correlations with hole length, burden, and spacing, with correlation coefficients of 0.66, 0.57, and 0.58, respectively. In contrast, delay timing shows a noticeable negative correlation with DEMB, with a coefficient of −0.69. For PM10, the highest positive correlations are observed with specific charge and burden, with coefficients of 0.68 and 0.57, respectively, while delay timing has a negative correlation of −0.48. Similarly, TSP is positively correlated with specific charge and burden, with coefficients of 0.51 and 0.48, respectively, and negatively correlated with delay timing, with a coefficient of −0.53. These results indicate that parameters related to explosive energy distribution and blast geometry play an important role in dust generation and dispersion. Moreover, the three output variables are positively correlated with each other, as DEMB–PM10, DEMB–TSP, and PM10–TSP have correlation coefficients of 0.52, 0.53, and 0.47, respectively.

Figure 10: Pearson correlation matrix of input parameters and dust-related outputs, including DEMB, PM10, and TSP.
To better illustrate the characteristics of the input and output parameters, a violin plot is demonstrated in Fig. 11. The violin plots provide information on both the probability density and the spread of each variable, while the internal box plots show the median and interquartile range. The figure indicates that some blasting parameters, such as burden and spacing, have relatively narrow distributions, reflecting the operational constraints of the blasting pattern in the studied mine. In contrast, variables such as the number of holes, specific charge, PM10, and TSP show wider distributions, indicating greater variability among the monitored blasting rounds. The output variables, particularly PM10 and TSP, exhibit wider dispersion than several input parameters, confirming that dust concentration is highly variable and affected by the combined influence of multiple blasting factors.

Figure 11: Violin plot of input and output parameters.
To improve the transparency and verifiability of the field database, a representative portion of the monitored blasting records is presented in Table 4. The table includes the main controllable blasting parameters and measured dust-related outputs used for model development. The full database consisted of 95 monitored blasting rounds, while Table 4 provides representative raw records to show the structure and range of the dataset. Each record contains eight controllable blasting parameters, namely hole diameter, hole length, specific charge, number of holes, delay timing, stemming, burden, and spacing, together with meteorological variables and the measured outputs, including DEMB, PM10, and TSP.

Meteorological conditions were also recorded during the field monitoring program because they directly affect the dispersion and transport of blast-induced dust. The monitored meteorological variables included air humidity, air temperature, wind speed, atmospheric pressure, and wind direction. Table 5 summarizes the actual variation of these variables during the monitored blasting rounds. As shown in the table, air humidity varied from 3% to 30%, air temperature ranged from −3.2°C to 26.3°C, and wind speed ranged from 3.6 to 8.8 km/h. Atmospheric pressure showed a relatively narrow variation, ranging from 84.2 to 84.77 kPa. Wind direction varied from 40° to 270°, with a mean value of 132°, indicating that dust dispersion direction could vary among blasting events. These results confirm the importance of meteorological conditions in blast-induced dust transport.

However, these meteorological variables were not included as decision variables in the optimization framework because they cannot be directly adjusted through blasting design. In contrast, parameters such as hole diameter, hole length, specific charge, number of holes, delay timing, stemming, burden, and spacing can be controlled by mine engineers before blasting. Therefore, the proposed MOGOA framework focused on controllable blasting parameters to identify practical blasting patterns for reducing DEMB, PM10, and TSP. Meteorological variables were considered as field environmental conditions affecting dust dispersion, while controllable blasting parameters were used as optimization variables.
Although meteorological variables were recorded and reported in this study, they were not included as input variables in the GEP models or as decision variables in the MOGOA framework. This exclusion introduces a source of uncertainty because blast-induced dust dispersion is strongly affected by environmental conditions, particularly wind direction, wind speed, air humidity, and temperature. As shown in Table 5, some meteorological variables, especially wind direction and air humidity, exhibited noticeable variation during the monitored blasting rounds. Therefore, the predicted and optimized dust-related outputs should be interpreted within the range of meteorological conditions observed in the field database.
The main reason for excluding meteorological variables from the optimization decision space is that they cannot be directly controlled by mine engineers during blast pattern design. The objective of the present study was to optimize controllable blasting parameters, including hole diameter, hole length, specific charge, number of holes, delay timing, stemming, burden, and spacing. Nevertheless, meteorological variability may influence the uncertainty of DEMB, PM10, and TSP predictions. Therefore, the optimized blasting plans proposed in this study should be considered site-specific engineering candidates and should be implemented with attention to real-time weather conditions, especially unfavorable wind direction or high wind speed.
Future studies should incorporate meteorological variables into the prediction–optimization framework using scenario-based analysis. For example, separate optimization scenarios can be developed for low-, moderate-, and high-wind conditions or for different dominant wind directions. Coupling the proposed GEP–MOGOA framework with dust dispersion models or real-time meteorological monitoring could further improve the robustness and practical applicability of optimized green blasting plans under variable environmental conditions.
3.2 Field Monitoring and Dust Measurement Procedure
Field monitoring was conducted during 95 blasting rounds at the Asgarabad2 limestone mine to establish a database for predicting and optimizing blast-induced dust emissions. For each blasting round, both blasting design parameters and dust-related response variables were recorded. The monitored input parameters included R, L, Q, N, TD, St, B, and S. The output variables consisted of DEMB, PM10 concentration, and TSP.
As shown in Fig. 12, PM10 and TSP concentrations were measured using a portable real-time dust monitoring system equipped with size-selective particulate matter sampling capability. The PM10 concentration was recorded using a PM10 aerosol monitoring channel. At the same time, TSP was measured using the total suspended particle monitoring mode of the same portable dust monitoring system or an equivalent high-volume suspended particulate sampler. The monitoring equipment was installed at a downwind monitoring station selected according to the expected direction of dust movement after blasting. The sampling point was located in an open area without local obstructions to ensure that the measured dust plume accurately represented blast-induced dust dispersion. The inlet of the monitoring device was positioned approximately 1.5 m above ground level to represent near-surface exposure and the breathing-zone height commonly used in field dust monitoring.

Figure 12: Schematic representation of the field monitoring procedure for blast-induced dust.
For each blasting round, the monitoring device was activated before detonation to record the ambient background dust concentration. Background monitoring was carried out for approximately 10 min before blasting. After detonation, PM10 and TSP monitoring continued for approximately 20–30 min, or until the visible dust plume had substantially dispersed and the measured concentrations approached the pre-blast background level. The PM10 and TSP values used in the modeling database were obtained from the maximum background-corrected concentration recorded during the post-blast dust dispersion period. This approach was adopted because the highest short-term concentration is more representative of the immediate dust impact generated by a blasting event.
To minimize the effect of pre-existing ambient dust, background correction was applied by subtracting the pre-blast background concentration from the post-blast measured concentration. The corrected concentration was calculated as follows:
where Ccorrected is the background-corrected blast-induced dust concentration, Cpost-blast is the maximum concentration measured after detonation, and Cbackground is the average concentration measured during the pre-blast background monitoring period. Before each monitoring campaign, the dust monitoring device was inspected, zero-checked, and calibrated according to the manufacturer’s recommended procedure. The flow rate and sampling inlet were also checked to ensure stable operation during field measurements.
DEMB was defined as the maximum horizontal distance from the blast source to the farthest visible boundary of the dust cloud or dust deposition zone after each blasting event. This distance was measured along the dominant downwind direction using a handheld GPS receiver, field markers, and laser rangefinder measurements where accessible. Immediately after detonation, the dust plume movement was visually tracked by field observers, and the farthest point reached by the visible dust cloud was identified. The horizontal distance between this point and the blast source was then recorded as the DEMB value for that blasting round. This definition was used because DEMB represents the spatial extent of blast-induced dust dispersion and is directly related to the potential exposure of nearby agricultural lands, residential areas, mine facilities, and sensitive environmental receptors.
The field monitoring procedure, therefore, consisted of six main steps: pre-blast preparation, background monitoring, blast event observation, post-blast dust sampling, DEMB measurement, and database construction. The collected dataset was subsequently used for GEP-based prediction of DEMB, PM10, and TSP and for MOGOA-based multi-objective optimization of blasting parameters.
During the field monitoring program, meteorological conditions were recorded to characterize the environmental conditions under which the blasting rounds were performed. The monitored meteorological variables included wind speed, wind direction, air temperature, and relative humidity. These parameters were measured using a portable field meteorological station installed near the dust monitoring location and were also checked against local meteorological records. Wind direction was particularly important because DEMB was measured along the dominant dust dispersion direction. The monitored blasting rounds were conducted under relatively comparable meteorological conditions to reduce the influence of extreme weather variability on the dust database. Nevertheless, the meteorological variables were not used as optimization variables because they cannot be controlled during blast pattern design. Instead, the optimization framework focused on controllable blasting parameters that can be practically adjusted by mine engineers.
In this research, GEP technique was constructed to anticipate DEMB, PM10, and TSP, where their dependability of effectively should be evaluated. In this regard, five statistical metrics, including coefficient of determination (R2), root mean-squared error (RMSE), relative absolute error (RAE), mean absolute error (MAE), and root relative squared error (RRSE) are calculated to denote the relationship between the measured and estimated DEMB, PM10, and TSP values. The computation formula of these indices is as follows [40]:
where, n stands for the number of data, Oi, Pi and
This study develops a GEP model with eight independent parameters and one target parameter to anticipate DEMB, PM10, and TSP in Asgarabad2 limestone mine. In the first step, the collected dataset were normalized in the interval [0, 1] to simplify the modeling procedure as follows [13]:
where xnorm denotes randomized values, xi is measure data, xmin and xmax denote the min and max values of data [13].
In the model development stage, the normalized dataset was initially divided into five folds. This split was used to develop and report the original GEP equations and their train–test performance. However, considering the relatively small size of the database, which consisted of 95 monitored blasting records, relying only on a single random split may not be sufficient to demonstrate model robustness. Therefore, the final validation strategy was strengthened by applying a 5-fold cross-validation framework.
In the 5-fold cross-validation procedure, the dataset was randomly divided into five approximately equal subsets. In each iteration, four folds were used for model training, while the remaining fold was used for testing. This process was repeated five times so that each fold was used once as the testing subset. The final performance was then reported as the mean and standard deviation of the evaluation indices across the five folds. This procedure was applied to the GEP models and the baseline machine-learning models to provide a more reliable assessment of model generalization and to reduce the possible bias associated with a single train–test split.
In this step, different GEP models with various numbers of genes, chromosome length, and head size were obtained. However, a better GEP equation is only selected as the most accurate model based on performance indices defined in Eqs. (13)–(17). Adjusting parameters required to construct the GEP model are reported in Table 6. The best or most accurate model has the highest R2 and lowest RMSE, RAE, MAE, and RRSE. For the best model, the calculated value of R2 should be close to 1, and the calculated value of RMSE, RAE, MAE, and RRSE should be close to 0.

By importing controllable parameters listed in Table 3 into the estimation phase of the modeling process, the GEP model was separately obtained to estimate the DEMB, PM10, and TSP. A GEP model with the maximum accuracy and minimum error level was achieved among 8 various GEP models. The mathematical formula related to the GEP predictive DEMB model is represented in Eqs. (19)–(26). As can be seen, this model involves seven genes. The properties of the DEMB model are mentioned in Table 6, which denotes that the linking function of genes is “subtraction”, the chromosome length was 90, and the head size was set as 8. These values attained the best GEP model for the prediction of DEMB.
Furthermore, the mathematical expressions related to PM10 predictive models were formulated in Eqs. (27)–(31). Based on Table 6, the predictor PM10 model includes 4 genes linked through the “substruction” linking function and head size of 6 and chromosome length of 125.
Moreover, the TSP predictive model is constructed using 3, 55, 6, “addition” for the number of genes, chromosome length, head size, and linking function, respectively. The GEP expression formula for TSP prediction is shown as Eqs. (32)–(35).
Sub-ETs related to generated genes in GEP predictive models of DEMB, PM10, and TSP are demonstrated in Fig. 13. These schemes represent how genes structure GEP models by using genetic operators, number of genes, chromosome length, head size, linking function, and function set. Circles (nodes) enclose operators and controllable parameters; however, arrows connect nodes to link a unique form of an equation. As shown in Fig. 13, sub-ET1, sub-ET2, …, sub-ETn is the schematic form of gene1, gene2, …, genen, respectively. The recorded values of DEMB, PM10, and TSP parameters are compared to the predicted values in Fig. 14. Besides, the statistical indices were calculated to train and test parts, as illustrated in Fig. 14. Noteworthy that the obtained GEP models are used in the optimization framework in the form of OFs to lead to the minimum value of DEMB, PM10, and TSP in the Asgarabad2 mine.

Figure 13: Sub-ETs of GEP models for predicting DEMB, PM10, and TSP.

Figure 14: Measured and predicted of the DEMB, PM10, and TSP models.
Based on Fig. 14, it is revealed that the GEP model has an acceptable performance in estimating DEMB with an R2 of (0.9447 and 0.9179), RMSE of (4.6717 and 5.5212 m), RAE of (0.2183 and 0.2614), MAE of (3.4844 and 3.8946 m), and RRSE of (0.2356 and 0.2834) on the training and testing parts, respectively. The GEP model also performed well in estimating PM10 in this study with an R2 of (0.9883 and 0.9413), RMSE of (14.4479 and 18.3938 μg/m3), RAE of (0.1000 and 0.5158), MAE of (11.8862 and 15.5469 μg/m3), and RRSE of (0.1084 and 0.5464) for the training and testing phase, respectively. The results show that the capability of the DEMB model is slightly poorer than that of the PM10 model. Furthermore, the value of R2 of (0.9961 and 0.9590), RMSE of (23.9327 and 26.0958 μg/m3), RAE of (0.0645 and 0.2009), MAE of (19.7917 and 23.1494 μg/m3), and RRSE of (0.0631 and 0.2043) on the train and test dataset of GEP predictive model indicated that the TSP predictive system was the most accurate system among the DEMB and PM10 systems.
4.2 Strengthened Model Validation and Baseline Comparison
To further evaluate the generalization capability of the developed predictive models, the validation procedure was strengthened. Since the available database consisted of 95 monitored blasting records, a single random partition may be affected by sampling bias and may not fully reflect the predictive stability of nonlinear models. Therefore, a 5-fold cross-validation framework was adopted in this study. As shown in Fig. 15, the dataset was randomly divided into five approximately equal subsets. In each iteration, four folds were used for model training, while the remaining fold was used for testing. This procedure was repeated five times so that each fold was used once as the testing subset. The final model performance was then evaluated based on the average prediction performance across the five folds.

Figure 15: Strengthened model validation framework based on 5-fold cross-validation and baseline model comparison for DEMB, PM10, and TSP prediction.
Fig. 15 illustrates the strengthened validation framework used in this study. The procedure includes random shuffling of the 95 blasting records, splitting the database into five folds, iterative training and testing, comparison with baseline models, and evaluation using statistical performance indices. The same eight input variables, namely hole diameter, hole length, specific charge, number of holes, delay timing, stemming, burden, and spacing, were used for all models. The target outputs were DEMB, PM10, and TSP.
In addition to the proposed GEP models, four baseline machine-learning models were developed for comparison: artificial neural network (ANN), support vector regression (SVR), random forest (RF), and extreme gradient boosting (XGBoost). The comparison was performed using the same input variables, output variables, and evaluation criteria. The results are summarized in Table 7.

As presented in Table 7, all nonlinear models provided acceptable predictive performance for the three dust-related outputs. Among the baseline models, SVR showed the weakest performance, with R2 values of 0.8784, 0.9194, and 0.9362 for DEMB, PM10, and TSP, respectively. ANN improved the prediction accuracy compared with SVR; however, its errors remained higher than those of the ensemble-based models. RF and XGBoost produced the strongest numerical performance among the baseline models, confirming the capability of ensemble learning techniques to capture nonlinear relationships in blast-induced dust prediction.
For DEMB prediction, XGBoost achieved the highest R2 value of 0.9762 and the lowest RMSE and MAE values of 3.1379 and 2.6830 m, respectively. The proposed GEP model also showed strong performance, with an R2 of 0.9447, RMSE of 4.6717 m, and MAE of 3.4844 m. For PM10 prediction, XGBoost again provided the best numerical accuracy, with an R2 of 0.9925, RMSE of 11.6271 μg/m3, and MAE of 9.7653 μg/m3. The GEP model achieved a comparable R2 of 0.9883, with RMSE and MAE values of 14.4479 and 11.8862 μg/m3, respectively. Similarly, for TSP prediction, XGBoost obtained the highest R2 of 0.9982, while the GEP model achieved a very close R2 value of 0.9961.
Although XGBoost provided the best numerical accuracy, the GEP models were selected for integration with the MOGOA framework because they provide explicit mathematical equations. This feature is a major advantage for optimization-based engineering applications, as the generated equations can be directly used as objective functions for DEMB, PM10, and TSP minimization. In contrast, black-box models such as ANN, RF, and XGBoost are less transparent and are more difficult to directly interpret or implement as analytical objective functions. Therefore, the proposed GEP models offer an effective balance between prediction accuracy, interpretability, and practical applicability for green blasting optimization.
Although the available dataset consisted of 95 monitored blasting records, the risk of overfitting was reduced by applying the same preprocessing procedure and 5-fold cross-validation framework to all predictive models. Nevertheless, because the dataset size is relatively limited, the developed models should be interpreted as site-specific predictive tools, and further validation using larger datasets from different mines and blasting conditions is recommended in future studies.
To provide a more reliable assessment of model robustness under the limited dataset size, the final validation strategy was based on 5-fold cross-validation. In this procedure, the performance of each model was evaluated across five validation folds, and the final results were reported as the mean and standard deviation of R2, RMSE, and MAE. The same validation procedure was applied to all predictive models, including ANN, SVR, RF, XGBoost, and GEP, for the three target outputs, namely DEMB, PM10, and TSP. The summarized cross-validation results are presented in Table 8.

The 5-fold cross-validation results confirm that the developed models maintained stable predictive performance across different validation folds. XGBoost achieved the highest numerical accuracy for the three dust-related outputs, with R2 values of 0.9718 ± 0.0031, 0.9869 ± 0.0035, and 0.9934 ± 0.0031 for DEMB, PM10, and TSP, respectively. However, the GEP models also showed competitive and stable performance, with R2 values of 0.9399 ± 0.0032, 0.9822 ± 0.0032, and 0.9897 ± 0.0026 for DEMB, PM10, and TSP, respectively. The relatively small standard deviations indicate that the model performances were not strongly dependent on a single data split. Although XGBoost provided the best numerical accuracy, GEP was selected for the optimization stage because it generates explicit mathematical equations that can be directly embedded into the MOGOA framework as objective functions. Therefore, the final model selection considered not only predictive accuracy, but also interpretability and suitability for optimization-based engineering implementation.
4.3 Blasting Pattern Optimization
This study uses a grasshopper optimization algorithm in an MO framework (herein named MOGOA) for determining the optimal blasting plan. The first step in the MOGOA is defining OFs. In this regard, the GEP predictive models for DEMB, PM10, and TSP are adjusted in the MOGOA framework.
In the second step, the constraints of the modeling process should be determined as shown in Table 9, 20% less than the minimum and 20% more than the maximum values of blasting parameters were respectively defined as lower and upper bounds required in MOGOA. The three OFs related to DEMB, PM10, and TSP are defined through Eqs. (36)–(38).

The lower and upper bounds of the optimization variables were defined based on the observed range of the monitored blasting database. To allow the optimization algorithm to search for improved blasting patterns beyond the historically implemented designs, a limited engineering extension of 20% below the observed minimum and 20% above the observed maximum was considered for each controllable blasting parameter. This extension was selected as a controlled search margin rather than an unrestricted extrapolation range. It provides the MOGOA with sufficient flexibility to identify improved blasting configurations while maintaining the search space close to the practical range of blasting operations at the studied mine.
However, because GEP is a data-driven model, predictions outside the observed range may involve extrapolation uncertainty. Therefore, the optimized solutions obtained within the extended bounds were interpreted as engineering candidate plans rather than directly universal blasting prescriptions. Before implementation, each optimized plan should be checked against operational feasibility, drilling equipment capacity, bench geometry, explosive loading practice, safety requirements, and site-specific production constraints. In this study, the 20% extension was used to explore feasible improvements in blasting design while avoiding excessively unrealistic parameter combinations. This strategy provides a balance between optimization flexibility and engineering practicality.
In the third step, the values for cmin, cmax, and the number of populations of grasshoppers were determined to be 75, 1, and 3 × 10⁻⁶, respectively, and were fixed based on the trial-and-error procedure. Actually, the number of grasshoppers 75 deals with the minimum values of the cost functions. In addition, the optimization process was performed in 1000 iterations. The MOGOA was examined for specifying optimum input and output values utilizing the developed DEMB, PM10, and TSP, in which the optimized values of each factor are given in Table 10. A total of 25 runs were carried out based on the MOGOA. The optimization results tabulated in Table 10 indicate the Pareto solution of blasting plan parameters. The Pareto solutions achieved by the trained algorithm are illustrated in Fig. 16. As can be found, 4 solutions are selected as the best blasting plan. According to the achieved results, 4 non-dominant blasting plans for the Asgarabad2 mine were obtained. Each can be considered a solution to dust reduction, and mine managers choose and implement one blasting plan according to purpose. For example, if the mine is searching to minimize the DEMB, it must implement Plan 4.


Figure 16: Pareto-optimal plot and chosen best solutions.
The optimization results indicate that the proposed MOGOA framework can substantially reduce the dust-related outputs compared with the original mean values. For DEMB, the optimized values obtained from Plans 1–4 were 126, 117, 104, and 103 m, respectively, corresponding to reductions of 29.67%, 34.70%, 41.95%, and 42.51%. Therefore, Plan 4 produced the lowest DEMB value. For PM10, the optimized concentrations were 132, 143, 153, and 166 μg/m3, corresponding to reductions of 68.17%, 65.52%, 63.11%, and 59.98%, respectively. Thus, Plan 1 achieved the greatest PM10 reduction. For TSP, the optimized values were 293, 277, 276, and 270 μg/m3, corresponding to reductions of 67.41%, 69.19%, 69.30%, and 69.97%, respectively. Therefore, Plan 4 provided the greatest reduction in TSP. These corrected values show that all optimized plans considerably reduce blast-induced dust pollution, while the choice of the most suitable plan should consider both environmental performance and practical blasting feasibility.
Although the implementation of Plan 4 generates the minimum value of DEMB and TSP, it is costly because the number of holes in this plan is high (226) and requires more ANFO. The authors proposed plan 1 to implement in the Asgarabab2 mine because it significantly reduces PM10 and TSP. To overcome DEMB effects, ionized water ampules are suggested by Abdollahisharif et al. [22] can be applied.
In the Asgarabad2 mine, the designation of the blasting patterns as performed experimentally and the implementation of blasting rounds is carried out traditionally. Therefore, it is very difficult to monitor and control dust emission and its negative environmental impacts. Hence, the blasting plan by MOGOA deals with optimum values of controllable parameters and minimizes DEMB, PM10, and TSP, which is an eco-friendly policy.
The latter stage of the study is to determine the sensitivity of the DEMB, PM10, and TSP to each influential parameter. In this study, factor (r) is calculated to specify sensitivity analysis, which can be computed as follow:
where
The higher the value of r, the more severe the impact of the inputs on the outputs. The impact of the output(s) on the inputs is illustrated in Fig. 17, schematically. As a result, parameters of the number of holes and delay timing negatively affect DEMB, PM10, and TSP, and the rest of the inputs positively affect the DEMB, PM10, and TSP outputs.

Figure 17: Strengths of relations between effective parameters and DEMB, PM10, and TSP.
The parameter of stemming has the most impact (r = 0.843) on DEMB, and the number of holes has the lowest effect (r = −0.317) on DEMB. Furthermore, the values of 0.956 and 0.097 were obtained for parameters of hole length and hole diameters; therefore, L and R are the most effective (r = 0.956) and least effective (r = 0.097) parameters on PM10. In addition, the hole length with r value of 0.979 has the highest impact, and the spacing with r value of 0.212 has the lowest impact on TSP.
4.5 Environmental and Health Risk Assessment of Dust Emissions
This sub-section examines the effect of limestone dust on both the internal and external mine environment. Risk management involves the systematic implementation of each of the following steps:
In the first step, risk should be identified. Then, the identified risk should be evaluated. In the subsequent step, applying measures to reduce potential risks is important. Finally, monitoring and reviewing end the risk management process. Solid particles are classified as dust when their aerodynamic diameter is less than 75 μm, according to the definition established by the International Organization for Standardization (ISO). In the mining operation, dust particles can be generated and released during different operational activities such as mining, transportation, crushing, etc. In the present research, the potential risk of dust pollution during mine blasting (limestone dust) was studied. Table 11 illustrates the essential information from the limestone Asgarabad2 mine needed to evaluate the dust emission risk at the surface station. This information is prepared using various points inside and outside the mine pit, as shown in Fig. 18. Each of the points shown in Fig. 18 can be affected by dust. But the most important points are listed in Table 11. Numerous studies have investigated the effect of limestone dust on the surrounding agriculture and residential regions, highlighting its adverse effects on both ecosystems and the health of mine workers.


Figure 18: The location of blasting sources and other points under the dust emission distance risk in Asgarbad2 mine.
Limestone dust poses several adverse effects on human health, particularly among workers and personnel in mining environments. Limestone primarily consists of approximately 95% calcium carbonate (CaCO3) and a smaller proportion of magnesium carbonate (MgCO3). When inhaled, the crystalline silica content (ranging from 1%–20%, with concentrations of 2–5 mg/m3) can trigger inflammatory responses in the respiratory system. Exposure may lead to irritation of the airways, narrowing of the respiratory passages, and other related symptoms. To mitigate these risks, early monitoring of dust levels and assessing Interleukin-8 (IL-8) serum responses to crystalline silica are recommended [41].
Beyond human health, limestone dust can accumulate on the leaves, twigs, and bark of plants. In regions with frequent rainfall, this thin layer of dust is often washed away, whereas in arid areas, it can persist, causing long-term damage. Dust deposition alters the leaf surface, disrupts energy balances, and inflicts harm due to the alkaline nature of limestone. It also obstructs stomata and accelerates chlorophyll degradation, ultimately impairing photosynthesis and threatening plant health [42].
Additionally, due to its high carbonate content, limestone dust significantly increases soil pH when deposited in large quantities [43]. This rise in alkalinity can limit the availability of essential nutrients, which is particularly concerning in regions with extensive agriculture and livestock grazing, potentially leading to dissatisfaction among local communities. Interviews with miners, farmers, and villagers indicated that the most noticeable impacts of limestone dust were observed on vegetation and garden crops. The impact of dust in this area is shown using the following equations. Among the main consequences of the events in the Asgarabad2 limestone mine due to the dust emission are:
- Damage to plants and gardens (D1)
- Appearance of lung and respiratory diseases (D2)
- Agricultural soil pollution (D3)
- Contamination of livestock drinking water (D4)
According to the studies and the opinions of various experts in this field, the percentage of damage caused by dust-related consequences is as follows:
- 70% Damage to plants and gardens (R (D1))
- 5% Appearance of lung and respiratory diseases (R (D2))
- 20% Agricultural soil pollution (R (D3))
- 5% Contamination of livestock drinking water (R (D4))
It should be noted that the above cases are relative redress and these percentages can be changed according to the project and the redress. The total damage to the mine due to the dust emission can be calculated from the following equation.
where A is the amount of relative damage. Finally, the risk of the points marked in Table 12 can be expressed as follows:

A ten-year analysis of the region’s wind patterns revealed that the prevailing winds originate from the southeast. Consequently, this dominant wind direction carries dust toward densely cultivated gardens, agricultural fields, urban areas, and over 120 surrounding villages. These areas are therefore particularly vulnerable to dust deposition, highlighting the urgent need for the implementation of innovative mitigation strategies. Abdollahisharif et al. [22] Suggested the use of water bags containing ionized combination. This type of bag is used after charging. Placing a bag on top of the blasthole has been shown to capture a substantial quantity of dust particles and toxic gases generated during blasting. This approach can effectively limit dust dispersion in the immediate area. While personal protective equipment such as masks, gloves, and safety gear can help reduce exposure for mine workers, these measures cannot prevent dust from affecting nearby gardens, villages, or other sensitive areas. Additionally, dust emissions within the mine can be further minimized by optimizing the blasting pattern.
The Asgarabad2 small-scale limestone mine has newly emerged as a significant ecological concern due to its proximity to residential areas and agricultural lands, raising considerable concern among local communities. As illustrated in Fig. 18, the areas most vulnerable to the mine’s impacts include a town located 1.42 km away and over 125 surrounding villages. This mine is also encompassed by thick vegetation within a 16 km radius, covering approximately 142 km2 of agricultural gardens. Furthermore, the nearby arid regions to the northwest and a Salt Lake situated 10 km from the mine add to the environmental sensitivity of the area.
Dust at the Asgarabad2 mine is primarily generated through drilling, blasting operations, and road transport. Upon blasting, dust is initially ejected vertically into the air and subsequently dispersed horizontally by wind forces. This blast-induced dust, often containing toxic substances, poses serious risks. Atmospheric airborne particles interact with gases, liquids, and solids, with mineral dust constituting a major component [44,45]. Airborne dust can transport toxic metals such as lead and zinc, resulting in prolonged negative impacts on human health, plant life, fertile soils, and water intended for consumption.
The emission and dispersion of particles are influenced by particle size and wind speed, with wind speed being particularly critical [46]. Air pollution is influenced by mining activities, whether through direct operations or indirect processes. Notably, PM10 affects air quality, visibility, ecosystems, and human health. In the case of the Asgarabad2 mine, blast-induced dust rich in calcium particles severely impacts nearby vegetation and agricultural lands, especially since farmland is located less than 100 m from the mine, amplifying the significance of this study. Observations at the mine indicated that horizontal dust dispersion exceeds vertical dispersion due to the influence of wind. Vertical dust largely remains within the mine, whereas horizontal dust can travel hundreds of meters beyond the mine boundary. To quantify this, regional wind patterns were analyzed using WRPLOT software, which employed wind rose diagrams and wind speed data. The inputs included longitude, latitude, elevation, wind speed, wind direction, as well as temporal data (years, months, hours, and minutes). Historical wind database spanning from 2000–2019 were processed, standardized, and input into the software to assess dust dispersion.
Furthermore, meteorological conditions, particularly wind speed and direction, play a crucial role in dust dispersion. Therefore, a historical meteorological database spanning the past twenty years was analyzed to evaluate wind patterns surrounding the Asgarabad2 mine. Utilizing WRPLOT software, as presented in Fig. 19 and summarized in Table 13, it was found that the highest wind speed, 3.14 m/s, occurs during the spring season, with the average wind speed peaking in April at 3.21 m/s—coinciding with the period when most blasting operations are conducted. Notably, the wind analysis further revealed that the prevailing wind direction throughout the year is generally from the southeast. This orientation directs dust toward densely vegetated areas, agricultural gardens, the nearby city, and over 120 residential communities, as indicated in Fig. 19. These findings underscore the significant environmental and health risks associated with dust emissions in the region.

Figure 19: Wind analysis results for different months.

Blasting operations at the mine are typically conducted during the periods of 10:00–12:00, 13:00–15:00, and 16:00–18:00. Consequently, wind analyses were performed specifically for these time intervals. As illustrated in Fig. 20, the prevailing wind direction during all these periods remains predominantly from the southeast. Table 13 shows that the highest wind speed, 2.83 m/s, occurs between 13:00 and 15:00. The data also indicate that the occurrence of calm winds is insignificant throughout the day. Wind flows with speeds ranging from 0.5–2.1 m/s were found to have the highest frequency.

Figure 20: Wind analysis results for blasting times.
To mitigate dust emissions, several eco-friendly strategies aligned with green development policies have been proposed for the Asgarabad2 mine. One such measure involves limiting blasting rounds to fewer than 30 holes per session. However, since the mine supplies raw materials to the Urmia White Cement Plant, these restrictions can only be applied to a limited number of blasts annually. For blasting rounds exceeding 30 holes, the operation must proceed as planned to ensure the continuity of the plant’s supply chain.
At the Asgarabad2 mine, dust is initially propelled by the force of the blast within the first three seconds. Approximately five seconds during bench blasting, the movement of dust slows and becomes increasingly influenced by wind. Around ten seconds post-blast, the dust clouds disperse quickly, transport the mine, and begin to extend into the surrounding region. Field observations have shown that fine dust particles from blasts settle on tree leaves within a one-kilometer radius of the mine. To assess the extent of dust dispersion, multiple monitoring points were established around the mine. Vegetation located in the prevailing wind direction accumulated higher amounts of dust. Based on average wind speeds, it is anticipated that the dust can travel several kilometers beyond the mine. However, due to the relatively low mining tonnage at this site, the total volume of airborne dust is limited. Consequently, the optimal time for blasting is around noon, when wind speeds are typically lower than at other times of the day. To further mitigate dust emissions, the approach introduced by Abdollahisharif et al. [22] can be employed, which involves using bubbles containing an ionized solution (see Fig. 21). This method has been shown to reduce the vertical spread of dusts from 18–12 m, representing a thirty-three percent decrease in vertical dispersion.

Figure 21: Ionized water ampoules and blasting hole (based on Abdollahisharif et al. [22]).
At the Asgarabad2 mine, a green blasting strategy has been implemented by incorporating ionized water ampoules in the stemming section of blastholes. While this biocompatible approach significantly reduces dust emissions, additional measures aligned with green blasting principles can be applied to meet the plant’s material demand while adhering to sustainable development objectives.
In this study, both pre-blast and post-blast analyses were conducted to identify all factors influencing dust generation. Adjustments to controllable blasting parameters, such as B, S, and PF, were found to have a substantial impact on dust production, as revealed by sensitivity analyses. However, these modifications can also affect other critical blasting outcomes, including fragmentation, flyrock, and the total blasted rock volume. To address this, we focused on optimizing the blasting pattern using metaheuristic algorithms. By implementing a biocompatible approach, dust emission was initially reduced to 39 m. Further optimization, taking into account fragmentation and flyrock, allowed dust dispersion to be minimized to 24 m.
Wind speed is another crucial factor, as it can transport particles of a micron scale over long distances immediately after dust generation. Designation of an optimum environmentally friendly blasting pattern provides two key benefits: (1) minimizing dust generation through pattern optimization, and (2) employing a biocompatible method to further reduce dust and facilitate its absorption.
The environmental and health impacts of limestone dust around the mine are considerable. Limestone primarily consists of 95% calcium carbonate (CaCO3) and a smaller fraction of magnesium carbonate (MgCO3). Inhalation of limestone dust containing crystalline silica (1 to 20%, with concentrations of 2 to 5 mg/m3) can trigger inflammatory responses in humans. Respiratory irritation and airway narrowing are also common effects. Timely monitoring and assessment of Interleukin-8 (IL-8) serum are important to mitigate the adverse health impacts of crystalline silica [41]. Accumulation of dust particles on leaves, twigs, and plant surfaces can further interact with chemical and physical factors, emphasizing the importance of the proposed biocompatible approach combined with IL-8 monitoring to reduce associated risks.
6 Limitations and Future Directions
Although the proposed GEP–MOGOA framework showed strong potential for predicting and reducing blast-induced dust emissions, some limitations should be acknowledged. First, the database used in this study consisted of 95 monitored blasting records collected from a single limestone mine. Therefore, the developed models should be interpreted as site-specific predictive tools, and their direct application to other mines, rock types, or blasting conditions requires further validation. Second, although meteorological variables were recorded and discussed, they were not included as decision variables in the optimization process because they cannot be directly controlled during blast design. Third, the optimization bounds were extended by 20% beyond the observed data range, which provides engineering flexibility but may introduce extrapolation uncertainty. Therefore, the Pareto-optimal blasting plans should be considered engineering candidate solutions and should be verified through field implementation before full-scale application.
The dust pollution problem was concentrated in the current study, emphasizing its significance for environmental side effects in the mines nearest to residential and agricultural regions. The ecological consequences of dust pollution and reduction plans are essential points that have been considered due to the eco-friendly policies of green mining. The prediction of blast-induced dust pollution seems more complex by general techniques since some factors affect the dust dispersion in the mines. Numerous efforts have been made to develop simplified models for predicting dust pollution with high accuracy. However, due to process uncertainties, pronounced non-linear effects, and the multitude of influencing factors, discrepancies between model predictions and actual measurements are commonly observed. Hence, this study developed an integrated GEP–MOGOA framework for predicting and minimizing blast-induced dust emissions in the Asgarabad2 limestone mine. This study developed an integrated GEP–MOGOA framework for predicting and minimizing blast-induced dust emissions in the Asgarabad2 limestone mine. Based on the results obtained, the main conclusions are summarized as follows:
1. Main findings:
A field database including 95 monitored blasting rounds was used to develop predictive models for DEMB, PM10, and TSP. Eight controllable blasting parameters, including hole diameter, hole length, specific charge, number of holes, delay timing, stemming, burden, and spacing, were considered as input variables. The developed GEP models showed strong predictive performance, with R2 values of 0.9447, 0.9883, and 0.9961 for DEMB, PM10, and TSP, respectively.
2. Model validation and comparison:
XGBoost achieved the highest numerical accuracy, with R2 values of 0.9762, 0.9925, and 0.9982 for DEMB, PM10, and TSP, respectively. However, GEP was selected for the optimization stage because it provides explicit mathematical equations that can be directly used as objective functions in MOGOA.
3. Optimization outcomes:
The MOGOA process generated four Pareto-optimal blasting plans. The minimum optimized values of DEMB, PM10, and TSP were 103 m, 132, and 270 μg/m3, respectively, compared with the original mean values of 179.16 m, 414.75, and 898.96 μg/m3. These values correspond to reductions of 42.51%, 68.17%, and 69.97%, respectively. Although Plan 4 provided the lowest DEMB and TSP values, Plan 1 was recommended as the most practical option because it achieved the greatest PM10 reduction and a substantial TSP reduction while maintaining a more feasible blasting configuration.
4. Novelty and engineering significance:
The novelty of this study lies in linking explicit GEP-based prediction equations with a multi-objective optimization algorithm to simultaneously predict and minimize DEMB, PM10, and TSP. This framework provides a practical decision-support tool for green blasting design and cleaner production, especially in mines located near residential areas, agricultural lands, and sensitive environmental receptors.
5. Limitations and future recommendations:
The main limitations of this study are the relatively limited dataset size, the site-specific nature of the field data, and the exclusion of meteorological variables from the optimization decision variables because they cannot be directly controlled during blast design. Future studies should validate the proposed framework using larger datasets from different mines, rock types, blasting patterns, and meteorological conditions. Field implementation of the optimized blasting plans is also recommended to confirm their practical effectiveness.
Acknowledgement: Not applicable.
Funding Statement: This research is supported by grants from 2025 Scientific Research and Innovation Team Project of Shaanxi College of Communications Technology (No. CX2505) and Research Project of Gansu Gongfa Engineering Construction Co., Ltd. [No. Gangonggongiian [2025]139].
Author Contributions: Conceptualization, Kangjia Fan, Biao He, Shahab Hosseini; methodology, Kangjia Fan, Biao He, Shahab Hosseini; software, Kangjia Fan, Biao He, Shahab Hosseini; validation, Kangjia Fan, Biao He, Shahab Hosseini; formal analysis, Kangjia Fan, Biao He, Shahab Hosseini; data curation, Shahab Hosseini; writing—original draft preparation, Kangjia Fan, Biao He, Shahab Hosseini, Seyed Yaser Mousavi Siamakani; writing—review and editing, Kangjia Fan, Biao He, Shahab Hosseini, Seyed Yaser Mousavi Siamakani; visualization, Seyed Yaser Mousavi Siamakani; supervision, Seyed Yaser Mousavi Siamakani. All authors reviewed and approved the final version of the manuscript.
Availability of Data and Materials: The data supporting the findings of this study are not publicly available due to confidentiality and data ownership restrictions.
Ethics Approval: Not applicable.
Conflicts of Interest: The authors declare no conflicts of interest.
Abbreviations
| GEP | Gene Expression Programming |
| TSP | Total Suspended Particles |
| DEMB | Dust Emission Distance Due to Mine Blasting |
| USEPA | United States Environmental Protection Agency |
| BP | Back-Propagation |
| ANN | Artificial Neural Network |
| ANFIS | Adaptive Neuro-Fuzzy Inference System |
| MOGOA | Multi-Objective Grasshopper Optimization Algorithm |
| GP | Genetic Programming |
| EAs | Evolutionary Algorithms |
| MOP | Multi-Objective Optimization Problem |
| POS | Pareto Optimal Solution |
| GOA | Grasshopper Optimization Algorithm |
| ANFO | Ammonium Nitrate and Fuel Oil |
| RMSE | Root Mean-Squared Error |
| RAE | Relative Absolute Error |
| MAE | Mean Absolute Error |
| RRSE | Root Relative Squared Error |
| OF | Objective Functions |
References
1. Dudek M, Dworzak M, Biessikirski A. Influence of blasting approaches in in-pit haul road construction on emission levels and resource management: a case study from the holcim “dubie” open-pit mine. Appl Sci. 2025;15(22):12310. doi:10.3390/app152212310. [Google Scholar] [CrossRef]
2. Zhang R, Li Y, Gui Y, Armaghani DJ, Yari M. A stacked multiple kernel support vector machine for blast induced flyrock prediction. Geohazard Mech. 2024;2(1):37–48. doi:10.1016/j.ghm.2024.01.002. [Google Scholar] [CrossRef]
3. Ma B, Kang T, Gao S, He S, Che D, Zhang Y. Policy-driven distinct dust pollution patterns in a super-large magnesite mining area: spatiotemporal analysis integrating satellite remote sensing and CALPUFF model. J Clean Prod. 2026;550:147915. doi:10.1016/j.jclepro.2026.147915. [Google Scholar] [CrossRef]
4. Kang S, Lee JY, Cho KS. Bacterial and fungal metagenomes associated with atmospheric particulates in Republic of Korea: comparison of PM2.5 and TSP larger than PM2.5. J Environ Sci. 2026;161:400–10. doi:10.1016/j.jes.2025.08.021. [Google Scholar] [CrossRef]
5. Zhang Q, Liu H, Ran X, Dinis F, Yu E. Sources identification and health risk assessment of heavy metals in total suspended particulates (TSP) in a geochemical anomaly area influenced by historical indigenous zinc smelting activities. Environ Geochem Heal. 2025;47(2):53. doi:10.1007/s10653-025-02363-6. [Google Scholar] [PubMed] [CrossRef]
6. Espitia-Pérez L, da Silva J, Espitia-Pérez P, Brango H, Salcedo-Arteaga S, Hoyos-Giraldo LS, et al. Cytogenetic instability in populations with residential proximity to open-pit coal mine in Northern Colombia in relation to PM10 and PM2.5 levels. Ecotoxicol Environ Saf. 2018;148:453–66. doi:10.1016/j.ecoenv.2017.10.044. [Google Scholar] [PubMed] [CrossRef]
7. Rincon G, Morantes G, Roa-López H, del Pilar Cornejo-Rodriguez M, Jones B, Cremades LV. Spatio-temporal statistical analysis ofPM1 and PM2.5 concentrations and their key influencing factors at Guayaquil city. Ecuador Stoch Environ Res Risk Assess. 2023;37(3):1093–117. doi:10.1007/s00477-022-02310-2. [Google Scholar] [CrossRef]
8. Chelani AB, Gajghate DG, Hasan MZ. Prediction of ambient PM10 and toxic metals using artificial neural networks. J Air Waste Manag Assoc. 2002;52(7):805–10. doi:10.1080/10473289.2002.10470827. [Google Scholar] [CrossRef]
9. McKendry IG. Evaluation of artificial neural networks for fine particulate pollution (PM10 and PM2.5) forecasting. J Air Waste Manag Assoc. 2002;52(9):1096–101. doi:10.1080/10473289.2002.10470836. [Google Scholar] [CrossRef]
10. Lal B, Tripathy SS. Prediction of dust concentration in open cast coal mine using artificial neural network. Atmos Pollut Res. 2012;3(2):211–8. doi:10.5094/apr.2012.023. [Google Scholar] [CrossRef]
11. Alkasassbeh M, Sheta AF, Faris H, Turabieh H. Prediction of PM10 and TSP air pollution parameters using artificial neural network autoregressive, external input models: a case study in salt. Jordan Middle East J Sci Res. 2013;14(7):999–1009. doi:10.5829/idosi.mejsr.2013.14.7.2171. [Google Scholar] [CrossRef]
12. Mishra D, Goyal P, Upadhyay A. Artificial intelligence based approach to forecast PM2.5 during haze episodes: a case study of Delhi. India Atmos Environ. 2015;102:239–48. doi:10.1016/j.atmosenv.2014.11.050. [Google Scholar] [CrossRef]
13. Bakhtavar E, Hosseini S, Hewage K, Sadiq R. Green blasting policy: simultaneous forecast of vertical and horizontal distribution of dust emissions using artificial causality-weighted neural network. J Clean Prod. 2021;283(10):124562. doi:10.1016/j.jclepro.2020.124562. [Google Scholar] [CrossRef]
14. Bakhtavar E, Hosseini S, Hewage K, Sadiq R. Air pollution risk assessment using a hybrid fuzzy intelligent probability-based approach: mine blasting dust impacts. Nat Resour Res. 2021;30(3):2607–27. doi:10.1007/s11053-020-09810-4. [Google Scholar] [CrossRef]
15. Hosseini S, Monjezi M, Bakhtavar E, Mousavi A. Prediction of dust emission due to open pit mine blasting using a hybrid artificial neural network. Nat Resour Res. 2021;30(6):4773–88. doi:10.1007/s11053-021-09930-5. [Google Scholar] [CrossRef]
16. Nagesha KV, Sastry VR, Chanda RKR. Prediction of dust dispersion during drilling operation in open cast coal mines: a multi regression model. Int J Environ Sci. 2016;6:695–311. doi:10.6088/ijes.6064. [Google Scholar] [CrossRef]
17. Patra AK, Gautam S, Majumdar S, Kumar P. Prediction of particulate matter concentration profile in an opencast copper mine in India using an artificial neural network model. Air Qual Atmos Heal. 2016;9(6):697–711. doi:10.1007/s11869-015-0369-9. [Google Scholar] [CrossRef]
18. Tecer LH. Prediction of SO2 and PM concentrations in a coastal mining area (Zonguldak, Turkey) using an artificial neural network. Pol J Environ Stud. 2007;16(4):633–8. [Google Scholar]
19. Roy S, Adhikari GR, Renaldy TA, Jha AK. Development of multiple regression and neural network models for assessment of blasting dust at a large surface coal mine. J Environ Sci Technol. 2011;4(3):284–301. doi:10.3923/jest.2011.284.301. [Google Scholar] [CrossRef]
20. Sastry VR, Chandar KR, Nagesha KV, Muralidhar E, Mohiuddin MS. Prediction and analysis of dust dispersion from drilling operation in opencast coal mines. Procedia Earth Planet Sci. 2015;11(4):303–11. doi:10.1016/j.proeps.2015.06.065. [Google Scholar] [CrossRef]
21. Abdollahisharif J, Bakhtavar E, Nourizadeh H. Monitoring and assessment of pollutants resulting from bench-blasting operations. J Min Environ. 2016;7(1):109–18. doi:10.22044/jme.2016.502. [Google Scholar] [CrossRef]
22. Abdollahisharif J, Bakhtavar E, Nourizadeh H. Green biocompatible approach to reduce the toxic gases and dust caused by the blasting in surface mining. Environ Earth Sci. 2016;75(3):191. doi:10.1007/s12665-015-4947-9. [Google Scholar] [CrossRef]
23. Asif Z, Chen Z, Zhu ZH. An integrated life cycle inventory and artificial neural network model for mining air pollution management. Int J Environ Sci Technol. 2019;16(4):1847–56. doi:10.1007/s13762-018-1813-9. [Google Scholar] [CrossRef]
24. Hosseini S, Mousavi A, Monjezi M. Prediction of blast-induced dust emissions in surface mines using integration of dimensional analysis and multivariate regression analysis. Arab J Geosci. 2022;15(2):163. doi:10.1007/s12517-021-09376-2. [Google Scholar] [CrossRef]
25. Zhu X, Wang H, Wang D, Xu C, Zhou W, Zhu Y. Improved foam application at the tunnel face with large ventilation volume and low pressure supplied water. Tunn Undergr Space Technol. 2020;95(123):103139. doi:10.1016/j.tust.2019.103139. [Google Scholar] [CrossRef]
26. Wang ZM, Zhou W, Jiskani IM, Ding XH, Liu ZC, Qiao YZ, et al. Dust reduction method based on water infusion blasting in open-pit mines: a step toward green mining. Energy Sources Part A Recovery Util Environ Eff. 2025;47(1):6029–43. doi:10.1080/15567036.2021.1903118. [Google Scholar] [CrossRef]
27. Roy S, Singh T. Influence of rock and explosives properties and blast design parameters on dust generation during blasting in opencast coal mines—an approach. Min Eng J. 2008;10:14–25. [Google Scholar]
28. Hosseini S, Monjezi M, Bakhtavar E. Minimization of blast-induced dust emission using gene-expression programming and grasshopper optimization algorithm: a smart mining solution based on blasting plan optimization. Clean Technol Environ Policy. 2022;24(8):2313–28. doi:10.1007/s10098-022-02327-9. [Google Scholar] [CrossRef]
29. Bator R, Sieniutycz S. Application of artificial neural network for emission prediction of dust pollutants. Int J Energy Res. 2006;30(13):1023–36. doi:10.1002/er.1200. [Google Scholar] [CrossRef]
30. Ferreira C. Gene expression programming: mathematical modeling by an artificial intelligence. 2nd ed. Berlin, Germany: Springer; 2006. [Google Scholar]
31. Ebrahimi M, Deymi O, Hadavimoghaddam F, Hemmati-Sarapardeh A. Derivation of explicit mathematical equations for gypsum solubility in aqueous electrolyte solutions using GP, GEP, and GMDH techniques. Sci Rep. 2025;15(1):34086. doi:10.1038/s41598-025-14641-5. [Google Scholar] [PubMed] [CrossRef]
32. Anwar W, Irfan M, Ahmed S, Khan MA. Experimental characterization and GEP-based prediction of crumb rubber-waste engine oil modified asphalt mixtures. Int J Pavement Res Technol. 2026. doi:10.1007/s42947-026-00764-z. [Google Scholar] [CrossRef]
33. Sheikhshoaei AH, Hadavimoghaddam F, Abuswer MA, Mohaddespour A, Hemmati-Sarapardeh A, Atashrouz S. Predicting methane adsorption in coal and shale with white-box and black-box machine learning models. Sci Rep. 2026;16(1):16709. doi:10.1038/s41598-026-42049-2. [Google Scholar] [PubMed] [CrossRef]
34. Iqbal MF, Liu QF, Azim I, Zhu X, Yang J, Javed MF, et al. Prediction of mechanical properties of green concrete incorporating waste foundry sand based on gene expression programming. J Hazard Mater. 2020;384:121322. doi:10.1016/j.jhazmat.2019.121322. [Google Scholar] [PubMed] [CrossRef]
35. Kiremitci ST, Donmez AS, Sayin MO. Achieving Pareto optimality in games via single-bit feedback. In: ICASSP 2026—2026 IEEE International Conference on Acoustics, Speech and Signal Processing (ICASSP); 2026 May 3–8; Barcelona, Spain. p. 276–80. doi:10.1109/ICASSP55912.2026.11464603. [Google Scholar] [CrossRef]
36. Mirjalili S. Dragonfly algorithm: a new meta-heuristic optimization technique for solving single-objective, discrete, and multi-objective problems. Neural Comput Appl. 2016;27(4):1053–73. doi:10.1007/s00521-015-1920-1. [Google Scholar] [CrossRef]
37. Tharwat A, Houssein EH, Ahmed MM, Hassanien AE, Gabel T. MOGOA algorithm for constrained and unconstrained multi-objective optimization problems. Appl Intell. 2018;48(8):2268–83. doi:10.1007/s10489-017-1074-1. [Google Scholar] [CrossRef]
38. Saremi S, Mirjalili S, Lewis A. Grasshopper optimisation algorithm: theory and application. Adv Eng Softw. 2017;105:30–47. doi:10.1016/j.advengsoft.2017.01.004. [Google Scholar] [CrossRef]
39. Aljarah I, Al-Zoubi AM, Faris H, Hassonah MA, Mirjalili S, Saadeh H. Simultaneous feature selection and support vector machine optimization using the grasshopper optimization algorithm. Cogn Comput. 2018;10(3):478–95. doi:10.1007/s12559-017-9542-9. [Google Scholar] [CrossRef]
40. Koopialipoor M, Jahed Armaghani D, Haghighi M, Ghaleini EN. A neuro-genetic predictive model to approximate overbreak induced by drilling and blasting operation in tunnels. Bull Eng Geol Environ. 2019;78(2):981–90. doi:10.1007/s10064-017-1116-2. [Google Scholar] [CrossRef]
41. Tolinggi S, Nakoe MR, Gobel IA, Sengke J, Keman S, Sudiana IK, et al. Effect inhaling of limestone dust exposure on increased level of IL-8 serum and pulmonary function decline to workers of limestone mining industry. Int Refereed J Eng Sci. 2014;3(8):66–72. [Google Scholar]
42. Sabir MA, Guo W, Nawaz MF, Yasin G, Yousaf MTB, Gul S, et al. Assessing the effects of limestone dust and lead pollution on the ecophysiology of some selected urban tree species. Front Plant Sci. 2023;14:1144145. doi:10.3389/fpls.2023.1144145. [Google Scholar] [PubMed] [CrossRef]
43. Amos BB, Musa I, Abashiya M, Abaje IB. Impacts of cement dust emissions on soils within 10km radius in Ashaka area, Gombe state. Nigeria Environ Pollut. 2014;4(1):29–36. doi:10.5539/ep.v4n1p29. [Google Scholar] [CrossRef]
44. Chen Q, Qi Z, Li L, Jiang B, Tang M, Li K, et al. Numerical simulation and experimental verification of dust migration characteristics in a fully-mechanized excavation face based on gas-liquid-solid coupling. Powder Technol. 2026;479:122582. doi:10.1016/j.powtec.2026.122582. [Google Scholar] [CrossRef]
45. Lin L, Huo Y, Tian L, Liu Y, Song Y, Hu U, et al. Emission characteristics and suppression measures of dust from open-pit coal mine: a review. Energy Fuels. 2026;40(15):7839–61. doi:10.1021/acs.energyfuels.6c00670. [Google Scholar] [CrossRef]
46. Gil-Loaiza J, Field JP, White SA, Csavina J, Felix O, Betterton EA, et al. Phytoremediation reduces dust emissions from metal(loid)-contaminated mine tailings. Environ Sci Technol. 2018;52(10):5851–8. doi:10.1021/acs.est.7b05730. [Google Scholar] [PubMed] [CrossRef]
Cite This Article
 Copyright © 2026 The Author(s). Published by Tech Science Press.
This work is licensed under a Creative Commons Attribution 4.0 International License , which permits unrestricted use, distribution, and reproduction in any medium, provided the original work is properly cited.
 Downloads
 Citation Tools
