
 Login
Login Register
 Submit a Paper
 Propose a Special lssue
 Open Access
ARTICLE
Steady Bending Force and Shaft Torque in Central-Axis Bending of Reinforcing Bars: Mechanics-Based Analytical Modelling and Finite Element Assessment
1 School of Mechanical and Electronic Engineering, Wuhan University of Technology, Wuhan, 430070, China
2 Department of Mechanical Engineering, Faculty of Engineering, Sana’a University, Sana’a, 11311, Yemen
3 State Key Laboratory of Light Superalloys, Wuhan University of Technology, Wuhan, 430070, China
4 Hubei Engineering Research Center of Robotics and Intelligent Manufacturing, Wuhan University of Technology, Wuhan, 430070, China
* Corresponding Author: Haibin Yin. Email:
(This article belongs to the Special Issue: Mechanical Applications of Computational Methods and Machine Learning)
Computer Modeling in Engineering & Sciences 2026, 148(3), 8 https://doi.org/10.32604/cmes.2026.086319
Received 28 May 2026; Accepted 14 August 2026; Issue published 28 September 2026
 View Full Text
 Download PDF
Abstract
A mechanics-based analytical framework is developed for estimating the steady bending force and shaft torque in central-axis bending of reinforcing bars (RBs). Analytical expressions are derived for the sectional bending moment and are subsequently linked to the machine-level force and torque through the roller-system load-transfer geometry. Three constitutive descriptions are considered, namely elastic-perfectly plastic, bilinear hardening, and power-law hardening, to examine the influence of post-yield material response on bending-demand estimation. The analytical formulations are assessed using a section-level pure-bending finite element model, a process-level three-dimensional finite element model with tool-bar contact, and reported smooth round-bar torque measurements and FE results for torque and circular-roller-force. The results show that representation of post-yield hardening is essential for reliable estimation of RB bending demand. At the section level, the mean relative error remains below 1% for the power-law formulation and below 5% for the bilinear formulation, whereas the elastic-perfectly plastic model deviates by about 30%–35%. At the process level, the mean relative errors of the power-law formulation remain below 7.5% for torque and below 10% for force; those of the bilinear formulation remain below 11% for torque and below 15% for force. Against the reported torque measurements, the elastic-perfectly plastic model underestimates the two reported steady torque levels by 36.02%–38.81%, whereas the hardening-based formulations give relative errors of 5.31%–7.48%. The parametric study further shows that RB diameter and strength grade govern the steady bending force and shaft torque primarily through sectional bending resistance, whereas machine-geometry parameters act primarily through the external load-transfer condition. Within the adopted assumptions, the proposed framework provides a mechanics-based quantitative tool for preliminary estimation and parametric assessment of steady bending force and shaft torque demand in central-axis RB bending systems.Keywords
Supplementary Material
Supplementary Material FileIn central-axis reinforcing-bar (RB) bending, the machine must generate sufficient bending force and shaft torque to overcome the elastic–plastic resistance of the bar through the load-transfer geometry of the bending system. The problem therefore couples the sectional response of the RB with the process-level load required from the machine. Reliable estimation of these quantities is important for machine sizing and process planning because the machine demand depends jointly on the material response, section geometry, and roller-system configuration.
When an RB is bent, the longitudinal fibers on the outer and inner sides of the section are subjected primarily to tension and compression, respectively. Once yielding begins, plastic deformation spreads progressively through the section and enables the bar to retain its bent configuration. During continued bending, the internal resistance evolves according to the post-yield material response [1–4]. Consequently, the force and torque required to sustain bending depend not only on the yield strength and section geometry but also on the hardening behavior of the RB.
Previous studies on RB and steel-bar bending have followed several complementary directions. Machine-design and numerical investigations have examined bending mechanisms, structural parameters, stress development, and springback prediction or compensation [5–7]. Experimental studies have reported operator-applied force in manual bending [8], measured shaft-torque histories for process characterization and springback control [9], and torque variations associated with rib–tool interaction [10]. Analytical studies have also estimated force or torque for particular bending-machine configurations [6,11,12]. These contributions established important foundations for machine design, process monitoring, and springback control. However, the available analytical load estimates typically employed first-yield, ideal-plastic, fully plastic, or coefficient-corrected sectional resistance descriptions, whereas measured torque histories were used mainly as process-response or control signals rather than as outputs predicted from material and machine parameters.
Related research on metallic bending processes provides complementary section- and process-level foundations. At the section level, analytical formulations for wires and tubes have incorporated elastic–plastic response and material nonlinearity to evaluate sectional bending response, springback, and residual stress [13–15]. Related studies of metallic members have examined load-carrying capacity, combined axial–bending response, distributed plasticity, and work-hardening effects [16–19]. At the process level, three-roll bending studies have related forming force and curvature to material behavior, roll arrangement, and process geometry [20–23]. For V-die bending, force-prediction accuracy likewise depends on representing the actual deformation mechanism [24]. Finite element studies of rebar and steel-bar bending have further examined springback, tool-bar contact, material nonlinearity, and machine-parameter effects [5,7,25]. Together, these studies establish complementary foundations for sectional resistance and process-level load transfer, although their target outputs, machine configurations, and loading paths differ from those of central-axis RB bending.
Against this background, a specific gap remains in predicting the sustained demand of central-axis RB bending. The effects of material-specific hardening on the sectional bending moment and, consequently, on the steady bending force and shaft torque remain insufficiently quantified. In particular, the reviewed studies do not systematically compare alternative constitutive representations, identified from the corresponding tensile data, within a common section-to-machine formulation. The predictive benefit of retaining material hardening when estimating both machine-level outputs therefore remains unclear.
To address this gap, the present study develops a mechanics-based section-to-machine framework for estimating the steady bending force and shaft torque in central-axis RB bending. Three principal advances are made. First, the sectional bending resistance is formulated consistently for elastic-perfectly plastic, bilinear-hardening, and power-law responses, with the constitutive parameters identified from the corresponding tensile stress-strain data, thereby retaining material-specific post-yield behavior beyond the simplified sectional resistance descriptions used in earlier load estimates. Second, the resulting sectional moment is transferred through the roller-system equilibrium to predict both steady bending force and shaft torque from material and geometric inputs, enabling the influence of material hardening on machine demand to be quantified. Third, the sectional-moment formulations are first assessed against section-level pure-bending FE results, and the resulting steady bending-force and shaft-torque estimates are subsequently assessed against process-level three-dimensional FE results obtained with tool-bar contact. The assessment is supplemented by reported smooth-round-bar torque measurements and an additional reported FE torque–force case in which the simulated torque response reproduced the measured response trend. The framework is then applied to examine the effects of RB diameter, strength grade, and machine geometry. Fig. 1 summarizes the overall methodology.
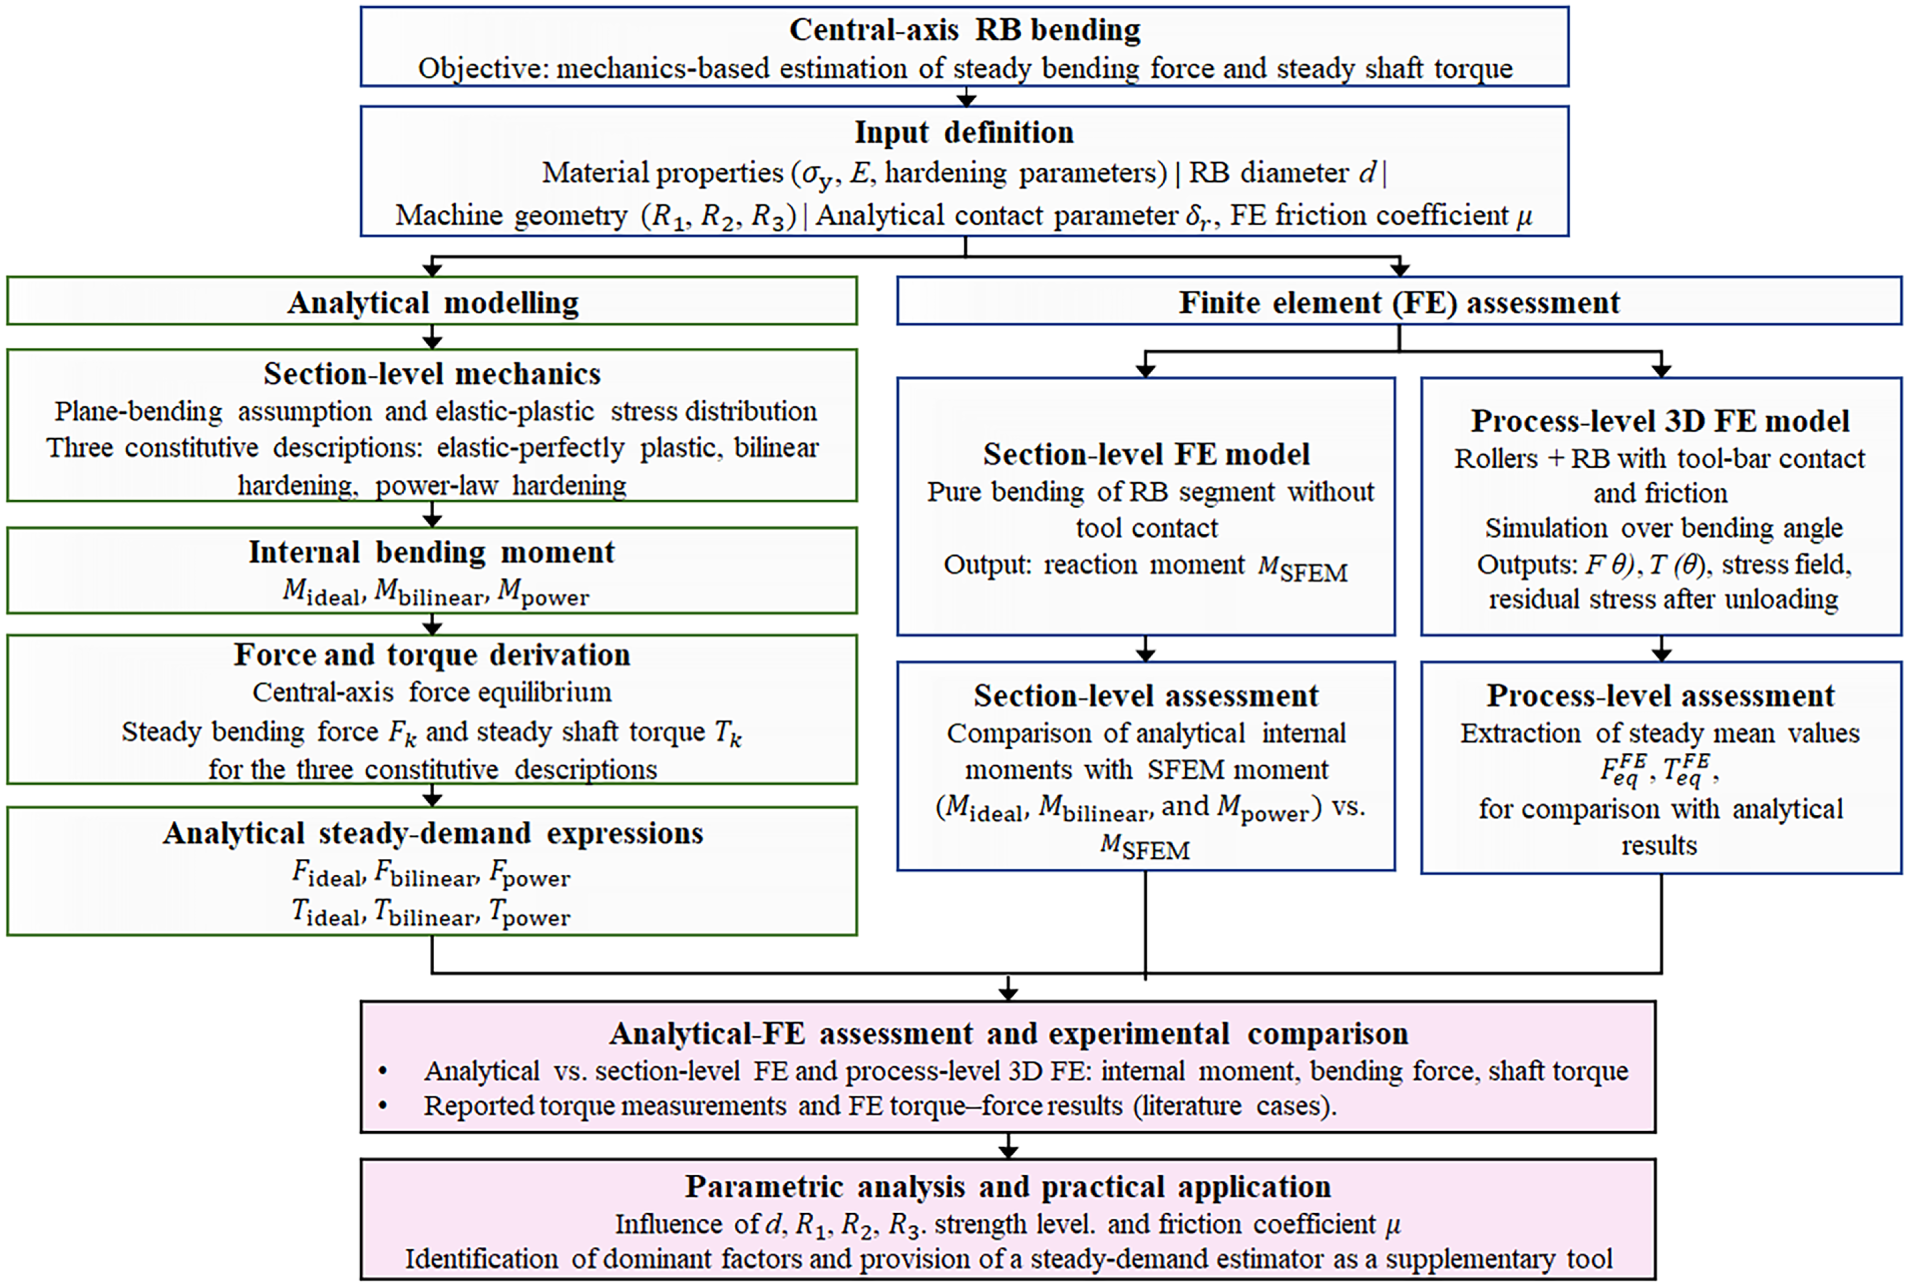
Figure 1: Methodological framework of the present study.
2.1 Bending Mechanism and Working Principle of Central-Axis RB Bending
The bending configuration considered in this study is central-axis bending of a reinforcing bar (RB), in which the rotating bending roller, mounted on the turntable, moves along a circular path about the fulcrum roller, as schematically shown in Fig. 2. During operation, one end of the RB is restrained by a clamping mechanism, while the bar is supported by the fulcrum roller. As the turntable rotates, the bending roller advances along its prescribed circular trajectory and applies the load required to bend the RB to the target angle. The imposed bending angle before unloading is therefore governed by the angular displacement of the turntable about the bending axis. Closely related experimental configurations employ a fulcrum roller, a rotating circular roller, and an RB receiver [10,26–28]. Other mechanized RB-bending systems similarly employ a rotating bending shaft or pin acting about a central support [5,7,29]. Despite differences in machine-layout details, these configurations share a common kinematic principle in which a rotating tool bends a restrained bar about a supporting element.
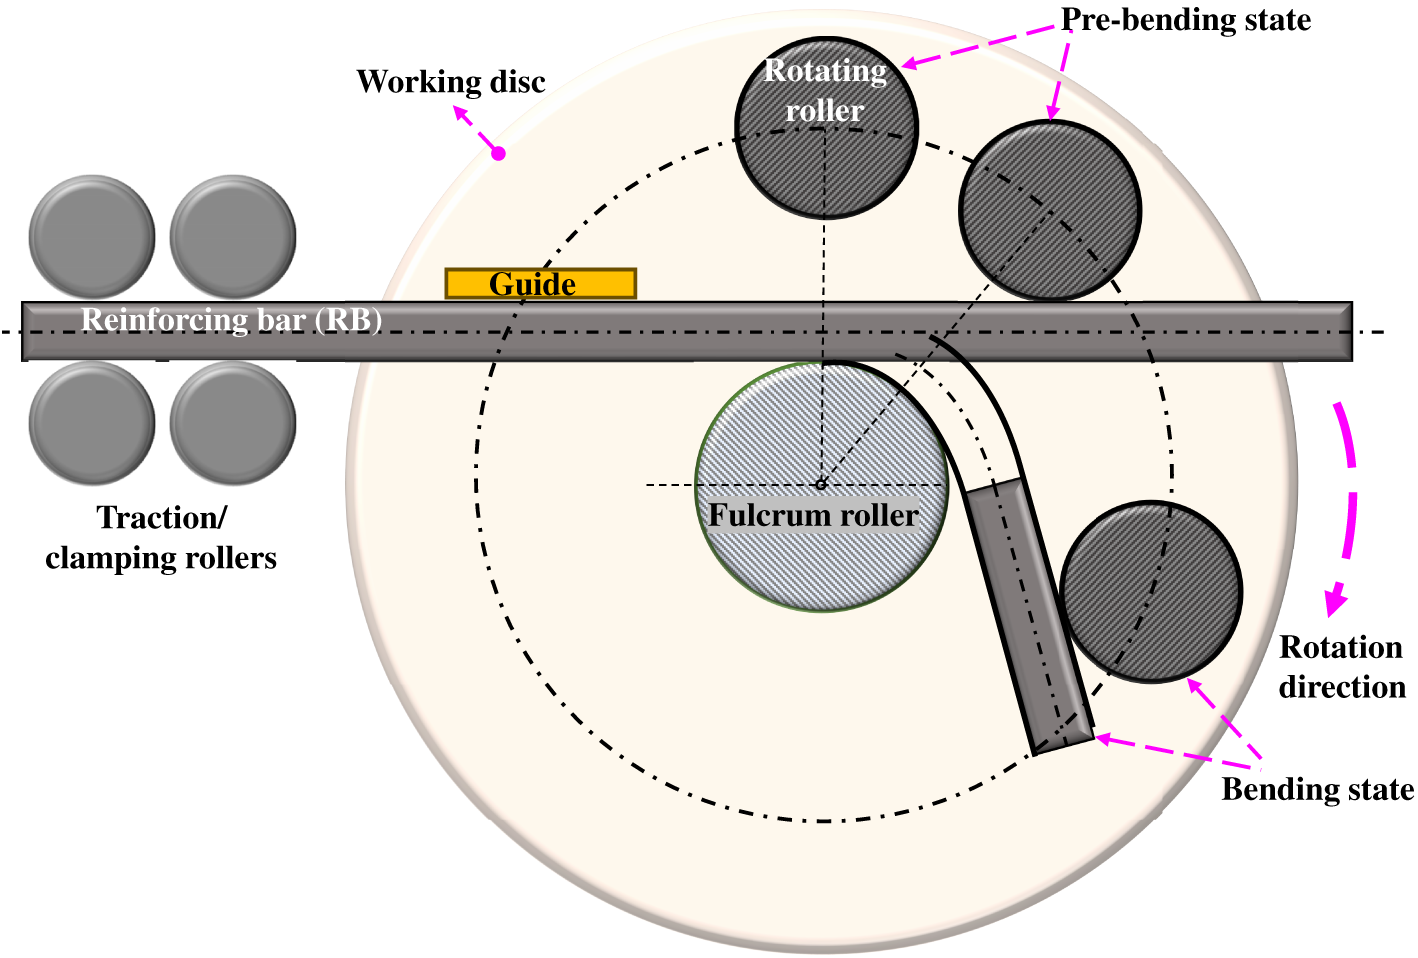
Figure 2: Schematic illustration of the central-axis bending process of the reinforcing bar (RB).
Under the externally applied bending action, the RB changes progressively from the initial straight configuration to the bent configuration, as illustrated in Figs. 2 and 3. During this process, the longitudinal fibers on one side of the neutral layer are stretched, whereas those on the opposite side are compressed. The tensile and compressive stress resultants developed in these regions resist further deformation and together generate the internal bending moment that balances the external applied action. Accordingly, the bending response of the RB is governed by the sectional stress distribution about the neutral axis, while the process-level force and torque demand is governed by the transfer of this sectional resistance through the roller-driven bending system.
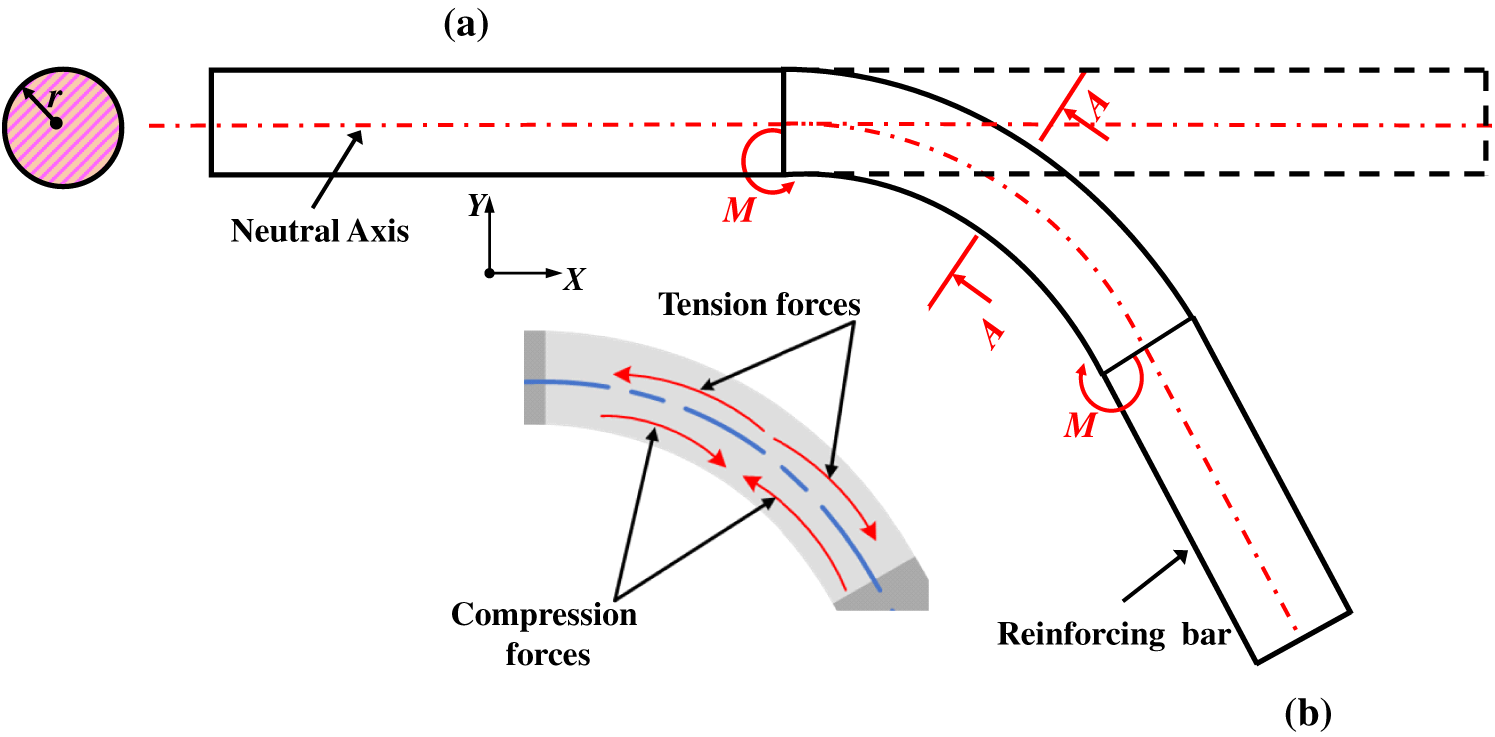
Figure 3: Deformation geometry: (a) undeformed configuration; (b) deformed configuration.
At the beginning of loading, the deformation is fully elastic, but this stage is very short and occupies only a small part of the overall bending process. As the bending load increases, the stress at the outermost or innermost fibers reaches the yield limit, and the section enters the elastic-plastic regime. Since the inner and outer surfaces are farthest from the neutral layer, these regions experience the largest bending strain and yield first. The transition from fully elastic bending to elastic-plastic bending is therefore determined by whether the stress at the outermost tensile side or the innermost compressive side of the RB section exceeds the elastic limit.
2.2 Assumptions of Elastic-Plastic Bending Model
The following assumptions are adopted, based on elastic-plastic bending theory, to simplify the derivation of the analytical expressions for RB bending:
(1) The RB is treated as a continuous, homogeneous, and isotropic solid.
(2) Plane sections remain plane during bending. Hence, the longitudinal strain of each fiber is represented by the linearized bending strain measured from the neutral layer; shear deformation is neglected in deriving the analytical sectional moment.
(3) The neutral layer remains unchanged during bending and is assumed not to undergo plastic deformation.
(4) The material response is assumed to be identical in tension and compression.
(5) The ribbed RB is represented by a smooth circular section having the same nominal cross-sectional area,
(6) Inertial effects are neglected in the calculation of the internal bending moment, bending force, and shaft torque.
(7) Rib-induced variations in the roller–bar contact conditions and local frictional response are not considered.
2.3 Analytical Modelling of the Internal Bending Moment
Three constitutive descriptions are considered for the RB material in the analytical formulation: the elastic-perfectly plastic behavior, the bilinear hardening behavior, and the power-law hardening behavior according to the Hollomon relation. Fig. 4 shows the corresponding stress-strain idealizations together with the associated stress distribution across the circular RB section under pure bending. In all three cases, the section consists of an inner elastic region and an outer plastic region. From the neutral axis to the elastic-plastic boundary
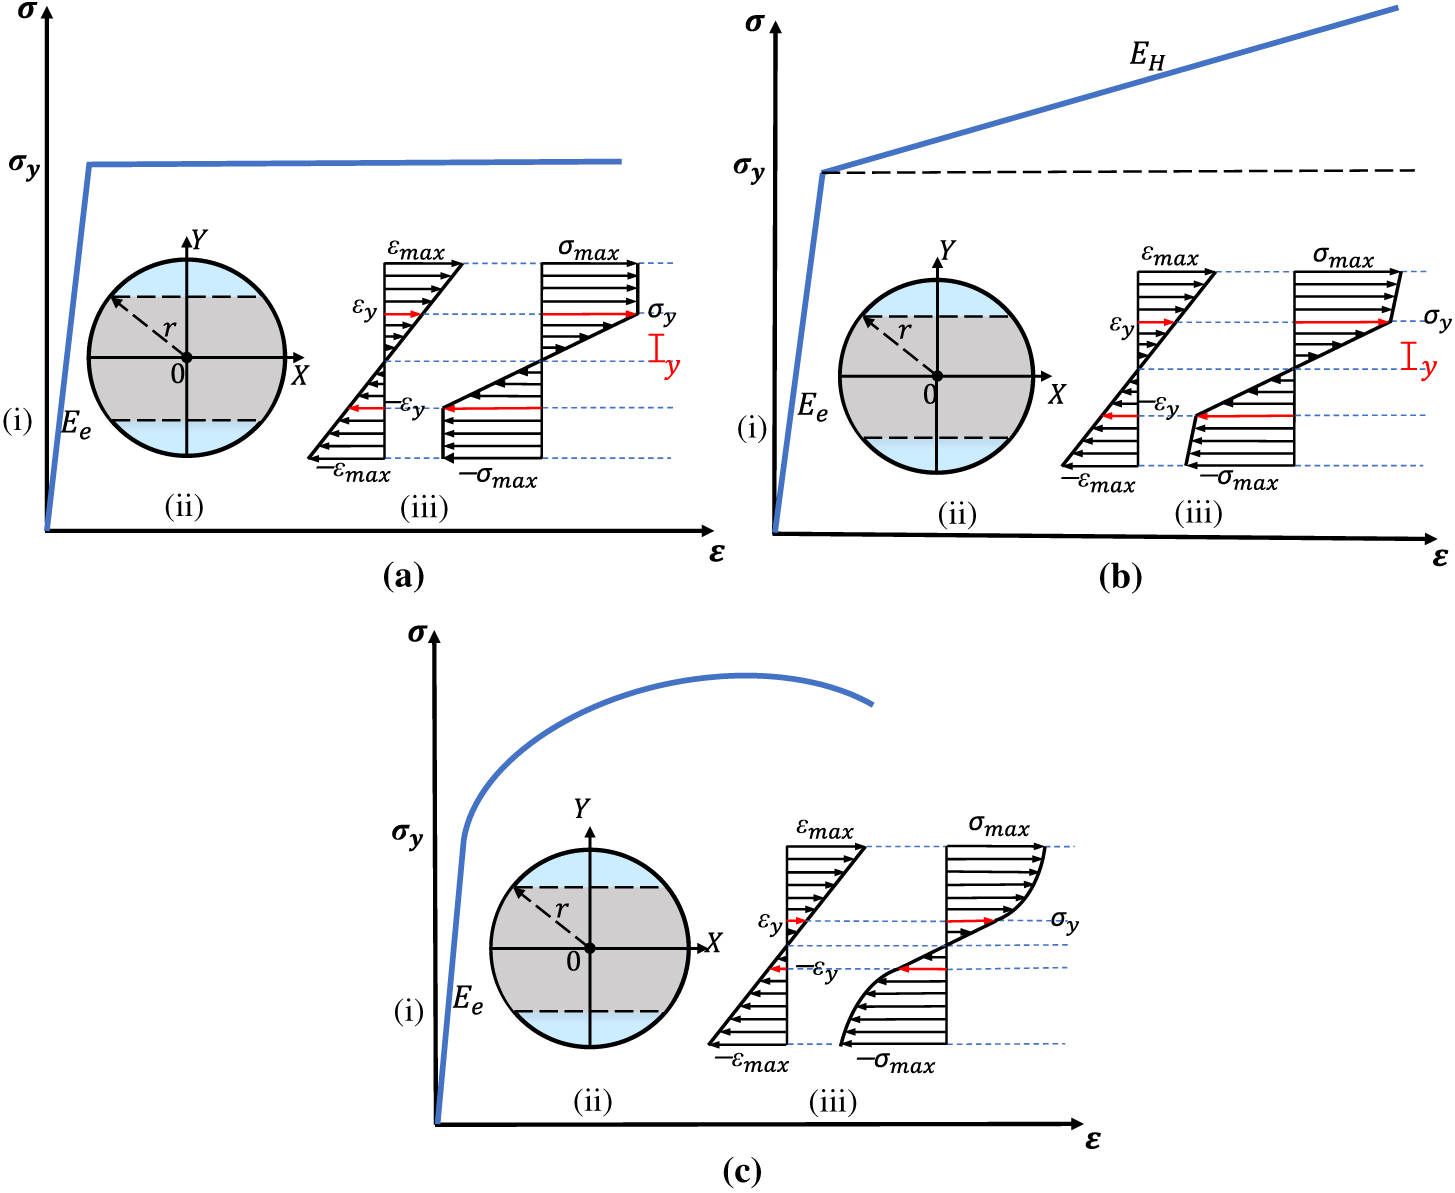
Figure 4: Idealized bending states of RB under the (a) elastic-perfectly plastic; (b) bilinear hardening; and (c) power-law hardening material models: (i) stress-strain relation, (ii) sectional geometry, and (iii) sectional stress-strain distribution under pure bending.
Under the plane bending assumption, the longitudinal strain is represented by the classical linear through-section bending field,
where
and the corresponding normalized elastic-zone depth is
The idealized elastic–plastic stress state and pure-bending geometry underlying the sectional formulation are illustrated in Fig. 5a,c, respectively. For a circular cross-section of radius
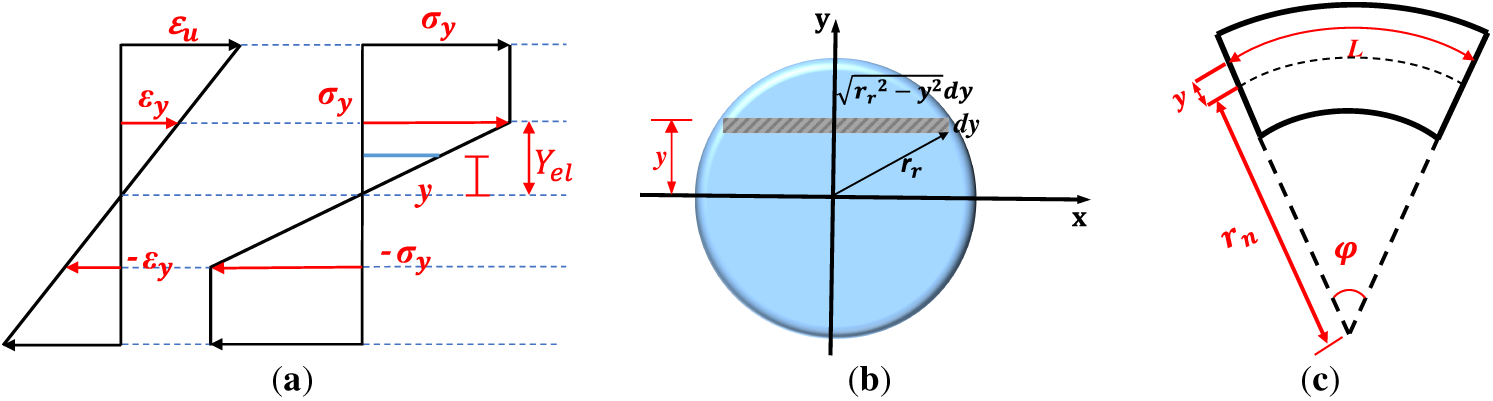
Figure 5: Idealized stress and section geometry: (a) elastic-plastic stress-strain state diagram of the ideal material; (b) RB cross-section; (c) RB under pure bending.
The sectional integration is written in terms of the following geometric functions:
where
The auxiliary functions
For the elastic-perfectly plastic material, the stress distribution is
Substituting Eq. (9) into Eq. (4) gives
Using Eqs. (5) and (6), the elastic-perfectly plastic bending moment becomes
For the bilinear hardening model shown in Fig. 4b, the post-yield stress increases linearly with tangent modulus
Substitution into Eq. (4) gives
Using Eqs. (5)–(7), the bilinear bending moment becomes
For the power-law hardening model shown in Fig. 4c, the elastic region is described by
where
The corresponding sectional moment is
The power-law plastic-zone integral is expressed as
where
Eq. (19) gives the power-law sectional bending moment corresponding to the adopted linear through-section strain field and the fitted total-strain hardening response. The three moment expressions
2.4 Analytical Modelling of Steady Bending Force and Shaft Torque
The sectional moments derived in Section 2.3 define the internal resistance transmitted through the roller-RB contact system. An earlier study reported a central-axis bending-force relation based on roller equilibrium and the plastic-limit moment of an ideal circular section [12]. In the present formulation, the roller equilibrium is coupled to the constitutive-dependent sectional moments obtained from the elastic-perfectly plastic, bilinear-hardening, and power-law stress distributions. Accordingly, the influence of material hardening is retained in both the steady bending-force and shaft-torque estimates.
As shown in Fig. 6, the load transfer is governed by the rotating-roller geometry and the moment arms of the normal and equivalent tangential contact-resistance components. Let
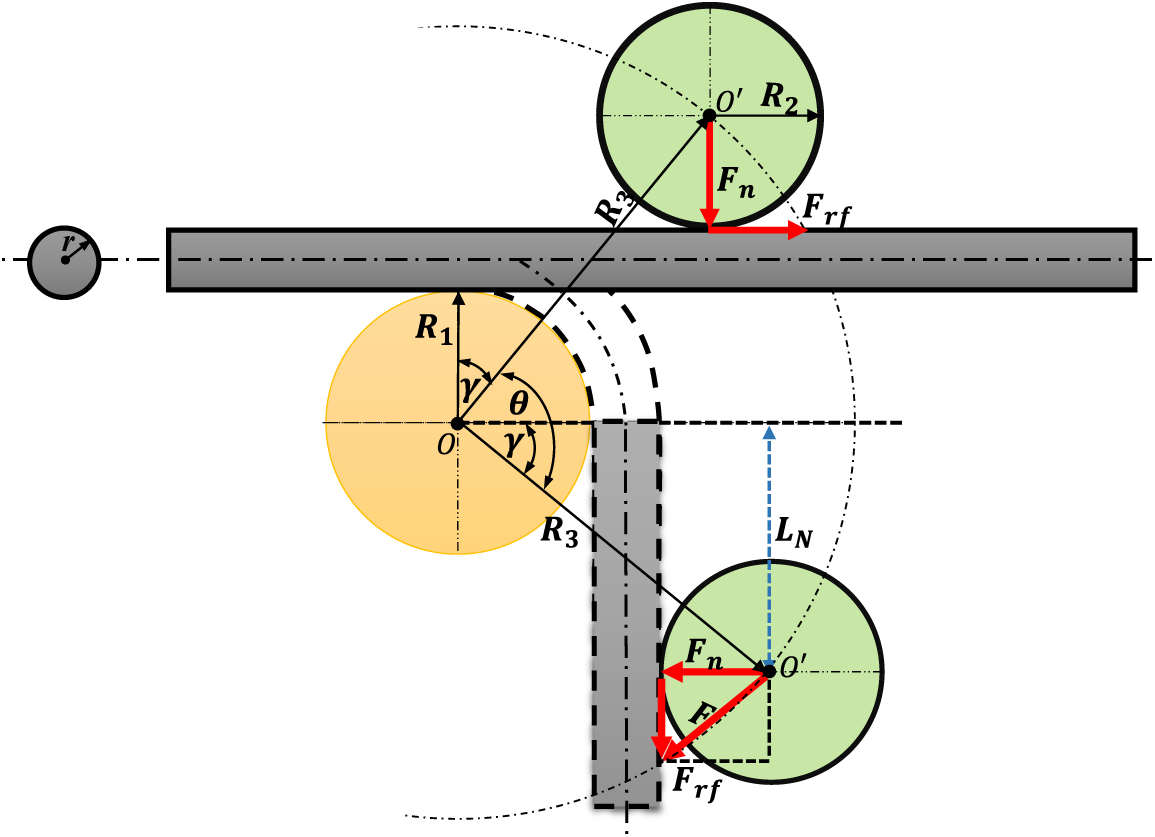
Figure 6: Geometric force analysis of the central-axis RB bending configuration.
The contact-resistance contribution is represented by the prescribed offset
here,
From the contact geometry, the angle
where
The moment arm associated with the equivalent tangential contact-resistance force is
The external moment generated by the contact-force components is then
Substituting Eq. (21) into Eq. (25) gives
Under quasi-static equilibrium, the external moment is taken to balance the sectional bending resistance,
The effective load-transfer arm is therefore defined as
or, in terms of the roller geometry,
From Eqs. (26)–(28), the normal contact force is
Combining Eqs. (20), (21) and (30) gives the resultant bending force,
For the three constitutive formulations, the bending-force estimates become
The corresponding shaft torque is obtained from the moment balance of the contact-force components. Using Eqs. (20), (21) and (28), it can be written as
Thus, the shaft-torque estimates corresponding to the three constitutive descriptions are
Eqs. (32)–(34) provide the analytical bending-force estimates, whereas Eqs. (36)–(38) give the corresponding shaft-torque estimates. The terms
3 Numerical Simulation of RB Bending Forming
3.1 Establishment of the RB Bending Model
To assess the process-level response of central-axis RB bending, a three-dimensional finite element model was established in ANSYS Workbench based on the central-axis bending configuration shown in Fig. 7. Several modelling simplifications were introduced to reduce computational cost while retaining the essential mechanics of the bending process. Consistent with the equivalent smooth-section representation defined in Assumption 5, the RB was modelled as a homogeneous and isotropic smooth circular bar of nominal diameter
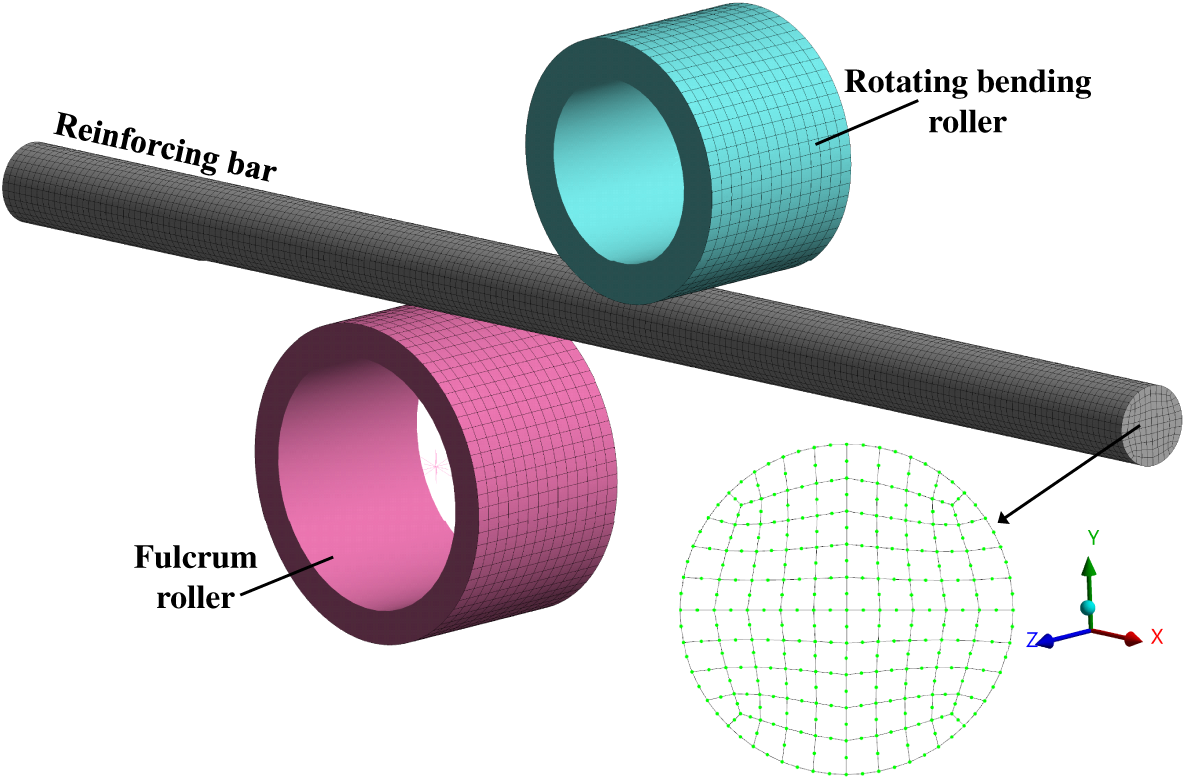
Figure 7: 3D FE mesh of the process-level central-axis RB bending model.
The upstream clamping part was represented by a fixed boundary at the left end of the RB, while the deformation zone was formed by the fulcrum roller and the rotating bending roller. This simplified restraint treatment is consistent with related steel-bar and rebar bending-machine FE studies in which fixed constraints or fixed points were used when the analysis focused on the roller-bar bending region [5,7]. The fixed boundary represents an ideal no-slip upstream restraint. Accordingly, reaction components and stress fields close to the restrained end are influenced by this boundary idealization, whereas the force-torque assessment is interpreted in relation to the roller-bar deformation zone. The resulting model consisted of three principal components: the RB, the fulcrum roller, and the rotating bending roller.
The nonlinear analysis was performed using the ANSYS Transient Structural module. The RB was treated as the main deformable body, whereas the fulcrum roller and rotating bending roller were treated as rigid bodies. The RB materials considered in this study were HRB335, HRB400, and HRB500. A multilinear isotropic hardening model was used to describe the elastic-plastic response of the RB during bending and unloading. Plastic yielding was governed by the von Mises yield criterion, and isotropic hardening was adopted to represent the post-yield response. The material responses for the HRB335 d10, HRB400 d10, HRB400 d12, and HRB500 d10 cases were defined from the reinforcement data reported in Refs. [33–35]. For HRB335 and HRB400, the constitutive parameters were identified from the reported stress–strain responses [33,34], whereas the HRB500 response was defined using the ϕ10 reinforcement parameters reported in Ref. [35]. The adopted material properties are summarized in Table 1, together with those assigned to the fulcrum and rotating bending rollers.
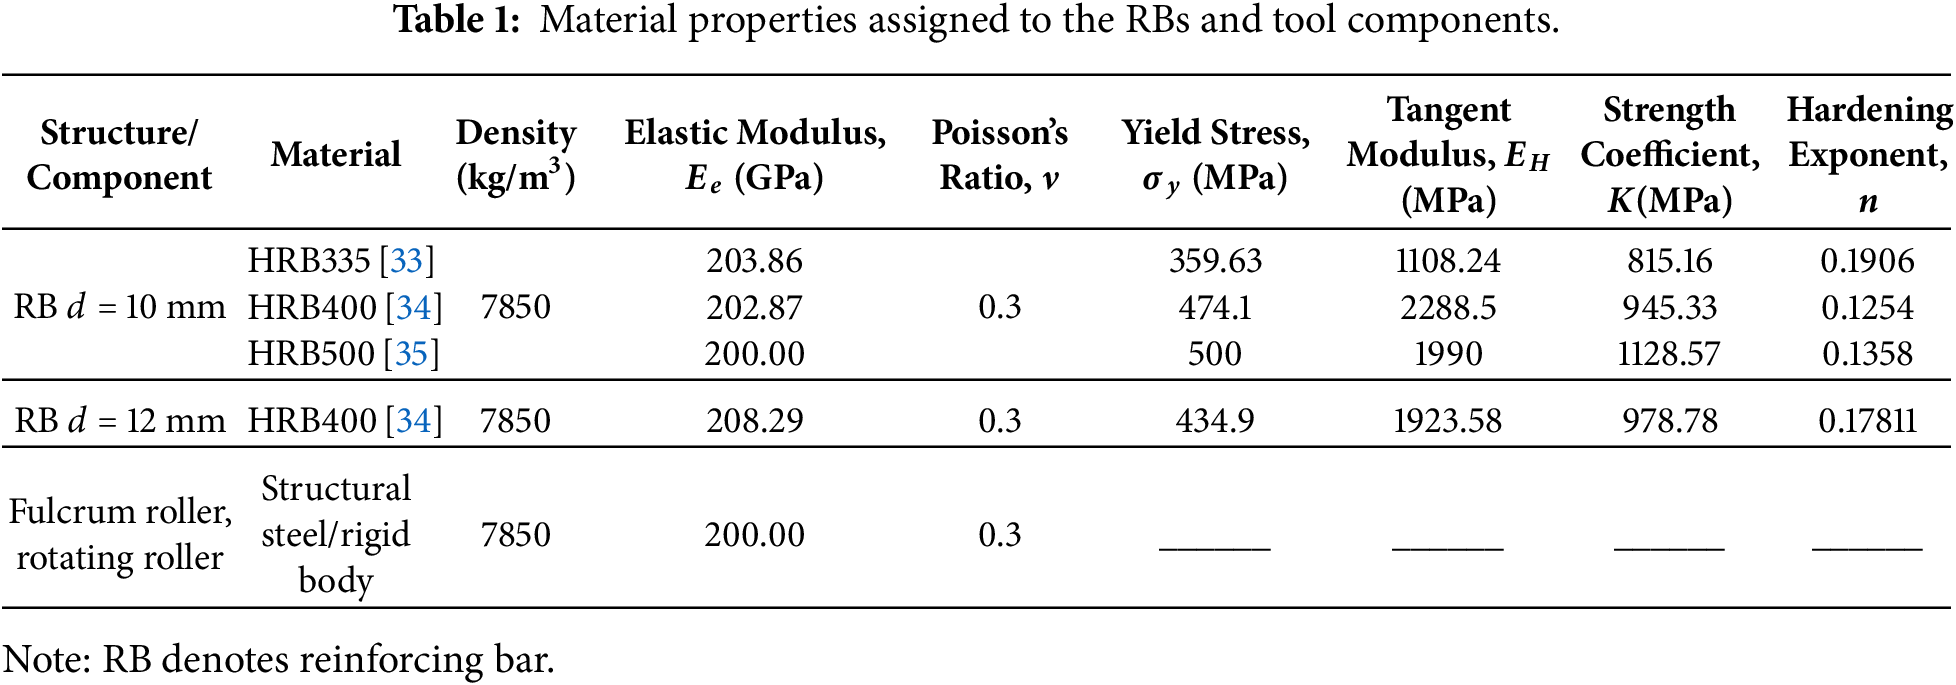
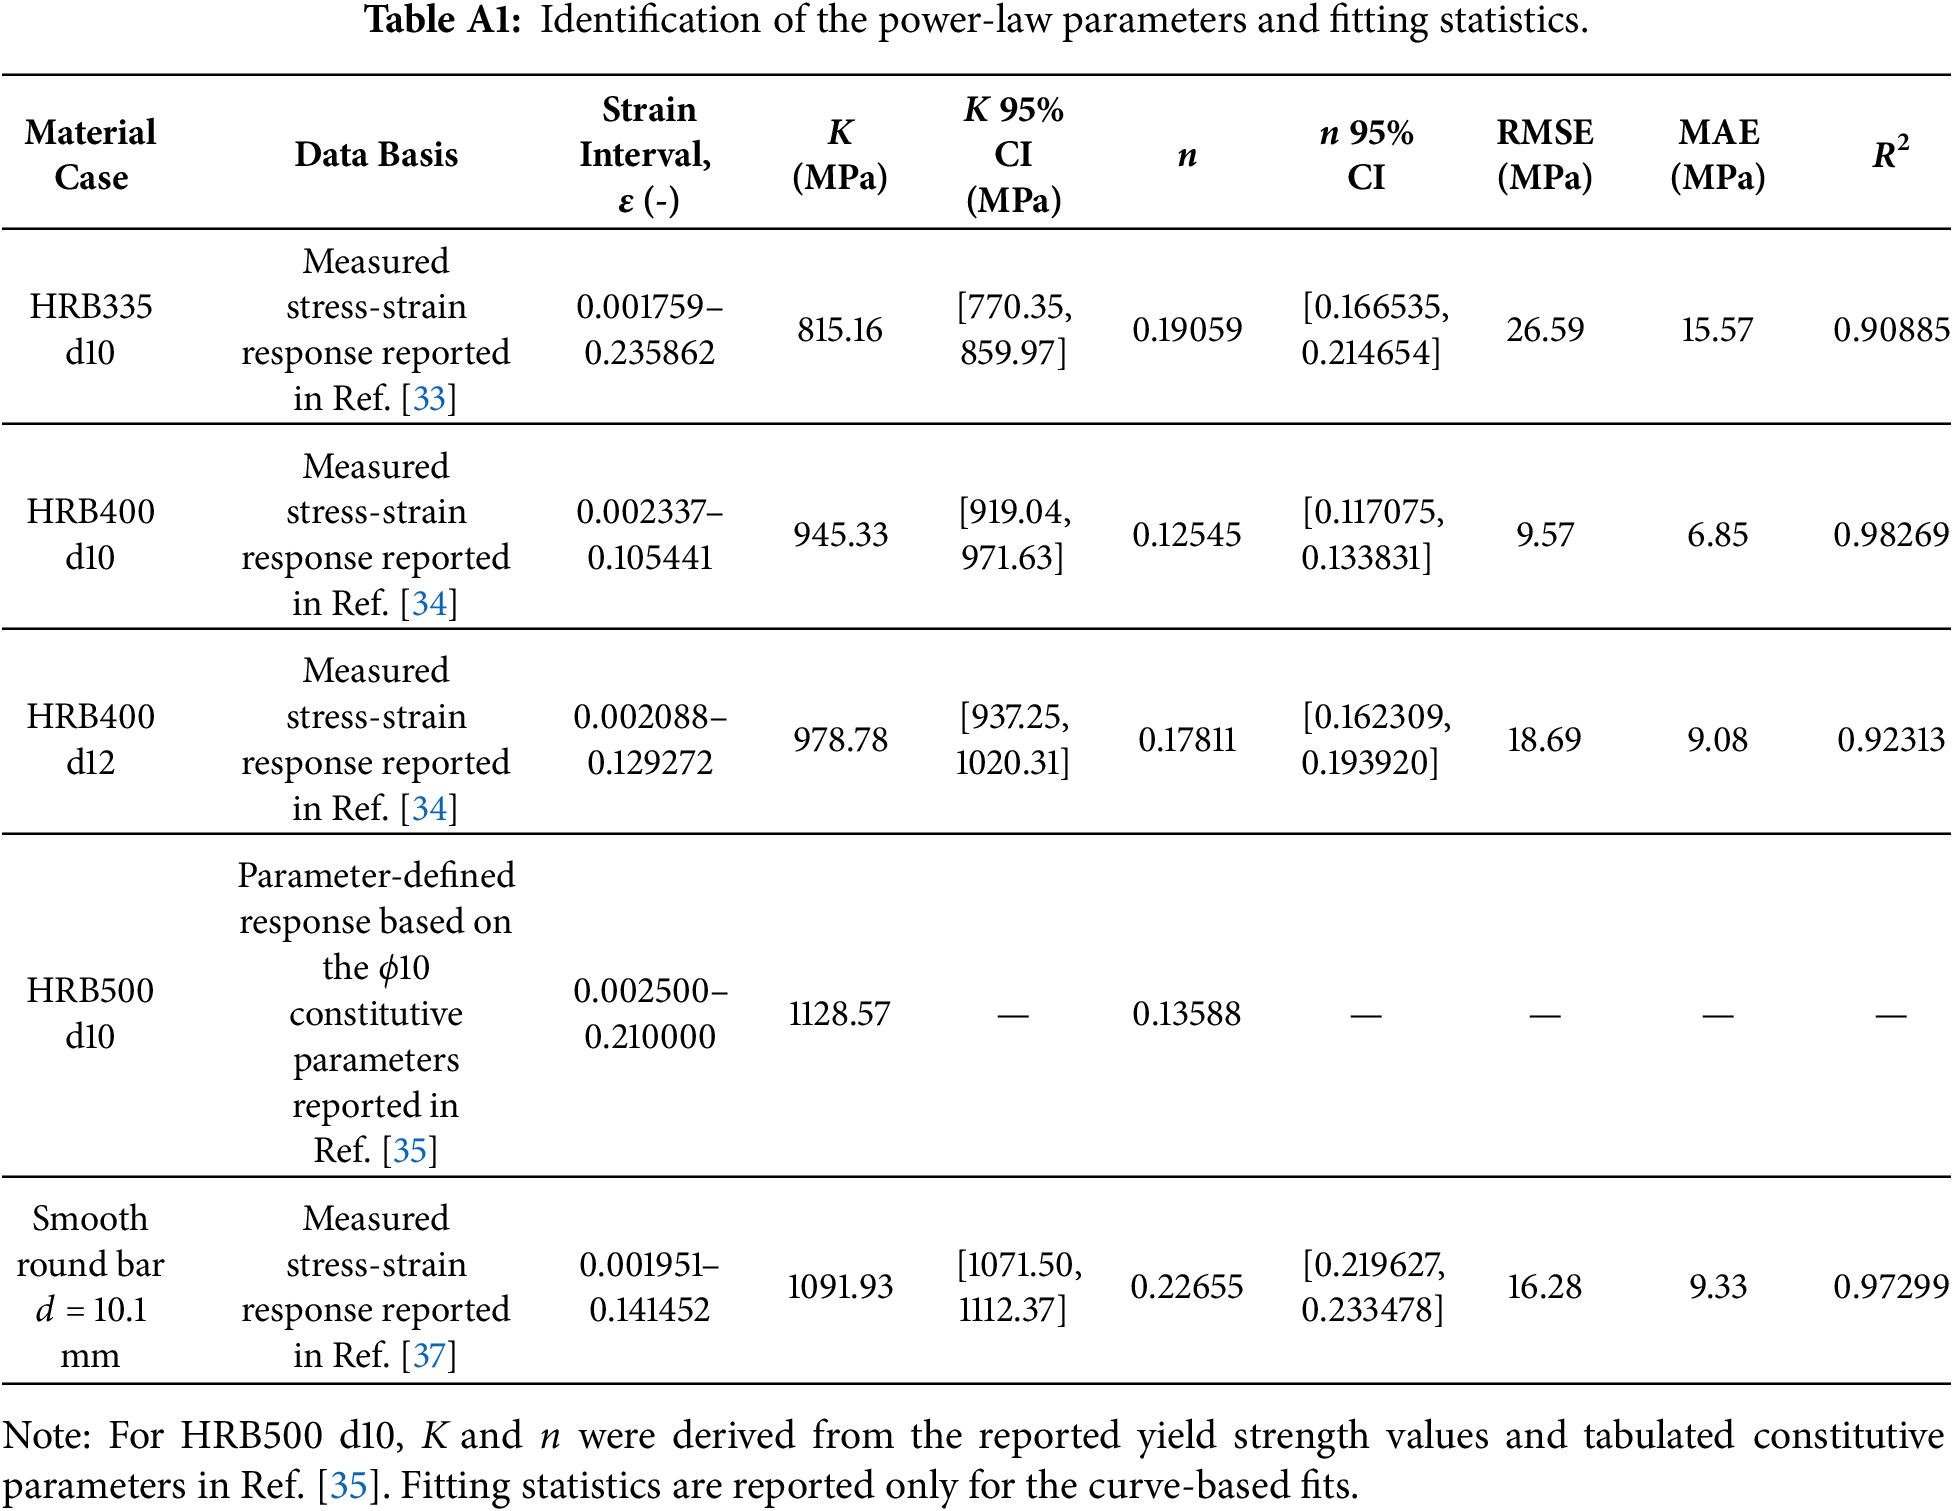
The engineering stress-strain data were converted into true stress-true plastic strain form to define the multilinear plasticity input in ANSYS. For the analytical power-law formulation, the hardening parameters K and n were identified from the corresponding true stress-true total strain response, consistent with the total-strain form used in the analytical section model. The fitting intervals, fitting procedure, uncertainty estimates, and regression-quality metrics for the power-law parameters are summarized in Appendix A. The conversion relations used for the FE plasticity input are
where
Because the RB undergoes substantial elastic-plastic deformation during bending and unloading, the mesh size affects both numerical accuracy and computational cost. The RB was discretized using the MultiZone meshing method with mapped hexahedral elements, as shown in Fig. 7, to provide regular through-length and through-section discretization in the deforming region. Mesh convergence was assessed using the maximum shaft torque and maximum bending force, which represent the global machine-load response of the process-level model. The maximum von Mises stress and maximum equivalent plastic strain in the RB were also examined as local stress and plastic-deformation indicators. As shown in Fig. 8, all four quantities approached mesh-insensitive values with refinement. When the RB mesh size was reduced from 1.00 to 0.95 mm, the maximum shaft torque changed by 0.03%, the maximum bending force by 0.25%, the maximum von Mises stress by 0.14%, and the maximum equivalent plastic strain by 1.26%. Therefore, a 1.0 mm RB mesh was adopted in the subsequent process-level FE analyses as a compromise between numerical accuracy and computational efficiency.
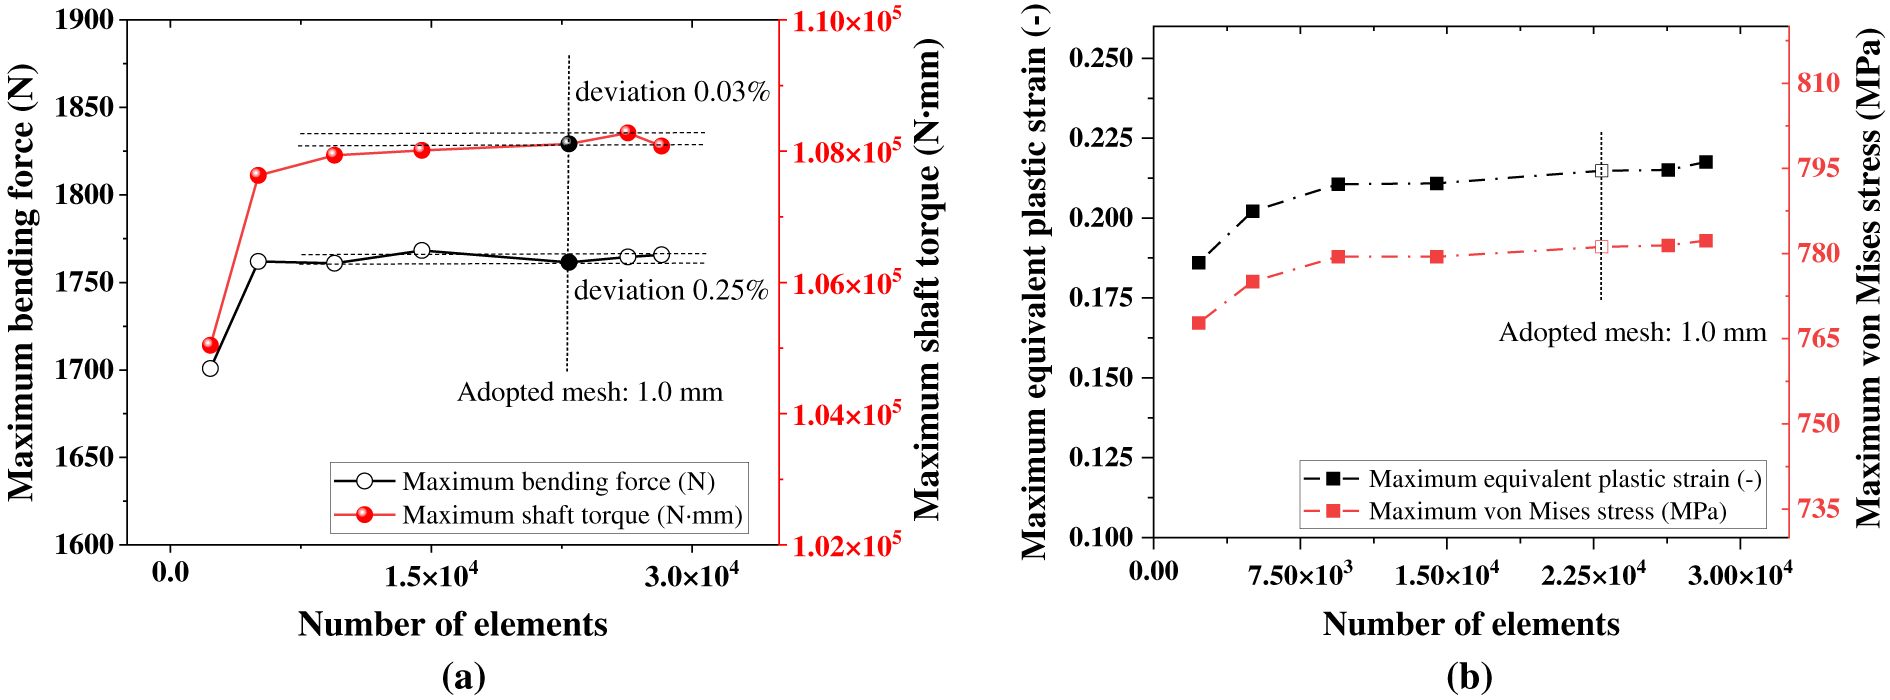
Figure 8: Mesh-convergence response of the process-level FE model: (a) maximum bending force and maximum shaft torque of the process-level model; (b) maximum equivalent plastic strain and maximum von Mises stress.
The principal contact interactions were defined between the fulcrum roller and the RB surface and between the rotating bending roller and the RB surface. Consistent with the physical tool-bar contact condition, both interfaces were modelled as frictional contact pairs with a Coulomb friction coefficient
The loading scheme is illustrated in Fig. 9. The center of the rotating roller was connected to the fixed axis through a revolute joint, allowing the roller to revolve about the fixed axis while maintaining the prescribed central-axis bending configuration. In the transient FE analysis, the driving condition was applied as a time-dependent rotational velocity at this joint. The prescribed quantity was therefore the rotational-velocity history of the bending shaft, while the bending angle followed from the imposed angular motion. Based on the selected processing conditions, the angular velocity of the bending spindle was set to 11 rad/s, corresponding to 105 r/min. The target maximum bending angle was 180∘, giving a bending-forming time of 0.285 s during the loading stage.
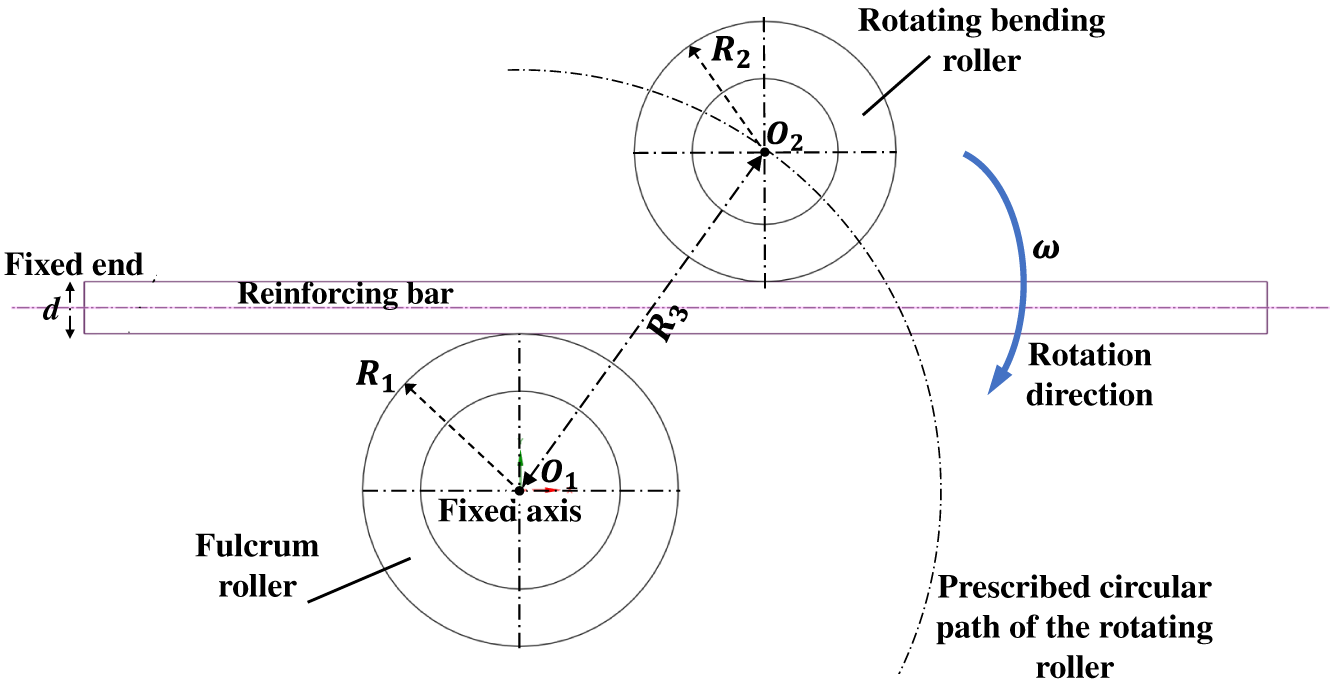
Figure 9: Loading schematic of the central-axis RB bending FE model.
4.1 FE Analysis of Bending Stress and Residual Stress
The reference process-level FE case was examined first to clarify the stress development during loading and the residual-stress state after unloading. The reference case used an HRB400 RB with
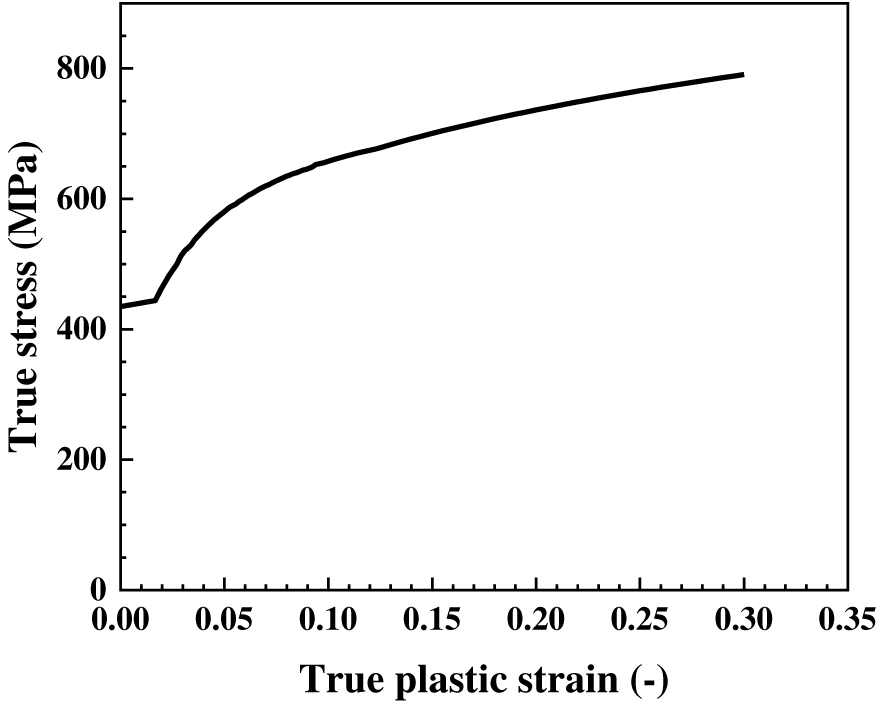
Figure 10: True stress-true plastic strain curve used for the HRB400 d12 material model.
During central-axis RB bending, the bar is deformed progressively by the pressure exerted by the rotating roller. At the beginning of loading, the response is elastic. Once the stress exceeds the yield stress, the sectional stiffness decreases markedly and plastic deformation develops in the bending region while part of the section may still remain elastic. The total strain in the deformation zone therefore contains both recoverable elastic strain and irreversible plastic strain. During unloading, the elastic part is released and springback occurs, whereas the plastic strain remains. The stress field after unloading is consequently not eliminated completely, giving rise to a residual-stress state in the bent RB.
The axial normal-stress contour plots of the RB before and after unloading at the prescribed bending angle are shown in Fig. 11. The overall contours are shown in Fig. 11a, the curved deformation zone is enlarged in Fig. 11b, and the sectional stress distributions at locations A, B, and C along the bending arm are shown in Fig. 11c. Before unloading, the stress field is distributed approximately symmetrically about the section centerline, with tensile stress on the outer arc and compressive stress on the inner arc. The highest stress level is concentrated in the curved deformation zone, whereas the stress in the force-transfer region is comparatively smaller. In terms of absolute magnitude, the largest axial normal stress appears on the inner side of the bending section and reaches about 999.14 MPa. This indicates that the most severe loading state is localized in the curved region, while the straight-arm portion mainly transmits the bending action toward the active deformation zone.
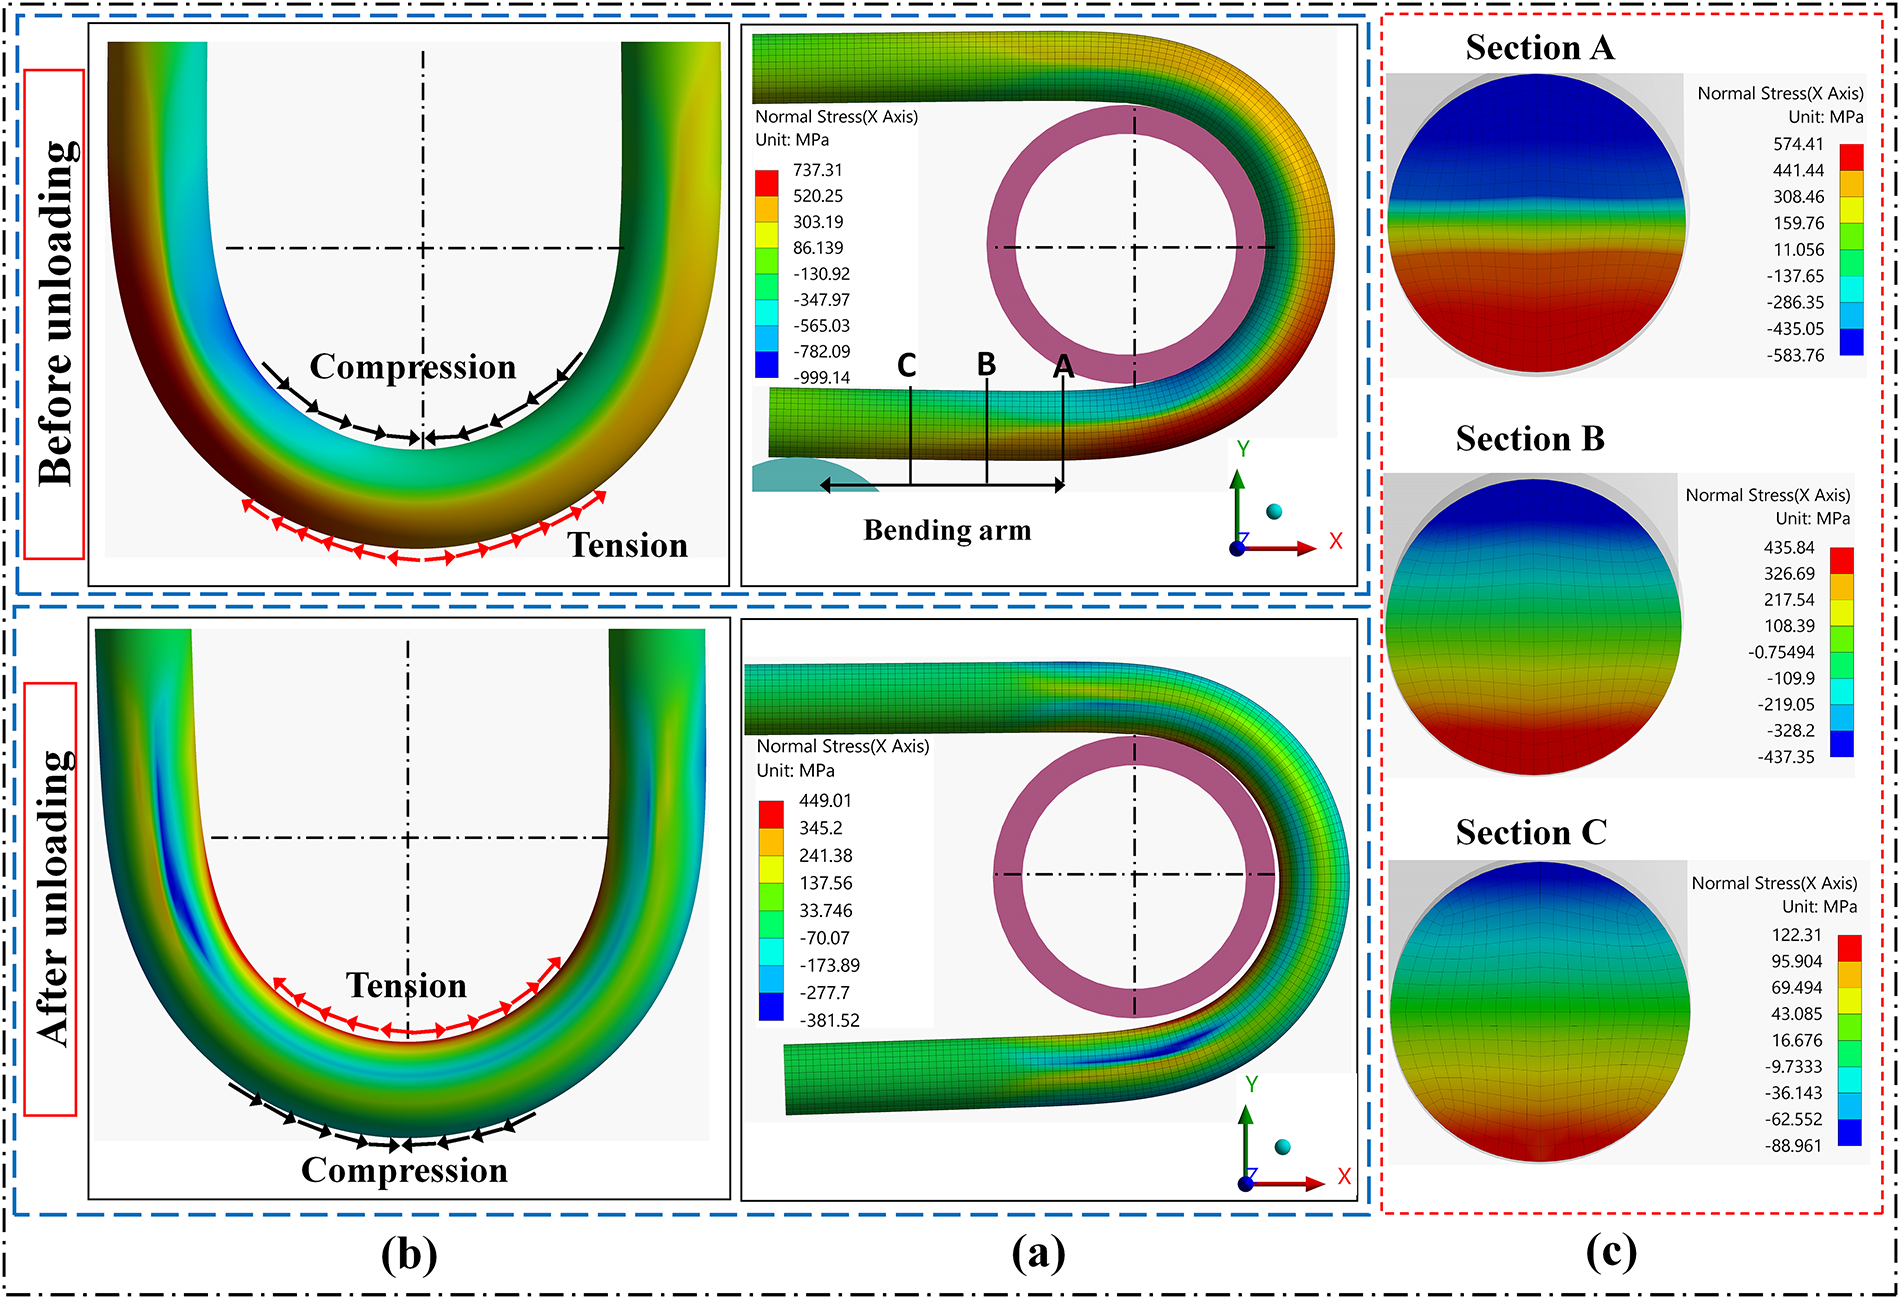
Figure 11: Axial normal stress distribution of the RB before and after unloading: (a) overall contour plots; (b) enlarged view of the curved deformation zone; (c) sectional normal-stress distributions at locations A, B, and C.
After unloading, the stress field is redistributed markedly. The stress difference between the inner and outer sides decreases, and the overall stress level becomes much lower than that before unloading. The tensile stress on the outer side decreases and tends to transform into compressive stress, whereas the compressive stress on the inner side decreases and tends to transform into tensile stress. After complete unloading, the maximum tensile and compressive residual stresses are about 449 MPa and 381.5 MPa, respectively. Thus, although a large part of the stored elastic strain energy is released during springback, a non-negligible residual stress field remains in the bent RB.
The sectional distribution in Fig. 11c further shows that the stress state varies along the bending arm. Section A, located closest to the main curved deformation zone, exhibits the highest stress level and the steepest through-section stress gradient. At Section B, the stress level is lower and the stress distribution becomes less intense, showing that the section lies in a transition region. Section C has the lowest overall stress level, indicating that it is farther from the main bending zone and is less affected by the forming action. These three sections therefore reveal a stress transition along the bending arm, from the highly stressed region near the main bending zone to regions of progressively lower stress intensity farther away.
Overall, the FE results indicate that the curved deformation zone governs the most severe elastic-plastic bending response, while the adjoining bending arm exhibits a gradual reduction in stress intensity. Unloading redistributes rather than eliminates the internal stress field: recoverable elastic strain is released, whereas plastic strain retained in the deformation zone prevents complete stress relaxation. The through-section stress gradient is therefore reduced and the tensile-compressive stress distribution is redistributed, leaving a non-negligible residual-stress field in the bent RB. Since springback in rebar and steel-bar bending arises from elastic recovery after stress removal and affects the final bending angle [5,7], the resulting residual-stress field helps explain the mechanical connection between the unloading path, springback, and practical bending accuracy.
4.2 Section-Level Assessment of Analytical Internal Bending Moments Using the SFEM
To assess the analytically derived internal bending moments independently of tool-bar contact and machine-level load transfer, a simplified section-level finite element model (SFEM) was established using the Static Structural module in ANSYS Workbench. Under quasi-static equilibrium, the internal sectional moment associated with the through-thickness stress field must be balanced by the external reaction moment required to impose the prescribed curvature. The SFEM reaction moment was therefore used as the reference quantity for assessing the analytical moment expressions.
The SFEM was constructed by prescribing end displacement and rotation boundary conditions to impose pure bending without tool contact. Thus, frictional effects and contact-induced load transfer were excluded, and inertia was neglected. The model was solved implicitly so that equilibrium was satisfied incrementally during loading. The resulting response therefore reflects mainly the constitutive law and imposed curvature, without interference from tool-bar contact mechanics. The RB was meshed using MultiZone hexahedral elements, consistent with the meshing strategy adopted in the full process-level contact FE model.
For the diameter-dependent comparison, the HRB400 d10 material response was kept fixed so that the variation in
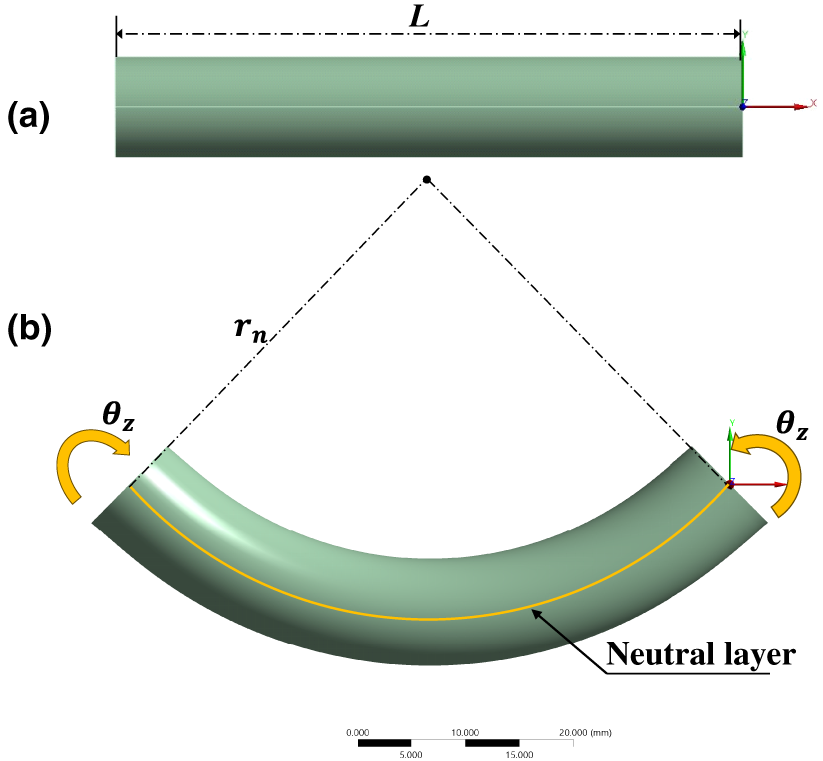
Figure 12: Section-level pure-bending FE model: (a) undeformed straight RB segment; (b) deformed constant-curvature configuration.
Table 2 summarizes the section-level comparison between the analytically estimated internal bending moments and the SFEM reaction moments for two parametric sets: the RB diameter range
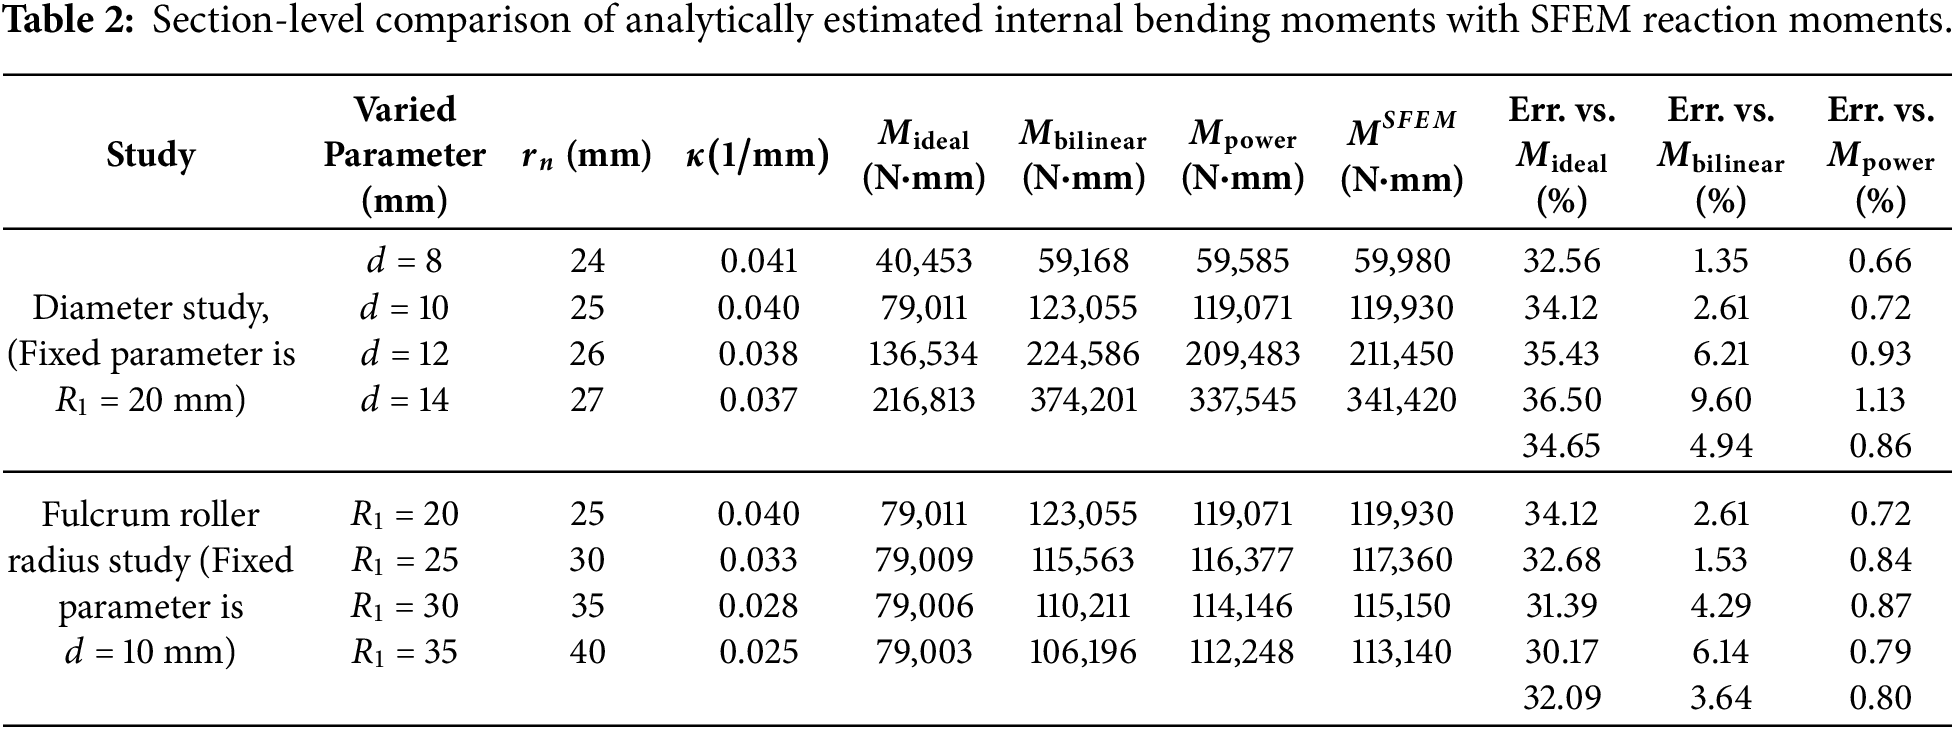
Across the RB diameter range, the mean relative errors between the analytical and SFEM moments were 34.65%, 4.94%, and 0.86% for the elastic-perfectly plastic, bilinear hardening, and power-law hardening formulations, respectively. A similar ranking was obtained over the
The section-level comparison therefore provides a direct assessment of the analytical internal bending moments under a prescribed pure-bending state. This assessment isolates the sectional elastic-plastic resistance from tool geometry, frictional contact, and roller-position effects. In the actual bending process, the sectional resistance is transferred to the machine through roller-bar contact; the resulting steady bending force and shaft torque are then evaluated using the process-level 3D FE model.
4.3 Process-Level Assessment of Analytical Bending Force and Shaft Torque
The analytical formulations were next assessed at the process level using a full three-dimensional FE model with tool-bar contact. The FE torque response,
At the beginning of rotation, the response is affected by contact establishment between the rotating bending roller and the RB, rapid development of the plastic deformation zone, and adjustment of the tool-bar contact state. Similar torque histories have been reported for circular-roller bending of round steel bars and rebars, where the torque rises after roller contact and then becomes nearly constant for round bars, whereas ribbed bars exhibit additional fluctuations associated with rib-induced contact changes [10]. In the present process-level FE simulation, both
where
The bending force was treated in the same manner. Since the analytical force expression represents the steady force required to maintain bending equilibrium, rather than a transient extremum associated with initial contact formation, the FE force history was reduced to the steady mean force,
where
Fig. 13 shows the FE torque-rotation response
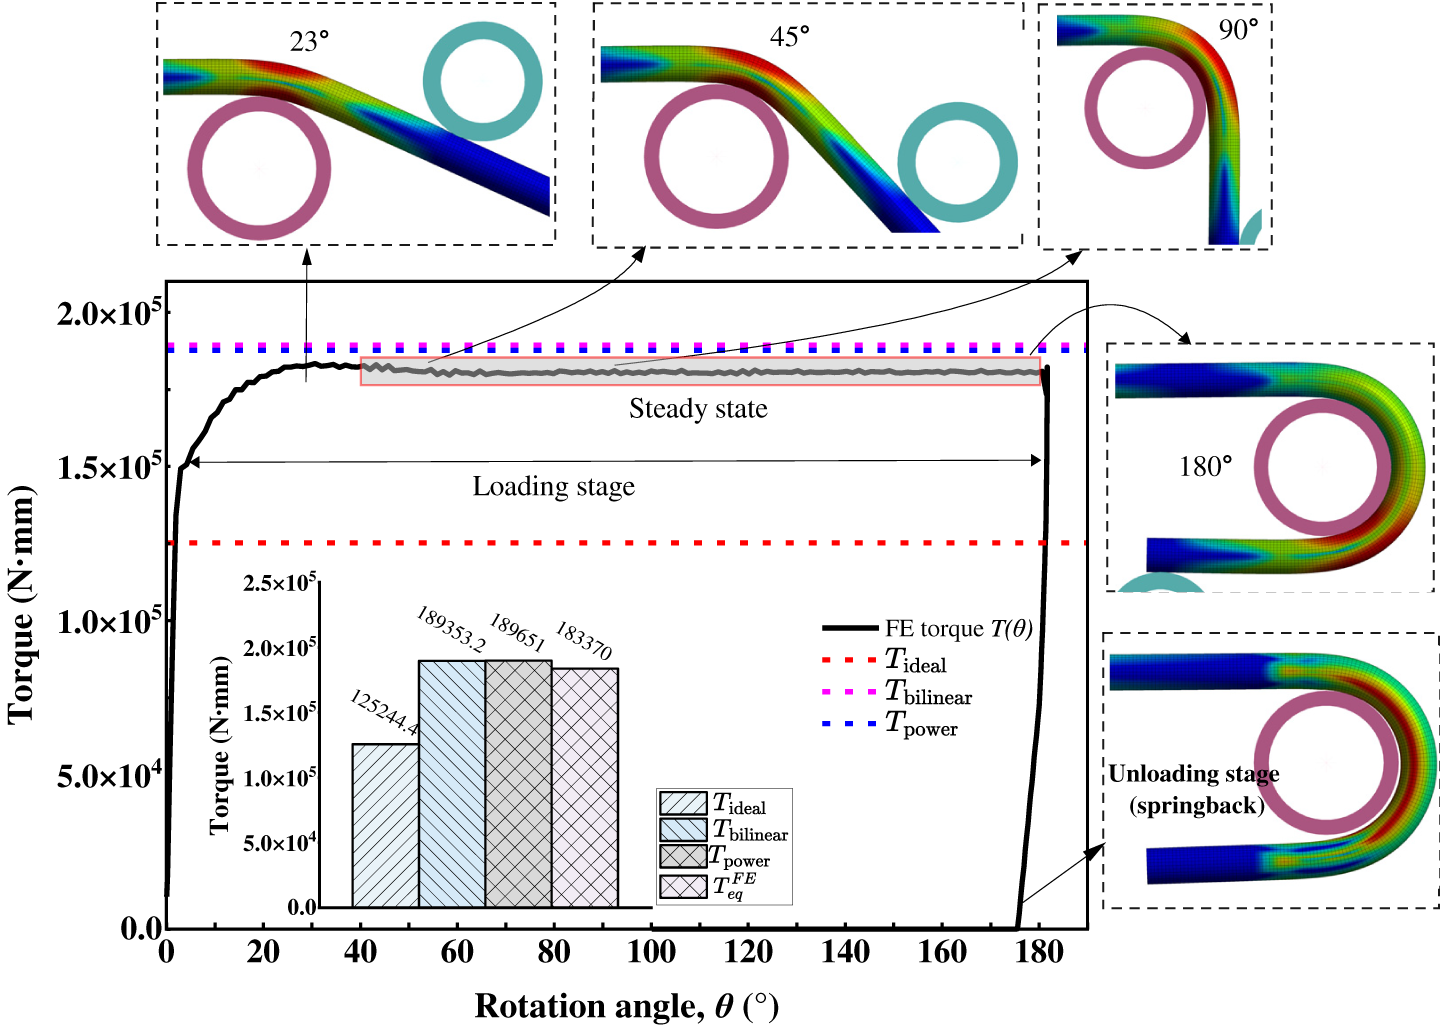
Figure 13: FE torque-rotation response
For the present case, the FE steady mean torque was
Fig. 14 presents the corresponding FE force-rotation response
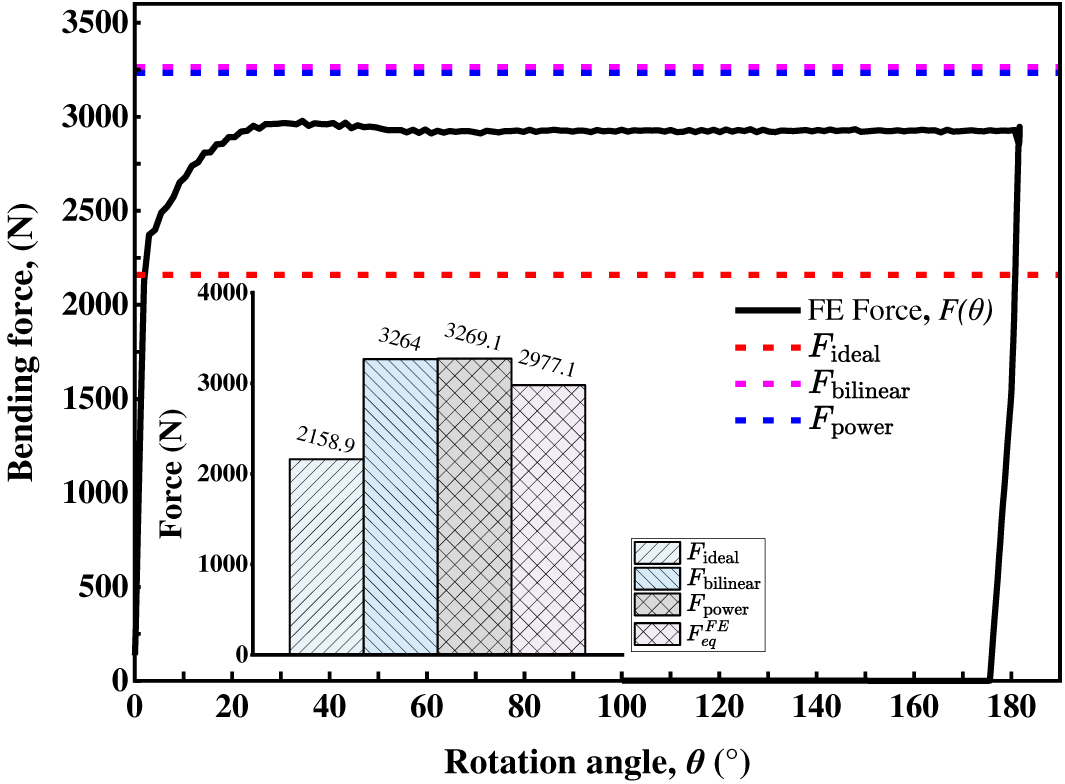
Figure 14: FE force-rotation response
For the present case, the FE steady mean force was
4.3.2 Comparison with Reported Smooth Round-Bar Torque and Circular-Roller Force
The process-level analytical estimates were further assessed using the smooth round-bar bending results reported by Higaki et al. [10] and Higaki [36]. Higaki et al. [10] reported measured torque–rotation responses for smooth round bars with
Both experimental specimens were machined from D13 SD345 reinforcing bar [10]. The same D13-derived true stress–true strain response was therefore used to identify the material parameters, with only the bar diameter varied in the sectional-moment calculations. The corresponding material response and power-law fit are shown in Fig. 15a.
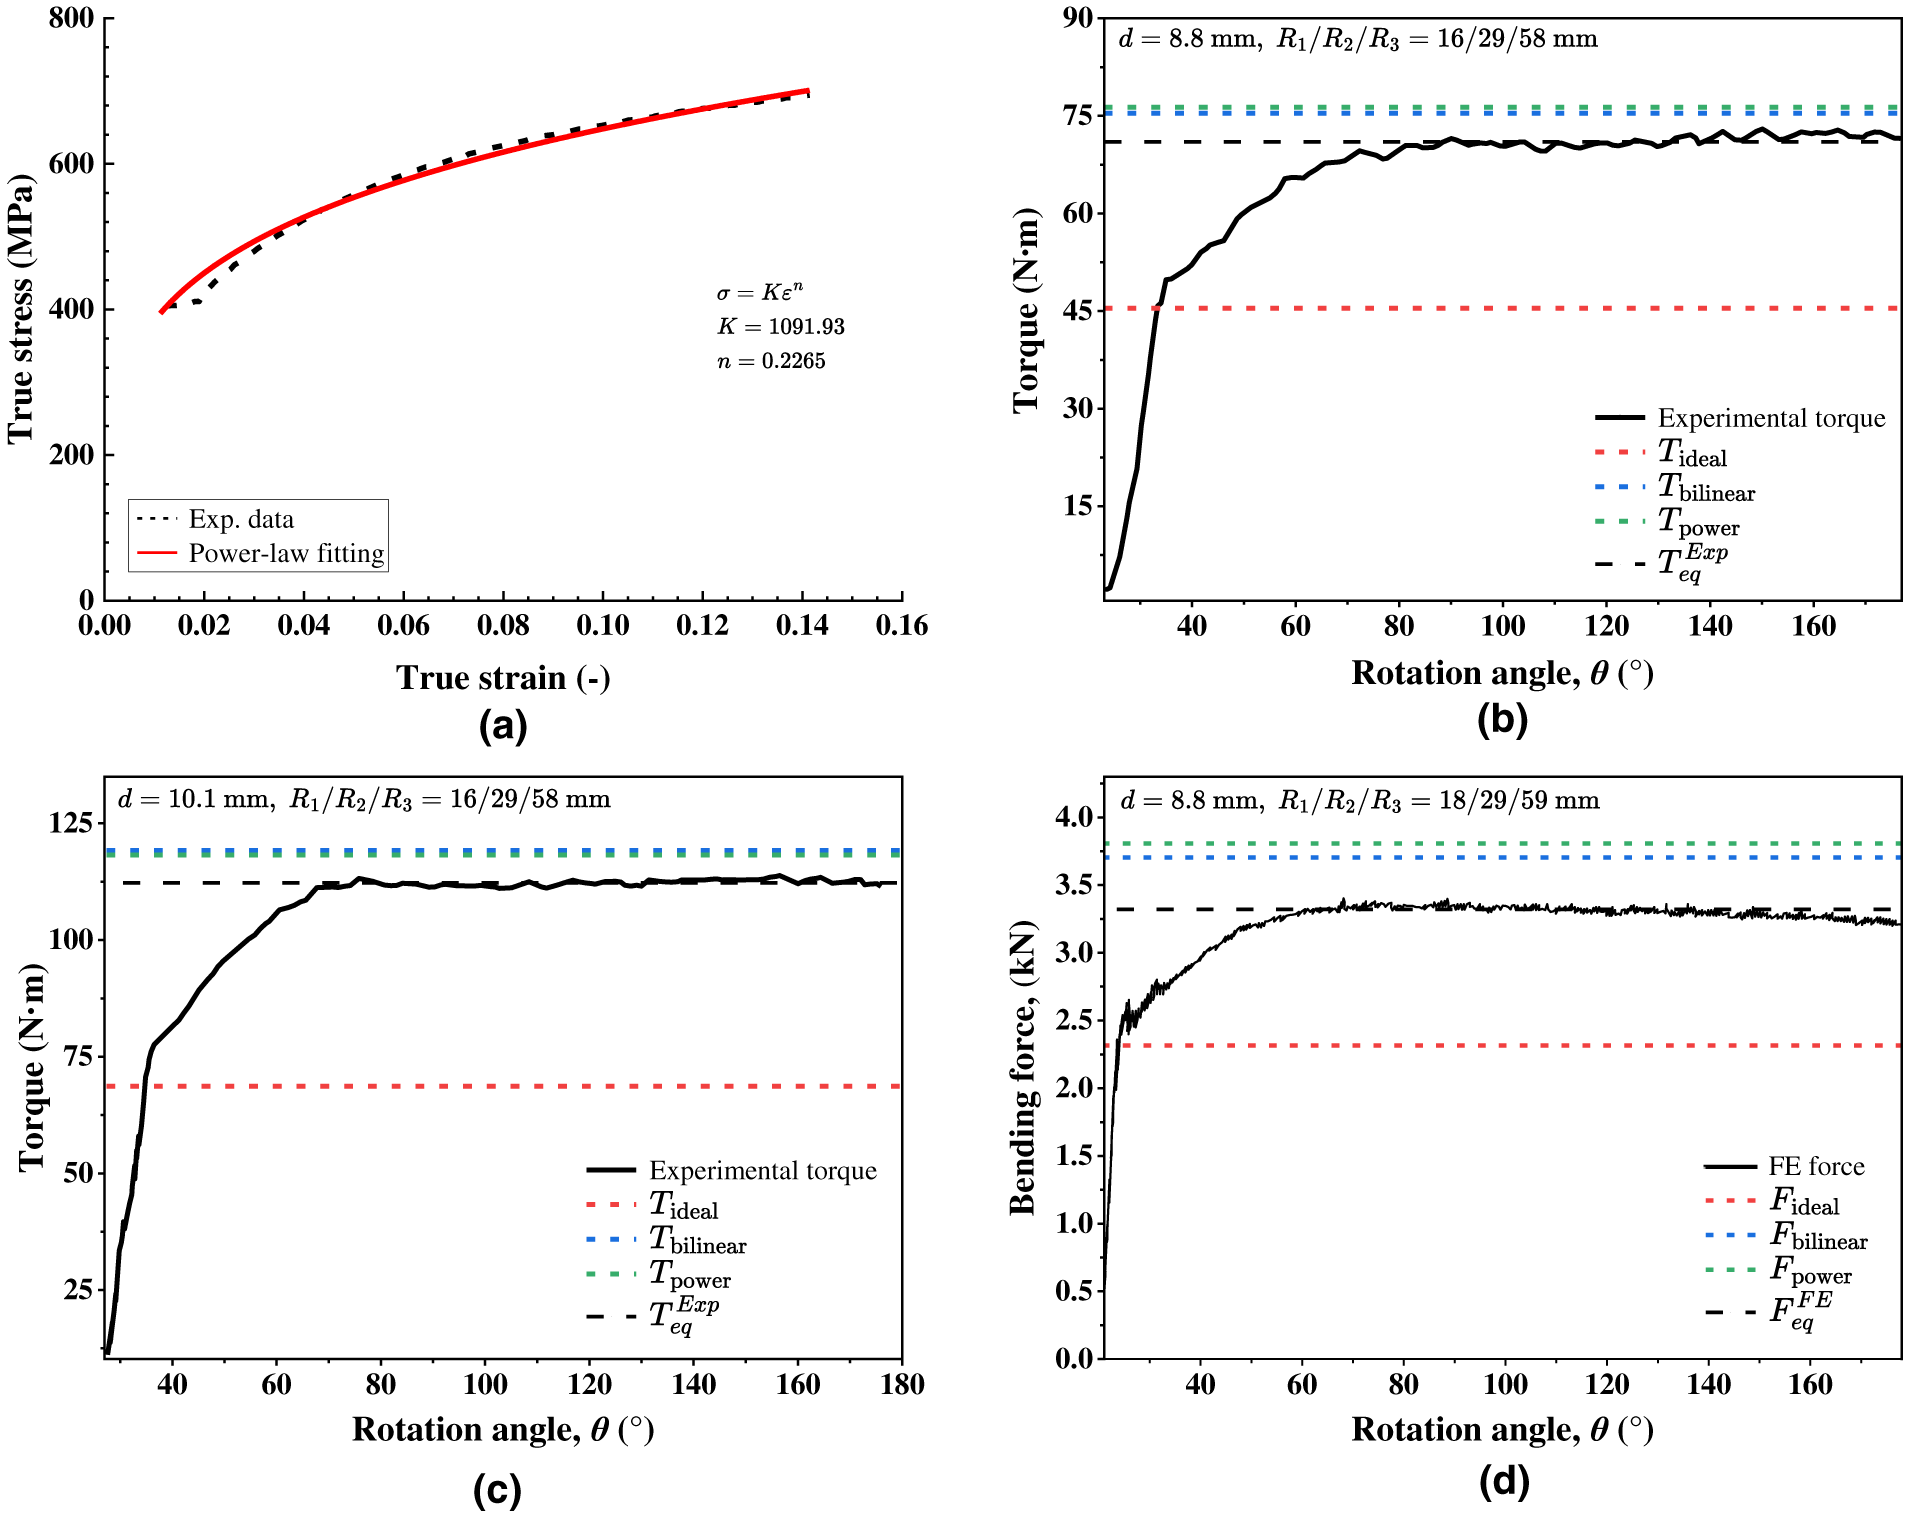
Figure 15: Comparison with reported smooth round-bar bending results: (a) true stress-true strain response of the D13-derived material and corresponding power-law fit [36,37]; (b,c) measured torque–rotation responses and analytical torque estimates for the
The experimental configuration reported by Higaki et al. [10] used
For d = 8.8 mm,
The
The reported FE force response and the corresponding steady analytical force estimates are shown in Fig. 15d. Using the material parameters and machine dimensions of this FE case, the elastic-perfectly plastic, bilinear-hardening, and power-law formulations predict torques of 45.429, 72.693, and 74.720 N·m, respectively. Their deviations from
Because the steady FE torque and circular-roller force were evaluated for the same bending case and averaging interval, their ratio gives an effective resultant-force arm of
The corresponding analytical value is
The difference between the two values is 0.57%, showing close agreement in the effective resultant-force arm for this FE case.
Across the two measured-torque cases and the additional FE torque–force case, the hardening-based formulations consistently provide closer estimates than the elastic-perfectly plastic formulation. The bilinear and power-law torque deviations are 5.31%–7.48% for the measured cases and 10.46%–13.54% for the FE case, while the corresponding force deviations are 11.10%–14.19%. The reference values, analytical estimates, and corresponding relative deviations are summarized in Table 3.

4.3.3 Parametric Influences on Bending Force and Shaft Torque
Using the parameter ranges listed in Table 4, the influence of RB grade, bar diameter, bending geometry, and machine-geometry parameters on the steady bending force and shaft torque was examined. The elastic-perfectly plastic formulation was not included in this parametric discussion because the preceding section-level, process-level, and experimental comparisons showed that it gave much larger deviations and consistently underestimated the bending demand. The analysis therefore focuses on the bilinear and power-law formulations, which retain post-yield hardening and provide the more relevant basis for interpreting practical force and torque trends. For each parameter set, the analytical estimates obtained from the corresponding force and torque relations were compared with the steady FE results, thereby extending the process-level assessment beyond the reference configuration.
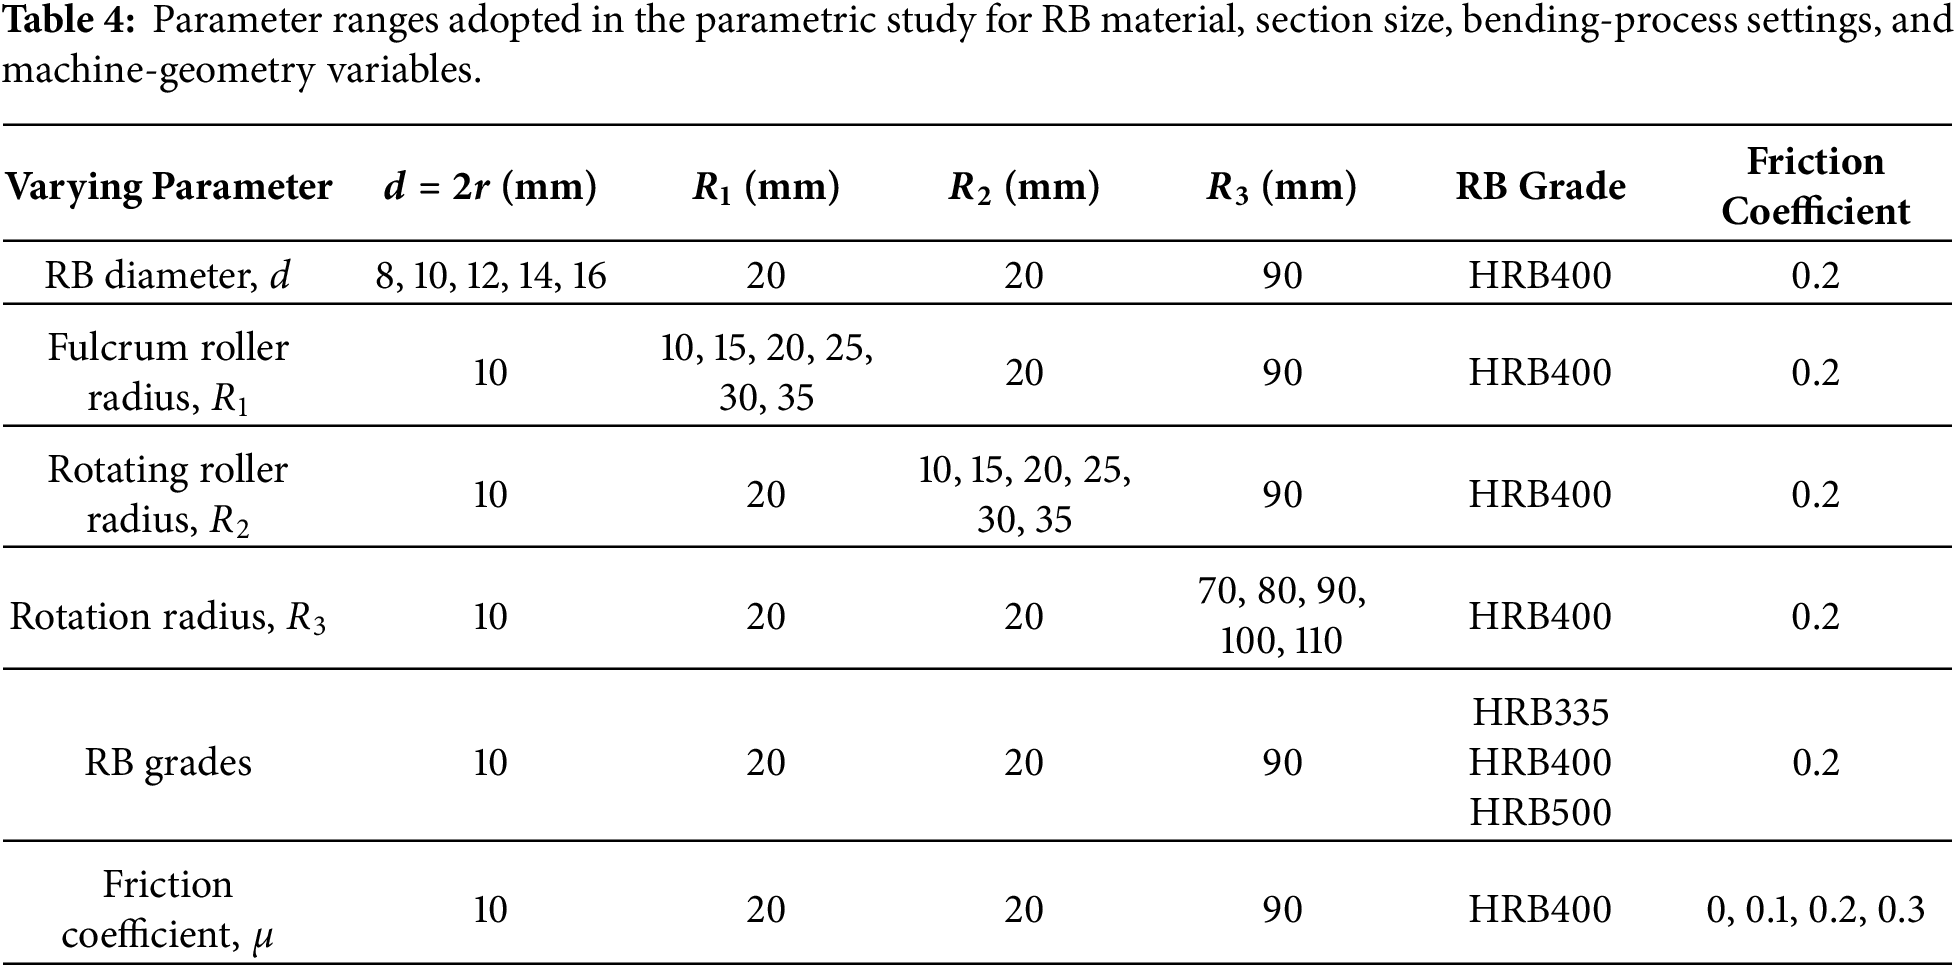
a. Influence of RB diameter,
To isolate the diameter effect, the HRB400 d10 material response was assigned to all
Fig. 16a,c shows the FE torque-rotation and force-rotation responses for different RB diameters. For clarity, only the response up to 90° is presented, since the curves have already entered the steady stage beyond approximately 40°, and further extension adds little additional information while increasing the FE computational cost. In both cases, the response rises rapidly at the beginning of bending and then approaches a nearly constant level as the deformation proceeds. As the RB diameter increases from 8 to 16 mm, the steady shaft torque increases by about 791.49%, while the steady bending force increases by about 864.72%, confirming the strong influence of section size on the process-level demand.
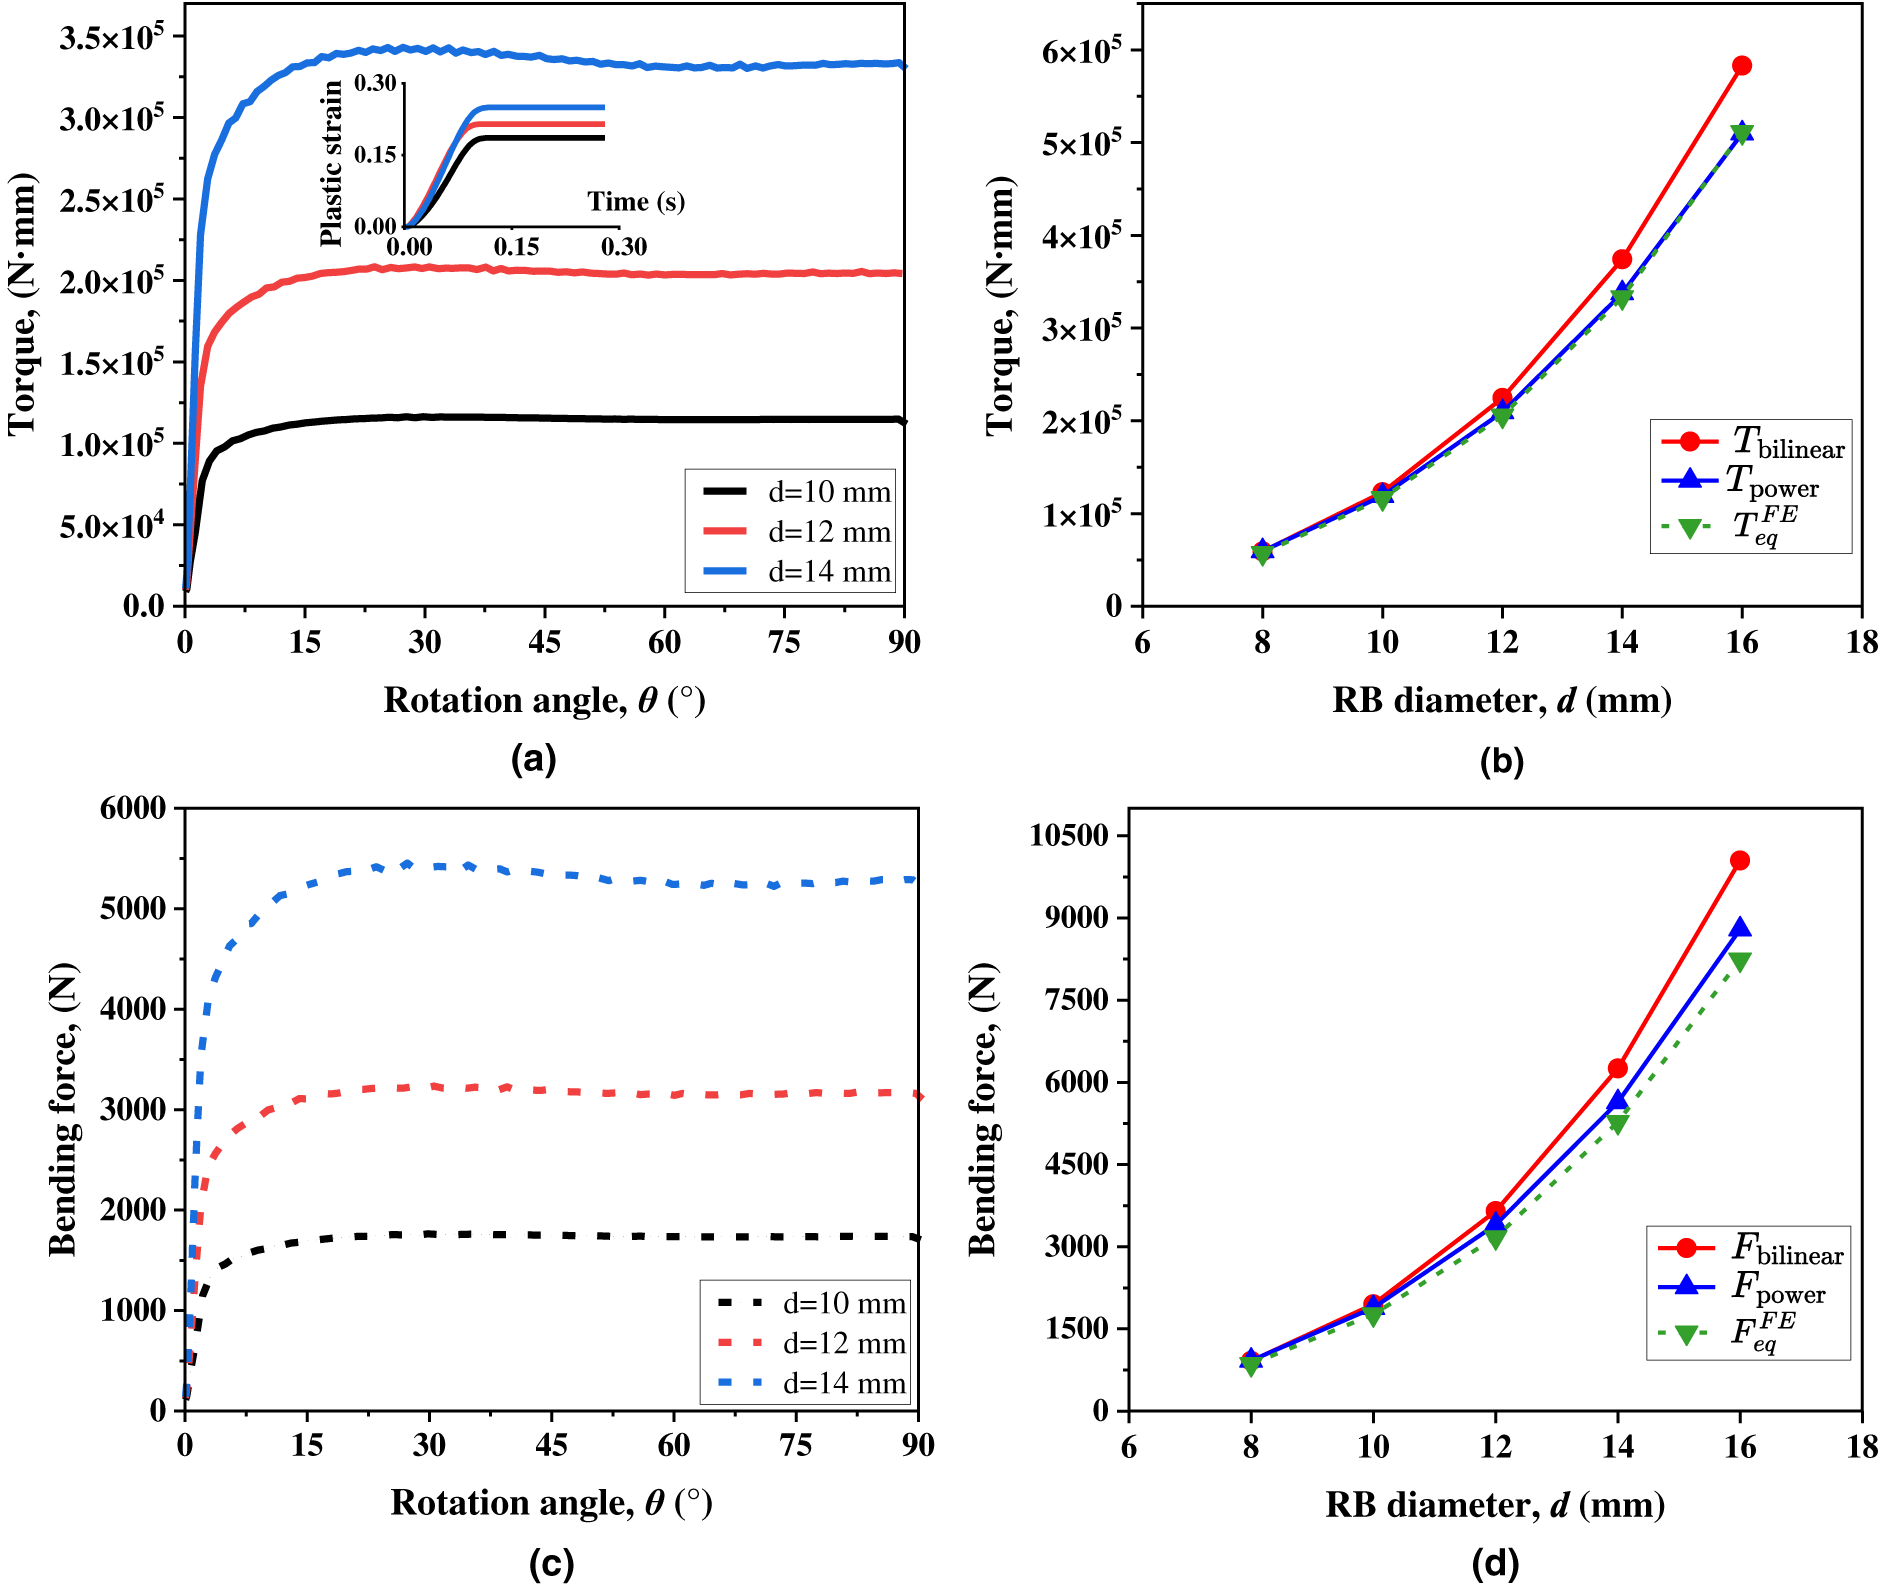
Figure 16: Influence of RB diameter on process-level torque and bending force: (a) FE torque-rotation response
This tendency is mechanically expected. Increasing RB diameter raises the sectional bending resistance directly, because the internal bending moment depends strongly on section size. Larger diameters therefore require both higher shaft torque and higher bending force to achieve the same curvature.
Fig. 16b,d compares the analytical torque estimates
b. Influence of fulcrum roller radius,
Fig. 17 compares the analytical estimates of shaft torque and bending force with the corresponding FE steady quantities for the
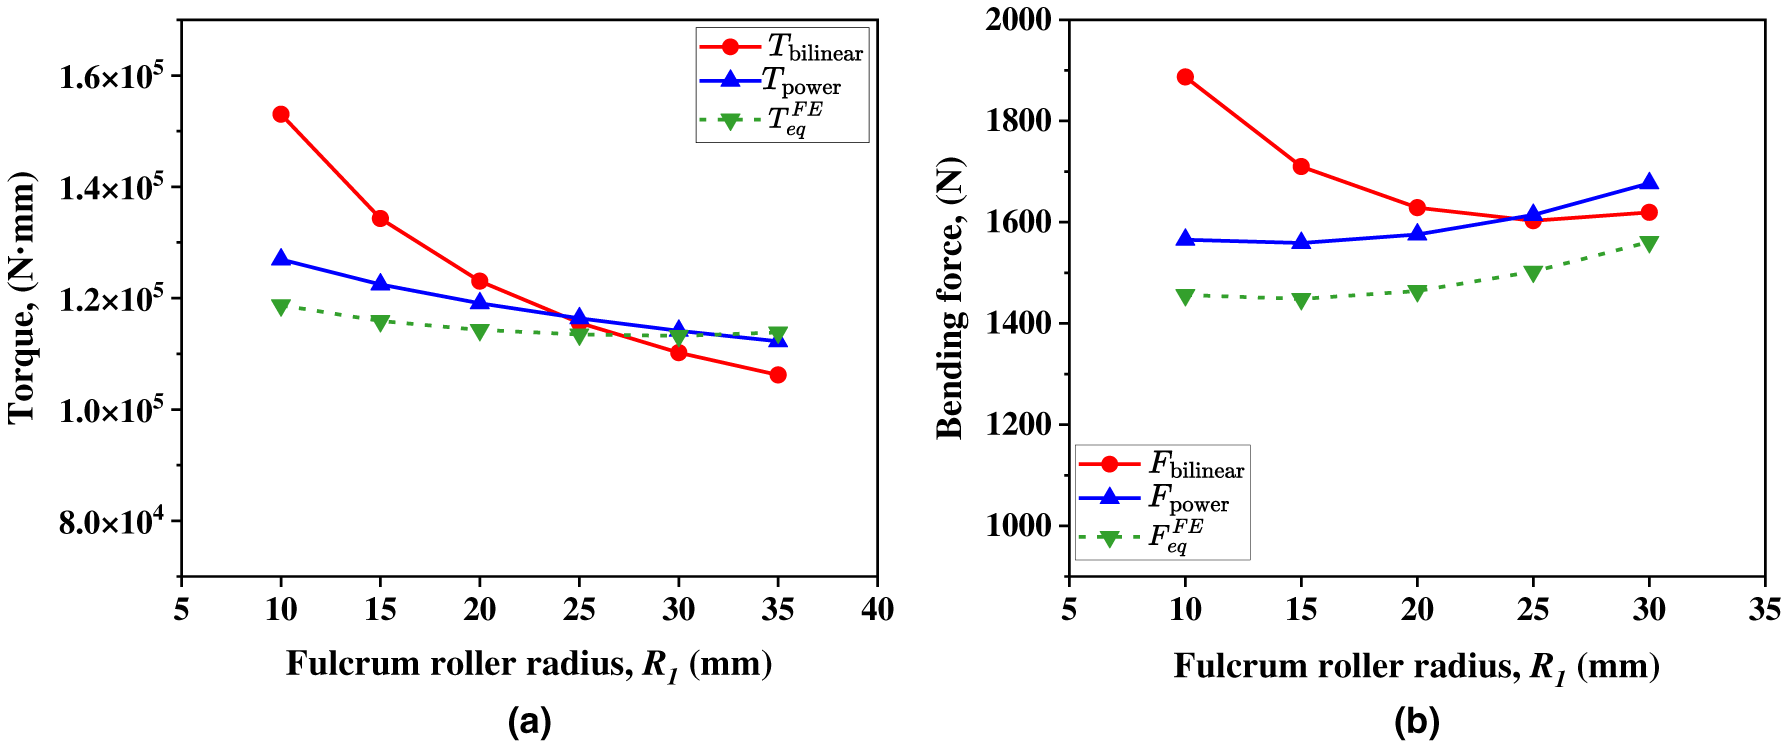
Figure 17: Influence of fulcrum roller radius
The corresponding bending force comparison is shown in Fig. 17b. In contrast to the torque response, the FE steady mean force
Mechanically, the effect is associated with both bending geometry and contact-transfer condition. A larger fulcrum roller radius changes the imposed bending geometry and modifies the external force-transfer condition. Even if the internal bending moment changes only weakly, the effective force arm may become less favorable, so that the required bending force does not necessarily decrease. From a process standpoint, the present results indicate that reducing the fulcrum roller radius lowers the bending-force demand. Previous rebar-bending studies, in which the corresponding stationary support is represented by a support shaft or fixed roller, also report lower springback angles as the associated support or bending radius decreases [5,7]. However, smaller bending radii have also been associated with more severe local deformation in bent reinforcing bars [38,39].
The force comparison further shows that the bilinear and power-law hardening formulations remain much closer to the FE results. The mean relative errors of
c. Influence of rotating bending roller radius,
Fig. 18 compares the analytical and FE estimates of shaft torque and bending force as the rotating bending roller radius varies. As shown in Fig. 18a, the analytical torque estimates remain essentially unchanged with increasing bending roller radius, while the FE steady mean torque exhibits only a slight increase over the range considered. This indicates that the torque demand is only weakly sensitive to the rotating bending roller radius. The bilinear and power-law formulations remain close to the FE steady mean torque, with mean relative errors of approximately 7.14% and 3.67%, respectively.
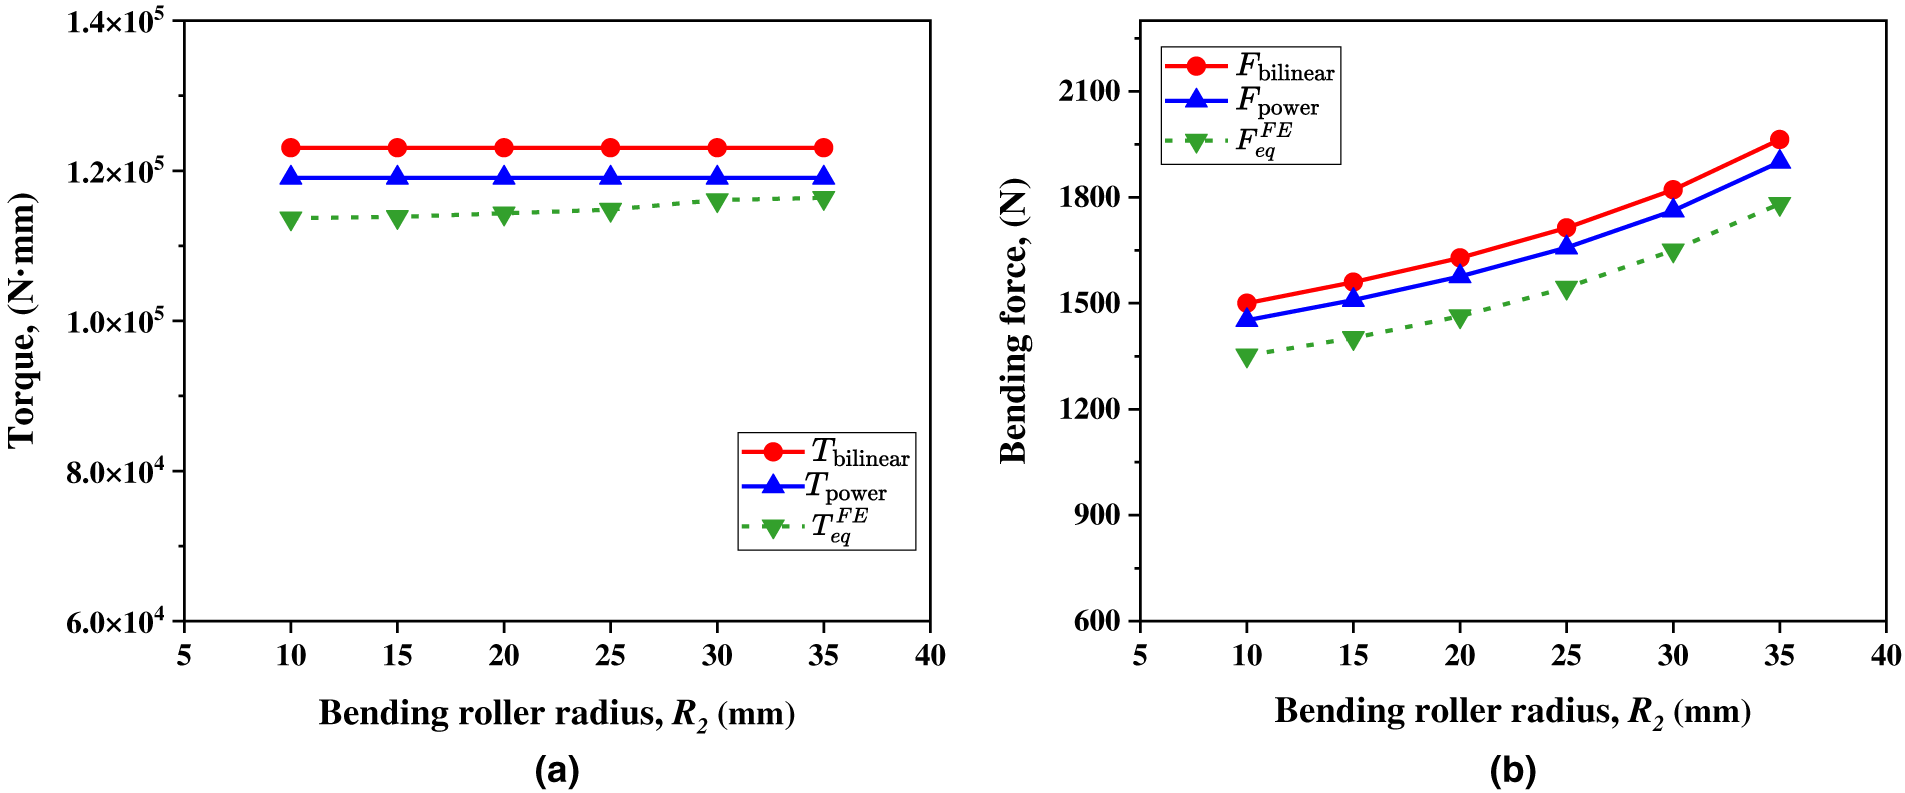
Figure 18: Influence of rotating bending roller radius
The corresponding bending force comparison is shown in Fig. 18b. The FE steady mean force
This behavior is attributable to the fact that increasing the rotating bending roller radius produces only a limited change in the position of the external force application and hence only a weak change in the effective moment arm governing force transfer. As a result, variations in the rotating bending roller radius have only a weak influence on shaft torque, but a secondary and more visible influence on bending force. This weak influence is qualitatively consistent with the observations reported in Ref. [5], where changes in rotating bending roller radius produced only minor changes in the stress distribution of the bent RB. From a practical standpoint, selecting a smaller rotating bending roller radius can therefore reduce the bending force slightly, although the reduction is limited.
The force comparison further confirms that the bilinear and power-law hardening formulations remain in good agreement with the FE results. The mean relative errors of
d. Influence of bending roller rotation radius,
Fig. 19 shows the influence of the bending roller rotation radius
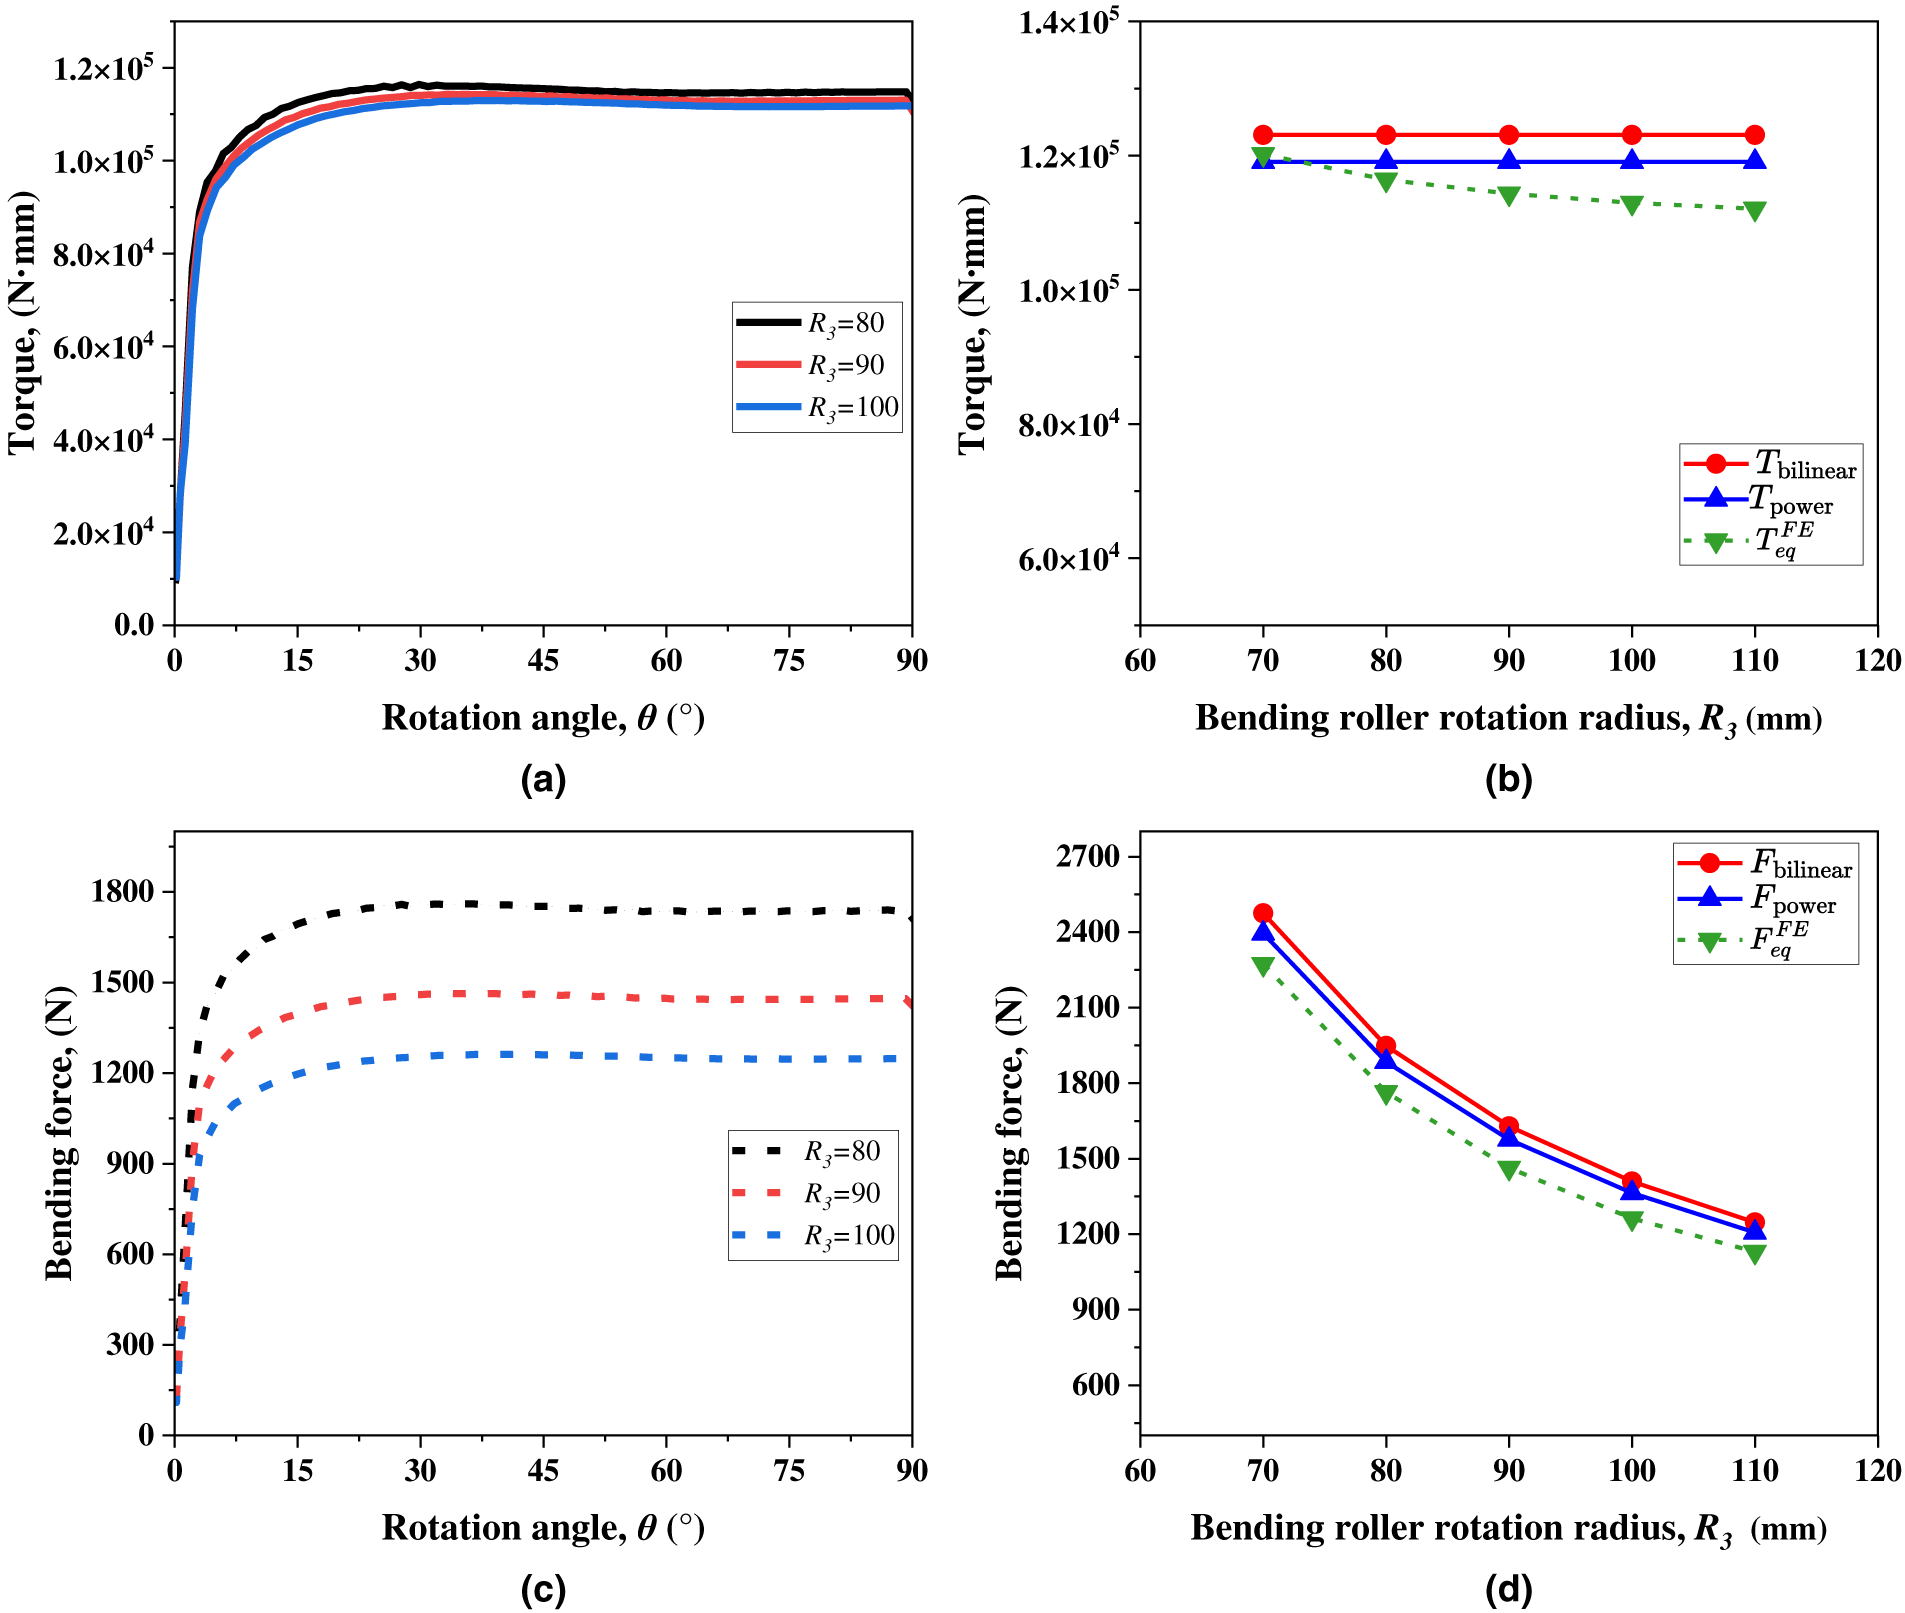
Figure 19: Influence of bending roller rotation radius
As shown in Fig. 19a,b, the torque level decreases slightly as the bending roller rotation radius increases. The FE steady mean torque exhibits only a weak downward trend over the range considered, whereas the analytical torque estimates remain essentially unchanged. Even so, the bilinear and power-law formulations remain close to the FE torque level, with mean relative errors of approximately 6.90% and 3.81%, respectively.
The corresponding force response is shown in Fig. 19c,d. In this case, both the FE and analytical results decrease clearly with increasing rotation radius
From a process standpoint, this indicates that, provided the required bending quality is maintained, increasing the rotation radius offers an effective means of lowering the bending force demand. However, a larger
The force comparison further shows that the bilinear and power-law formulations remain in good agreement with the FE results. The mean relative errors of
e. Influence of RB strength grade
Fig. 20 shows the influence of RB strength grade on process-level shaft torque and bending force. The FE torque-rotation and force-rotation responses for HRB335, HRB400, and HRB500 are presented in Fig. 20a,c, while Fig. 20b,d compares the analytical estimates with the corresponding FE steady quantities. The FE torque histories for the three grades exhibit the same general response pattern, characterized by a rapid increase during the initial bending stage followed by a nearly steady torque level. This trend is qualitatively consistent with previous observations from rebar bending tests, in which the measured torque increased during the early stage of bending and then approached an approximately constant or levelled response after yielding [9,10].
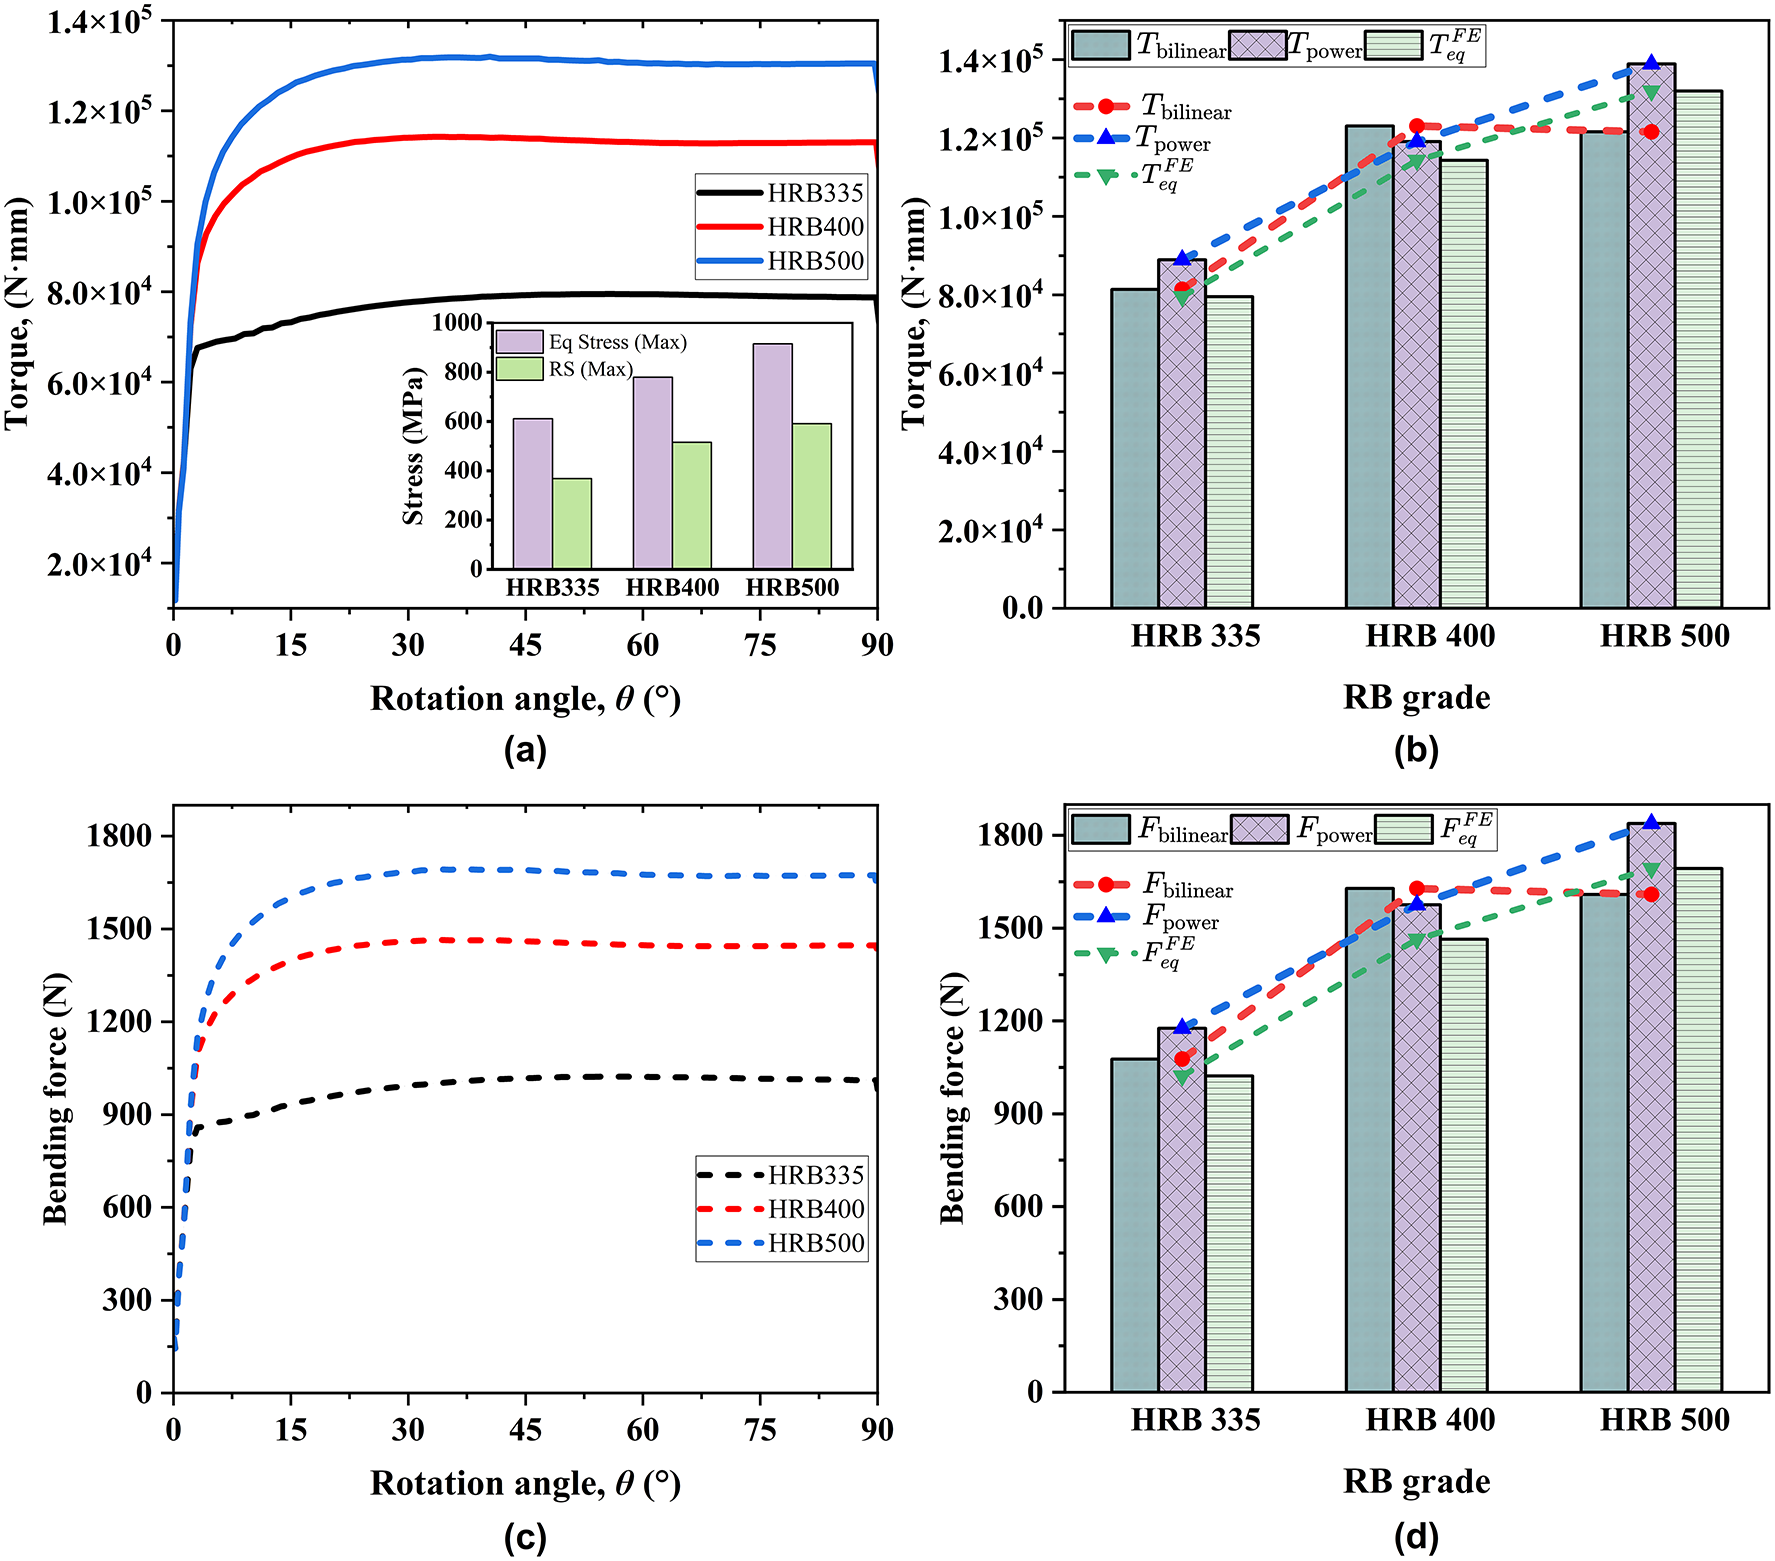
Figure 20: Influence of RB strength grade on process-level torque and bending force: (a) FE torque-rotation response
Although the response pattern is similar for the three grades, the torque level differs markedly. HRB500 requires the highest shaft torque to reach the same target bending angle, whereas HRB335 requires the lowest. As the strength grade increases from HRB335 to HRB500, the steady shaft torque increases by about 66%.
This tendency is mechanically reasonable. Compared with HRB335, HRB400 and HRB500 have higher yield and ultimate strengths and therefore provide greater resistance to plastic bending. A larger torque is consequently required to impose the same curvature. At the same time, the higher strength bars retain more elastic strain energy during loading. This is also reflected in the inset of Fig. 20a, where both the maximum equivalent stress and the maximum residual stress increase with RB grade. Thus, the higher torque demand of HRB500 is associated with a higher stress level and a stronger residual stress state after unloading.
The comparison in Fig. 20b further shows that both the analytical and FE torque levels increase with increasing RB strength grade. The power-law and bilinear hardening formulations remain close to the FE steady mean torque, with mean relative errors of approximately 5.97% and 7.10%, respectively.
The corresponding bending force response is shown in Fig. 20c,d. As with torque, the force level increases systematically with increasing RB strength grade. For a given bar diameter, the higher flow stress of HRB500 increases the sectional bending resistance and therefore leads to a larger bending-force demand than HRB400 and HRB335. The analytical results reproduce the same overall trend as the FE response. The mean relative errors of
Taken together, these results indicate that RB strength grade has a pronounced influence on both bending force and shaft torque. The increase in grade raises the sectional bending resistance, the stress level developed during bending, and the residual-stress level after unloading. Under these conditions, the hardening-based formulations remain capable of reproducing both the magnitude and the trend of the FE response with good accuracy.
f. Influence of friction coefficient
Fig. 21 shows the process-level FE torque and bending-force responses under varying friction coefficient
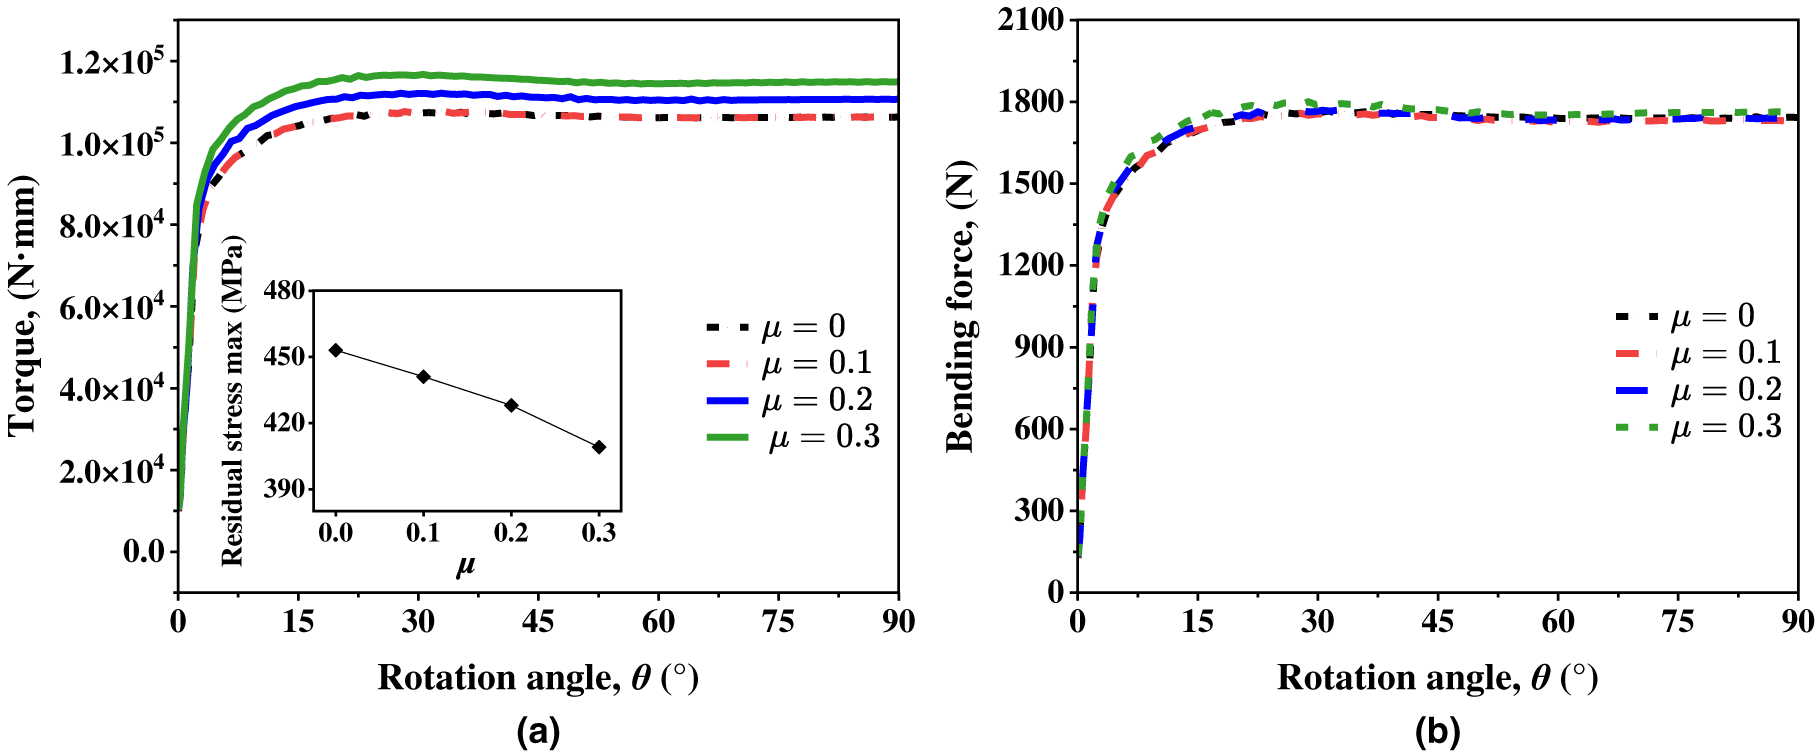
Figure 21: Influence of friction coefficient on process-level response: (a) FE torque-rotation response
As shown in Fig. 21a, increasing
A weaker sensitivity is observed in Fig. 21b for the bending force. The force curves remain close over the examined range of
The inset of Fig. 21a shows that the maximum axial residual stress after unloading decreases as friction coefficient increases. This suggests that higher-friction contact conditions alter the redistribution of plastic strain during loading and reduce the maximum axial residual stress retained after unloading. In other words, increasing the friction coefficient raises the mechanical demand of the bending process while tending to reduce the maximum axial residual stress in the bent RB.
From a process-design perspective, the reduction in maximum axial residual stress shown in Fig. 21a is consistent with previous numerical findings for rebar bending, where increasing the friction coefficient was reported to reduce the springback angle [7]. In the present results, however, this reduction is accompanied by a moderate increase in steady shaft torque and only a weak change in steady bending force. Accordingly, within the investigated range, the reduction in maximum axial residual stress at higher friction is accompanied by an increased steady shaft-torque demand.
4.3.4 Practical Implications for Steady Bending-Force and Shaft-Torque Estimation
The foregoing results show that steady bending force and steady shaft torque respond differently to material and machine parameters. RB diameter and strength grade act primarily through the sectional response and therefore increase both quantities markedly by raising the internal bending resistance of the bar. By contrast, several machine-geometry parameters affect the process primarily through the external load-transfer condition. As a result, steady shaft torque remains governed mainly by sectional bending resistance, whereas steady bending force is additionally influenced by the effective force arm and load-transfer geometry.
The relative influence of each parameter can be interpreted from the way it enters the sectional resistance and the external load-transfer path. Diameter and strength grade primarily modify the plastic bending resistance of the RB section; therefore, their effects appear simultaneously in the steady shaft torque and bending force. Increasing the RB diameter from 8 to 16 mm increased the steady shaft torque by 791.49% and the steady bending force by 864.72%. The slightly larger increase in force reflects the additional influence of the roller force-transfer geometry. In contrast, variations in
The constitutive comparison also has direct practical meaning. The bilinear and power-law formulations reproduce the FE response more closely because they retain the continued increase in bending resistance after first yield, whereas the elastic-perfectly plastic model is too simplified for a process governed by sustained plastic deformation. Across the section-level FE comparisons, process-level FE results, and external smooth round-bar torque comparisons, both hardening-based formulations provide close overall agreement; the power-law formulation generally gives the lowest errors over the examined FE parametric ranges, while the bilinear model remains a simpler and still useful approximation.
The practical application of the framework is based on the equivalent smooth-section representation adopted in the analytical and FE models. In actual ribbed RBs, transverse ribs can modify the local roller-bar contact state, introduce local stress concentrations, and produce oscillations in the torque history. This behavior is consistent with the circular-roller bending observations of Higaki et al. [10], where smooth round bars reached a nearly steady torque after the initial rise, whereas ribbed bars exhibited torque fluctuations associated with successive rib-tool interactions. The present framework therefore estimates the steady mean force and torque at the equivalent-section level, without resolving rib-induced local contact variations.
To facilitate use of the assessed analytical expressions, a self-contained browser-based calculation file was prepared as Supplementary File S1. The estimator implements the final force and torque relations and is intended for use within the parameter ranges examined in this study.
A mechanics-based analytical framework was developed for the central-axis bending of reinforcing bars (RBs). Analytical expressions were derived for the sectional bending moment and, subsequently, for the steady bending force and steady shaft torque required by the bending system. Three constitutive descriptions were considered: elastic-perfectly plastic, bilinear hardening, and power-law hardening. The analytical results were assessed against a section-level pure-bending FE model, a process-level three-dimensional FE model with tool-bar contact, and reported smooth round-bar torque measurements and FE results for torque and circular-roller-force.
The results show that material hardening must be represented for reliable estimation of RB bending demand. Across the section-level and process-level FE comparisons, the power-law formulation generally provided the closest overall agreement, followed by the bilinear hardening formulation, whereas the elastic-perfectly plastic idealization showed substantially larger errors. At the section level, the mean relative error over the examined FE parametric range remained below 1% for the power-law formulation and below 5% for the bilinear formulation, while the elastic-perfectly plastic formulation deviated by approximately 30%–35%. At the process level, the corresponding mean relative errors over the examined FE parametric ranges remained below 7.5% for torque and below 10% for force with the power-law formulation, and below 11% for torque and below 15% for force with the bilinear formulation. The external smooth round-bar comparisons showed the same trend, with the hardening-based formulations providing closer steady torque estimates for the measured cases and closer torque and force estimates for the additional FE case than the elastic-perfectly plastic formulation.
The parametric study further clarified the distinct roles of material and machine variables in central-axis RB bending. RB diameter and strength grade exerted the strongest influence on both steady bending force and steady shaft torque through their direct effect on sectional bending resistance. By contrast, machine-geometry parameters acted primarily through the load-transfer condition of the bending system. Consequently, steady shaft torque was governed predominantly by the sectional bending resistance, whereas the steady bending force depended on both the sectional resistance and the roller-system load-transfer geometry.
The process-level FE stress analysis further showed that the most severe stress state was concentrated in the curved deformation zone. During unloading, recoverable elastic strain was released, whereas retained plastic strain prevented complete stress relaxation, leaving a non-negligible residual-stress field in the bent RB.
Within the examined parameter ranges and adopted assumptions, the proposed framework provides a mechanics-based quantitative tool for estimating the steady bending-force and shaft-torque demands and for preliminary parametric design of central-axis RB bending systems across variations in RB diameter, strength grade, and machine geometry. The process-level FE analysis further characterized the sensitivity of the steady force and torque to the roller-RB friction coefficient. The applicability of the framework is bounded by the equivalent smooth-section representation, the constitutive descriptions considered, the process geometries examined, and the currently available experimental evidence, which is limited to reported smooth round-bar steady torque measurements. Future work should extend the experimental basis through paired bending-force and shaft-torque measurements, together with rib-resolved tool-bar contact modelling over broader ranges of RB diameters, rib configurations, and machine geometric parameters.
Acknowledgement: The authors acknowledge the School of Mechanical and Electronic Engineering, Wuhan University of Technology.
Funding Statement: The authors received no specific funding for this study.
Author Contributions: The authors confirm contribution to the paper as follows: Conceptualization, Hashem Al-Madwami; methodology, Hashem Al-Madwami; software, Hashem Al-Madwami, Amira Abo Kaf; validation, Hashem Al-Madwami, Amira Abo Kaf; investigation, Hashem Al-Madwami, Amira Abo Kaf; resources, Haibin Yin; data curation, Amira Abo Kaf, Hashem Al-Madwami; writing—original draft preparation, Hashem Al-Madwami; writing—review and editing, Haibin Yin, Hashem Al-Madwami; visualization, Amira Abo Kaf, Hashem Al-Madwami; supervision, Haibin Yin; project administration, Haibin Yin. All authors reviewed and approved the final version of the manuscript.
Availability of Data and Materials: All data generated or analyzed during this study are included in this published article and its Supplementary Materials.
Ethics Approval: Not applicable.
Conflicts of Interest: The authors declare no conflicts of interest.
Supplementary Materials: The supplementary material is available online at https://www.techscience.com/doi/10.32604/cmes.2026.086319/s1. Supplementary File S1: Browser-based steady-demand estimator for central-axis reinforcing-bar bending.
Nomenclature
The following nomenclature are used in this manuscript:
| Width of the RB cross-section at distance | |
| Nominal cross-sectional area of the RB, mm2 | |
| Nominal RB diameter and diameter of the equivalent circular section, mm | |
| Elastic modulus, MPa | |
| Bilinear hardening modulus, MPa | |
| Analytically estimated bending force for constitutive formulation, N | |
| Normal contact force transmitted by the rotating bending roller, N | |
| Equivalent tangential contact-resistance force, N | |
| Strength coefficient in the power-law relation, MPa | |
| Moment arm of the normal contact-force component, mm | |
| Moment arm of the equivalent tangential contact-resistance component, mm | |
| Effective load-transfer arm, mm | |
| Internal bending moment for constitutive formulation | |
| External moment generated by the contact-force components, N·mm | |
| Strain-hardening exponent in the power-law relation | |
| Radius of the equivalent circular section, | |
| Bending radius of the neutral layer, mm | |
| Fulcrum roller radius, mm | |
| Rotating bending roller radius, mm | |
| Rotation radius of the bending roller center, mm | |
| Analytically estimated shaft torque for constitutive formulation | |
| FE steady mean shaft torque, N | |
| Experimental steady mean shaft torque, N·mm | |
| FE steady mean bending force, N | |
| Distance from the neutral axis to a material point in the cross-section, mm | |
| Elastic-plastic boundary distance from the neutral axis, mm | |
| Dimensionless elastic-plastic boundary, | |
| Geometric angle associated with the rotating bending roller position, rad or deg | |
| Strain | |
| Yield strain | |
| True strain | |
| True plastic strain | |
| Normal stress, MPa | |
| Yield stress, MPa | |
| True stress, MPa | |
| Bending shaft rotation angle, deg or rad | |
| Start angle of the steady averaging interval, deg | |
| End angle of the steady averaging interval, deg | |
| Coulomb friction coefficient | |
| Abbreviations | |
| EPP | Elastic-perfectly plastic |
| RB | Reinforcing bar |
| RMSE | Root-mean-square error |
| 3D | Three-dimensional |
| FE | Finite element |
| HRB | Hot-rolled ribbed bar |
| MAE | Mean absolute error |
| MISO | Multilinear isotropic hardening |
| SFEM | Section-level finite element model |
Appendix A Identification of the Power-Law Material Parameters
The analytical power-law formulation is expressed in true-total-strain form as
where
For the curve-based datasets, the engineering stress-strain data were converted to true stress-true total strain form before fitting. The corresponding FE plasticity input was defined in true stress–true plastic strain form using
where
For HRB500 d10, the parameter-defined response was constructed using the ϕ10 reinforcement parameters reported in Ref. [35]. The reinforcement tests reported in that source followed GB/T 28900-2022 [40]. The adopted parameters were
giving
The stress predicted by the adopted parameter-defined response at
which gives
The power-law response was constrained by the yield and terminal conditions,
Accordingly,
giving
For the curve-based datasets,
where
where
References
1. Arslan E, Eraslan AN. Analytical stress analysis of partially plastic graded curved bars subjected to pure bending. Proc Appl Math Mech. 2011;11(1):189–90. doi:10.1002/pamm.201110086. [Google Scholar] [CrossRef]
2. Karyakin M, Pustovalova O, Tiutiunnikova E. Semi-analytical study of large bending strains of the inhomogeneous bar. In: Proceedings of the 2018 5th International Conference on Mathematics and Computers in Sciences and Industry (MCSI); 2018 Aug 25–27; Corfu, Greece. p. 77–80. doi:10.1109/MCSI.2018.00025. [Google Scholar] [CrossRef]
3. Arslan E, Eraslan AN. Analytical solution to the bending of a nonlinearly hardening wide curved bar. Acta Mech. 2010;210(1–2):71–84. doi:10.1007/s00707-009-0195-y. [Google Scholar] [CrossRef]
4. Yu TX, Zhang LC. Plastic bending: theory and applications. Singapore: World Scientific Publishing; 1996. doi:10.1142/2754. [Google Scholar] [CrossRef]
5. Wei J, Ren J, Zhou Z, Xie Y. Research on structural parameter optimization and springback compensation methods of a steel bar hoop bending machine. Appl Sci. 2023;13(17):9721. doi:10.3390/app13179721. [Google Scholar] [CrossRef]
6. Wei JX. Research on structural optimization and bending springback method of steel bar hoop bending machine [master’s thesis]. Handan, China: Hebei University of Engineering; 2023. (In Chinese). doi:10.27104/d.cnki.ghbjy.2023.001000. [Google Scholar] [CrossRef]
7. Choi CH, Kulinsky L, Jun JS, Kim JH. A numerical study of the spring-back phenomenon in bending with a rebar bending machine. Adv Mech Eng. 2014;6:959207. doi:10.1155/2014/959207. [Google Scholar] [CrossRef]
8. Deepu S, Vishnu RS, Harish MT, Bhavani RR. An experimental study of force involved in manual rebar bending process. IOP Conf Ser Mater Sci Eng. 2018;310(1):012050. doi:10.1088/1757-899X/310/1/012050. [Google Scholar] [CrossRef]
9. Dunston PS, Bernold LE. Adaptive control for robotic rebar bending. Comput Aided Civ Infrastruct Eng. 1994;9(1):53–60. doi:10.1111/j.1467-8667.1994.tb00361.x. [Google Scholar] [CrossRef]
10. Higaki S, Naito H, Go T, Sasada M, Tanaka T. Effect of ribs on torque in bending of rebars. Mater Res Proc. 2024;44:11–22. doi:10.21741/9781644903254-2. [Google Scholar] [CrossRef]
11. Yuan ZP. Parameter analysis and simulation studies on hoop bending machine for double reinforcing bars [master’s thesis]. Qinhuangdao, China: Yanshan University; 2016. (In Chinese). [Google Scholar]
12. Jin HR, Lu XC. Mechanism design and parameters calculation of profiling hoop bending machine for 5/12 reinforcing bars. Mach Des Manuf. 2012;(12):203–4. (In Chinese). doi:10.3969/j.issn.1001-3997.2012.12.072. [Google Scholar] [CrossRef]
13. Baragetti S. A theoretical study on nonlinear bending of wires. Meccanica. 2006;41(4):443–58. doi:10.1007/s11012-006-0002-y. [Google Scholar] [CrossRef]
14. Zhang Z, Wu J, Xu X, Yang Z, Wu W, Liu L. Mechanical modeling of tube bending considering elastoplastic evolution of tube cross-section. Materials. 2022;15(11):3997. doi:10.3390/ma15113997. [Google Scholar] [CrossRef]
15. Al-Qureshi HA. Elastic-plastic analysis of tube bending. Int J Mach Tools Manuf. 1999;39(1):87–104. doi:10.1016/S0890-6955(98)00012-1. [Google Scholar] [CrossRef]
16. Juhas P. Elastic-plastic load-carrying capacity of steel members. MATEC Web Conf. 2018;146:02001. doi:10.1051/matecconf/201814602001. [Google Scholar] [CrossRef]
17. Hawileh R, Rahman A, Tabatabai H. A non-linear 3D FEM to simulate un-bonded steel reinforcement bars under axial and bending loads. Engineering. 2009;1(2):75–90. doi:10.4236/eng.2009.12009. [Google Scholar] [CrossRef]
18. Grigusevičius A, Blaževičius G. A distributed plasticity approach for steel frames analysis including strain hardening effects. Period Polytech Civ Eng. 2019;63(2):401–13. doi:10.3311/ppci.13270. [Google Scholar] [CrossRef]
19. Kobelev V. Elastic-plastic work-hardening deformation under combined bending and torsion and residual stresses in helical springs. Int J Mater Form. 2010;3(Suppl 1):869–81. doi:10.1007/s12289-010-0908-8. [Google Scholar] [CrossRef]
20. Kim KW, Kim MK, Cho WY. An analytical model of roll bending steel pipe formed by three rollers. Int J Adv Manuf Technol. 2019;104(9–12):4039–48. doi:10.1007/s00170-019-04183-2. [Google Scholar] [CrossRef]
21. Salem J, Champliaud H, Feng Z, Dao TM. Experimental analysis of an asymmetrical three-roll bending process. Int J Adv Manuf Technol. 2016;83(9–12):1823–33. doi:10.1007/s00170-015-7678-x. [Google Scholar] [CrossRef]
22. Gavrilescu I, Boazu D, Stan F. Estimating of bending force and curvature of the bending plate in a three-roller bending system using finite element simulation and analytical modeling. Materials. 2021;14(5):1204. doi:10.3390/ma14051204. [Google Scholar] [CrossRef]
23. Boazu D, Gavrilescu I, Stan F. Analytical and finite element analysis of the rolling force for the three-roller cylindrical bending process. Materials. 2024;17(21):5230. doi:10.3390/ma17215230. [Google Scholar] [CrossRef]
24. Doungmarda K, Thipprakmas S. A new bending force formula for the V-die bending process. Metals. 2023;13(3):587. doi:10.3390/met13030587. [Google Scholar] [CrossRef]
25. Novotný L. Finite element simulation of bending of steel bar including plasticity. Appl Mech Mater. 2015;816:182–7. doi:10.4028/www.scientific.net/amm.816.182. [Google Scholar] [CrossRef]
26. Higaki S, Matsukuma I, Go T, Sasada M, Tanaka T. Study on the hardness of curved rebar by a simple bending machine. Harris Sci Rev Doshisha Univ. 2024;65(2):95–102. doi:10.14988/0002000619. [Google Scholar] [CrossRef]
27. Higaki S, Go T, Mizuno K, Sasada M, Tanaka T. Effect of diameter of fulcrum roller on shape of rebar in bending. In: Mocellin K, Bouchard PO, Bigot R, Balan T, editors. Proceedings of the 14th International Conference on the Technology of Plasticity—Current Trends in the Technology of Plasticity; 2023 Sep 24–29; Mandelieu-La Napoule, France. p. 404–13. doi:10.1007/978-3-031-42093-1_39. [Google Scholar] [CrossRef]
28. Higaki S, Nishida H, Koike Y, Sasada M, Tanaka T. Effect of transverse ribs on axial displacement of rebars in bending. Procedia Manuf. 2020;50:253–6. doi:10.1016/j.promfg.2020.08.047. [Google Scholar] [CrossRef]
29. Jiang Y, Cheng X, Li H, Ren X, Li Y. Structural design of steel bar bending machine. J Phys Conf Ser. 2021;1986(1):012097. doi:10.1088/1742-6596/1986/1/012097. [Google Scholar] [CrossRef]
30. El Megharbel A, El Nasser GA, El Domiaty A. Bending of tube and section made of strain-hardening materials. J Mater Process Technol. 2008;203(1–3):372–80. doi:10.1016/j.jmatprotec.2007.10.078. [Google Scholar] [CrossRef]
31. El-Galy I, Ahmed MH, Essa A. Modeling and validation of residual stresses in tube bending of strain-hardening materials. J Eng Appl Sci. 2018;65(3):223–42. [Google Scholar]
32. Ma L, Ma H, Liu Z, Chen S. Theoretical analysis of five-point bending and springback for preforming process of ERW pipe FFX forming. Math Probl Eng. 2019;2019(1):1703739. doi:10.1155/2019/1703739. [Google Scholar] [CrossRef]
33. Li Y, Huang L, Wang R, Yan L, Ba P, Liu C. Bonding failure mechanism of corroded concrete beams under different anchored types: experimental study. Case Stud Constr Mater. 2025;22:e04814. doi:10.1016/j.cscm.2025.e04814. [Google Scholar] [CrossRef]
34. Luo X, Zhang S, Li A, Zhang C, Zhang Y. Reinforcement effects on tensile behavior of ultra-high-performance concrete (UHPC) with low steel fiber volume fractions. Materials. 2024;17(10):2418. doi:10.3390/ma17102418. [Google Scholar] [CrossRef]
35. Liu M, Gao G, Jiang D. Experimental and numerical simulation research on penetration resistance of prestressed reinforced concrete structure. At Energy Sci Technol. 2024;58(S):75–86. (In Chinese). [Google Scholar]
36. Higaki S. Study on springback and inside bend diameter in the bending process of rebars [dissertation]. Kyoto, Japan: Doshisha University; 2025. (In Japanese). doi:10.14988/0002001056. [Google Scholar] [CrossRef]
37. Higaki S, Matsukuma I, Go T, Sasada M, Tanaka T. Study on springback prediction method in rebar bending. J Jpn Soc Des Eng. 2024;60(2):81–96. doi:10.14953/jjsde.2024.3023. [Google Scholar] [CrossRef]
38. Miyagawa T. Fracture of reinforcing steels in concrete damaged by ASR. Constr Build Mater. 2013;39:105–12. doi:10.1016/j.conbuildmat.2012.05.015. [Google Scholar] [CrossRef]
39. Zheng YL, Sun YT, Lin HR, Wang JQ, Liu X, Lu CH. Experimental study of initial damage to steel bars due to bending process and the resulting performance deterioration. Constr Build Mater. 2024;411:134326. doi:10.1016/j.conbuildmat.2023.134326. [Google Scholar] [CrossRef]
40. GB/T 28900-2022. Test methods of steel for reinforcement of concrete. Beijing, China: State Administration for Market Regulation, Standardization Administration of China; 2022. (In Chinese). [Google Scholar]
Cite This Article
 Copyright © 2026 The Author(s). Published by Tech Science Press.
This work is licensed under a Creative Commons Attribution 4.0 International License , which permits unrestricted use, distribution, and reproduction in any medium, provided the original work is properly cited.
 Downloads
 Citation Tools
