
 Login
Login Register
 Submit a Paper
 Propose a Special lssue
 Open Access
ARTICLE
Effect of Cyclic Loading Frequency on Liquefaction Behavior of Granular Materials: Insights from Discrete Element Simulations
1 College of Civil Engineering and Architecture, Zhejiang University, Hangzhou, China
2 Future City Laboratory, Innovation Center of Yangtze River Delta, Zhejiang University, Jiaxing, China
3 Department of Civil and Smart Cities, Shantou University, Shantou, China
4 Power China Huadong Engineering Co., Ltd., Hangzhou, China
* Corresponding Author: Yan-Bin Shen. Email:
Computer Modeling in Engineering & Sciences 2026, 148(3), 9 https://doi.org/10.32604/cmes.2026.086395
Received 29 May 2026; Accepted 07 September 2026; Issue published 28 September 2026
 View Full Text
 Download PDF
Abstract
In this study, the two-dimensional discrete element method (DEM) was employed to investigate how the frequency of cyclic loading affects the liquefaction behavior of granular materials. A stress-controlled undrained cyclic biaxial loading method was implemented, and a series of numerical simulations were carried out across a wide range of loading frequencies. The simulation results reveal that cyclic loading frequency has negligible influence on the material’s behavior prior to liquefaction. However, it delays the development of excess pore water pressure and axial strain during and after liquefaction, a phenomenon referred to as the “delay effect”. This delay effect further contributes to an increase in the liquefaction resistance and alters the stress-strain curve and stress path after liquefaction. To interpret these macroscopic observations, the evolution of the internal microstructure was quantitatively characterized in terms of fabric anisotropy and the mechanical coordination number. The findings indicate that the delay in macroscopic behavior is closely associated with the slower evolution of the microstructure under higher loading frequencies. The underlying mechanism can be attributed to particle inertia: as the cyclic loading frequency increases, particle inertial forces progressively participate in load bearing and enhance orthogonal confinement within the granular skeleton. This reduces the driving force for contact structure disintegration and slows down the microstructural adjustment. Overall, this study provides insight into the micromechanical mechanisms that govern the effect of cyclic loading frequency on the liquefaction behavior of granular materials.Keywords
Soil liquefaction has attracted considerable interest from both researchers and engineers in the field of geotechnical engineering over the past few decades [1–4]. Liquefaction leads to the loss of soil strength and stiffness, which may cause significant damages to civil infrastructure and even endanger the lives of the people [5–8]. There are mainly two types of factors that could influence the liquefaction behavior: one is by affecting the physical and mechanical properties of the sand itself, such as soil density, confining stress, fines content, etc. [9–11]; the other is by influencing the external loads, such as the frequency, magnitude, and direction of the external loads [12–14].
The cyclic loading frequency affects the rate at which the soil is loaded and has been proven to have a non-negligible influence on the liquefaction behavior of the sand. Earlier researchers identified discrepancies in the liquefaction behavior of sand when subjected to different cyclic loading frequencies [15]. Continued studies have further shown that the development of excess pore water pressure (i.e., EPWP) and axial strain slows down as the cyclic loading frequency increases, and thus the high cyclic loading frequency is believed to have a beneficial contribution to liquefaction resistance [16–18]. However, there are also a few researchers observed contrary phenomena that high-frequency loading rather accelerates the liquefaction behavior [19]. After compiling and summarizing the previous literature, Zhu et al. [13] conducted more comprehensive laboratory studies. The stress-controlled cyclic triaxial tests on poorly graded Hostun 31 sand covering the cyclic loading frequency from 0.02 to 0.6 Hz were performed, and the results showed that more loading cycles are required to trigger liquefaction or achieve specified axial strain (i.e., 3%) when the cyclic loading frequency is high. More recently, Yue et al. [20] and Xu et al. [21] found that the dilatancy of sand would be affected by cyclic loading frequency, and high-frequency loading tends to suppress the dilative tendency, which further alters the liquefaction modes of the sand from “cyclic mobility” for low-frequency loading to “cyclic instability” for high-frequency loading.
However, due to the limitations of the equipment, the above laboratory experiments are mostly performed at low cyclic loading frequencies, usually only a few Hz. Therefore, the conventional laboratory experiments could not completely cover the frequency range of actual earthquake loading, which could be up to 10 Hz [22], let alone study the liquefaction behavior at higher cyclic loading frequencies. For example, in the centrifuge shaking table tests, it is often necessary to increase the cyclic loading frequency to tens of times the actual earthquake frequency in order to satisfy the scaling law [23–25], and with further improvements in the ability of centrifuge shaking table equipment, the cyclic loading frequency could even exceed 100 Hz [26].
In addition to the above factors, most of the above-mentioned conclusions related to the effect of cyclic loading frequency on the liquefaction behavior were based on laboratory experiments, and few studies were conducted from the micromechanical perspective, which leaves the micromechanical mechanism unclear. Further, the limited understanding of micromechanical mechanisms has, to some extent, contributed to the lack of consensus on the effect of cyclic loading frequency on liquefaction behavior [18]. In recent years, DEM (Discrete Element Method) proposed by Cundall and Strack [27] has enabled direct observation of grain-scale and fabric-scale features in granular materials, and has proven to be an effective tool for exploring the mechanisms underlying the macroscopic phenomena [28–30]. For example, DEM studies have revealed that the coupled evolution of contact fabric and coordination number governs the transition from stability to liquefaction [31,32], and that asynchronous changes in particle orientation and contact-normal anisotropies directly trigger strain localization [33].
In this research, a series of stress-controlled undrained cyclic biaxial tests with a wide range of cyclic loading frequencies were simulated with DEM, which approximately cover the cyclic loading frequencies of actual earthquakes and centrifuge shaking table tests. The influence of cyclic loading frequency on the liquefaction behavior of granular materials is investigated, and the evolution of microstructures is further examined to explore the underlying micromechanical mechanism.
2.1 DEM Sample and Contact Models
The PFC2D (Particle Flow Code in 2 Dimensions) was used in this study [34]. The sample (Fig. 1a) is a rectangular packing (60 mm × 60 mm), which consists of 3602 circular particles with diameters ranging from 0.8 to 1.2 mm. Fig. 1b presents the grain size distribution curve, and the mean particle size D50 = 1.00 mm, uniformity coefficient CU = 1.25. According to the method proposed by Yang et al. [35], the maximum and minimum void ratio (i.e., emax and emin) are 0.2594 and 0.1931, respectively, where the emax is estimated by generating samples with a friction coefficient μ = 0.5, and the emin is obtained with μ = 0, both under a reference confining pressure of 10 kPa.
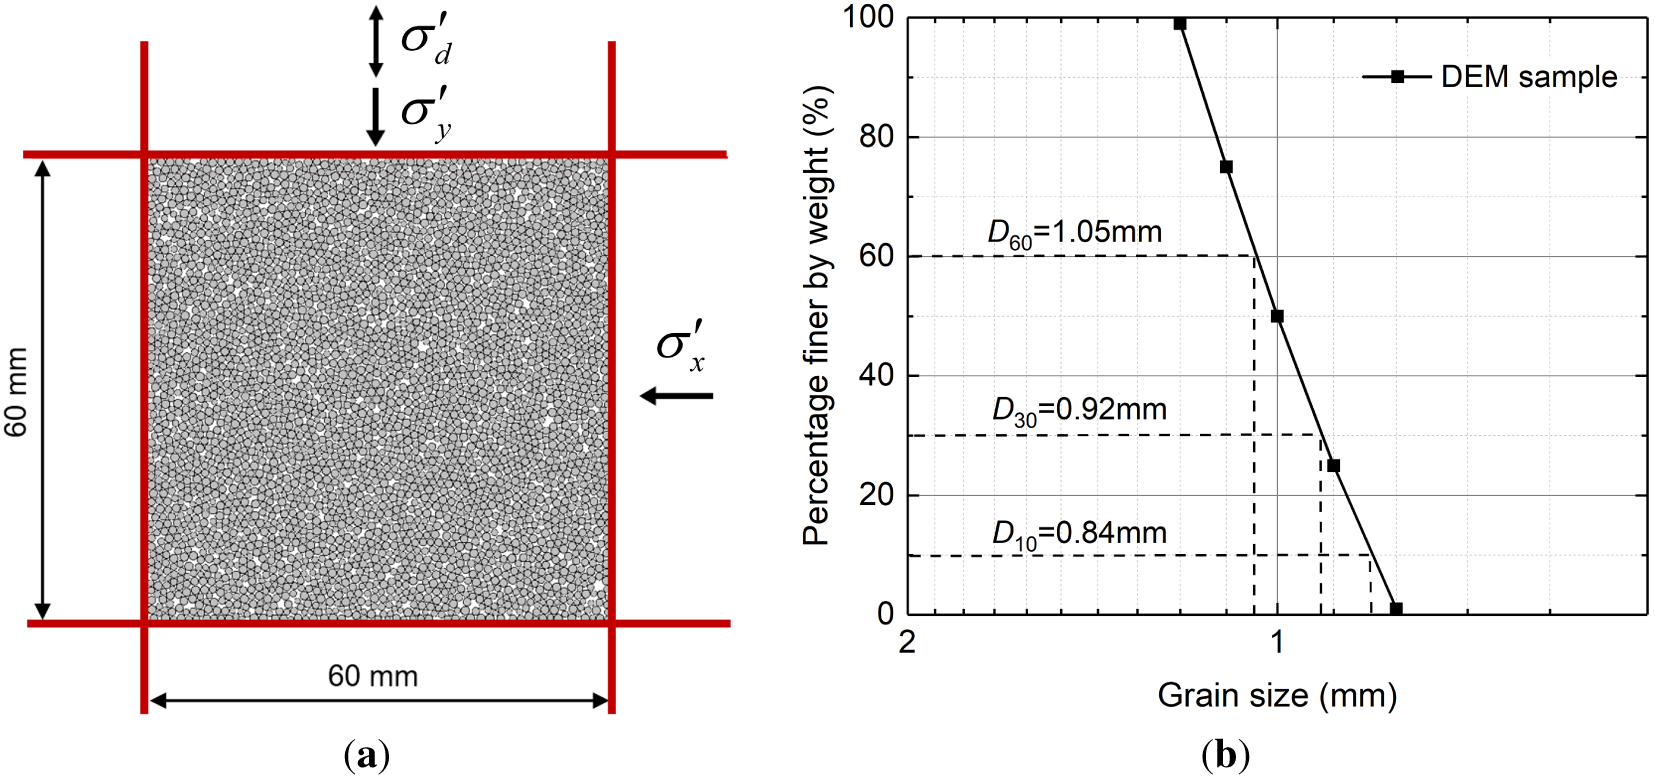
Figure 1: The DEM sample (a) the configuration, and (b) the grain size distribution curve.
Plenty of contact models are applicable for simulating the cyclic behavior of granular materials, with the Hertz-Mindlin contact model being the most widely used [36]. In recent years, scholars have further proposed some modified Hertz-Mindlin contact models to incorporate the effects of particle surface roughness, particle shape, contact stiffness degradation, and other factors, thereby improving the quantitative accuracy of the simulations [37–39]. Since this study primarily focuses on qualitative mechanistic investigation, the original Hertz-Mindlin contact model is considered appropriate for the requirements and has been adopted accordingly.
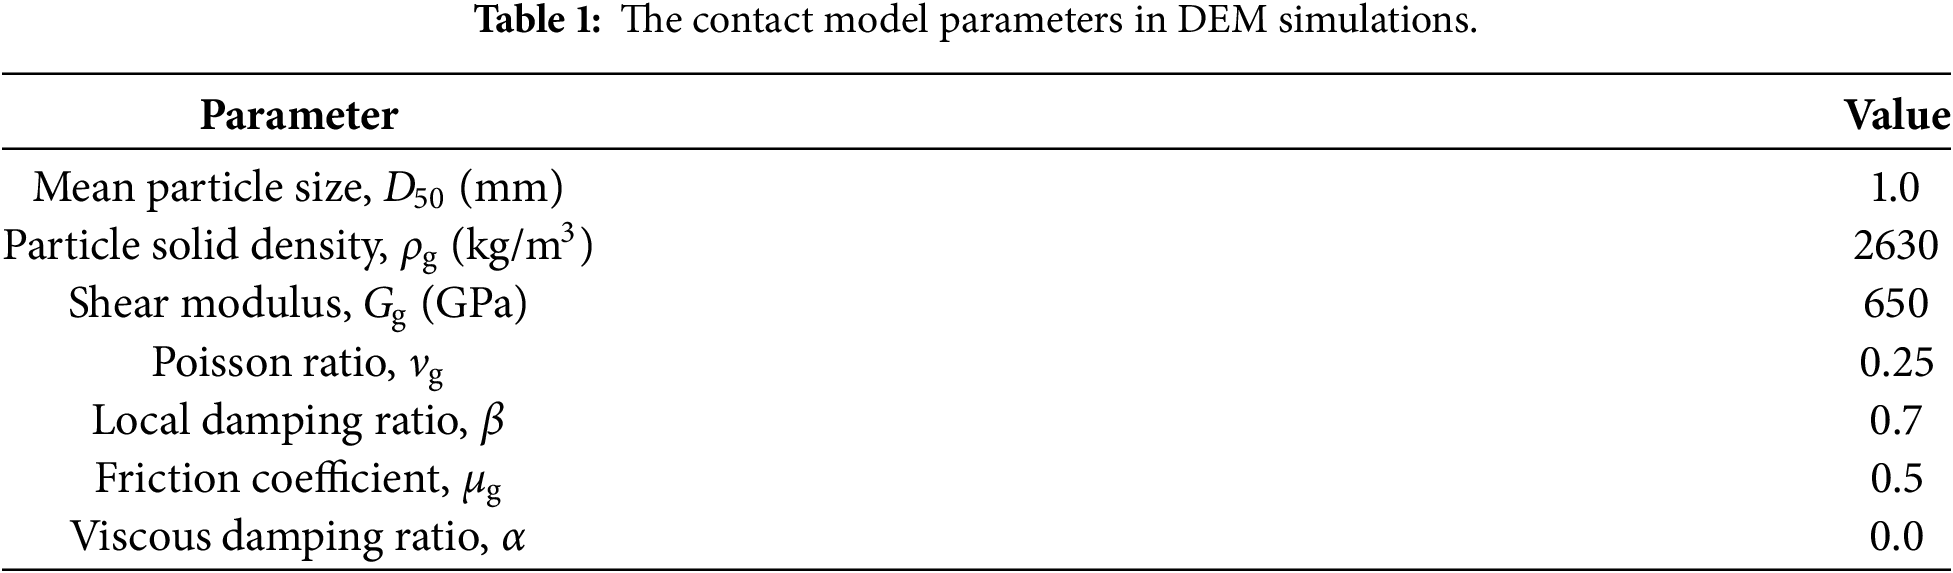
The contact model parameters, as listed in Table 1, were determined through laboratory experiments that incorporated spectral-induced polarization (SIP) and bender element (BE) techniques. The detailed calibration process can be referred to in Bate et al. [40] and Sun et al. [41]. The research by Zhou et al. [42] further indicates that this set of contact model parameters is suitable for simulating the cyclic behavior of granular materials. It effectively captures “cyclic mobility” in medium-dense to dense sand and “flow liquefaction” in loose sand. The parameters also reproduce the small-strain stiffness and liquefaction resistance across different densities. These findings suggest that, given the qualitative micromechanical focus of this work, the parameter set meets the basic requirements.
2.2 Sample Generation and Loading Method
The assembly is prepared randomly distributed over the two-dimensional space, and then isotropically consolidated under 100 kPa mean effective confining stress σ′m (=(σ′x + σ′y)/2). For this study, a medium dense sample with void ratio e = 0.2278 (i.e., relative density Dr ≈ 48%) after consolidation is selected. This relative density is loose enough to liquefy under cyclic loading, but not so loose that post-liquefaction deformation becomes too rapid to resolve frequency-dependent effects on the post-liquefaction response. This relative density is also commonly encountered in natural alluvial sand deposits, enhancing the practical relevance of the results.
Stress-controlled undrained cyclic biaxial tests are conducted on the DEM samples. In the stress-controlled undrained cyclic tests, the samples should satisfy two conditions: (1) The undrained condition, i.e., the constant area for 2D samples or the constant volume for 3D samples; (2) The time history of deviatoric stress q (=σ′y − σ′x) follows a prescribed sinusoidal relationship, which is commonly used to represent earthquake loading:
where f is the cyclic loading frequency; qc is the amplitude of the cyclic deviatoric stress, which is defined as qc = σ′d. Here, σ′d refers to the single amplitude of the cyclic vertical stress in biaxial tests, as shown in Fig. 1a, and the value of σ′d was set to 42 kPa in this study.
In the 2D DEM, the sample area is defined by four walls that constrain the particles. To maintain a constant area, the wall velocities should satisfy:
where Vx is the velocity of the side walls, and Vy is the velocity of the end walls; H and D are the current height and width of the sample, respectively. Fig. 2 gives the corresponding schematic diagram. The relationship between the effective stresses and wall velocities can be expressed as [34]:
where σ′x0 and σ′y0 are the effective horizontal and vertical stresses before the movement of the walls, and σ′x1 and σ′y1 are the effective stresses after the movement. These stresses are obtained by monitoring the forces acting on the walls and then dividing by the corresponding lengths (i.e., σ′x = Fx/H for the side walls and σ′y = Fy/D for the end walls). The Gx and Gy are the “gain” parameters, and they are defined as [34]:
where Ncx and Ncy are half of the number of contacts on the side and end walls; The
where q1 (=σ′y1 − σ′x1) is the deviatoric stress after the wall movement, and q0 (=σ′y0 − σ′x0) is that before the movement. Since the time histories of deviatoric stress are predetermined, q1 and q0 could be determined directly at any time. Finally, combining Eqs. (2) and (5) yields the wall velocities (Eq. (6)), which enable the sample to satisfy both the undrained condition and the specified deviatoric stress condition:
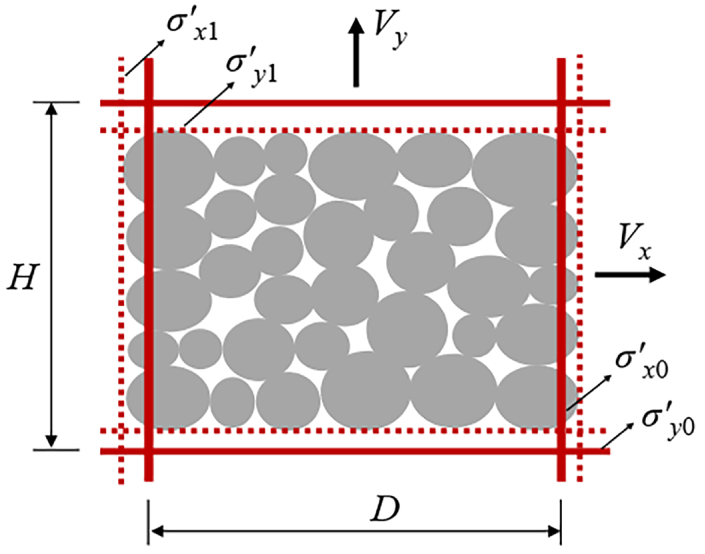
Figure 2: Schematic diagram of the stress-controlled loading method.
Fig. 3a,b demonstrates the performance of this loading method, and it can be seen that the volumetric strain εv (=εx + εy) remains zero throughout the test, and the applied deviatoric stress strictly follows the prescribed sinusoidal relationship. Fig. 3c–f further presents the simulated cyclic undrained behavior, which well reproduces typical “cyclic mobility” features, including an S-shaped stress-strain curve and a butterfly-shaped stress path [43–45], etc. These observations confirm the robustness and validity of the DEM setup in this study.
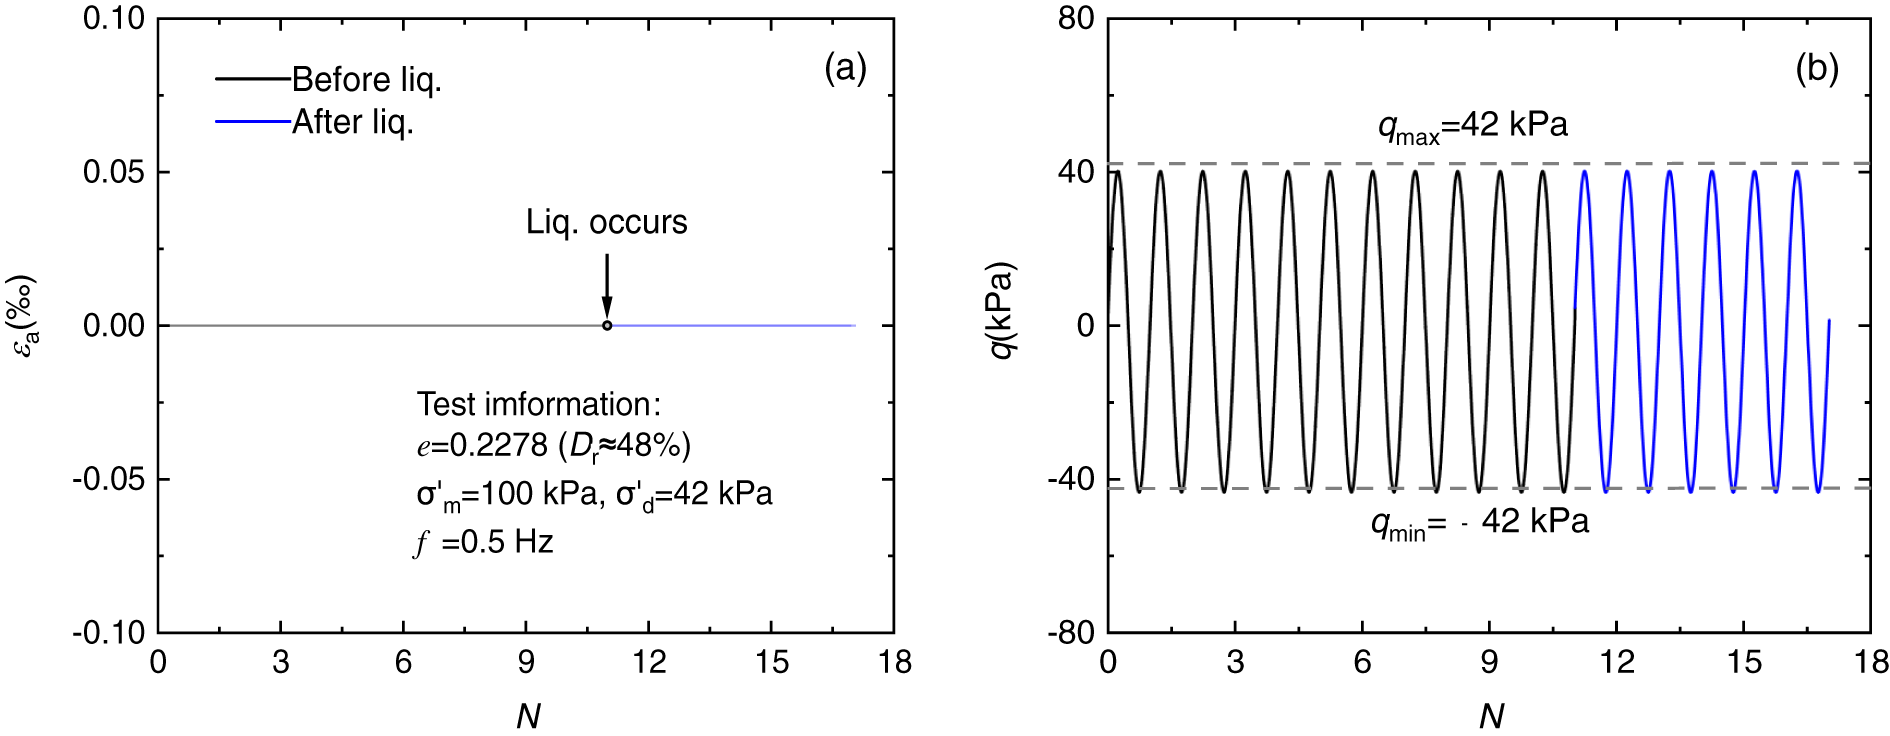
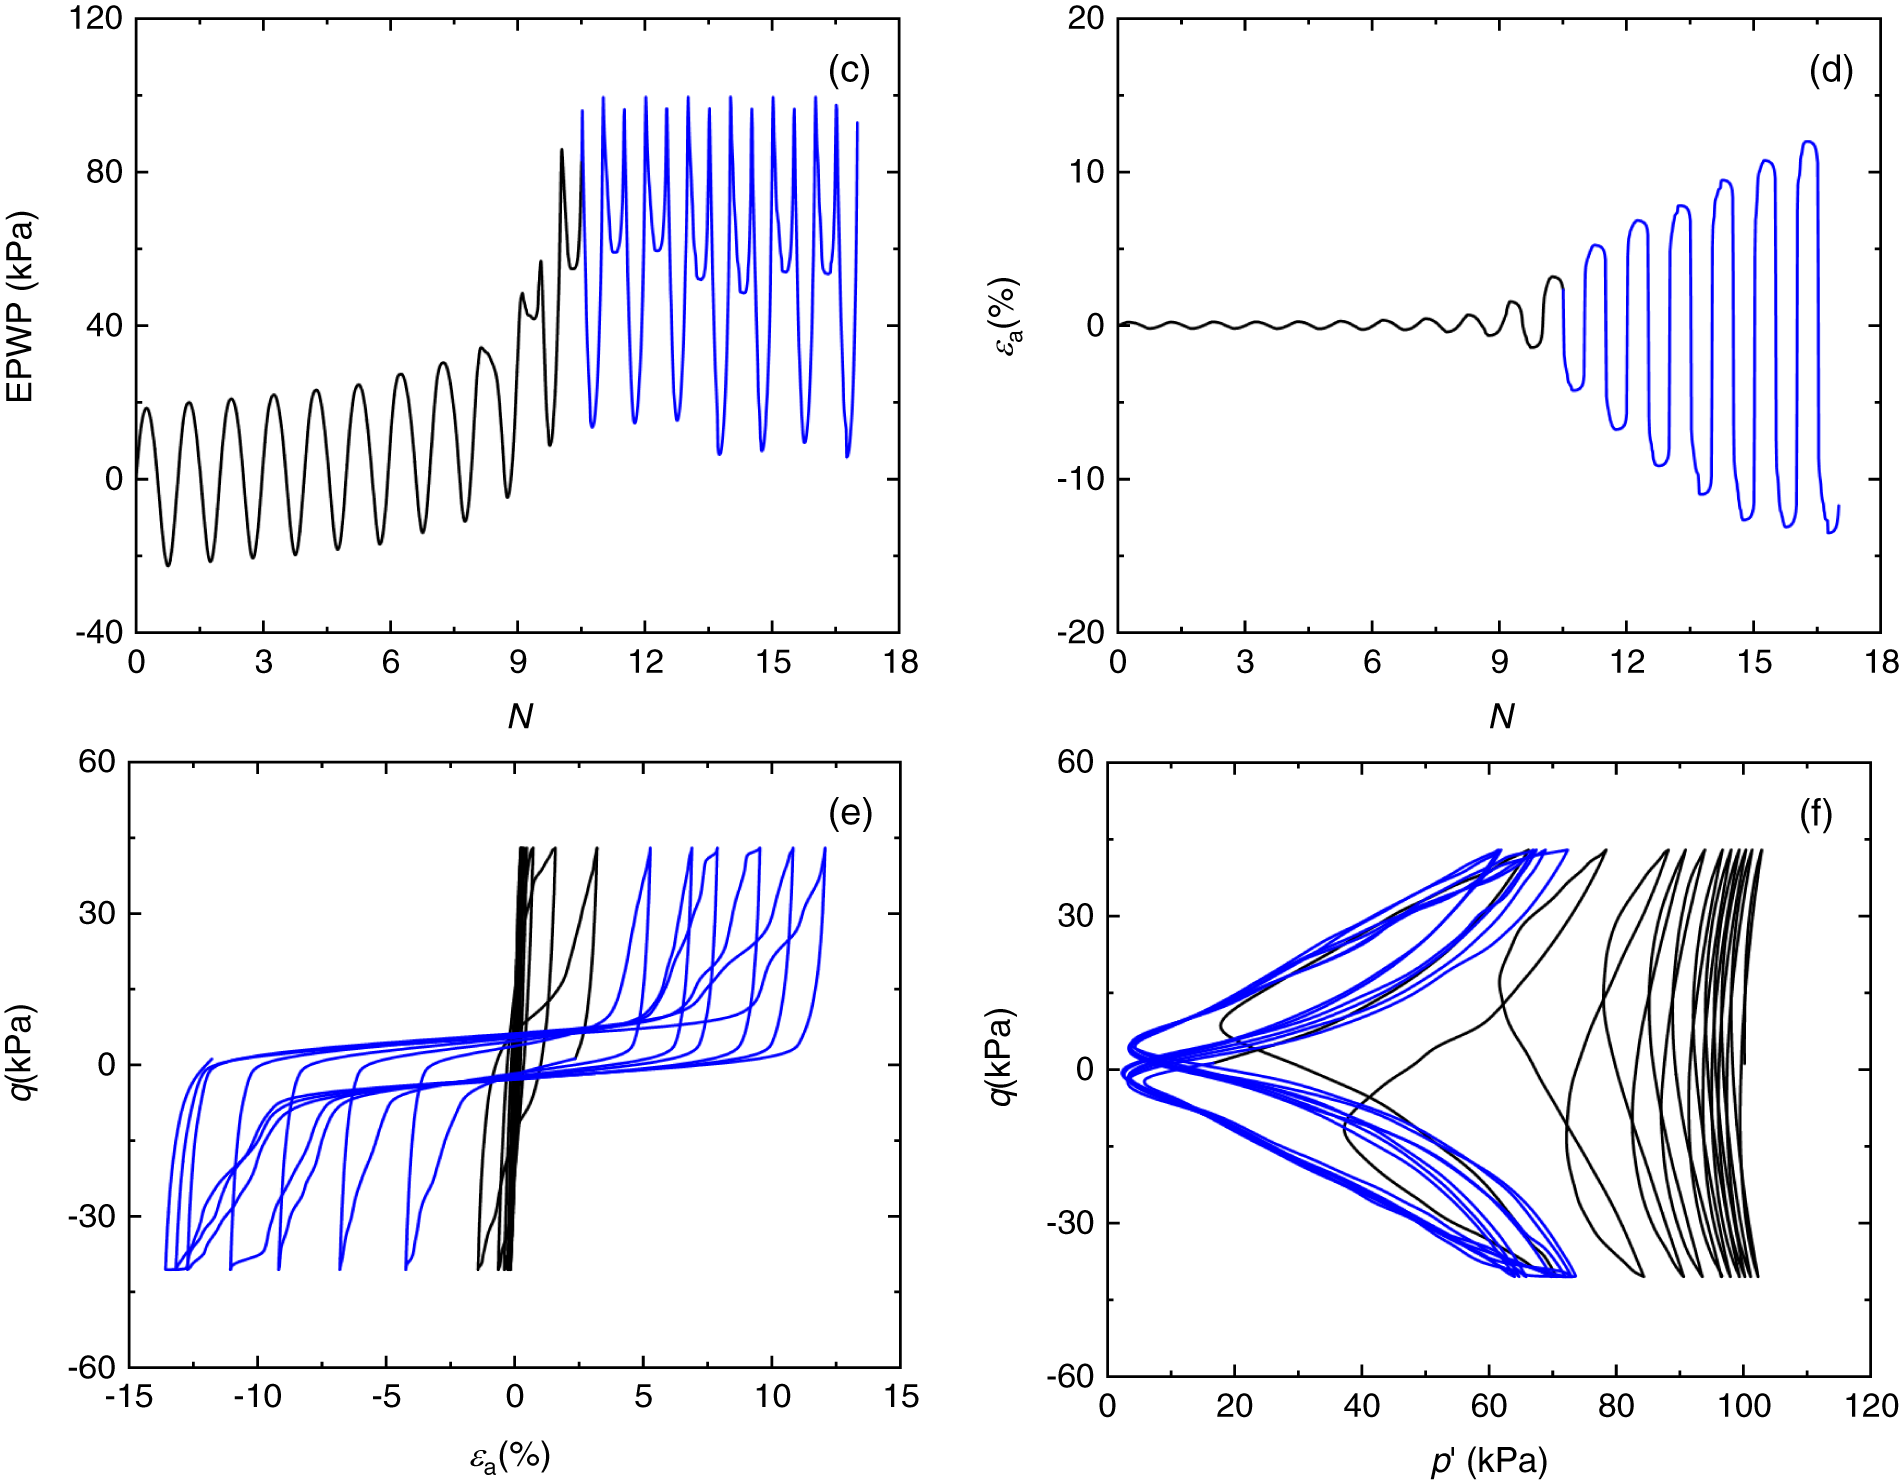
Figure 3: The simulated “cyclic mobility” behavior: (a) volumetric strain εv, (b) deviatoric stress q, (c) excess pore water pressure EPWP, (d) axial strain εa, (e) stress-strain curve, and (f) stress path.
The undrained stress-controlled cyclic biaxial tests with identical void ratio but five different cyclic loading frequencies (i.e., f = 0.5, 2, 8, 32, 128 Hz) were simulated to investigate the effect of cyclic loading frequency on the liquefaction behavior of the granular materials. The selection of these frequencies follows the rationale discussed in the Introduction, covering the range from typical earthquake loading to high-frequency centrifuge testing conditions.
3.1 Excess Pore Water Pressure
Fig. 4a shows the development of excess pore water pressure (i.e., EPWP) under different cyclic loading frequencies. Here, the value of EPWP for the sample is regarded as equivalent to the reduced amplitude of horizontal stress (Eq. (7)) [46], which could be obtained by monitoring the stress σ′x of the side walls (Fig. 2). σ′xc denotes the horizontal stress after consolidation. The EPWP increases gradually during the early stages of loading, and there is negligible difference in EPWP response under different f before liquefaction. As liquefaction approaches, differences in the EPWP response become evident gradually. The sample subjected to high-frequency loading shows a slower increase in EPWP during liquefaction, and exhibits a more significant reduction in the fluctuation amplitude of EPWP after liquefaction. Here, the fluctuation amplitude is defined as the difference between the maximum and minimum values of EPWP within each cycle. A similar phenomenon was also observed in laboratory experiments of saturated sands [21]. This consistency also provides confidence in the reliability of the present DEM simulations.
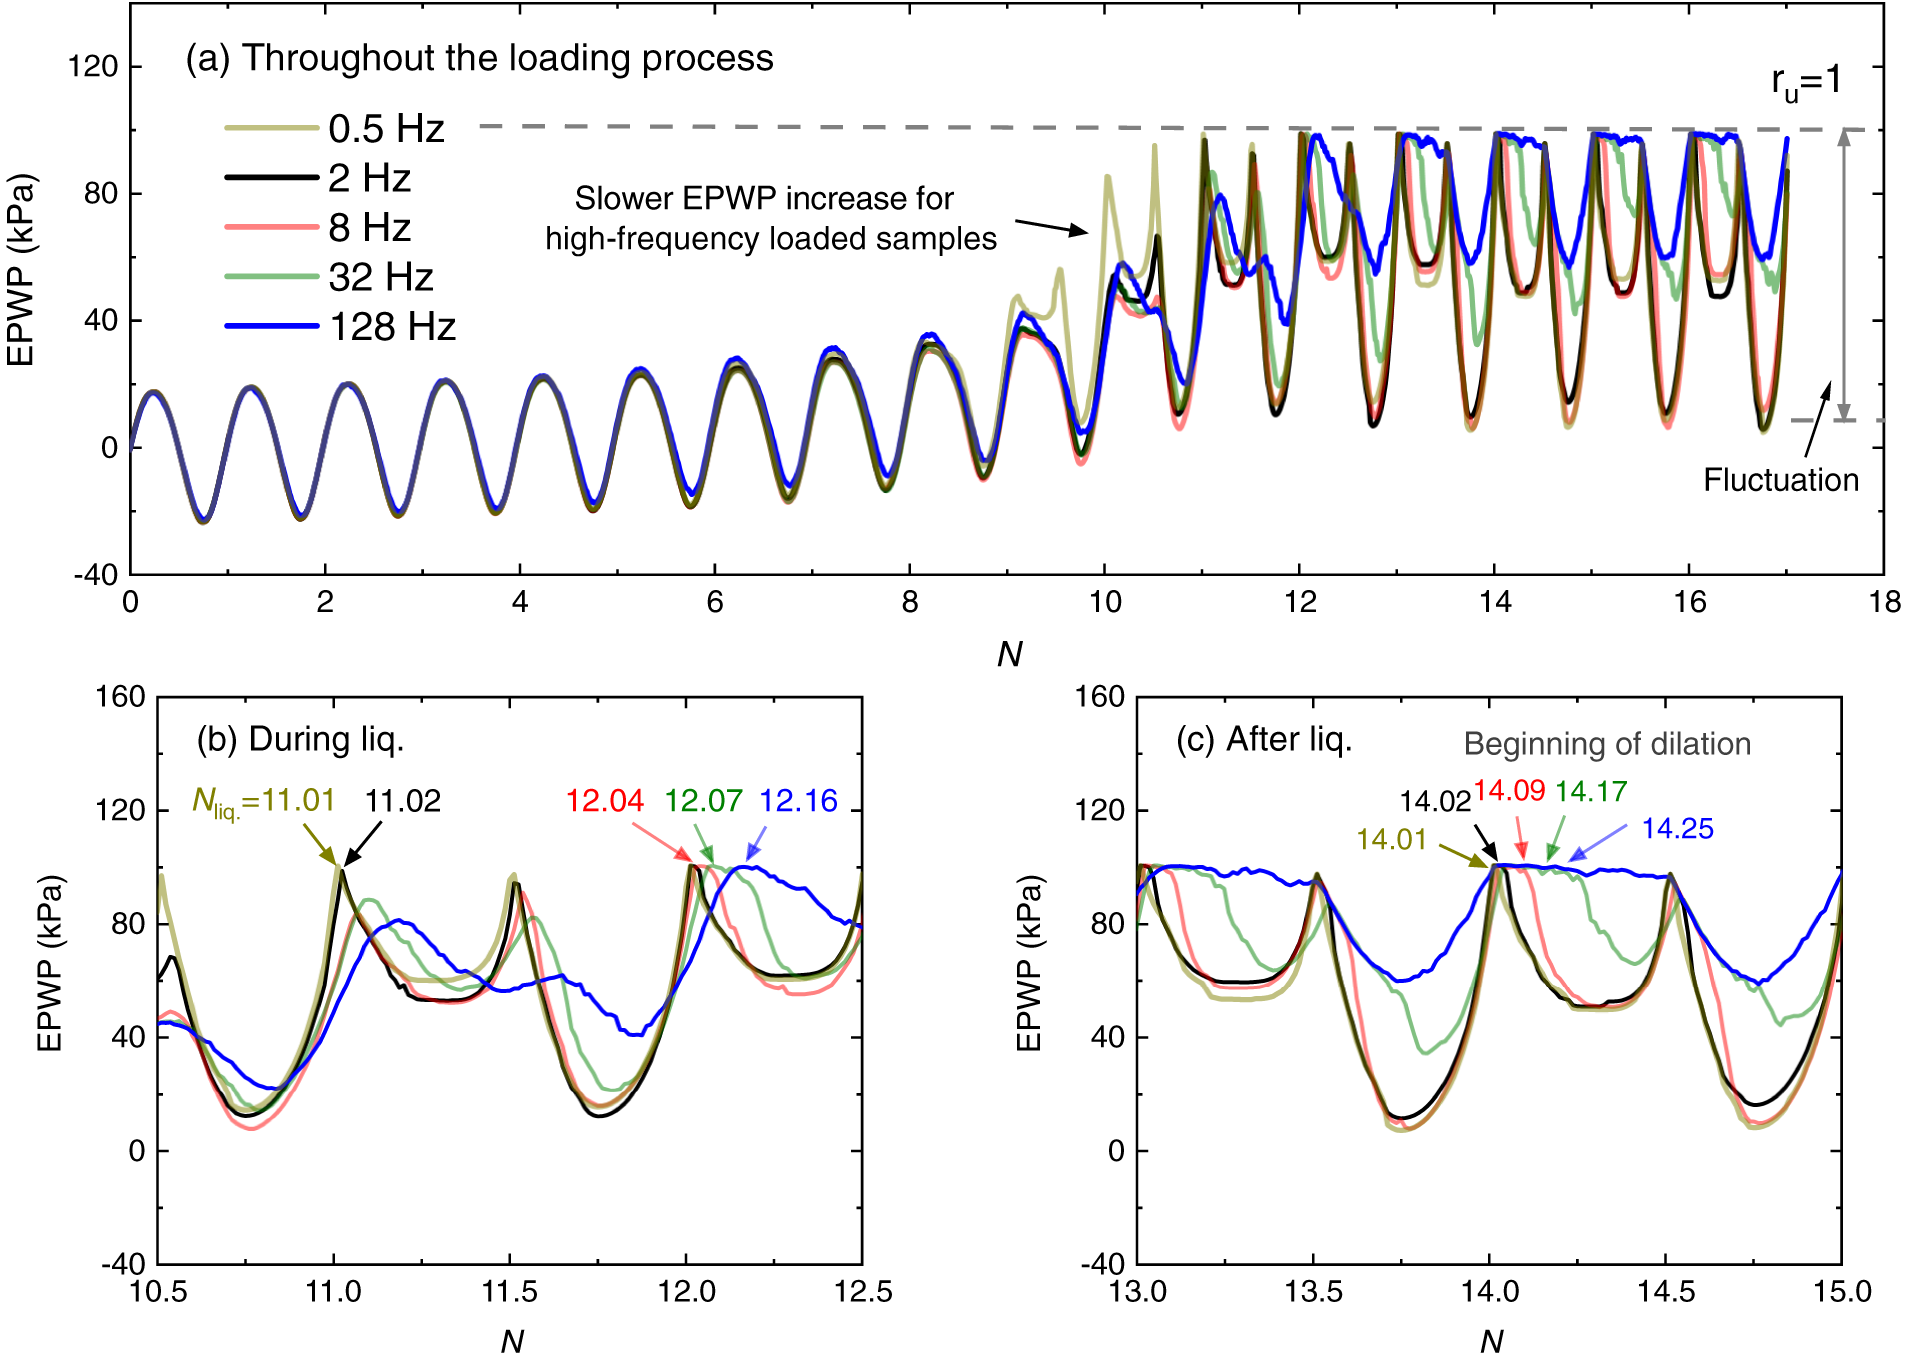
Figure 4: The cyclic responses of the excess pore water pressure EPWP under different cyclic loading frequencies: (a) throughout the loading process, (b) during liquefaction, and (c) after liquefaction.
Fig. 4b further presents the detailed response of EPWP during liquefaction. It is interesting to note that the high-frequency loading seems to bring about a “delay effect” on the development of EPWP. For instance, as the f increases, the onset of EPWP growth occurs later, and the time to reach liquefaction (i.e., ru = EPWP/σ′m = 1) is also delayed. The “delay effect” also results in an increase in liquefaction resistance. For example, the samples with f ≤ 2 Hz reach liquefaction at approximately N = 11, while the samples with higher f do not liquefy until around N = 12. After liquefaction, as illustrated in Fig. 4c, the impact of the “delay effect” on the response of EPWP remains significant. The sample with higher f dilates later. For instance, the sample with f = 128 Hz experiences dilation approximately 1/4 cycle later than the samples with f ≤ 2 Hz. Furthermore, the degree of dilation is notably reduced with increasing f, such that the sample with f = 128 Hz nearly stops dilating. The above phenomenon reveals that the high-frequency loading tends to restrain the dilative tendency of the granular materials.
Fig. 5a illustrates the development of axial strain εa under different cyclic loading frequencies. Qualitatively, the behavior of axial strain under various f exhibits similarities, summarized as: Before liquefaction, the axial strain fluctuates steadily with a minimal amplitude (εa < 0.5%). As liquefaction approaches, a sudden and significant increase in axial strain occurs, and after liquefaction, the axial strain demonstrates symmetrical growth on both compression and extension sides. Similar to the influence of cyclic loading frequency on EPWP, the effect of cyclic loading frequency on axial strain is primarily observed during and after the liquefaction. It can be seen that high-frequency loading tends to suppress the development of axial strain, and when f = 128 Hz, the axial strain after liquefaction barely develops.
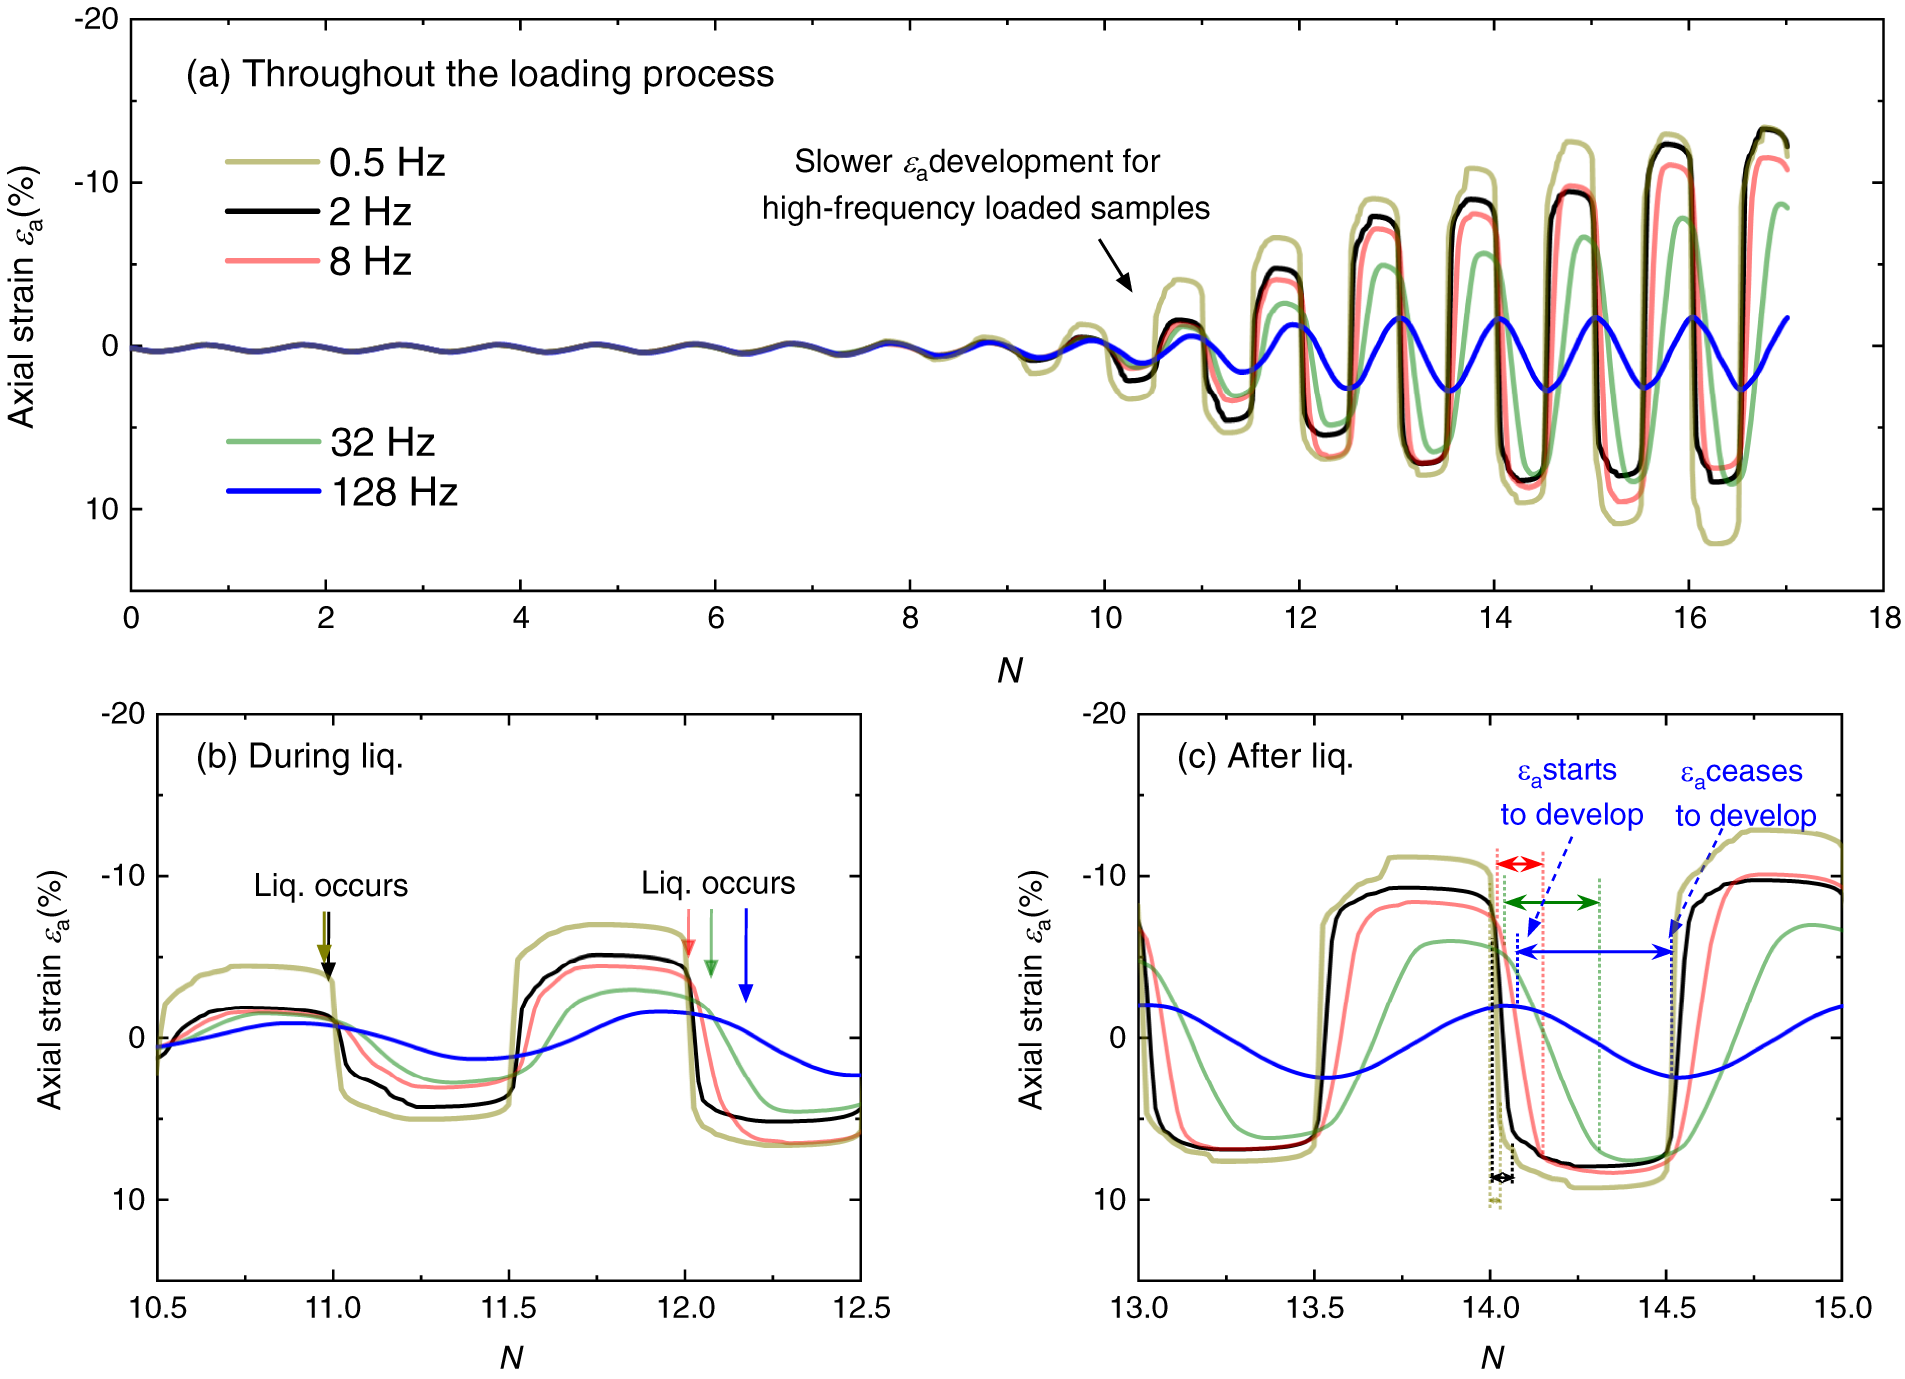
Figure 5: The cyclic responses of the axial strain εa under different cyclic loading frequencies: (a) throughout the loading process, (b) during liquefaction, and (c) after liquefaction.
Fig. 5b,c further presents the detailed response of εa during and after liquefaction, respectively. It can be seen that the high-frequency loading also brings about the “delay effect” on the development of εa, and the “delay effect” becomes more pronounced with increasing f. As f increases, there is a delay in the onset of εa development, while the cessation of εa development exhibits a more significant delay. This results in an extended duration for samples with higher f to develop axial strain.
Fig. 6 shows the stress-strain curve (i.e., εa-q relationship) under different cyclic loading frequencies. When f = 0.5 Hz, the “S-shaped” stress-strain curve is observed after liquefaction. Significant axial strain begins to develop when the deviatoric stress q reaches 0 in each cycle. At this point, the sample liquefies (i.e., p′ = q = 0) and shares no resistance to the cyclic load, and even a slight increase in deviatoric stress could lead to a substantial increase in axial strain. As the deviatoric stress continues to increase, dilation occurs, resulting in the recovery of effective stress and shear stiffness, and then the deformation of the sample is controlled.
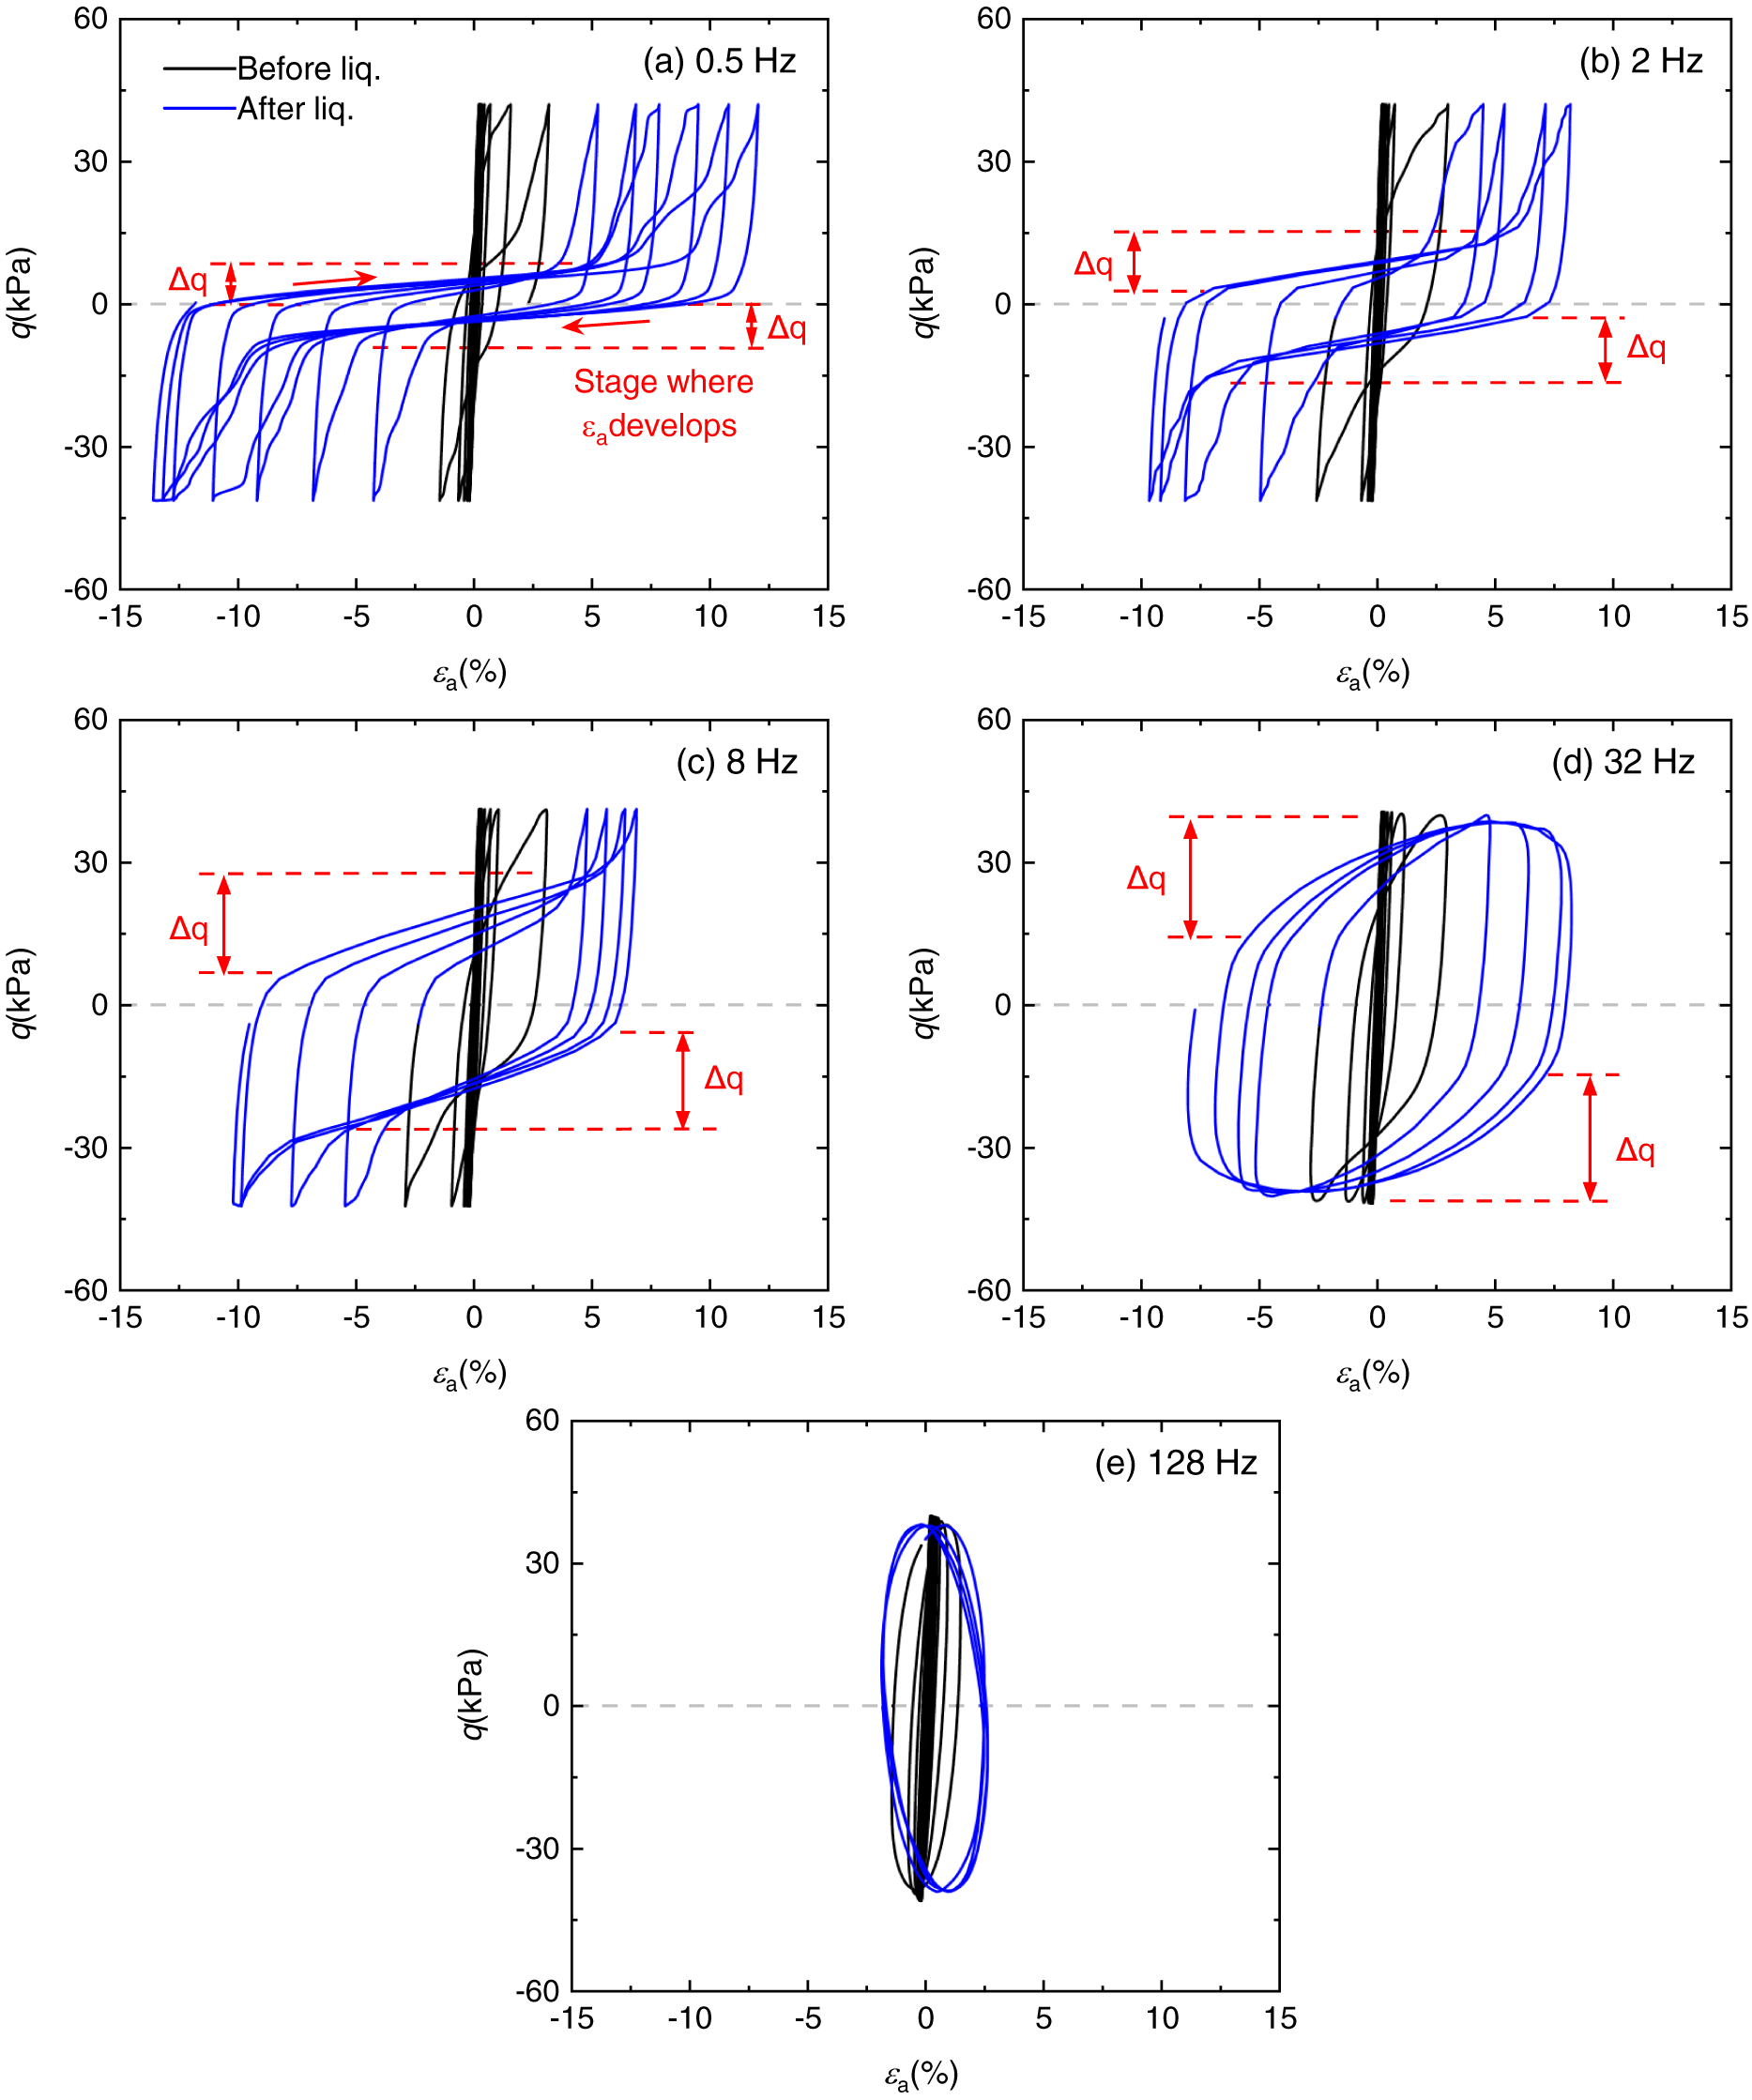
Figure 6: The cyclic responses of the stress strain curves under different cyclic loading frequencies: (a) 0.5 Hz, (b) 2 Hz, (c) 8 Hz, (d) 32 Hz, and (e) 128 Hz.
With the increase of f, the deviatoric stress gradually moves away from 0 as significant axial strain begins to develop. In addition, the sample with higher f must undergo a larger change in deviatoric stress ∆q before dilation is triggered to cease the development of axial strain, which also leads to a transition of the stress-strain curve from “S-shaped” to “O-shaped”. Similar phenomena were also observed in the laboratory tests [20,21] and centrifuge shaking table tests [47,48].
Fig. 7 shows the stress paths under different cyclic loading frequencies. The stress path gradually shifts to the left-hand side, with the pace of the shift accelerating as loading continues. After liquefaction, the stress paths significantly differ depending on the cyclic loading frequencies. When f = 0.5 Hz, as shown in Fig. 8, the stress path after liquefaction exhibits a “butterfly” shape, with the upper and lower edges of the stress path moving along the critical state line (i.e., CSL). The determination of CSL is presented in Appendix A; As f increases (f = 0.5 → 8 Hz), the stress path briefly crosses the CSL before continuing along it; When f reaches 32 Hz, the edge of the stress path first follows the path where Δq/Δp′ = ±2 (i.e., σ′y ≠ 0, σ′x = 0), and then moves horizontally (i.e., Δq/Δp′ = 0). It is important to note that the stress condition of σ′x = 0 and σ′y ≠ 0 indicates that the sample bears the vertical load without lateral support. This state could not occur under static conditions and only exists under high-frequency loading, where the inertial forces of particles may help resist the vertical load [13,49]; When f = 128 Hz, the stage where the stress path moves horizontally disappears, resulting in an overlap of the stress paths during loading and unloading.
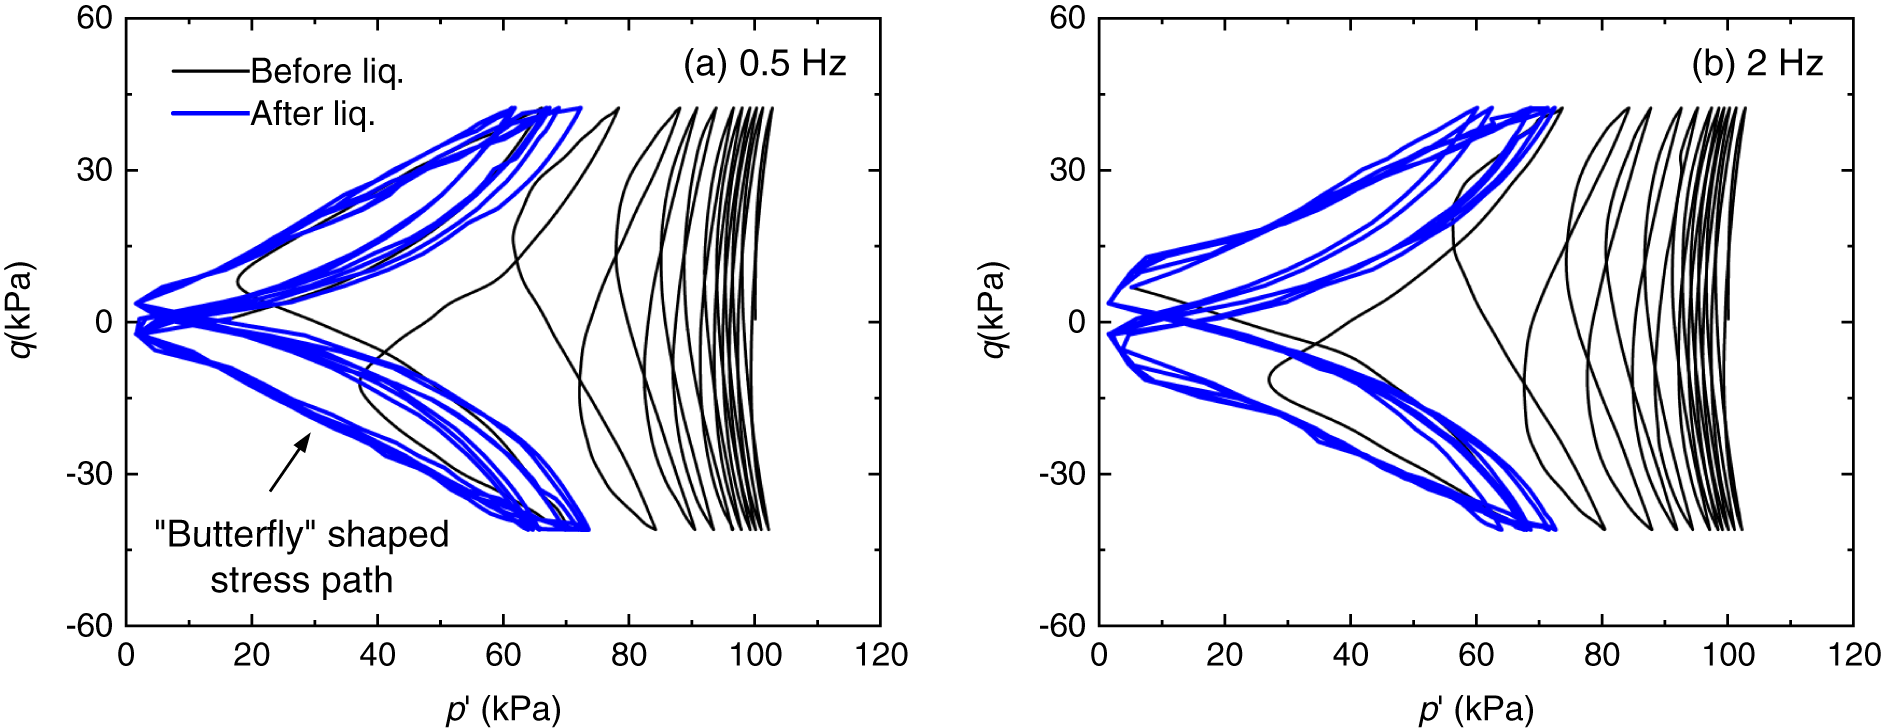
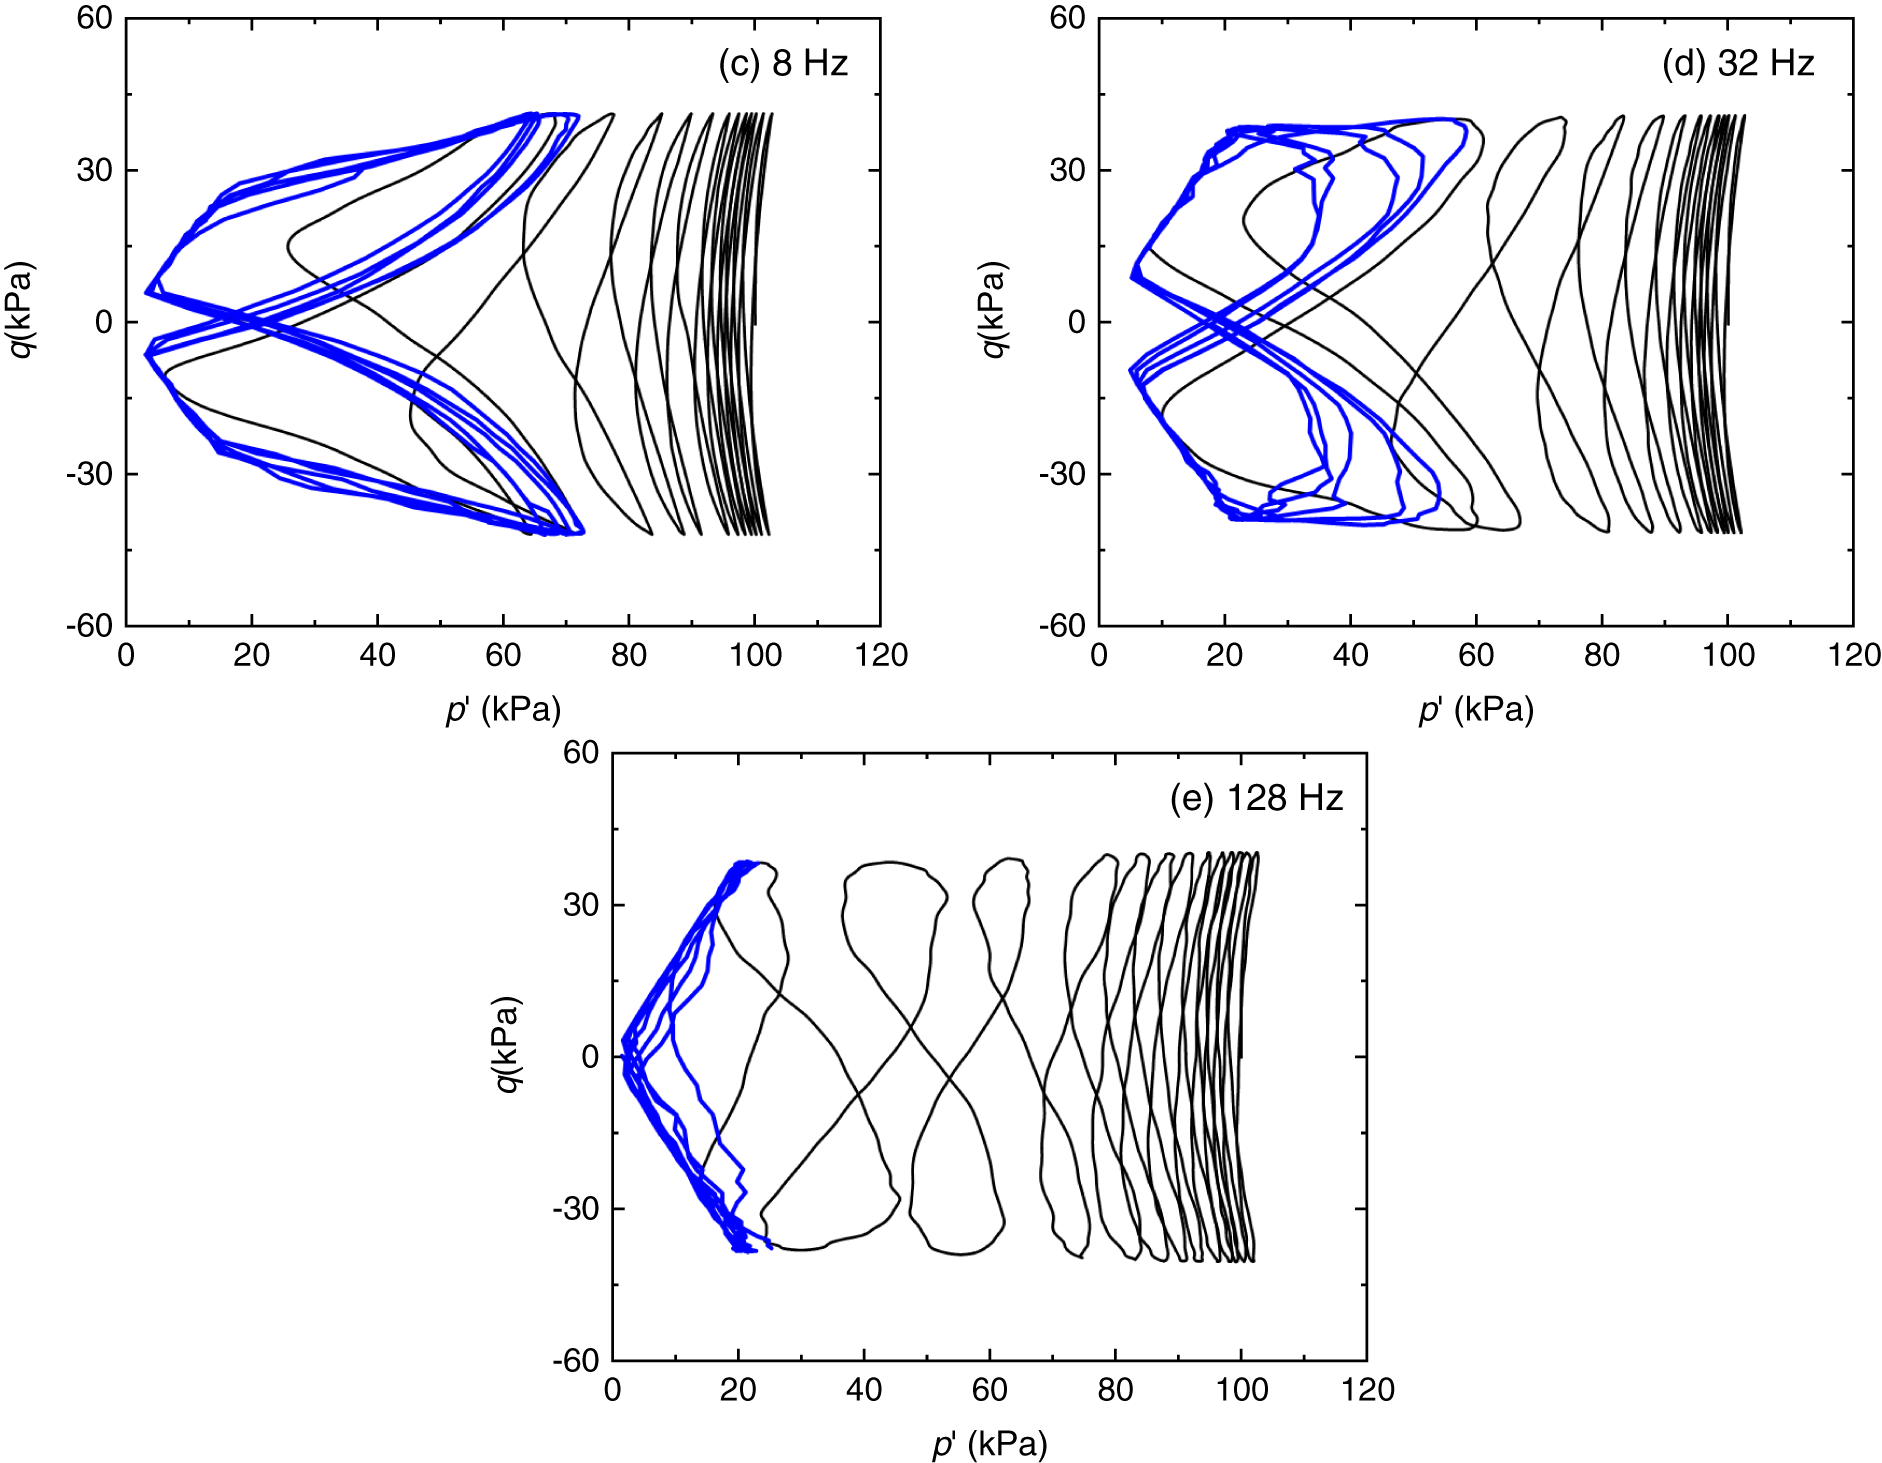
Figure 7: The cyclic responses of the stress paths under different cyclic loading frequencies: (a) 0.5 Hz, (b) 2 Hz, (c) 8 Hz, (d) 32 Hz, and (e) 128 Hz.
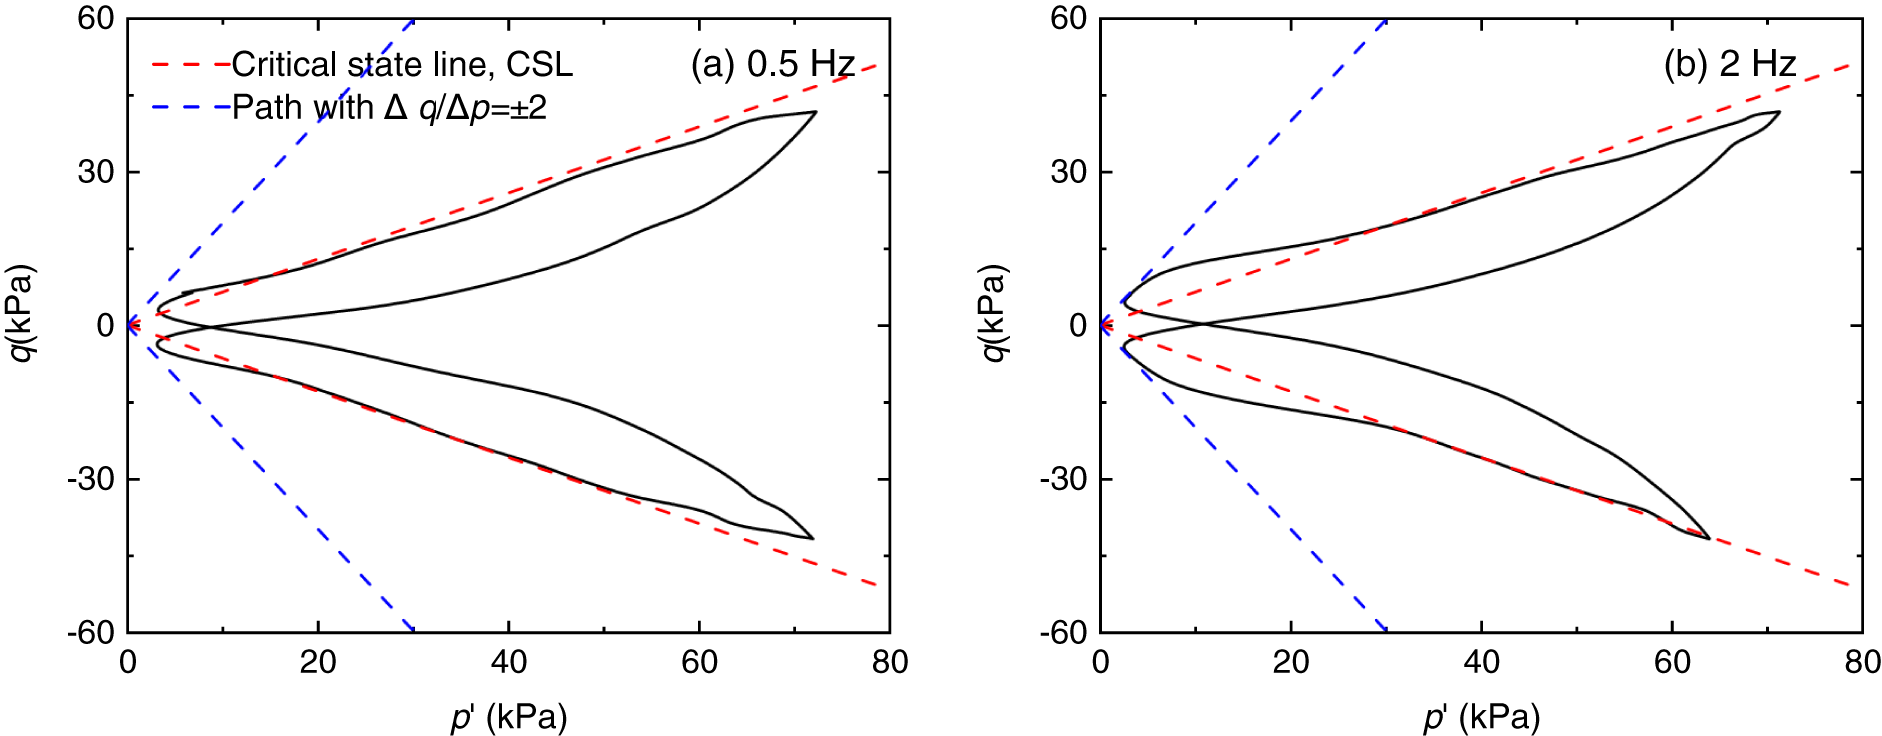
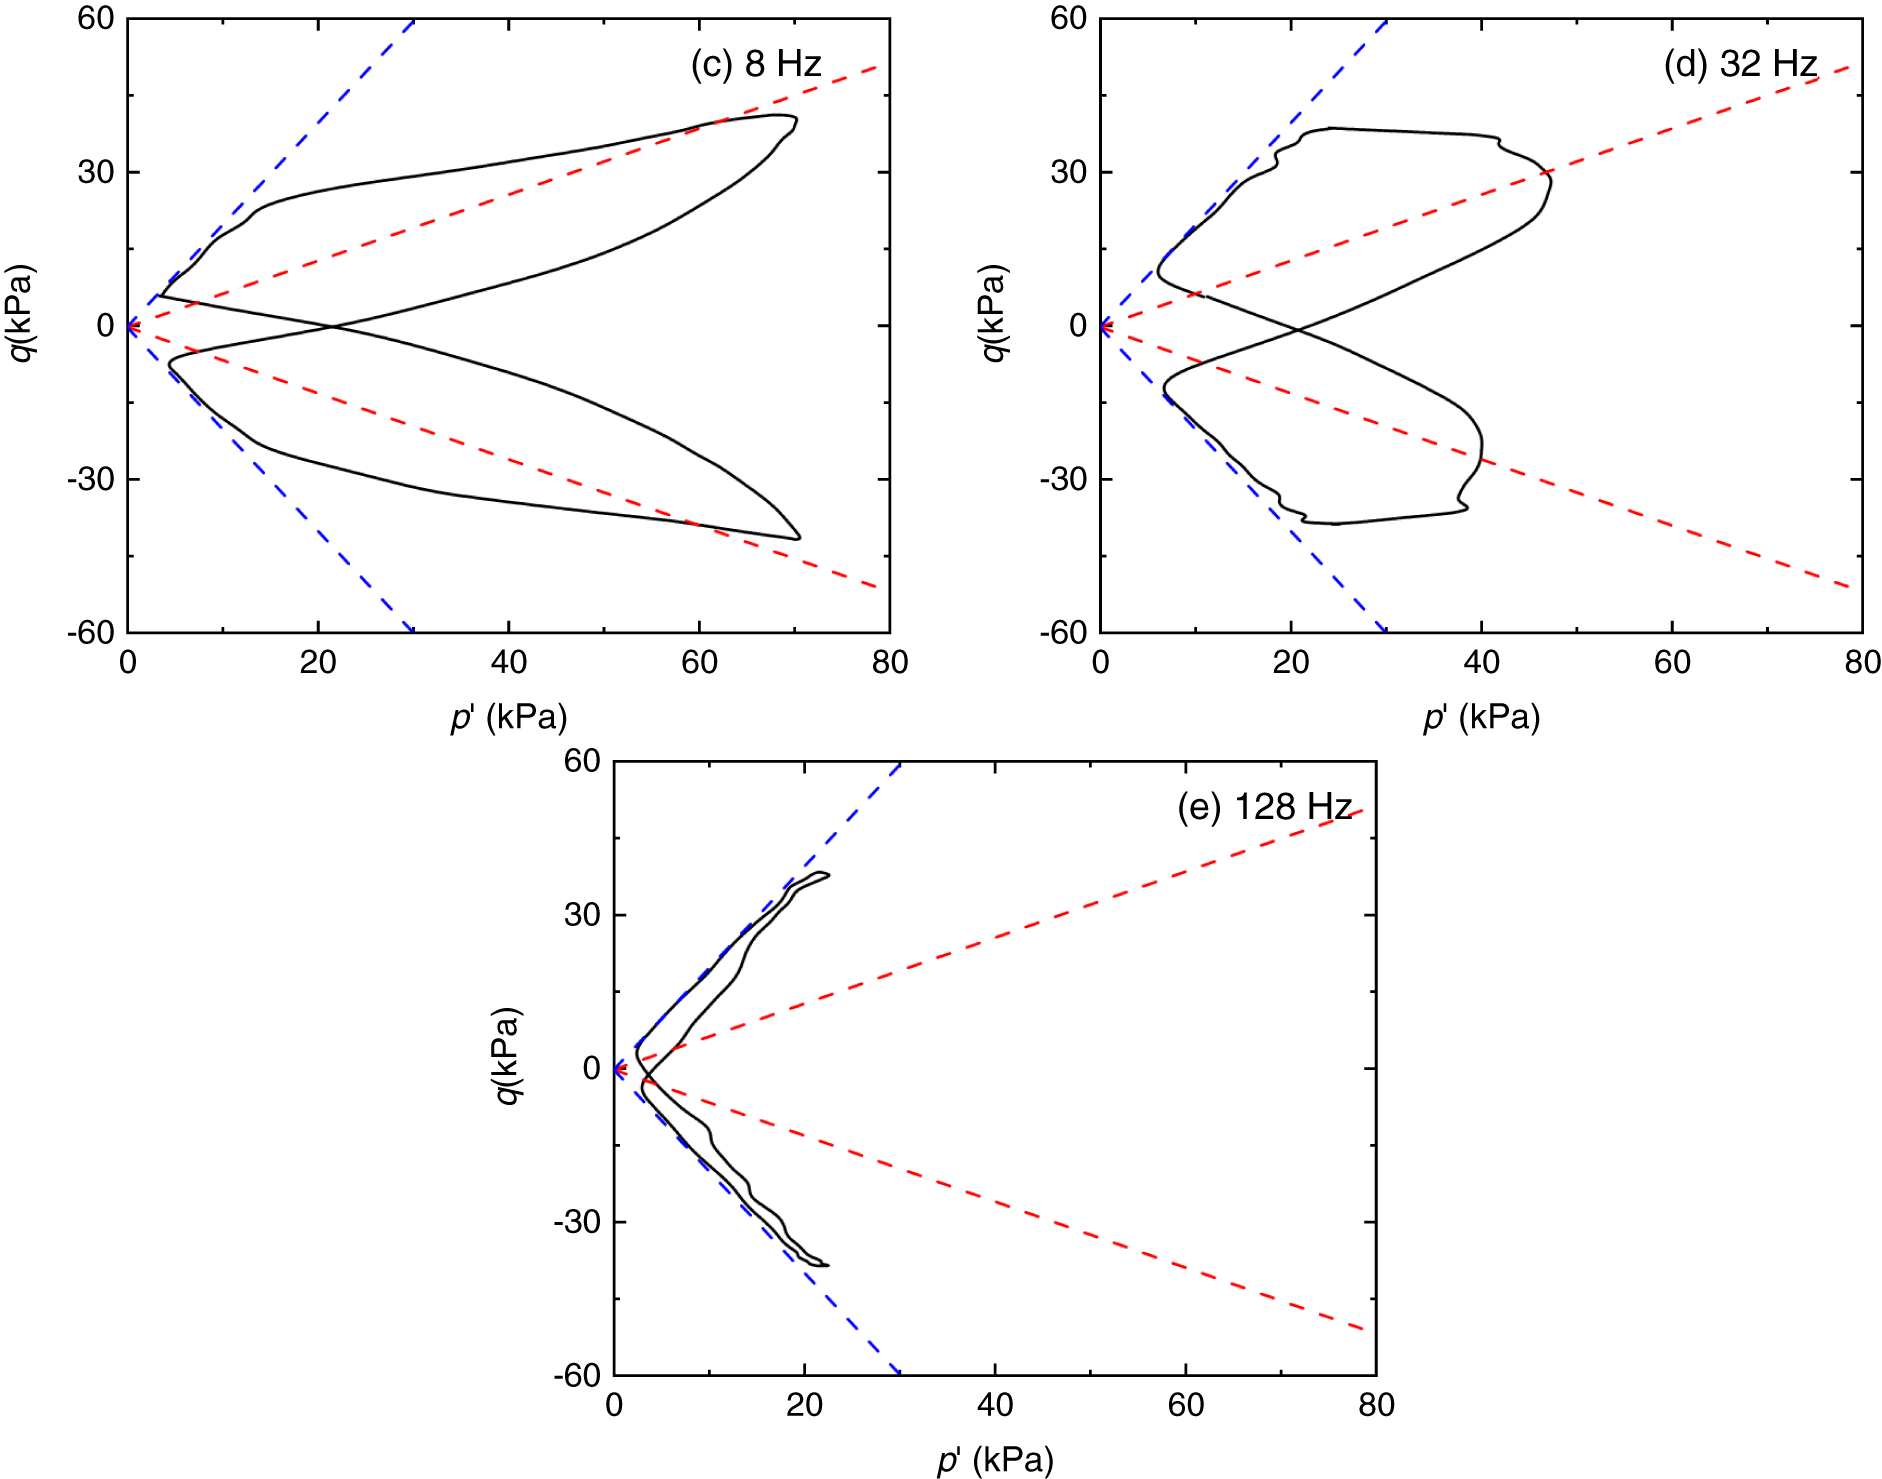
Figure 8: The typical stress paths after liquefaction under different cyclic loading frequencies: (a) 0.5 Hz, (b) 2 Hz, (c) 8 Hz, (d) 32 Hz, (e) 128 Hz.
From the above observations, it could be concluded that as the cyclic loading frequency increases, the EPWP and εa of the sample exhibit the “delay effect” during and after liquefaction, with this effect becoming more pronounced under higher cyclic loading frequencies. The “delay effect” contributes to an increase in liquefaction resistance and facilitates the transition of the stress-strain curve from “S-shaped” to “O-shaped”. Besides, the increase in cyclic loading frequency significantly alters the stress path after liquefaction.
4 The Evolution of the Microstructures
The evolution of the microstructure of the samples under different cyclic loading frequencies is further investigated, which may provide insights into the micromechanism underlying the above macroscopic behaviors.
The soil microstructure consists of numerous contacts, and since the contact could be defined by the contact normal n, normal contact force fn, and tangential contact force ft (Fig. 9), it is possible that these three parameters could characterize the microstructure. According to Rothenburg and Bathurst [50], the angular distribution of n could be used to characterize the contact structure of the soil, while the angular distribution of fn and ft could be used to characterize the contact force structure. Fig. 10 presents the typical angular distribution of n, fn and ft with f = 2 Hz when the deviatoric stress q > 0 (N = 10.2 in Fig. 10a) and q < 0 (N = 10.7 in Fig. 10b). It could be seen that the angular distribution in both cases is highly anisotropic, and the major principal direction of angular distribution is vertical when N = 10.2 and horizontal when N = 10.7.
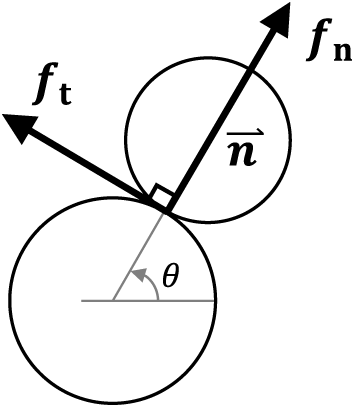
Figure 9: The schematic diagram of contact normal n, normal contact force fn and tangential contact force ft.
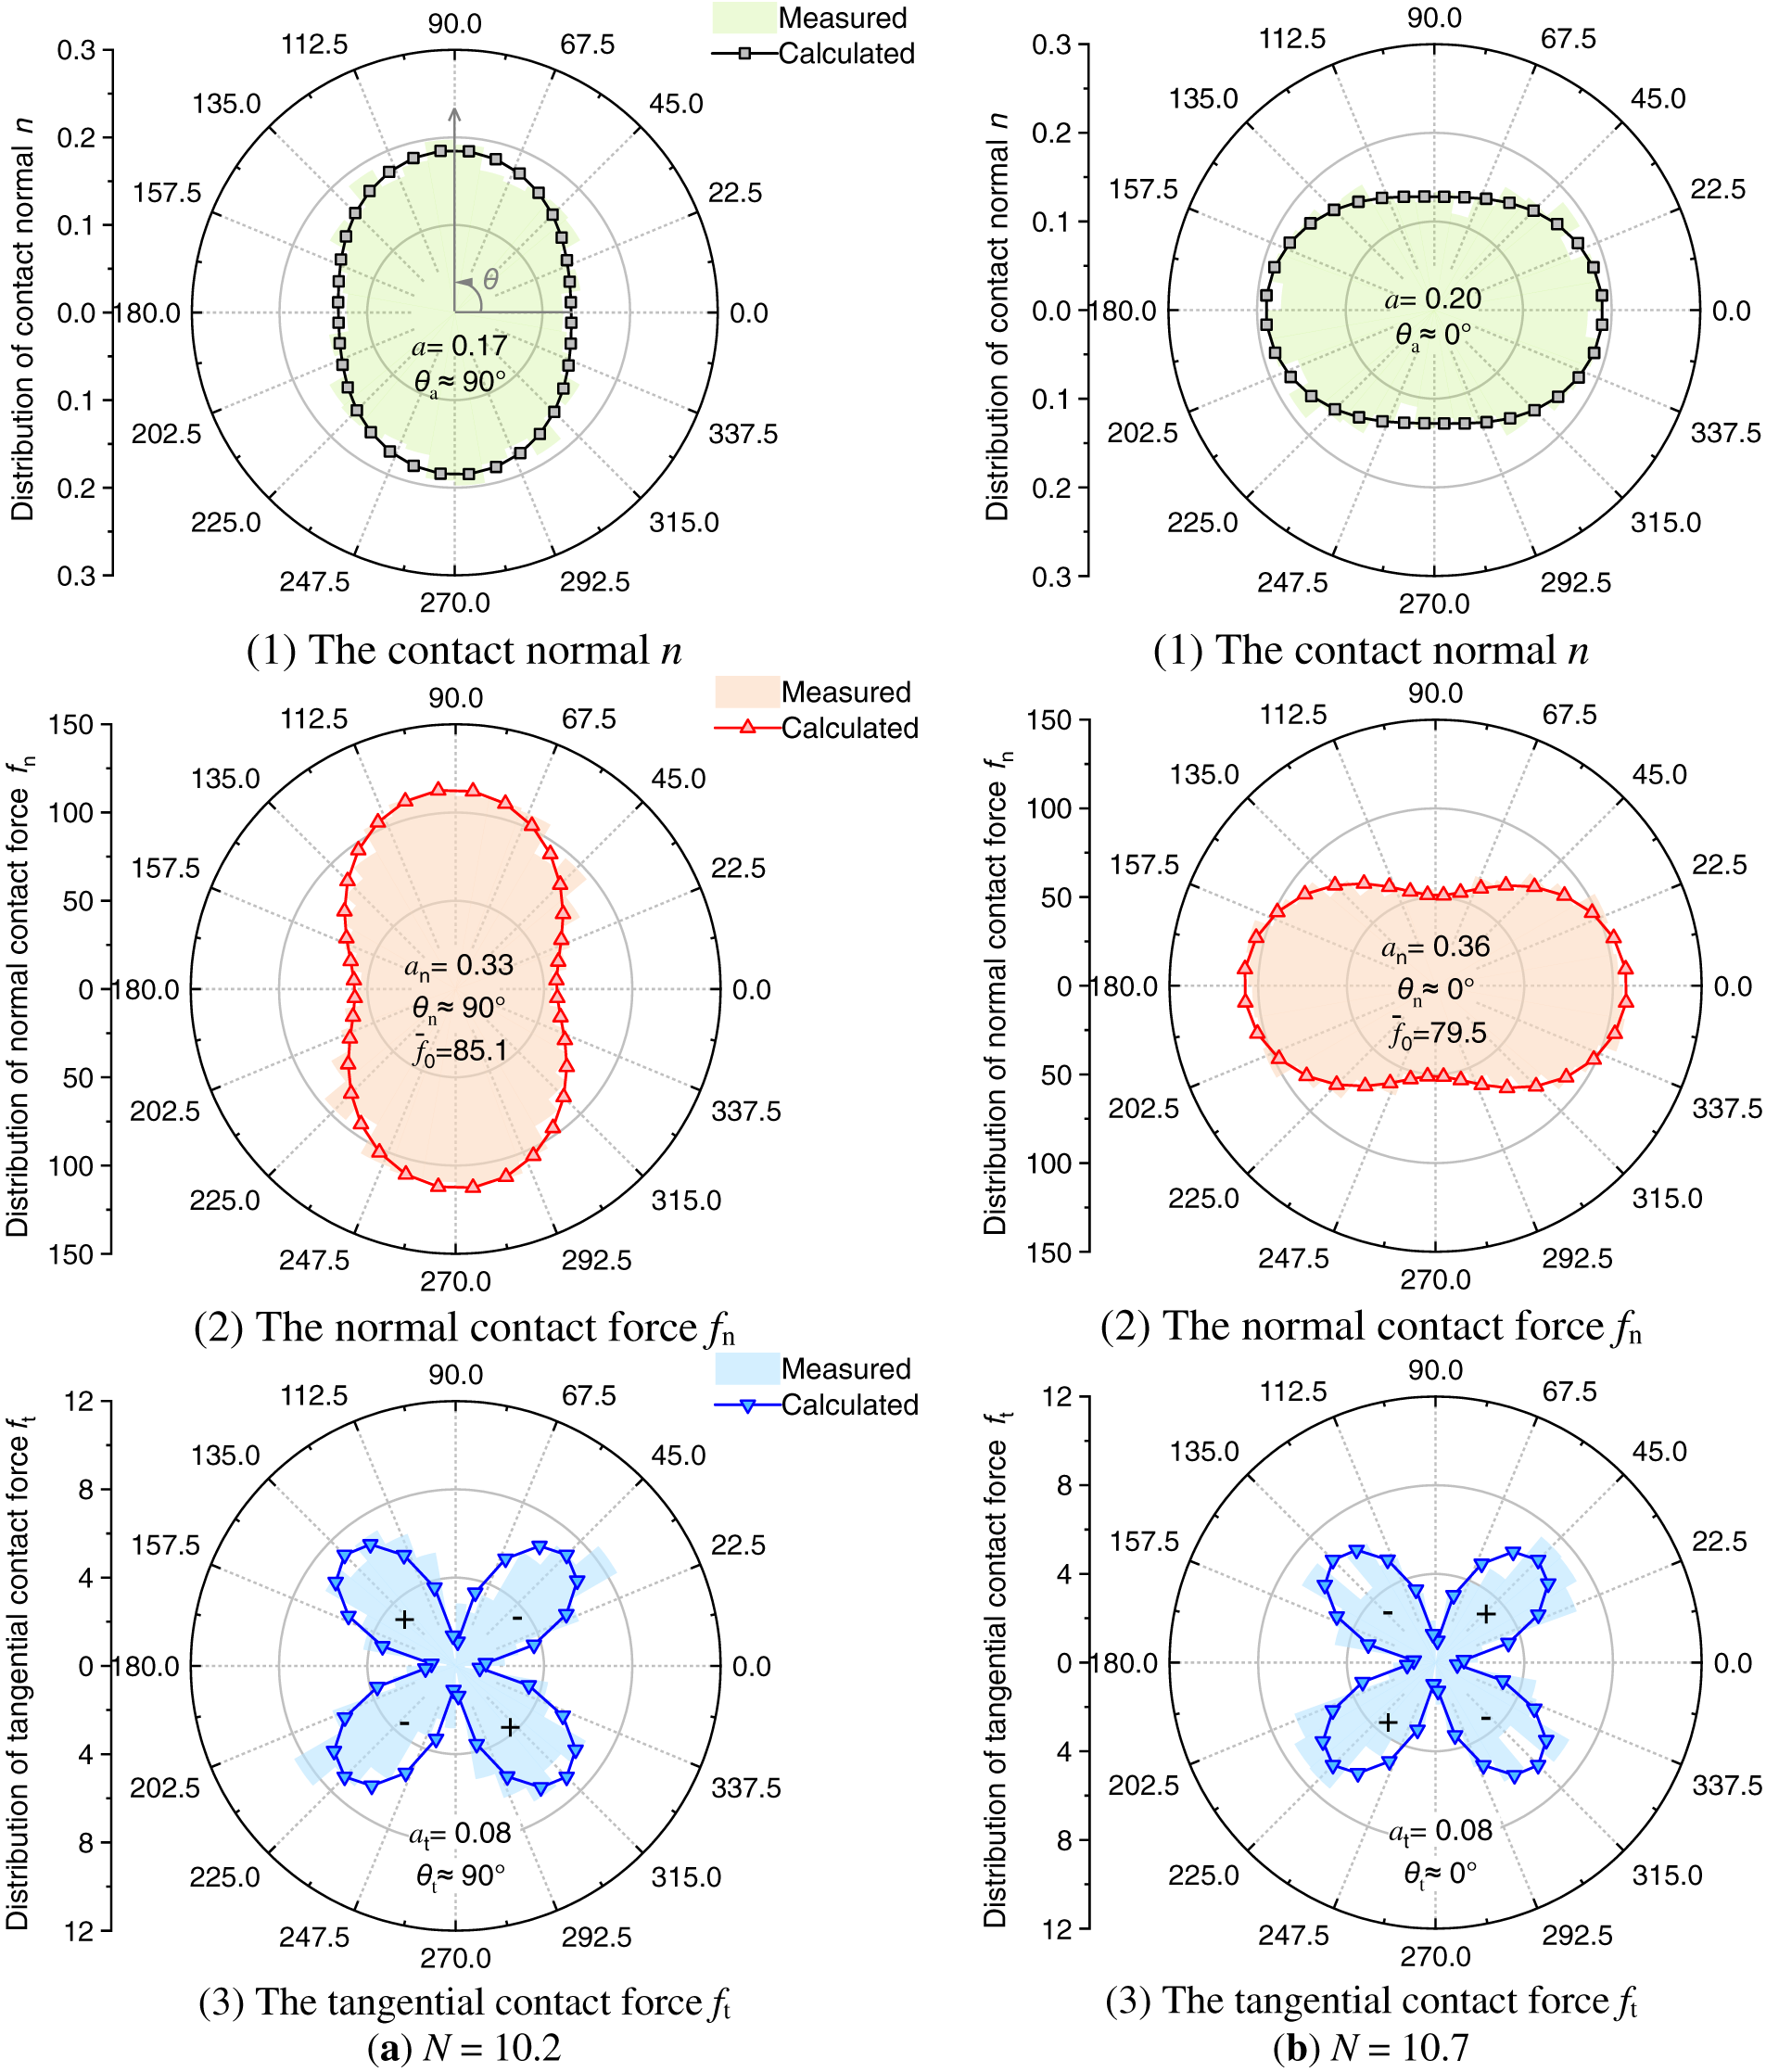
Figure 10: The angular distribution of contact normal n, normal contact force fn and tangential contact force ft when (a) N = 10.2, and (b) N = 10.7 of the sample with f = 2 Hz.
Rothenburg and Bathurst [50] further suggested that the above angular distribution could be approximated by the following function:
where, the
The evolution of the anisotropies a, an and at under different cyclic loading frequencies is given in Fig. 11. It could be seen that: (1) Before liquefaction, the responses of a, an and at under different f are almost identical, following a “M-type” growth pattern in each loading cycle; (2) During and after liquefaction, although a, an and at continue to exhibit a “M-type” growth, their responses significantly differ depending on the cyclic loading frequency. Additionally, with the increase of f, the onset of growth for the anisotropies a, an and at is progressively delayed (i.e., “delay effect”), as highlighted by the red dashed box in Fig. 11.
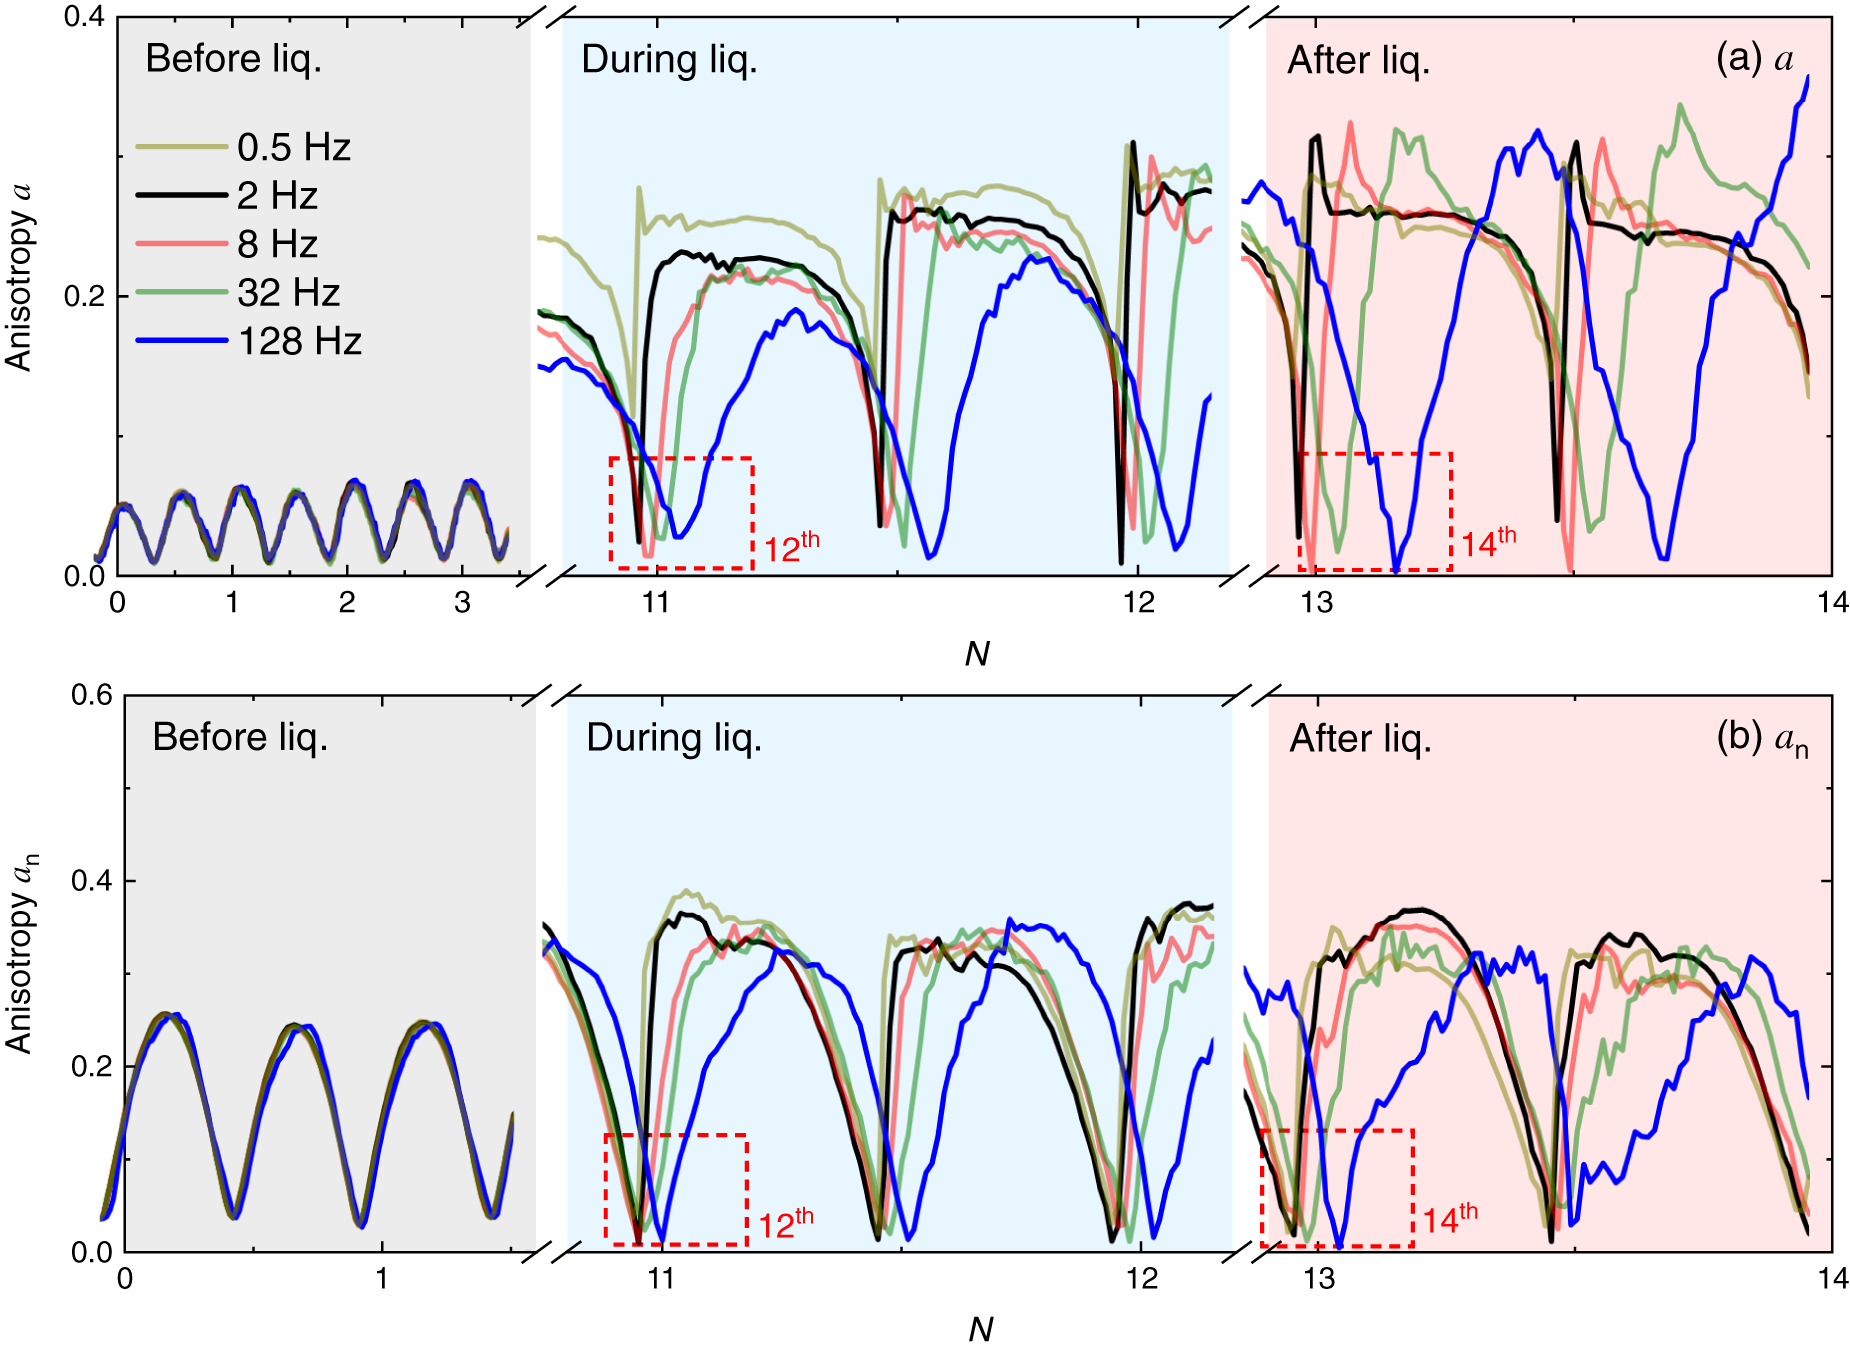
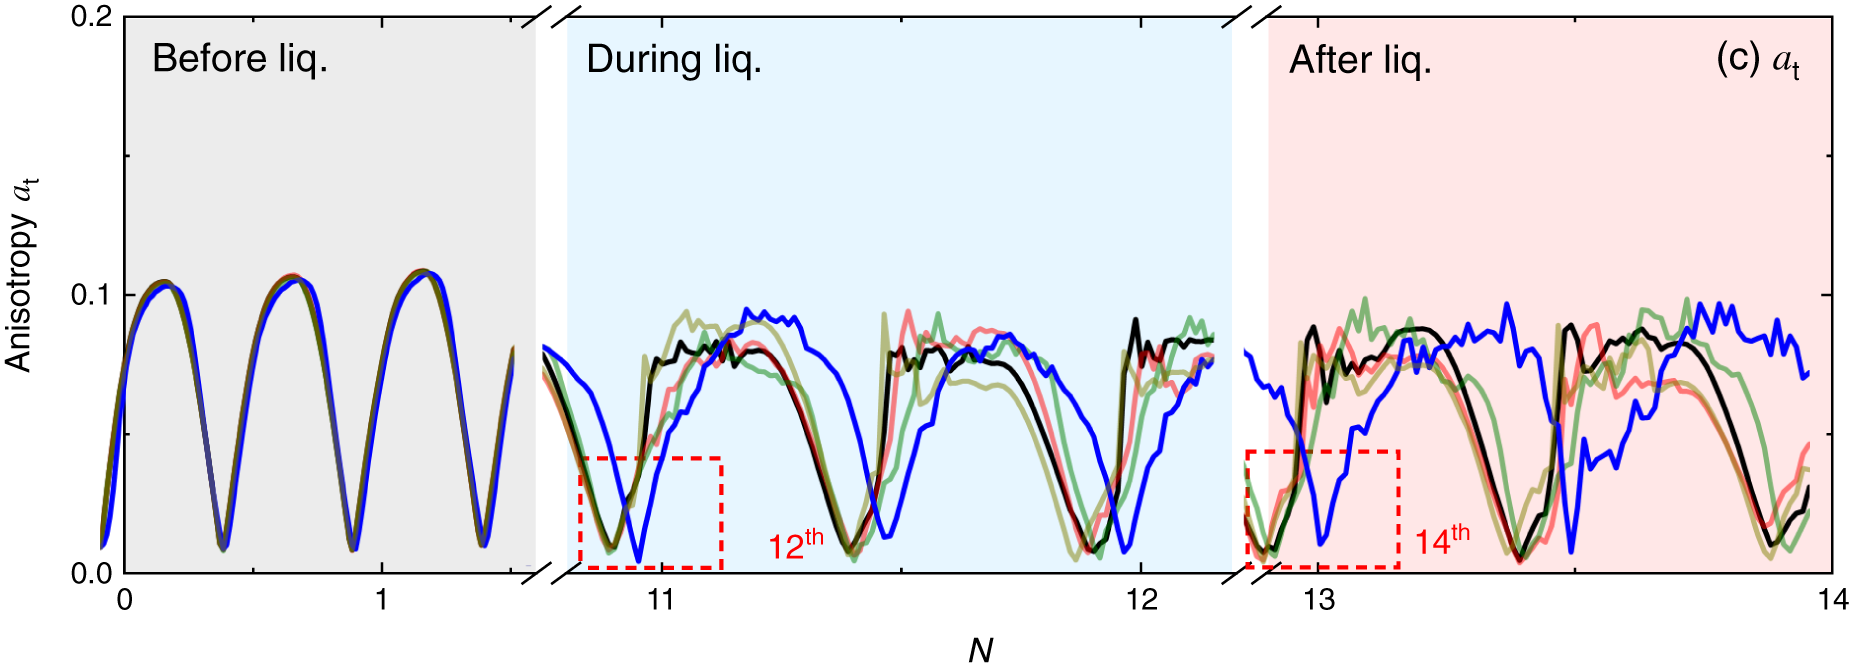
Figure 11: The evolution of the degree of anisotropy (a) a, (b) an, and (c) at under different cyclic loading frequencies.
To quantify the “delay effect” of anisotropies a, an, and at, we define three parameters: ∆Na, ∆Nn, and ∆Nt. For each loading cycle, these parameters represent the difference between the cycle number at which the corresponding anisotropy starts to increase and the cycle number at the cycle’s onset (Fig. 12). The larger the ∆Na, ∆Nn and ∆Nt, the greater the delay. Fig. 13 presents the evolution of ∆Na, ∆Nn and ∆Nt, and it can be seen that: (1) Regardless of whether the cyclic loading frequency is high or low, an and at increase first, followed by an increase in a. This reveals the load-bearing mechanism of granular specimens, wherein the response of contact forces precedes the adjustment of contact structures under external loads. Further, the tangential contact force resists the external loads prior to the normal contact force; (2) The “delay effect” is most pronounced during and after liquefaction, with larger cyclic loading frequency leading to a more significant delay in the anisotropies. Among a, an and at, the a is most strongly influenced by the cyclic loading frequency, followed by an and at; (3) More importantly, as the cyclic loading frequency increases, the asynchrony between the evolution of internal contact forces and the adjustment of contact structures in the samples becomes progressively more pronounced, manifesting primarily as a significant temporal lag of structural reorganization behind contact force response under high-frequency loading.
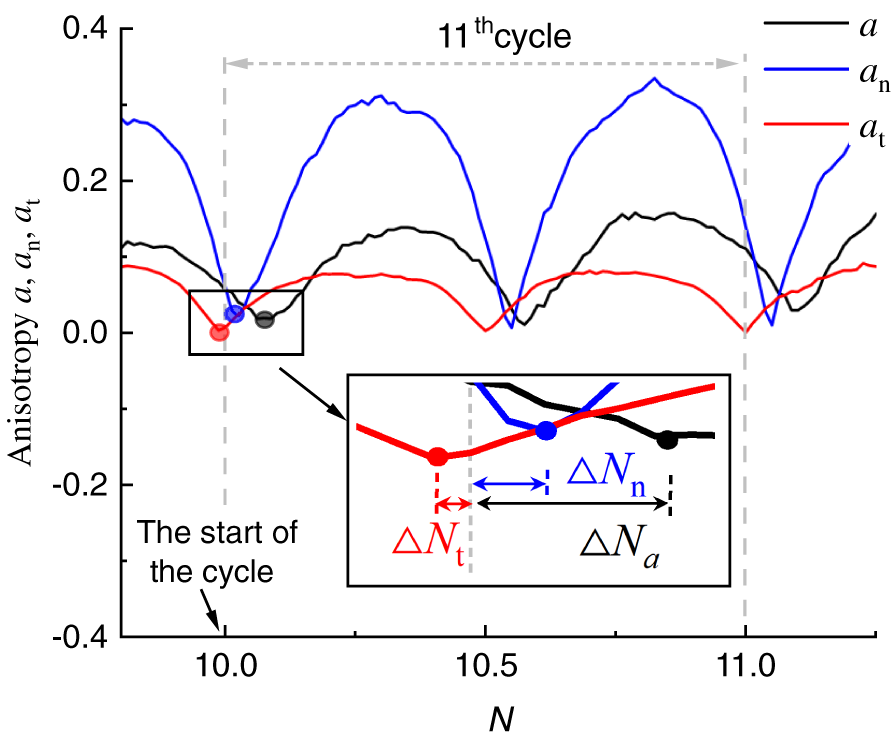
Figure 12: The schematic diagram of ∆Na, ∆Nn and ∆Nt.
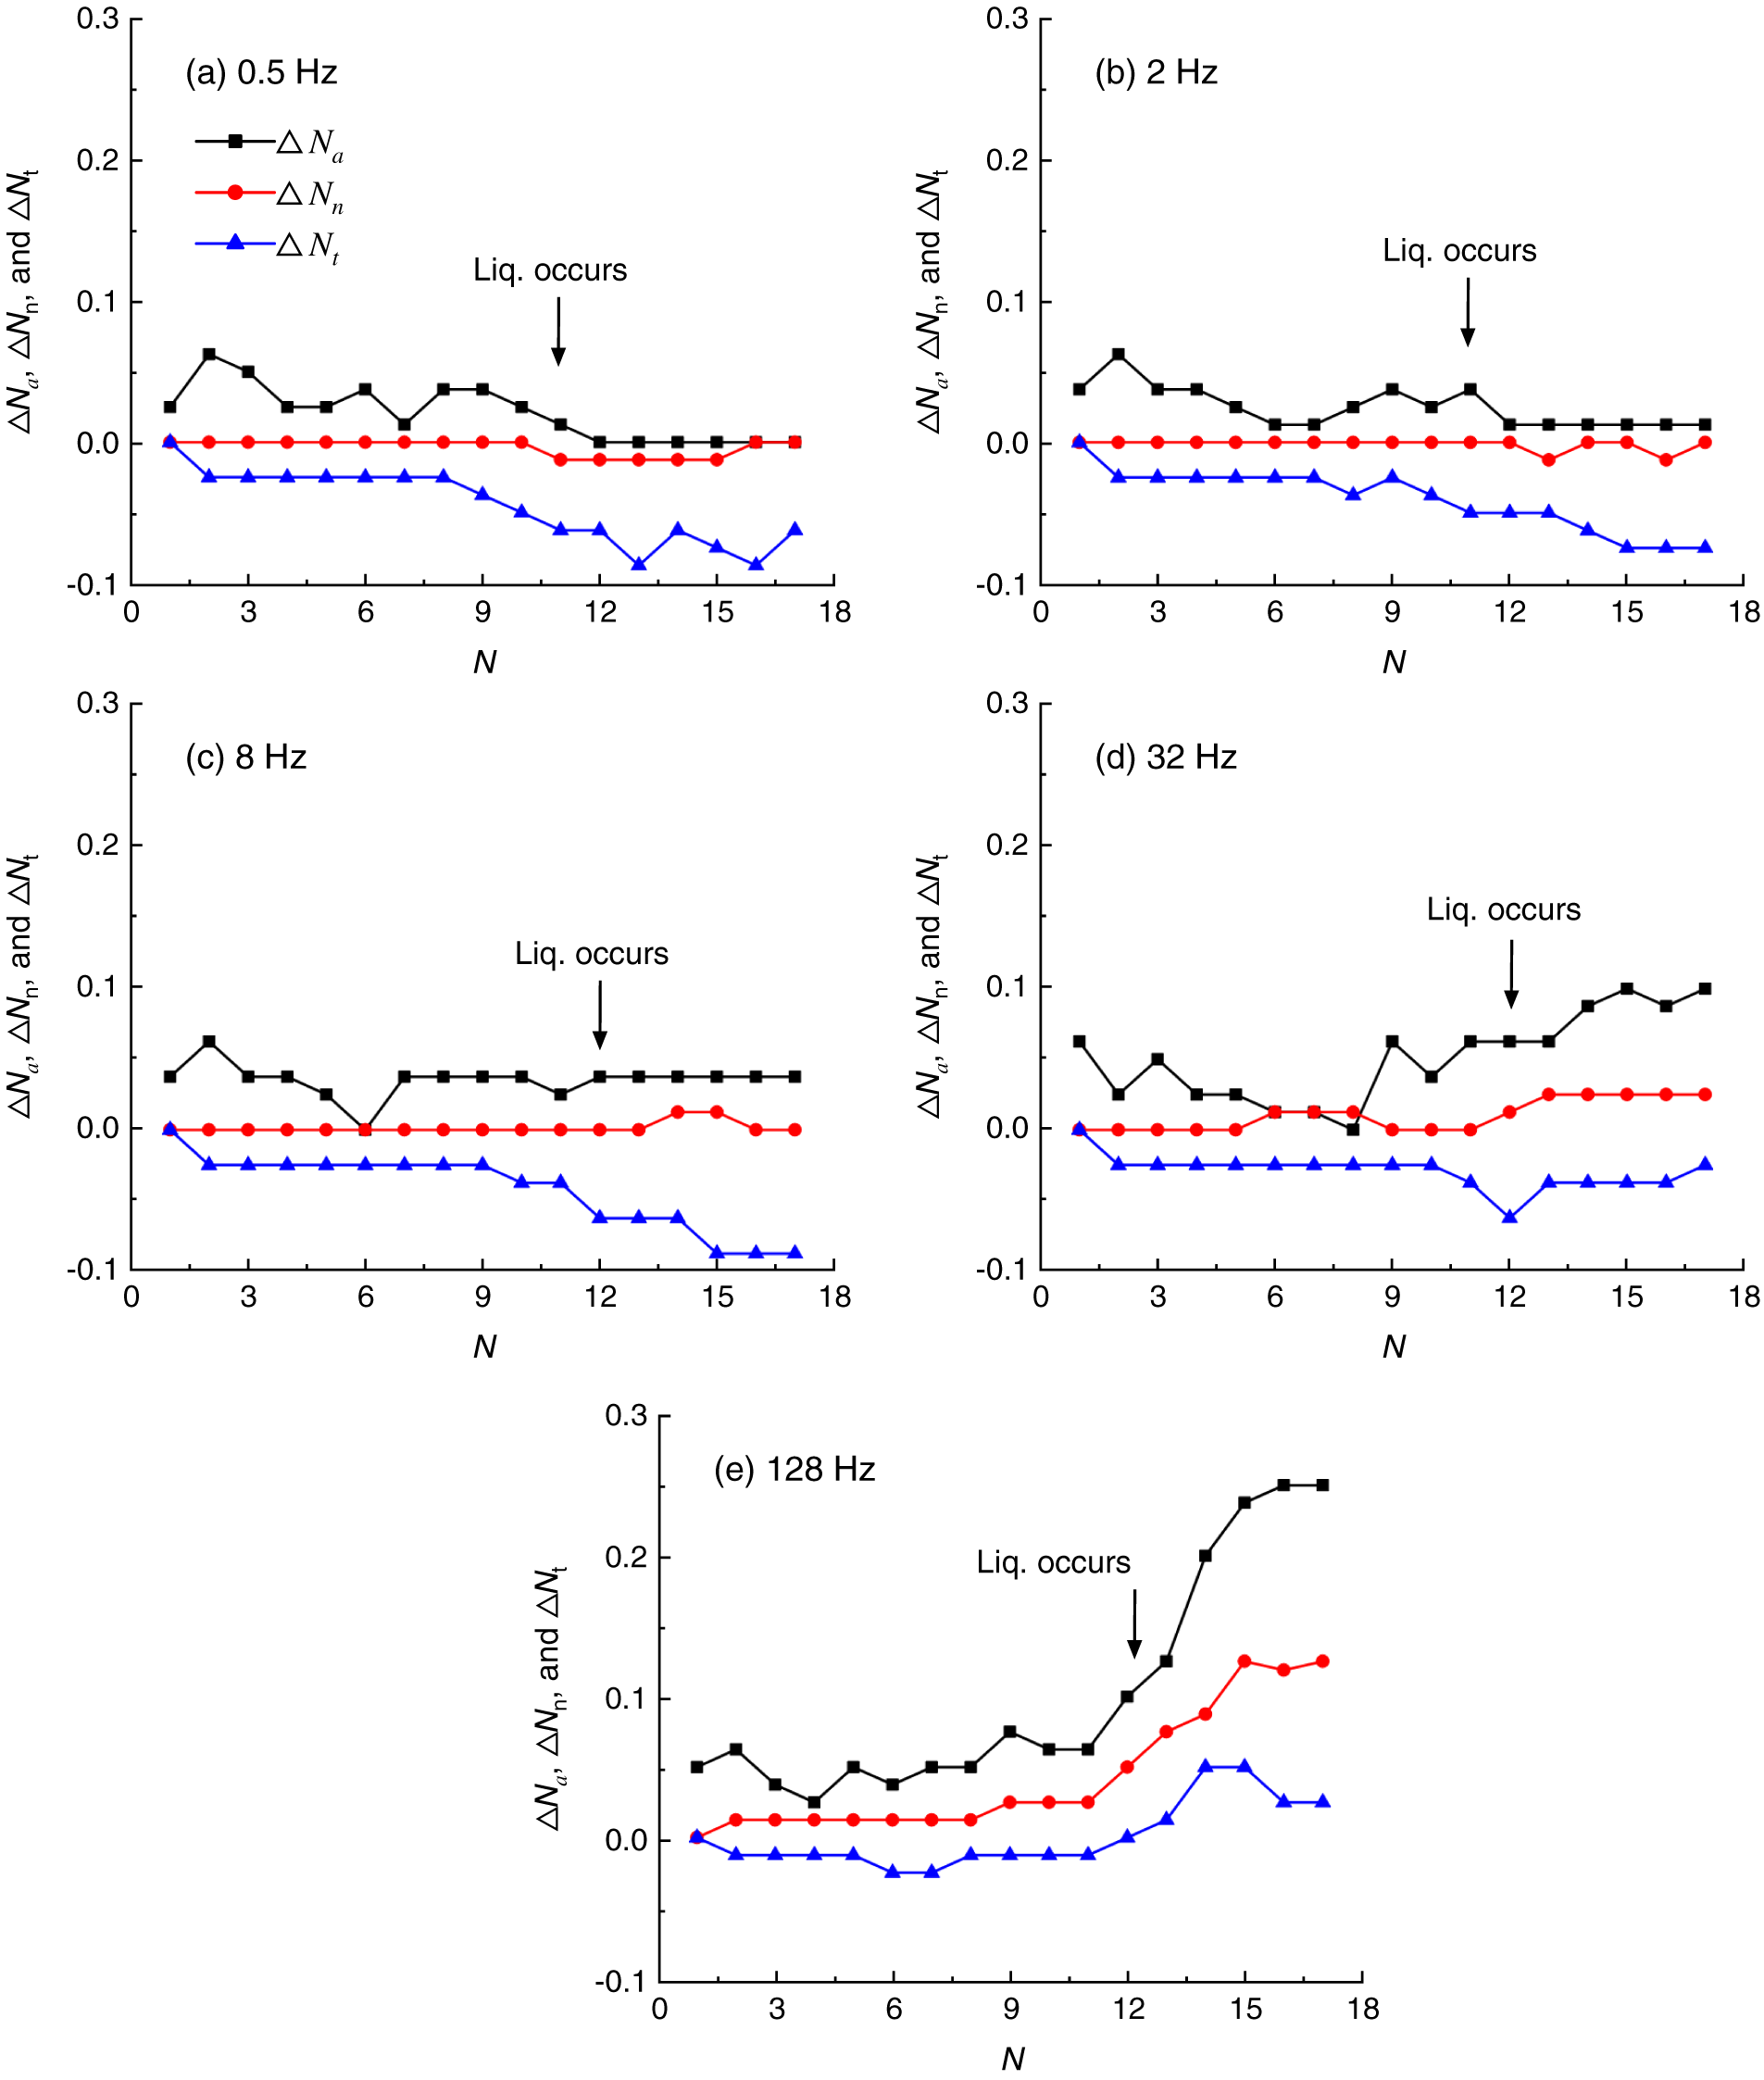
Figure 13: The evolution of ∆Na, ∆Nn and ∆Nt under different cyclic loading frequencies: (a) 0.5 Hz, (b) 2 Hz, (c) 8 Hz, (d) 32 Hz, (e) 128 Hz.
The mechanical coordination number (MCN) proposed by Thornton [51] is adopted to examine the evolution of contact density during the cyclic loading process. It is calculated as an average number of inter-particle contacts for each particle, but excludes the particles with fewer than 2 contacts, as these do not contribute to the stable stress state. It could be expressed as:
where Nb and Nc are the number of particles and contacts within the sample, respectively; Nb1 and Nb0 are the number of particles with only one and zero contacts, respectively.
The evolution of MCN under different cyclic loading frequencies is given in Fig. 14. It can be seen that: (1) Before liquefaction, the responses of MCN under different f are almost identical, following a “W-type” growth pattern in each loading cycle. Loading on the compression and extension sides results in a disintegration of the contact structure (i.e., MCN decreases), while unloading on both sides helps restore the contact structure (i.e., MCN increases); (2) During and after liquefaction, the MCN response transitions to an “M-type” growth pattern, where loading rather causes an increase in MCN, and unloading leads to a decrease in MCN. Additionally, the responses of MCN at varying cyclic loading frequencies exhibit significant differences, with high-frequency loading delaying the development of MCN, i.e., slowing down the microstructural adjustment.
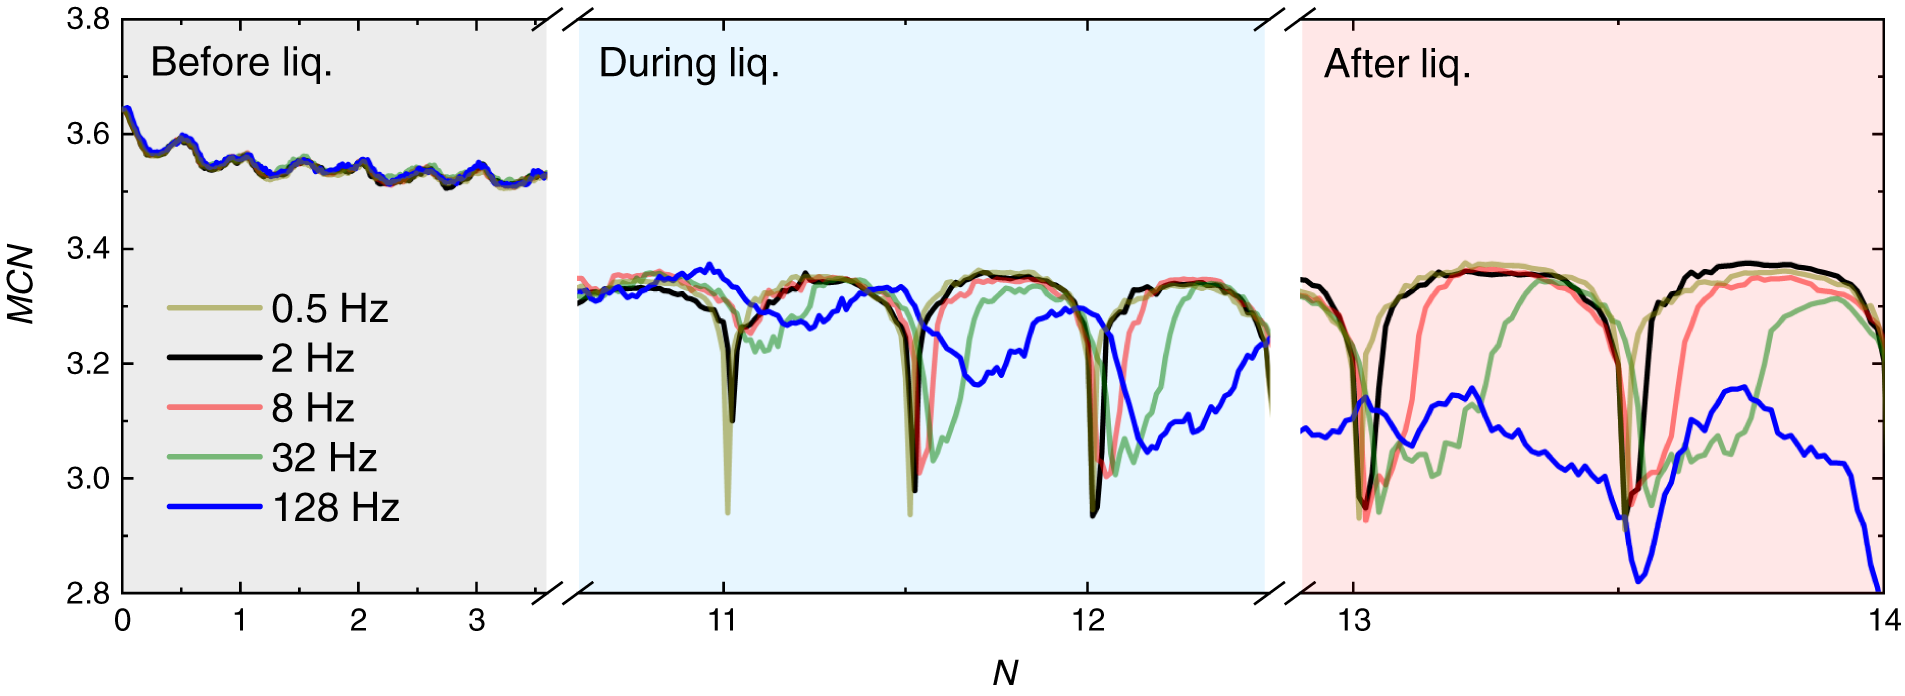
Figure 14: The evolution of the mechanical coordination number MCN under different cyclic loading frequencies.
As observed above, both macro- and micromechanical responses exhibit a “delay effect” with increasing cyclic loading frequency. The following subsections examine why this “delay effect” becomes more pronounced at higher loading frequencies.
5.1 Boundary Stress and Homogenized Stress
Two definitions of stress are considered [52]. The first is boundary stress (external stress), which is calculated from forces on the boundary walls, representing the load applied to the sample. The second is homogenized stress (internal stress), which is computed from contact normal and contact forces within the assembly, reflecting the average stress borne by particle contacts. Both are expressed as the dimensionless ratio
Fig. 15 compares the two stresses during liquefaction for low and high frequencies. For low frequency (f = 0.5 Hz), the two stresses remain nearly identical throughout loading, except for deviations at the liquefaction instants when p′ approaches zero, causing spikes in
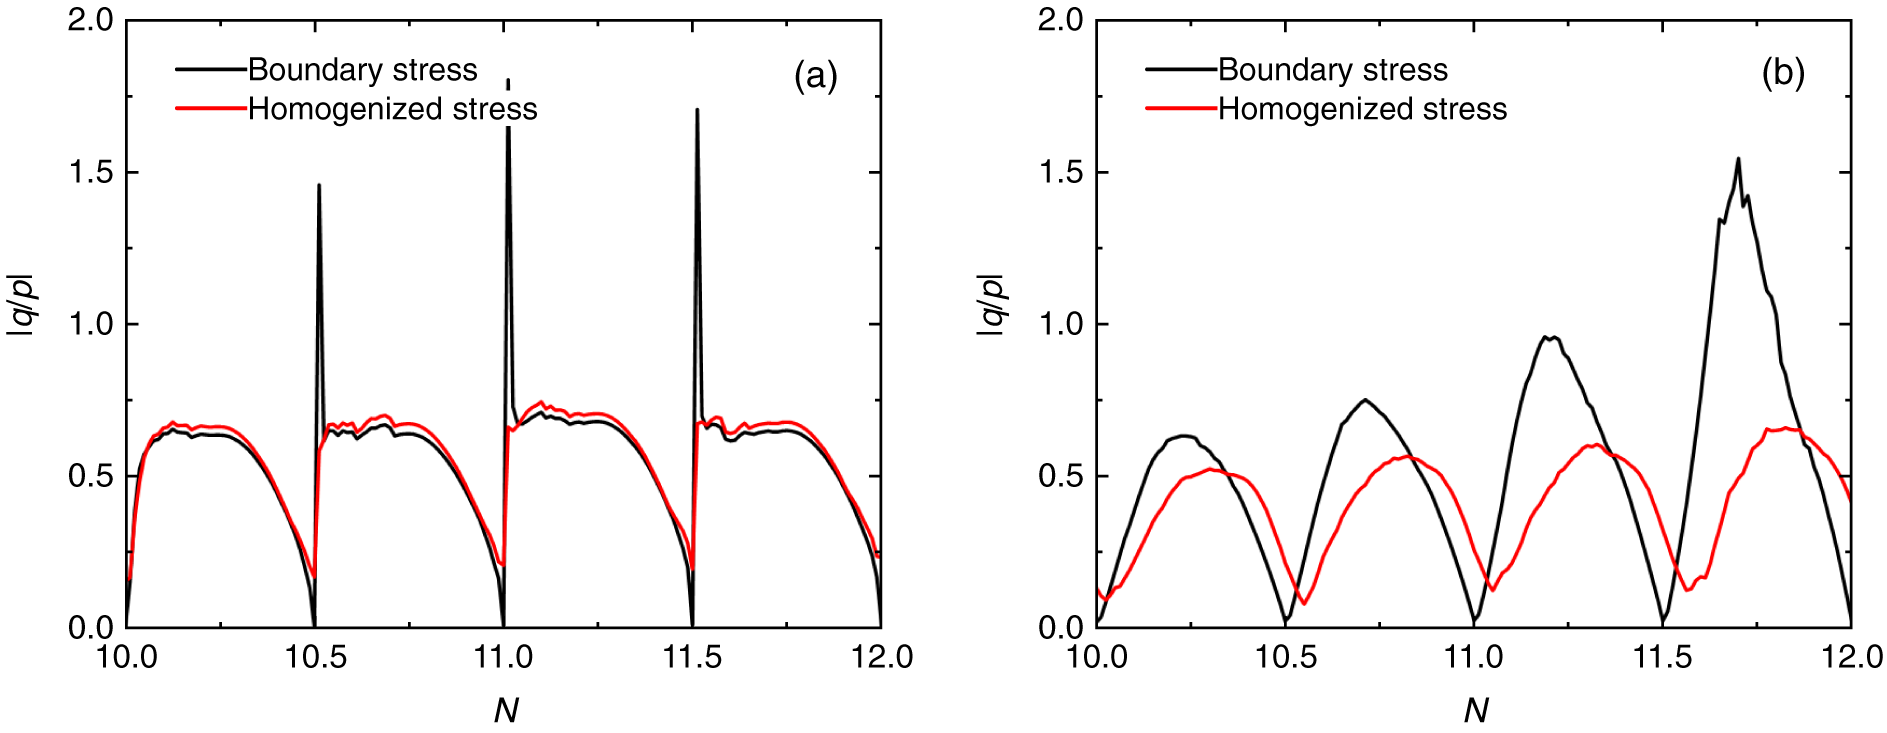
Figure 15: Comparison of boundary stress and homogenized stress during liquefaction: (a) 0.5 Hz, and (b) 128 Hz.
5.2 Evidence of Inertial Forces
To confirm whether particle inertia participates in load bearing under high-frequency loading, the ratio of mean unbalanced force
Fig. 16 shows the ratio
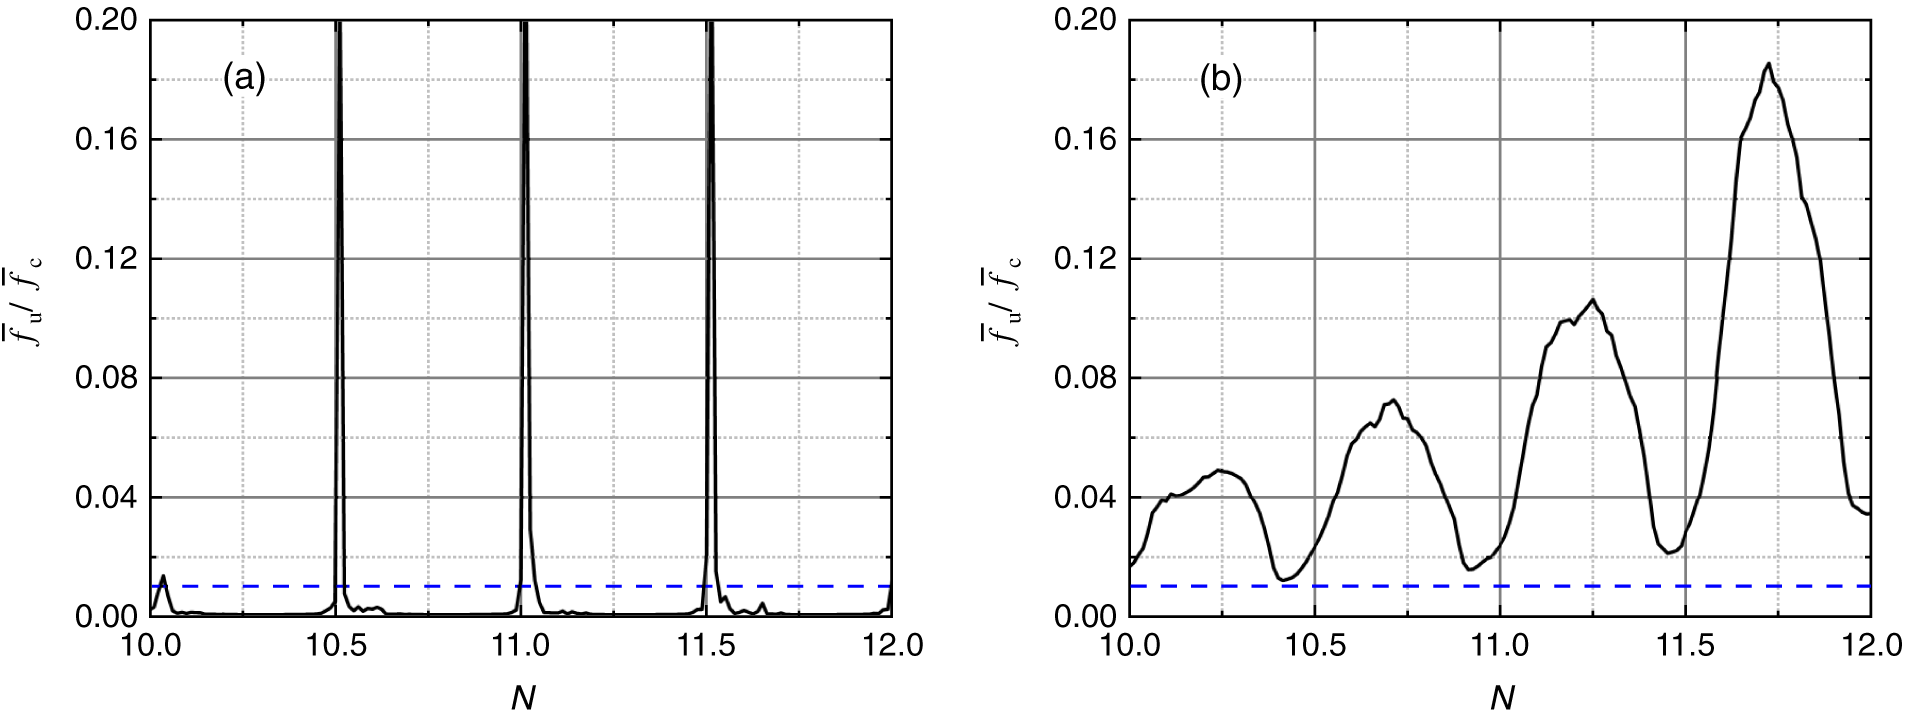
Figure 16: Evolution of ratio of mean unbalanced force to mean contact force during liquefaction: (a) 0.5 Hz, and (b) 128 Hz.
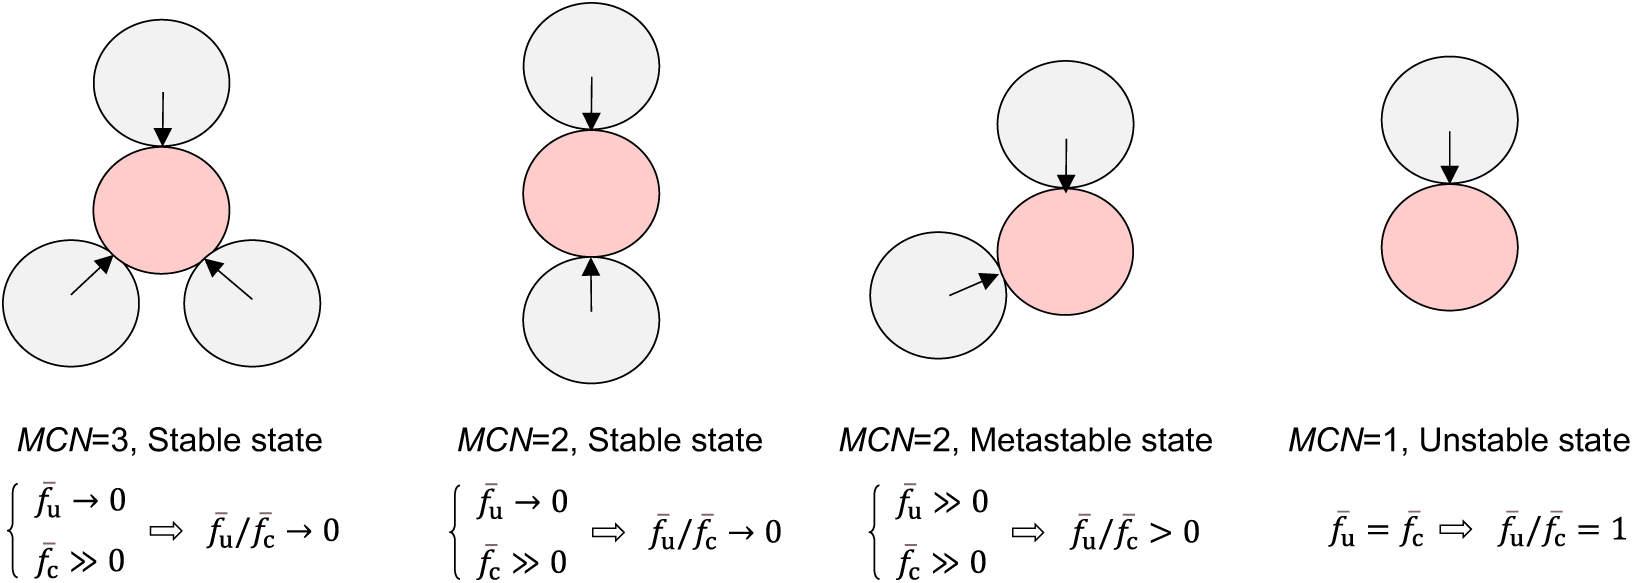
Figure 17: Schematic diagram of force analysis on particles under different mechanical coordination numbers MCN.
This subsection examines how inertial forces influence the disintegration of the contact structure, thereby revealing the underlying mechanism of the delay effect.
(1) In the compression cycle (Fig. 18a), the end walls move rapidly inward under high-frequency loading. The adjacent particles are forced to move inward, producing an inward acceleration and thus an outward inertial force. This inertial force carries part of the vertical load, reducing the contact forces transmitted into the internal contact structure. A prerequisite for contact structure disintegration (e.g., breaking existing contacts) is that contact forces reach a certain threshold. When inertia shares part of the load, the increment of contact forces becomes smaller, weakening the driving force for contact destruction. Meanwhile, to satisfy the undrained condition (i.e., constant sample area), the side walls move outward, and the adjacent particles are forced to move outward, producing an outward acceleration and thus an inward inertial force. This inward inertial force enhances the lateral confinement. In the compression cycle, the vertical stress is larger than the horizontal stress (σ′y − σ′x > 0), making the vertical direction the principal direction that causes contact structure disintegration. Particle inertia both reduces the vertical load and enhances lateral confinement, together delaying the disintegration of the contact structure in the compression cycle.
(2) In the extension cycle (Fig. 18b), the side walls move rapidly inward under high-frequency loading, and the adjacent particles are forced to move inward, producing an inward acceleration and thus an outward inertial force. This inertial force carries part of the horizontal load, reducing the internal contact forces and weakening the driving force for contact destruction. At the same time, the end walls move outward, and the adjacent particles are forced to move outward, producing an outward acceleration and thus an inward inertial force, which enhances the vertical confinement. Since the horizontal stress is larger than the vertical stress (σ′y − σ′x < 0), the horizontal direction becomes the principal direction that causes contact structure disintegration. Particle inertia both reduces the horizontal load and enhances vertical confinement, jointly delaying the disintegration of the contact structure in the extension cycle.
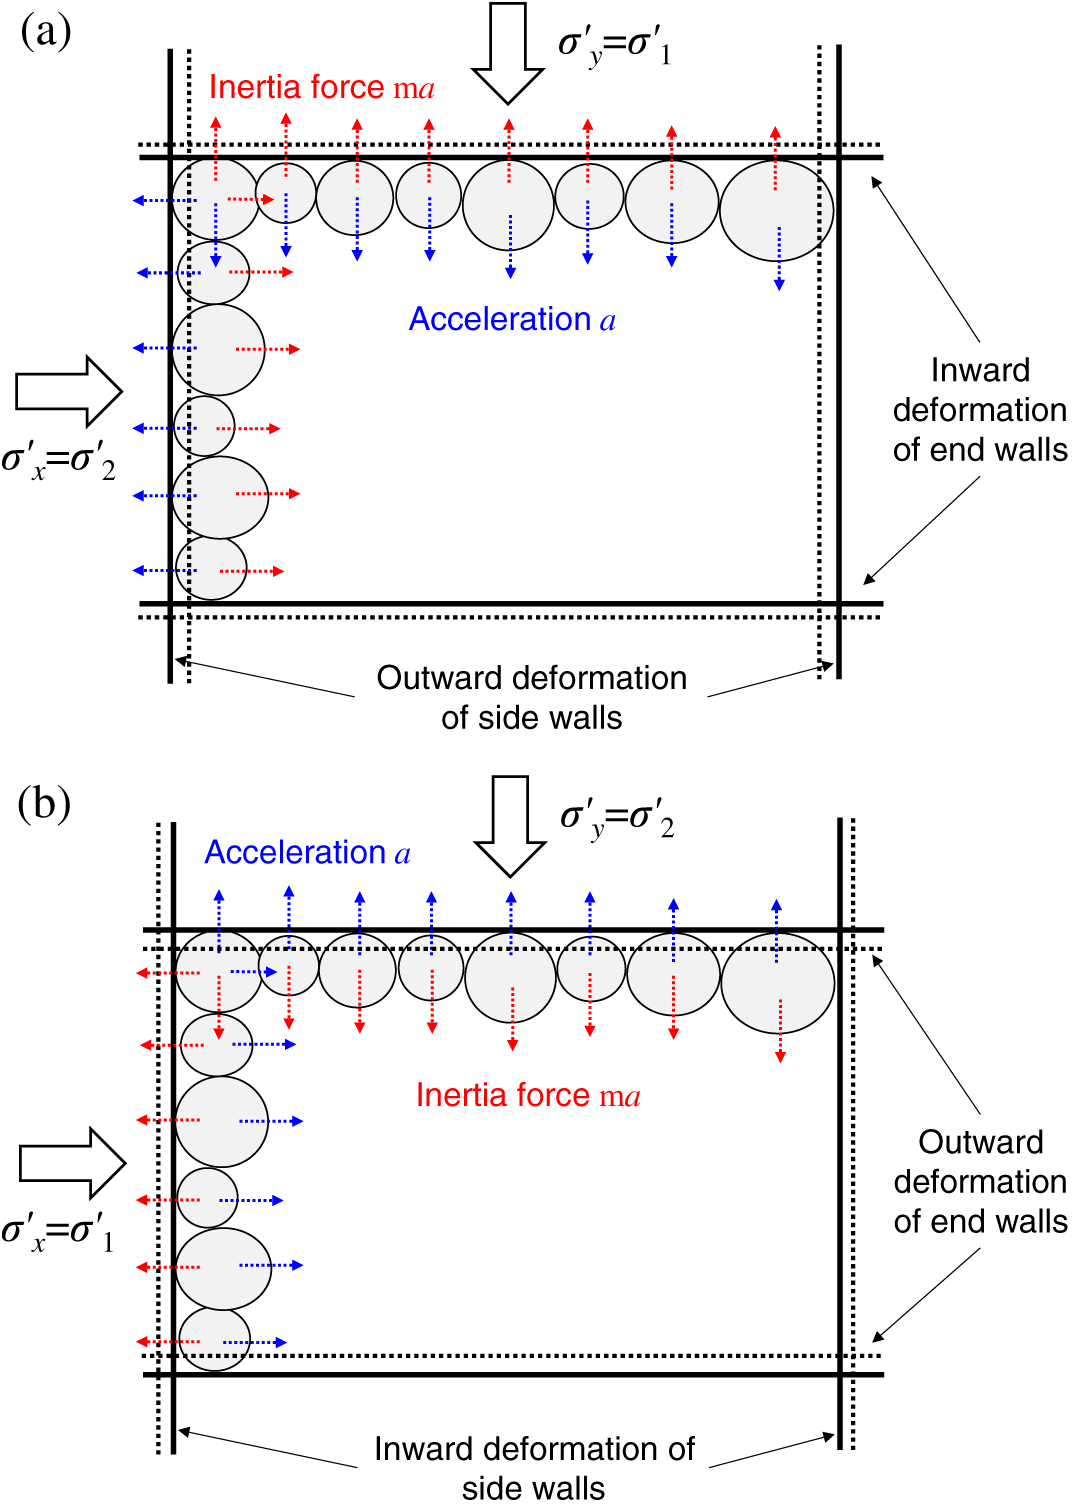
Figure 18: Schematic diagram of inertia mechanism under high-frequency loading: (a) compression cycle, (b) extension cycle.
In summary, the particle inertia induced by high-frequency loading resists the external load in the principal direction while simultaneously enhancing the confinement in the orthogonal direction. These two effects together delay the disintegration of the contact structure. This inertial mechanism explains the microscopic delays in the evolution of fabric anisotropy and mechanical coordination number and the macroscopic delays in EPWP and strain development.
A micromechanical study has been presented to investigate the influence of the cyclic loading frequency on the liquefaction behavior of granular materials. Based on the DEM simulation results, the microstructure changes are further investigated to explore the underlying mechanism. The main conclusions drawn from the study are summarized as:
(1) A stress-controlled undrained cyclic loading method was implemented in the 2D DEM framework. By coordinating the velocities of the end walls and side walls, the method maintains constant sample area while accurately following the prescribed deviatoric stress history. The validity of this loading method was confirmed by successfully reproducing typical cyclic mobility behaviors.
(2) The cyclic loading frequency barely affects the behavior before liquefaction, but when approaching liquefaction, a clear “delay effect” emerges: higher loading frequencies slow down the development of excess pore water pressure and axial strain, increase liquefaction resistance, and alter the stress-strain curve as well as the stress path after liquefaction.
(3) In granular materials subjected to cyclic loading, contact forces (both normal and tangential) respond before the contact structure adjusts. An increase in loading frequency delays the development of contact forces and also delays the disintegration of the contact structure. Compared with contact forces, the contact structure is more significantly affected by the loading frequency.
(4) The “delay effect” under high-frequency loading originates from the inertia mechanism. As the loading frequency increases, particle inertia progressively participates in load bearing and enhances orthogonal confinement. Together, these two effects reduce the driving force for contact structure disintegration and slow down microstructural adjustment. This inertia mechanism accounts for the observed “delay effect” in macroscopic behavior and microstructural fabric during and after liquefaction.
The key novelty of this work is the identification of a particle inertia mechanism that governs the frequency-dependent liquefaction behavior. Despite these contributions, the present study employs idealized circular particles and a narrow gradation, which may limit the quantitative generalizability of the results. Future investigations incorporating realistic particle shapes and broader size distributions are warranted to further confirm the proposed mechanism.
Acknowledgement: None.
Funding Statement: This research was funded by the National Natural Science Foundation of China (Nos. 52238001, 51578491, 52008366, 52378203). The financial support is gratefully acknowledged.
Author Contributions: The authors confirm contribution to the paper as follows: Conceptualization, Xin-Hui Zhou and Yan-Bin Shen; investigation, Xin-Hui Zhou, Yu-Xiang Cai and Jin Guo; software, Xin-Hui Zhou and Jin Guo; data curation, Xin-Hui Zhou; visualization, Jin Guo; writing—original draft preparation, Xin-Hui Zhou; writing—review and editing, Chao Yang, Yanfeng Zheng, Yu-Xiang Cai and Yan-Bin Shen; funding acquisition, Chao Yang, Yanfeng Zheng, Yao-Zhi Luo and Yan-Bin Shen; supervision, Chao Yang, Yao-Zhi Luo and Yan-Bin Shen. All authors reviewed and approved the final version of the manuscript.
Availability of Data and Materials: Data available on request from the authors.
Ethics Approval: Not applicable.
Conflicts of Interest: The authors declare no conflicts of interest.
Appendix A
To determine the critical state line (i.e., CSL), biaxial undrained shear tests were performed on 6 samples with void ratio e ranges from 0.2113 to 0.2576 (i.e., Dr = 2.7%~72.5%). It could be seen that: (1) For loose samples (Fig. A1), the EPWP initially increases but stabilizes after the axial strain εa exceeds 8% (i.e., reaching the critical state). Deviatoric stress rises rapidly at first, and then decreases significantly before stabilizing at the critical state; (2) For dense samples (Fig. A2), the EPWP initially increases due to contraction, then continuously decreases due to dilation until the axial strain exceeds 15%. The deviatoric stress first increases and then stabilizes at the critical state. The stress paths in Fig. A3 determine the critical state line, with a critical state stress ratio of 0.65 for the generated DEM samples.
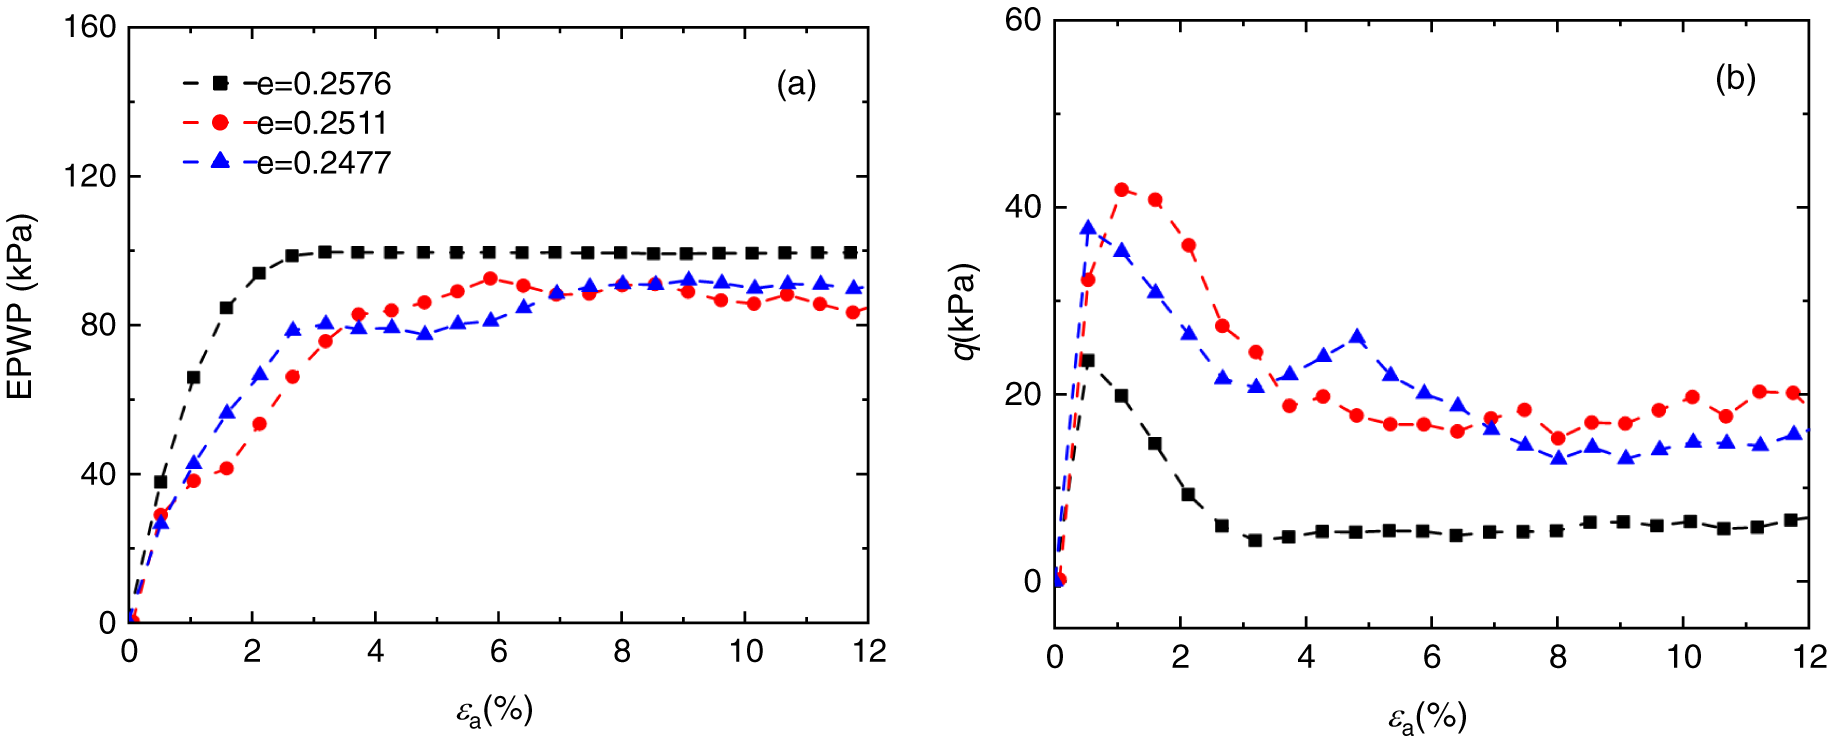
Figure A1: The undrained behaviors of loose samples: (a) EPWP, (b) Deviatoric stress q.
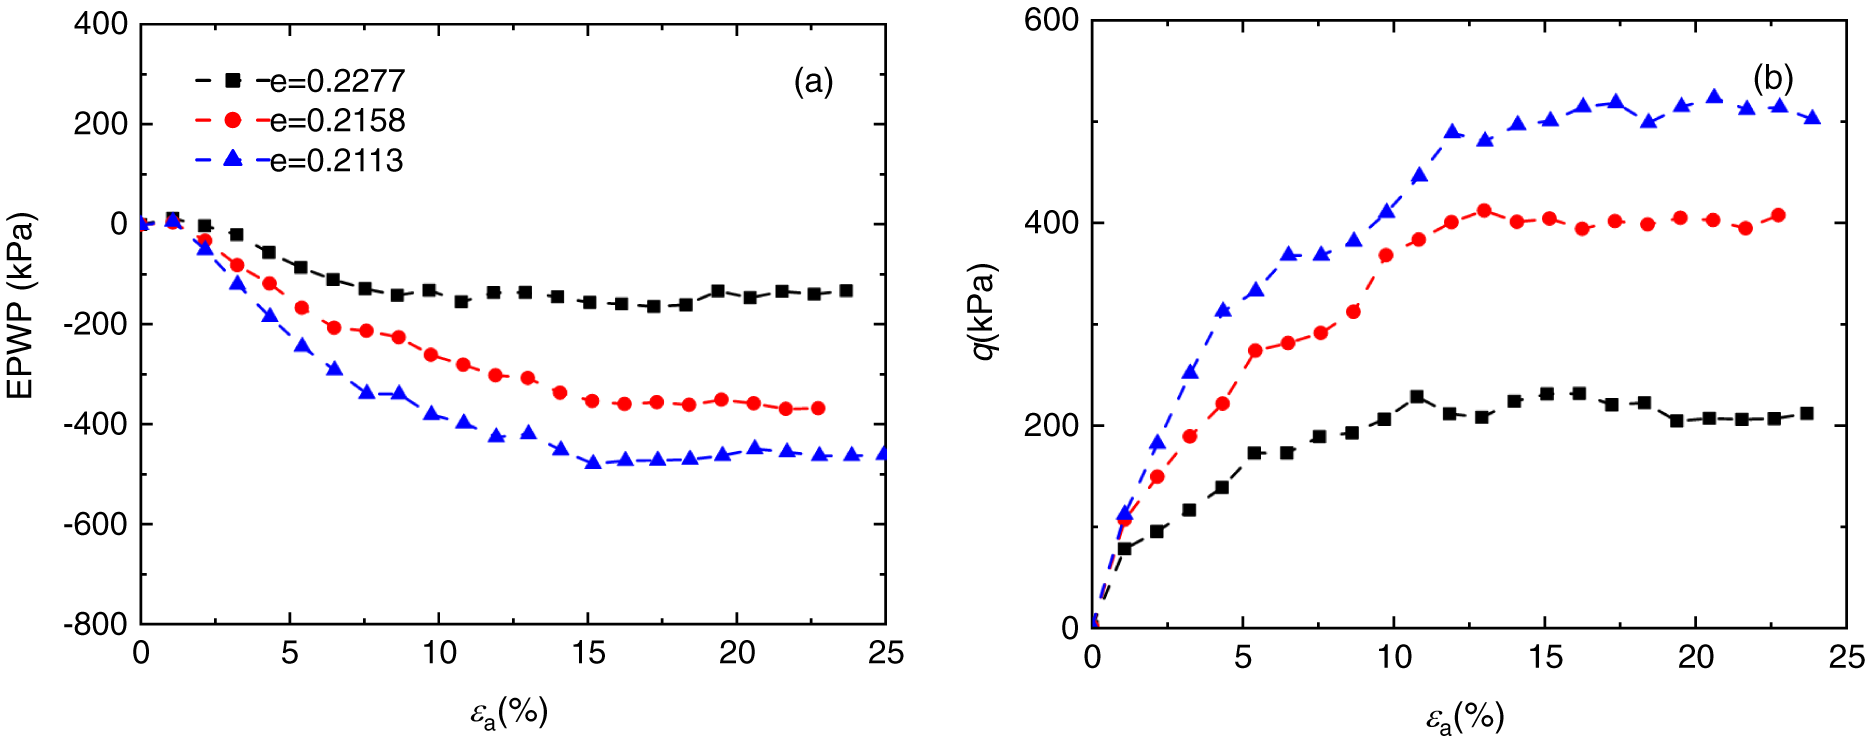
Figure A2: The undrained behaviors of dense samples: (a) EPWP, (b) Deviatoric stress q.
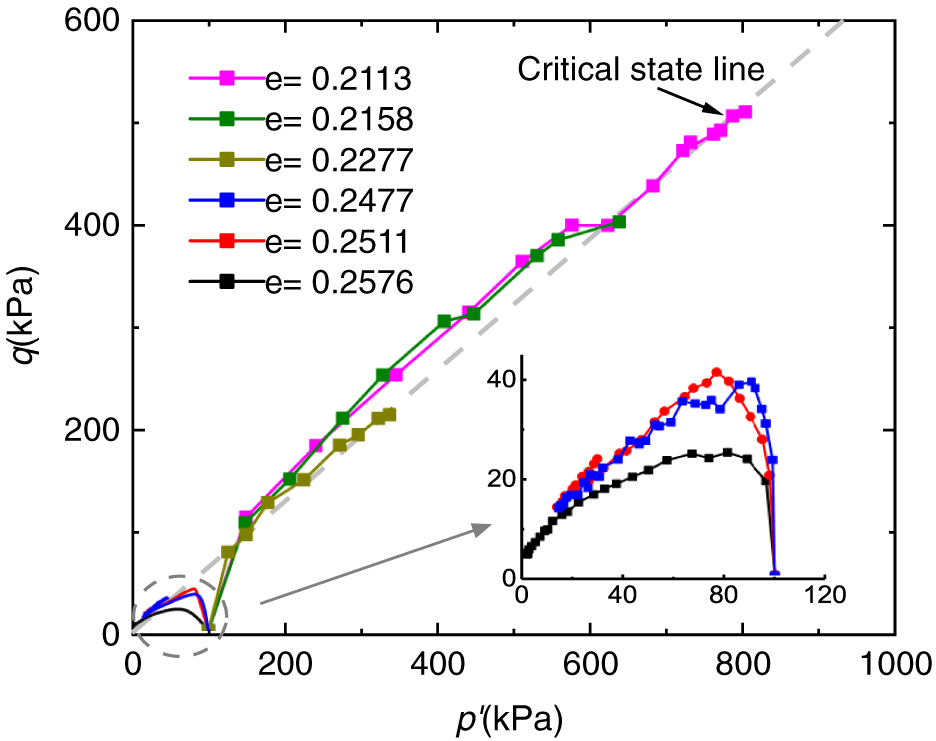
Figure A3: The stress path of generated DEM sample.
References
1. Dobry R, Abdoun T. 3rd Ishihara lecture: an investigation into why liquefaction charts work: a necessary step toward integrating the states of art and practice. Soil Dyn Earthq Eng. 2015;68(8):40–56. doi:10.1016/j.soildyn.2014.09.011. [Google Scholar] [CrossRef]
2. Chen G, Wu Q, Zhao K, Shen Z, Yang J. A binary packing material-based procedure for evaluating soil liquefaction triggering during earthquakes. J Geotech Geoenviron Eng. 2020;146(6):04020040. doi:10.1061/(asce)gt.1943-5606.0002263. [Google Scholar] [CrossRef]
3. Sassel TS, Patino-Ramirez F, Hanley KJ, O’Sullivan C. Linking the macro-scale response of granular materials during drained cyclic loading to the evolution of micro-structure, contact network and energy components. Granul Matter. 2023;25(2):23. doi:10.1007/s10035-023-01308-z. [Google Scholar] [CrossRef]
4. Rehman MU, Kandasami RK, Banerjee S. Simplified approach for liquefaction assessment in granular soils: integrating bulk and grain properties. Granul Matter. 2025;27(3):56. doi:10.1007/s10035-025-01529-4. [Google Scholar] [CrossRef]
5. Osanai N, Yamada T, Hayashi SI, Kastura S, Furuichi T, Yanai S, et al. Characteristics of landslides caused by the 2018 Hokkaido eastern Iburi earthquake. Landslides. 2019;16(8):1517–28. doi:10.1007/s10346-019-01206-7. [Google Scholar] [CrossRef]
6. Zhou YG, Xia P, Ling DS, Chen YM. Liquefaction case studies of gravelly soils during the 2008 Wenchuan earthquake. Eng Geol. 2020;274(5):105691. doi:10.1016/j.enggeo.2020.105691. [Google Scholar] [CrossRef]
7. Jiang M, Shen Z, Wu D. CFD-DEM simulation of submarine landslide triggered by seismic loading in methane hydrate rich zone. Landslides. 2018;15(11):2227–41. doi:10.1007/s10346-018-1035-8. [Google Scholar] [CrossRef]
8. Wu QX, Pan K, Yang ZX. Effects of initial static shear on undrained cyclic behavior of granular materials: energy evolution and micromechanical interpretation. Granul Matter. 2023;25(1):7. doi:10.1007/s10035-022-01291-x. [Google Scholar] [CrossRef]
9. Yang J, Sze HY. Cyclic behaviour and resistance of saturated sand under non-symmetrical loading conditions. Géotechnique. 2011;61(1):59–73. doi:10.1680/geot.9.p.019. [Google Scholar] [CrossRef]
10. Pan K, Yu C, Hu Z, Shen M. CFD-DEM investigation of suffusion-induced cyclic shear degradation in gap-graded soils: roles of mean stress and stress anisotropy. Granul Matter. 2025;27(3):58. doi:10.1007/s10035-025-01536-5. [Google Scholar] [CrossRef]
11. Hu W, Luo H, Xu Q, McSaveney M, Huang R, Zheng J, et al. Effect of amplitude and duration of cyclic loading on frictional sliding instability in granular media: implication to earthquake triggering of landslides. J Geophys Res Solid Earth. 2022;127(11):e2022JB024488. doi:10.1029/2022JB024488. [Google Scholar] [CrossRef]
12. Chen G, Wu Q, Zhou Z, Ma W, Chen W, Khoshnevisan S, et al. Undrained anisotropy and cyclic resistance of saturated silt subjected to various patterns of principal stress rotation. Géotechnique. 2020;70(4):317–31. doi:10.1680/jgeot.18.p.180. [Google Scholar] [CrossRef]
13. Zhu Z, Zhang F, Peng Q, Dupla JC, Canou J, Cumunel G, et al. Effect of the loading frequency on the sand liquefaction behaviour in cyclic triaxial tests. Soil Dyn Earthq Eng. 2021;147:106779. doi:10.1016/j.soildyn.2021.106779. [Google Scholar] [CrossRef]
14. Wei J, Xu T, He J. Effect of static shear stress and cyclic loading direction on cyclic behaviors of granular soils by DEM analysis. Comput Geotech. 2024;167(12):106112. doi:10.1016/j.compgeo.2024.106112. [Google Scholar] [CrossRef]
15. Tatsuoka F, Toki S, Miura S, Kato H, Okamoto M, Yamada SI, et al. Some factors affecting cyclic undrained triaxial strength of sand. Soils Found. 1986;26(3):99–116. doi:10.3208/sandf1972.26.3_99. [Google Scholar] [CrossRef]
16. Zhang J, Cao J, Huang S. Experimental study on the effects of initial shear stress and vibration frequency on dynamic strength of saturated sands. Adv Mater Sci Eng. 2019;2019(1):3758527. doi:10.1155/2019/3758527. [Google Scholar] [CrossRef]
17. Nong Z, Park SS, Jeong SW, Lee DE. Effect of cyclic loading frequency on liquefaction prediction of sand. Appl Sci. 2020;10(13):4502. doi:10.3390/app10134502. [Google Scholar] [CrossRef]
18. Rui X, Shen Y, Ma Y, Xu J. Frequency effect on mechanical properties of calcareous sand under cyclic traffic loading. Soil Dyn Earthq Eng. 2023;171:107955. doi:10.1016/j.soildyn.2023.107955. [Google Scholar] [CrossRef]
19. Dash HK, Sitharam TG. Effect of frequency of cyclic loading on liquefaction and dynamic properties of saturated sand. Int J Geotech Eng. 2016;10(5):487–92. doi:10.1080/19386362.2016.1171951. [Google Scholar] [CrossRef]
20. Yue C, Liang K, Xu C, Du X. Experimental study on cyclic deformation properties of saturated Fujian sand at different loading frequencies. Undergr Space. 2023;13(1):150–65. doi:10.1016/j.undsp.2023.02.014. [Google Scholar] [CrossRef]
21. Xu C, Yue C, Du X, Liang K, Wang B, Chen G. Experimental study on the influence of cyclic loading frequency on liquefaction characteristics of saturated sand. Géotechnique. 2025;75(4):501–14. doi:10.1680/jgeot.21.00384. [Google Scholar] [CrossRef]
22. Ishihara K. Soil behaviour in earthquake geotechnics. Oxford, UK: Oxford University Press; 1996. doi:10.1093/oso/9780198562245.001.0001. [Google Scholar] [CrossRef]
23. Ma Q, Zhou YG, Yang XT, Chen YM. A state parameter-based scaling law for centrifuge modelling. Soil Dyn Earthq Eng. 2022;162(3):107487. doi:10.1016/j.soildyn.2022.107487. [Google Scholar] [CrossRef]
24. Abuhajar O, El Naggar H, Newson T. Experimental and numerical investigations of the effect of buried box culverts on earthquake excitation. Soil Dyn Earthq Eng. 2015;79(3):130–48. doi:10.1016/j.soildyn.2015.07.015. [Google Scholar] [CrossRef]
25. Cao Y, Zhou YG, Ma Q, Zhou XH, Chen YM. Liquefaction and fluidization responses of level ground retained by sheet-pile wall through centrifuge model tests. Soil Dyn Earthq Eng. 2024;178(5):108517. doi:10.1016/j.soildyn.2024.108517. [Google Scholar] [CrossRef]
26. Ma Q, Ling D, Meng D, Ueda K, Zhou Y. A modified generalized scaling law for the similitude of dynamic strain in centrifuge modeling. Earthq Eng Eng Vibr. 2023;22(3):589–600. doi:10.1007/s11803-023-2189-5. [Google Scholar] [CrossRef]
27. Cundall PA, Strack OD. A discrete numerical model for granular assemblies. Géotechnique. 1979;29(1):47–65. doi:10.1680/geot.1979.29.1.47. [Google Scholar] [CrossRef]
28. Luding S. Introduction to discrete element methods: basic of contact force models and how to perform the micro-macro transition to continuum theory. Eur J Environ Civ Eng. 2008;12(7–8):785–826. doi:10.1080/19648189.2008.9693050. [Google Scholar] [CrossRef]
29. Zhao J, Jiang M, Soga K, Luding S. Micro origins for macro behavior in granular media. Granul Matter. 2016;18(3):59. doi:10.1007/s10035-016-0662-9. [Google Scholar] [CrossRef]
30. Pinzón G, Andò E, Desrues J, Viggiani G. Fabric evolution and strain localisation in inherently anisotropic specimens of anisometric particles (lentils) under triaxial compression. Granul Matter. 2023;25(1):15. doi:10.1007/s10035-022-01305-8. [Google Scholar] [CrossRef]
31. Zhao J, Guo N. The interplay between anisotropy and strain localisation in granular soils: a multiscale insight. Géotechnique. 2015;65(8):642–56. doi:10.1680/geot.14.p.184. [Google Scholar] [CrossRef]
32. Jiang M, Zhang A, Li T. Distinct element analysis of the microstructure evolution in granular soils under cyclic loading. Granul Matter. 2019;21(2):39. doi:10.1007/s10035-019-0892-8. [Google Scholar] [CrossRef]
33. Xia P, Dai D, Hang L, Li Z. DEM study on the dynamic behaviors of binary mixtures with the same equivalent skeleton void ratio. Comput Geotech. 2024;168(6):106160. doi:10.1016/j.compgeo.2024.106160. [Google Scholar] [CrossRef]
34. ITASCA Consulting Group. PFC2D user’s guide. Ver. 4.0. Minneapolis, MN, USA: ITASCA Consulting Group; 2008. [Google Scholar]
35. Yang ZX, Yang J, Wang LZ. Micro-scale modeling of anisotropy effects on undrained behavior of granular soils. Granul Matter. 2013;15(5):557–72. doi:10.1007/s10035-013-0429-5. [Google Scholar] [CrossRef]
36. Song Y, Zhang D, Ranjith PG, Huang Y, Wu B, Zhang F, et al. Critical review of DEM simulation for sand production during geo-energy development: models, parameters, and future directions. Powder Technol. 2024;444(38):119977. doi:10.1016/j.powtec.2024.119977. [Google Scholar] [CrossRef]
37. Otsubo M, O’Sullivan C, Hanley KJ, Sim WW. The influence of particle surface roughness on elastic stiffness and dynamic response. Géotechnique. 2017;67(5):452–9. doi:10.1680/jgeot.16.p.050. [Google Scholar] [CrossRef]
38. Wu H, Gu X, Hu J, Zhou Q. DEM simulation of small strain and large strain behaviors of granular soils with a coherent contact model. Granul Matter. 2022;24(4):125. doi:10.1007/s10035-022-01286-8. [Google Scholar] [CrossRef]
39. Jiang M, Shen Z, Wang J. A novel three-dimensional contact model for granulates incorporating rolling and twisting resistances. Comput Geotech. 2015;65(1):147–63. doi:10.1016/j.compgeo.2014.12.011. [Google Scholar] [CrossRef]
40. Bate B, Cao J, Zhang C, Hao N. Spectral induced polarization study on enzyme induced carbonate precipitations: influences of size and content on stiffness of a fine sand. Acta Geotech. 2021;16(3):841–57. doi:10.1007/s11440-020-01059-8. [Google Scholar] [CrossRef]
41. Sun M, Cao J, Cao J, Zhang S, Chen Y, Bate B. Discrete element modeling of shear wave propagation in carbonate precipitate–cemented particles. Acta Geotech. 2022;17(7):2633–49. doi:10.1007/s11440-022-01456-1. [Google Scholar] [CrossRef]
42. Zhou XH, Zhou YG, Chen YM. The failure type-dependent characterization of liquefaction resistance by small-strain shear modulus for saturated sand. Eng Geol. 2024;335(11):107526. doi:10.1016/j.enggeo.2024.107526. [Google Scholar] [CrossRef]
43. Adamidis O, Anastasopoulos I. Cyclic liquefaction resistance of sand under a constant inflow rate. Géotechnique. 2024;74(10):1019–32. doi:10.1680/jgeot.21.00082. [Google Scholar] [CrossRef]
44. Ye GL, Leng J, Jeng DS. Numerical testing on wave-induced seabed liquefaction with a poro-elastoplastic model. Soil Dyn Earthq Eng. 2018;105(5):150–9. doi:10.1016/j.soildyn.2017.11.026. [Google Scholar] [CrossRef]
45. Khashila M, Hussien MN, Karray M, Chekired M. Liquefaction resistance from cyclic simple and triaxial shearing: a comparative study. Acta Geotech. 2021;16(6):1735–53. doi:10.1007/s11440-020-01104-6. [Google Scholar] [CrossRef]
46. Yimsiri S, Soga K. DEM analysis of soil fabric effects on behaviour of sand. Géotechnique. 2010;60(6):483–95. doi:10.1680/geot.2010.60.6.483. [Google Scholar] [CrossRef]
47. Cao Y, Kurimoto Y, Zhou YG, Ishikawa A, Chen Y. Centrifuge model tests on liquefaction mitigation effect of soil-cement grids under large earthquake loadings. Bull Earthq Eng. 2023;21(9):4217–36. doi:10.1007/s10518-023-01711-0. [Google Scholar] [CrossRef]
48. Zeghal M, Goswami N, Kutter BL, Manzari MT, Abdoun T, Arduino P, et al. Stress-strain response of the LEAP-2015 centrifuge tests and numerical predictions. Soil Dyn Earthq Eng. 2018;113(6):804–18. doi:10.1016/j.soildyn.2017.10.014. [Google Scholar] [CrossRef]
49. Omidvar M, Iskander M, Bless S. Stress-strain behavior of sand at high strain rates. Int J Impact Eng. 2012;49(4):192–213. doi:10.1016/j.ijimpeng.2012.03.004. [Google Scholar] [CrossRef]
50. Rothenburg L, Bathurst RJ. Analytical study of induced anisotropy in idealized granular materials. Géotechnique. 1989;39(4):601–14. doi:10.1680/geot.1989.39.4.601. [Google Scholar] [CrossRef]
51. Thornton C. Numerical simulations of deviatoric shear deformation of granular media. Géotechnique. 2000;50(1):43–53. doi:10.1680/geot.2000.50.1.43. [Google Scholar] [CrossRef]
52. Tu X, Andrade JE. Criteria for static equilibrium in particulate mechanics computations. Int J Numer Methods Eng. 2008;75(13):1581–606. doi:10.1002/nme.2322. [Google Scholar] [CrossRef]
53. Wang R, Fu P, Zhang JM, Dafalias YF. DEM study of fabric features governing undrained post-liquefaction shear deformation of sand. Acta Geotech. 2016;11(6):1321–37. doi:10.1007/s11440-016-0499-8. [Google Scholar] [CrossRef]
Cite This Article
 Copyright © 2026 The Author(s). Published by Tech Science Press.
This work is licensed under a Creative Commons Attribution 4.0 International License , which permits unrestricted use, distribution, and reproduction in any medium, provided the original work is properly cited.
 Downloads
 Citation Tools
